26th august, 2016 at bse auditorium, mumbai
TRANSCRIPT
April 30, 2016July 31, 2016
Join us on 26th August, 2016at BSE Auditorium, Mumbai

1
July 31, 2016
Dear Friends,
Mutual Funds in India have seen tremendous growth over the past couple of decades. But still, mutual fund's penetration levels, and its share within the financial assets kitty owned by the Indian households (and even firms, for that matter) remain low.
With only around 4-5% of the Indian households having invested in the mutual funds, the potential to expand remains very large. The comparison is especially numbing when we see it in contrast to markets such as the US. In the US, around 44% of the households hold mutual funds. If we consider mutual fund holdings through advisors, the US household holding percentage may go up as high as 80% of the households.
The trend is similar globally where mutual funds are the dominant medium through which the retail investor invests in the financial markets. So it is natural that we study their recent market trends to understand the new behavioural trends, investor preferences and market directions to study, anticipate and prepare ourselves better.
For instance, in the US, the aum flow tide seems to be turning. Overall assets last year dipped 1.4%, to $15.7 trillion, after rising at a 13% average annual pace since 1965. An assessment suggests that in the past 12 month around US$ 308bn have been redeemed from the active funds while around US$ 375 bn has been invested into ETFs and passively managed funds. Vanguard, the pioneer of low cost Index and ETF investments is today managing assets in excess of US$ 3 trillion, which is bigger than the GDP of India.
There is a theory here to explain this behaviour. Data suggests that the US investors are tending towards ETFs and for a particular reason: the inability of the most of the active fund managers to consistently beat the benchmark.
As per an FT report, less than one in five (19%) U.S. large-cap mutual funds beat the benchmark S&P 500 index in the first quarter of 2016, the lowest rate in a series that goes back to 1998. The average margin of underperformance -- 1.9 percentage points -- also set a new low. According to another report, this time by S&P Global, fewer than one in five (17.9%) actively managed large-cap U.S. equity funds in the U.S. managed to beat the S&P 500 over the 10-year period through 2015. With regard to small-cap funds, the beat rate was little above 1 in 10 (11.6%).
There is a school of thought that suggests the maturation of the US market, size of the mutual fund industry, the application of hyper-technology and proliferation of quant based products has reduced the inefficiencies in their market and made outperformance by active fund management difficult.
Could there be another reason for underperformance by active fund managers? Clearly the compensation in hedge funds, private equity funds and alternate investment manager is far superior to mutual funds. In mutual fund industry, the owners have become billionaires and fund managers have become famous. In hedge fund & private equity funds, the fund managers have become famous as well as rich. Probably the talent migrated to hedge fund, private equity and alternate investment funds compared to mutual funds. Apart from size and efficiency of market, inability to attract right skill set has contributed to active funds underperforming the benchmark. Let us remember the experience of an Ivy league University Endowment fund where they allowed a star fund management team to go which generated about 16 % return from 1990 to 2005 through superior fund management on issues related to compensation. Post their departure certainly their cost have come down but the return has halved.
In India most equity fund managers have outperformed benchmark indices by a big margin creating tremendous value for unit holders. Apart from small size, changing composition of Indian economy and inefficiency of market, the sheer talent pool of equity fund managers have contributed to this outstanding performance.
We must ensure that we retain talent and continue to attract outstanding talent in the mutual fund industry, which can continue to generate alpha on a larger size and efficient market.
Regards,
Nilesh Shah
Managing Director
EXPERT SPEAK
Mr. Nilesh Shah

2
Indian equities reported a strong performance in the month of July 2016 on the back of strong inflows. The large cap Nifty index rose 4.23% while the Nifty Midcap index rose 6.92% (both in INR terms). The market sentiment was boosted by the strong progress of monsoons in India, steady corporate earnings season, expectations of reforms boost with the hope of the passage of the GST (Goods and Services Tax) Bill in the Upper House of the Parliament (Rajya Sabha) during the monsoon session (ending on August 12, 2016) and the continuation of a global risk-on trade. There is also a growing belief that global central banks and governments may explore 'non-monetary' means to revive demand as the policies of low interest rates and QE programmes (Quantitative Easing) have yielded limited success. FIIs (Foreign Institutional Investors) were net buyers to the tune of USD 1.8Bn in the Indian equity markets in July '16, taking the CY16 YTD tally to USD 4.8Bn. Domestic Institutional Investors or DIIs were net buyers in the equity markets to the tune of USD 3Mn.
Currently the Nifty is trading at 19xFY17E EPS and 16x FY18E EPS which is at the higher end of the historic valuation band. The question therefore remains as to how sustainable is the current market rally? The key drivers of the market according to us would be (i) improvement in the corporate earnings trajectory (ii) India's superior growth outlook especially over the medium term (iii) structural shift in domestic savings from physical to financial sectors aided by positive real interest rates.
In this regard, a number of notable macro economic events are lined up over the next few months, the outcome of which would have a bearing on the direction that the market would take. These include decisions related to monetary policy (next RBI meeting scheduled on August 09, 2016) , the appointment of the new RBI (Reserve Bank of India) Governor, the selection of the Monetary Policy Committee (MPC) and the determination of the five year CPI inflation target, the passage of the GST Bill, FCNR (Foreign Currency Non Resident -B) redemptions and the US Federal Reserve action amongst others.
Corporate earnings: Driver of markets; domestic consumption the key
While all eyes are on the macro developments, the key driver for the Indian markets from hereon will be corporate earnings trajectory. The Q1FY17 earnings season has been fairly stable so far, with earnings upgrades and downgrades being balanced. Retail private sector banks have continued to report strong numbers with healthy asset quality trends and strong loan growth above industry average. Corporate banks however remain under pressure and face stress on their exposures with Non Performing Loans (NPLs) staying elevated. Many of the larger PSBs (Public Sector Banks) are yet to report numbers, but the profitability and asset quality trends remain subdued for the ones which have already reported.
Domestic sectors such as automobiles, cement (on the back of higher prices and lower costs) and media companies (strong advertising revenue growth) have seen positive numbers. Rural demand revival remains slow and the volume growth for most consumer companies has been muted. A normal monsoon season should however, help revive rural demand supporting our view that GDP growth in FY17 would be led by consumption. Technology has been a sector which has borne the brunt of the global slowdown with discretionary spending growth being muted. Concerns on margins emanating from pricing pressures, salary hikes, higher visa costs have also had a negative impact.
IndAS (the new Indian Accounting Standard which largely follows IFRS reporting) has been implemented from the June 2016 quarter (ex banks and financial services) onwards and several companies have already seen an impact of the same.
GST implementation: a huge step forward
Provision of enhanced liquidity to the banking system, including reopening of cross-border swap lines and stand-by emergency liquidity. With the Central Government approving key changes to the GST constitutional amendment bill to be presented in the Rajya Sabha Upper House), hopes have increased regarding its passage in the current monsoon session of Parliament. The changes incorporate a) 100% compensation to states for loss on their tax revenues due to GST and b) doing away with a 1% tax on inter-state supply of goods.
The GST Bill being a constitutional amendment requires that it be passed by both Houses of Parliament by 2/3 majority and be ratified by half of the states. The Government has been able to build up a broad consensus among the states and the recent event of the cabinet agreeing to most of the key demands will go a long way in ensuring their support. While the present Government has majority in the Lower House of the Parliament (Lok Sabha), it is in minority in the Upper House and hence needs support of other political parties. At present, the Rajya Sabha has 243 members and 82 votes would be needed to oppose the GST bill. The parties such as Congress, Left (CPI + CPI(M)) and AIADMK together reach the mark of 82. However, if the Left parties or AIADMK votes for GST or even abstains, the government will be able to pass the legislation.
The benefits of GST includes that of an unified national market, simpler tax rules and relative advantage of the formal sector over the informal sector. While the benefits of GST may not flow through in the near term, over time we do anticipate a positive impact on GDP growth. The impact both on growth and inflation would depend on the actual rate of GST and the tax brackets for each of the product categories. Currently we expect that sectors such as automobiles, consumer staples and consumer durables, along with media and entertainment could be positively impacted.
Monetary policy: RBI likely to stay on hold ; 25-50bps cut in FY17 still a possibility
We expect Reserve Bank of India (RBI) to maintain status quo on policy rates in the monetary policy review on August 09, 2016. Currently, the repo rate is at 6.5% and the reverse repo rate is at 6%. Headline CPI (Consumer Price Index) inflation has stayed elevated over the past 3 months and, in fact, is anticipated to remain so for the next couple of months on the back of higher prices of vegetables and pulses. With near term inflation remaining high, we believe that RBI would refrain from immediately cutting rates.
Towards the second half of the year, with monsoons having been normal thus far, the pressure on food inflation would ease. Pulses output is expected to be bumper this year (going by sowing data so far) causing sharp disinflation in the commodity. Also, international food prices which had spiked March onwards, have reversed course. Crude oil, too, has corrected in July 2016. With this backdrop, we continue to expect 25-50bps easing in FY17. The appointment of the new RBI Governor, members of the Monetary Policy Committee (MPC) and the course of action of the US Federal Reserve would be the key in determining the timing of the same.
Monsoon progress : rural demand revival hopes improve
Monsoons in India have been progressing well after a slow start in the month of June 2016. As per the data till July 27, 2016, cumulative rainfall was 1% surplus as compared to the LongPeriod Average. On a regional basis, most of India received normal to excess rainfall with some parts of western India and north-east India remaining deficient. Out of the 36 sub-divisionsacross India, till date, 11 have received excess rainfall, 17 have received normal rainfall, and eight have received deficient rainfall.With rainfall being good, Kharif (autumn/winter crop) acreage as of July 29, 2016 was 6.3% higher than the same period last year.. With better sowing trends, the spike in food inflationis likely to abate and this would be favourable for overall CPI inflation.
Fiscal deficit in April-June at 61% of FY17 budget; Government needs to keep a tight leash on expenditure; disinvestment could be the key
The fiscal deficit in April-June 2016 was 61% of the FY17 budget estimate. The growth in tax collections remained robust with gross tax collections growing 30.6% YoY, higher than the11.9% growth budgeted in FY17. Indirect tax collections grew 34.5% and direct taxes grew 26%. Total expenditure rose 18.8% and capital expenditure growth lagged revenueexpenditure. On the positive note, plan expenditure growth stood at 28.2% YoY on the back of the rise in rural and agricultural spending.
Since the last couple of months, we have been witnessing a renewed thrust on rural spending in an effort to revive consumption therein. The government has set itself a target of 3.5%fiscal deficit in FY17. While meeting this level would be certainly challenging, we believe that the government would definitely try not to breach the same, given that credit ratingagencies are keeping a close watch. The Government would be banking on robust tax revenue collections and higher disinvestment receipts in order to keep the overall government finance under check.
EQUITY VIEW
Key Variables Short -term
Medium -term
Remarks
Economy Improving growth, falling inflation
Corporate Earnings Improving operating leverage, falling interest costs and improvement in working capital can accelerate earnings, but a bit back-ended (FY17)
FII Flow India stands out among global asset classes with improving macro-economic variables and prospects of strong long term growth
DII FlowFocus on improving financial savings of households
Supply of paper Higher disinvestment target and repair of leveraged balance sheet to create supply in markets
Interest Rates Fall in interest rates to help revive demand and reduce stress for companies with significant debt. Market expecting better transmission of rates.
Policy/Reform Initiative
GST is key reform for government to focus on; if it gets passed, can provide a significant fillip

Key Events:
� Headline CPI inflation remained unchanged in the June month at 5.8% YoY, Vs 5.76% in May-16 . � Crude Oil prices plunged to $42.46/barrel (15% MoM) during the month. � FOMC : The Fed's policy-setting committee left its benchmark overnight interest rate in a range of 0.25 % to 0.50% � Near-term risks to the economic outlook have diminished," The Fed noted, however, that inflation expectations were on balance little changed in recent months, and gave no firm indication of whether it would raise rates at its next policy meeting in September. � India: Exports rise for the first time in 18 months. � Exports rose 1.3% y-o-y in June, the first expansion in 18 months, beating expectations. Non-oil exports grew 3.1% y-o-y, rising for the second consecutive
month after 16 months of contraction (May: 1% y-o-y). � The contraction in imports also eased to 7.3% y-o-y vs 13.2% in May. Oil imports picked up sequentially, while core imports (ex-oil, gold) contracted at a
slower pace as volumes improved. � With import contraction easing, the trade deficit widened to US$ 8.1 bn in June from US$ 6.3bn in May � Japanese Prime Minister Shinzo Abe's plan for $265 billion stimulus puts pressure on BOJ to ease further - Japan's PM unveiled a surprisingly large $265
billion stimulus package on Wednesday to reflate the world's 3rd-largest economy, adding pressure on the central bank to match the measures with monetary stimulus later this week
Debt OutlookLong Term Curve:
Bond yields rallied by close to 25 bps during the month of July 2016. 10 year gilt yield was down from 7.41% to 7.16% levels. We have become more confident of a 50 bps rate cut over the course of next 1 year, based on positive domestic (good monsoon and good pulses harvest
may lead to sharply lower headline CPI inflation reading, easy liquidity and low credit off take) and global factors (global growth concern leading to lower bond yields and lower commodity prices )
In case Liquidity become tight post FCNR deposit maturity, then we expect RBI to resume OMO, which would be positive for Gilts For above stated reasons, we revise our 10 year trading range and believe that the 10 year gilt would trend downward in the 6.75-6.85% band over the
course of next 6 months
Short-Term Curve (3m -24 m): � Short term rates up to 3 months are trading in the range of 10-15 bps above CBLO rates � NBFC spread has also compressed by 30-40 bps given the excess liquidity in the market
� Rates in the 6m-24m segments have moved down by 10-15 bps during last month and we expect further drop in these segment on rate cuts or post the FCNR deposit maturity
Key variables & their impact on interest rates:
3
Items Jul-16 Jun-16 Change
Reverse Repo 6.00% 6.00% Nil
Repo 6.50% 6.50% Nil
CRR 4% 4% Nil
SLR 21.25% 21.25% Nil
Mibor Overnight 6.59% 6.43% 16 bps
Call(O/N) 6.35% 6.38% - 3 bps
CBLO 6.28% 6.37% - 9 bps
1 yr T Bill 6.73% 6.88% - 15 bps
10 G Sec 7.17% 7.45% - 28 bps
5 Year AAA 7.64% 8.05% - 41 bps
USD/INR 67.00 67.61 61 paiseSource: RBI; ICRAonline.
DEBT VIEW
3
Key Variables Short - term (3-6 month)
Medium – term (6month – 2 years)
Inflation
Rupee
Credit Demand
Government Borrowing
RBI Policy
Global Event Risk
Corporate bond Spread
Debt FII flow
Liquidity Denotes fall in interest rates

The commodities space was a mix bag in the July month. While the crude oil was falling the Gold price rose. The difference was huge. Crude oil fell by
approximately 15% while the gold rose by 2%.
As we have highlighted in the previous note, Gold has always been perceived to be a safe haven currency in the time of geo political risk or excessive easing in MPR
(Monitory Policy Review) particularly by FED.
We gave a call on gold purely on technical basis and now we believe that a large move may be behind us and now on it may have limited upside from hereon in the
short to medium term. However, Gold can always be taken as insurance for an unforeseen eventuality.
Our domestic fundamentals have been changing as we have got better product - the gold bond. This will change the demand supply dynamics of the gold market.
The govt has just pushed the pedal on reforms and the mile stone of GST will be a big positive for India. This, coupled with good monsoon will support INR in
medium to long term. Therefore a large part of the Gold return which used to come from currency depreciation will be capped and probably can act otherwise.
The currency wars will keep Gold supportive in dollar terms. The impending expectation of the US Fed rate hike will keep it range bound.
India Story is unfolding and it has a long way to go therefore equities can be a better play followed by bonds then gold bonds and then gold for the domestic
investors.
4
GOLD VIEW
KOTAK 50An Open - Ended Equity Scheme
(As on July 31, 2016)
Issuer/Instrument Industry/Rating % to Net Assets
Equity & Equity related (Listed/Awaiting listing on Stock Exchange) HDFC Bank Ltd. Banks 8.60Infosys Ltd. Software 6.11ITC Ltd. Consumer Non Durables 5.34ICICI Bank Ltd. Banks 4.40Reliance Industries Ltd. Petroleum Products 4.29IndusInd Bank Ltd. Banks 4.18Axis Bank Ltd Banks 3.94Larsen And Toubro Ltd. Construction Project 3.62Sun Pharmaceuticals Industries Ltd. Pharmaceuticals 3.54Maruti Suzuki India Limited Auto 3.38HDFC Ltd. Finance 2.56Tata Motors Ltd - DVR Auto 2.44Mahindra & Mahindra Ltd. Auto 2.30Tata Consultancy Services Ltd. Software 2.26Ultratech Cement Ltd. Cement 2.19Bharat Petroleum Corporation Ltd. Petroleum Products 1.98Hero MotoCorp Ltd. Auto 1.93HCL Technologies Ltd. Software 1.87Lupin Ltd. Pharmaceuticals 1.63Britannia Industries Ltd. Consumer Non Durables 1.58Power Grid Corporation Of India Ltd Power 1.52Shree Cement Ltd. Cement 1.52Asian Paints Ltd. Consumer Non Durables 1.40Grasim Industries Ltd. Cement 1.39The Ramco Cements Ltd Cement 1.33Kajaria Ceramics Ltd. Construction 1.31DB Corp Limited Media and Entertainment 1.24State Bank Of India Banks 1.23Nestle India Ltd. Consumer Non Durables 1.20Equitas Holdings Ltd Finance 1.15MRF Limited Auto Ancillaries 1.13Cadila Healthcare Ltd. Pharmaceuticals 1.09Persistent Systems Limited Software 1.03Jubilant Foodworks Limited Consumer Non Durables 1.02Indraprastha Gas Ltd. Gas 1.01Siemens Ltd. Industrial Capital Goods 0.99
Issuer/Instrument Industry/Rating % to Net Assets
Sanofi India Ltd. Pharmaceuticals 0.98Alstom India Limited Industrial Capital Goods 0.90Colgate Palmolive (India ) Ltd. Consumer Non Durables 0.90Supreme Industries Limited Industrial Products 0.89Bharat Electronics Ltd Industrial Capital Goods 0.88Bayer Cropscience Ltd. Pesticides 0.84Tech Mahindra Ltd. Software 0.82Fag Bearings India Ltd. Industrial Products 0.79Bank Of Baroda Banks 0.76Adani Port and Special Economic Zone Limited Transportation 0.58Bharat Forge Ltd. Industrial Products 0.49Strides Shasun Ltd. Pharmaceuticals 0.49HDFC Ltd. Warrants Finance 0.45DR.Lal Pathlabs Ltd Healthcare Services 0.35Listed/Awaiting Listing on Stock Exchange - Total 97.82TERM DEPOSITS Kotak Mahindra Bank Ltd. 0.42Term Deposits - Total 0.42Collateral Borrowing & Lending obligation 1.91Net Current Assets/(Liabilities) -0.15Grand Total 100
PORTFOLIO
INVESTMENT STYLE
Value Blend Growth Size
Large
Mid
Small
EQUITY SCHEMES
Investment Objective
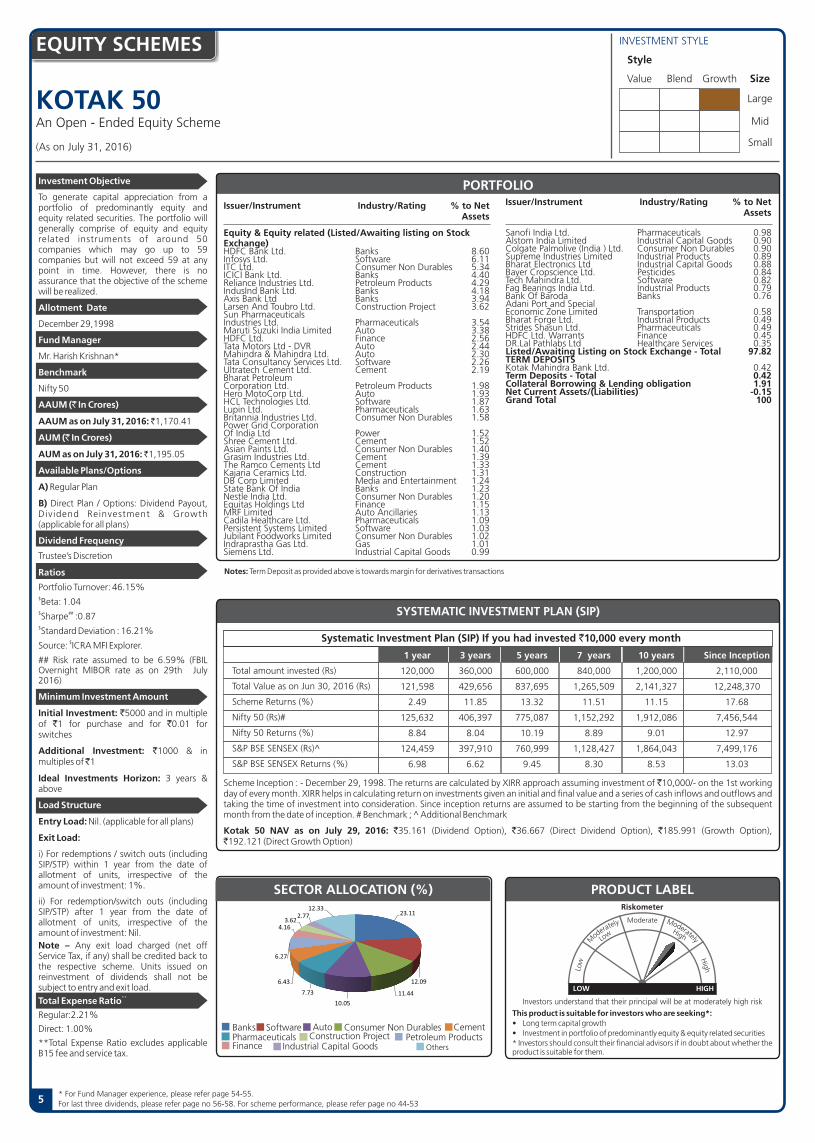
To generate capital appreciation from a portfolio of predominantly equity and equity related securities. The portfolio will generally comprise of equity and equity related instruments of around 50 companies which may go up to 59 companies but will not exceed 59 at any point in time. However, there is no assurance that the objective of the scheme will be realized.
Allotment Date
December 29,1998
Fund Manager
Mr. Harish Krishnan*
Benchmark
Nifty 50
AAUM (` In Crores)
AAUM as on July 31, 2016: ̀ 1,170.41
AUM (` In Crores)
AUM as on July 31, 2016: ̀ 1,195.05
Available Plans/Options
A) Regular Plan
B) Direct Plan / Options: Dividend Payout, Dividend Reinvestment & Growth (applicable for all plans)
Dividend Frequency
Trustee�s Discretion
Ratios
Portfolio Turnover: 46.15% $Beta: 1.04 $ ##Sharpe :0.87$Standard Deviation : 16.21%
$Source: ICRA MFI Explorer.
## Risk rate assumed to be 6.59% (FBIL Overnight MIBOR rate as on 29th July 2016)
Minimum Investment Amount
Initial Investment: `5000 and in multiple of `1 for purchase and for `0.01 for switches
Additional Investment: `1000 & in multiples of ̀ 1
Ideal Investments Horizon: 3 years & above
Load Structure
Entry Load: Nil. (applicable for all plans)
Exit Load:
i) For redemptions / switch outs (including SIP/STP) within 1 year from the date of allotment of units, irrespective of the amount of investment: 1%.
ii) For redemption/switch outs (including SIP/STP) after 1 year from the date of allotment of units, irrespective of the amount of investment: Nil. Note � Any exit load charged (net off Service Tax, if any) shall be credited back to the respective scheme. Units issued on reinvestment of dividends shall not be subject to entry and exit load.
Total Expense Ratio**
Regular:2.21%
Direct: 1.00%
**Total Expense Ratio excludes applicable B15 fee and service tax.
SYSTEMATIC INVESTMENT PLAN (SIP)
Scheme Inception : - December 29, 1998. The returns are calculated by XIRR approach assuming investment of 10,000/- on the 1st working `day of every month. XIRR helps in calculating return on investments given an initial and final value and a series of cash inflows and outflows and taking the time of investment into consideration. Since inception returns are assumed to be starting from the beginning of the subsequent month from the date of inception. # Benchmark ; ̂ Additional Benchmark
Kotak 50 NAV as on July 29, 2016: `35.161 (Dividend Option), `36.667 (Direct Dividend Option), `185.991 (Growth Option), `192.121 (Direct Growth Option)
Notes: Term Deposit as provided above is towards margin for derivatives transactions
Style
5
This product is suitable for investors who are seeking*:� Long term capital growth� Investment in portfolio of predominantly equity & equity related securities* Investors should consult their financial advisors if in doubt about whether the product is suitable for them.
PRODUCT LABEL
Investors understand that their principal will be at moderately high risk
Riskometer
yletaredo
M
Moderate
Low
High
Low
High
LOW HIGH
Moderately
SECTOR ALLOCATION (%)
Banks Software Auto Consumer Non Durables CementPharmaceuticals Construction Project Petroleum ProductsFinance Industrial Capital Goods Others
25.34
16.78
9.78.24
6.65
5.54
4.984.61
12.0925.31
17.14
11.118.67
6.81
5.64
4.554.51
10.11
For last three dividends, please refer page no 56-58. For scheme performance, please refer page no 44-53 * For Fund Manager experience, please refer page 54-55.
25.23
16.01
11.399.18
7.04
5.69
4.934.83
10.06
Total amount invested (Rs)
Total Value as on Jun 30, 2016 (Rs)
Scheme Returns (%)
Nifty 50 (Rs)#
Nifty 50 Returns (%)
S&P BSE SENSEX (Rs)^
S&P BSE SENSEX Returns (%)
1 year 3 years 5 years 7 years 10 years Since Inception
120,000 360,000 600,000 840,000 1,200,000 2,110,000
121,598 429,656 837,695 1,265,509 2,141,327 12,248,370
2.49 11.85 13.32 11.51 11.15 17.68
125,632 406,397 775,087 1,152,292 1,912,086 7,456,544
8.84 8.04 10.19 8.89 9.01 12.97
124,459 397,910 760,999 1,128,427 1,864,043 7,499,176
6.98 6.62 9.45 8.30 8.53 13.03
Systematic Investment Plan (SIP) If you had invested `10,000 every month
24.55
15.26
10.828.63
6.80
5.59
5.304.31
3.59
12.44
23.11
12.09
11.44
10.05
7.73
6.43
6.27
4.163.62
2.7712.33

KOTAK CLASSIC EQUITYAn Open - Ended Equity Growth Scheme
Issuer/Instrument Industry/Rating % to Net Assets
Issuer/Instrument Industry/Rating % to Net Assets
PORTFOLIO
INVESTMENT STYLE
Value Blend Growth Size
Large
Mid
Small
Investment Objective
To generate capital appreciation from a diversified portfolio of equity and equity related securities. However, there is no assurance that the objective of the scheme will be realized.
Allotment Date
July 27, 2005
Fund Manager
Mr. Harish Krishnan*
Benchmark
Nifty 100
AAUM (` In Crores)
AAUM as on July 31, 2016: ̀ 100.95
AUM (` In Crores)
AUM as on July 31, 2016: ̀ 102.18
Available Plans/Options
A) Regular Plan
B) Direct Plan / Options: Dividend Payout, Dividend Reinvestment & Growth (applicable for all plans)
Dividend Frequency
Trustee�s Discretion
Ratios
Portfolio Turnover: 136.40% $Beta: 0.86$ ##Sharpe :0.84$Standard Deviation : 13.88%
$Source: ICRA MFI Explorer.
## Risk rate assumed to be 6.59% (FBIL Overnight MIBOR rate as on 29th July 2016)
Minimum Investment Amount
Initial Investment: `5000 and in multiple of `1 for purchase and for `0.01 for switches
Additional Investment: `1000 & in multiples of ̀ 1
Ideal Investments Horizon: 3 years & above
Load Structure
Entry Load: Nil. (applicable for all plans)
Exit Load: Nil. (applicable for all plans), (w.e.f December 01, 2014)
Total Expense Ratio**
Regular: 2.47%Direct: 1.09%
**Total Expense Ratio excludes applicable B15 fee and service tax.
Style
SYSTEMATIC INVESTMENT PLAN (SIP)
Scheme Inception : - July 27,2005. The returns are calculated by XIRR approach assuming investment of 10,000/- on the 1st working day of `every month. XIRR helps in calculating return on investments given an initial and final value and a series of cash inflows and outflows and taking the time of investment into consideration. Since inception returns are assumed to be starting from the beginning of the subsequent month from the date of inception. # Benchmark ; ̂ Additional Benchmark
Kotak Classic Equity NAV as on July 29, 2016: `19.645 (Dividend Option), `20.649 (Direct Dividend Option), `37.390 (Growth Option), `38.912 (Direct Growth Option)
Equity & Equity related (Listed/Awaiting listing on Stock Exchange) HDFC Bank Ltd. Banks 6.06Infosys Ltd. Software 5.78ITC Ltd. Consumer Non Durables 5.66Reliance Industries Ltd. Petroleum Products 5.28Grasim Industries Ltd. Cement 4.71Bharat Petroleum Corporation Ltd. Petroleum Products 4.47Asian Paints Ltd. Consumer Non Durables 3.68Hero MotoCorp Ltd. Auto 3.65Zee Entertainment Enterprises Ltd Media and Entertainment 3.44Ultratech Cement Ltd. Cement 3.07Tata Motors Ltd. Auto 2.83Bajaj Finance Limited Finance 2.44Hindustan Unilever Ltd. Consumer Non Durables 2.30Bajaj Auto Ltd. Auto 1.87Eicher Motors Ltd Auto 1.73Larsen And Toubro Ltd. Construction Project 1.59Petronet LNG Ltd. Gas 1.57Axis Bank Ltd Banks 1.52Lupin Ltd. Pharmaceuticals 1.45HDFC Ltd. Finance 1.43Power Grid Corporation Of India Ltd Power 1.41Wipro Ltd. Software 1.28IndusInd Bank Ltd. Banks 1.20National Thermal Power Corporation Limited Power 1.17Tata Consultancy Services Ltd. Software 1.10Tata Steel Limited. Ferrous Metals 1.05HDFC Ltd. Warrants Finance 0.96GAIL (India) Ltd. Gas 0.89Tech Mahindra Ltd. Software 0.84Mahindra & Mahindra Ltd. Auto 0.77ICICI Bank Ltd. Banks 0.70Bharti Airtel Ltd. Telecom - Services 0.66JSW Steel Ltd. Ferrous Metals 0.63Britannia Industries Ltd. Consumer Non Durables 0.59Ashok Leyland Ltd. Auto 0.56Marico Ltd. Consumer Non Durables 0.54Ambuja Cements Ltd Cement 0.52
EQUITY SCHEMES
6
This product is suitable for investors who are seeking*:� Long term capital growth� Investment in portfolio of predominantly equity & equity related securities* Investors should consult their financial advisors if in doubt about whether the product is suitable for them.
PRODUCT LABEL
Investors understand that their principal will be at moderately high risk
Riskometer
yletaredo
M
Moderate
Low
High
Low
High
LOW HIGH
Moderately
HCL Technologies Ltd. Software 0.50Sun Pharmaceuticals Industries Ltd. Pharmaceuticals 0.49Divi s Laboratories Limited Pharmaceuticals 0.48Yes Bank Ltd Banks 0.47Aurobindo Pharma Ltd. Pharmaceuticals 0.44ACC Ltd. Cement 0.43Alkem Laboratories Ltd Pharmaceuticals 0.43Pidilite Industries Ltd. Chemicals 0.41Equitas Holdings Ltd Finance 0.39Dr Reddys Laboratories Ltd Pharmaceuticals 0.34Hindalco Industries Ltd Non - Ferrous Metals 0.34Bosch Limited Auto Ancillaries 0.33Shriram Transport Finance Co Ltd. Finance 0.22Advanced Enzyme Technologies Ltd Healthcare Services 0.11Bharti Infratel Ltd. Telecom - Equipment & Accessories 0.02Maruti Suzuki India Limited Auto 0.01Listed/Awaiting Listing on Stock Exchange - Total 84.81Futures CNX NIFTY-AUG2016 3.38IndusInd Bank Ltd.-AUG2016 2.85Maruti Suzuki India Limited-AUG2016 1.75Bajaj Auto Ltd.-AUG2016 1.33Axis Bank Ltd-AUG2016 0.97ICICI Bank Ltd.-AUG2016 0.84Yes Bank Ltd-AUG2016 0.50Futures (Market value represents Notional Value) - Total 11.62TERM DEPOSITS Kotak Mahindra Bank Ltd. 5.19Term Deposits - Total 5.19Collateral Borrowing & Lending obligation 9.43Net Current Assets/(Liabilities) -11.05Grand Total 100
SECTOR ALLOCATION (%)
Banks Software Auto FinanceDerivativesConsumer Non Durables Pharmaceuticals
Cement
Petroleum Products CBLO&Term Deposits&Rev.Repo
23.9215.00
12.048.717.2
6.01
5.364.39
12.31
Others
24.24
15.27
12.38.14
7.17
6.13
5.314.21
12.2318.35
13.4
12.89
10.518.81
6.81
5.65
4.85
11.19
For last three dividends, please refer page no 56-58. For scheme performance, please refer page no 44-53 * For Fund Manager experience, please refer page 54-55.
Total amount invested (Rs)
Total Value as on Jun 30, 2016 (Rs)
Scheme Returns (%)
Nifty 100 (Rs)#
Nifty 100 Returns (%)
Nifty 50 (Rs)^
Nifty 50 Returns (%)
1 year 3 years 5 years 7 years 10 years Since Inception
120,000 360,000 600,000 840,000 1,200,000 1,320,000
126,094 423,164 832,495 1,257,738 2,162,687 2,528,325
9.58 10.80 13.07 11.34 11.34 11.29
125,707 413,926 795,658 1,184,471 1,988,276 2,360,700
8.96 9.29 11.24 9.66 9.75 10.13
125,632 406,397 775,087 1,152,292 1,912,086 2,272,982
8.84 8.04 10.19 8.89 9.01 9.49
Systematic Investment Plan (SIP) If you had invested `10,000 every month
EQUITY SCHEMES
6
Notes: Term Deposit as provided above is towards margin for derivatives transactions
(As on July 31, 2016)
14.62
12.77
11.6211.429.95
9.75
9.50
8.735.44
3.63 2.57

EQUITY SCHEMES
KOTAK OPPORTUNITIESAn Open - Ended Equity Growth Scheme
Investment Objective
To generate capital appreciation from a diversified portfolio of equity and equity related securities. However, there is no assurance that the objective of the scheme will be realized.
Allotment Date
September 9, 2004
Fund Manager
Mr. Harsha Upadhyaya*
Benchmark
Nifty 500
AAUM (` In Crores)
AAUM as on July 31, 2016: ̀ 787.89
AUM (` In Crores)
AUM as on July 31, 2016: ̀ 808.13
Available Plans/Options
A) Regular Plan:
B) Direct Plan / Options: Dividend Payout, Dividend Reinvestment & Growth (applicable for all plans)
Dividend Frequency
Trustee�s Discretion
Ratios
Portfolio Turnover: 22.43% $Beta: 0.98$ ##Sharpe :1.04$Standard Deviation :15.88%
$Source: ICRA MFI Explorer.
##Risk rate assumed to be 6.59% (FBIL Overnight MIBOR rate as on 29th July 2016)
Minimum Investment Amount
Initial Investment: `5000 and in multiple of `1 for purchase and for `0.01 for switches
Additional Investment: `1000 & in multiples of ̀ 1
Ideal Investments Horizon: 3 years & above
Load Structure
Entry Load: Nil. (applicable for all plans)
Exit Load:
I) For redemptions / switch outs (including SIP/STP) within 1 year from the date of allotment of units, irrespective of the amount of investment: 1%
ii) For redemptions / switch outs (including SIP/STP) after 1 year from the date of allotment of units, irrespective of the amount of investment: NIL
iii) Any exit load charged (net off Service Tax, if any) shall be credited back to the respective Scheme. (applicable for all plans)
iv) Units issued on reinvestment of dividends shall not be subject to exit load (applicable for all plans)
Total Expense Ratio**
Regular: 2.33%Direct: 1.16%
**Total Expense Ratio excludes applicable B15 fee and service tax.
7
SYSTEMATIC INVESTMENT PLAN (SIP)
Scheme Inception : - September 09, 2004. The returns are calculated by XIRR approach assuming investment of 10,000/- on the 1st working `day of every month. XIRR helps in calculating return on investments given an initial and final value and a series of cash inflows and outflows and taking the time of investment into consideration. Since inception returns are assumed to be starting from the beginning of the subsequent month from the date of inception. # Benchmark ; ̂ Additional Benchmark Kotak Opportunities NAV as on July 29, 2016: `25.173 (Dividend Option), `26.047 (Direct Dividend Option), `90.667 (Growth Option), `93.638 (Direct Growth Option)
Issuer/Instrument Industry/Rating % to Net Assets
Issuer/Instrument Industry/Rating % to Net Assets
PORTFOLIO
Notes: Term Deposit as provided above is towards margin for derivatives transactions
This product is suitable for investors who are seeking*:� Long term capital growth� Investment in portfolio of predominantly equity & equity related securities* Investors should consult their financial advisors if in doubt about whether the product is suitable for them.
PRODUCT LABEL
Investors understand that their principal will be at moderately high risk
Riskometer
yletaredo
M
Moderate
Low
High
Low
High
LOW HIGH
Moderately
INVESTMENT STYLE
Value Blend Growth Size
Large
Mid
Small
Style
SECTOR ALLOCATION (%)
Banks Software
Cement
OthersAuto Pharmaceuticals Finance Consumer Non Durables
Petroleum Products
Gas Construction Project
For last three dividends, please refer page no 56-58. For scheme performance, please refer page no 44-53 * For Fund Manager experience, please refer page 54-55.
Total amount invested (Rs)
Total Value as on Jun 30, 2016 (Rs)
Scheme Returns (%)
Nifty 500 (Rs)#
Nifty 500 Returns (%)
Nifty 50 (Rs)^
Nifty 50 Returns (%)
1 year 3 years 5 years 7 years 10 years Since Inception
120,000 360,000 600,000 840,000 1,200,000 1,420,000
127,305 459,901 918,290 1,391,839 2,420,898 3,641,617
11.51 16.59 17.06 14.18 13.45 14.96
126,375 425,688 817,288 1,204,466 1,996,825 2,766,795
10.02 11.21 12.32 10.13 9.83 10.73
125,632 406,397 775,087 1,152,257 1,912,051 2,702,171
8.84 8.04 10.19 8.89 9.01 10.36
Systematic Investment Plan (SIP) If you had invested `10,000 every month
Equity & Equity related (Listed/Awaiting listing on Stock Exchange) HDFC Bank Ltd. Banks 5.12Infosys Ltd. Software 4.78Bajaj Finance Limited Finance 4.11ITC Ltd. Consumer Non Durables 3.59Shree Cement Ltd. Cement 3.54Hindustan Petroleum Corporation Ltd Petroleum Products 3.36Hero MotoCorp Ltd. Auto 3.17Axis Bank Ltd Banks 2.87Bharat Petroleum Corporation Ltd. Petroleum Products 2.79ICICI Bank Ltd. Banks 2.77Maruti Suzuki India Limited Auto 2.65Ultratech Cement Ltd. Cement 2.53Larsen And Toubro Ltd. Construction Project 2.41IndusInd Bank Ltd. Banks 2.40UPL Ltd Pesticides 2.32State Bank Of India Banks 2.27Dalmia Bharat Ltd Cement 2.23Reliance Industries Ltd. Petroleum Products 2.20Tata Motors Ltd. Auto 1.97Britannia Industries Ltd. Consumer Non Durables 1.91Sun Pharmaceuticals Industries Ltd. Pharmaceuticals 1.90Torrent Pharmaceuticals Ltd. Pharmaceuticals 1.87Max Financial Services Ltd. Finance 1.82Mahindra & Mahindra Ltd. Auto 1.81The Ramco Cements Ltd Cement 1.70Indraprastha Gas Ltd. Gas 1.68Tech Mahindra Ltd. Software 1.64Petronet LNG Ltd. Gas 1.57Lupin Ltd. Pharmaceuticals 1.41HCL Technologies Ltd. Software 1.40National Buildings Construction Corporation Limited Construction 1.22Multi Commodity Exchange of India Limited Finance 1.17Healthcare Global Enterprises Ltd Healthcare Services 1.16Va Tech Wabag Limited Engineering Services 1.07Arvind Ltd Textile Products 1.06
Ashok Leyland Ltd. Auto 1.06Persistent Systems Limited Software 1.02JK Cement Ltd. Cement 0.97Whirlpool of India Ltd. Consumer Durables 0.97Fag Bearings India Ltd. Industrial Products 0.96MRF Limited Auto Ancillaries 0.96AIA Engineering Limited Industrial Capital Goods 0.95Bank Of Baroda Banks 0.94Container Corporation of India Ltd. Transportation 0.93DR.Lal Pathlabs Ltd Healthcare Services 0.90Techno Electric & Engineering Co Ltd. Construction Project 0.85Federal Bank Ltd. Banks 0.80Equitas Holdings Ltd Finance 0.73Cummins India Ltd. Industrial Products 0.65MBL Infrastructures Ltd. Construction 0.59Prestige Estates Projects Limited Construction 0.57HDFC Ltd. Warrants Finance 0.54SKF India Ltd Industrial Products 0.51CESC Ltd. Power 0.49D-Link (India) Ltd Hardware 0.46Swaraj Engines Ltd Industrial Products 0.43Max India Limited Healthcare Services 0.286 Redm Preference Sh Zee Entertainment Enterprises Ltd Media and Entertainment 0.14Listed/Awaiting Listing on Stock Exchange - Total 98.17Futures Cummins India Ltd.-AUG2016 0.21Futures (Market value represents Notional Value) - Total 0.21TERM DEPOSITS Kotak Mahindra Bank Ltd. 0.43Term Deposits - Total 0.43Collateral Borrowing & Lending obligation 1.52Net Current Assets/(Liabilities) -0.33Grand Total 100
(As on July 31, 2016)
17.17
10.97
10.66
8.848.37
8.35
5.50
5.18
3.26
3.25
18.45

KOTAK SELECT FOCUS FUNDAn Open - Ended Equity Scheme
Issuer/Instrument Industry/Rating % to Net Assets
Issuer/Instrument Industry/Rating % to Net Assets
PORTFOLIO
EQUITY SCHEMES
Investment Objective
The investment objective of the scheme is to generate long-term capital appreciation from a portfolio of equity and equity related securities, generally focused on a few selected sectors. However, there is no assurance that the objective of the scheme will be realized.
Allotment Date
September 11, 2009
Fund Manager
Mr. Harsha Upadhyaya*
Benchmark
Nifty 200
AAUM (` In Crores)
AAUM as on July 31, 2016: ̀ 5,259.59
AUM (` In Crores)
AUM as on July 31, 2016: ̀ 5,481.39
Available Plans/Options
A) Regular Plan
B) Direct Plan / Options: Dividend Payout, Dividend Reinvestment & Growth (applicable for all plans)
Dividend Frequency
Trustee�s Discretion
Ratios
Portfolio Turnover: 19.80% $Beta: 1.00$ ##Sharpe : 1.17$Standard Deviation : 16.19%
$Source: ICRA MFI Explorer.
## Risk rate assumed to be 6.59% (FBIL Overnight MIBOR rate as on 29th July 2016)
Minimum Investment Amount
Initial Investment: `5000 and in multiple of `1 for purchase and for `0.01 for switches
Additional Investment: `1000 & in multiples of ̀ 1
Ideal Investments Horizon: 3 years & above
Load Structure
Entry Load: Nil. (applicable for all plans)
Exit Load:
I) For redemptions / switch outs (including SIP/STP) within 1 year from the date of allotment of units, irrespective of the amount of investment:1%
ii) For redemptions / switch outs (including SIP/STP) after 1 year from the date of allotment of units, irrespective of the amount of investment: NIL
iii) Any exit load charged (net off Service Tax, if any) shall be credited back to the respective Scheme. (applicable for all plans)
iv) Units issued on reinvestment of dividends shall not be subject to exit load (applicable for all plans)
Total Expense Ratio**
Regular: 2.01%Direct: 1.00%
**Total Expense Ratio excludes applicable B15 fee and service tax.
SYSTEMATIC INVESTMENT PLAN (SIP)
Scheme Inception : - September 11, 2009. The returns are calculated by XIRR approach assuming investment of 10,000/- on the 1st working `day of every month. XIRR helps in calculating return on investments given an initial and final value and a series of cash inflows and outflows and taking the time of investment into consideration. Since inception returns are assumed to be starting from the beginning of the subsequent month from the date of inception. # Benchmark ; ̂ Additional Benchmark
Kotak Select Focus Fund NAV as on July 29, 2016: ` 20.810 (Dividend Option), `21.519 (Direct Dividend Option), `25.733 (Growth Option), `26.562 (Direct Growth Option)
Notes: Term Deposit as provided above is towards margin for derivatives transactions
Equity & Equity related (Listed/Awaiting listing on Stock Exchange) HDFC Bank Ltd. Banks 5.91Reliance Industries Ltd. Petroleum Products 4.63Ultratech Cement Ltd. Cement 4.24Infosys Ltd. Software 4.11ITC Ltd. Consumer Non Durables 3.91The Ramco Cements Ltd Cement 3.64Hero MotoCorp Ltd. Auto 3.51Shree Cement Ltd. Cement 3.38Axis Bank Ltd Banks 3.19IndusInd Bank Ltd. Banks 3.11Hindustan Petroleum Corporation Ltd Petroleum Products 3.05Mahindra & Mahindra Ltd. Auto 2.94Max Financial Services Ltd. Finance 2.81Bajaj Finance Limited Finance 2.74Larsen And Toubro Ltd. Construction Project 2.73Maruti Suzuki India Limited Auto 2.71Britannia Industries Ltd. Consumer Non Durables 2.27Indraprastha Gas Ltd. Gas 2.09Petronet LNG Ltd. Gas 2.07ICICI Bank Ltd. Banks 1.98Bharat Electronics Ltd Industrial Capital Goods 1.97Bharat Petroleum Corporation Ltd. Petroleum Products 1.95Tata Motors Ltd. Auto 1.92State Bank Of India Banks 1.74Sun Pharmaceuticals Industries Ltd. Pharmaceuticals 1.59Equitas Holdings Ltd Finance 1.54HCL Technologies Ltd. Software 1.51Lupin Ltd. Pharmaceuticals 1.51Godrej Consumer Products Ltd. Consumer Non Durables 1.45Arvind Ltd Textile Products 1.33Ashok Leyland Ltd. Auto 1.30Bajaj Finserv Ltd. Finance 1.24Container Corporation of India Ltd. Transportation 1.18MRF Limited Auto Ancillaries 1.10Jk Lakshmi Cement Ltd. Cement 1.03Bayer Cropscience Ltd. Pesticides 0.99Federal Bank Ltd. Banks 0.94
Cadila Healthcare Ltd. Pharmaceuticals 0.91Tech Mahindra Ltd. Software 0.91Techno Electric & Engineering Co Ltd. Construction Project 0.89Solar Industries India Limited Chemicals 0.75Bank Of Baroda Banks 0.70AIA Engineering Limited Industrial Capital Goods 0.66Kec International Ltd. Power 0.59Max India Limited Healthcare Services 0.55Navkar Corporation Limited Transportation 0.51Whirlpool of India Ltd. Consumer Durables 0.43HDFC Ltd. Warrants Finance 0.33CESC Ltd. Power 0.31Kirloskar Oil Engines Ltd. Industrial Products 0.22IFB Industries Ltd. Consumer Durables 0.186 Redm Preference Sh Zee Entertainment Enterprises Ltd Media and Entertainment 0.02Advanced Enzyme Technologies Ltd Healthcare Services 0.01Listed/Awaiting Listing on Stock Exchange - Total 97.28TERM DEPOSITS Kotak Mahindra Bank Ltd. 0.45Term Deposits - Total 0.45Collateral Borrowing & Lending obligation 2.77Net Current Assets/(Liabilities) -0.50Grand Total 100
Systematic Investment Plan (SIP) If you had invested `10,000 every month
This product is suitable for investors who are seeking*:� Long term capital growth� Investment in portfolio of predominantly equity & equity related securities
generally focussed on a few selected sectors.* Investors should consult their financial advisors if in doubt about whether the product is suitable for them.
PRODUCT LABEL
Investors understand that their principal will be at moderately high risk
Riskometer
yletaredo
M
Moderate
Low
High
Low
High
LOW HIGH
Moderately
Total amount invested (Rs)
Total Value as on Jun 30, 2016 (Rs)
Scheme Returns (%)
Nifty 200 (Rs)#
Nifty 200 Returns (%)
Nifty 50 (Rs)^
Nifty 50 Returns (%)
INVESTMENT STYLE
Value Blend Growth Size
Large
Mid
Small
Style
SECTOR ALLOCATION (%)
Banks Software
Cement
Petroleum ProductsAuto Pharmaceuticals Finance Consumer Non Durables
Gas
Construction Project Others
20.27
10.82
9.43
8.327.77.38
6.68
4.994.95
4.48
14.98
8For last three dividends, please refer page no 56-58. For scheme performance, please refer page no 44-53 * For Fund Manager experience, please refer page 54-55.
(As on July 31, 2016)
1 year 3 years 5 years Since Inception
120,000 360,000 600,000 820,000
129,377 479,888 985,598 1,466,182
14.84 19.61 19.96 16.74
125,779 418,163 801,361 1,143,845
9.07 9.99 11.53 9.59
125,632 406,397 775,087 1,114,851
8.84 8.04 10.19 8.86
17.57
12.38
12.29
9.638.66
7.63
6.53
4.16
4.013.62
13.52

KOTAK TAX SAVERAn Open - Ended Equity Linked Savings Scheme
Investment Objective
To generate long-term capital appreciation from a diversified portfolio of equity and equity related securities and enable investors to avail the income tax rebate, as permitted from time to time. However, there is no assurance that the objective of the scheme will be realized.
Allotment Date
November 23, 2005
Fund Manager
Mr. Harsha Upadhyaya*
Benchmark
Nifty 500
AAUM (` In Crores)
AAUM as on July 31, 2016: ` 484.46
AUM (` In Crores)
AUM as on July 31, 2016: ` 496.29
Available Plans/Options
A) Regular Plan
B) Direct Plan / Options: Dividend Payout & Growth (applicable for all plans). .....
Dividend Frequency
Trustee�s Discretion
Ratios
Portfolio Turnover: 19.62% $Beta: 1.05$ ##Sharpe : 1.01$Standard Deviation : 17.06%
$Source: ICRA MFI Explorer.
## Risk rate assumed to be 6.59% (FBIL Overnight MIBOR rate as on 29th July 2016)
Minimum Investment Amount
Initial Investment: `500 and in multiple of `500
Additional Investment: `500 & in multiples of ̀ 500
Ideal Investments Horizon: 3 years & above
Load Structure
Entry Load: Nil. (applicable for all plans)
Exit Load: Exit Load is not applicable for Kotak Tax Saver Scheme. (applicable for all plans)
Units issued on reinvestment of dividends shall not be subject to exit load (applicable for all plans)
Total Expense Ratio**
Regular: 2.46%Direct: 1.21%
**Total Expense Ratio excludes applicable B15 fee and service tax.
EQUITY SCHEMES
9
SYSTEMATIC INVESTMENT PLAN (SIP)
Scheme Inception : - November 23, 2005. The returns are calculated by XIRR approach assuming investment of 10,000/- on the 1st working `day of every month. XIRR helps in calculating return on investments given an initial and final value and a series of cash inflows and outflows and taking the time of investment into consideration. Since inception returns are assumed to be starting from the beginning of the subsequent month from the date of inception. # Benchmark ; ̂ Additional BenchmarkKotak Tax Saver NAV as on July 29, 2016: `18.086 (Dividend Option), `20.220 (Direct Dividend Option), ` 33.232 (Growth Option), `34.730 (Direct Growth Option)
INVESTMENT STYLE
Value Blend Growth Size
Large
Mid
Small
Style
Issuer/Instrument Industry/Rating % to Net Assets
Issuer/Instrument Industry/Rating % to Net Assets
Multi Commodity Exchange of India Limited Finance 1.27Arvind Ltd Textile Products 1.23Container Corporation of India Ltd. Transportation 1.21HCL Technologies Ltd. Software 1.21Bank Of Baroda Banks 1.15AIA Engineering Limited Industrial Capital Goods 1.04Blue Dart Express Ltd. Transportation 1Thermax Ltd. Industrial Capital Goods 0.98Hawkins Cooker Ltd Household Appliances 0.84Navneet Education Ltd. Media and Entertainment 0.84Texmaco Rail & Engineering Ltd. Industrial Capital Goods 0.69MBL Infrastructures Ltd. Construction 0.63Cummins India Ltd. Industrial Products 0.53KSB Pump Ltd Industrial Products 0.53Maruti Suzuki India Limited Auto 0.38Max India Limited Healthcare Services 0.366 Redm Preference Sh Zee Entertainment Enterprises Ltd Media and Entertainment 0.15Advanced Enzyme Technologies Ltd Healthcare Services 0.01Listed/Awaiting Listing on Stock Exchange - Total 97.87Debt Instruments Debentures and Bonds Corporate Debt/Financial Institutions Blue Dart Express Ltd ICRA AA 0.03Corporate Debt/Financial Institutions - Total 0.03Collateral Borrowing & Lending obligation 2.10Grand Total 100
PORTFOLIO
Equity & Equity related (Listed/Awaiting listing on Stock Exchange) HDFC Bank Ltd. Banks 5.56Infosys Ltd. Software 5.19Reliance Industries Ltd. Petroleum Products 4.23ITC Ltd. Consumer Non Durables 4.08Shree Cement Ltd. Cement 3.90IndusInd Bank Ltd. Banks 3.32Axis Bank Ltd Banks 3.25Hindustan Petroleum Corporation Ltd Petroleum Products 3.05ICICI Bank Ltd. Banks 3.05Bajaj Finance Limited Finance 3.03Ultratech Cement Ltd. Cement 3Bharat Petroleum Corporation Ltd. Petroleum Products 2.99Hero MotoCorp Ltd. Auto 2.90Whirlpool of India Ltd. Consumer Durables 2.60State Bank Of India Banks 2.52Larsen And Toubro Ltd. Construction Project 2.20Tata Motors Ltd. Auto 2.14Techno Electric & Engineering Co Ltd. Construction Project 2.08Britannia Industries Ltd. Consumer Non Durables 2.01SKF India Ltd Industrial Products 1.93Dalmia Bharat Ltd Cement 1.89Mahanagar Gas Ltd Gas 1.78SRF Ltd. Textile Products 1.77Lupin Ltd. Pharmaceuticals 1.75Sun PharmaceuticalsIndustries Ltd. Pharmaceuticals 1.67The Ramco Cements Ltd Cement 1.66Max Financial Services Ltd. Finance 1.58Tech Mahindra Ltd. Software 1.57UPL Ltd Pesticides 1.51Solar Industries India Limited Chemicals 1.49Cadila Healthcare Ltd. Pharmaceuticals 1.48Ashok Leyland Ltd. Auto 1.34Federal Bank Ltd. Banks 1.30
This product is suitable for investors who are seeking*:� long term capital growth with a 3 year lock in� Investment in portfolio of predominantly equity & equity related securities.* Investors should consult their financial advisors if in doubt about whether the product is suitable for them.
PRODUCT LABEL
Investors understand that their principal will be at moderately high risk
Riskometer
yletaredo
M
Moderate
Low
High
Low
High
LOW HIGH
Moderately
SECTOR ALLOCATION (%)
Banks SoftwareAuto
PharmaceuticalsConsumer Non Durables Petroleum ProductsCement Finance Construction ProjectIndustrial Products Others
22.51
9.75
7.36.14
6.16.055.68
5.32
4.94
4.65
21.56
For last three dividends, please refer page no 56-58. For scheme performance, please refer page no 44-53* For Fund Manager experience, please refer page 54-55
Total amount invested (Rs)
Total Value as on Jun 30, 2016 (Rs)
Scheme Returns (%)
Nifty 500 (Rs)#
Nifty 500 Returns (%)
Nifty 50 (Rs)^
Nifty 50 Returns (%)
1 year 3 years 5 years 7 years 10 years Since Inception
120,000 360,000 600,000 840,000 1,200,000 1,280,000
125,739 460,485 884,961 1,322,372 2,169,298 2,387,538
9.01 16.68 15.55 12.74 11.40 11.20
126,375 425,688 817,288 1,204,596 1,996,956 2,212,547
10.02 11.21 12.32 10.13 9.84 9.87
125,632 406,397 775,087 1,152,292 1,912,086 2,133,041
8.84 8.04 10.19 8.89 9.01 9.22
Systematic Investment Plan (SIP) If you had invested `10,000 every month
(As on July 31, 2016)
20.15
10.45
10.27
7.976.766.095.88
4.90
4.28
3.00
20.25

KOTAK MID-CAPAn Open - Ended Equity Growth Scheme
INVESTMENT STYLE
Investment Objective
To generate capital appreciation from a diversified portfolio of equity and equity related securities. However, there is no assurance that the objective of the scheme will be realized.
Allotment Date
February 24, 2005
Fund Manager
Mr. Pankaj Tibrewal*
Benchmark
Nifty Midcap 100
AAUM (` In Crores)
AAUM as on July 31, 2016: ̀ 415.68
AUM (` In Crores)
AUM as on July 31, 2016: ̀ 431.97
Available Plans/Options
A) Regular Plan
B) Direct Plan / Options: Dividend Payout, Dividend Reinvestment & Growth (applicable for all plans)
Dividend Frequency
Trustee�s Discretion
Ratios
Portfolio Turnover:47.58% $Beta: 1.01$ ##Sharpe : 1.45$Standard Deviation : 18.53%
$Source: ICRA MFI Explorer.
## Risk rate assumed to be 6.59% (FBIL Overnight MIBOR rate as on 29th July 2016)
Minimum Investment Amount
Initial Investment: `5000 and in multiple of `1 for purchase and for `0.01 for switches
Additional Investment: `1000 & in multiples of ̀ 1
Ideal Investments Horizon: 3 years & above
Load Structure
Entry Load: Nil. (applicable for all plans)
Exit Load:
I) For redemptions / switch outs (including SIP/STP) within 1 year from the date of allotment of units, irrespective of the amount of investment:1%
ii) For redemptions / switch outs (including SIP/STP) after 1 year from the date of allotment of units, irrespective of the amount of investment: NIL
iii) Any exit load charged (net off Service Tax, if any) shall be credited back to the Scheme.(applicable for all plans)
iv) Units issued on reinvestment of dividends shall not be subject to exit load (applicable for all plans)
Total Expense Ratio**
Regular: 2.50%Direct: 1.24%
**Total Expense Ratio excludes applicable B15 fee and service tax.
StyleEQUITY SCHEMES
SYSTEMATIC INVESTMENT PLAN (SIP)
Scheme Inception : - February 24,2005. The returns are calculated by XIRR approach assuming investment of 10,000/- on the 1st working day `of every month. XIRR helps in calculating return on investments given an initial and final value and a series of cash inflows and outflows and taking the time of investment into consideration. Since inception returns are assumed to be starting from the beginning of the subsequent month from the date of inception. # Benchmark ; ̂ Additional BenchmarkKotak Mid-cap NAV as on July 29, 2016: `33.509 (Dividend Option), `34.934 (Direct Dividend Option), `60.452 (Growth Option), `62.861 (Direct Growth Option)
Value Blend Growth Size
Large
Mid
Small
Issuer/Instrument Industry/Rating % to Net Assets
Equity & Equity related (Listed/Awaiting listing on Stock Exchange) Finolex Cables Ltd. Industrial Products 3.41Atul Ltd. Chemicals 2.90DB Corp Limited Media and Entertainment 2.85Techno Electric & Engineering Co Ltd. Construction Project 2.84Federal Bank Ltd. Banks 2.59The Ramco Cements Ltd Cement 2.52Whirlpool of India Ltd. Consumer Durables 2.52Fag Bearings India Ltd. Industrial Products 2.46IndusInd Bank Ltd. Banks 2.45Persistent Systems Limited Software 2.39Hindustan Petroleum Corporation Ltd Petroleum Products 2.37Solar Industries India Limited Chemicals 2.35ICICI Bank Ltd. Banks 2.27Kewal Kiran Clothing Limited. Textile Products 2.26Hawkins Cooker Ltd Household Appliances 2.04Shriram City Union Finance Ltd. Finance 2.04SRF Ltd. Textile Products 2.02JK Cement Ltd. Cement 2.01Strides Shasun Ltd. Pharmaceuticals 1.98Alkem Laboratories Ltd Pharmaceuticals 1.91Divi s Laboratories Limited Pharmaceuticals 1.83Motherson Sumi Systems Ltd. Auto Ancillaries 1.79Va Tech Wabag Limited Engineering Services 1.76Thermax Ltd. Industrial Capital Goods 1.72Shriram Transport Finance Co Ltd. Finance 1.70Mahindra & Mahindra Financial Services Ltd. Finance 1.64Bajaj Finserv Ltd. Finance 1.61MRF Limited Auto Ancillaries 1.54Voltas Ltd. Construction Project 1.54Britannia Industries Ltd. Consumer Non Durables 1.53
Issuer/Instrument Industry/Rating % to Net Assets
Torrent Pharmaceuticals Ltd. Pharmaceuticals 1.53HSIL Ltd. Consumer Durables 1.48Bajaj Finance Limited Finance 1.47Arvind Ltd Textile Products 1.46Pennar Engineered Building Systems Limited Ferrous Metals 1.46Sundaram Finance Ltd. Finance 1.43Axis Bank Ltd Banks 1.40Bharat Forge Ltd. Industrial Products 1.38Jubilant Foodworks Limited Consumer Non Durables 1.33PVR Ltd. Media and Entertainment 1.31Havells India Ltd. Consumer Durables 1.30Cadila Healthcare Ltd. Pharmaceuticals 1.27Adani Port and Special Economic Zone Limited Transportation 1.22Jk Lakshmi Cement Ltd. Cement 1.16NIIT Technologies Ltd Software 1.16Navneet Education Ltd. Media and Entertainment 1.12Kansai Nerolac Paints Ltd Consumer Non Durables 1.10UPL Ltd Pesticides 1Zuari Agro Chemicals Ltd Fertilisers 0.95SKF India Ltd Industrial Products 0.92Balrampur Chini Mills Ltd Consumer Non Durables 0.89Bharat Petroleum Corporation Ltd. Petroleum Products 0.89Bank Of Baroda Banks 0.84WPIL Ltd Industrial Products 0.82Power Mech Projects Ltd Power 0.74Tech Mahindra Ltd. Software 0.73Supreme Industries Limited Industrial Products 0.50Union Bank Of India Banks 0.18CNX NIFTY - 8600.000 - Put Option - September 2016 0.10Listed/Awaiting Listing on Stock Exchange - Total 95.88Collateral Borrowing & Lending obligation 3.61Net Current Assets/(Liabilities) 0.41Grand Total 100
PORTFOLIO
This product is suitable for investors who are seeking*:� Long term capital growth� Investment in equity & equity related securities predominantly in mid cap
stocks.* Investors should consult their financial advisors if in doubt about whether the product is suitable for them.
PRODUCT LABEL
Investors understand that their principal will be at moderately high risk
Riskometer
yletaredo
M
Moderate
Low
High
Low
High
LOW HIGH
Moderately
SECTOR ALLOCATION (%)
Banks
Industrial Products
Consumer DurablesPharmaceuticals
CementTextile Products
FinanceMedia & Entertainment
Others
Midcap and Small cap stocks as a % age of Net Assets: 81.34%
12.81 9.64
7.61
7.38 6.87
6.37 5.79
5.28 5.07
27.71
Chemicals
For last three dividends, please refer page no 56-58. For scheme performance, please refer page no 44-53.* For Fund Manager experience, please refer page 54-55.
Total amount invested (Rs)
Total Value as on Jun 30, 2016 (Rs)
Scheme Returns (%)
Nifty Midcap 100 (Rs)#
Nifty Midcap 100 Returns (%)
Nifty 50 (Rs)^
Nifty 50 Returns (%)
1 year 3 years 5 years 7 years 10 years Since Inception
120,000 360,000 600,000 840,000 1,200,000 1,370,000
130,740 528,754 1,073,157 1,677,872 2,870,661 3,603,339
17.05 26.67 23.48 19.43 16.63 15.95
127,202 476,332 919,332 1,356,476 2,351,899 3,001,431
11.34 19.08 17.11 13.46 12.91 13.03
125,632 406,397 775,087 1,152,292 1,912,086 2,477,821
8.84 8.04 10.19 8.89 9.01 9.93
Systematic Investment Plan (SIP) If you had invested `10,000 every month
10
(As on July 31, 2016)
Consumer Non Durables
9.899.73
9.49
8.52
5.745.69
5.305.28
5.25
4.85
30.26

EQUITY SCHEMES
KOTAK EMERGING EQUITYAn Open - Ended Equity Growth Scheme
INVESTMENT STYLE
Investment Objective
The investment objective of the scheme is to generate long-term capital appreciation from a portfolio of equity and equity related securities, by investing predominantly in mid and small cap companies. However, there is no assurance that the objective of the scheme will be realized.
Allotment Date
March 30, 2007
Fund Manager
Mr. Pankaj Tibrewal*
Benchmark
S&P BSE MID SMALL CAP
AAUM (` In Crores)
AAUM as on July 31, 2016: ̀ 985.56
AUM (` In Crores)
AUM as on July 31, 2016: ̀ 1,018.81
Available Plans/Options
A) Regular Plan
B) Direct Plan / Options: Dividend Payout, Dividend Reinvestment & Growth (applicable for all plans)
Dividend Frequency
Trustee�s Discretion
Ratios
Portfolio Turnover: 39.55%$Beta: 0.97$ ##Sharpe :1.67$Standard Deviation : 18.12%
$Source: ICRA MFI Explorer.
## Risk rate assumed to be 6.59% (FBIL Overnight MIBOR rate as on 29th July 2016)
Minimum Investment Amount
Initial Investment: `5000 and in multiple of `1 for purchase and for `0.01 for switches
Additional Investment: `1000 & in multiples of ̀ 1
Ideal Investments Horizon: 3 years & above
Load Structure
Entry Load: Nil. (applicable for all plans)
Exit Load:
i) For redemptions / switch outs (including SIP/STP) within 1 year from the date of allotment of units, irrespective of the amount of investment: 1%.
ii) For redemption/switch outs (including SIP/STP) after 1 year from the date of allotment of units, irrespective of the amount of investment: Nil.
Note � Any exit load charged (net off Service Tax, if any) shall be credited back to the respective scheme. Units issued on reinvestment of dividends shall not be subject to entry and exit load.
Total Expense Ratio**
Regular: 2.25%Direct: 1.05%
**Total Expense Ratio excludes applicable B15 fee and service tax.
Value Blend Growth Size
Large
Mid
Small
Style
11
SYSTEMATIC INVESTMENT PLAN (SIP)
Issuer/Instrument Industry/Rating % to Net Assets
Issuer/Instrument Industry/Rating % to Net Assets
PORTFOLIO
Equity & Equity related (Listed/Awaiting listing on Stock Exchange) V-Guard Industries Ltd. Industrial Capital Goods 3.98Finolex Cables Ltd. Industrial Products 3.50Whirlpool of India Ltd. Consumer Durables 3.27The Ramco Cements Ltd Cement 3.03Fag Bearings India Ltd. Industrial Products 2.93Solar Industries India Limited Chemicals 2.79DB Corp Limited Media and Entertainment 2.73IndusInd Bank Ltd. Banks 2.59Persistent Systems Limited Software 2.55Federal Bank Ltd. Banks 2.46Atul Ltd. Chemicals 2.43Hawkins Cooker Ltd Household Appliances 2.34SRF Ltd. Textile Products 2.31Strides Shasun Ltd. Pharmaceuticals 2.29Carborundum Universal Ltd. Industrial Products 2.07PVR Ltd. Media and Entertainment 2.04ICICI Bank Ltd. Banks 2.02Kewal Kiran Clothing Limited. Textile Products 1.97Alkem Laboratories Ltd Pharmaceuticals 1.96Motherson Sumi Systems Ltd. Auto Ancillaries 1.92Shriram City Union Finance Ltd. Finance 1.87Mahindra & Mahindra Financial Services Ltd. Finance 1.69Navneet Education Ltd. Media and Entertainment 1.66Indraprastha Gas Ltd. Gas 1.60Va Tech Wabag Limited Engineering Services 1.59Finolex Industries Ltd. Industrial Products 1.57Pennar Engineered Building Systems Limited Ferrous Metals 1.51Jk Lakshmi Cement Ltd. Cement 1.50Bajaj Finance Limited Finance 1.49Divi s Laboratories Limited Pharmaceuticals 1.41SKF India Ltd Industrial Products 1.41Sundaram Finance Ltd. Finance 1.41Torrent Pharmaceuticals Ltd. Pharmaceuticals 1.33Ramkrishna Forgings Ltd. Industrial Products 1.31PNC INFRATECH LIMITED Construction Project 1.29Britannia Industries Ltd. Consumer Non Durables 1.23Jubilant Foodworks Limited Consumer Non Durables 1.20
Max Financial Services Ltd. Finance 1.19Axis Bank Ltd Banks 1.17Equitas Holdings Ltd Finance 1.16Greaves Cotton Ltd. Industrial Products 1.11Coromandel International Ltd. Fertilisers 1.10D-Link (India) Ltd Hardware 1.07Oberoi Realty Ltd Construction 0.92GMM Pfaudler Ltd. Engineering 0.90Power Mech Projects Ltd Power 0.88Zuari Agro Chemicals Ltd Fertilisers 0.86Maharashtra Seamless Ltd. Ferrous Metals 0.85WPIL Ltd Industrial Products 0.83Kirloskar Brothers Ltd. Industrial Products 0.69Engineers India Ltd. Construction Project 0.68IDFC Bank Limited Banks 0.66Supreme Industries Limited Industrial Products 0.64Kec International Ltd. Power 0.61Multi Commodity Exchange of India Limited Finance 0.58Bank Of Baroda Banks 0.55IFB Industries Ltd. Consumer Durables 0.50Blue Dart Express Ltd. Transportation 0.40KPIT Technologies LImited Software 0.37Max India Limited Healthcare Services 0.30Listed/Awaiting Listing on Stock Exchange - Total 94.27TERM DEPOSITS Kotak Mahindra Bank Ltd. 0.25Term Deposits - Total 0.25Collateral Borrowing & Lending obligation 5.90Net Current Assets/(Liabilities) -0.42Grand Total 100
Scheme Inception : - March 30, 2007. The returns are calculated by XIRR approach assuming investment of 10,000/- on the 1st working day of `every month. XIRR helps in calculating return on investments given an initial and final value and a series of cash inflows and outflows and taking the time of investment into consideration. Since inception returns are assumed to be starting from the beginning of the subsequent month from the date of inception. # Benchmark ; ̂ Additional BenchmarkKotak Emerging Equity NAV as on July 29, 2016: `22.065 (Dividend Option), `22.996 (Direct Dividend Option), `30.310 (Growth Option), `31.440 (Direct Growth Option)
This product is suitable for investors who are seeking*:� Long term capital growth� Investment in equity & equity related securities predominantly in mid &
small cap companies* Investors should consult their financial advisors if in doubt about whether the product is suitable for them.
PRODUCT LABEL
Investors understand that their principal will be at moderately high risk
Riskometer
yletaredo
M
Moderate
Low
High
Low
High
LOW HIGH
Moderately
SECTOR ALLOCATION (%)
Midcap and Small cap stocks as a % age of Net Assets: 86.99%
Industrial Products Pharmaceuticals BanksIndustrial Capital Goods Finance CementMedia and Entertainment CBLO & Term Deposits & Rev.RepoChemicals Textile Products Others
11 For last three dividends, please refer page no 56-58. For scheme performance, please refer page no 44-53.* For Fund Manager experience, please refer page 54-55.
Total amount invested (Rs)
Total Value as on Jun 30, 2016 (Rs)
Scheme Returns (%)
S&P BSE MidSmallCap (Rs)#
S&P BSE MidSmallCap Returns (%)
Nifty 50 (Rs)^
Nifty 50 Returns (%)
Systematic Investment Plan (SIP) If you had invested `10,000 every month
(As on July 31, 2016)
1 year 3 years 5 years 7 years Since Inception
120,000 360,000 600,000 840,000 1,120,000
133,432 564,788 1,169,933 1,811,581 2,733,587
21.45 31.59 27.09 21.58 18.32
128,597 478,988 922,974 1,341,323 2,034,381
13.59 19.48 17.27 13.14 12.35
125,632 406,397 775,087 1,152,292 1,728,256
8.84 8.04 10.19 8.89 9.03
16.06
9.45
9.39
6.996.43
6.155.22
4.53
4.28
3.98
27.52
KOTAK INFRASTRUCTURE & ECONOMIC REFORM FUNDAn Open - Ended Equity Scheme
Issuer/Instrument Industry/Rating % to Net Assets
Issuer/Instrument Industry/Rating % to Net Assets
Investment Objective
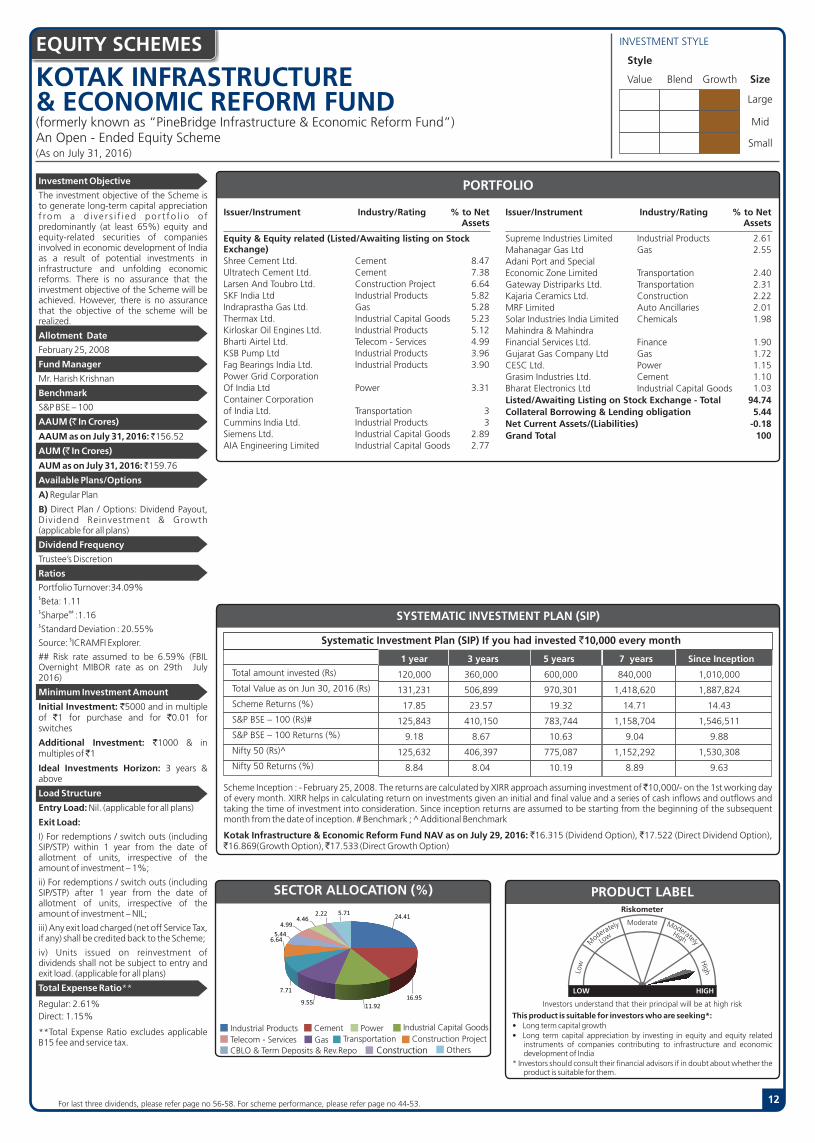
The investment objective of the Scheme is to generate long-term capital appreciation f rom a d i ve r s i f i ed po r t fo l i o o f predominantly (at least 65%) equity and equity-related securities of companies involved in economic development of India as a result of potential investments in infrastructure and unfolding economic reforms. There is no assurance that the investment objective of the Scheme will be achieved. However, there is no assurance that the objective of the scheme will be realized.
Allotment Date
February 25, 2008
Fund Manager
Mr. Harish Krishnan
Benchmark
S&P BSE � 100
AAUM (` In Crores)
AAUM as on July 31, 2016: ̀ 156.52
AUM (` In Crores)
AUM as on July 31, 2016: ̀ 159.76
Available Plans/Options
A) Regular Plan
B) Direct Plan / Options: Dividend Payout, Dividend Reinvestment & Growth (applicable for all plans)
Dividend Frequency
Trustee�s Discretion
Ratios
Portfolio Turnover:34.09%$Beta: 1.11$ ##Sharpe :1.16$Standard Deviation : 20.55%
$Source: ICRAMFI Explorer.
## Risk rate assumed to be 6.59% (FBIL Overnight MIBOR rate as on 29th July 2016)
Minimum Investment Amount
Initial Investment: `5000 and in multiple of `1 for purchase and for `0.01 for switches
Additional Investment: `1000 & in multiples of ̀ 1
Ideal Investments Horizon: 3 years & above
Load Structure
Entry Load: Nil. (applicable for all plans)
Exit Load:
I) For redemptions / switch outs (including SIP/STP) within 1 year from the date of allotment of units, irrespective of the amount of investment � 1%;
ii) For redemptions / switch outs (including SIP/STP) after 1 year from the date of allotment of units, irrespective of the amount of investment � NIL;
iii) Any exit load charged (net off Service Tax, if any) shall be credited back to the Scheme;
iv) Units issued on reinvestment of dividends shall not be subject to entry and exit load. (applicable for all plans)
Total Expense Ratio**
Regular: 2.61%Direct: 1.15%
**Total Expense Ratio excludes applicable B15 fee and service tax.
(formerly known as �PineBridge Infrastructure & Economic Reform Fund�)
EQUITY SCHEMES
12
Equity & Equity related (Listed/Awaiting listing on Stock Exchange) Shree Cement Ltd. Cement 8.47Ultratech Cement Ltd. Cement 7.38Larsen And Toubro Ltd. Construction Project 6.64SKF India Ltd Industrial Products 5.82Indraprastha Gas Ltd. Gas 5.28Thermax Ltd. Industrial Capital Goods 5.23Kirloskar Oil Engines Ltd. Industrial Products 5.12Bharti Airtel Ltd. Telecom - Services 4.99KSB Pump Ltd Industrial Products 3.96Fag Bearings India Ltd. Industrial Products 3.90Power Grid Corporation Of India Ltd Power 3.31Container Corporation of India Ltd. Transportation 3Cummins India Ltd. Industrial Products 3Siemens Ltd. Industrial Capital Goods 2.89AIA Engineering Limited Industrial Capital Goods 2.77
Supreme Industries Limited Industrial Products 2.61Mahanagar Gas Ltd Gas 2.55Adani Port and Special Economic Zone Limited Transportation 2.40Gateway Distriparks Ltd. Transportation 2.31Kajaria Ceramics Ltd. Construction 2.22MRF Limited Auto Ancillaries 2.01Solar Industries India Limited Chemicals 1.98Mahindra & Mahindra Financial Services Ltd. Finance 1.90Gujarat Gas Company Ltd Gas 1.72CESC Ltd. Power 1.15Grasim Industries Ltd. Cement 1.10Bharat Electronics Ltd Industrial Capital Goods 1.03Listed/Awaiting Listing on Stock Exchange - Total 94.74Collateral Borrowing & Lending obligation 5.44Net Current Assets/(Liabilities) -0.18Grand Total 100
PORTFOLIO
SYSTEMATIC INVESTMENT PLAN (SIP)
Scheme Inception : - February 25, 2008. The returns are calculated by XIRR approach assuming investment of 10,000/- on the 1st working day `of every month. XIRR helps in calculating return on investments given an initial and final value and a series of cash inflows and outflows and taking the time of investment into consideration. Since inception returns are assumed to be starting from the beginning of the subsequent month from the date of inception. # Benchmark ; ̂ Additional Benchmark
Kotak Infrastructure & Economic Reform Fund NAV as on July 29, 2016: ̀ 16.315 (Dividend Option), ̀ 17.522 (Direct Dividend Option), `16.869(Growth Option), ̀ 17.533 (Direct Growth Option)
This product is suitable for investors who are seeking*:� Long term capital growth� Long term capital appreciation by investing in equity and equity related
instruments of companies contributing to infrastructure and economic development of India
* Investors should consult their financial advisors if in doubt about whether the product is suitable for them.
PRODUCT LABEL
Investors understand that their principal will be at high risk
Riskometer
yletaredo
M
Moderate
Low
High
Low
High
LOW HIGH
Moderately
INVESTMENT STYLE
Value Blend Growth Size
Large
Mid
Small
Style
SECTOR ALLOCATION (%)
Industrial Products Cement Power Industrial Capital GoodsTelecom - Services Gas TransportationCBLO & Term Deposits & Rev.Repo Construction
Construction ProjectOthers
32.53
14.699.36
7.53
7.09
7.03
4.814.04
5.93
29.12
14.3
10.617.49
6.94
6.9
5.644.3
7.78
For last three dividends, please refer page no 56-58. For scheme performance, please refer page no 44-53.
Total amount invested (Rs)
Total Value as on Jun 30, 2016 (Rs)
Scheme Returns (%)
S&P BSE � 100 (Rs)#
S&P BSE � 100 Returns (%)
Nifty 50 (Rs)^
Nifty 50 Returns (%)
Systematic Investment Plan (SIP) If you had invested `10,000 every month
(As on July 31, 2016)
29.24
14.51
12.228.37
7.78
6.34
6.264.36
5.62
1 year 3 years 5 years 7 years Since Inception
120,000 360,000 600,000 840,000 1,010,000
131,231 506,899 970,301 1,418,620 1,887,824
17.85 23.57 19.32 14.71 14.43
125,843 410,150 783,744 1,158,704 1,546,511
9.18 8.67 10.63 9.04 9.88
125,632 406,397 775,087 1,152,292 1,530,308
8.84 8.04 10.19 8.89 9.63
24.41
16.9511.92
9.55
7.71
6.645.44
4.994.46
2.22 5.71

KOTAK BALANCEAn Open - Ended Balanced Scheme
Investment Objective
To achieve growth by investing in equity & equity related instruments, balanced with income generation by investing in debt &money market instruments. However, there is no assurance that the objective of the scheme will be realized.
Allotment Date
November 25, 1999
Fund Managers
Mr. Pankaj Tibrewal and Mr. Abhishek Bisen*
Benchmark
Crisil Balanced Fund
AAUM (` In Crores)
AAUM as on July 31, 2016: ̀ 318.84
AUM (` In Crores)
AUM as on July 31, 2016: ̀ 340.12
Available Plans/Options
A) Regular Plan
B) Direct Plan / Options: Dividend Payout, Dividend Reinvestment & Growth (applicable for all plans)
Dividend Frequency
Half Yearly (25th of Mar/Sep)
Ratios
Portfolio Turnover: 48.43% $Beta: 1.05$ ##Sharpe : 0.84$Standard Deviation : 11.44%
$Source: ICRA MFI Explorer.
## Risk rate assumed to be 6.59% (FBIL Overnight MIBOR rate as on 29th July 2016)
Minimum Investment Amount
Initial Investment: `5000 and in multiple of `1 for purchase and for `0.01 for switches
Additional Investment: `1000 & in multiples of ̀ 1
Ideal Investments Horizon: 3 years & above
Load Structure
Entry Load: Nil. (applicable for all plans)
Exit Load:
I) For redemptions / switch outs (including SIP/STP) within 1 year from the date of allotment of units, irrespective of the amount of investment:1%
ii) For redemptions / switch outs (including SIP/STP) after 1 year from the date of allotment of units, irrespective of the amount of investment: NIL
iii) Any exit load charged (net off Service Tax, if any) shall be credited back to the respective Scheme. (applicable for all plans)
iv) Units issued on reinvestment of dividends shall not be subject to exit load (applicable for all plans)
Total Expense Ratio**
Regular: 2.53%Direct: 1.27%
**Total Expense Ratio excludes applicable B15 fee and service tax.
EQUITY SCHEMES INVESTMENT STYLE
Short Medium Long Volatility
Low
Medium
High
Maturity
Value Blend Growth Size
Large
Mid
Small
Style
Issuer/Instrument Industry/Rating % to Net AssetsEquity & Equity related (Listed/Awaiting listing on Stock Exchange) HDFC Bank Ltd. Banks 3.81ICICI Bank Ltd. Banks 3.42Infosys Ltd. Software 2.93IndusInd Bank Ltd. Banks 2.36Maruti Suzuki India Limited Auto 2.32Larsen And Toubro Ltd. Construction Project 2.26Reliance Industries Ltd. Petroleum Products 2.11Tata Motors Ltd. Auto 1.88Axis Bank Ltd Banks 1.73State Bank Of India Banks 1.67DB Corp Limited Media and Entertainment 1.66ITC Ltd. Consumer Non Durables 1.65Fag Bearings India Ltd. Industrial Products 1.54Finolex Cables Ltd. Industrial Products 1.53Whirlpool of India Ltd. Consumer Durables 1.52SRF Ltd. Textile Products 1.42JK Cement Ltd. Cement 1.37Mahindra & Mahindra Ltd. Auto 1.33HDFC Ltd. Finance 1.32Solar Industries India Limited Chemicals 1.32Hindustan Petroleum Corporation Ltd Petroleum Products 1.28Ultratech Cement Ltd. Cement 1.24The Ramco Cements Ltd Cement 1.22Tata Consultancy Services Ltd. Software 1.08Va Tech Wabag Limited Engineering Services 1.05Atul Ltd. Chemicals 1.02Engineers India Ltd. Construction Project 1Motherson Sumi Systems Ltd. Auto Ancillaries 0.97Zee Entertainment Enterprises Ltd Media and Entertainment 0.95Carborundum Universal Ltd. Industrial Products 0.94HCL Technologies Ltd. Software 0.94Cipla Ltd. Pharmaceuticals 0.93Thermax Ltd. Industrial Capital Goods 0.84Ramkrishna Forgings Ltd. Industrial Products 0.79Strides Shasun Ltd. Pharmaceuticals 0.76Adani Port and Special Economic Zone Limited Transportation 0.75Jubilant Foodworks Limited Consumer Non Durables 0.72Equitas Holdings Ltd Finance 0.71UPL Ltd Pesticides 0.68Oil & Natural Gas Corporation Ltd. Oil 0.66Havells India Ltd. Consumer Durables 0.63Navkar Corporation Limited Transportation 0.63
Issuer/Instrument Industry/Rating % to Net Assets
PORTFOLIO
Pennar Engineered Building Systems Limited Ferrous Metals 0.62HDFC Ltd. Warrants Finance 0.58Voltas Ltd. Construction Project 0.58Bharat Forge Ltd. Industrial Products 0.54Coal India Ltd. Minerals/Mining 0.53Colgate Palmolive (India ) Ltd. Consumer Non Durables 0.50Kirloskar Oil Engines Ltd. Industrial Products 0.50Bank Of Baroda Banks 0.49Federal Bank Ltd. Banks 0.48Balrampur Chini Mills Ltd Consumer Non Durables 0.45Lupin Ltd. Pharmaceuticals 0.41Mahindra & Mahindra Financial Services Ltd. Finance 0.39Arvind Ltd Textile Products 0.36IDFC Bank Limited Banks 0.34Larsen & Toubro Infotech Ltd Software 0.24Persistent Systems Limited Software 0.20Divi s Laboratories Limited Pharmaceuticals 0.17Mahanagar Gas Ltd Gas 0.15Advanced Enzyme Technologies Ltd Healthcare Services 0.13The Indian Hotels Company Ltd. Hotels 0.05Listed/Awaiting Listing on Stock Exchange - Total 66.65Debt Instruments Debentures and Bonds Corporate Debt/Financial Institutions LIC Housing Finance Ltd. CRISIL AAA 0.15Tata Sons Ltd. CRISIL AAA 0.06Corporate Debt/Financial Institutions - Total 0.21Public Sector Undertakings Bank of India CRISIL A+ 2.99Public Sector Undertakings - Total 2.99Government Dated Securities 7.61% Central Government SOV 4.567.59% Central Government SOV 2.428.33% State Government SOV 1.528.19% State Government SOV1.518.29% State Government SOV 1.517.35% Central Government SOV 0.03Government Dated Securities - Total 11.55Collateral Borrowing & Lending obligation 18.21Net Current Assets/(Liabilities) 0.39Grand Total 100
This product is suitable for investors who are seeking*:� Long term capital growth� Investment in equity & equity related securities balanced with income generation
by investing in debt & money market instruments* Investors should consult their financial advisors if in doubt about whether the product is suitable for them.
PRODUCT LABEL
Investors understand that their principal will be at moderately high risk
Riskometer
yletaredo
M
Moderate
Low
High
Low
High
LOW HIGH
Moderately
SECTOR ALLOCATION (%)
Government Dated Securities Industrial Products
BanksSoftware
Petroleum Products Consumer Non DurablesAuto
CementConstruction Project
Others
23.73
15.88
10.227.086.73
6.27
5.33
5.13
11.1630.67
15.42
9.666.61
5.715
4.84.77
9.31
For last three dividends, please refer page no 56-58. For scheme performance, please refer page no 44-53 * For Fund Manager experience, please refer page 54-55.
SYSTEMATIC INVESTMENT PLAN (SIP)
Scheme Inception : - November 25,1999. The returns are calculated by XIRR approach assuming investment of 10,000/- on the 1st working `day of every month. XIRR helps in calculating return on investments given an initial and final value and a series of cash inflows and outflows and taking the time of investment into consideration. Since inception returns are assumed to be starting from the beginning of the subsequent month from the date of inception. # Benchmark ; ̂ Additional BenchmarkKotak Balance NAV as on July 29, 2016: ̀ 15.845 (Dividend Option), ̀ 16.660 (Direct Dividend Option), ̀ 20.377 (Growth Option) ̀ 21.189 (Direct Growth Option)
13
20.7
14.6
9.439.08
6.025.18
4.96
4.72
18.38
Total amount invested (Rs)
Total Value as on Jun 30, 2016 (Rs)
Scheme Returns (%)
Crisil Balanced Fund Index (Rs)#
Crisil Balanced Fund Index Returns (%)
Nifty 50 (Rs)^
Nifty 50 Returns (%)
1 year 3 years 5 years 7 years 10 years Since Inception
120,000 360,000 600,000 840,000 1,200,000 2,000,000
124,338 405,915 769,930 1,166,840 1,952,577 7,480,228
6.79 7.96 9.92 9.24 9.41 14.31
125,965 412,549 774,899 1,163,296 1,930,371 NA
9.37 9.06 10.18 9.15 9.19 NA
125,632 406,397 775,087 1,152,292 1,912,086 6,604,873
8.84 8.04 10.19 8.89 9.01 13.04
Systematic Investment Plan (SIP) If you had invested `10,000 every month
(As on July 31, 2016)
CBLO & Term Deposits & Rev.Repo
18.21
14.30
11.55
5.845.535.39
3.84
3.83
3.39
3.32
24.80
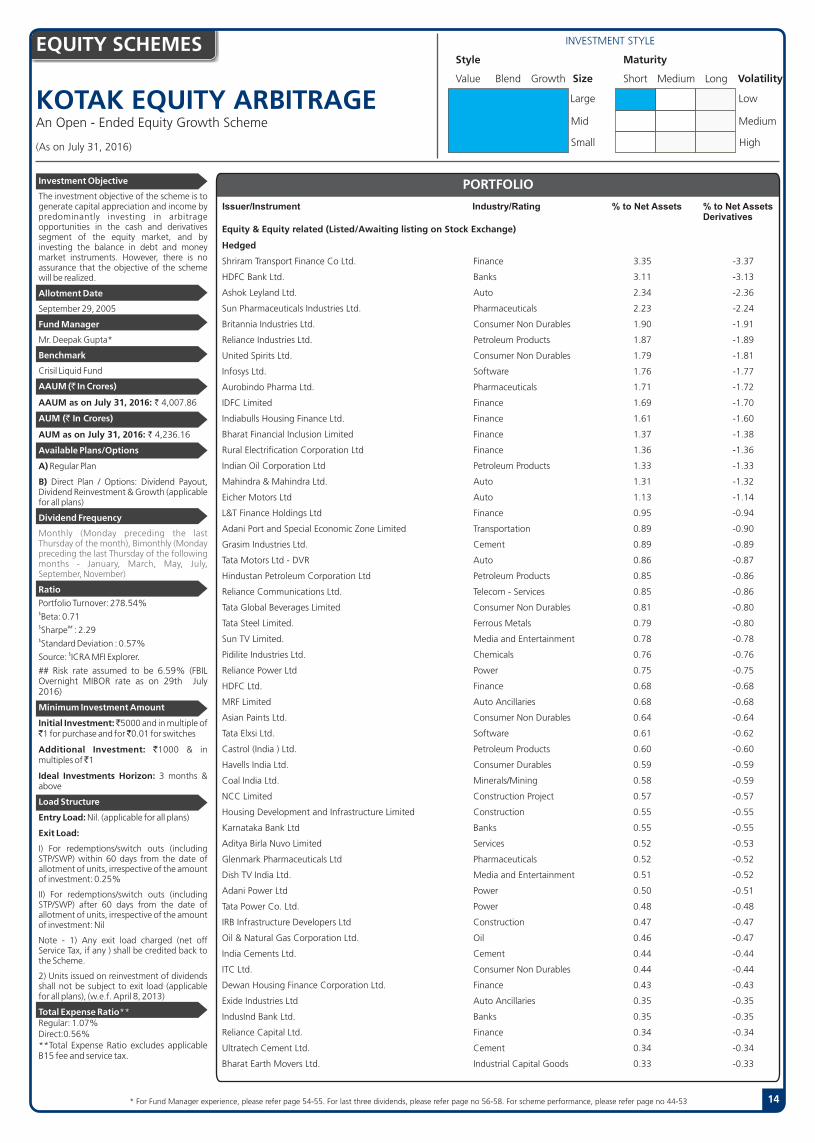
KOTAK EQUITY ARBITRAGEAn Open - Ended Equity Growth Scheme
EQUITY SCHEMES
14
INVESTMENT STYLE
Short Medium Long Volatility
Low
Medium
High
Maturity
Value Blend Growth Size
Large
Mid
Small
Style
Investment Objective
The investment objective of the scheme is to generate capital appreciation and income by predominantly investing in arbitrage opportunities in the cash and derivatives segment of the equity market, and by investing the balance in debt and money market instruments. However, there is no assurance that the objective of the scheme will be realized.
Allotment Date
September 29, 2005
Fund Manager
Mr. Deepak Gupta*
Benchmark
Crisil Liquid Fund
AAUM (` In Crores)
AAUM as on July 31, 2016: ` 4,007.86
AUM (` In Crores)
AUM as on July 31, 2016: ` 4,236.16
Available Plans/Options
A) Regular Plan
B) Direct Plan / Options: Dividend Payout, Dividend Reinvestment & Growth (applicable for all plans)
Dividend Frequency
Monthly (Monday preceding the last Thursday of the month), Bimonthly (Monday preceding the last Thursday of the following months - January, March, May, July, September, November)
Ratio
Portfolio Turnover: 278.54% $Beta: 0.71$ ##Sharpe : 2.29$Standard Deviation : 0.57%
$Source: ICRA MFI Explorer.
## Risk rate assumed to be 6.59% (FBIL Overnight MIBOR rate as on 29th July 2016)
Minimum Investment Amount
Initial Investment: ̀ 5000 and in multiple of `1 for purchase and for ̀ 0.01 for switches
Additional Investment: `1000 & in multiples of ̀ 1
Ideal Investments Horizon: 3 months & above
Load Structure
Entry Load: Nil. (applicable for all plans)
Exit Load:
I) For redemptions/switch outs (including STP/SWP) within 60 days from the date of allotment of units, irrespective of the amount of investment: 0.25%
II) For redemptions/switch outs (including STP/SWP) after 60 days from the date of allotment of units, irrespective of the amount of investment: Nil
Note - 1) Any exit load charged (net off Service Tax, if any ) shall be credited back to the Scheme.
2) Units issued on reinvestment of dividends shall not be subject to exit load (applicable for all plans), (w.e.f. April 8, 2013)
Total Expense Ratio**Regular: 1.07%Direct:0.56%**Total Expense Ratio excludes applicable B15 fee and service tax.
PORTFOLIO
Issuer/Instrument Industry/Rating % to Net Assets % to Net Assets Derivatives
Equity & Equity related (Listed/Awaiting listing on Stock Exchange)
Hedged
Shriram Transport Finance Co Ltd. Finance 3.35 -3.37
HDFC Bank Ltd. Banks 3.11 -3.13
Ashok Leyland Ltd. Auto 2.34 -2.36
Sun Pharmaceuticals Industries Ltd. Pharmaceuticals 2.23 -2.24
Britannia Industries Ltd. Consumer Non Durables 1.90 -1.91
Reliance Industries Ltd. Petroleum Products 1.87 -1.89
United Spirits Ltd. Consumer Non Durables 1.79 -1.81
Infosys Ltd. Software 1.76 -1.77
Aurobindo Pharma Ltd. Pharmaceuticals 1.71 -1.72
IDFC Limited Finance 1.69 -1.70
Indiabulls Housing Finance Ltd. Finance 1.61 -1.60
Bharat Financial Inclusion Limited Finance 1.37 -1.38
Rural Electrification Corporation Ltd Finance 1.36 -1.36
Indian Oil Corporation Ltd Petroleum Products 1.33 -1.33
Mahindra & Mahindra Ltd. Auto 1.31 -1.32
Eicher Motors Ltd Auto 1.13 -1.14
L&T Finance Holdings Ltd Finance 0.95 -0.94
Adani Port and Special Economic Zone Limited Transportation 0.89 -0.90
Grasim Industries Ltd. Cement 0.89 -0.89
Tata Motors Ltd - DVR Auto 0.86 -0.87
Hindustan Petroleum Corporation Ltd Petroleum Products 0.85 -0.86
Reliance Communications Ltd. Telecom - Services 0.85 -0.86
Tata Global Beverages Limited Consumer Non Durables 0.81 -0.80
Tata Steel Limited. Ferrous Metals 0.79 -0.80
Sun TV Limited. Media and Entertainment 0.78 -0.78
Pidilite Industries Ltd. Chemicals 0.76 -0.76
Reliance Power Ltd Power 0.75 -0.75
HDFC Ltd. Finance 0.68 -0.68
MRF Limited Auto Ancillaries 0.68 -0.68
Asian Paints Ltd. Consumer Non Durables 0.64 -0.64
Tata Elxsi Ltd. Software 0.61 -0.62
Castrol (India ) Ltd. Petroleum Products 0.60 -0.60
Havells India Ltd. Consumer Durables 0.59 -0.59
Coal India Ltd. Minerals/Mining 0.58 -0.59
NCC Limited Construction Project 0.57 -0.57
Housing Development and Infrastructure Limited Construction 0.55 -0.55
Karnataka Bank Ltd Banks 0.55 -0.55
Aditya Birla Nuvo Limited Services 0.52 -0.53
Glenmark Pharmaceuticals Ltd Pharmaceuticals 0.52 -0.52
Dish TV India Ltd. Media and Entertainment 0.51 -0.52
Adani Power Ltd Power 0.50 -0.51
Tata Power Co. Ltd. Power 0.48 -0.48
IRB Infrastructure Developers Ltd Construction 0.47 -0.47
Oil & Natural Gas Corporation Ltd. Oil 0.46 -0.47
India Cements Ltd. Cement 0.44 -0.44
ITC Ltd. Consumer Non Durables 0.44 -0.44
Dewan Housing Finance Corporation Ltd. Finance 0.43 -0.43
Exide Industries Ltd Auto Ancillaries 0.35 -0.35
IndusInd Bank Ltd. Banks 0.35 -0.35
Reliance Capital Ltd. Finance 0.34 -0.34
Ultratech Cement Ltd. Cement 0.34 -0.34
Bharat Earth Movers Ltd. Industrial Capital Goods 0.33 -0.33
* For Fund Manager experience, please refer page 54-55. For last three dividends, please refer page no 56-58. For scheme performance, please refer page no 44-53
(As on July 31, 2016)
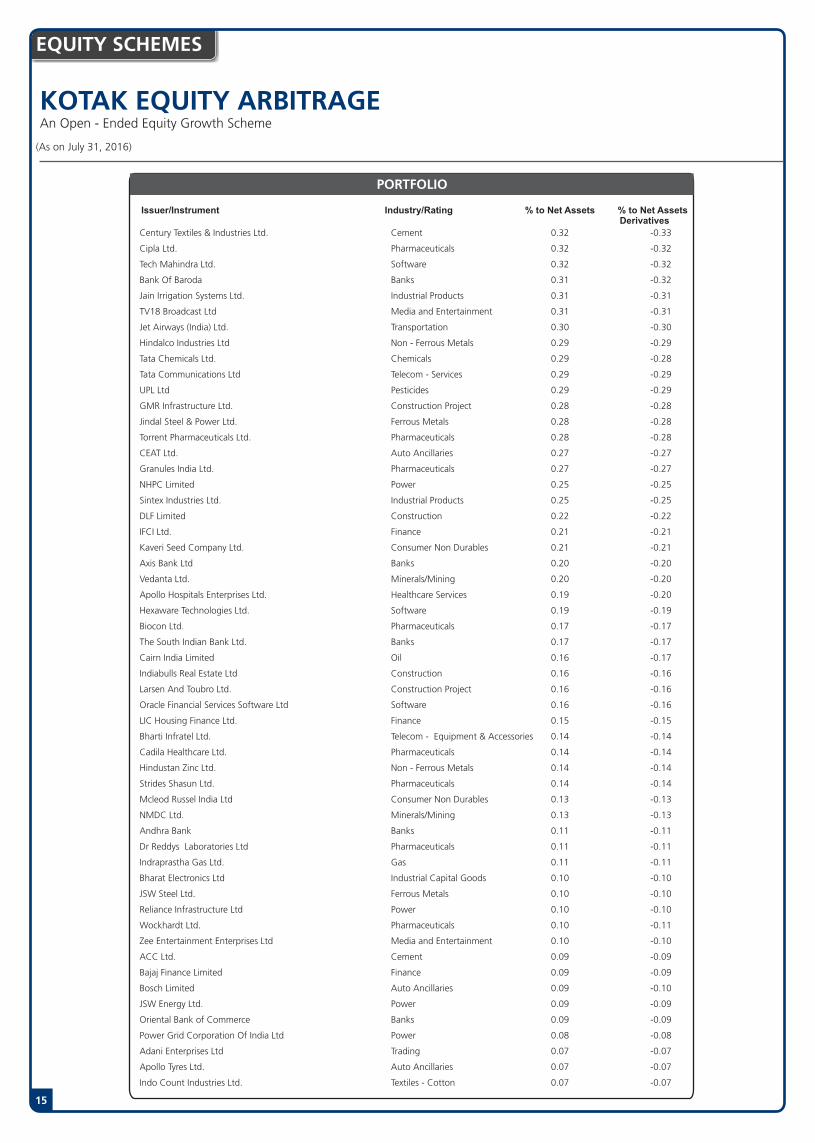
KOTAK EQUITY ARBITRAGE
EQUITY SCHEMES
15
An Open - Ended Equity Growth Scheme
PORTFOLIO
Issuer/Instrument Industry/Rating % to Net Assets % to Net Assets Derivatives
Century Textiles & Industries Ltd. Cement 0.32 -0.33
Cipla Ltd. Pharmaceuticals 0.32 -0.32
Tech Mahindra Ltd. Software 0.32 -0.32
Bank Of Baroda Banks 0.31 -0.32
Jain Irrigation Systems Ltd. Industrial Products 0.31 -0.31
TV18 Broadcast Ltd Media and Entertainment 0.31 -0.31
Jet Airways (India) Ltd. Transportation 0.30 -0.30
Hindalco Industries Ltd Non - Ferrous Metals 0.29 -0.29
Tata Chemicals Ltd. Chemicals 0.29 -0.28
Tata Communications Ltd Telecom - Services 0.29 -0.29
UPL Ltd Pesticides 0.29 -0.29
GMR Infrastructure Ltd. Construction Project 0.28 -0.28
Jindal Steel & Power Ltd. Ferrous Metals 0.28 -0.28
Torrent Pharmaceuticals Ltd. Pharmaceuticals 0.28 -0.28
CEAT Ltd. Auto Ancillaries 0.27 -0.27
Granules India Ltd. Pharmaceuticals 0.27 -0.27
NHPC Limited Power 0.25 -0.25
Sintex Industries Ltd. Industrial Products 0.25 -0.25
DLF Limited Construction 0.22 -0.22
IFCI Ltd. Finance 0.21 -0.21
Kaveri Seed Company Ltd. Consumer Non Durables 0.21 -0.21
Axis Bank Ltd Banks 0.20 -0.20
Vedanta Ltd. Minerals/Mining 0.20 -0.20
Apollo Hospitals Enterprises Ltd. Healthcare Services 0.19 -0.20
Hexaware Technologies Ltd. Software 0.19 -0.19
Biocon Ltd. Pharmaceuticals 0.17 -0.17
The South Indian Bank Ltd. Banks 0.17 -0.17
Cairn India Limited Oil 0.16 -0.17
Indiabulls Real Estate Ltd Construction 0.16 -0.16
Larsen And Toubro Ltd. Construction Project 0.16 -0.16
Oracle Financial Services Software Ltd Software 0.16 -0.16
LIC Housing Finance Ltd. Finance 0.15 -0.15
Bharti Infratel Ltd. Telecom - Equipment & Accessories 0.14 -0.14
Cadila Healthcare Ltd. Pharmaceuticals 0.14 -0.14
Hindustan Zinc Ltd. Non - Ferrous Metals 0.14 -0.14
Strides Shasun Ltd. Pharmaceuticals 0.14 -0.14
Mcleod Russel India Ltd Consumer Non Durables 0.13 -0.13
NMDC Ltd. Minerals/Mining 0.13 -0.13
Andhra Bank Banks 0.11 -0.11
Dr Reddys Laboratories Ltd Pharmaceuticals 0.11 -0.11
Indraprastha Gas Ltd. Gas 0.11 -0.11
Bharat Electronics Ltd Industrial Capital Goods 0.10 -0.10
JSW Steel Ltd. Ferrous Metals 0.10 -0.10
Reliance Infrastructure Ltd Power 0.10 -0.10
Wockhardt Ltd. Pharmaceuticals 0.10 -0.11
Zee Entertainment Enterprises Ltd Media and Entertainment 0.10 -0.10
ACC Ltd. Cement 0.09 -0.09
Bajaj Finance Limited Finance 0.09 -0.09
Bosch Limited Auto Ancillaries 0.09 -0.10
JSW Energy Ltd. Power 0.09 -0.09
Oriental Bank of Commerce Banks 0.09 -0.09
Power Grid Corporation Of India Ltd Power 0.08 -0.08
Adani Enterprises Ltd Trading 0.07 -0.07
Apollo Tyres Ltd. Auto Ancillaries 0.07 -0.07
Indo Count Industries Ltd. Textiles - Cotton 0.07 -0.07
(As on July 31, 2016)

KOTAK EQUITY ARBITRAGE
EQUITY SCHEMES
16
An Open - Ended Equity Growth Scheme
Notes:Term Deposit as provided above is towards margin for derivatives transactions
Kotak Equity Arbitrage NAV as on July 29, 2016: `10.7379 (Dividend Option), `10.8788 (Direct Dividend Option), `22.4841 (Growth Option), ̀ 22.8884 (Direct Growth Option), ̀ 19.9519 (Bimonthly Option), ̀ 20.1429 (Direct Bimonthly Option)
This product is suitable for investors who are seeking*:� Income from arbitrage opportunities in the equity market� Investment in arbitrage opportunities in the cash & derivatives segment of
the equity market.* Investors should consult their financial advisors if in doubt about whether the product is suitable for them.
PRODUCT LABEL
Investors understand that their principal will be at moderately low risk
Riskometer
yletaredo
M
Moderate
Low
High
Low
High
LOW HIGH
Moderately
PORTFOLIO
Issuer/Instrument Industry/Rating % to Net Assets % to Net Assets Derivatives
KPIT Technologies LImited Software 0.07 -0.07MindTree Ltd. Software 0.07 -0.07Ajanta Pharma Ltd. Pharmaceuticals 0.06 -0.06Siemens Ltd. Industrial Capital Goods 0.06 -0.06Jaiprakash Associates Ltd Construction 0.05 -0.05Mahindra & Mahindra Financial Services Ltd. Finance 0.05 -0.05National Thermal Power Corporation Limited Power 0.05 -0.05Crompton Greaves Ltd. Industrial Capital Goods 0.04 -0.04GAIL (India) Ltd. Gas 0.04 -0.04Hindustan Unilever Ltd. Consumer Non Durables 0.04 -0.04ICICI Bank Ltd. Banks 0.04 -0.04Tata Motors Ltd. Auto 0.04 -0.04United Breweries Ltd. Consumer Non Durables 0.04 -0.04Godrej Industries Ltd Consumer Non Durables 0.03 -0.03Kotak Mahindra Bank Ltd. Banks 0.03 -0.03NIIT Technologies Ltd Software 0.03 -0.03Oil India Limited Oil 0.03 -0.03Union Bank Of India Banks 0.03 -0.03Bajaj Auto Ltd. Auto 0.02 -0.02PTC India Ltd. Power 0.02 -0.02Amara Raja Batteries Ltd. Auto Ancillaries 0.01 -0.01CESC Ltd. Power 0.01 -0.01Container Corporation of India Ltd. Transportation 0.01 -0.01Dabur India Ltd Consumer Non Durables 0.01 -0.01Godrej Consumer Products Ltd. Consumer Non Durables 0.01 -0.01HCL Technologies Ltd. Software 0.01 -0.01Lupin Ltd. Pharmaceuticals 0.01 -0.01Marico Ltd. Consumer Non Durables 0.01 -0.01SRF Ltd. Textile Products 0.01 -0.01Voltas Ltd. Construction Project 0.01 -0.01Wipro Ltd. Software 0.01 -0.01Hedged - Total 62.69 -63Listed/Awaiting Listing on Stock Exchange - Total 62.69 -63Mutual Fund Units Kotak Floater Short Term Direct Growth Mutual Fund Units 9.61 Kotak Liquid Plan A Mutual Fund Units 1.67 Mutual Fund Units - Total 11.28 Debt Instruments Debentures and Bonds Corporate Debt/Financial Institutions Mahindra & Mahindra Financial Services Ltd. FITCH IND AAA 3.55 Kotak Mahindra Prime Ltd. 0.59 Corporate Debt/Financial Institutions - Total 4.14 Money Market Instruments Commercial Paper(CP)/Certificate of Deposits(CD) Corporate Debt/Financial Institutions Gruh Finance Ltd ICRA A1+ 4.67 Corporate Debt/Financial Institutions - Total 4.67 TERM DEPOSITS Kotak Mahindra Bank Ltd. 9.28 Ratnakar Bank Ltd 1.41IndusInd Bank Ltd. 1.00 Term Deposits - Total 11.69 Collateral Borrowing & Lending obligation 2.53 Net Current Assets/(Liabilities) 3.00 Grand Total 100
SECTOR ALLOCATION (%)
CBLO & Term Deposits & Rev.Repo
Banks Pharmaceuticals Finance
Auto
Petroleum ProductsMutual Fund Units Consumer Non Durables
Commercial Paper (CP)/Certificate of Deposits (CD)
Others
16.87
15.28
11.41
8.417.735.78
5.34
4.554.53.15
16.98 19.45
10.45
8.68
7.076.515.42
3.203.00
30.3619.07
16.52
9.036.976.91
6.80
6.26
4.173.002.94
18.33
(As on July 31, 2016)
Debentures and Bonds
14.22
12.28
11.28
6.06
6.065.704.994.67
4.65
4.14
25.95

KOTAK EQUITY SAVINGS FUNDAn Open Ended Equity Fund
Investment Objective
The investment objective of the scheme is to generate capital appreciation and income by predominantly investing in arbitrage opportunities in the cash and derivatives segment of the equity market, and enhance returns with a moderate exposure in equity & equity related instruments. There is no assurance or guarantee that the investment objective of the scheme will be achieved. However, there is no assurance that the objective of the scheme will be realized.
Allotment Date
October 13, 2014
Fund Managers
Mr. Deepak Gupta & Mr. Abhishek Bisen*
Benchmark
75% of Crisil Liquid Fund & 25% in Nifty 50
AAUM (` In Crores)
AAUM as on July 31, 2016: ̀ 843.01
AUM (` In Crores)
AUM as on July 31, 2016: ̀ 849.93
Available Plans/Options
A) Regular Plan
B) Direct Plan / Options: Dividend Payout, Dividend Reinvestment & Growth (applicable for all plans)
Dividend Frequency
Monthly (12th of every month) Quarterly (20th of March, June, September and December of every year)
RatiosPortfolio Turnover: 172.99%
Minimum Investment AmountInitial Investment: `5000 and in multiple of `1 for purchase and for `0.01 for switchesAdditional Investment: `1000 & in multiples of `1 for purchase and for `0.01 for switchesIdeal Investments Horizon: 3 years & above
Load Structure
Entry Load: Nil.
Exit Load:I) For redemption / switch out of upto 10% of the initial investment amount (limit) purchased or switched in within 1 year from the date of allotment: Nil. ii) If units redeemed or switched out are in excess of the limit within 1 year from the date of allotment: 1%.iii) If units are redeemed or switched out on or after 1 year from the date of allotment: Nil.iv) Any exit load charged (net off Service Tax, if any) shall be credited back to the respective Scheme. Units issued on reinvestment of dividends shall not be subject to entry and exit load.
Total Expense Ratio**
Regular: 1.55%Direct: 0.91%
**Total Expense Ratio excludes applicable B15 fee and service tax.
EQUITY SCHEMES
17
INVESTMENT STYLE
Short Medium Long Volatility
Low
Medium
High
Maturity
Value Blend Growth Size
Large
Mid
Small
Style
Issuer/Instrument Industry/Rating % to Net Assets % to Net Assets - Derivatives
PORTFOLIO
Equity & Equity related (Listed/Awaiting listing on Stock Exchange) Non-Hedge HCL Technologies Ltd. Software -0.05HDFC Bank Ltd. Banks 1.58 Infosys Ltd. Software 1.49 Reliance Industries Ltd. Petroleum Products 1.30 ITC Ltd. Consumer Non Durables 1.19 Bharat Petroleum Corporation Ltd. Petroleum Products 1.16 Grasim Industries Ltd. Cement 1.16 IndusInd Bank Ltd. Banks 1.01 HDFC Ltd. Warrants Finance 0.95 Asian Paints Ltd. Consumer Non Durables 0.94 Hero MotoCorp Ltd. Auto 0.94 Zee Entertainment Enterprises Ltd Media and Entertainment 0.87 Bajaj Auto Ltd. Auto 0.82 Ultratech Cement Ltd. Cement 0.76 Bajaj Finance Limited Finance 0.69 Tata Motors Ltd. Auto 0.66 Hindustan Unilever Ltd. Consumer Non Durables 0.61 Maruti Suzuki India Limited Auto 0.52 Lupin Ltd. Pharmaceuticals 0.51 Yes Bank Ltd Banks 0.51 Eicher Motors Ltd Auto 0.44 Petronet LNG Ltd. Gas 0.41 ICICI Bank Ltd. Banks 0.40 Power Grid Corporation Of India Ltd Power 0.40 Axis Bank Ltd Banks 0.39 Larsen And Toubro Ltd. Construction Project 0.39 Wipro Ltd. Software 0.33 Equitas Holdings Ltd Finance 0.32 National Thermal Power Corporation Limited Power 0.31 Tata Steel Limited. Ferrous Metals 0.27 Geometric Software Solutions Co Ltd Software 0.24 GAIL (India) Ltd. Gas 0.23 Tata Consultancy Services Ltd. Software 0.22 Tech Mahindra Ltd. Software 0.22 HDFC Ltd. Finance 0.20 Britannia Industries Ltd. Consumer Non Durables 0.19 Mahindra & Mahindra Ltd. Auto 0.19 Bharti Airtel Ltd. Telecom - Services 0.18 Alkem Laboratories Ltd Pharmaceuticals 0.16 JSW Steel Ltd. Ferrous Metals 0.16 Ashok Leyland Ltd. Auto 0.15 Advanced Enzyme Technologies Ltd Healthcare Services 0.14 Ambuja Cements Ltd Cement 0.14 Aurobindo Pharma Ltd. Pharmaceuticals 0.14 Marico Ltd. Consumer Non Durables 0.14 Bosch Limited Auto Ancillaries 0.13 Divi s Laboratories Limited Pharmaceuticals 0.12 ACC Ltd. Cement 0.11 CNX NIFTY - 8000.000 - Call Option - December 2016 0.10 Pidilite Industries Ltd. Chemicals 0.10 Hindalco Industries Ltd Non - Ferrous Metals 0.08 Shriram Transport Finance Co Ltd. Finance 0.06 Ujjivan Financial Services Ltd Finance 0.06 Chennai Super Kings Cricket Ltd. Media and Entertainment 0.02 Bharti Infratel Ltd. Telecom - Equipment & Accessories 0.01 Non-Hedged- Total 24.82 -0.05Hedged GMR Infrastructure Ltd. Construction Project 3.65 -3.67Karnataka Bank Ltd Banks 2.25 -2.25Infosys Ltd. Software 2.19 -2.19Aurobindo Pharma Ltd. Pharmaceuticals 1.81 -1.81Axis Bank Ltd Banks 1.72 -1.72HDFC Bank Ltd. Banks 1.61 -1.61IDFC Limited Finance 1.44 -1.45Dish TV India Ltd. Media and Entertainment 1.36 -1.37Housing Development and Infrastructure Limited Construction 1.03 -1.04Wockhardt Ltd. Pharmaceuticals 0.95 -0.95Jet Airways (India) Ltd. Transportation 0.93 -0.93Indiabulls Housing Finance Ltd. Finance 0.87 -0.87Reliance Communications Ltd. Telecom - Services 0.80 -0.80Sun Pharmaceuticals Industries Ltd. Pharmaceuticals 0.80 -0.81Tata Communications Ltd Telecom - Services 0.80 -0.80Ashok Leyland Ltd. Auto 0.78 -0.78Bharat Financial Inclusion Limited Finance 0.76 -0.76India Cements Ltd. Cement 0.74 -0.74L&T Finance Holdings Ltd Finance 0.73 -0.73Jain Irrigation Systems Ltd. Industrial Products 0.71 -0.72Century Textiles & Industries Ltd. Cement 0.68 -0.68Havells India Ltd. Consumer Durables 0.62 -0.63HDFC Ltd. Finance 0.60 -0.60IRB Infrastructure Developers Ltd Construction 0.53 -0.54Tata Steel Limited. Ferrous Metals 0.53 -0.53NCC Limited Construction Project 0.52 -0.51Reliance Power Ltd Power 0.48 -0.48MRF Limited Auto Ancillaries 0.47 -0.47Maruti Suzuki India Limited Auto 0.46 -0.46Rural Electrification Corporation Ltd Finance 0.46 -0.47Shriram Transport Finance Co Ltd. Finance 0.46 -0.46Glenmark Pharmaceuticals Ltd Pharmaceuticals 0.40 -0.41Sun TV Limited. Media and Entertainment 0.40 -0.40IFCI Ltd. Finance 0.38 -0.38Mahindra & Mahindra Ltd. Auto 0.37 -0.37Indian Oil Corporation Ltd Petroleum Products 0.36 -0.36UPL Ltd Pesticides 0.36 -0.36Dewan Housing Finance Corporation Ltd. Finance 0.35 -0.35Adani Port and Special Economic Zone Limited Transportation 0.34 -0.34Pidilite Industries Ltd. Chemicals 0.33 -0.33Tech Mahindra Ltd. Software 0.33 -0.33
* For Fund Manager experience, please refer page 54-55. For last three dividends, please refer page no 56-58. For scheme performance, please refer page no 44-53
(As on July 31, 2016)

EQUITY SCHEMES
18
KOTAK EQUITY SAVINGS FUNDAn Open Ended Equity Fund
Issuer/Instrument Industry/Rating % to Net Assets % to Net Assets - Derivatives
PORTFOLIO
Asian Paints Ltd. Consumer Non Durables 0.32 -0.32Reliance Industries Ltd. Petroleum Products 0.29 -0.29DLF Limited Construction 0.26 -0.26Larsen And Toubro Ltd. Construction Project 0.26 -0.26Indiabulls Real Estate Ltd Construction 0.25 -0.25Reliance Capital Ltd. Finance 0.25 -0.25Aditya Birla Nuvo Limited Services 0.24 -0.24IndusInd Bank Ltd. Banks 0.20 -0.20United Spirits Ltd. Consumer Non Durables 0.20 -0.20Adani Power Ltd Power 0.19 -0.19Tata Motors Ltd - DVR Auto 0.19 -0.19LIC Housing Finance Ltd. Finance 0.17 -0.17Tata Chemicals Ltd. Chemicals 0.17 -0.17Bank Of Baroda Banks 0.16 -0.16Cairn India Limited Oil 0.16 -0.16Divi s Laboratories Limited Pharmaceuticals 0.15 -0.15Hindustan Unilever Ltd. Consumer Non Durables 0.15 -0.15Cipla Ltd. Pharmaceuticals 0.14 -0.14JSW Energy Ltd. Power 0.13 -0.13Biocon Ltd. Pharmaceuticals 0.12 -0.12Grasim Industries Ltd. Cement 0.11 -0.11Tata Global Beverages Limited Consumer Non Durables 0.11 -0.11Tata Motors Ltd. Auto 0.11 -0.11Coal India Ltd. Minerals/Mining 0.10 -0.10Wipro Ltd. Software 0.10 -0.10Castrol (India ) Ltd. Petroleum Products 0.09 -0.09Tata Elxsi Ltd. Software 0.09 -0.09Torrent Pharmaceuticals Ltd. Pharmaceuticals 0.09 -0.09Power Grid Corporation Of India Ltd Power 0.08 -0.08NIIT Technologies Ltd Software 0.07 -0.07Oracle Financial Services Software Ltd Software 0.07 -0.07SRF Ltd. Textile Products 0.07 -0.07Vedanta Ltd. Minerals/Mining 0.07 -0.07Hindalco Industries Ltd Non - Ferrous Metals 0.06 -0.06Hindustan Petroleum Corporation Ltd Petroleum Products 0.05 -0.05HCL Technologies Ltd. Software 0.04 -0.04ITC Ltd. Consumer Non Durables 0.04 -0.04Mahindra & Mahindra Financial Services Ltd. Finance 0.04 -0.04TV18 Broadcast Ltd Media and Entertainment 0.04 -0.04Union Bank Of India Banks 0.04 -0.04Indraprastha Gas Ltd. Gas 0.03 -0.03Kotak Mahindra Bank Ltd. Banks 0.03 -0.03Tata Power Co. Ltd. Power 0.03 -0.03Bharat Earth Movers Ltd. Industrial Capital Goods 0.02 -0.02CESC Ltd. Power 0.02 -0.02Jaiprakash Associates Ltd Construction 0.02 -0.02National Thermal Power Corporation Limited Power 0.02 -0.02JSW Steel Ltd. Ferrous Metals 0.01 -0.01NMDC Ltd. Minerals/Mining 0.01 -0.01Hedged - Total 41.02 -41.12Listed/Awaiting Listing on Stock Exchange - Total 65.74 -41.17Mutual Fund Units Kotak Floater Short Term Direct Growth 10.21 Kotak Liquid Plan A 0.59 Mutual Fund Units - Total 10.80 Government Dated Securities 7.59% Central Government SOV 1.21 8.53% State Government SOV 0.61 Government Dated Securities - Total 1.82 TERM DEPOSITS Kotak Mahindra Bank Ltd. 6.64 Ratnakar Bank Ltd 1.65 Term Deposits - Total 8.29 Collateral Borrowing & Lending obligation 12.65 Net Current Assets/(Liabilities) 0.60 Grand Total 100
(As on July 31, 2016)
SYSTEMATIC INVESTMENT PLAN (SIP)
Total amount invested (Rs)
Total Value as on Jun 30, 2016 (Rs)
Scheme Returns (%)
75% Crisil Liquid Fund Index + 25% Nifty 50 (Rs)#
75% Crisil Liquid Fund Index + 25% Nifty 50 Returns (%)
Nifty 50 (Rs)^
Nifty 50 Returns (%)
1 year Since Inception
120,000 210,000
124,555 222,255
7.13 6.37
125,253 218,957
8.24 4.66
125,632 213,892
8.84 2.03
Systematic Investment Plan (SIP) If you had invested `10,000 every monthKotak Equity Savings Fund NAV as on July 29, 2016: `11.564 (Growth Option), `10.7086 (Monthly Dividend Option), `10.6964 (Quarterly Dividend Option), `11.7004 (Direct Growth Option), `10.8377 (Direct Monthly Dividend Option), `10.7518 (Direct Quarterly Dividend Option)
This product is suitable for investors who are seeking*:� Income from arbitrage opportunities in the equity market & long term
capital growth� Investment predominantly in arbitrage opportunities in the cash &
derivatives segment of the equity market and equity & equity related securities
* Investors should consult their financial advisors if in doubt about whether the product is suitable for them.
PRODUCT LABEL
Investors understand that their principal will be at moderately high risk
Riskometer
yletaredo
M
Moderate
Low
High
Low
High
LOW HIGH
Moderately
SECTOR ALLOCATION (%)
CBLO & Term Deposits & Rev.Repo Banks FinanceSoftware AutoConsumer Non Durables Cement
Pharmaceuticals Others
22.18
11.19
8.927.095.13.72
3.6
30.03
Construction ProjectUnrated
# Benchmark ; ^ Additional Benchmark
20.94
10.80
9.90
8.795.635.39
5.39
4.82
3.89
3.70
20.75
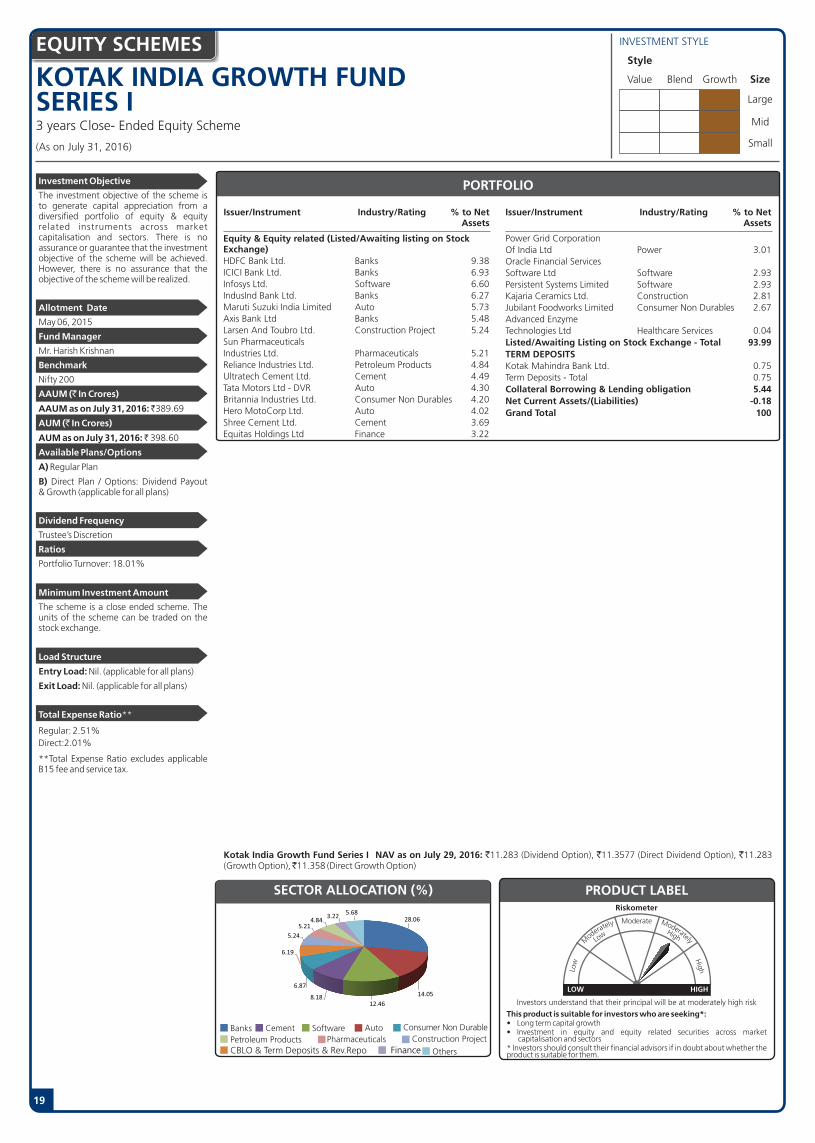
KOTAK INDIA GROWTH FUND SERIES I3 years Close- Ended Equity Scheme
Issuer/Instrument Industry/Rating % to Net Assets
Issuer/Instrument Industry/Rating % to Net Assets
Investment Objective
The investment objective of the scheme is to generate capital appreciation from a diversified portfolio of equity & equity related instruments across market capitalisation and sectors. There is no assurance or guarantee that the investment objective of the scheme will be achieved. However, there is no assurance that the objective of the scheme will be realized.
Allotment Date
May 06, 2015
Fund Manager
Mr. Harish Krishnan
Benchmark
Nifty 200
AAUM (` In Crores)
AAUM as on July 31, 2016: ̀ 389.69
AUM (` In Crores)
AUM as on July 31, 2016: ̀ 398.60
Available Plans/Options
A) Regular Plan
B) Direct Plan / Options: Dividend Payout & Growth (applicable for all plans)
Dividend Frequency
Trustee�s Discretion
Ratios
Portfolio Turnover: 18.01%
Minimum Investment Amount
The scheme is a close ended scheme. The units of the scheme can be traded on the stock exchange.
Load Structure
Entry Load: Nil. (applicable for all plans)
Exit Load: Nil. (applicable for all plans)
Total Expense Ratio**
Regular: 2.51%Direct:2.01%
**Total Expense Ratio excludes applicable B15 fee and service tax.
EQUITY SCHEMES
Equity & Equity related (Listed/Awaiting listing on Stock Exchange) HDFC Bank Ltd. Banks 9.38ICICI Bank Ltd. Banks 6.93Infosys Ltd. Software 6.60IndusInd Bank Ltd. Banks 6.27Maruti Suzuki India Limited Auto 5.73Axis Bank Ltd Banks 5.48Larsen And Toubro Ltd. Construction Project 5.24Sun Pharmaceuticals Industries Ltd. Pharmaceuticals 5.21Reliance Industries Ltd. Petroleum Products 4.84Ultratech Cement Ltd. Cement 4.49Tata Motors Ltd - DVR Auto 4.30Britannia Industries Ltd. Consumer Non Durables 4.20Hero MotoCorp Ltd. Auto 4.02Shree Cement Ltd. Cement 3.69Equitas Holdings Ltd Finance 3.22
Power Grid Corporation Of India Ltd Power 3.01Oracle Financial Services Software Ltd Software 2.93Persistent Systems Limited Software 2.93Kajaria Ceramics Ltd. Construction 2.81Jubilant Foodworks Limited Consumer Non Durables 2.67Advanced Enzyme Technologies Ltd Healthcare Services 0.04Listed/Awaiting Listing on Stock Exchange - Total 93.99TERM DEPOSITS Kotak Mahindra Bank Ltd. 0.75Term Deposits - Total 0.75Collateral Borrowing & Lending obligation 5.44Net Current Assets/(Liabilities) -0.18Grand Total 100
PORTFOLIO
Kotak India Growth Fund Series I NAV as on July 29, 2016: `11.283 (Dividend Option), `11.3577 (Direct Dividend Option), `11.283 (Growth Option), ̀ 11.358 (Direct Growth Option)
INVESTMENT STYLE
Value Blend Growth Size
Large
Mid
Small
Style
SECTOR ALLOCATION (%)
Banks Cement Software Consumer Non DurablePetroleum Products PharmaceuticalsCBLO & Term Deposits & Rev.Repo
AutoConstruction Project
Others
32.53
14.699.36
7.53
7.09
7.03
4.8129.12
14.3
10.617.49
6.94
6.9
5.64
26.28
15.93
14.76.48
5.55
5.07
4.954.3
Finance
This product is suitable for investors who are seeking*:� Long term capital growth� Investment in equity and equity related securities across market
capitalisation and sectors* Investors should consult their financial advisors if in doubt about whether the product is suitable for them.
PRODUCT LABEL
Investors understand that their principal will be at moderately high risk
Riskometer
yletaredo
M
Moderate
Low
High
Low
High
LOW HIGH
Moderately
27.37
16.83
14.74
6.44
5.83
5.46
5.32
19
26.35
16.68
13.656.74
6.46
5.97
5.45
(As on July 31, 2016)
25.63
17.4
13.167.5
7.1
5.82
5.76
28.06
14.05
12.468.18
6.87
6.19
5.24
5.214.84
3.225.68
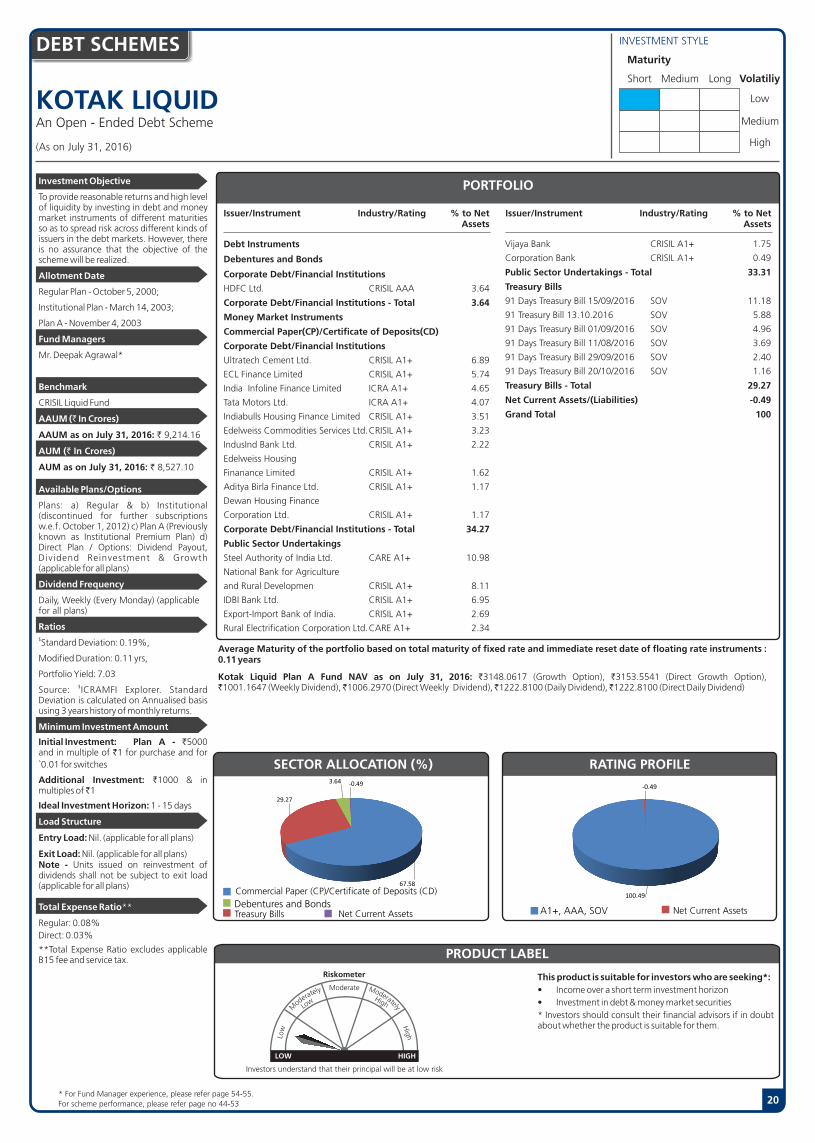
20
KOTAK LIQUIDAn Open - Ended Debt Scheme
Issuer/Instrument Industry/Rating % to Net Assets
Debt Instruments
Debentures and Bonds
Corporate Debt/Financial Institutions
HDFC Ltd. CRISIL AAA 3.64
Corporate Debt/Financial Institutions - Total 3.64
Money Market Instruments
Commercial Paper(CP)/Certificate of Deposits(CD)
Corporate Debt/Financial Institutions
Ultratech Cement Ltd. CRISIL A1+ 6.89
ECL Finance Limited CRISIL A1+ 5.74
India Infoline Finance Limited ICRA A1+ 4.65
Tata Motors Ltd. ICRA A1+ 4.07
Indiabulls Housing Finance Limited CRISIL A1+ 3.51
Edelweiss Commodities Services Ltd. CRISIL A1+ 3.23
IndusInd Bank Ltd. CRISIL A1+ 2.22
Edelweiss Housing
Finanance Limited CRISIL A1+ 1.62
Aditya Birla Finance Ltd. CRISIL A1+ 1.17
Dewan Housing Finance
Corporation Ltd. CRISIL A1+ 1.17
Corporate Debt/Financial Institutions - Total 34.27
Public Sector Undertakings
Steel Authority of India Ltd. CARE A1+ 10.98
National Bank for Agriculture
and Rural Developmen CRISIL A1+ 8.11
IDBI Bank Ltd. CRISIL A1+ 6.95
Export-Import Bank of India. CRISIL A1+ 2.69
Rural Electrification Corporation Ltd. CARE A1+ 2.34
Issuer/Instrument Industry/Rating % to Net Assets
Vijaya Bank CRISIL A1+ 1.75
Corporation Bank CRISIL A1+ 0.49
Public Sector Undertakings - Total 33.31
Treasury Bills
91 Days Treasury Bill 15/09/2016 SOV 11.18
91 Treasury Bill 13.10.2016 SOV 5.88
91 Days Treasury Bill 01/09/2016 SOV 4.96
91 Days Treasury Bill 11/08/2016 SOV 3.69
91 Days Treasury Bill 29/09/2016 SOV 2.40
91 Days Treasury Bill 20/10/2016 SOV 1.16
Treasury Bills - Total 29.27
Net Current Assets/(Liabilities) -0.49
Grand Total 100
PORTFOLIO
INVESTMENT STYLEDEBT SCHEMES
Investment Objective
To provide reasonable returns and high level of liquidity by investing in debt and money market instruments of different maturities so as to spread risk across different kinds of issuers in the debt markets. However, there is no assurance that the objective of the scheme will be realized.
Allotment Date
Regular Plan - October 5, 2000;
Institutional Plan - March 14, 2003;
Plan A - November 4, 2003
Fund Managers
Mr. Deepak Agrawal*
Benchmark
CRISIL Liquid Fund
AAUM (` In Crores)
AAUM as on July 31, 2016: ` 9,214.16
AUM (` In Crores)
AUM as on July 31, 2016: ` 8,527.10
Available Plans/Options
Plans: a) Regular & b) Institutional (discontinued for further subscriptions w.e.f. October 1, 2012) c) Plan A (Previously known as Institutional Premium Plan) d) Direct Plan / Options: Dividend Payout, Dividend Reinvestment & Growth (applicable for all plans)
Dividend Frequency
Daily, Weekly (Every Monday) (applicable for all plans)
Ratios$Standard Deviation: 0.19%,
Modified Duration: 0.11 yrs,
Portfolio Yield: 7.03 $Source: ICRAMFI Explorer. Standard
Deviation is calculated on Annualised basis using 3 years history of monthly returns.
Minimum Investment Amount
Initial Investment: Plan A - `5000 and in multiple of `1 for purchase and for `0.01 for switches
Additional Investment: `1000 & in multiples of ̀ 1
Ideal Investment Horizon: 1 - 15 days
Load Structure
Entry Load: Nil. (applicable for all plans)
Exit Load: Nil. (applicable for all plans)Note - Units issued on reinvestment of dividends shall not be subject to exit load (applicable for all plans)
Total Expense Ratio**
Regular: 0.08%Direct: 0.03%
**Total Expense Ratio excludes applicable B15 fee and service tax.
Investors understand that their principal will be at low risk
Riskometer
yletaredo
M
Moderate
Low
High
Low
High
LOW HIGH
Moderately
This product is suitable for investors who are seeking*:� Income over a short term investment horizon� Investment in debt & money market securities* Investors should consult their financial advisors if in doubt about whether the product is suitable for them.
PRODUCT LABEL
Short Medium Long Volatiliy
Low
Medium
High
Maturity
Average Maturity of the portfolio based on total maturity of fixed rate and immediate reset date of floating rate instruments : 0.11 years
Kotak Liquid Plan A Fund NAV as on July 31, 2016: `3148.0617 (Growth Option), `3153.5541 (Direct Growth Option),`1001.1647 (Weekly Dividend), ̀ 1006.2970 (Direct Weekly Dividend), ̀ 1222.8100 (Daily Dividend), ̀ 1222.8100 (Direct Daily Dividend)
90.38
75.74
15.55
90.22
8.396.85
For scheme performance, please refer page no 44-53 * For Fund Manager experience, please refer page 54-55.
(As on July 31, 2016)
64.44
19.74
15.57
Debentures and BondsNet Current AssetsTreasury Bills
SECTOR ALLOCATION (%) RATING PROFILE
A1+, AAA, SOV Net Current Assets
67.58
29.27
3.64 -0.49
Commercial Paper (CP)/Certificate of Deposits (CD)100.49
-0.49
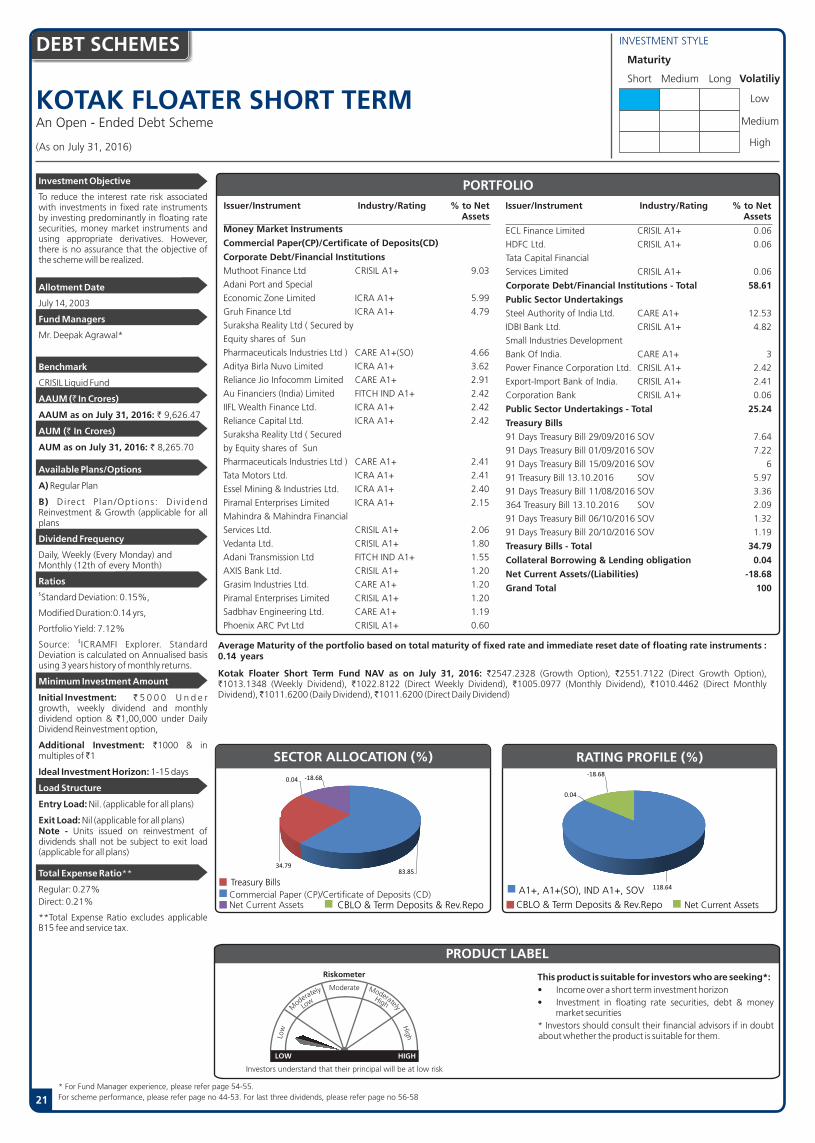
21
KOTAK FLOATER SHORT TERMAn Open - Ended Debt Scheme
Issuer/Instrument Industry/Rating % to Net AssetsMoney Market Instruments
Commercial Paper(CP)/Certificate of Deposits(CD)
Corporate Debt/Financial Institutions
Muthoot Finance Ltd CRISIL A1+ 9.03
Adani Port and Special
Economic Zone Limited ICRA A1+ 5.99
Gruh Finance Ltd ICRA A1+ 4.79
Suraksha Reality Ltd ( Secured by
Equity shares of Sun
Pharmaceuticals Industries Ltd ) CARE A1+(SO) 4.66
Aditya Birla Nuvo Limited ICRA A1+ 3.62
Reliance Jio Infocomm Limited CARE A1+ 2.91
Au Financiers (India) Limited FITCH IND A1+ 2.42
IIFL Wealth Finance Ltd. ICRA A1+ 2.42
Reliance Capital Ltd. ICRA A1+ 2.42
Suraksha Reality Ltd ( Secured
by Equity shares of Sun
Pharmaceuticals Industries Ltd ) CARE A1+ 2.41
Tata Motors Ltd. ICRA A1+ 2.41
Essel Mining & Industries Ltd. ICRA A1+ 2.40
Piramal Enterprises Limited ICRA A1+ 2.15
Mahindra & Mahindra Financial
Services Ltd. CRISIL A1+ 2.06
Vedanta Ltd. CRISIL A1+ 1.80
Adani Transmission Ltd FITCH IND A1+ 1.55
AXIS Bank Ltd. CRISIL A1+ 1.20
Grasim Industries Ltd. CARE A1+ 1.20
Piramal Enterprises Limited CRISIL A1+ 1.20
Sadbhav Engineering Ltd. CARE A1+ 1.19
Phoenix ARC Pvt Ltd CRISIL A1+ 0.60
Issuer/Instrument Industry/Rating % to Net Assets
ECL Finance Limited CRISIL A1+ 0.06
HDFC Ltd. CRISIL A1+ 0.06
Tata Capital Financial
Services Limited CRISIL A1+ 0.06
Corporate Debt/Financial Institutions - Total 58.61
Public Sector Undertakings
Steel Authority of India Ltd. CARE A1+ 12.53
IDBI Bank Ltd. CRISIL A1+ 4.82
Small Industries Development
Bank Of India. CARE A1+ 3
Power Finance Corporation Ltd. CRISIL A1+ 2.42
Export-Import Bank of India. CRISIL A1+ 2.41
Corporation Bank CRISIL A1+ 0.06
Public Sector Undertakings - Total 25.24
Treasury Bills
91 Days Treasury Bill 29/09/2016 SOV 7.64
91 Days Treasury Bill 01/09/2016 SOV 7.22
91 Days Treasury Bill 15/09/2016 SOV 6
91 Treasury Bill 13.10.2016 SOV 5.97
91 Days Treasury Bill 11/08/2016 SOV 3.36
364 Treasury Bill 13.10.2016 SOV 2.09
91 Days Treasury Bill 06/10/2016 SOV 1.32
91 Days Treasury Bill 20/10/2016 SOV 1.19
Treasury Bills - Total 34.79
Collateral Borrowing & Lending obligation 0.04
Net Current Assets/(Liabilities) -18.68
Grand Total 100
PORTFOLIO
INVESTMENT STYLEDEBT SCHEMES
Investment Objective
To reduce the interest rate risk associated with investments in fixed rate instruments by investing predominantly in floating rate securities, money market instruments and using appropriate derivatives. However, there is no assurance that the objective of the scheme will be realized.
Allotment Date
July 14, 2003
Fund Managers
Mr. Deepak Agrawal*
Benchmark
CRISIL Liquid Fund
AAUM (` In Crores)
AAUM as on July 31, 2016: ` 9,626.47
AUM (` In Crores)
AUM as on July 31, 2016: ` 8,265.70
Available Plans/Options
A) Regular Plan
B) Direct P lan/Opt ions: Div idend Reinvestment & Growth (applicable for all plans
Dividend Frequency
Daily, Weekly (Every Monday) and Monthly (12th of every Month)
Ratios$Standard Deviation: 0.15%,
Modified Duration:0.14 yrs,
Portfolio Yield: 7.12% $Source: ICRAMFI Explorer. Standard
Deviation is calculated on Annualised basis using 3 years history of monthly returns.
Minimum Investment Amount
Initial Investment: ` 5 0 0 0 U n d e r growth, weekly dividend and monthly dividend option & `1,00,000 under Daily Dividend Reinvestment option,
Additional Investment: `1000 & in multiples of ̀ 1
Ideal Investment Horizon: 1-15 days
Load Structure
Entry Load: Nil. (applicable for all plans)
Exit Load: Nil (applicable for all plans) Note - Units issued on reinvestment of dividends shall not be subject to exit load (applicable for all plans)
Total Expense Ratio**
Regular: 0.27%Direct: 0.21%
**Total Expense Ratio excludes applicable B15 fee and service tax.
Short Medium Long Volatiliy
Low
Medium
High
Maturity
Average Maturity of the portfolio based on total maturity of fixed rate and immediate reset date of floating rate instruments : 0.14 years
Kotak Floater Short Term Fund NAV as on July 31, 2016: `2547.2328 (Growth Option), `2551.7122 (Direct Growth Option),`1013.1348 (Weekly Dividend), `1022.8122 (Direct Weekly Dividend), `1005.0977 (Monthly Dividend), `1010.4462 (Direct Monthly Dividend), ̀ 1011.6200 (Daily Dividend), ̀ 1011.6200 (Direct Daily Dividend)
Investors understand that their principal will be at low risk
Riskometer
yletaredo
M
Moderate
Low
High
Low
High
LOW HIGH
Moderately
This product is suitable for investors who are seeking*:� Income over a short term investment horizon� Investment in floating rate securities, debt & money
market securities* Investors should consult their financial advisors if in doubt about whether the product is suitable for them.
PRODUCT LABEL
SECTOR ALLOCATION (%)SECTOR ALLOCATION (%)
Net Current Assets
95.58
A1+, A1+(SO), IND A1+, SOV
97.08
* For Fund Manager experience, please refer page 54-55. For scheme performance, please refer page no 44-53. For last three dividends, please refer page no 56-58
(As on July 31, 2016)
92.95
4.56
Net Current Assets
Treasury BillsCommercial Paper (CP)/Certificate of Deposits (CD)
RATING PROFILE (%)
83.8534.79
0.04 -18.68
CBLO & Term Deposits & Rev.Repo
118.64
0.04
-18.68
CBLO & Term Deposits & Rev.Repo

22
KOTAK TREASURY ADVANTAGE FUND(Formerly Known as Kotak Floater Long Term Scheme)An Open � Ended Debt Scheme
Issuer/Instrument Industry/Rating % to Net Assets
Debt Instruments Debentures and Bonds Corporate Debt/Financial Institutions Bharti enterprises (Holding) Pvt. Ltd.^ CRISIL A1+ 9.64Kotak Mahindra Prime Ltd.^ CRISIL AAA 5.20Shriram Transport Finance Co Ltd.^ CRISIL AA+ 3.92HDFC Ltd.^ CRISIL AAA 3.79Tata Motors Finance Ltd CRISIL AA 3.16Fullerton India Credit Co. Ltd. CARE AAA 2.60Nabha Power Ltd. ( backed by unconditional and irrevocable guarantee by Larsen & Toubro Ltd ) ICRA AAA 2.48Shriram Transport Finance Co Ltd. FITCH IND AA+ 2.18Kotak Mahindra Investments Ltd. CRISIL AAA 2.07Indiabulls Housing Finance Limited CARE AAA 1.35Karelides Traders Private Ltd. ( backed by unconditional and irrevocable undertaking by a wholly owned subsidiary of Piramal Enterprises Ltd ) ICRA AA- 1.16India Infoline Housing Finance Ltd. ICRA AA 1.03Mahindra & Mahindra Financial Services Ltd. FITCH IND AAA 1.03SP Jammu Udhampur Highway Ltd. ( backed by unconditional and irrevocable guarantee of Shapoorji Pallonji & Co Pvt Ltd ) ICRA AAA 0.48Piramal Enterprises Limited ICRA AA 0.29Mandava Holdings Private Limited ( backed by unconditional and irrevocable undertaking by Axis Capital ) ICRA AAA 0.24Tata Capital Housing Finance Ltd; CRISIL AA+ 0.24Nabha Power Ltd. ( backed by unconditional and irrevocable guarantee by Larsen & Toubro Ltd ) ICRA AAA(SO) 0.19East-North Interconnection Company Limited CRISIL AAA(SO) 0.14Cholamandalam Investment and Finance Company Ltd ICRA AA 0.10India Infoline Finance Limited CARE AA 0.10L & T Finance Limited CARE AA+ 0.06Shapoorji Pallonji Energy Gujarat
Issuer/Instrument Industry/Rating % to Net Assets
Private Limited ICRA AA(SO) 0.06Tata Sons Ltd. CRISIL AAA 0.03Corporate Debt/Financial Institutions - Total 41.54Public Sector Undertakings State Bank Of India.^ CRISIL AAA 2.80Small Industries Development Bank Of India. CARE AAA 0.83Rural Electrification Corporation Ltd. CRISIL AAA 0.82Power Finance Corporation Ltd. CRISIL AAA 0.45National Bank for Agriculture and Rural Developmen CRISIL AAA 0.17Vijaya Bank CARE AA+ 0.10Public Sector Undertakings - Total 5.17Money Market Instruments Commercial Paper(CP)/Certificate of Deposits(CD) Corporate Debt/Financial Institutions Tata Power Company Ltd. ICRA A1+ 7.98Hindustan Zinc Ltd ICRA A1+ 7.07Larsen and Toubro Ltd. CRISIL A1+ 6.04Piramal Enterprises Limited ICRA A1+ 5.35Adani Transmission Ltd FITCH IND A1+ 3.03Manappuram Finance Ltd CRISIL A1+ 1.92AXIS Bank Ltd. CRISIL A1+ 1.17HDFC Bank Ltd. ICRA A1+ 0.51ICICI Bank Ltd. ICRA A1+ 0.10Muthoot Finance Ltd CRISIL A1+ 0.10Corporate Debt/Financial Institutions - Total 33.27Public Sector Undertakings Corporation Bank CRISIL A1+ 0.25Andhra Bank CARE A1+ 0.20Export-Import Bank of India. CRISIL A1+ 0.20IDBI Bank Ltd. CRISIL A1+ 0.02Public Sector Undertakings - Total 0.67Treasury Bills 91 Days Treasury Bill 27/10/2016 SOV 5.19182 Treasury Bill 20.10.2016 SOV 4.1791 Days Treasury Bill 01/09/2016 SOV 0.1191 Days Treasury Bill 22/09/2016 SOV 0.03Treasury Bills - Total 9.50Collateral Borrowing & Lending obligation 2.71Net Current Assets/(Liabilities) 7.14Grand Total 100
PORTFOLIO
INVESTMENT STYLEDEBT SCHEMES
Investment Objective
The investment objective of the Scheme is to generate returns through investments in debt and money market instruments with a view to reduce the interest rate risk. However, there is no assurance or guarantee that the investment objective of the scheme will be achieved.
Allotment Date
August 13, 2004
Fund Manager
Mr. Deepak Agrawal*
Benchmark
CRISIL Liquid Fund
AAUM (` In Crores)
AAUM as on July 31, 2016: ` 4,818.50
AUM (` In Crores)
AUM as on July 31, 2016: ` 4,842.00
Available Plans/Options
A) Regular Plan
B) Direct Plan/Options: Dividend Payout, Dividend Reinvestment & Growth (applicable for all plans)
Dividend Frequency
Daily, Monthly (12th of every Month) and Weekly (Every Monday)
Ratios$Standard Deviation:0.47%,
Modified Duration: 0.52yrs,
Portfolio Yield: 7.60%$Source: ICRAMFI Explorer. Standard
Deviation is calculated on Annualised basis using 3 years history of monthly returns.
Minimum Investment Amount
Initial Investment: (i) Dividend Re-investment & Growth- `5000 & above (ii) Dividend Payout (Weekly) - ̀ 1,00,00,000 & above
Additional Investment: `1000 & in multiples of ̀ 1
Ideal Investment Horizon: 1-3 months
Load Structure
Entry Load: Nil. (applicable for all plans)
Exit Load: Nil.(applicable for all plans) Note - Units issued on reinvestment of dividends shall not be subject to exit load (applicable for all plans)
Total Expense Ratio**
Regular: 0.60%Direct: 0.25%
**Total Expense Ratio excludes applicable B15 fee and service tax.
Short Medium Long Volatiliy
Low
Medium
High
Maturity
Average Maturity of the portfolio based on total maturity of fixed rate and immediate reset date of floating rate instruments : 0.57 years.
Kotak Treasury Advantage Fund NAV as on Ju ly 29 , 2016 : ` 10 .0798 (Da i l y D i v i dend Op t i on ) ,`10.0798 (Daily Dividend - Direct), `24.8157 (Growth Option), `10.1449 (Monthly Dividend Option), `10.1544 (Weekly Dividend Option), `11.3337 (Monthly Dividend - Direct), ̀ 10.1705 (Weekly Dividend - Direct), ̀ 25.0595 (Growth - Direct Option)
Investors understand that their principal will be at moderately low risk
Riskometer
yletaredo
M
Moderate
Low
High
Low
High
LOW HIGH
Moderately
This product is suitable for investors who are seeking*:� Income over a short term investment horizon� Investment in debt & money market securities* Investors should consult their financial advisors if in doubt about whether the product is suitable for them.
PRODUCT LABEL
RATING PROFILE
Net Current AssetsCommercial Paper (CP)/Certificate of Deposits (CD)
Debentures and Bonds Net Current Assets
76.57
19.2
* For Fund Manager experience, please refer page 54-55. For scheme performance, please refer page no 44-53. For last three dividends, please refer page no 56-58
(As on July 31, 2016)
83.68
15.69
CBLO & Term Deposits & Rev.Repo
Note:^ Party blocked against Interest Rate Swap (IRS).
A1+, AAA, AAA(SO), IND A1+, IND AAA, SOVAA+, IND AA+, AA, AA(SO), AA-
Treasury Bills
CBLO & Term Deposits & Rev. Repo
46.71
33.94
9.507.14 2.71
77.75
12.40
7.14 2.71

KOTAK BANKING AND PSU DEBT FUNDEarlier known as Kotak Mahindra Gilt Savings Scheme - 98 - Savings Plan.An Open - Ended Debt Scheme
INVESTMENT STYLEDEBT SCHEMES
Average Maturity of the portfolio based on total maturity of fixed rate and immediate reset date of floating rate instruments 3.43 years.
Kotak Banking And PSU Debt Fund NAV as on July 29, 2016: `34.8714 (Growth Option), `35.1250 (Direct Growth Option),`10.7259 (Monthly Dividend), ̀ 10.9339 (Direct Monthly Dividend), ̀ 10.0485 (Daily Dividend Reinvestment), ̀ 10.0817 (Direct Daily Dividend Reinvestment), ̀ 16.0840 (Annual Dividend), ̀ 17.0303 (Direct Annual)
Short Medium Long Volatiliy
Low
Medium
High
Maturity
23
Issuer/Instrument Industry/Rating % to Net AssetsDebt Instruments Debentures and Bonds Public Sector Undertakings Rural Electrification Corporation Ltd. CRISIL AAA 9.31PNB Housing Finance Ltd. CARE AAA 7.93Power Finance Corporation Ltd. ICRA AAA 6.30State Bank of Travancore CRISIL AAA 6.09ONGC Manglore Petrochemicals Ltd. FITCH IND AAA 5.86National Bank for Agriculture and Rural Developmen CRISIL AAA 5.26Canara Bank CRISIL AAA 4.47Export-Import Bank of India. CRISIL AAA 3.92Punjab National Bank CARE AA 2.61Powergrid Vizag Transminssion Ltd. ( backed by unconditional and irrevocable guarantee by Powergrid Corp ) CRISIL AAA(SO) 2.34Indian Railway Finance Corporation Ltd. CRISIL AAA 1.79Power Finance Corporation Ltd. CRISIL AAA 1.26
Issuer/Instrument Industry/Rating % to Net Assets
Public Sector Undertakings - Total 57.14Government Dated Securities 8.27% State Government SOV 8.048.53% State Government SOV 6.328.52% State Government SOV 4.51Government Dated Securities - Total 18.87Money Market Instruments Commercial Paper(CP)/Certificate of Deposits(CD) Corporate Debt/Financial Institutions AXIS Bank Ltd. CRISIL A1+ 8.15ICICI Bank Ltd. ICRA A1+ 7.07IndusInd Bank Ltd. CRISIL A1+ 5.70Corporate Debt/Financial Institutions - Total 20.92Public Sector Undertakings Export-Import Bank of India. CRISIL A1+ 0.87Public Sector Undertakings - Total 0.87Collateral Borrowing & Lending obligation 0.35Net Current Assets/(Liabilities) 1.85Grand Total 100
PORTFOLIOInvestment Objective
To generate income by predominantly investing in debt & money market securities issued by Banks & PSUs and Reverse repos in such securities, sovereign securities issued by the Central Government and State Governments, and / or any security unconditionally guaranteed by the Govt. of India. However, there is no assurance that the objective of the scheme will be realized.
Allotment Date
December 29,1998
Fund Manager
Mr. Deepak Agrawal*
Benchmark
Crisil Liquid Fund
AAUM (` In Crores)
AAUM as on July 31, 2016: ` 462.39
AUM (` In Crores)
AUM as on July 31, 2016: ` 572.76 Available Plans/Options
A) Regular Plan
B) Direct Plan/Options: Dividend Payout, Dividend Reinvestment & Growth (applicable for all plans)
Dividend Frequency
Daily, Monthly (12th of every Month) & Annual
Ratios$Standard Deviation: 0.96%,
Modified Duration: 2.70 yrs,
Portfolio Yield: 7.65%$Source: ICRAMFI Explorer. Standard
Deviation is calculated on Annualised basis using 3 years history of monthly returns.
Minimum Investment Amount
Initial Investment: Dividend Payout, Dividend Re-investment & Growth ̀ 5000 & above.
Additional Investment: `1000 & in multiples of ̀ 1.
Ideal Investment Horizon: 1-3 months
Load Structure
Entry Load: Nil. (applicable for all plans)
Exit Load: Nil (applicable for all plans) Note - Units issued on reinvestment of dividends shall not be subject to exit load (applicable for all plans)
Total Expense Ratio**
Regular:0.50%Direct: 0.14%
**Total Expense Ratio excludes applicable B15 fee and service tax.
Investors understand that their principal will be at moderately low risk
Riskometer
yletaredo
M
Moderate
Low
High
Low
High
LOW HIGH
Moderately
This product is suitable for investors who are seeking*:� Income over a short to medium term investment horizon� Investment in debt & money market securities of PSUs,
Banks & government securities* Investors should consult their financial advisors if in doubt about whether the product is suitable for them.
PRODUCT LABEL
Net Current AssetsGovernment Dated Securities Debentures and Bonds A1+, AAA, AAA(SO), IND AAA, SOV
96.83
26.95
5.28
97.18
26.02
99.55
* For Fund Manager experience, please refer page 54-55. For scheme performance, please refer page no 44-53. For last three dividends, please refer page no 56-58
(As on July 31, 2016)
Net Current AssetsCBLO & Term Deposits & Rev.RepoCBLO & Term Deposits & Rev.Repo
Commercial Paper (CP)/Certificate of Deposits (CD)
57.1421.79
18.871.85 0.35
95.19
2.611.85 0.35
AA

24
KOTAK LOW DURATION FUND (Formerly known as PineBridge India Short Term Fund)An Open - Ended Debt Scheme
Issuer/Instrument Industry/Rating % to Net Assets
Debt Instruments Debentures and Bonds Corporate Debt/Financial Institutions Bharti enterprises (Holding) Pvt. Ltd. CRISIL A1+ 8.70Innovador Realtors Pvt Ltd ( backed by unconditional and irrevocable undertaking by Piramal ) ICRA A1+(SO) 7.95Shriram Transport Finance Co Ltd. FITCH IND AA+ 5.23Reliance Jio Infocomm Limited CRISIL AAA 4.58Indiabulls Housing Finance Limited CARE AAA 3.83Karelides Traders Private Ltd. ( backed by unconditional and irrevocable undertaking by a wholly owned subsidiary of Piramal Enterprises Ltd ) ICRA AA- 3.47Muthoot Fincorp Ltd. CRISIL A 3.47JSW Investments Pvt. Ltd. BRICKWORK BWR A 3.43Pune Solapur Expressways Pvt. Ltd. ( toll road project of Tata Realty & Infrastructure Ltd, 100 subsidiary of Tata Sons ) ICRA A 3.06Muthoot Finance Ltd ICRA AA- 2.67Nabha Power Ltd. ( backed by unconditional and irrevocable guarantee by Larsen & Toubro Ltd ) ICRA AAA 2.30Adani Power Ltd ( Secured by Equity shares of Adani Ports and SEZ Ltd ) BRICKWORK BWR AA- 1.97Janalakshami Financial Services Ltd. ICRA A+ 1.75Peninsula Land Limited BRICKWORK BWR A 1.74Shivprasad Realty Pvt Ltd ( backed by unconditional and irrevocable undertaking by Axis Capital ) ICRA AAA 1.71Sterlite Industries (India) Ltd CRISIL AA- 1.71HPCL Mittal Energy Ltd. ICRA AA- 1.40Mandava Holdings Private Limited ( backed by unconditional and irrevocable undertaking by Axis Capital ) ICRA AAA 1.33Sahyadri Agencies Ltd ( Secured by Equity shares of Jyothy Laboratories Ltd ) BRICKWORK BWR A(SO) 1.26Hero Realty Ltd ( Guaranteed by a Hero Group company ) ICRA A+ 1.22Indostar Capital Finance Private Limited CARE AA- 1.19
Issuer/Instrument Industry/Rating % to Net Assets
HDFC Ltd. CRISIL AAA 1.10Kotak Mahindra Prime Ltd. 0.88Intime Properties Ltd. FITCH IND AAA 0.81India Infoline Finance Limited CARE AA 0.80Edelweiss Agri Value Chain Limited ( ) CARE AA(SO) 0.66Grand View Estate Pvt Ltd ( backed by unconditional and irrevocable guarantee of Shapoorji Pallonji & Co Pvt Ltd ) ICRA AA 0.42ECL Finance Limited CARE AA 0.35Muthoot Finance Ltd CRISIL AA- 0.17Aspire Home Finance Corporation Ltd ICRA AA- 0.10Piramal Enterprises Limited ICRA AA 0.01Corporate Debt/Financial Institutions - Total 69.27Public Sector Undertakings Export-Import Bank of India. CRISIL AAA 3.49Rural Electrification Corporation Ltd. CRISIL AAA 0.53Public Sector Undertakings - Total 4.02Money Market Instruments Commercial Paper(CP)/Certificate of Deposits(CD) Corporate Debt/Financial Institutions Suraksha Reality Ltd ( Secured by Equity shares of Sun Pharmaceuticals Industries Ltd ) CARE A1+ 5.16ICICI Bank Ltd. ICRA A1+ 4.32Suraksha Reality Ltd ( Secured by Equity shares of Sun Pharmaceuticals Industries Ltd ) CARE A1+(SO) 3.78ICICI Bank Ltd. CRISIL A1+ 2.77AXIS Bank Ltd. CRISIL A1+ 1.96Adani Transmission Ltd FITCH IND A1+ 1.66Manappuram Finance Ltd CRISIL A1+ 1.62Piramal Enterprises Limited ICRA A1+ 0.22Mahindra & Mahindra Financial Services Ltd. CRISIL A1+ 0.17Corporate Debt/Financial Institutions - Total 21.66Public Sector Undertakings Andhra Bank CARE A1+ 0.12Public Sector Undertakings - Total 0.12Treasury Bills 91 Days Treasury Bill 27/10/2016 SOV 1.71Treasury Bills - Total 1.71Collateral Borrowing & Lending obligation 0.08Net Current Assets/(Liabilities) 3.14Grand Total 100
PORTFOLIO
INVESTMENT STYLEDEBT SCHEMES
Investment Objective
The primary objective of the Scheme is to generate income through investment primarily in low duration debt & money market securities. However, there is no assurance that the objective of the scheme will be realized.
Allotment Date
March 6, 2008
Fund Manager
Mr. Deepak Agrawal *
Benchmark
CRISIL Liquid Fund
AAUM (` In Crores)
AAUM as on July 31, 2016: ̀ 2,691.51
AUM (` In Crores)
AUM as on July 31, 2016: ̀ 2,878.43
Available Plans/Options
A) Regular B) Direct Plan / Options: Dividend Payout, Dividend Reinvestment & Growth (dividend payout is available under monthly dividend only) (applicable for all plans)
Dividend Frequency
Weekly (every Monday), Monthly (12th of every month)and Normal (as decided by Trustees)
Ratios$Standard Deviation: 0.47%,
Modified Duration: 0.65 yrs,
Portfolio Yield: 8.74% $Source: ICRAMFI Explorer. Standard
Deviation is calculated on Annualised basis using 3 years history of monthly returns.
Minimum Investment Amount
Initial Investment: Plan A - `5000 and in multiple of `1 for purchase and for `0.01 for switches
Additional Investment: `1000 & in multiples of `1 for purchase and for `0.01 for switches.
Ideal Investment Horizon: 1-3 months
Load Structure
Entry Load: Nil.
Exit Load: Nil.
Any exit load charged (net off Service Tax, if any) shall be credited back to the Scheme;
Note - Units issued on reinvestment of dividends shall not be subject to entry and exit load.
Total Expense Ratio**
Regular: 1.00%Direct: 0.25%
**Total Expense Ratio excludes applicable B15 fee and service tax.
Short Medium Long Volatiliy
Low
Medium
High
Maturity
Average Maturity of the portfolio based on total maturity of fixed rate and immediate reset date of floating rate instruments : 0.77 years
Kotak Low Duration Fund NAV as on : `1929.4958 (Retail Plan-Growth Option), `1022.0887 (Retail plan Weekly July 29, 2016Dividend),`1023.5824 (Retail Plan-Monthly Dividend), `1877.5694 (Standard Plan-Growth Option), `1015.9618 (Standard Plan-Weekly Dividend), `1023.3919 (Standard Plan-Monthly Dividend), `1913.4771 (Direct Plan- Growth Option), `1173.0869 (Direct Plan- Weekly Dividend), ̀ 1038.7830 (Direct Plan- Monthly Dividend)
Investors understand that their principal will be at moderate risk
Riskometer
yletaredo
M
Moderate
Low
High
Low
High
LOW HIGH
Moderately
This product is suitable for investors who are seeking*:� Regular income over short term� Income by focusing on low duration securities* Investors should consult their financial advisors if in doubt about whether the product is suitable for them.
PRODUCT LABEL
SECTOR ALLOCATION (%) RATING PROFILE
77.03
15.62
10.85
IND AA+, AA, AA(SO), AA-, BWR AA-
71.72
23.02
* For Fund Manager experience, please refer page 54-55. For scheme performance, please refer page no 44-53. For last three dividends, please refer page no 56-58
(As on July 31, 2016)
73.66
21.29
53.0132.53
14.01
-
A+, A, BWR A(SO)A1+, A1+(SO), AAA, IND A1+, IND AAA, SOVDebentures and Bonds
73.29
21.78
3.14 1.71 0.08
Treasury Bills
59.8220.15
15.933.14 0.88 0.08
Unrated

KOTAK BOND SHORT TERMAn Open - Ended Debt Scheme
Issuer/Instrument Industry/ % to Net Rating Assets
Investment Objective
The investment objective of the Scheme is to provide reasonable returns and high level of liquidity by investing in debt instruments such as bonds , debentures and Government securities; and money market i n s t r u m e n t s s u c h a s t r e a s u r y bills,commercial papers, certificates of deposit, including repos in permitted securities of different maturities, so as to spread the risk across different kinds of issuers in the debt markets. The Scheme may invest in the call money/termmoney market in terms of RBI guidelines in this respect. To reduce the risk of the portfolio, the Scheme may also use various derivative and hedging products from time to time, in the manner permitted by SEBI. Subject to the maximum amount permitted from time to time, the Scheme may invest in offshore securities in the manner allowed by SEBI/RBI, provided such investments are in conformity with the investment objective of the Scheme and the prevailing guidelines and Regulations. However, there is no assurance that the objective of the scheme will be realized.
Allotment Date
May 2, 2002
Fund Manager
Mr. Deepak Agrawal*
Benchmark
Crisil Short - Term Bond Fund
AAUM (` In Crores)
AAUM as on July 31, 2016: ̀ 3,545.65
AUM (` In Crores)
AUM as on July 31, 2016: ̀ 4,025.02
Available Plans/Options
A) Regular Plan
B) Direct Plan/Options: Dividend Payout, Dividend Reinvestment & Growth (applicable for all plans)
Dividend Frequency
Monthly (12th of every Month), Half Yearly (20th of Mar/Sept) and normal (as decided by Trustees)
Ratios$Standard Deviation: 1.26%,
Modified Duration: 2.28yrs,
Portfolio Yield: 7.75%$Source: ICRAMFI Explorer. Standard
Deviation is calculated on Annualised basis using 3 years history of monthly returns.
Minimum Investment Amount
Initial Investment: (i) Dividend Re-investment & Growth - `5000 & above (ii) Dividend Payout (Monthly Dividend) - `50,000 & aboveAdditional Investment: `1000 & in multiples of ̀ 1Ideal Investments Horizon: 6 months & above
Load Structure
Entry Load: Nil. (applicable for all plans)Exit Load: Nil
Total Expense Ratio
Regular: 1.13%; Direct: 0.25%**Total Expense Ratio excludes applicable B15 fee and service tax.
Issuer/Instrument Industry/ % to Net Rating Assets
PORTFOLIO
INVESTMENT STYLE
Short Medium Long Volatiliy
Maturity
Low
Medium
High
DEBT SCHEMES
Average Maturity of the portfolio based on total maturity of fixed rate and immediate reset date of floating rate instruments : 2.84 years.Kotak Bond Short Term Fund NAV as on July 29, 2016: `29.1968 (Growth Option), `29.8857 (Direct Growth Option),`10.1898 (Dividend), ̀ 10.2987 (Direct Dividend), ̀ 10.7525 (Direct Half Yearly Dividend)
23
Investors understand that their principal will be at moderately low risk
Riskometer
yletaredo
M
Moderate
Low
High
Low
High
LOW HIGH
Moderately
This product is suitable for investors who are seeking*:� Income over a medium term horizon� Investment in debt & money market securities* Investors should consult their financial advisors if in doubt about whether the product is suitable for them.
PRODUCT LABEL
DEBT SCHEMES
25
82.73
13.50
71.53
SECTOR ALLOCATION (%)
82.2
14.38
90.59
15.27
82.61
13.08
83.54
13.12
* For Fund Manager experience, please refer page 54-55. For scheme performance, please refer page no 44-53. For last three dividends, please refer page no 56-58
(As on July 31, 2016)
Net Current Assets
71.67
17.32
7.1
96.09
CBLO & Term Deposits & Rev.RepoCBLO & Term Deposits & Rev.Repo
IND AADebentures and Bonds Government Dated Securities
A1+, AAA, AAA(SO), IND AAA, SOV
Debt Instruments
Debentures and Bonds
Corporate Debt/Financial Institutions
Reliance Jio Infocomm Limited CRISIL AAA 9.20
Nabha Power Ltd. ( backed by
unconditional and irrevocable
guarantee by Larsen &
Toubro Ltd ) ICRA AAA 7.71
HDFC Ltd. CRISIL AAA 7
Kotak Mahindra Prime Ltd. CRISIL AAA 6
Dewan Housing Finance
Corporation Ltd. CARE AAA 3.75
ICICI Home Finance Company
Limited ICRA AAA 3.11
HDB Financial Services Ltd. CRISIL AAA 2.95
LIC Housing Finance Ltd. CRISIL AAA 1.82
IOT Utkal Energy Services Ltd. CRISIL AAA(SO) 0.97
Indiabulls Housing Finance Limited CARE AAA 0.62
SP Jammu Udhampur Highway Ltd.
( backed by unconditional and
irrevocable guarantee of Shapoorji
Pallonji & Co Pvt Ltd ) ICRA AAA 0.27
East-North Interconnection
Company Limited CRISIL AAA(SO) 0.13
Bajaj Finance Limited FITCH IND AAA 0.03
Mahindra & Mahindra Financial
Services Ltd. FITCH IND AAA 0.02
Corporate Debt/Financial Institutions - Total 43.58
Public Sector Undertakings
ONGC Manglore
Petrochemicals Ltd. FITCH IND AAA 7.53
Power Finance Corporation Ltd. CRISIL AAA 7.42
Rural Electrification
Corporation Ltd. CRISIL AAA 4.62
National Bank for Agriculture and
Rural Developmen CRISIL AAA 3.84
State Bank Of India. CRISIL AAA 0.89
Steel Authority of India Ltd. FITCH IND AA 0.25
Public Sector Undertakings - Total 24.55
Government Dated Securities
8.53 State Government SOV 4.58
8.26 State Government SOV 3.81
7.59 Central Government SOV 2.55
8.45 State Government SOV 2.44
8.55 State Government SOV 1.03
8.5 State Government SOV 0.77
8.27 State Government SOV 0.76
8.52 State Government SOV 0.39
1.44 Central Government SOV 0.24
Government Dated Securities - Total 16.57
Money Market Instruments
Commercial Paper(CP)/Certificate of Deposits(CD)
Corporate Debt/Financial Institutions
AXIS Bank Ltd. CRISIL A1+ 4.77
IndusInd Bank Ltd. CRISIL A1+ 1.51
Corporate Debt/Financial Institutions - Total 6.28
Public Sector Undertakings
National Bank for Agriculture and
Rural Developmen CRISIL A1+ 0.12
Public Sector Undertakings - Total 0.12
Treasury Bills
182 Treasury Bill 20.10.2016 SOV 3.43
Treasury Bills - Total 3.43
Collateral Borrowing & Lending obligation 2.71
Net Current Assets/(Liabilities) 2.76
Grand Total 100
68.13
16.57
6.403.43 2.76 2.71
Treasury Bills94.28
2.762.71 0.25
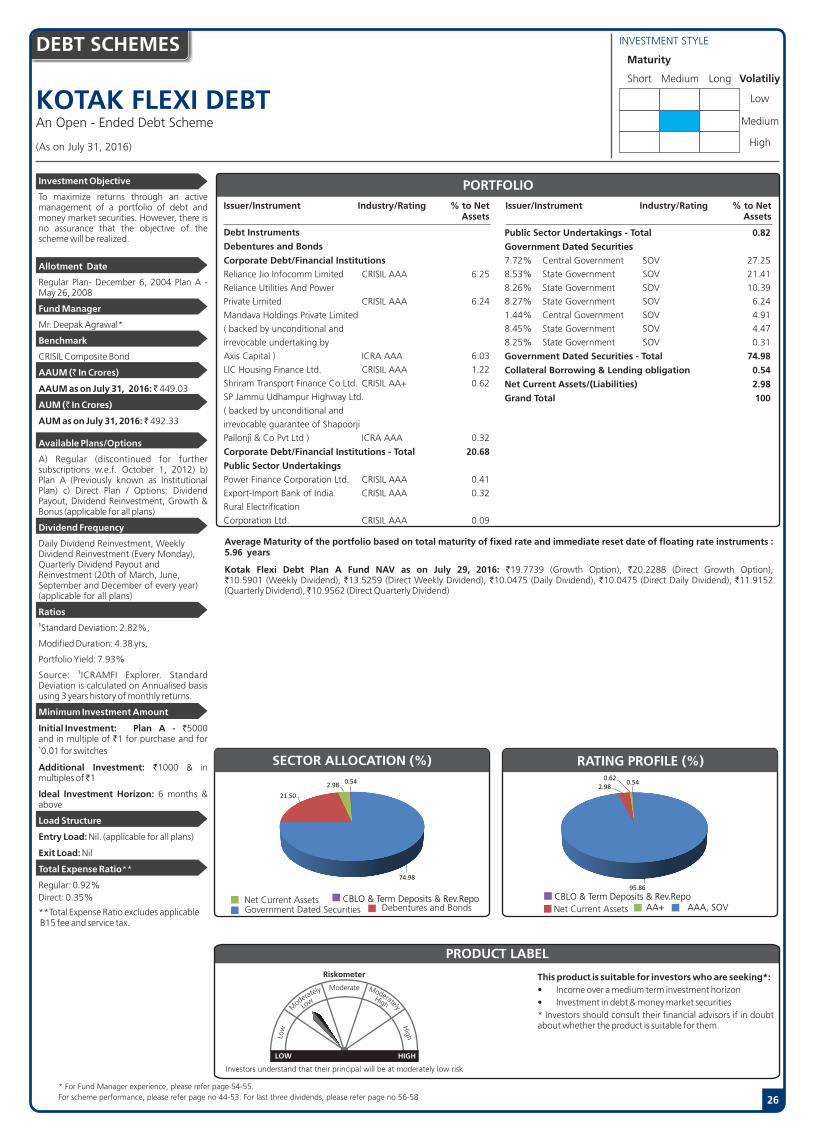
26
KOTAK FLEXI DEBTAn Open - Ended Debt Scheme
Issuer/Instrument Industry/Rating % to Net Assets
Debt Instruments
Debentures and Bonds
Corporate Debt/Financial Institutions
Reliance Jio Infocomm Limited CRISIL AAA 6.25
Reliance Utilities And Power
Private Limited CRISIL AAA 6.24
Mandava Holdings Private Limited
( backed by unconditional and
irrevocable undertaking by
Axis Capital ) ICRA AAA 6.03
LIC Housing Finance Ltd. CRISIL AAA 1.22
Shriram Transport Finance Co Ltd. CRISIL AA+ 0.62
SP Jammu Udhampur Highway Ltd.
( backed by unconditional and
irrevocable guarantee of Shapoorji
Pallonji & Co Pvt Ltd ) ICRA AAA 0.32
Corporate Debt/Financial Institutions - Total 20.68
Public Sector Undertakings
Power Finance Corporation Ltd. CRISIL AAA 0.41
Export-Import Bank of India. CRISIL AAA 0.32
Rural Electrification
Corporation Ltd. CRISIL AAA 0.09
Issuer/Instrument Industry/Rating % to Net Assets
Public Sector Undertakings - Total 0.82
Government Dated Securities
7.72% Central Government SOV 27.25
8.53% State Government SOV 21.41
8.26% State Government SOV 10.39
8.27% State Government SOV 6.24
1.44% Central Government SOV 4.91
8.45% State Government SOV 4.47
8.25% State Government SOV 0.31
Government Dated Securities - Total 74.98
Collateral Borrowing & Lending obligation 0.54
Net Current Assets/(Liabilities) 2.98
Grand Total 100
PORTFOLIO
INVESTMENT STYLEDEBT SCHEMES
Investment Objective
To maximize returns through an active management of a portfolio of debt and money market securities. However, there is no assurance that the objective of the scheme will be realized.
Allotment Date
Regular Plan- December 6, 2004 Plan A - May 26, 2008
Fund Manager
Mr. Deepak Agrawal*
Benchmark
CRISIL Composite Bond
AAUM (` In Crores)
AAUM as on July 31, 2016: ̀ 449.03
AUM (` In Crores)
AUM as on July 31, 2016: ̀ 492.33
Available Plans/Options
A) Regular (discontinued for further subscriptions w.e.f. October 1, 2012) b) Plan A (Previously known as Institutional Plan) c) Direct Plan / Options: Dividend Payout, Dividend Reinvestment, Growth & Bonus (applicable for all plans)
Dividend Frequency
Daily Dividend Reinvestment, Weekly Dividend Reinvestment (Every Monday), Quarterly Dividend Payout and Reinvestment (20th of March, June, September and December of every year) (applicable for all plans)
Ratios$Standard Deviation: 2.82%,
Modified Duration: 4.38 yrs,
Portfolio Yield: 7.93% $Source: ICRAMFI Explorer. Standard
Deviation is calculated on Annualised basis using 3 years history of monthly returns.
Minimum Investment Amount
Initial Investment: Plan A - `5000 and in multiple of `1 for purchase and for `0.01 for switches
Additional Investment: `1000 & in multiples of ̀ 1
Ideal Investment Horizon: 6 months & above
Load Structure
Entry Load: Nil. (applicable for all plans)
Exit Load: Nil
Total Expense Ratio**
Regular: 0.92%Direct: 0.35%
**Total Expense Ratio excludes applicable B15 fee and service tax.
Short Medium Long Volatiliy
Low
Medium
High
Maturity
Average Maturity of the portfolio based on total maturity of fixed rate and immediate reset date of floating rate instruments : 5.96 years
Kotak Flexi Debt Plan A Fund NAV as on July 29, 2016: `19.7739 (Growth Option), `20.2288 (Direct Growth Option),`10.5901 (Weekly Dividend), `13.5259 (Direct Weekly Dividend), `10.0475 (Daily Dividend), `10.0475 (Direct Daily Dividend), `11.9152 (Quarterly Dividend), ̀ 10.9562 (Direct Quarterly Dividend)
Investors understand that their principal will be at moderately low risk
Riskometer
yletaredo
M
Moderate
Low
High
Low
High
LOW HIGH
Moderately
This product is suitable for investors who are seeking*:� Income over a medium term investment horizon� Investment in debt & money market securities* Investors should consult their financial advisors if in doubt about whether the product is suitable for them.
PRODUCT LABEL
RATING PROFILESECTOR ALLOCATION (%)
CBLO & Term Deposits & Rev.RepoNet Current AssetsGovernment Dated Securities Debentures and Bonds Net Current Assets
66.54
23.82
7.91
* For Fund Manager experience, please refer page 54-55. For scheme performance, please refer page no 44-53. For last three dividends, please refer page no 56-58
(As on July 31, 2016)
47.12
44.11
7.00
CBLO & Term Deposits & Rev.RepoAA+ AAA, SOV
74.98
21.50
2.980.54
95.86
2.98
0.620.54

KOTAK INCOME OPPORTUNITIES FUNDAn Open - Ended Debt Scheme
Investment Objective
The investment objective of the scheme is to generate income by investing in debt /and money market securities across the yield curve and credit spectrum. The scheme would also seek to maintain reasonable liquidity within the fund. However, there is no assurance that the objective of the scheme will be realized.
Allotment Date
May 11, 2010
Fund Managers
Mr. Deepak Agrawal*
Benchmark
Crisil Short Term Bond Fund
AAUM (` In Crores)
AAUM as on July 31, 2016: ̀ 1,945.59
AUM (` In Crores)
AUM as on July 31, 2016: ̀ 2,051.50
Available Plans/Options
A) Regular Plan
B) Direct Plan/Options: Dividend Payout, Dividend Reinvestment & Growth (applicable for all plans)
Dividend Frequency
Weekly (Every Monday), Monthly (12th of every Month), Quarterly (20th of Mar, Jun, Sep and Dec of every Year), Annual (12th of March).
Ratios$Standard Deviation: 1.14%,
Modified Duration: 2.27yrs,
Portfolio Yield: 9.67%$Source: ICRAMFI Explorer. Standard
Deviation is calculated on Annualised basis using 3 years history of monthly returns.
Minimum Investment Amount
Initial Investment: `5000 and in multiple of `1 for purchase and for `0.01 for switches
Additional Investment: `1000 & in multiples of ̀ 1
Ideal Investments Horizon: 1 year & above
Load Structure
Entry Load: Nil. (applicable for all plans)
Exit Load: I) For redemption / switch out of upto 10% of the initial investment amount (limit) purchased or switched in within 1 year from the date of allotment: Nil.
II) If units redeemed or switched out are in excess of the limit within 1 year from the date of allotment: 1%.
iii) If units are redeemed or switched out on or after 1 year from the date of allotment: Nil.
iv) Any exit load charged (net off Service Tax, if any) shall be credited back to the respective Scheme. Units issued on reinvestment of dividends shall not be subject to entry and exit load.
Total Expense Ratio**
Regular: 1.60%Direct:0.60%
**Total Expense Ratio excludes applicable B15 fee and service tax.
INVESTMENT STYLEDEBT SCHEMES
27
Issuer/Instrument Industry/ % to Net Rating Assets
Debt Instruments Debentures and Bonds Corporate Debt/Financial Institutions Reliance Jio Infocomm Limited CRISIL AAA 9.26HPCL Mittal Pipelines Ltd. ICRA AA- 8.97HPCL Mittal Energy Ltd. ICRA AA- 7.21DLF Emporio Ltd CRISIL AA 5.04Sterlite Industries (India) Ltd CRISIL AA- 5.04Janalakshami Financial Services Ltd. ICRA A+ 4.99Au Financiers (India) Limited FITCH IND A+ 4.93Piramal Enterprises Limited ICRA AA 4.42Prestige Estates Projects Limited ICRA A+ 3.68Bharti enterprises (Holding) Pvt. Ltd. CRISIL A1+ 3.66Karelides Traders Private Ltd. ( backed by unconditional and irrevocable undertaking by a wholly owned subsidiary of Piramal Enterprises Ltd ) ICRA AA- 3.65India Infoline Housing Finance Ltd. ICRA AA 2.44Edelweiss Agri Value Chain Limited ( ) CARE AA(SO) 2.43SBK Properties Pvt Ltd. ( Guaranteed by a Kalyani Group company ) ICRA AA- 2.09Equitas Micro Finance Ltd. CARE A+ 1.97Adani Power Ltd ( Secured by Equity shares of Adani Ports and SEZ Ltd ) BRICKWORK BWR AA- 1.84Dalmia Bharat Ltd ICRA AA- 1.63ECL Finance Limited ICRA AA 1.46SP Jammu Udhampur Highway Ltd. ( backed by unconditional and irrevocable guarantee of Shapoorji Pallonji & Co Pvt Ltd ) ICRA AAA 1.25Shriram Transport Finance Co Ltd. FITCH IND AA+ 1.22ECL Finance Limited CARE AA 0.98Peninsula Land Limited ICRA A 0.94Haldhar Developers Private Limited ( backed by unconditional and irrevocable undertaking by Piramal ) ICRA LAA-(SO) 0.80
Issuer/Instrument Industry/ % to Net Rating Assets
Indostar Capital Finance Private Limited CARE AA- 0.79Continental Drug Company P Ltd ( Secured by Equity shares of Zee Entertainment Enterprises Ltd ) BRICKWORK BWR A+ 0.70Mandava Holdings Private Limited ( backed by unconditional and irrevocable undertaking by Axis Capital ) ICRA AAA 0.49Hero Realty Ltd ( Guaranteed by a Hero Group company ) ICRA A+ 0.25Tata Capital Housing Finance Ltd; CRISIL AA+ 0.08HDFC Ltd. CRISIL AAA 0.06LIC Housing Finance Ltd. CRISIL AAA 0.04HDB Financial Services Ltd. CRISIL AAA 0.02Corporate Debt/Financial Institutions - Total 82.33Public Sector Undertakings Bank of India CRISIL A+ 1.98Indian Overseas Bank CARE CARE BBB 1.64Syndicate Bank CARE AA- 1.22Bank of India BRICKWORK BWR AA- 0.46Public Sector Undertakings - Total 5.30Money Market Instruments Commercial Paper(CP)/Certificate of Deposits(CD) Corporate Debt/Financial Institutions Suraksha Reality Ltd ( Secured by Equity shares of Sun PharmaceuticalsIndustries Ltd ) CARE A1+ 7.21Manappuram Finance Ltd CRISIL A1+ 2.27Corporate Debt/Financial Institutions - Total 9.48Net Current Assets/(Liabilities) 2.89Grand Total 100
PORTFOLIO
Short Medium Long Volatiliy
Maturity
Low
Medium
High
Average Maturity of the portfolio based on total maturity of fixed rate and immediate reset date of floating rate instruments : 2.84 years.
Kotak Income Opportunities Fund NAV as on July 29, 2016: `16.8973 (Growth Option), `17.4595 (Direct Growth Option),`10.0450 (Weekly Dividend), `10.2131 (Direct Weekly Dividend), `10.2707 (Monthly Dividend), `10.4076 (Direct Monthly Dividend), `10.8182 (Quarterly Dividend), ̀ 10.6399 (Annual Dividend), ̀ 13.1139 (Direct Annual).
Investors understand that their principal will be at moderately low risk
Riskometer
yletaredo
M
Moderate
Low
High
Low
High
LOW HIGH
Moderately
This product is suitable for investors who are seeking*:� Income over a medium term investment horizon� Investment in debt & money market securities* Investors should consult their financial advisors if in doubt about whether the product is suitable for them.
PRODUCT LABEL
SECTOR ALLOCATION (%)
A+, BWR A+, IND A+, AA1+, AAA Net Current Assets
Debentures and Bonds
51.18
30.63
14.06
* For Fund Manager experience, please refer page 54-55. For scheme performance, please refer page no 44-53. For last three dividends, please refer page no 56-58
(As on July 31, 2016)
CARE BBBCommercial Paper (CP)/Certificate of Deposits (CD)
AA+, IND AA+, AA, AA(SO), AA-, BWR AA-, LAA-(SO)Net Current Assets
87.63
9.482.89
51.7724.26
19.442.89 1.64

51.12 28.83
18.15
Net Current AssetsCBLO & Term Deposits & Rev.RepoAA+, AA, IND AA
28
KOTAK CORPORATE BOND FUND(Formerly known as PineBridge India Total Return Bond Fund)An Open - Ended Debt Scheme
Issuer/Instrument Industry/Rating % to Net Assets
Debt Instruments
Debentures and Bonds
Corporate Debt/Financial Institutions Bajaj Finance Limited FITCH IND AAA 6.71HDFC Ltd. CRISIL AAA 6.34SP Jammu Udhampur Highway Ltd. ( backed by unconditional and irrevocable guarantee of Shapoorji Pallonji & Co Pvt Ltd ) ICRA AAA 5.22Reliance Ports And Terminals Limited CRISIL AAA 5.19Nabha Power Ltd. ( backed by unconditional and irrevocable guarantee by Larsen & Toubro Ltd ) ICRA AAA(SO) 4.50IOT Utkal Energy Services Ltd. CRISIL AAA(SO) 4.24Nabha Power Ltd. ( backed by unconditional and irrevocable guarantee by Larsen & Toubro Ltd ) ICRA AAA 3.72Reliance Jio Infocomm Limited CRISIL AAA 3.72Shriram Transport Finance Co Ltd. CRISIL AA+ 1.50Ultratech Cement Ltd. CRISIL AAA 1.35Inox Air Products Ltd. CRISIL AA 0.74Mahindra & Mahindra Financial Services Ltd. ICRA AAA 0.74Corporate Debt/Financial Institutions - Total 43.97Public Sector Undertakings Power Finance Corporation Ltd. CRISIL AAA 8.70Small Industries Development
Issuer/Instrument Industry/Rating % to Net Assets
Bank Of India. CARE AAA 7.40ONGC Manglore Petrochemicals Ltd. FITCH IND AAA 6.74Powergrid Vizag Transminssion Ltd. ( backed by unconditional and irrevocable guarantee by Powergrid Corp ) CRISIL AAA(SO) 5.32Rural Electrification Corporation Ltd. CRISIL AAA 4.53Export-Import Bank of India. CRISIL AAA 1.31Airports Authority of India CRISIL AAA 0.75National Bank for Agriculture and Rural Developmen CRISIL AAA 0.73Steel Authority of India Ltd. FITCH IND AA 0.60Public Sector Undertakings - Total 36.08Money Market Instruments Commercial Paper(CP)/Certificate of Deposits(CD) Corporate Debt/Financial Institutions AXIS Bank Ltd. CRISIL A1+ 1.45Corporate Debt/Financial Institutions - Total 1.45Collateral Borrowing & Lending obligation 13.81Net Current Assets/(Liabilities) 4.69Grand Total 100
PORTFOLIO
INVESTMENT STYLEDEBT SCHEMES
Investment Objective
The primary objective of the Scheme is to generate income through investment primarily in low duration debt & money market securities. However, there is no assurance that the objective of the scheme will be realized.
Allotment Date
September 21, 2007
Fund Manager
Mr. Deepak Agrawal*
Benchmark
CRISIL Composite Bond Fund
AAUM (` In Crores)
AAUM as on July 31, 2016: ̀ 132.47
AUM (` In Crores)
AUM as on July 31, 2016: ̀ 135.78
Available Plans/Options
Plans: a) Regular & b) Direct Plan
Options: Dividend Payout, Dividend Reinvestment and Growth (applicable for all plans)
Dividend Frequency
Monthly (12th of every Month), Quarterly (20th of Mar, Jun, Sep and Dec of every Year)
Ratios$Standard Deviation: 1.19%,
Modified Duration: 1.72 yrs,
Portfolio Yield: 7.52% $Source: ICRAMFI Explorer.
Standard Deviation is calculated on Annualised basis using 3 years history of monthly returns.
Minimum Investment Amount
Initial Investment: `5000 and in multiple of `1 for purchase and for `0.01 for switches
Additional Investment: `1000 & in multiples of `1for purchase and for `0.01 for switches.
Ideal Investment Horizon: 1 Year & Above
Load Structure
Entry Load: Nil. (applicable for all plans)
Exit Load: Nil
Total Expense Ratio**
Regular: 0.50%Direct: 0.30%
**Total Expense Ratio excludes applicable B15 fee and service tax.
Short Medium Long Volatiliy
Low
Medium
High
Maturity
Average Maturity of the portfolio based on total maturity of fixed rate and immediate reset date of floating rate instruments : 2.10 years
Kotak Corporate Bond Fund NAV as on July 29, 2016: `2021.5261 (Standard Plan-Growth Option), `1175.5998 (Standard Plan-Weekly Dividend),`1045.1731 (Standard Plan-Monthly Dividend), ̀ 1061.4564 (Standard Plan-Quarterly Dividend), ̀ 1058.0264 (Standard Plan-Daily Dividend), `1988.5335 (Retail Plan-Growth Option), `1057.599 (Retail Plan- Weekly Dividend), `1045.3074 (Retail Plan- Monthly Dividend), `1057.9164 (Retail Plan-Daily Dividend), ̀ 2053.4479 (Direct Plan- Growth Option), ̀ 1092.7141 (Direct Plan- Monthly Dividend), ̀ 2042.8239 (Institutional Plan-Growth Option)
Investors understand that their principal will be at moderately low risk
Riskometer
yletaredo
M
Moderate
Low
High
Low
High
LOW HIGH
Moderately
This product is suitable for investors who are seeking*:� Regular income over short term� Income by investing in fixed income securities of varying
maturities & credit* Investors should consult their financial advisors if in doubt about whether the product is suitable for them.
PRODUCT LABEL
79.95
18.15
80.6
14.68
47.37
33.23
14.68
* For Fund Manager experience, please refer page 54-55. For scheme performance, please refer page no 44-53. For last three dividends, please refer page no 56-58
(As on July 31, 2016)
73.15
11.71
8.08
7.06
Debentures and BondsA1+, AAA, AAA(SO), IND AAACommercial Paper (CP)/Certificate of Deposits (CD)
CBLO & Term Deposits & Rev.RepoNet Current Assets
80.05
13.81
4.69 1.45
78.66
13.81
4.69 2.84

29
KOTAK MEDIUM TERM FUNDAn Open - Ended Debt Scheme
Issuer/Instrument Industry/Rating % to Net Assets
Debt Instruments Debentures and Bonds Corporate Debt/Financial Institutions Reliance Jio Infocomm Limited CRISIL AAA 9.60HPCL Mittal Energy Ltd. ICRA AA- 8.22Piramal Enterprises Limited ICRA AA 6.79HPCL Mittal Pipelines Ltd. ICRA AA- 5.38Prestige Estates Projects Limited ICRA A+ 4.68ECL Finance Limited CARE AA 3.74India Infoline Housing Finance Ltd. ICRA AA 3.72Ashirvad Microfinance Private Limited ( 85 subsidiary of Manappuram Finance Ltd ) CARE A- 3.11SBK Properties Pvt Ltd. ( Guaranteed by a Kalyani Group company ) ICRA AA- 3.03Edelweiss Agri Value Chain Limited ( ) CARE AA(SO) 3.02Reliance Utilities And Power Private Limited CRISIL AAA 2.53Janalakshami Financial Services Ltd. ICRA
A+ 2.51Intime Properties Ltd. FITCH IND AAA 2.38Camden Industries Ltd. ( backed by unconditional and irrevocable undertaking of Axis Capital ) CARE AAA(SO) 2.37Equitas Micro Finance Ltd. CARE A+ 2.19ECL Finance Limited ICRA AA 2.17Peninsula Land Limited ICRA A 2.11Dalmia Bharat Ltd ICRA AA- 2.07Au Financiers (India) Limited FITCH IND A+ 1.60Manappuram Finance Ltd CRISIL AA- 1.58East-North Interconnection Company Limited CRISIL AAA(SO) 1.56Grand View Estate Pvt Ltd ( backed by unconditional and irrevocable guarantee of Shapoorji Pallonji & Co Pvt Ltd ) ICRA AA 1.37Shriram Transport Finance Co Ltd. FITCH IND AA+ 1.24Sterlite Industries (India) Ltd CRISIL AA- 1.22Adani Power Ltd ( Secured by Equity shares of Adani Ports and SEZ Ltd ) BRICKWORK BWR AA- 1.17Reliance Ports And Terminals Limited CRISIL AAA 0.81Haldhar Developers Private Limited
Issuer/Instrument Industry/Rating % to Net Assets
( backed by unconditional and irrevocable undertaking by Piramal ) ICRA LAA-(SO) 0.78Nabha Power Ltd. ( backed by unconditional and irrevocable guarantee by Larsen & Toubro Ltd ) ICRA AAA 0.62SP Jammu Udhampur Highway Ltd. ( backed by unconditional and irrevocable guarantee of Shapoorji Pallonji & Co Pvt Ltd ) ICRA AAA 0.58IOT Utkal Energy Services Ltd. CRISIL AAA(SO) 0.54Mandava Holdings Private Limited ( backed by unconditional and irrevocable undertaking by Axis Capital ) ICRA AAA 0.47Tata Power Company Ltd. CRISIL AA- 0.18IOT Utkal Energy Services Ltd. CRISIL AAA 0.02Corporate Debt/Financial Institutions - Total 83.36Public Sector Undertakings Bank of India CRISIL A+ 3.14Power Finance Corporation Ltd. CRISIL AAA 2Syndicate Bank CARE AA- 1.55Bank of India BRICKWORK BWR AA- 1.35ONGC Manglore Petrochemicals Ltd. FITCH IND AAA 0.94State Bank of Travancore CRISIL AAA 0.70Rural Electrification Corporation Ltd. CRISIL AAA 0.34PNB Housing Finance Ltd. CARE AAA 0.31Public Sector Undertakings - Total 10.33Government Dated Securities 1.44% Central Government SOV 0.90Government Dated Securities - Total 0.90Money Market Instruments Commercial Paper(CP)/Certificate of Deposits(CD) Corporate Debt/Financial Institutions ICICI Bank Ltd. CRISIL A1+ 0.87Corporate Debt/Financial Institutions - Total 0.87Collateral Borrowing & Lending obligation 1.99Net Current Assets/(Liabilities) 2.55Grand Total 100
PORTFOLIO
INVESTMENT STYLEDEBT SCHEMES
Investment Objective
The investment objective of the scheme is to generate regular income and capital appreciation by investing in a portfolio of medium term debt and money market instruments. However, there is no assurance that the objective of the scheme will be realized.
Allotment Date
March 21, 2014
Fund Manager
Mr. Deepak Agrawal*
Benchmark
CRISIL Composite Bond Fund
AAUM (` In Crores)
AAUM as on July 31, 2016: ̀ 1,556.98
AUM (` In Crores)
AUM as on July 31, 2016: ̀ 1,616.63
Available Plans/Options
A) Regular Plan
B) Direct Plan/Options: Dividend Payout, Dividend Reinvestment & Growth (applicable for all plans)
Dividend Frequency
Quarterly (20th of Mar, Jun, Sep and Dec of every Year), Annually (12th of March)
Ratios$Standard Deviation: 1.53%,
Modified Duration: 2.61yrs,
Portfolio Yield: 9.68%$Source: ICRAMFI Explorer. Standard
Deviation is calculated on Annualised basis using 3 years history of monthly returns.
Minimum Investment Amount
Initial Purchase: `5,000/- and in multiples of 1 for purchases and for `0.01 for switches.
Additional Purchase: `1000 & in multiples of ̀ 1.for purchases and for ̀ 0.01 for switches.
Ideal Investment Horizon: 2.5 years & above
Load Structure
Entry Load: Nil. (applicable for all plans)
Exit Load: i) For redemption / switch out of upto 15% of the initial investment amount (limit) purchased or switched in within 18 months from the date of allotment: Nil.
ii) If units redeemed or switched out are in excess of the limit within 18 months from the date of allotment: 2%.
iii) If units are redeemed or switched out on or after 18 months from the date of allotment: Nil.
iv) Any exit load charged (net off Service Tax, if any) shall be credited back to the respective Scheme. Units issued on reinvestment of dividends shall not be subject to entry and exit load.
Total Expense Ratio**
Regular: 1.70%Direct: 0.60%
**Total Expense Ratio excludes applicable B15 fee and service tax.
Short Medium Long Volatiliy
Low
Medium
High
Maturity
Average Maturity of the portfolio based on total maturity of fixed rate and immediate reset date of floating rate instruments : 3.36 years
Kotak Medium Term Fund NAV as on July 29, 2016: `12.7488 (Growth Option), `13.0493 (Direct Growth Option),`10.5646 (Quarterly Dividend), ̀ 10.5939 (Direct Quarterly Dividend), ̀ 10.7281 (Annual Dividend), ̀ 13.0806 (Direct Annual).
Investors understand that their principal will be at moderate risk
Riskometer
yletaredo
M
Moderate
Low
High
Low
High
LOW HIGH
Moderately
This product is suitable for investors who are seeking*:� Income over a medium term investment horizon� Investment in debt, government securities & money
market instruments with a portfolio weighted average maturity between 3-7 years
* Investors should consult their financial advisors if in doubt about whether the product is suitable for them.
PRODUCT LABEL
RATING PROFILE
A1+(SO), AAA, AAA(SO), IND AAA, SOVCBLO & Term Deposits & Rev.RepoNet Current AssetsGovernment Dated Securities
Debentures and BondsNet Current Assets
92.87
36.52
35.45
24
* For Fund Manager experience, please refer page 54-55. For scheme performance, please refer page no 44-53. For last three dividends, please refer page no 56-58
(As on July 31, 2016)
35.79
34.51
23.24
A+, IND A+, A, A-CBLO & Term Deposits & Rev.RepoCommercial Paper (CP)/Certificate of Deposits (CD)
IND AA+, AA, AA(SO), AA-, BWR AA-, LAA-(SO)93.69
2.55
1.990.90 0.87
48.58
27.54
19.342.55 1.99

KOTAK BONDAn Open - Ended Debt Scheme
Investment Objective
To create a portfolio of debt and money market instruments of different maturities so as to spread the risk across a wide maturity horizon & different kinds of issuers in the debt market. However, there is no assurance that the objective of the scheme will be realized.
Allotment Date
November 25, 1999
Fund Manager
Mr. Abhishek Bisen*
Benchmark
Crisil Composite Bond Fund
AAUM (` In Crores)
AAUM as on July 31, 2016: ` 4,121.54
AUM (` In Crores)
AUM as on July 31, 2016: ` 4,148.69
Available Plans/Options
A) Deposit (discontinued for further subscriptions w.e.f. October 1, 2012)
B) Plan A (Previously known as Regular Plan)
C) Direct Plan / Options: Dividend Payout, Dividend Reinvestment & Growth (applicable for all plans)
Dividend Frequency
Quarterly (20th of Mar/Jun/Sep/Dec), Half Yearly (20th of Mar/Sept), Annual (12th of Mar) (applicable for all plans)
Ratios$Standard Deviation: 4.60%
Modified Duration: 7.40 yrs
Portfolio Yield: 7.69%$Source: ICRAMFI Explorer. Standard
Deviation is calculated on Annualised basis using 3 years history of monthly returns.
Minimum Investment Amount
Initial Investment: Plan A `5000 and in multiple of `1 for purchase and for `0.01 for switches
Additional Investment: `1000 & in multiples of ̀ 1
Ideal Investments Horizon: 1 year & above
Load Structure
Entry Load: Nil. (applicable for all plans)
Exit Load: Nil.
Note - Units issued on reinvestment of dividends shall not be subject to exit load (applicable for all plans)
Total Expense Ratio**
Regular: 1.77%Direct: 0.97%
**Total Expense Ratio excludes applicable B15 fee and service tax.
DEBT SCHEMES
30
Issuer/Instrument Industry/ % to Net Rating Assets
Debt Instruments Debentures and Bonds Corporate Debt/Financial Institutions Bajaj Finance Limited CARE AAA 2.41East-North Interconnection Company Limited CRISIL AAA(SO) 0.81Shriram Transport Finance Co Ltd. CRISIL AA+ 0.48HDFC Ltd. CRISIL AAA 0.02Corporate Debt/Financial Institutions - Total 3.72Public Sector Undertakings Canara Bank CRISIL AAA 5.55Bank of India BRICKWORK BWR AA- 1.28Bank of India CRISIL A+ 0.98Syndicate Bank CARE AA- 0.97
PORTFOLIO
INVESTMENT STYLE
Short Medium Long Volatiliy
Maturity
Low
Medium
High
Average Maturity of the portfolio based on total maturity of fixed rate and immediate reset date of floating rate instruments : 12.12 years.Kotak Bond Plan A Fund NAV as on July 29, 2016: `44.5439 (Growth Option), `45.6994 (Direct Growth Option),`11.4930 (Quarterly Dividend), `12.3678 (Direct Quarterly Dividend), `27.2908 (Annual Dividend), `23.0364 (Direct Annual Dividend), `29.6928 (Plan A-Bonus Plan), ̀ 13.2107 (Kotak-Bond Deposit Deposit Dividend)
Investors understand that their principal will be at moderate risk
Riskometer
yletaredo
M
Moderate
Low
High
Low
High
LOW HIGH
Moderately
This product is suitable for investors who are seeking*:� Income over long term investment horizon� Investment in debt & money market securities* Investors should consult their financial advisors if in doubt about whether the product is suitable for them.
PRODUCT LABEL
SECTOR ALLOCATION (%)
* For Fund Manager experience, please refer page 54-55. For scheme performance, please refer page no 44-53. For last three dividends, please refer page no 56-58
(As on July 31, 2016)
AA+, AA-, BWR AA-Net Current AssetsGovernment Dated SecuritiesDebentures and Bonds
Net Current Assets
92.87
36.52
35.45
2435.79
34.51
23.24
A+AAA, AAA(SO), SOV
85.13
12.502.37
93.92
2.732.37 0.98
Issuer/Instrument Industry/ % to Net Rating Assets
Public Sector Undertakings - Total 8.78Government Dated Securities 7.59% Central Government SOV 35.107.73% Central Government SOV 23.597.61% Central Government SOV 11.838.27% State Government SOV 6.848.15% State Government SOV 1.758.19% State Government SOV 1.518.33% State Government SOV 1.518.29% State Government SOV 1.268.45% State Government SOV 1.248.53% State Government SOV 0.50Government Dated Securities - Total 85.13Net Current Assets/(Liabilities) 2.37Grand Total 100
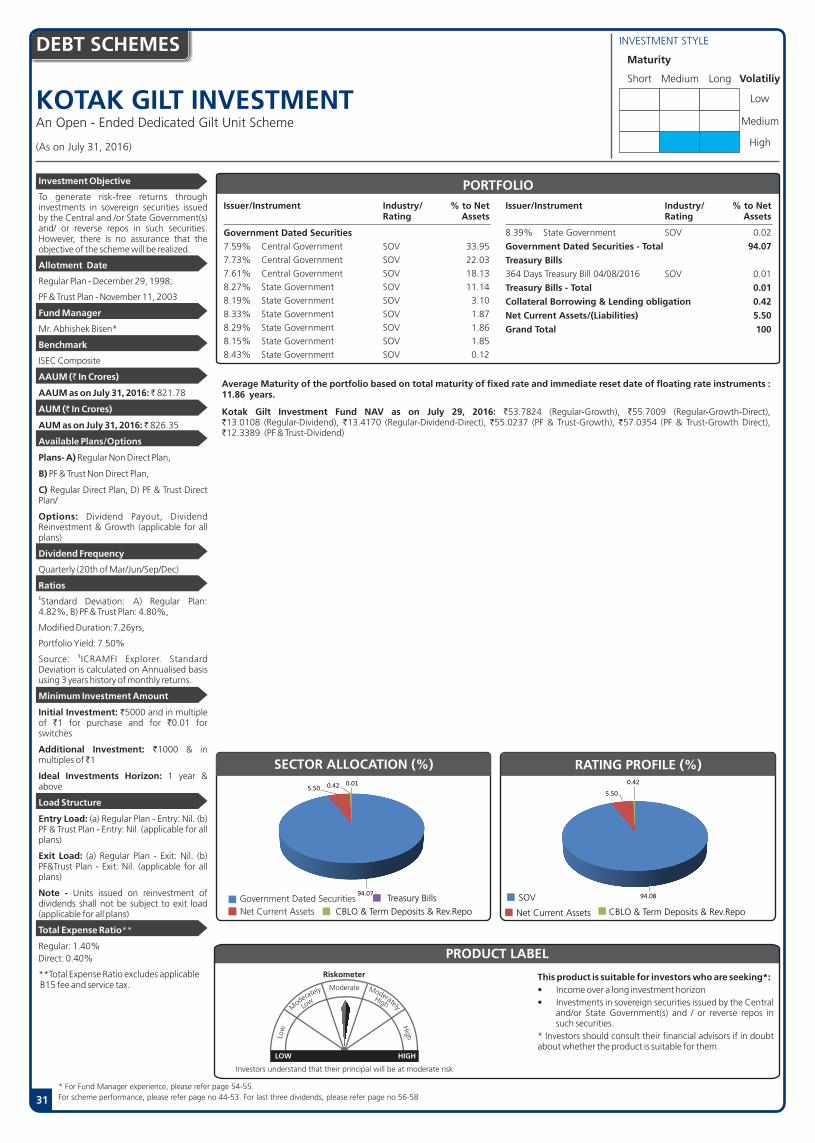
KOTAK GILT INVESTMENTAn Open - Ended Dedicated Gilt Unit Scheme
Investment Objective
To generate risk-free returns through investments in sovereign securities issued by the Central and /or State Government(s) and/ or reverse repos in such securities. However, there is no assurance that the objective of the scheme will be realized.
Allotment Date
Regular Plan - December 29, 1998;
PF & Trust Plan - November 11, 2003
Fund Manager
Mr. Abhishek Bisen*
Benchmark
ISEC Composite
AAUM (` In Crores)
AAUM as on July 31, 2016: ̀ 821.78
AUM (` In Crores)
AUM as on July 31, 2016: ̀ 826.35
Available Plans/Options
Plans- A) Regular Non Direct Plan,
B) PF & Trust Non Direct Plan,
C) Regular Direct Plan, D) PF & Trust Direct Plan/
Options: Dividend Payout, Dividend Reinvestment & Growth (applicable for all plans)
Dividend Frequency
Quarterly (20th of Mar/Jun/Sep/Dec)
Ratios$Standard Deviation: A) Regular Plan: 4.82%, B) PF & Trust Plan: 4.80%,
Modified Duration:7.26yrs,
Portfolio Yield: 7.50%$Source: ICRAMFI Explorer. Standard
Deviation is calculated on Annualised basis using 3 years history of monthly returns.
Minimum Investment Amount
Initial Investment: `5000 and in multiple of `1 for purchase and for `0.01 for switches
Additional Investment: `1000 & in multiples of ̀ 1
Ideal Investments Horizon: 1 year & above
Load Structure
Entry Load: (a) Regular Plan - Entry: Nil. (b) PF & Trust Plan - Entry: Nil. (applicable for all plans)
Exit Load: (a) Regular Plan - Exit: Nil. (b) PF&Trust Plan - Exit: Nil. (applicable for all plans)
Note - Units issued on reinvestment of dividends shall not be subject to exit load (applicable for all plans)
Total Expense Ratio**
Regular: 1.40%Direct: 0.40%
**Total Expense Ratio excludes applicable B15 fee and service tax.
23
INVESTMENT STYLE
Short Medium Long Volatiliy
Maturity
Low
Medium
High
PORTFOLIOIssuer/Instrument Industry/ % to Net Rating Assets
Government Dated Securities
7.59% Central Government SOV 33.95
7.73% Central Government SOV 22.03
7.61% Central Government SOV 18.13
8.27% State Government SOV 11.14
8.19% State Government SOV 3.10
8.33% State Government SOV 1.87
8.29% State Government SOV 1.86
8.15% State Government SOV 1.85
8.43% State Government SOV 0.12
Issuer/Instrument Industry/ % to Net Rating Assets
8.39% State Government SOV 0.02
Government Dated Securities - Total 94.07
Treasury Bills
364 Days Treasury Bill 04/08/2016 SOV 0.01
Treasury Bills - Total 0.01
Collateral Borrowing & Lending obligation 0.42
Net Current Assets/(Liabilities) 5.50
Grand Total 100
DEBT SCHEMES
Average Maturity of the portfolio based on total maturity of fixed rate and immediate reset date of floating rate instruments : 11.86 years.
Kotak Gilt Investment Fund NAV as on July 29, 2016: `53.7824 (Regular-Growth), `55.7009 (Regular-Growth-Direct),`13.0108 (Regular-Dividend), `13.4170 (Regular-Dividend-Direct), `55.0237 (PF & Trust-Growth), `57.0354 (PF & Trust-Growth Direct), `12.3389 (PF & Trust-Dividend)
Investors understand that their principal will be at moderate risk
Riskometer
yletaredo
M
Moderate
Low
High
Low
High
LOW HIGH
Moderately
This product is suitable for investors who are seeking*:� Income over a long investment horizon� Investments in sovereign securities issued by the Central
and/or State Government(s) and / or reverse repos in such securities.
* Investors should consult their financial advisors if in doubt about whether the product is suitable for them.
PRODUCT LABEL
SECTOR ALLOCATION (%)
Net Current Assets
SOV
31* For Fund Manager experience, please refer page 54-55. For scheme performance, please refer page no 44-53. For last three dividends, please refer page no 56-58
(As on July 31, 2016)
92.57
CBLO & Term Deposits & Rev.Repo CBLO & Term Deposits & Rev.Repo
80.89
12.846.27
80.89
12.846.27
Treasury Bills94.07
5.50 0.42 0.01
94.08
5.50
0.42
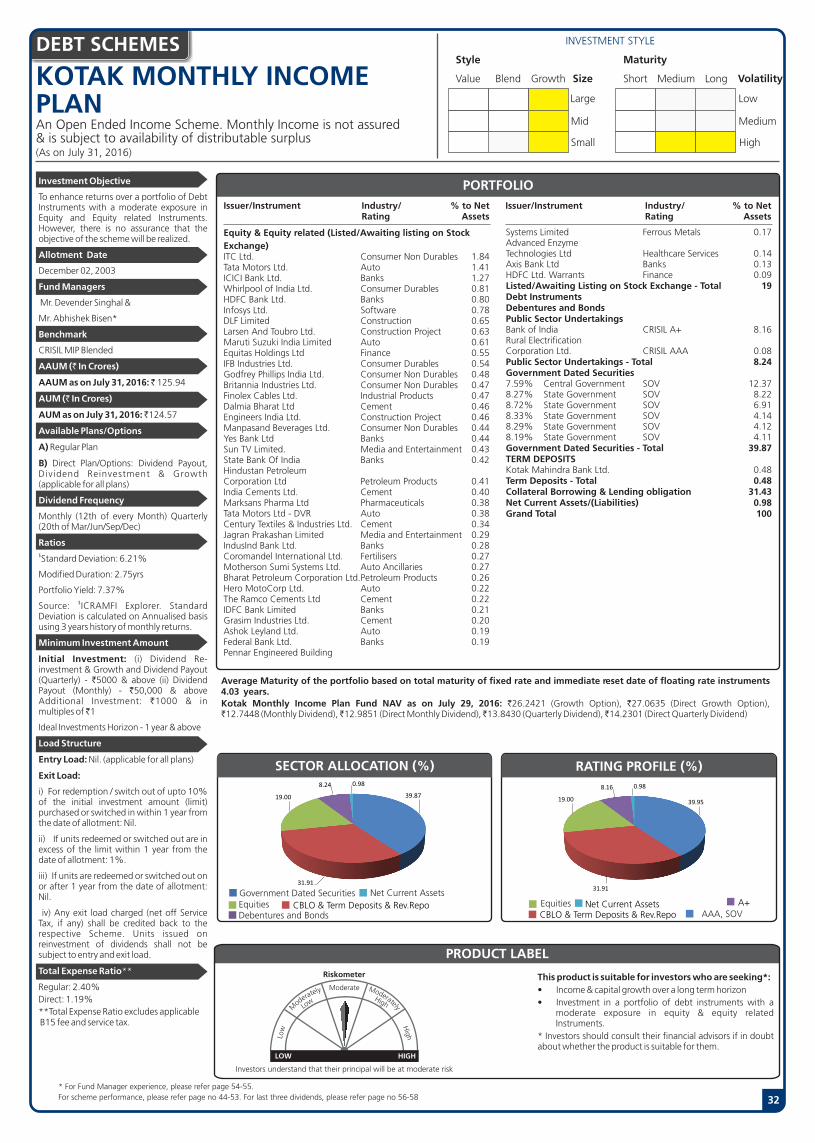
KOTAK MONTHLY INCOME PLANAn Open Ended Income Scheme. Monthly Income is not assured & is subject to availability of distributable surplus
Investment Objective
To enhance returns over a portfolio of Debt Instruments with a moderate exposure in Equity and Equity related Instruments. However, there is no assurance that the objective of the scheme will be realized.
Allotment Date
December 02, 2003
Fund Managers
Mr. Devender Singhal &
Mr. Abhishek Bisen*
Benchmark
CRISIL MIP Blended
AAUM (` In Crores)
AAUM as on July 31, 2016: ̀ 125.94
AUM (` In Crores)
AUM as on July 31, 2016: ̀ 124.57
Available Plans/Options
A) Regular Plan
B) Direct Plan/Options: Dividend Payout, Dividend Reinvestment & Growth (applicable for all plans)
Dividend Frequency
Monthly (12th of every Month) Quarterly (20th of Mar/Jun/Sep/Dec)
Ratios$Standard Deviation: 6.21%
Modified Duration: 2.75yrs
Portfolio Yield: 7.37%$Source: ICRAMFI Explorer. Standard
Deviation is calculated on Annualised basis using 3 years history of monthly returns.
Minimum Investment Amount
Initial Investment: (i) Dividend Re-investment & Growth and Dividend Payout (Quarterly) - `5000 & above (ii) Dividend Payout (Monthly) - `50,000 & above Additional Investment: `1000 & in multiples of ̀ 1
Ideal Investments Horizon - 1 year & above
Load Structure
Entry Load: Nil. (applicable for all plans)
Exit Load:
i) For redemption / switch out of upto 10% of the initial investment amount (limit) purchased or switched in within 1 year from the date of allotment: Nil.
ii) If units redeemed or switched out are in excess of the limit within 1 year from the date of allotment: 1%.
iii) If units are redeemed or switched out on or after 1 year from the date of allotment: Nil.
iv) Any exit load charged (net off Service Tax, if any) shall be credited back to the respective Scheme. Units issued on reinvestment of dividends shall not be subject to entry and exit load.
Total Expense Ratio**
Regular: 2.40%Direct: 1.19%**Total Expense Ratio excludes applicable B15 fee and service tax.
DEBT SCHEMES
32
INVESTMENT STYLE
Short Medium Long Volatility
Low
Medium
High
Maturity
Value Blend Growth Size
Large
Mid
Small
Style
Issuer/Instrument Industry/ % to Net Rating Assets
Equity & Equity related (Listed/Awaiting listing on Stock Exchange)ITC Ltd. Consumer Non Durables 1.84Tata Motors Ltd. Auto 1.41ICICI Bank Ltd. Banks 1.27Whirlpool of India Ltd. Consumer Durables 0.81HDFC Bank Ltd. Banks 0.80Infosys Ltd. Software 0.78DLF Limited Construction 0.65Larsen And Toubro Ltd. Construction Project 0.63Maruti Suzuki India Limited Auto 0.61Equitas Holdings Ltd Finance 0.55IFB Industries Ltd. Consumer Durables 0.54Godfrey Phillips India Ltd. Consumer Non Durables 0.48Britannia Industries Ltd. Consumer Non Durables 0.47Finolex Cables Ltd. Industrial Products 0.47Dalmia Bharat Ltd Cement 0.46Engineers India Ltd. Construction Project 0.46Manpasand Beverages Ltd. Consumer Non Durables 0.44Yes Bank Ltd Banks 0.44Sun TV Limited. Media and Entertainment 0.43State Bank Of India Banks 0.42Hindustan Petroleum Corporation Ltd Petroleum Products 0.41India Cements Ltd. Cement 0.40Marksans Pharma Ltd Pharmaceuticals 0.38Tata Motors Ltd - DVR Auto 0.38Century Textiles & Industries Ltd. Cement 0.34Jagran Prakashan Limited Media and Entertainment 0.29IndusInd Bank Ltd. Banks 0.28Coromandel International Ltd. Fertilisers 0.27Motherson Sumi Systems Ltd. Auto Ancillaries 0.27Bharat Petroleum Corporation Ltd. Petroleum Products 0.26Hero MotoCorp Ltd. Auto 0.22The Ramco Cements Ltd Cement 0.22IDFC Bank Limited Banks 0.21Grasim Industries Ltd. Cement 0.20Ashok Leyland Ltd. Auto 0.19Federal Bank Ltd. Banks 0.19Pennar Engineered Building
Issuer/Instrument Industry/ % to Net Rating Assets
Systems Limited Ferrous Metals 0.17Advanced Enzyme Technologies Ltd Healthcare Services 0.14Axis Bank Ltd Banks 0.13HDFC Ltd. Warrants Finance 0.09Listed/Awaiting Listing on Stock Exchange - Total 19Debt Instruments Debentures and Bonds Public Sector Undertakings Bank of India CRISIL A+ 8.16Rural Electrification Corporation Ltd. CRISIL AAA 0.08Public Sector Undertakings - Total 8.24Government Dated Securities 7.59% Central Government SOV 12.378.27% State Government SOV 8.228.72% State Government SOV 6.918.33% State Government SOV 4.148.29% State Government SOV 4.128.19% State Government SOV 4.11Government Dated Securities - Total 39.87TERM DEPOSITS Kotak Mahindra Bank Ltd. 0.48Term Deposits - Total 0.48Collateral Borrowing & Lending obligation 31.43Net Current Assets/(Liabilities) 0.98Grand Total 100
PORTFOLIO
Average Maturity of the portfolio based on total maturity of fixed rate and immediate reset date of floating rate instruments 4.03 years.Kotak Monthly Income Plan Fund NAV as on July 29, 2016: `26.2421 (Growth Option), `27.0635 (Direct Growth Option),`12.7448 (Monthly Dividend), ̀ 12.9851 (Direct Monthly Dividend), ̀ 13.8430 (Quarterly Dividend), ̀ 14.2301 (Direct Quarterly Dividend)
Investors understand that their principal will be at moderate risk
Riskometer
yletaredo
M
Moderate
Low
High
Low
High
LOW HIGH
Moderately
This product is suitable for investors who are seeking*:� Income & capital growth over a long term horizon� Investment in a portfolio of debt instruments with a
moderate exposure in equity & equity related Instruments.
* Investors should consult their financial advisors if in doubt about whether the product is suitable for them.
PRODUCT LABEL
SECTOR ALLOCATION (%) RATING PROFILE
AAA, SOVCBLO & Term Deposits & Rev.Repo
CBLO & Term Deposits & Rev.Repo
* For Fund Manager experience, please refer page 54-55. For scheme performance, please refer page no 44-53. For last three dividends, please refer page no 56-58
(As on July 31, 2016)
50.95
19.86
17.93
9.55
50.87
19.86
17.93
9.55
Net Current Assets A+
39.87
31.91
19.00
8.24 0.98
39.95
31.91
19.00
8.16 0.98

KOTAK MULTI ASSETALLOCATION FUNDAn Open - Ended Debt Scheme
Investment Objective
The investment objective of the scheme is to generate income by investing predominantly in debt and money market securities, to generate growth by taking moderate exposure to equity and equity re lated inst ruments and prov ide diversification by investing in Gold ETFs. However, there is no assurance that the objective of the scheme will be realized.
Allotment Date
January 21, 2011
Fund Managers Mr. Deepak Gupta &Mr. Abhishek Bisen*
Benchmark
75% CRISIL Short Term Bond Fund,
15% Nifty 50 and 10% Price of Gold.
AAUM (` In Crores)
AAUM as on July 31, 2016: ̀ 25.65
AUM (` In Crores)
AUM as on July 31, 2016: ̀ 25.35
Available Plans/Options
A) Regular Plan
B) Direct Plan / Options: Dividend Payout, Dividend Reinvestment & Growth (applicable for all plans))
Dividend Frequency
Monthly (12th of Every Month), Quarterly (20th of Mar/Jun/Sep/Dec), Annual (12th of March)
Ratios$Standard Deviation: 4.61%,
Modified Duration: 2.97yrs,
Portfolio Yield: 7.58%$Source: ICRAMFI Explorer. Standard
Deviation is calculated on Annualised basis using 3 years history of monthly returns.
Minimum Investment Amount
Initial Investment: `10000 and in multiple of `1 for purchase and for `0.01 for switches
Additional Investment: `1000 & in multiples of ̀ 1
Ideal Investments Horizon: 1 year & above
Load Structure
Entry Load: Nil. (applicable for all plans)
Exit Load: i) For exit within 1 year from the date of allotment of units: 1%. ii) For exit after 1 year from the date of allotment
of units: Nil. iii) Any exit load charged (net off Service Tax, if any) shall be credited back to the Scheme.
Note - Units issued on reinvestment of dividends shall not be subject to exit load (applicable for all plans)
Total Expense Ratio**
Regular: 2.38%Direct: 0.44%
**Total Expense Ratio excludes applicable B15 fee and service tax.
DEBT SCHEMES
33
INVESTMENT STYLE
Short Medium Long Volatility
Low
Medium
High
Maturity
Value Blend Growth Size
Large
Mid
Small
Style
Issuer/Instrument Industry/ % to Net Rating Assets
Equity & Equity related (Listed/Awaiting listing on Stock Exchange)HDFC Bank Ltd. Banks 1.23Infosys Ltd. Software 1.05Reliance Industries Ltd. Petroleum Products 0.91Bharat Petroleum Corporation Ltd. Petroleum Products 0.83ITC Ltd. Consumer Non Durables 0.82Grasim Industries Ltd. Cement 0.80IndusInd Bank Ltd. Banks 0.77Asian Paints Ltd. Consumer Non Durables 0.68Zee Entertainment Enterprises Ltd Media and Entertainment 0.62Hero MotoCorp Ltd. Auto 0.61Bajaj Auto Ltd. Auto 0.56Ultratech Cement Ltd. Cement 0.55Bajaj Finance Limited Finance 0.51Tata Motors Ltd. Auto 0.50Eicher Motors Ltd Auto 0.43Hindustan Unilever Ltd. Consumer Non Durables 0.43Lupin Ltd. Pharmaceuticals 0.41Yes Bank Ltd Banks 0.32Larsen And Toubro Ltd. Construction Project 0.30ICICI Bank Ltd. Banks 0.29Axis Bank Ltd Banks 0.28Maruti Suzuki India Limited Auto 0.28Petronet LNG Ltd. Gas 0.28Power Grid Corporation Of India Ltd Power 0.25Ujjivan Financial Services Ltd Finance 0.23Wipro Ltd. Software 0.23National Thermal Power Corporation Limited Power 0.21Equitas Holdings Ltd Finance 0.20Tata Consultancy Services Ltd. Software 0.20Tata Steel Limited. Ferrous Metals 0.19Britannia Industries Ltd. Consumer Non Durables 0.15GAIL (India) Ltd. Gas 0.15Tech Mahindra Ltd. Software 0.15HDFC Ltd. Finance 0.14Bharti Airtel Ltd. Telecom - Services 0.13HCL Technologies Ltd. Software 0.12Advanced Enzyme Technologies Ltd Healthcare Services 0.11Ashok Leyland Ltd. Auto 0.11JSW Steel Ltd. Ferrous Metals 0.11Mahindra & Mahindra Ltd. Auto 0.11Marico Ltd. Consumer Non Durables 0.10Aurobindo Pharma Ltd. Pharmaceuticals 0.09Divi s Laboratories Limited Pharmaceuticals 0.09
Issuer/Instrument Industry/ % to Net Rating Assets
Mahanagar Gas Ltd Gas 0.09Bosch Limited Auto Ancillaries 0.08Dr Reddys Laboratories Ltd Pharmaceuticals 0.08Pidilite Industries Ltd. Chemicals 0.08ACC Ltd. Cement 0.06Ambuja Cements Ltd Cement 0.06Hindalco Industries Ltd Non - Ferrous Metals 0.06Shriram Transport Finance Co Ltd. Finance 0.04Bharti Infratel Ltd. Telecom - Equipment & Accessories 0.01Listed/Awaiting Listing on Stock Exchange - Total 17.09Mutual Fund Units Kotak Mutual Fund - Kotak Gold ETF Mutual Fund Units 8.48Mutual Fund Units - Total 8.48Futures CNX NIFTY-AUG2016 -0.51Futures (Market value represents Notional Value) - Total -0.51Debt Instruments Debentures and Bonds Corporate Debt/Financial Institutions Hindalco Industries Ltd. CRISIL AA- 3.26Corporate Debt/Financial Institutions - Total 3.26Government Dated Securities 8.45% State Government SOV 20.358.72% State Government SOV 16.488.53% State Government SOV 12.257.59% Central Government SOV 8.10Government Dated Securities - Total 57.18TERM DEPOSITS Kotak Mahindra Bank Ltd. 0.99Term Deposits - Total 0.99Collateral Borrowing & Lending obligation 10.41Net Current Assets/(Liabilities) 3.10Grand Total 100
PORTFOLIO
Average Maturity of the portfolio based on total maturity of fixed rate and immediate reset date of floating rate instruments: 4.13 years.Kotak Multi Asset Allocation Fund NAV as on July 29, 2016: `15.5762 (Growth Option), `16.1014 (Direct Growth Option),`13.0569 (Monthly Dividend), `12.2375 (Quarterly Dividend), `12.5222 (Direct Quarterly Dividend), `12.0716 (Annual Dividend), `12.8804 (Direct Annual)
Investors understand that their principal will be at moderate risk
Riskometer
yletaredo
M
Moderate
Low
High
Low
High
LOW HIGH
Moderately
This product is suitable for investors who are seeking*:� Income & capital growth over a long term horizon� Investment in a portfolio of debt instruments with a
moderate exposure in equity & equity related instruments and provides diversification by investing in Gold ETFs
* Investors should consult their financial advisors if in doubt about whether the product is suitable for them.
PRODUCT LABEL
Mutual Fund UnitsNet Current Assets AA-
Mutual Fund Units
* For Fund Manager experience, please refer page 54-55. For scheme performance, please refer page no 44-53. For last three dividends, please refer page no 56-58
Derivatives
(As on July 31, 2016)
Government Dated SecuritiesSOV
Notes: Term Deposit as provided above is towards margin for derivatives transactions
57.1817.09
11.40
8.483.26 3.10 -0.51
57.1817.09
11.408.48
3.26 3.10 -0.51
Debentures and Bonds
Derivatives

34
Details of exposure across all Debt Funds of Kotak Mahindra Mutual Fund as on 31 July 2016
Issuer Name%age of Exposure
to Debt AUM $ Issuer Name%age of Exposure
to Debt AUM $AXIS Bank Ltd. 0.94Aasan Developers and Constructions Private Limited ( Guaranteed by a Piramal Group Company ) 0.14Adani Port and Special Economic Zone Limited 1.00Adani Power Ltd ( Secured by Equity shares of Adani Ports and SEZ Ltd ) 0.23Adani Transmission Ltd 0.65Aditya Birla Finance Ltd. 0.21Aditya Birla Nuvo Limited 0.60Airports Authority of India 0.05Andhra Bank 0.13Ashirvad Microfinance Private Limited ( 85% subsidiary of Manappuram Finance Ltd ) 0.10Aspire Home Finance Corporation Ltd 0.14Au Financiers (India) Limited 0.66Bajaj Capital Ventures Pvt. Ltd. ( Secured by Equity shares of Bajaj Corp. Ltd ) 0.15Bajaj Finance Limited 1.01Bank of India 0.48Bhanu Vyapaar Private Limited ( Secured by Equity shares of Emami Ltd ) 0.09Bharti enterprises (Holding) Pvt. Ltd. 1.61CBLO/REVERSE REPO 2.33Camden Industries Ltd. ( backed by unconditional and irrevocable undertaking of Axis Capital ) 0.45Canara Bank 0.51Central Government 19.98Cholamandalam Investment and Finance Company Ltd 0.01Continental Drug Company P Ltd ( Secured by Equity shares of Zee Entertainment Enterprises Ltd ) 0.42Corporation Bank 0.15DLF Emporio Ltd 0.21Dalmia Bharat Ltd 0.20Dewan Housing Finance Corporation Ltd. 0.50ECL Finance Limited 1.32East-North Interconnection Company Limited 0.14Edelweiss Agri Value Chain Limited (Unconditional and irrevocable guarantee from Edelweiss Financial Services Limited ) 0.57Edelweiss Commodities Services Ltd. 0.55Edelweiss Financial Services Limited 0.16Edelweiss Housing Finanance Limited 0.39Edisons Untility Works Pvt.Ltd. ( Secured by Equity shares of Zee Entertainment Enterprises Ltd ) 0.21Emami Enclave Markets Pvt Ltd. ( Secured by Equity shares of Emami Ltd ) 0.09Equitas Micro Finance Ltd. 0.15Essel Mining & Industries Ltd. 0.40Export-Import Bank of India. 1.52Fullerton India Credit Co. Ltd. 0.25Grand View Estate Pvt Ltd ( backed by unconditional and irrevocable guarantee of Shapoorji Pallonji & Co Pvt Ltd ) 0.38Grasim Industries Ltd. 0.20Gruh Finance Ltd 0.80HDB Financial Services Ltd. 0.45HDFC Bank Ltd. 0.05HDFC Ltd. 2.17HPCL Mittal Energy Ltd. 0.65HPCL Mittal Pipelines Ltd. 0.55Haldhar Developers Private Limited ( backed by unconditional and irrevocable undertaking by Piramal ) 0.08Hero Realty Ltd ( Guaranteed by a Hero Group company ) 0.20High Point Properties Pvt LTD ( backed by unconditional and irrevocable guarantee of Shapoorji Pallonji & Co Pvt Ltd ) 0.17Hindalco Industries Ltd. 0.00Hinduja Leyland Finance Ltd. 0.20Hindustan Zinc Ltd 0.69ICICI Bank Ltd. 0.55ICICI Home Finance Company Limited 0.47IDBI Bank Ltd. 2.09IDFC Bank Limited 0.04IIFL Wealth Finance Ltd. 0.40IL & FS Transportation Networks Limited ( Secured by Equity shares of IL & FS Ltd ) 0.14IOT Utkal Energy Services Ltd. 0.21India Infoline Finance Limited 1.06India Infoline Housing Finance Ltd. 0.43Indiabulls Housing Finance Limited 1.01Indian Oil Corporation Ltd. 0.03Indian Overseas Bank 0.07Indian Railway Finance Corporation Ltd. 0.29Indostar Capital Finance Private Limited 0.25IndusInd Bank Ltd. 0.59Infrastructure Leasing & Financial Services Limite 0.02Innovador Realtors Pvt Ltd ( backed by unconditional and irrevocable undertaking by Piramal ) 0.47Inox Air Products Ltd. 0.01
Intime Properties Ltd. 0.12JSW Investments Pvt. Ltd. 0.20Janalakshami Financial Services Ltd. 0.41Jyothy Laboratories Limited 0.07Karelides Traders Private Ltd. ( backed by unconditional and irrevocable undertaking by a wholly owned subsidiary of Piramal Enterprises Ltd ) 0.74Kotak Mahindra Bank Ltd. 0.00Kotak Mahindra Investments Ltd. 0.21Kotak Mahindra Prime Ltd. 1.28L & T Finance Limited 0.28LIC Housing Finance Ltd. 0.75Larsen and Toubro Ltd. 0.59MA MAULTI TRADE PVT LTD ( Secured by Equity shares of Bajaj Corp. Ltd ) 0.15Mahindra & Mahindra Financial Services Ltd. 1.28Manappuram Finance Ltd 0.81Mandava Holdings Private Limited ( backed by unconditional and irrevocable undertaking by Axis Capital ) 0.34Muthoot Finance Ltd 1.70Muthoot Fincorp Ltd. 0.20Nabha Power Ltd. ( backed by unconditional and irrevocable guarantee by Larsen & Toubro Ltd ) 1.63National Bank for Agriculture and Rural Developmen 2.10National Housing Bank 0.25ONGC Manglore Petrochemicals Ltd. 0.78PNB Housing Finance Ltd. 0.11Peninsula Land Limited 0.21Phoenix ARC Pvt Ltd 0.10Piramal Enterprises Limited 1.97Power Finance Corporation Ltd. 2.62Power Grid Corporation of India Ltd. 0.22Powergrid Vizag Transminssion Ltd. ( backed by unconditional and irrevocable guarantee by Powergrid Corp ) 0.04Prestige Estates Projects Limited 0.42Pune Solapur Expressways Pvt. Ltd. ( toll road project of Tata Realty & Infrastructure Ltd, 100% subsidiary of Tata Sons ) 0.18Punjab National Bank 0.03Ratnakar Bank Ltd 0.04Raymond Ltd. 0.09Reliance Capital Ltd. 0.40Reliance Jio Infocomm Limited 2.47Reliance Ports And Terminals Limited 0.04Reliance Utilities And Power Private Limited 0.14Rural Electrification Corporation Ltd. 2.34SBK Properties Pvt Ltd. ( Guaranteed by a Kalyani Group company ) 0.18SP Jammu Udhampur Highway Ltd. ( backed by unconditional and irrevocable guarantee of Shapoorji Pallonji & Co Pvt Ltd ) 0.19Sadbhav Engineering Ltd. 0.20Sahyadri Agencies Ltd ( Secured by Equity shares of Jyothy Laboratories Ltd ) 0.21Shapoorji Pallonji Energy Gujarat Private Limited 0.08Shapoorji Pallonji Energy Gujarat Private Limited ( backed by unconditional and irrevocable guarantee of Shapoorji Pallonji & Co Pvt Ltd ) 0.04Shivprasad Realty Pvt Ltd ( backed by unconditional and irrevocable undertaking by Axis Capital ) 0.10Shriram Transport Finance Co Ltd. 1.04Small Industries Development Bank Of India. 0.85Sneha Abasan Pvt Ltd ( Secured by Equity shares of Emami Ltd ) 0.07Sneha Enclave Pvt Ltd ( Secured by Equity shares of Emami Ltd ) 0.04State Bank Of India. 0.37State Bank of Travancore 0.09State Government 5.49Steel Authority of India Ltd. 4.38Sterlite Industries (India) Ltd 0.36Sundaram BNP Paribas Home Finance Ltd 0.09Sundaram Finance Ltd. 0.05Suraksha Reality Ltd ( Secured by Equity shares of Sun Pharmaceuticals Industries Ltd ) 1.99Syndicate Bank 0.18Tata Capital Financial Services Limited 0.29Tata Capital Housing Finance Ltd; 0.71Tata Motors Finance Ltd 0.33Tata Motors Ltd. 1.10Tata Power Company Ltd. 0.79Tata Sons Ltd. 0.08Ultratech Cement Ltd. 1.28Vedanta Ltd. 0.30Vijaya Bank 0.39TOTAL 100
Industry / Sector %age of Exposure to Debt AUM $
BANK 6.70CASH(CBLO/REVERSE REPO) 2.33CORPORATES 31.97FINANCIAL SERVICES 17.74GOI/TBILLS 25.47NBFC 15.18REAL ESTATE 0.61TOTAL 100.00
$ - Includes Hybrid schemes - debt scheme schemes having equity exposure

KOTAK ASSET ALLOCATOR FUNDAn Open � Ended Fund of Funds Scheme(Earlier known as Kotak Equity FOF Scheme)
Issuer/Instrument Industry/Rating % to Net Assets
Issuer/Instrument Industry/Rating % to Net Assets
Investment Objective
The investment objective of the scheme is to generate long-term capital appreciation from a portfolio created by investing in specified open-ended equity, and debt schemes of Kotak Mahindra Mutual Fund. However, there is no assurance that the investment objective of the Scheme will be realized.
Allotment Date
August 9, 2004
Fund Manager
Mr. Deepak Gupta*
Benchmark
Crisil Balanced Fund
AAUM (` In Crores)
AAUM as on July 31, 2016: ̀ 28.14
AUM (` In Crores)
AUM as on July 31, 2016: ̀ 28.28
Available Plans/Options
A) Regular Plan
B) Regular Plan / Options: Dividend Payout, Dividend Reinvestment & Growth (applicable for all plans)
Dividend Frequency
Trustee�s Discretion
Minimum Investment Amount
Initial Investment: `5000 and in multiple of `1 for purchase and for `0.01 for switches
Additional Investment: `1000 & in multiples of ̀ 1
Ideal Investments Horizon: 3 years & above
Load Structure
Entry Load: Nil. (applicable for all plans)
Exit Load: I) 1% if exit before 1 year from date of allotment.
II) Nil if exit after 1 year from the date of allotment.
Exit Load shall be applicable incase of switch from Regular Plan (where broker code is mentioned) to Direct Plan
Exit Load shall not be applicable:
Incase of switch from Regular Plan (where no b roker code i s mentioned) to Direct Plan
In case of switch from Direct Plan to Regular Plan.
III) Any exit load charged (net off Service Tax, if any) shall be credited back to the Scheme (applicable for all plans).
Note - Units issued on reinvestment of dividends shall not be subject to entry and exit load. (applicable for all plans)
Total Expense Ratio**
Regular: 1.70%
Direct:1.22%
**Total Expense Ratio excludes applicable B15 fee and service tax.
FUND OF FUNDS INVESTMENT STYLE
Short Medium Long Volatility
Low
Medium
High
Maturity
Value Blend Growth Size
Large
Mid
Small
Style
PORTFOLIO
Equity & Equity related (Listed/Awaiting listing on Stock Exchange)
Mutual Fund Units
Kotak Floater Long Term
Direct Growth Debt Scheme 48.40
Kotak Select Focus Fund
Direct Growth Equity Scheme 20.70
Kotak Mahindra Bond Plan Debt Scheme 20.52
Kotak Liquid Plan A Debt Scheme 9.97
Mutual Fund Units - Total 99.59
Net Current Assets/(Liabilities) 0.41
Grand Total 100
This product is suitable for investors who are seeking*:� Long term capital growth� Investment in open-ended diversified equity schemes and debt schemes of
Kotak Mahindra Mutual Fund* Investors should consult their financial advisors if in doubt about whether the product is suitable for them.
PRODUCT LABEL
Investors understand that their principal will be at moderate risk
Riskometer
yletaredo
M
Moderate
Low
High
Low
High
LOW HIGH
Moderately
SECTOR ALLOCATION (%)
87.20
Equity Scheme Others
79.95
20.13
For scheme performance, please refer page no 44-53. For last three dividends, please refer page no 56-58 * For Fund Manager experience, please refer page 54-55.
35
30.91
60.66
7.57
Debt Scheme
(As on July 31, 2016)
41.02
39.11
19.89
Kotak Asset Allocator Fund NAV as on July 29, 2016: `63.982 (Dividend Option), `65.024 (Direct Dividend Option), `65.730 (Growth Option), `66.212 (Direct Growth Option)
20.70
78.89
0.41
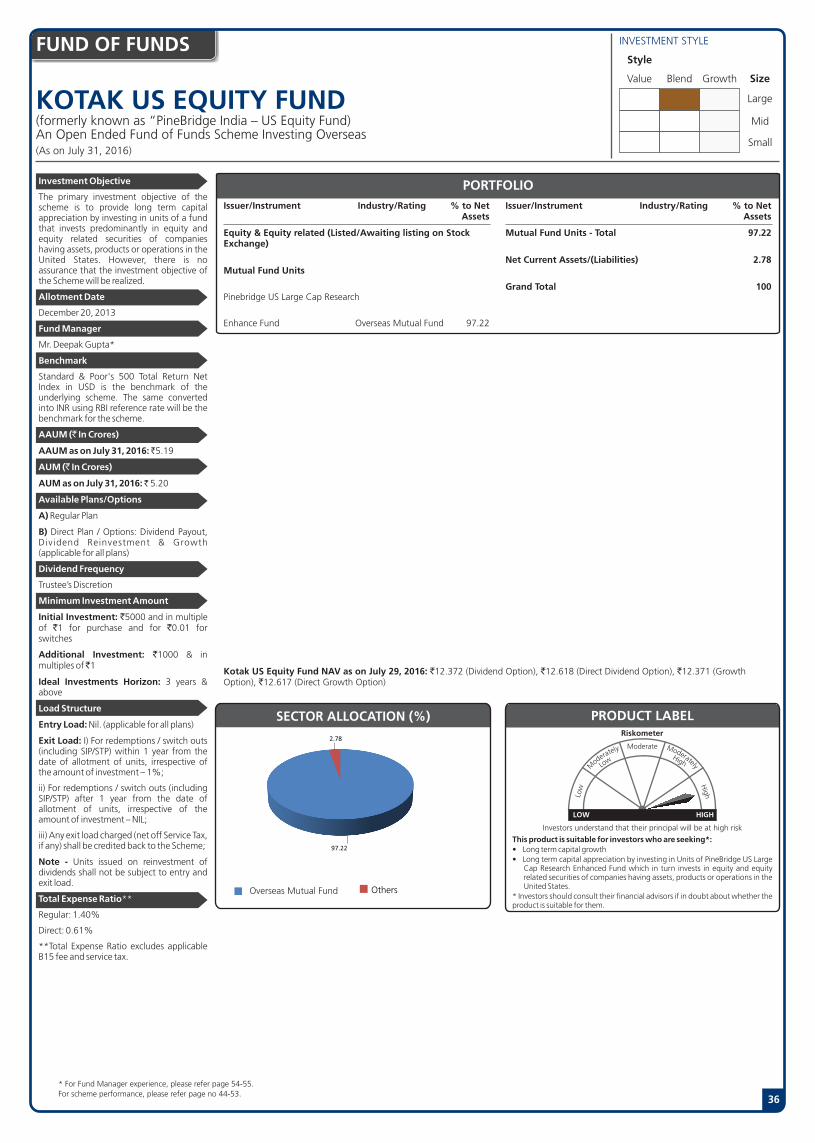
(formerly known as �PineBridge India � US Equity Fund)An Open Ended Fund of Funds Scheme Investing Overseas
INVESTMENT STYLE
Investment Objective
The primary investment objective of the scheme is to provide long term capital appreciation by investing in units of a fund that invests predominantly in equity and equity related securities of companies having assets, products or operations in the United States. However, there is no assurance that the investment objective of the Scheme will be realized.
Allotment Date
December 20, 2013
Fund Manager
Mr. Deepak Gupta*
Benchmark
Standard & Poor's 500 Total Return Net Index in USD is the benchmark of the underlying scheme. The same converted into INR using RBI reference rate will be the benchmark for the scheme.
AAUM (` In Crores)
AAUM as on July 31, 2016: ̀ 5.19
AUM (` In Crores)
AUM as on July 31, 2016: ̀ 5.20
Available Plans/Options
A) Regular Plan
B) Direct Plan / Options: Dividend Payout, Dividend Reinvestment & Growth (applicable for all plans)
Dividend Frequency
Trustee�s Discretion
Minimum Investment Amount
Initial Investment: `5000 and in multiple of `1 for purchase and for `0.01 for switches
Additional Investment: `1000 & in multiples of ̀ 1
Ideal Investments Horizon: 3 years & above
Load Structure
Entry Load: Nil. (applicable for all plans)
Exit Load: I) For redemptions / switch outs (including SIP/STP) within 1 year from the date of allotment of units, irrespective of the amount of investment � 1%;
ii) For redemptions / switch outs (including SIP/STP) after 1 year from the date of allotment of units, irrespective of the amount of investment � NIL;
iii) Any exit load charged (net off Service Tax, if any) shall be credited back to the Scheme;
Note - Units issued on reinvestment of dividends shall not be subject to entry and exit load.
Total Expense Ratio**
Regular: 1.40%
Direct: 0.61%
**Total Expense Ratio excludes applicable B15 fee and service tax.
KOTAK US EQUITY FUND
FUND OF FUNDS
36
Value Blend Growth Size
Large
Mid
Small
Style
Issuer/Instrument Industry/Rating % to Net Assets
Issuer/Instrument Industry/Rating % to Net Assets
PORTFOLIO
Equity & Equity related (Listed/Awaiting listing on Stock Exchange)
Mutual Fund Units
Pinebridge US Large Cap Research
Enhance Fund Overseas Mutual Fund 97.22
Mutual Fund Units - Total 97.22
Net Current Assets/(Liabilities) 2.78
Grand Total 100
This product is suitable for investors who are seeking*:� Long term capital growth� Long term capital appreciation by investing in Units of PineBridge US Large
Cap Research Enhanced Fund which in turn invests in equity and equity related securities of companies having assets, products or operations in the United States.
* Investors should consult their financial advisors if in doubt about whether the product is suitable for them.
PRODUCT LABEL
Investors understand that their principal will be at high risk
Riskometer
yletaredo
M
Moderate
Low
High
Low
High
LOW HIGH
Moderately
Overseas Mutual Fund
SECTOR ALLOCATION (%)
For scheme performance, please refer page no 44-53. * For Fund Manager experience, please refer page 54-55.
(As on July 31, 2016)
Kotak US Equity Fund NAV as on July 29, 2016: `12.372 (Dividend Option), `12.618 (Direct Dividend Option), `12.371 (Growth Option), `12.617 (Direct Growth Option)
Others
97.22
2.78

KOTAK GLOBAL EMERGING MARKET FUNDAn Open - Ended Equity Scheme
Issuer/Instrument Industry/Rating % to Net Assets
Issuer/Instrument Industry/Rating % to Net Assets
PORTFOLIOInvestment Objective
The investment objective of the scheme is to generate long-term capital appreciation by investing in an overseas mutual fund scheme that invest in a diversified portfolio of securities as prescribed by SEBI from time to time in global emerging markets. However, there is no assurance that the objective of the scheme will be realized.
Allotment Date
September 26, 2007
Fund Managers
Mr. Deepak Gupta (Dedicated fund manager for Fund Managers overseas investment) & Mr.Abhishek Bisen*
Benchmark
MSCI Emerging Market
AAUM (` In Crores)
AAUM as on July 31, 2016: ̀ 29.76
AUM (` In Crores)
AUM as on July 31, 2016: ̀ 30.12
Available Plans/Options
A) Regular Plan
B) Direct Plan / Options: Dividend Payout, Dividend Reinvestment & Growth (applicable for all plans)
Dividend Frequency
Trustee�s Discretion
Minimum Investment Amount
Initial Investment: `5000 and in multiple of `1 for purchase and for `0.01 for switches
Additional Investment: `1000 & in multiples of ̀ 1
Ideal Investments Horizon: 3 years & above
Load Structure
Entry Load: Nil. (applicable for all plans)
Exit Load: I) For exit within 1 year from the date of allotment of units: 1%.
ii) For exit after 1 year from the date of allotment of units: Nil
iii) Any exit load charged (net off Service Tax, if any) shall be credited back to the Scheme. (applicable for all plans)
Note - Units issued on reinvestment of dividends shall not be subject to exit load (applicable for all plans)
Total Expense Ratio**
Regular: 1.93%
Direct: 0.78%
**Total Expense Ratio excludes applicable B15 fee and service tax.
FUND OF FUNDS
37
Kotak Global Emerging Market Fund NAV as on July 29, 2016: `13.393 (Dividend Option), `13.734 (Direct Dividend Option), `13.394 (Growth Option), ̀ 13.691 (Direct Growth Option)
INVESTMENT STYLE
Value Blend Growth Size
Large
Mid
Small
Style
Equity & Equity related (Listed/Awaiting listing on Stock Exchange)
Mutual Fund Units
MGF Asian Small
Equity Fund Class I Overseas Mutual Fund 77.48
ishares MSCI Emerging
Markets ETF Overseas Mutual Fund 21.06
Mutual Fund Units - Total 98.54
Collateral Borrowing &
Lending obligation 1.33
Net Current Assets/(Liabilities) 0.13
Grand Total 100
This product is suitable for investors who are seeking*:� Long term capital growth� Investment in overseas mutual fund schemes that invest in a diversified portfolio of securities in global emerging markets * Investors should consult their financial advisors if in doubt about whether the product is suitable for them.
PRODUCT LABEL
Investors understand that their principal will be at high risk
Riskometer
yletaredo
M
Moderate
Low
High
Low
High
LOW HIGH
Moderately
98.72
Overseas Mutual Fund Others
SECTOR ALLOCATION (%)
93.72
6.13
For scheme performance, please refer page no 44-53. * For Fund Manager experience, please refer page 54-55.
95.36
4.56
(As on July 31, 2016)
CBLO & Term Deposits & Rev.Repo
98.54
1.330.13

FUND OF FUNDS
KOTAK WORLD GOLD FUND
Issuer/Instrument Industry/Rating % to Net Assets
Issuer/Instrument Industry/Rating % to Net Assets
INVESTMENT STYLE
Investment Objective
The primary investment objective of the Scheme is to provide long term capital appreciation by investing predominantly in units of Falcon Gold Equity Fund. The Scheme may, at the discretion of the Investment Manager, also invest in the units of other similar overseas mutual fund schemes. The Scheme may also invest a certain portion of its corpus in debt and money market securities and/or units of debt/liquid schemes of Mutual Funds, in order to meet liquidity requirements from time to time. However, there is no assurance that the investment objective of the Scheme will be realized.
Allotment Date
June 6, 2008
Fund Manager
Mr. Deepak Gupta*
Benchmark
Financial Times Gold Mines Total Price Index, in USD is the benchmark of Falcon Gold Equity Fund. The above translated to INR using the RBI Reference Rate will be the benchmark of Kotak World Gold Fund.
AAUM (` In Crores)
AAUM as on July 31, 2016: ̀ 60.01
AUM (` In Crores)
AUM as on July 31, 2016: ̀ 61.71
Available Plans/Options
A) Regular Plan
B) Direct Plan / Options: Dividend Payout, Dividend Reinvestment & Growth (applicable for all plans)
Dividend Frequency
Trustee�s Discretion
Minimum Investment Amount
Initial Investment: `5000 and in multiple of `1 for purchase and for `0.01 for switches
Additional Investment: `1000 & in multiples of `1 for purchase and for `0.01 for switches
Ideal Investments Horizon: 3 years & above
Load Structure
Entry Load: Nil. (applicable for all plans)
Exit Load:
I) For redemptions / switch outs (including SIP/STP) within 1 year from the date of allotment of units, irrespective of the amount of investment � 1%;
ii) For redemptions / switch outs (including SIP/STP) after 1 year from the date of allotment of units, irrespective of the amount of investment � NIL;
iii) Any exit load charged (net off ServiceTax, if any) shall be credited back to the Scheme;
Note - Units issued on reinvestment of dividends shall not be subject to entry and exit load.
Total Expense Ratio**
Regular:1.90%
Direct: 1.09%
**Total Expense Ratio excludes applicable B15 fee and service tax.
Style
(formerly known as �PineBridge World Gold Fund�)An Open � Ended Fund of Funds Scheme
38
Value Blend Growth Size
Large
Mid
Small
Equity & Equity related (Listed/Awaiting listing on Stock Exchange)
Mutual Fund Units
Falcon Gold Equity ASIA Overseas Mutual Fund 97.94
Mutual Fund Units - Total 97.94
Collateral Borrowing & Lending obligation 3.79%
Net Current Assets/(Liabilities) -1.73
Grand Total 100
PORTFOLIO
Kotak World Gold Fund NAV as on July 29, 2016: `10.308 (Dividend Option), `10.588 (Direct Dividend Option), `12.434 (Growth Option), `12.753 (Direct Growth Option)
This product is suitable for investors who are seeking*:� Long term capital growth� Long term capital appreciation by investing in units of Falcon Gold Equity
Fund which in turn invests in international securities of gold production, processing and marketing companies
* Investors should consult their financial advisors if in doubt about whether the product is suitable for them.
PRODUCT LABEL
Investors understand that their principal will be at high risk
Riskometer
yletaredo
M
Moderate
Low
High
Low
High
LOW HIGH
Moderately
Overseas Mutual FundOthers
SECTOR ALLOCATION (%)
98.43
4.53-
For scheme performance, please refer page no 44-53. * For Fund Manager experience, please refer page 54-55.
99.03102.15
97.71100.05
(As on July 31, 2016)
CBLO & Term Deposits & Rev.Repo
97.94
3.79 -1.73

39
KOTAK GOLD ETFAn Open Ended Gold Exchange Traded Fund
ETF SCHEMES
For scheme performance, please refer page no 44-53 * For Fund Manager experience, please refer page 54-55.
Issuer / Instrument Industry/ % to Net Rating Assets
Gold
Gold Fineness99.5 Gold 100.07
Listed/Awaiting Listing on Stock Exchange - Total 100.07
Issuer / Instrument Industry/ % to Net Rating Assets
Net Current Assets/(Liabilities) -0.07
Grand Total 100.00
PORTFOLIO
NAV
Kotak Gold ETF NAV as on July 29, 2016: ̀ 291.9023
Investment Objective
The investment objective of Kotak Gold ETF is to generate returns that are in line with the returns on investment in physical gold, subject to tracking error.
Allotment Date
July 27, 2007
Fund Manager
Mr. Abhishek Bisen*
Benchmark
Physical Gold
AAUM (`In Crores)
AAUM as on July 31, 2016: ̀ 517.33
AUM (`In Crores)
AUM as on July 31, 2016: ̀ 514.07
Available Plans/Options
A) Regular Plan
B) Direct Plan
Minimum Investment Amount
Through Exchange:10 Units,
Through AMC: 10000 Units,
Ideal Investment Horizon: 3 years and above
Load Structure
Entry Load: Nil. (applicable for all plans)
Exit Load: Nil (applicable for all plans)
Total Expense Ratio**
Regular: 1.00%
Direct: NA
**Total Expense Ratio excludes applicable B15 fee and service tax.
This product is suitable for investors who are seeking*:� Returns in line with physical gold over medium to long term, subject to
tracking error� Investment in physical gold* Investors should consult their financial advisors if in doubt about whether the product is suitable for them.
PRODUCT LABEL
Investors understand that their principal will be at moderate risk
Riskometer
yletaredo
M
Moderate
Low
High
Low
High
LOW HIGH
Moderately
100.07
-0.07
Sector Allocation (%)
Gold Others
Tracking Error: 0.06%
(As on July 31, 2016)

40
KOTAK NIFTY ETFAn Open Ended Exchange Traded Fund[Eligible scheme under Rajiv Gandhi Equity Savings Scheme (RGESS)]
ETF SCHEMES
* For Fund Manager experience, please refer page 54-55. For scheme performance, please refer page no 44-53. For last three dividends, please refer page no 56-58
Issuer / Instrument Industry/ % to Net Rating Assets
Equity & Equity related (Listed/Awaiting listing on Stock Exchange)
HDFC Bank Ltd. Banks 7.87
HDFC Ltd. Finance 6.86
Infosys Ltd. Software 6.78
ITC Ltd. Consumer Non Durables 6.74
Reliance Industries Ltd. Petroleum Products 5.30
ICICI Bank Ltd. Banks 4.83
Tata Consultancy Services Ltd. Software 4.40
Larsen And Toubro Ltd. Construction Project 4.04
Tata Motors Ltd. Auto 3.08
Axis Bank Ltd Banks 2.88
Sun Pharmaceuticals
Industries Ltd. Pharmaceuticals 2.84
Kotak Mahindra Bank Ltd. Banks 2.57
State Bank Of India Banks 2.25
Mahindra & Mahindra Ltd. Auto 2.16
Hindustan Unilever Ltd. Consumer Non Durables 2.08
Maruti Suzuki India Limited Auto 2
IndusInd Bank Ltd. Banks 1.81
Asian Paints Ltd. Consumer Non Durables 1.59
Bharti Airtel Ltd. Telecom - Services 1.51
HCL Technologies Ltd. Software 1.34
Coal India Ltd. Minerals/Mining 1.31
Lupin Ltd. Pharmaceuticals 1.31
Hero MotoCorp Ltd. Auto 1.27
Yes Bank Ltd Banks 1.26
Oil & Natural Gas
Corporation Ltd. Oil 1.25
National Thermal Power
Corporation Limited Power 1.24
Ultratech Cement Ltd. Cement 1.23
Power Grid Corporation
Issuer / Instrument Industry/ % to Net Rating Assets
Of India Ltd Power 1.22
Dr Reddys Laboratories Ltd Pharmaceuticals 1.17
Bajaj Auto Ltd. Auto 1.16
Wipro Ltd. Software 1.11
Grasim Industries Ltd. Cement 1
Bharat Petroleum
Corporation Ltd. Petroleum Products 0.98
Tech Mahindra Ltd. Software 0.96
Eicher Motors Ltd Auto 0.87
Zee Entertainment
Enterprises Ltd Media and Entertainment 0.86
Cipla Ltd. Pharmaceuticals 0.84
Tata Steel Limited. Ferrous Metals 0.75
Bosch Limited Auto Ancillaries 0.72
Adani Port and Special
Economic Zone Limited Transportation 0.67
Ambuja Cements Ltd Cement 0.67
Aurobindo Pharma Ltd. Pharmaceuticals 0.67
Bharti Infratel Ltd. Telecom - Equipment & Accessories 0.66
GAIL (India) Ltd. Gas 0.57
Hindalco Industries Ltd Non - Ferrous Metals 0.54
Tata Motors Ltd - DVR Auto 0.51
ACC Ltd. Cement 0.50
Bank Of Baroda Banks 0.45
Bharat Heavy Electricals Ltd. Industrial Capital Goods 0.42
Tata Power Co. Ltd. Power 0.41
Idea Cellular Ltd. Telecom - Services 0.37
Listed/Awaiting Listing on Stock Exchange - Total 99.88
Net Current Assets/(Liabilities) 0.12
Grand Total 100
PORTFOLIO
NAV
Kotak Nifty ETF NAV as on July 29, 2016 : ̀ 871.6928
Investment Objective
The investment objective of the scheme is to provide returns before expenses that closely correspond to the total returns of the CNX Nifty subject to tracking errors.
Allotment Date
February 2, 2010
Fund Manager
Mr. Deepak Gupta*
Benchmark
Nifty 50
AAUM (`In Crores)
AAUM as on July 31, 2016: ̀ 423.18
AUM (`In Crores)
AUM as on July 31, 2016: ̀ 464.96
Available Plans/Options
A) Regular Plan
B) Direct Plan
Ratios
Portfolio Turnover: 23.01%
Tracking Error: 0.08%
Minimum Investment Amount
Through Exchange:1 Unit,
Through AMC: 5000 Units,
Ideal Investment Horizon: 3 years and above
Load Structure
Entry Load: Nil. (applicable for all plans)
Exit Load: Nil (applicable for all plans)
Total Expense Ratio**
Regular:0.13%
Direct: NA
**Total Expense Ratio excludes applicable B15 fee and service tax.
This product is suitable for investors who are seeking*:� Long term capital growth� Investment in stocks comprising the underlying index and endeavours to
track the benchmark index* Investors should consult their financial advisors if in doubt about whether the product is suitable for them.
PRODUCT LABEL
Investors understand that their principal will be at moderate risk
Riskometer
yletaredo
M
Moderate
Low
High
Low
High
LOW HIGH
Moderately
Sector Allocation (%)
Banks Software Consumer Non DurablesAuto Pharmaceuticals FinancePetroleum Products Construction Project CementPower Others
24.27
16.716.63
5.814.65
10.12
16.42
(As on July 31, 2016)
23.92
14.59
11.0510.41
6.86
6.83
6.284.043.40
2.879.75

41
KOTAK SENSEX ETFAn Open Ended Exchange Traded Fund[Eligible scheme under Rajiv Gandhi Equity Savings Scheme (RGESS)]
ETF SCHEMES
* For Fund Manager experience, please refer page 54-55. For scheme performance, please refer page no 44-53. For last three dividends, please refer page no 56-58
Issuer / Instrument Industry/ % to Net Rating Assets
Issuer / Instrument Industry/ % to Net Rating Assets
PORTFOLIO
NAV
Kotak Sensex ETF NAV as on July 29, 2016 : ̀ 287.6159
Investment Objective
The investment objective of the scheme is to provide returns before expenses that closely correspond to the total returns of the BSE SENSEX subject to tracking errors.
Allotment Date
June 6, 2008
Fund Manager
Mr. Deepak Gupta*
Benchmark
S&P BSE SENSEX
AAUM (`In Crores)
AAUM as on July 31, 2016: ̀ 11.39
AUM (`In Crores)
AUM as on July 31, 2016: ̀ 11.56
Available Plans/Options
A) Regular Plan
B) Direct Plan
Ratios
Portfolio Turnover: 20.33%
Tracking Error: 0.12%
Minimum Investment Amount
Through Exchange:1 Unit,
Through AMC: 10000 Units,
Ideal Investment Horizon: 3 years and above
Load Structure
Entry Load: Nil. (applicable for all plans)
Exit Load: Nil (applicable for all plans)
Total Expense Ratio**
Regular: 0.25%
Direct: NA
**Total Expense Ratio excludes applicable B15 fee and service tax.
PORTFOLIO
This product is suitable for investors who are seeking*:� Long term capital growth� Investment in stocks comprising the underlying index and endeavours to
track the benchmark index* Investors should consult their financial advisors if in doubt about whether the product is suitable for them.
PRODUCT LABEL
Investors understand that their principal will be at moderate risk
Riskometer
yletaredo
M
Moderate
Low
High
Low
High
LOW HIGH
Moderately
Banks Software AutoConsumer Non Durables Pharmaceuticals FinancePetroleum Products Construction Project
PowerTelecom - Services Others
Sector Allocation (%)
22.68
16.44
10.5510.12
10.06
8.1
6.115.68
5.65
22.67
17.4
10.510.29
9.87
8.28
6.155.2
5.4 22.46
16.58
10.7410.4
9.83
8.41
6.644.9
5.79
Equity & Equity related (Listed/Awaiting listing on Stock Exchange)
HDFC Bank Ltd. Banks 9.62
HDFC Ltd. Finance 8.49
Infosys Ltd. Software 8.39
ITC Ltd. Consumer Non Durables 8.34
Reliance Industries Ltd. Petroleum Products 6.56
ICICI Bank Ltd. Banks 5.97
Tata Consultancy Services Ltd. Software 5.24
Larsen And Toubro Ltd. Construction Project 4.99
Tata Motors Ltd. Auto 3.75
Axis Bank Ltd Banks 3.61
Sun Pharmaceuticals
Industries Ltd. Pharmaceuticals 3.51
State Bank Of India Banks 2.85
Mahindra & Mahindra Ltd. Auto 2.63
Hindustan Unilever Ltd. Consumer Non Durables 2.57
Maruti Suzuki India Limited Auto 2.47
Bharti Airtel Ltd. Telecom - Services 1.98
Asian Paints Ltd. Consumer Non Durables 1.96
Lupin Ltd. Pharmaceuticals 1.63
Coal India Ltd. Minerals/Mining 1.62
Oil & Natural Gas
Corporation Ltd. Oil 1.54
Hero MotoCorp Ltd. Auto 1.53
Power Grid Corporation
Of India Ltd Power 1.51
Dr Reddys Laboratories Ltd Pharmaceuticals 1.47
Bajaj Auto Ltd. Auto 1.44
Wipro Ltd. Software 1.37
National Thermal Power
Corporation Limited Power 1.28
Cipla Ltd. Pharmaceuticals 1.04
Tata Steel Limited. Ferrous Metals 0.93
Adani Port and Special
Economic Zone Limited Transportation 0.83
GAIL (India) Ltd. Gas 0.70
Listed/Awaiting Listing on Stock Exchange - Total 99.82
Net Current Assets/(Liabilities) 0.18
Grand Total 100
(As on July 31, 2016)
22.05
15.00
12.8711.82
8.49
7.65
6.56
4.992.79 1.98 5.80

42
KOTAK BANKING ETFAn Open Ended Exchange Traded Fund
ETF SCHEMES
* For Fund Manager experience, please refer page 54-55. For scheme performance, please refer page no 44-53. For last three dividends, please refer page no 56-58
Issuer / Instrument Industry/ % to Net Rating Assets
Equity & Equity related (Listed/Awaiting listing on Stock Exchange)
HDFC Bank Ltd. Banks 31.60
ICICI Bank Ltd. Banks 19.40
Axis Bank Ltd Banks 11.57
Kotak Mahindra Bank Ltd. Banks 10.31
State Bank Of India Banks 9.04
IndusInd Bank Ltd. Banks 7.28
Yes Bank Ltd Banks 5.07
Bank Of Baroda Banks 1.82
Federal Bank Ltd. Banks 1.41
Issuer / Instrument Industry/ % to Net Rating Assets
Punjab National Bank Banks 1.17
Canara Bank Banks 0.45
Bank of India Banks 0.33
Listed/Awaiting Listing on Stock Exchange - Total 99.45
Futures
CNX BANK INDEX-AUG2016 0.48
Futures (Market value represents Notional Value) - Total 0.48
Net Current Assets/(Liabilities) 0.07
Grand Total 100
PORTFOLIO
NAV
Kotak Banking ETF NAV as on July 29, 2016: ̀ 192.673
Investment Objective
The investment objective of the scheme is to provide returns before expenses that closely correspond to the total returns of stocks as represented by the CNX Bank Index subject to tracking errors. There can be no assurance or guarantee that the investment objective of the plan will be achieved.
Allotment Date
December 04, 2014
Fund Manager
Mr. Deepak Gupta*
Benchmark
Nifty Bank
AAUM (`In Crores)
AAUM as on July 31, 2016: ̀ 1,465.59
AUM (`In Crores)
AUM as on July 31, 2016: ̀ 1,464.91
Available Plans/Options
Option - Dividend Payout
Ratios
Portfolio Turnover: 46.68%
Tracking Error: 0.10%
Minimum Investment Amount
Through Exchange:1 Unit,
Through AMC: 15000 Units,
Ideal Investment Horizon: 3 years and above
Load Structure
Entry Load: Nil. (applicable for all plans)
Exit Load: Nil (applicable for all plans)
Total Expense Ratio**
Regular:0.20%
Direct: NA
**Total Expense Ratio excludes applicable B15 fee and service tax.
This product is suitable for investors who are seeking*:� Long term capital growth� Investment in stocks comprising the underlying index and endeavours to
track the benchmark index* Investors should consult their financial advisors if in doubt about whether the product is suitable for them.
PRODUCT LABEL
Investors understand that their principal will be at moderate risk
Riskometer
yletaredo
M
Moderate
Low
High
Low
High
LOW HIGH
Moderately
Sector Allocation (%)
(As on July 31, 2016)
99.45
0.48 0.07
Banks Derivatives Derivatives

43
KOTAK PSU BANK ETFAn Open Ended Exchange Traded Fund
ETF SCHEMES
* For Fund Manager experience, please refer page 54-55. For scheme performance, please refer page no 44-53. For last three dividends, please refer page no 56-58
Issuer / Instrument Industry/ % to Net Rating Assets
Equity & Equity related (Listed/Awaiting listing on Stock Exchange)
State Bank Of India Banks 62.50
Bank Of Baroda Banks 12.57
Punjab National Bank Banks 8.08
Canara Bank Banks 3.10
Union Bank Of India Banks 2.84
Bank of India Banks 2.29
Industrial Development Bank
of India Ltd. Banks 2.27
Issuer / Instrument Industry/ % to Net Rating Assets
Allahabad Bank. Banks 1.52
Andhra Bank Banks 1.40
Syndicate Bank Banks 1.39
Oriental Bank of Commerce Banks 1.24
Indian Overseas Bank Banks 0.78
Listed/Awaiting Listing on Stock Exchange - Total 99.98
Net Current Assets/(Liabilities) 0.02
Grand Total 100
PORTFOLIO
NAV
Kotak PSU Bank ETF NAV as on July 29, 2016: ̀ 293.3048
Investment Objective
The investment objective of the scheme is to provide returns that closely correspond to the total returns of CNX PSU Bank Index, subject to tracking errors.
Allotment Date
November 8, 2007
Fund Manager
Mr. Deepak Gupta*
Benchmark
Nifty PSU Bank
AAUM (`In Crores)
AAUM as on July 31, 2016: ̀ 130.17
AUM (`In Crores)
AUM as on July 31, 2016: ̀ 139.83
Available Plans/Options
A) Regular Plan
B) Direct Plan
Ratios
Portfolio Turnover: 92.12%
Tracking Error: 0.26%
Minimum Investment Amount
Through Exchange:1 Unit,
Through AMC: 10000 Units,
Ideal Investment Horizon: 3 years and above
Load Structure
Entry Load: Nil. (applicable for all plans)
Exit Load: Nil (applicable for all plans)Total
Total Expense Ratio**
Regular:0.49%
Direct: NA
**Total Expense Ratio excludes applicable B15 fee and service tax.
Sector Allocation (%)
This product is suitable for investors who are seeking*:� Long term capital growth� Investment in stocks comprising the underlying index and endeavours to
track the benchmark index* Investors should consult their financial advisors if in doubt about whether the product is suitable for them.
PRODUCT LABEL
Investors understand that their principal will be at moderate risk
Riskometer
yletaredo
M
Moderate
Low
High
Low
High
LOW HIGH
Moderately
Sector Allocation (%)
100.00
(As on July 31, 2016)
Banks Others
99.96
99.98
0.02

Scheme Performances as on June 30, 2016
44
Kotak 50 - Dividend
N.A stands for data not available. Note: Point to Point (PTP) Returns in INR show the value of ̀ 10,000/- investment made at inception. Source: ICRA MFI Explorer
# Name of Scheme Benchmark. ## Name of Additional Benchmark. ̂ Past performance may or may not be sustained in the future. All payouts during the period have been reinvested in the units of the scheme at the then prevailingNAV. Returns <= 1 year: Absolute; Returns > 1 year: CAGR (Compounded Annualised Growth Rate).
SchemeReturns ^
Nifty 50 #
S&P BSE Sensex ## Current Value of Standard Investment of ` 10000 in the
Scheme (`) Benchmark #(`)Additional
Benchmark # # (`)
Kotak Classic Equity - Growth
N.A stands for data not available. Note: Point to Point (PTP) Returns in INR show the value of ̀ 10,000/- investment made at inception. Source: ICRA MFI Explorer
# Name of Scheme Benchmark. ## Name of Additional Benchmark. ̂ Past performance may or may not be sustained in the future. All payouts during the period have been reinvested in the units of the scheme at the then prevailingNAV. Returns <= 1 year: Absolute; Returns > 1 year: CAGR (Compounded Annualised Growth Rate).
SchemeReturns ^
Nifty 100 #
Nifty 50## Current Value of Standard Investment of ` 10000 in the
Scheme (`) Benchmark #(`)Additional
Benchmark # # (`)
Kotak Select Focus Fund - Growth
N.A stands for data not available. Note: Point to Point (PTP) Returns in INR show the value of ̀ 10,000/- investment made at inception. Source: ICRA MFI Explorer
# Name of Scheme Benchmark. ## Name of Additional Benchmark. ̂ Past performance may or may not be sustained in the future. All payouts during the period have been reinvested in the units of the scheme at the then prevailingNAV. Returns <= 1 year: Absolute; Returns > 1 year: CAGR (Compounded Annualised Growth Rate).
SchemeReturns ^
Nifty 200#
Nifty 50 ## Current Value of Standard Investment of ` 10000 in the
Scheme (`) Benchmark #(`)Additional
Benchmark # # (`)
Since Inception till June 30, 2016 13.99 8.50 8.26 24,381 17,428 17,161
Jun 30, 2015 To Jun 30, 2016 6.63 0.04 -0.96
Jun 30, 2014 To Jun 30, 2015 26.40 11.57 9.95 NA
Jun 30, 2013 To Jun 30, 2014 43.12 34.02 30.28
Kotak Opportunities Fund - Growth
N.A stands for data not available. Note: Point to Point (PTP) Returns in INR show the value of ̀ 10,000/- investment made at inception. Source: ICRA MFI Explorer
# Name of Scheme Benchmark. ## Name of Additional Benchmark. ̂ Past performance may or may not be sustained in the future. All payouts during the period have been reinvested in the units of the scheme at the then prevailingNAV. Returns <= 1 year: Absolute; Returns > 1 year: CAGR (Compounded Annualised Growth Rate).
SchemeReturns^
Nifty 500#
Nifty 50 ## Current Value of Standard Investment of ` 10000 in the
Scheme (`) Benchmark #(`)Additional
Benchmark # # (`)
Since Inception till June 30, 2016 19.87 14.58 14.65 85,058 49,922 50,259
Jun 30, 2015 To Jun 30, 2016 3.03 1.21 -0.96
Jun 30, 2014 To Jun 30, 2015 26.33 11.71 9.95 NA
Jun 30, 2013 To Jun 30, 2014 36.69 36.87 30.28
Since Inception till June 30, 2016 12.28 12.58 12.35 35,480 36,532 35,737
Jun 30, 2015 To Jun 30, 2016 -0.23 -0.29 -0.96
Jun 30, 2014 To Jun 30, 2015 13.74 11.49 9.95 NA
Jun 30, 2013 To Jun 30, 2014 37.38 31.98 30.28
Since Inception till June 30, 2016 19.64 13.71 13.27 231,151 94,972 88,631
Jun 30, 2015 To Jun 30, 2016 -0.94 -0.96 -2.81
Jun 30, 2014 To Jun 30, 2015 21.56 9.95 9.31 NA
Jun 30, 2013 To Jun 30, 2014 30.62 30.28 31.03

41
Kotak Midcap Fund - Growth
N.A stands for data not available. Note: Point to Point (PTP) Returns in INR show the value of ̀ 10,000/- investment made at inception. Source: ICRA MFI Explorer
# Name of Scheme Benchmark. ## Name of Additional Benchmark. ̂ Past performance may or may not be sustained in the future. All payouts during the period have been reinvested in the units of the scheme at the then prevailingNAV. Returns <= 1 year: Absolute; Returns > 1 year: CAGR (Compounded Annualised Growth Rate).
SchemeReturns ^
Nifty Midcap 100#
Nifty 50 ## Current Value of Standard Investment of ` 10000 in the
Scheme (`) Benchmark #(`)Additional
Benchmark # # (`)
Since Inception till June 30, 2016 16.43 14.50 13.07 56,267 46,526 40,324
Jun 30, 2015 To Jun 30, 2016 9.82 6.20 -0.96
Jun 30, 2014 To Jun 30, 2015 31.81 17.24 9.95 NA
Jun 30, 2013 To Jun 30, 2014 53.69 51.13 30.28
Kotak Emerging Equity Scheme - Growth
N.A stands for data not available. Note: Point to Point (PTP) Returns in INR show the value of ̀ 10,000/- investment made at inception. Source: ICRA MFI Explorer
# Name of Scheme Benchmark. ## Name of Additional Benchmark. ̂ Past performance may or may not be sustained in the future. All payouts during the period have been reinvested in the units of the scheme at the then prevailingNAV. Returns <= 1 year: Absolute; Returns > 1 year: CAGR (Compounded Annualised Growth Rate).
SchemeReturns^
S&P BSE Midcap #
Nifty 50 ## Current Value of Standard Investment of ` 10000 in the
Scheme (`) Benchmark #(`)Additional
Benchmark # # (`)
Since Inception till June 30, 2016 12.13 10.32 8.72 28,867 24,835 21,687
Jun 30, 2015 To Jun 30, 2016 11.94 8.08 -0.96
Jun 30, 2014 To Jun 30, 2015 39.95 16.36 9.95 NA
Jun 30, 2013 To Jun 30, 2014 58.90 50.45 30.28
Kotak Tax Saver - Growth
N.A stands for data not available. Note: Point to Point (PTP) Returns in INR show the value of ̀ 10,000/- investment made at inception. Source: ICRA MFI Explorer
# Name of Scheme Benchmark. ## Name of Additional Benchmark. ̂ Past performance may or may not be sustained in the future. All payouts during the period have been reinvested in the units of the scheme at the then prevailingNAV. Returns <= 1 year: Absolute; Returns > 1 year: CAGR (Compounded Annualised Growth Rate).
SchemeReturns^
Nifty 500 #
Nifty 50## Current Value of Standard Investment of ` 10000 in the
Scheme (`) Benchmark #(`)Additional
Benchmark # # (`)
Since Inception till June 30, 2016 11.34 11.24 11.51 31,256 30,950 31,771
Jun 30, 2015 To Jun 30, 2016 0.35 1.21 -0.96
Jun 30, 2014 To Jun 30, 2015 30.25 11.71 9.95
Jun 30, 2013 To Jun 30, 2014 33.44 36.87 30.28
45
Kotak Infrastructure & Economic Reform Fund - Growth
N.A stands for data not available. Note: Point to Point (PTP) Returns in INR show the value of ̀ 10,000/- investment made at inception. Source: ICRA MFI Explorer.
# Name of Scheme Benchmark. ## Name of Additional Benchmark. ̂ Past performance may or may not be sustained in future. All payouts during the period have been reinvested in the units of the scheme at the then prevailingNAV. Returns <= 1 year: Absolute; Returns > 1 year: CAGR (Compounded Annualised Growth Rate).
SchemeReturns^
S&P BSE 100 #
Nifty 50## Current Value of Standard Investment of ` 10000 in the
Scheme (`) Benchmark #(`)Additional
Benchmark # # (`)
Since Inception till June 30, 2016 6.09 5.39 5.74 16,377 15,502 15,936
Jun 30, 2015 To Jun 30, 2016 6.27 -0.40 -0.96
Jun 30, 2014 To Jun 30, 2015 22.26 9.32 9.95 NA
Jun 30, 2013 To Jun 30, 2014 60.94 33.44 30.28
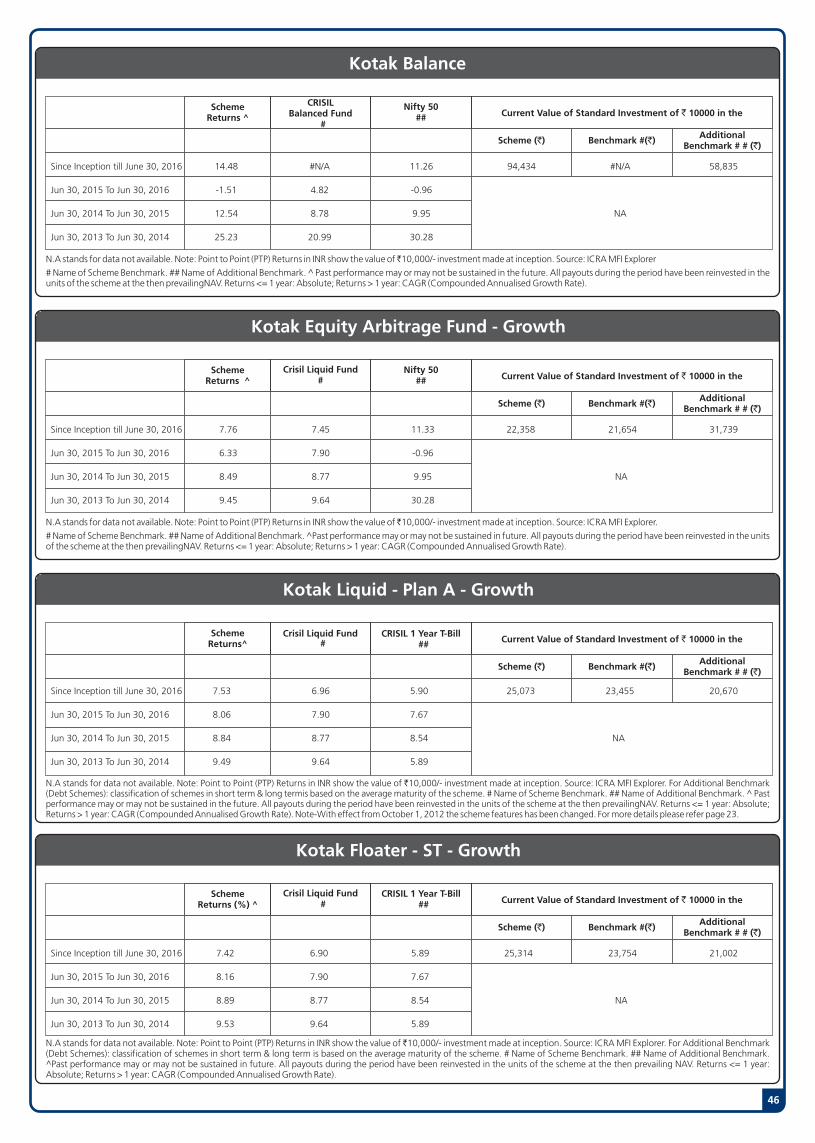
Kotak Equity Arbitrage Fund - Growth
N.A stands for data not available. Note: Point to Point (PTP) Returns in INR show the value of ̀ 10,000/- investment made at inception. Source: ICRA MFI Explorer.
# Name of Scheme Benchmark. ## Name of Additional Benchmark. ̂ Past performance may or may not be sustained in future. All payouts during the period have been reinvested in the units of the scheme at the then prevailingNAV. Returns <= 1 year: Absolute; Returns > 1 year: CAGR (Compounded Annualised Growth Rate).
SchemeReturns ^
Crisil Liquid Fund#
Nifty 50## Current Value of Standard Investment of ` 10000 in the
Scheme (`) Benchmark #(`)Additional
Benchmark # # (`)
Since Inception till June 30, 2016 7.76 7.45 11.33 22,358 21,654 31,739
Jun 30, 2015 To Jun 30, 2016 6.33 7.90 -0.96
Jun 30, 2014 To Jun 30, 2015 8.49 8.77 9.95 NA
Jun 30, 2013 To Jun 30, 2014 9.45 9.64 30.28
46
Kotak Balance
N.A stands for data not available. Note: Point to Point (PTP) Returns in INR show the value of ̀ 10,000/- investment made at inception. Source: ICRA MFI Explorer
# Name of Scheme Benchmark. ## Name of Additional Benchmark. ̂ Past performance may or may not be sustained in the future. All payouts during the period have been reinvested in the units of the scheme at the then prevailingNAV. Returns <= 1 year: Absolute; Returns > 1 year: CAGR (Compounded Annualised Growth Rate).
SchemeReturns ^
CRISILBalanced Fund
#
Nifty 50## Current Value of Standard Investment of ` 10000 in the
Scheme (`) Benchmark #(`)Additional
Benchmark # # (`)
Since Inception till June 30, 2016 14.48 #N/A 11.26 94,434 #N/A 58,835
Jun 30, 2015 To Jun 30, 2016 -1.51 4.82 -0.96
Jun 30, 2014 To Jun 30, 2015 12.54 8.78 9.95 NA
Jun 30, 2013 To Jun 30, 2014 25.23 20.99 30.28
Kotak Liquid - Plan A - Growth
N.A stands for data not available. Note: Point to Point (PTP) Returns in INR show the value of `10,000/- investment made at inception. Source: ICRA MFI Explorer. For Additional Benchmark (Debt Schemes): classification of schemes in short term & long termis based on the average maturity of the scheme. # Name of Scheme Benchmark. ## Name of Additional Benchmark. ̂ Past performance may or may not be sustained in the future. All payouts during the period have been reinvested in the units of the scheme at the then prevailingNAV. Returns <= 1 year: Absolute; Returns > 1 year: CAGR (Compounded Annualised Growth Rate). Note-With effect from October 1, 2012 the scheme features has been changed. For more details please refer page 23.
SchemeReturns^
Crisil Liquid Fund #
CRISIL 1 Year T-Bill ## Current Value of Standard Investment of ` 10000 in the
Scheme (`) Benchmark #(`)Additional
Benchmark # # (`)
Since Inception till June 30, 2016 7.53 6.96 5.90 25,073 23,455 20,670
Jun 30, 2015 To Jun 30, 2016 8.06 7.90 7.67
Jun 30, 2014 To Jun 30, 2015 8.84 8.77 8.54 NA
Jun 30, 2013 To Jun 30, 2014 9.49 9.64 5.89
Kotak Floater - ST - Growth
SchemeReturns (%) ^
Crisil Liquid Fund #
CRISIL 1 Year T-Bill ## Current Value of Standard Investment of ` 10000 in the
Scheme (`) Benchmark #(`)Additional
Benchmark # # (`)
Since Inception till June 30, 2016 7.42 6.90 5.89 25,314 23,754 21,002
Jun 30, 2015 To Jun 30, 2016 8.16 7.90 7.67
Jun 30, 2014 To Jun 30, 2015 8.89 8.77 8.54 NA
Jun 30, 2013 To Jun 30, 2014 9.53 9.64 5.89
N.A stands for data not available. Note: Point to Point (PTP) Returns in INR show the value of ̀ 10,000/- investment made at inception. Source: ICRA MFI Explorer. For Additional Benchmark (Debt Schemes): classification of schemes in short term & long term is based on the average maturity of the scheme. # Name of Scheme Benchmark. ## Name of Additional Benchmark. ^Past performance may or may not be sustained in future. All payouts during the period have been reinvested in the units of the scheme at the then prevailing NAV. Returns <= 1 year: Absolute; Returns > 1 year: CAGR (Compounded Annualised Growth Rate).

47
Kotak Treasury Advantage Fund - Growth
N.A stands for data not available. Note: Point to Point (PTP) Returns in INR show the value of ̀ 10,000/- investment made at inception. Source: ICRA MFI Explorer. For Additional Benchmark (Debt Schemes): classification of schemes in short term & long term is based on the average maturity of the scheme. # Name of Scheme Benchmark. ## Name of Additional Benchmark. ^Past performance may or may not be sustained in future. All payouts during the period have been reinvested in the units of the scheme at the then prevailingNAV. Returns <= 1 year: Absolute; Returns > 1 year: CAGR (Compounded Annualised Growth Rate).
SchemeReturns ^
Crisil Liquid Fund #
CRISIL 1 Year TBill ## Current Value of Standard Investment of ` 10000 in the
Scheme (`) Benchmark #(`)Additional
Benchmark # # (`)
Since Inception till June 30, 2016 7.87 7.16 6.02 24,616 22,756 20,043
Jun 30, 2015 To Jun 30, 2016 8.27 7.90 7.67
Jun 30, 2014 To Jun 30, 2015 9.07 8.77 8.54 NA
Jun 30, 2013 To Jun 30, 2014 9.08 9.64 5.89
Kotak Banking and PSU Debt Fund - Growth
SchemeReturns^
Crisil Liquid Fund #
CRISIL 1 Year TBill ## Current Value of Standard Investment of ` 10000 in the
Scheme (`) Benchmark #(`)Additional
Benchmark # # (`)
Since Inception till June 30, 2016 7.31 #N/A 6.66 34,386 #N/A 30,912
Jun 30, 2015 To Jun 30, 2016 8.29 7.90 7.67
Jun 30, 2014 To Jun 30, 2015 8.88 8.77 8.54 NA
Jun 30, 2013 To Jun 30, 2014 10.44 9.64 5.89
Note: Point to Point (PTP) Returns in INR show the value of ̀ 10,000/- investment made at inception. Source: ICRA MFI Explorer. For Additional Benchmark (Debt Schemes): classification of schemes in short term & long term is based on the average maturity of the scheme. # Name of Scheme Benchmark. ## Name of Additional Benchmark. ̂ Past performance may or may not be sustained in the future. All payouts during the period have been reinvested in the units of the scheme at the then prevailing NAV. Returns <= 1 year: Absolute; Returns > 1 year: CAGR (Compounded Annualised Growth Rate).
Kotak Low Duration Fund - Growth
SchemeReturns^
CRISIL Liquid Fund #
CRISIL 1 Year T-Bill ## Current Value of Standard Investment of ` 10000 in the
Scheme (`) Benchmark #(`)Additional
Benchmark # # (`)
Since Inception till June 30, 2016 7.74 7.73 6.48 18,603 18,587 16,858
Jun 30, 2015 To Jun 30, 2016 8.88 7.90 7.67
Jun 30, 2014 To Jun 30, 2015 9.83 8.77 8.54 NA
Jun 30, 2013 To Jun 30, 2014 7.24 9.64 5.89
N.A stands for data not available. Note: Point to Point (PTP) Returns in INR show the value of `10,000/- investment made at inception. Source: ICRAMFI Explorer. # Name of Scheme Benchmark. ## Name of Additional Benchmark. ̂ Past performance may or may not be sustained in future. All payouts during the period have been reinvested in the units of the scheme at the then prevailingNAV. Returns <= 1 year: Absolute; Returns > 1 year:CAGR(Compounded Annualised Growth Rate).
Kotak Bond Short Term Plan - Growth
N.A stands for data not available. Note: Point to Point (PTP) Returns in INR show the value of ̀ 10,000/- investment made at inception. Source: ICRA MFI Explorer. For Additional Benchmark (Debt Schemes): classification of schemes in short term& long termis based on the average maturity of the scheme. # Name of Scheme Benchmark. ## Name of Additional Benchmark. ̂ Past performance may or may not be sustained in future. All payouts during the period have been reinvested in the units of the scheme at the then prevailing NAV. Returns <= 1 year: Absolute; Returns > 1 year: CAGR (Compounded Annualised Growth Rate).
SchemeReturns^
Crisil Short Term BondFund#
CRISIL 1Year T-Bill ## Current Value of Standard Investment of ` 10000 in the
Scheme (`) Benchmark #(`)Additional
Benchmark # # (`)
Since Inception till June 30, 2016 7.74 7.19 5.93 28,772 26,761 22,614
Jun 30, 2015 To Jun 30, 2016 8.51 8.94 7.67
Jun 30, 2014 To Jun 30, 2015 8.90 9.56 8.54 NA
Jun 30, 2013 To Jun 30, 2014 7.26 8.76 5.89

Kotak Income Opportunities Fund - Growth
N.A stands for data not available. Note: Point to Point (PTP) Returns in INR show the value of ̀ 10,000/- investment made at inception. Source: ICRA MFI Explorer. For Additional Benchmark (Debt Schemes): classification of schemes in short term & long term is based on the average maturity of the scheme. # Name of Scheme Benchmark. ## Name of Additional Benchmark. ^Past performance may or may not be sustained in future. All payouts during the period have been reinvested in the units of the scheme at the then prevailingNAV. Returns <= 1 year: Absolute; Returns > 1 year: CAGR (Compounded Annualised Growth Rate).
SchemeReturns^
Crisil Short Term Bond Fund #
CRISIL 1 Year TBill ## Current Value of Standard Investment of ` 10000 in the
Scheme (`) Benchmark #(`)Additional
Benchmark # # (`)
Since Inception till June 30, 2016 8.64 8.39 6.87 16,641 16,400 15,040
Jun 30, 2015 To Jun 30, 2016 9.32 8.94 7.67
Jun 30, 2014 To Jun 30, 2015 9.62 9.56 8.54 NA
Jun 30, 2013 To Jun 30, 2014 8.43 8.76 5.89
48
Kotak Flexi Debt Fund - Plan A - Growth
N.A stands for data not available. Note: Point to Point (PTP) Returns in INR show the value of ̀ 10,000/- investment made at inception. Source: ICRA MFI Explorer. For Additional Benchmark (Debt Schemes): classification of schemes in short term & long term is based on the average maturity of the scheme. # Name of Scheme Benchmark. ## Name of Additional Benchmark. ̂ Past performance may or may not be sustained in the future. All payouts during the period have been reinvested in the units of the scheme at the then prevailingNAV. Returns <= 1 year: Absolute; Returns > 1 year: CAGR (Compounded Annualised Growth Rate).
SchemeReturns^
Crisil Composite Bond Fund #
CRISIL 1 Year T-Bill ## Current Value of Standard Investment of ` 10000 in the
Scheme (`) Benchmark #(`)Additional
Benchmark # # (`)
Since Inception till June 30, 2016 8.45 7.84 6.47 19,296 18,429 16,621
Jun 30, 2015 To Jun 30, 2016 10.53 10.19 7.67
Jun 30, 2014 To Jun 30, 2015 8.25 11.10 8.54 NA
Jun 30, 2013 To Jun 30, 2014 8.79 4.55 5.89
Kotak Corporate Bond Fund - Growth
N.A stands for data not available. Note: Point to Point (PTP) Returns in INR show the value of `10,000/- investment made at inception. Source: ICRA MFI Explorer. # Name of Scheme Benchmark. ## Name of Additional Benchmark. ̂ Past performance may or may not be sustained in future. All payouts during the period have been reinvested in the units of the scheme at the then prevailing NAV. Returns <= 1 year: Absolute; Returns > 1 year: CAGR (Compounded Annualised Growth Rate).
SchemeReturns ^
Crisil Composite Bond Fund #
CRISIL 1 Year Gilt ## Current Value of Standard Investment of ` 10000 in the
Scheme (`) Benchmark #(`)Additional
Benchmark # # (`)
Since Inception till June 30, 2016 8.19 7.74 6.42 19,966 19,248 17,274
Jun 30, 2015 To Jun 30, 2016 8.40 10.19 7.67
Jun 30, 2014 To Jun 30, 2015 12.85 11.10 8.54 NA
Jun 30, 2013 To Jun 30, 2014 3.29 4.55 5.89
Kotak Medium Term Fund - Growth
N.A stands for data not available. Note: Point to Point (PTP) Returns in INR show the value of ̀ 10,000/- investment made at inception. Source: ICRA MFI Explorer. For Additional Benchmark (Debt Schemes): classification of schemes in short term & long term is based on the average maturity of the scheme. # Name of Scheme Benchmark. ## Name of Additional Benchmark. ̂ Past performance may or may not be sustained in the future. All payouts during the period have been reinvested in the units of the scheme at the then prevailing NAV. Returns <= 1 year: Absolute; Returns > 1 year: CAGR (Compounded Annualised Growth Rate).
SchemeReturns ^
CRISIL Composite Bond Fund #
CRISIL 10 Year Gilt ## Current Value of Standard Investment of ` 10000 in the
Scheme (`) Benchmark #(`)Additional
Benchmark # # (`)
Since Inception till June 30, 2016 10.22 11.21 10.82 12,460 12,714 12,613
Jun 30, 2015 To Jun 30, 2016 9.56 10.19 10.03
Jun 30, 2014 To Jun 30, 2015 10.20 11.10 11.76 NA

49
Kotak Gilt Investment PF & Trust Plan - Growth
N.A stands for data not available. Note: Point to Point (PTP) Returns in INR show the value of ̀ 10,000/- investment made at inception. Source: ICRA MFI Explorer.
For Additional Benchmark (Debt Schemes): classification of schemes in short term & long term is based on the average maturity of the scheme. # Name of Scheme Benchmark. ## Name of Additional Benchmark. ̂ Past performance may or may not be sustained in the future. All payouts during the period have been reinvested in the units of the scheme at the then prevailing NAV. Returns <= 1 year: Absolute; Returns > 1 year: CAGR (Compounded Annualised Growth Rate).
SchemeReturns^
ISEC Composite #
CRISIL 10 Year Gilt ## Current Value of Standard Investment of ` 10000 in the
Scheme (`) Benchmark #(`)Additional
Benchmark # # (`)
Since Inception till June 30, 2016 7.39 7.33 5.29 24,627 24,449 19,180
Jun 30, 2015 To Jun 30, 2016 10.46 10.81 10.03
Jun 30, 2014 To Jun 30, 2015 11.24 11.70 11.76 NA
Jun 30, 2013 To Jun 30, 2014 -0.57 4.07 -2.51
Kotak Gilt - Investment Regular Plan - Growth
SchemeReturns^
ISEC Composite #
CRISIL 10 Year Gilt ## Current Value of Standard Investment of ` 10000 in the
Scheme (`) Benchmark #(`)Additional
Benchmark # # (`)
Since Inception till June 30, 2016 9.88 NA NA 52,066 NA NA
Jun 30, 2015 To Jun 30, 2016 10.33 10.81 10.03
Jun 30, 2014 To Jun 30, 2015 11.24 11.70 11.76 NA
Jun 30, 2013 To Jun 30, 2014 -0.67 4.07 -2.51
Kotak Monthly Income Plan - Growth
SchemeReturns ^
Crisil MIP Blended #
CRISIL 10 Year Gilt ## Current Value of Standard Investment of ` 10000 in the
Scheme (`) Benchmark #(`)Additional
Benchmark # # (`)
Since Inception till June 30, 2016 7.69 7.96 5.37 25,422 26,213 19,315
Jun 30, 2015 To Jun 30, 2016 9.52 8.63 10.03
Jun 30, 2014 To Jun 30, 2015 11.27 11.05 11.76 NA
Jun 30, 2013 To Jun 30, 2014 11.71 8.24 -2.51
N.A stands for data not available. Note: Point to Point (PTP) Returns in INR show the value of ̀ 10,000/- investment made at inception. Source: ICRA MFI Explorer. For Additional Benchmark (Debt Schemes): classification of schemes in short term& long term is based on the average maturity of the scheme. # Name of Scheme Benchmark. ## Name of Additional Benchmark. ̂ Past performance may or may not be sustained in the future. All payouts during the period have been reinvested in the units of the scheme at the then prevailing NAV. Returns <= 1 year: Absolute; Returns > 1 year: CAGR (Compounded Annualised Growth Rate).
Kotak Bond - Plan A - Growth
N.A stands for data not available. Note: Point to Point (PTP) Returns in INR show the value of ̀ 10,000/- investment made at inception. Source: ICRA MFI Explorer. For Additional Benchmark (Debt Schemes): classification of schemes in short term & long term is based on the average maturity of the scheme. # Name of Scheme Benchmark. ## Name of Additional Benchmark. ̂ Past performance may or may not be sustained in the future. All payouts during the period have been reinvested in the units of the scheme at the then prevailing NAV. Returns <= 1 year: Absolute; Returns > 1 year: CAGR (Compounded Annualised Growth Rate).
SchemeReturns^
Crisil Composite Bond Fund #
CRISIL 10 Year Gilt ## Current Value of Standard Investment of ` 10000 in the
Scheme (`) Benchmark #(`)Additional
Benchmark # # (`)
Since Inception till June 30, 2016 9.21 #N/A #N/A 43,188 #N/A #N/A
Jun 30, 2015 To Jun 30, 2016 9.55 10.19 10.03
Jun 30, 2014 To Jun 30, 2015 9.75 11.10 11.76 NA
Jun 30, 2013 To Jun 30, 2014 1.80 4.55 -2.51

50
Kotak US Equity Fund - Growth
N.A stands for data not available. Note: Point to Point (PTP) Returns in INR show the value of ̀ 10,000/- investment made at inception. Source: ICRA MFI Explorer.
#Name of Scheme Benchmark. ## Name of Additional Benchmark. ̂ Past performance may or may not be sustained in future. All payouts during the period have been reinvested in the units of the scheme at the then prevailingNAV. Returns <= 1 year: Absolute; Returns > 1 year: CAGR (Compounded Annualised Growth Rate).
SchemeReturns ^
Standard & Poor�s 500 Total Return Net
#
Nifty 50 ## Current Value of Standard Investment of ` 10000 in the
Scheme (`) Benchmark #(`)Additional
Benchmark # # (`)
Since Inception till June 30, 2016 7.54 11.84 11.63 12,019 13,271 13,209
Jun 30, 2015 To Jun 30, 2016 3.59 10.39 -0.96
Jun 30, 2014 To Jun 30, 2015 11.31 13.81 9.95 NA
Kotak Gold ETF
N.A stands for data not available. Note: Point to Point (PTP) Returns in INR show the value of `10,000/- investment made at inception. Source: ICRA MFI Explorer. # Name of Scheme Benchmark. ## Name of Additional Benchmark. ̂ Past performance may or may not be sustained in the future. All payouts during the period have been reinvested in the units of the scheme at the then prevailingNAV. Returns <= 1 year: Absolute; Returns > 1 year: CAGR (Compounded Annualised Growth Rate).
SchemeReturns^
Physical Gold Price#
CRISIL 10 Year Gilt ## Current Value of Standard Investment of ` 10000 in the
Scheme (`) Benchmark #(`)Additional
Benchmark # # (`)
Since Inception till June 30, 2016 14.15 15.52 6.77 32,610 36,279 17,951
Jun 30, 2015 To Jun 30, 2016 17.67 18.96 10.03
Jun 30, 2014 To Jun 30, 2015 -5.60 -4.55 11.76 NA
Jun 30, 2013 To Jun 30, 2014 9.64 10.96 -2.51
Kotak World Gold Fund - Growth
N.A stands for data not available. Note: Point to Point (PTP) Returns in INR show the value of ̀ 10,000/- investment made at inception. Source: ICRA MFI Explorer.
# Name of Scheme Benchmark. ## Name of Additional Benchmark. ̂ Past performance may or may not be sustained in future. All payouts during the period have been reinvested in the units of the scheme at the then prevailing NAV. Returns <= 1 year: Absolute; Returns > 1 year: CAGR (Compounded Annualised Growth Rate).
SchemeReturns ^
Financial TimesGold Mines Total-Price
#
Nifty 50 ## Current Value of Standard Investment of ` 10000 in the
Scheme (`) Benchmark #(`)Additional
Benchmark # # (`)
Since Inception till June 30, 2016 2.08 0.83 7.49 11,808 10,689 17,909
Jun 30, 2015 To Jun 30, 2016 54.51 80.36 -0.96
Jun 30, 2014 To Jun 30, 2015 -32.05 -25.98 9.95 NA
Jun 30, 2013 To Jun 30, 2014 31.39 12.52 30.28
Kotak Multi Asset Allocation Fund - Growth
N.A stands for data not available. Note: Point to Point (PTP) Returns in INR show the value of ̀ 10,000/- investment made at inception. Source: ICRA MFI Explorer.
#Name of Scheme Benchmark. ## Name of Additional Benchmark. ̂ Past performance may or may not be sustained in future. All payouts during the period have been reinvested in the units of the scheme at the then prevailingNAV. Returns <= 1 year: Absolute; Returns > 1 year: CAGR (Compounded Annualised Growth Rate).
SchemeReturns ^
75% Crisil Short termBond Fund ,15%Nifty 50 & 10% Prices of Gold #
CRISIL 10 Year Gilt ## Current Value of Standard Investment of ` 10000 in the
Scheme (`) Benchmark #(`)Additional
Benchmark # # (`)
Since Inception till June 30, 2016 7.97 9.02 7.22 15,182 16,001 14,612
Jun 30, 2015 To Jun 30, 2016 6.65 8.72 10.03
Jun 30, 2014 To Jun 30, 2015 7.46 8.32 11.76 NA
Jun 30, 2013 To Jun 30, 2014 8.07 12.38 -2.51

51
Kotak SENSEX ETF
SchemeReturns^
S&P BSESensex #
Nifty 50 ##Current Value of Standard Investment of ` 10000 in the
Scheme (`) Benchmark #(`)Additional
Benchmark # # (`)
Since Inception till June 30, 2016 8.17 7.06 7.49 18,850 17,338 17,909
Jun 30, 2015 To Jun 30, 2016 -1.53 -2.81 -0.96
Jun 30, 2014 To Jun 30, 2015 10.48 9.31 9.95 NA
Jun 30, 2013 To Jun 30, 2014 32.14 31.03 30.28
N.A stands for data not available. Note: Point to Point (PTP) Returns in INR show the value of ̀ 10,000/- investment made at inception. Source: ICRA MFI Explorer.
# Name of Scheme Benchmark. ## Name of Additional Benchmark. ̂ Past performance may or may not be sustained in the future. All payouts during the period have been reinvested in the units of the scheme at the then prevailing NAV. Returns <= 1 year: Absolute; Returns > 1 year: CAGR (Compounded Annualised Growth Rate).
Kotak PSU Bank ETF
N.A stands for data not available. Note: Point to Point (PTP) Returns in INR show the value of `10,000/- investment made at inception. Source: ICRA MFI Explorer # Name of Scheme Benchmark. ## Name of Additional Benchmark. ̂ Past performance may or may not be sustained in the future. All payouts during the period have been reinvested in the units of the scheme at the then prevailing NAV. Returns <= 1 year: Absolute; Returns > 1 year: CAGR (Compounded Annualised Growth Rate).
SchemeReturns^
Nifty PSU Bank #
Nifty 50 ## Current Value of Standard Investment of ` 10000 in the
Scheme (`) Benchmark #(`)Additional
Benchmark # # (`)
Since Inception till June 30, 2016 1.37 -0.66 4.43 11,246 9,443 14,543
Jun 30, 2015 To Jun 30, 2016 -15.27 -15.59 -0.96
Jun 30, 2014 To Jun 30, 2015 -15.74 -16.71 9.95 NA
Jun 30, 2013 To Jun 30, 2014 43.74 41.25 30.28
Kotak Global Emerging Equity Market Fund
N.A stands for data not available. Note: Point to Point (PTP) Returns in INR show the value of `10,000/- investment made at inception. Source: ICRA MFI Explorer # Name of Scheme Benchmark. ## Name of Additional Benchmark. ̂ Past performance may or may not be sustained in the future. All payouts during the period have been reinvested in the units of the scheme at the then prevailing NAV. Returns <= 1 year: Absolute; Returns > 1 year: CAGR (Compounded Annualised Growth Rate).
SchemeReturns^
MSCI Emerging Market Index #
Nifty 50 ## Current Value of Standard Investment of ` 10000 in the
Scheme (`) Benchmark #(`)Additional
Benchmark # # (`)
Since Inception till June 30, 2016 2.85 2.11 6.08 12,797 12,012 16,775
Jun 30, 2015 To Jun 30, 2016 -14.43 -8.93 -0.96
Jun 30, 2014 To Jun 30, 2015 3.60 -1.98 9.95 NA
Jun 30, 2013 To Jun 30, 2014 15.67 12.51 30.28
Kotak Nifty ETF
N.A stands for data not available. Note: Point to Point (PTP) Returns in INR show the value of ̀ 10,000/- investment made at inception. Source: ICRA MFI Explorer.
# Name of Scheme Benchmark. ## Name of Additional Benchmark. ̂ Past performance may or may not be sustained in the future. All payouts during the period have been reinvested in the units of the scheme at the then prevailing NAV. Returns <= 1 year: Absolute; Returns > 1 year: CAGR (Compounded Annualised Growth Rate).
SchemeReturns ^
Nifty 50 #
S&P BSE Sensex ## Current Value of Standard Investment of ` 10000 in the
Scheme (`) Benchmark #(`)Additional
Benchmark # # (`)
Since Inception till June 30, 2016 10.21 9.06 8.60 18,617 17,410 16,943
Jun 30, 2015 To Jun 30, 2016 0.41 -0.96 -2.81
Jun 30, 2014 To Jun 30, 2015 11.18 9.95 9.31 NA
Jun 30, 2013 To Jun 30, 2014 31.49 30.28 31.03

52
Kotak Asset Allocator Fund - Growth
N.A stands for data not available. Note: Point to Point (PTP) Returns in INR show the value of `10,000/- investment made at inception. Source: ICRA MFI Explorer # Name of Scheme Benchmark. ## Name of Additional Benchmark. ̂ Past performance may or may not be sustained in the future. All payouts during the period have been reinvested in the units of the scheme at the then prevailing NAV. Returns <= 1 year: Absolute; Returns > 1 year: CAGR (Compounded Annualised Growth Rate).
SchemeReturns ^
CRISIL Balanced Fund #
S&P BSE SENSEX ## Current Value of Standard Investment of ` 10000 in the
Scheme (`) Benchmark #(`)Additional
Benchmark # # (`)
Since Inception till June 30, 2016 16.94 12.09 14.79 64,399 38,875 51,593
Jun 30, 2015 To Jun 30, 2016 8.56 4.82 -2.81
Jun 30, 2014 To Jun 30, 2015 12.64 8.78 9.31 NA
Jun 30, 2013 To Jun 30, 2014 43.61 20.99 31.03
OTHER PERFORMANCE
Kotak Equity Savings Fund - Growth
SchemeReturns ^
75% Crisil Liquid Fund Index & 25% Nifty 50 #
Nifty 50 ##Current Value of Standard Investment of ` 10000 in the
Scheme (`) Benchmark #(`)Additional
Benchmark ## (`)
Since Inception till June 30, 2016 7.54 5.39 2.95 11,327 10,942 10,512
Jun 30, 2015 To Jun 30, 2016 5.48 3.10 -0.96 NA
Kotak Banking ETF
SchemeReturns ^
Nifty Bank # Nifty 50##Current Value of Standard Investment of ` 10000 in the
Scheme (`) Benchmark #(`)Additional
Benchmark ## (`)
Since Inception till June 30, 2016 -0.89 -1.85 -0.52 9,862 9,714 9,919
Jun 30, 2015 To Jun 30, 2016 -1.04 -1.97 -0.96 NA
N.A stands for data not available. Note: Point to Point (PTP) Returns in INR show the value of `10,000/- investment made at inception. Source: ICRA MFI Explorer # Name of Scheme Benchmark. ## Name of Additional Benchmark. ̂ Past performance may or may not be sustained in the future. All payouts during the period have been reinvested in the units of the scheme at the then prevailing NAV. Returns <= 1 year: Absolute; Returns > 1 year: CAGR (Compounded Annualised Growth Rate).
N.A stands for data not available. Note: Point to Point (PTP) Returns in INR show the value of `10,000/- investment made at inception. Source: ICRA MFI Explorer # Name of Scheme Benchmark. ## Name of Additional Benchmark. ̂ Past performance may or may not be sustained in the future. All payouts during the period have been reinvested in the units of the scheme at the then prevailing NAV. Returns <= 1 year: Absolute; Returns > 1 year: CAGR (Compounded Annualised Growth Rate).
Kotak India Growth Fund - Series I - Regular Plan - Growth
SchemeReturns ^
Nifty 200 # (%) Nifty 50 # # (%)Current Value of Standard Investment of ` 10000 in the
Scheme (`) Benchmark #(`)Additional
Benchmark ## (`)
Since Inception till June 30, 2016 6.45 2.95 2.04 10,748 10,341 10,236
Jun 30, 2015 To Jun 30, 2016 4.60 0.04 -0.96 NA
N.A stands for data not available. Note: Point to Point (PTP) Returns in INR show the value of `10,000/- investment made at inception. Source: ICRA MFI Explorer # Name of Scheme Benchmark. ## Name of Additional Benchmark. ̂ Past performance may or may not be sustained in the future. All payouts during the period have been reinvested in the units of the scheme at the then prevailing NAV. Returns <= 1 year: Absolute; Returns > 1 year: CAGR (Compounded Annualised Growth Rate).

53OTHER PERFORMANCE
FMP's and Gold Fund Performance as on June 30, 2016
Kotak FMP Series 108 - (733D) - Regular Plan - Growth
SchemeReturns ^
Crisil Short TermBond Fund #
CRISIL 1 YearT-Bill ## Current Value of Standard Investment of ` 10000 in the
Scheme (`) Benchmark #(`)Additional
Benchmark ## (`)
Since Inception till June 30, 2016 9.16 9.68 8.19 12,892 13,072 12,563
Jun 30, 2015 To Jun 30, 2016 7.78 8.94 7.67
Jun 30, 2014 To Jun 30, 2015 9.09 9.56 8.54 NA
Kotak FMP Series 153 - (790D) - Regular Plan - Growth
SchemeReturns (%) ^
Crisil Short TermBond Fund #
CRISIL 1 YearT-Bill ## Current Value of Standard Investment of ` 10000 in the
Scheme (`) Benchmark #(`)Additional
Benchmark ## (`)
Since Inception till June 30, 2016 9.14 9.35 8.13 12,185 12,239 11,931
Jun 30, 2015 To Jun 30, 2016 7.69 8.94 7.67
Jun 30, 2014 To Jun 30, 2015 9.82 9.56 8.54 NA
Kotak FMP Series 172 - (1126D) - Regular Plan - Growth
SchemeReturns (%) ^
Crisil Short TermBond Fund #
CRISIL 1 YearT-Bill ## Current Value of Standard Investment of ` 10000 in the
Scheme (`) Benchmark #(`)Additional
Benchmark ## (`)
Since Inception till June 30, 2016 13.34 11.26 10.38 11,714 11,443 11,328
Jun 30, 2015 To Jun 30, 2016 10.41 10.19 10.03 NA
Kotak FMP Series 129 - (371D) - Reg - Growth
SchemeReturns (%) ^
Crisil Short TermBond Fund #
CRISIL 1 YearT-Bill ## Current Value of Standard Investment of ` 10000 in the
Scheme (`) Benchmark #(`)Additional
Benchmark ## (`)
Since Inception till June 30, 2016 8.33 9.49 8.18 12,254 12,589 12,210
Jun 30, 2015 To Jun 30, 2016 7.67 8.94 7.67
Jun 30, 2014 To Jun 30, 2015 8.74 9.56 8.54 NA
Kotak Gold Fund
SchemeReturns ^
Physical GoldPrice #
CRISIL 10 YearGilt ## Current Value of Standard Investment of ` 10000 in the
Scheme (`) Benchmark #(`)Additional
Benchmark ## (`)
Since Inception till June 30, 2016 5.18 8.24 6.95 13,050 15,178 14,253
Jun 30, 2015 To Jun 30, 2016 13.48 18.96 10.03
Jun 30, 2014 To Jun 30, 2015 -8.79 -4.55 11.76 NA
Jun 30, 2013 To Jun 30, 2014 9.37 10.96 -2.51
N.A stands for data not available. Past Performance may or may not be sustained in future. Note: Point to Point (PTP) Returns in INR show the value of ̀ 10,000/- investment made at inception. Source: ICRA MFI Explorer. For Additional Benchmark (Debt Schemes): classification of schemes in short term & long term is based on the average maturity of the scheme. # Name of Scheme Benchmark ## Name of Additional Benchmark ̂ Past performance may or may not be sustained in the future All payouts during the period have been reinvested in the units the scheme at the then prevailingNAV. Returns <= 1 year:Absolute; Returns > 1 year:CAGR(CompoundedAnnualised Growth Rate).

ABOUT OUR FUND MANAGERS
54
Name: Mr. Harsha UpadhyayaScheme (experience in managing these funds since)Kotak Opportunities (Aug 1, �12), Kotak Select Focus Fund (Aug 1, �12), Kotak Tax Saver (Aug. 25,'15)Business ExperienceMr. Harsha has nearly two decades of rich experience spread over Equity Research and Fund Management. His prior stints have been with companies such as DSP BlackRock, UTI Asset Management, Reliance Group and SG Asia Securities. Mr. Harsha is a Bachelor of Engineering (Mechanical) from National Institute of Technology, Suratkal, a Post Graduate in Management (Finance) from Indian Institute of Management, Lucknow and Chartered Financial Analyst from the CFA Institute.
Name: Mr. Harish KrishnanScheme (experience in managing these funds since)Kotak 50 (Nov. 15, �13), Kotak Infrastructure & Economic Reform Fund (Jan31,'15), Kotak Classic Equity (Aug. 25,'15), Kotak India Growth Fund Series I (May 06, �15)Business ExperienceMr. Harish has a decade of experience spread over Equity Research and Fund Management. Prior to joining Kotak Mutual Fund, he was based out of Singapore and Dubai, managing Kotak's offshore funds. Mr. Harish has also worked at Infosys Technologies Ltd in his earlier stint. He is a Bachelor of Technology (Electronics & Communications) from Government Engineering College, Trichur, a post Graduate in Management from Indian Institute of Management, Kozhikode and a Chartered Financial Analyst from the CFA Institute.
Name: Mr. Pankaj TibrewalScheme (experience in managing these funds since)Kotak Midcap (Jan. 21,�10) , Kotak Emerging Equity (May 27,'10), Kotak Balance (Aug. 25,'15)Business ExperienceMr. Pankaj is a graduate in Commerce from St. Xavier's College, Kolkata and holds a Master's degree in Finance from Manchester University. He has been associated with the mutual fund industry since 2003 where he has managed several debt and equity schemes. He has been a part of the organization since January 2010. Mr. Pankaj's earlier stint was with Principal Mutual Fund.
Business ExperienceMr. Deepak has almost 10 years of experience in the mutual fund industry. He had joined the Equity Fund Management team as a research analyst. He is now an Equity Fund Manager. Mr. Deepak is a Graduate in Commerce from Mumbai University. He is a qualified Chartered Accountant, a Cost Accountant and has cleared the AIMR CFA Level 3.
Name: Mr. Deepak GuptaScheme (experience in managing these funds since)Kotak Equity Arbitrage (Sept.1,�08), Kotak Asset Allocator Fund (Earlier Know as Kotak Equity FOF) (Sept.1,�08), Kotak Global Emerging Market Fund (Apr.4,�11), (Dedicated fund manager for over seas investment), Kotak Balance (Aug. 25,'15), Kotak Multi Asset Allocation Fund (Sept.10,�13), Kotak Equity Savings Fund (Oct. 13, '14), Kotak World Gold Fund (Jan.31,�15), Kotak US Equity Fund (Jan.31,�15), Kotak PSU Bank ETF (Nov. 8, �07), Kotak SENSEX ETF (Jun. 6, �08), Kotak NIFTY ETF (Feb. 8, �10), Kotak Banking ETF (Dec. 11, �14)
Performance of top 3 and bottom 3 schemes of the Fund Manager
Fund Manager
Top 3
Bottom 3
Mr. Deepak Gupta Refer Page No.
Kotak Asset Allocator Fund - Growth 35
Kotak Multi Asset Allocation Fund - Growth 33
Kotak Equity Arbitrage Fund - Growth 14
Kotak Sensex ETF 41
Kotak Global Emerging Market Fund - Growth 37
Kotak PSU Bank ETF 43

Name: Mr. Deepak Agrawal
Scheme (experience in managing these funds since)
(Kotak Bond Short Term (Apr. 14, �08), Kotak Flexi Debt (Jul. 11, �07), Kotak Floater Short Term (Jul. 11, �07), Kotak Liquid (Jul. 11, �07), Kotak Kotak Banking and PSU Debt Fund (Apr. 14, �08), Kotak Treasury Advantage Fund (Formerly Known as Kotak Floater Long Term Scheme) (Jul. 11, �07), Kotak Income Opportunities Fund (May 11, '10), Kotak Medium Term Fund (Mar. 21, �14), Kotak Low Duration Fund (Jan. 31, �15), Kotak Corporate Bond Fund (Jan. 31, �15), All Fix Maturity Plans in existence (Aug. 13,'15), All Quarterly Interval Plans (QIPs) (Aug. 13,'15)
Business Experience
Mr. Deepak's career has started from Kotak AMC when he joined the organization in December 2002 where he was initially in Research, Dealing and then moved into Fund Management from November 2006. Mr. Deepak is a Post Graduate in Commerce, Chartered Account and Company Secretary.
55
Name: Mr. Abhishek Bisen
Scheme (experience in managing these funds since)
Kotak Balance (Apr. 15, 2008), Kotak Monthly Income Plan (Apr. 15, �08), Kotak Bond (Plan A) (Apr 15, 2008), Kotak Gilt Investment (Regular & PF-Trust) (Apr. 15, �08), Kotak Global Emerging Market Fund (Apr. 15, �08), Kotak Multi Asset Allocation Fund (Jan. 21, �11), Kotak Equity Savings Fund (Oct. 13, '14), Kotak Gold ETF (Jul. 27, �07), Kotak Gold Fund (Mar. 25, '11)
Business Experience
Mr. Abhishek has been associated with the company since October 2006 and his key responsibilities include fund management of debt schemes. Prior to joining Kotak AMC, Me, Abhishek was working with Securities Trading Corporation Of India Ltd where he was looking at Sales & Trading of Fixed Income Products apart from doing Portfolio Advisory. He has been awarded twice as one of the Highly Commended Investors in Indian Rupees Bonds from the Asset magazine Hong Kong. His educational background is B.A (Management) and MBA (Finance).
Performance of top 3 and bottom 3 schemes of the Fund Manager
Fund Manager
Top 3
Bottom 3
Mr. Abhishek Bisen Refer Page No.
Kotak Gold Fund - Growth 53
Kotak Gilt - Investment - PF and Trust - Growth 31
Kotak Gilt - Investment - Regular - Growth 31
Kotak Equity Savings Fund - Growth 17
Kotak Balance - Dividend 13
Kotak Global Emerging Market Fund - Growth 37
Name: Mr. Devender Singhal
Scheme (experience in managing these funds since)
Kotak Monthly Income Plan (Aug. 25,�15)
Business Experience
Mr. Devender has been associated with the Kotak Group since July 2007. He is responsible for the research coverage of FMCG, Automobiles and Media sectors at Kotak AMC since Feb 2009. Devender has an overall working experience of 14 years in equity research and fund management. Prior to joining Kotak AMC, Devender worked with the PMS divisions of Kotak, Religare, Karvy and P N Vijay Financial Services.
Performance of top 3 and bottom 3 schemes of the Fund Manager
Fund Manager
Top 3
Bottom 3
Mr. Deepak Agrawal Refer Page No.
Kotak FMP Series 172 - (1126D) - Regular Plan - Growth 53
Kotak Medium Term Fund - Regular Plan - Growth 29
Kotak Income Opportunities Fund - Growth 27
Kotak FMP Series 108 - (733D) - Regular Plan - Growth 53
Kotak FMP Series 153 - (790D) - Regular Plan - Growth 53
Kotak FMP Series 129 - (371D) - Regular Plan - Growth 53

Kotak Bond Plan A-Quarterly DividendRecord Date Cum Dividend NAV `/Unit
Jun-20-16 11.243 Individual/ HUF: 0.1422 Others: 0.1317Mar-21-16 11.137 Individual/ HUF: 0.0801 Others: 0.0742Sep-21-15 10.9939 Individual/ HUF: 0.1423 Others: 0.1318
Kotak SENSEX ETF
Kotak Nifty ETF
Record Date Cum Dividend NAVCum Dividend NAV `/Unit
Record Date Cum Dividend NAVCum Dividend NAV `/Unit
Kotak PSU Bank ETF
Nov-21-14 290.4602 6.00June-18-13 201.3164 7.00
May-06-16 785.7880 11.00Nov-21-14 858.2720 9.50Jan-21-14 643.6753 11.00
Nov-21-14 428.2343 19.00Feb-21-13 358.8668 0.20
Cum Dividend NAVRecord Date `/Unit
ETF SCHEMES
Kotak Asset Allocator Fund (Earlier Know asKotak Equity FOF)
Record Date Cum Dividend NAV `/UnitAug-30-10 37.774 Individual/ HUF: 0.878 Others: 0.819
DIVIDEND HISTORY
54
Aug-28-15 24.388 1.60Aug-25-14 21.411 1.00Nov-11-11 13.862 0.50
Kotak Opportunities
Record Date Cum Dividend NAVCum Dividend NAV `/Unit
Record Date Cum Dividend NAV `/UnitJun-15-16 36.692 1.40Jun-29-15 44.732 11.00Dec-12-14 42.959 1.00
Kotak Classic Equity
Record Date Cum Dividend NAVCum Dividend NAV `/UnitJul-15-16 19.692 0.50Nov-20-15 18.450 0.50Jul-25-14 18.227 1.00
Kotak 50 - Dividend
Equity Schemes
Record Date Cum Dividend NAV `/UnitJul-25-16 10.7858 0.0587Jun-27-16 10.7883 0.0612May-23-16 10.7750 0.0479
Kotak Equity Arbitrage Fund
Kotak Midcap
Record Date Cum Dividend NAVCum Dividend NAV `/UnitFeb-23-16 26.770 1.00Feb-27-15 30.866 1.00Feb-28-14 17.731 1.00
Kotak Tax Saver
Record Date Cum Dividend NAVCum Dividend NAV `/UnitMar-22-16 16.266 0.650Jan-21-16 16.113 0.70Dec-30-14 17.542 0.10
Kotak Infrastructure and Economic ReformRecord Date Cum Dividend NAVCum Dividend NAV `/Unit
Jun-23-15 15.260 0.50
Kotak Emerging Equity
Record Date Cum Dividend NAVCum Dividend NAV `/UnitMay-27-16 21.196 1.30Apr-28-15 21.499 2.10May-02-14 13.073 0.50
Kotak Select Focus
Record Date Cum Dividend NAVCum Dividend NAV `/UnitOct-12-15 17.739 1.00Sept-26-14 17.791 1.00Oct-15-10 12.850 1.25
Jul-12-16 10.6329 0.042Jun-13-16 10.4812 0.042May-12-16 10.4214 0.040
Kotak Equity Saving Fund - Monthly Dividend Option
Record Date Cum Dividend NAVCum Dividend NAV `/Unit
Record Date Cum Dividend NAV `/Unit
Jul-12-16 12.6271 Individual/ HUF: 0.0561 Others: 0.0520Jun-13-16 12.3128 Individual/ HUF: 0.0580 Others: 0.0538May-12-16 12.3010 Individual/ HUF: 0.0542 Others: 0.0502
Kotak Equity Arbitrage Fund - Bimonthly Dividend
Jul-25-16 20.1743 0.2425May-23-16 20.1289 0.1782Mar-28-16 20.1492 0.2254
Record Date Cum Dividend NAV `/UnitKotak Equity Saving Fund - Quarterly Dividend
Kotak Monthly Income Plan - Monthly Dividend
Kotak Monthly Income Plan - Quarterly Dividend
Record Date
Record Date
Cum Dividend NAV
Cum Dividend NAV
`/Unit
`/UnitJun-20-16 13.4497 Individual/ HUF: 0.1183 Others: 0.1096Mar-21-16 13.0923 Individual/ HUF: 0.1072 Others: 0.0993Dec-21-15 13.0660 Individual/ HUF: 0.1187 Others: 0.1100
Hybrid Schemes
Record Date Cum Dividend NAV `/UnitJul-25-16 15.859 0.08Jun-27-16 15.086 0.08May-25-16 14.718 0.07
Kotak Balance
DEBT SCHEMES
DIVIDEND HISTORY
56
Jun-20-16 10.5437 0.125 Mar-21-16 10.3526 0.1200 Dec-21-15 10.4600 0.1500

Kotak Bond Plan A-Annual DividendRecord Date Cum Dividend NAV `/Unit
Mar-20-14 21.2977 Individual/ HUF: 0.2158 Others: 0.2067Mar-20-13 22.5941 Individual/ HUF: 1.4008 Others: 1.2006
Debt Schemes
57
Kotak Bond Short Term - Monthly DividendRecord Date Cum Dividend NAV `/Unit
Jul-12-16 10.2049 Individual/ HUF: 0.0727 Others: 0.0673Jun-13-16 10.1625 Individual/ HUF: 0.0421 Others: 0.0390May-12-16 10.1506 Individual/ HUF: 0.0335 Others: 0.0310
Kotak Bond Short Term-Half Yearly DividendRecord Date Cum Dividend NAV `/Unit
Sep-21-15 11.519 Individual/ HUF: 0.4471 Others: 0.4142Dec-30-14 11.1187 Individual/ HUF: 0.1759 Others: 0.1631Sep-22-14 10.8686 Individual/ HUF: 0.0519 Others: 0.0497
Kotak Income Opportunities Fund-Annual DividendRecord Date Cum Dividend NAV `/Unit
Mar-14-16 11.0308 Individual/ HUF: 0.6162 Others: 0.5709Mar-20-15 11.2454 Individual/ HUF: 0.7911 Others: 0.7337Mar-20-14 10.8769 Individual/ HUF: 0.5735 Others: 0.5492
Kotak Income Opportunities Fund-Monthly DividendRecord Date Cum Dividend NAV `/Unit
Jul-12-16 10.2637 Individual/ HUF: 0.0678 Others: 0.0629Jun-13-16 10.2439 Individual/ HUF: 0.0535 Others: 0.0496May-12-16 10.2090 Individual/ HUF: 0.0283 Others: 0.0262
Kotak Income Opportunities Fund-Quarterly DividendRecord Date Cum Dividend NAV `/Unit
Jun-20-16 10.8391 Individual/ HUF: 0.1543 Others: 0.143Mar-21-16 10.7923 Individual/ HUF: 0.1289 Others: 0.1195Dec-21-15 10.6233 Individual/ HUF: 0.0486 Others: 0.0451
Kotak Floater Short Term-Monthly DividendRecord Date Cum Dividend NAV `/Unit
Jul-12-16 1007.3748 Individual/ HUF: 4.3587 Others: 4.0382Jun-13-16 1008.1137 Individual/ HUF: 4.8924 Others: 4.5327May-12-16 1007.9172 Individual/ HUF: 4.7504 Others: 4.4012
Kotak Treasury Advantage Fund-Monthly DividendRecord Date Cum Dividend NAV `/Unit
Jul-12-16 10.1713 Individual/ HUF: 0.0530 Others: 0.0491Jun-13-16 10.1675 Individual/ HUF: 0.0503 Others: 0.0466May-12-16 10.1535 Individual/ HUF: 0.0402 Others: 0.0372
Kotak Flexi Debt Plan A-Quarterly Dividend Record Date Cum Dividend NAV `/Unit
Sep-21-15 11.1133 Individual/ HUF: 0.1835 Others: 0.1700Jun-22-15 11.4334 Individual/ HUF: 0.4485 Others: 0.4155Mar-20-14 11.2467 Individual/ HUF: 0.6366 Others: 0.6097
Debt Schemes
Kotak Corporate Bond Fund-Standard Monthly DividendRecord Date Cum Dividend NAV `/Unit
Jul-12-16 1046.9419 Individual/ HUF: 6.6184 Others: 6.1318Jun-13-16 1044.1354 Individual/ HUF: 4.5914 Others: 4.2538May-12-16 1042.2655 Individual/ HUF: 3.2408 Others: 3.0026
Kotak Corporate Bond Fund-Retail Monthly DividendRecord Date Cum Dividend NAV `/Unit
Jun-20-16 1049.2345 Individual/ HUF: 14.2276 Others: 13.1816Dec-21-15 1051.6449 Individual/ HUF: 15.9685 Others: 14.7945Sep-21-15 1059.8596 Individual/ HUF: 21.9017 Others: 20.2915
Kotak Corporate Bond Fund-Standard Quarterly DividendRecord Date Cum Dividend NAV `/Unit
Jun-20-15 1065.2512 Individual/ HUF: 14.264 Others: 13.2154Mar-21-15 1060.944 Individual/ HUF: 11.6905 Others: 10.8311Dec-21-15 1060.3578 Individual/ HUF: 15.4654 Others: 14.3284
Kotak Gilt Investment Regular Plan-DividendRecord Date Cum Dividend NAV `/Unit
Jun-20-16 12.6955 Individual/ HUF: 0.1658 Others: 0.1536Dec-21-15 12.0806 Individual/ HUF: 0.0059 Others: 0.0054Sep-21-15 12.2955 Individual/ HUF: 0.1703 Others: 0.1578
Kotak Gilt Investment Provident Fund and Trust Plan-Dividend
Record Date Cum Dividend NAV `/UnitJun-20-16 12.0397 Individual/ HUF: 0.1571 Others: 0.1456Mar-21-16 11.9228 Individual/ HUF: 0.0945 Others: 0.0875Dec-21-15 11.5420 Individual/ HUF: 0.0080 Others: 0.0074
Kotak Banking and PSU Debt Fund-Monthly DividendRecord Date Cum Dividend NAV `/Unit
Jul-12-16 10.7352 Individual/ HUF: 0.0723 Others: 0.0670Jun-13-16 10.7064 Individual/ HUF: 0.0515 Others: 0.0477May-12-16 10.6965 Individual/ HUF: 0.0444 Others: 0.0411
Kotak Banking and PSU Debt Fund-Annual DividendRecord Date Cum Dividend NAV `/Unit
Mar-14-16 16.6687 Individual/ HUF: 0.8840 Others: 0.8190Mar-20-15 16.7914 Individual/ HUF: 0.9986 Others: 0.9261Mar-20-14 16.895 Individual/ HUF: 1.1759 Others: 1.1262

56
Asset Allocation Graph
58
Kotak Low Duration Fund-Retail Monthly DividendRecord Date Cum Dividend NAV `/Unit
Jun-20-15 1034.7615 Individual/ HUF: 16.717 Others: 15.488Dec-21-15 1033.8774 Individual/ HUF: 16.0784 Others: 14.8964Sep-21-15 1049.8616 Individual/ HUF: 27.6232 Others: 25.5924
Debt Schemes
Kotak Low Duration Fund-Standard Monthly DividendRecord Date Cum Dividend NAV `/Unit
Jul-12-16 1025.6806 Individual/ HUF: 5.6991 Others: 5.2801Jun-13-16 1025.6316 Individual/ HUF: 5.6637 Others: 5.2473May-12-16 1023.9267 Individual/ HUF: 4.4323 Others: 4.1065
Kotak Multi Asset Allocation Fund-Annual DividendRecord Date Cum Dividend NAV `/Unit
Mar-13-16 11.4291 Individual/ HUF: 0.1276 Others: 0.1182Mar-20-15 12.0308 Individual/ HUF: 0.6000 Others: 0.5564Mar-20-14 10.9407 Individual/ HUF: 0.2925 Others: 0.2801
Kotak Multi Asset Allocation Fund-Monthly DividendRecord Date Cum Dividend NAV `/Unit
Jun-12-15 11.8504 Individual/ HUF: 0.0288 Others: 0.0267Apr-13-15 12.2623 Individual/ HUF: 0.0612 Others: 0.0567Mar-12-15 12.1696 Individual/ HUF: 0.0476 Others: 0.0442
Debt Schemes
Kotak Medium Term Fund-Quarterly DividendRecord Date Cum Dividend NAV `/Unit
Jun-20-16 10.5609 Individual/ HUF: 0.1508 Others: 0.1397Mar-21-16 10.5166 Individual/ HUF: 0.1245 Others: 0.1153Dec-21-15 10.5179 Individual/ HUF: 0.1737 Others: 0.1609
Kotak Medium Term Fund-Annual DividendRecord Date Cum Dividend NAV `/Unit
Mar-14-16 11.0913 Individual/ HUF: 0.6217 Others: 0.5760Mar-20-15 11.1843 Individual/ HUF: 0.7128 Others: 0.6610
Kotak Multi Asset Allocation Fund-Quarterly DividendRecord Date Cum Dividend NAV `/Unit
Jun-20-16 11.9766 Individual/ HUF: 0.1065 Others: 0.0987Mar-21-16 11.7975 Individual/ HUF: 0.1053 Others: 0.0976Dec-21-15 11.6683 Individual/ HUF: 0.1076 Others: 0.0997
This asset allocation guide helps you to determine the suggested equity exposure at different valuations levels based on the Sensex.
Suggested equity allocation (Assuming 50% equity allocation as neutral)
Valuation levels of the Sensex based on rolling 12month fwd EPS estimate of 1580
12000
15000
18000
21000
24000
27000
30000
Jul-1
3
Jul-1
3
Sep-13
Oct-13
Nov
-13
Dec-13
Jan-14
Feb-14
Mar-14
Apr-14
May-14
Jun-14
Jul-1
4
Aug
-14
Sep-14
Nov
-14
Dec-14
Jan-15
Feb-15
Mar-15
Apr-15
May-15
Jun-15
Jul-1
5
Aug
-15
Sep-15
Oct-15
Nov
-15
Dec-15
Feb-16
Mar-16
Apr-16
May-16
Jun-16
Jul-1
6
Attractive 10x-12x
Fair 12x-16x
Fair Value Plus 16-18x
Stretched 18x-20x
Cheap 9x-10x

How to read Fact Sheet
For details contact us at:KOTAK MAHINDRA ASSET MANAGEMENT COMPANY LIMITED: 6th Floor, Kotak Infiniti, Building No. 21, Infinity Park, Off Western Express Highway, Gen. A. K. Vaidya Marg, Malad (East), Mumbai � 400 097. Tel.: 91-22-66056825 Fax: 91-22-6638 4455 E-mail: [email protected] . Corporate Office of Website: assetmanagement.kotak.comAsset Management Company: 2nd Floor, 12-BKC, Plot No C-12, G Block, BKC, Bandra (East),Mumbai - 400 051
Agra: 0562-4009647Ahmedabad: 079-26779888/ 26766077Ajmer: 0145-2628881Aligarh: 0571-6453223Allahabad: 0532-6456177Ambala: 0171-6451570/71Amritsar: 0183-6575777/ 6576777Anand: 02692-650281Aurangabad: 0240-6611189Bangalore: 080-66128050/ 51Bareilly: 0581-6452934Bhavnagar: 0278-2569511Bhilai: 0788-2225385Bhopal: 0755-6461018Bhubaneshwar: 0674-6510250/9583340099Bhuj: 02832-653976Calicut: 495-6576552Chandigarh: 0172-4671885/ 5049476Chennai: 044-28221333/ 45038171Cochin: 0484-6533110/ 4064646Coimbatore: 422-6572165Cuttack: 0671-6510166/ 9776000093Dehradun: 135-2742900/ 6453000Dhanbad: 0326-6450798/09709157970Durgapur: 0343-6456038/ 2544609Goa: 0832-6650490
Gorakpur: 0551-2204127Gurgaon: 0124-6464077Guwahati: 0361-2734784Hubli: 0836-6450140Hyderabad: 040-66178140/ 41/ 42Indore: 0731-6453390Jaipur:141-6503339/ 2373879Jalandhar: 0181-2233481Jalgaon: 0257-2237131/ 32Jammu: 0191-2470779Jamnagar: 0288-6540129Jamshedpur: 0657-2317041/6543474/9570000685Jodhpur: 0291-2630625Kanpur: 0512-6454641/ 2541017Kolhapur: 0231-6610390/ 91Kolkata: 033-22822411/ 12/ 13/ 14Kottayam: 0481-6452922Lucknow: 522-4021168/ 4021169Ludhiana: 0161-4646602/ 4646604Mangalore: 0824-6452006Meerut: 0121-4007753Mumbai: 022-66056825Mumbai: (Thane): 022-65970185/ 186Muradabad: 0591-6456667Mysore: 0821-6541192Nagpur: 0712-2425052/8577
Nashik: 253-6574255New Delhi: 011-66306900/ 02Panipat: 0180-2632062Patiala: 0175-6451766Patna: 0612-6451120Pondicherry: 9962029229Pune: 020-20251526/27/29Raipur: 0771-4270917Rajkot: 0281-6620735Ranchi: 0651-6454629/ 2332274/9709001533Rourkela: 0661-6450114/ 9776640098Salem: 0427-6450115Shimla: 0177-6451211/ 2807911Silliguri: 0353-2522012Surat: 0261-6450004/ 6536677Trichur: 0487-2430115Trichy: 0431-6460668Trivandrum: 0471-4470134Udaipur: 0294-6451094Vadodara: 0265-6533957/ 6560167Vapi: 260-6534863/ 260-6453920Varanasi: 0542-6456985Vijayawada: 0866-6459930Vishakapatnam: 0891-6452145
Contact Details
Mutual Fund investments are subject to market risks, read all scheme related documents carefully.*The rating indicates highest degree of safety regarding timely receipt of payments from the investments that the Scheme has made. The ratings should, however, not be construed as an indication of expected returns, prospective performance of the Mutual Fund Scheme, NAV or of volatility in its returns.Disclaimer on market outlooks:The outlook provided is only a subjective understanding of an uncertain market phenomena, which may or may not occur, and may also not have any effect on the performance of the scheme, clement or otherwise. This outlook should not be construed as a reason for investment into the scheme based on prospect of future performance, which may not accrue as anticipated by the statement.
RISK FACTORS
Fund ManagerAn employee of the asset management company such as mutual fund or life insurer, who manages investments of the scheme. He is usually part of larger team of fund managers and research analysts.Application amount for fresh subscriptionThis is the minimum investment amount for a new investor in a mutual fund schemeMinimum Additional AmountThis is the minimum investment amount for an existing investor in a mutual fund schemeYield to MaturityThe yield to maturity or the YTM is the rate of return anticipated on a bond if held until maturity. YTM is expressed as an annual rate. The YTM factors in the bond�s current market price, par value, couple interest rate and time to maturitySIPSIP or systematic investment plan works on the principle of making periodic investments of a fixed sum. It works similar to a recurring bank deposit. For instance, an investor may opt for an SIP that invests Rs 500 every 15th of the month in an equity fund for a period of three years.NAVThe NAV or net asset value is the total asset value per unit of the mutual fund after deducting all related and permissible expenses. The NAV is calculated at the end of every business day. It is the value at which investors enter or exit the mutual fundBenchmarkA group of securities , usually a market index, whose performance is used as a standard or benchmark to measure investment performance of mutual funds, among other investments. Some typical benchmark include the Nifty, Sensex, BSE 200, BSE 500, 10-year GsecEntry LoadA mutual fund may have a sales charge or load at the time of entry and/or exit to compensate the distributor /agent. Entry load is charged at the time an investor purchases the units of a mutual fund. The entry load is added to the prevailing NAV at the time of investment. For instance, if the NAV is Rs 100 and the entry load is 1%, the investor will enter the fund at Rs 101.Note: SEBI, vide circular dated June 30, 2009 has abolished entry load and mandated that the upfront commission to distributors will be paid by the investor directly to the distributor, based on his assessment of various factors including the service rendered by the distributor.Exit loadExit load is charged at the time an investor redeems the units of a mutual fund. The exit load is deducted from the prevailing NAV at the time of redemption. For instance, if the NAV is RS 100and an exit load is 1%, the redemption price would be Rs. 99 per unit Modified DurationModified duration is the price sensitivity and the percentage change in price for a unit change in yield.Standard deviationStandard deviation is statistical measure of the range of an investment�s performance. When a mutual fund has a high standard deviation, it means its range of performance is wide, implying greater volatility.Sharp RatioThe Sharpe Ratio, named after its founder the Noble laureate William Sharpe, is measure of risk-adjusted returns. It is calculated using standard deviation and excess return to determine reward per unit of risk.BetaBeta is a measure of an investment�s volatility vis-à-vis the market. Beta of less than 1 means that the security will be less volatile than the market. A beta of greater than 1 implies that the security�s price will be more volatile than the market.AUMAUM or assets under management refers to the recent / updated cumulative market value of investments managed by Mutual fund or any investment firm.HoldingsThe holdings or the portfolio is a mutual fund�s latest or updated reported statement of investments/securities. These are usually displayed in terms of percentage to net assets or the rupee value or both. The objective is to give investors an idea of where their money is being invested by the fund manager.Nature of SchemeThe investment objective and underlying investments determine the nature of the mutual fund scheme. For instance, a mutual fund that aims at generating capital appreciation by investing in stock markets is an equity fund or growth fund. Likewise, a mutual fund that aims at capital preservation by investing in debt markets is a debt fund or income fund. Each of these categories may have sub-categories.Rating ProfileMutual funds invest in securities after evaluating their credit worthiness as disclosed by the ratings. A depiction of the mutual fund in various investments based on their rating becomes the rating profile of the fund. Typically, this is a feature of debt funds.