2401563 file000003 41504366
TRANSCRIPT

Supporting Information
Rechargeable zinc alkaline anodes for long-cycle energy storage
Damon E. Turney
1, Joshua W. Gallaway
1, Gautam G. Yadav
1, Rodolfo Ramirez
1, Michael Nyce
1,
Sanjoy Banerjee1, Yu-chen Chen-Wiegart
2, Jun Wang
2, Michael J. D’Ambrose
1, Snehal
Kolhekar1, Jinchao Huang
1, and Xia Wei
1
1City University of New York, Energy Institute, New York, NY 10031, USA
2National Synchrotron Light Source, Brookhaven National Laboratory, Upton, NY, USA
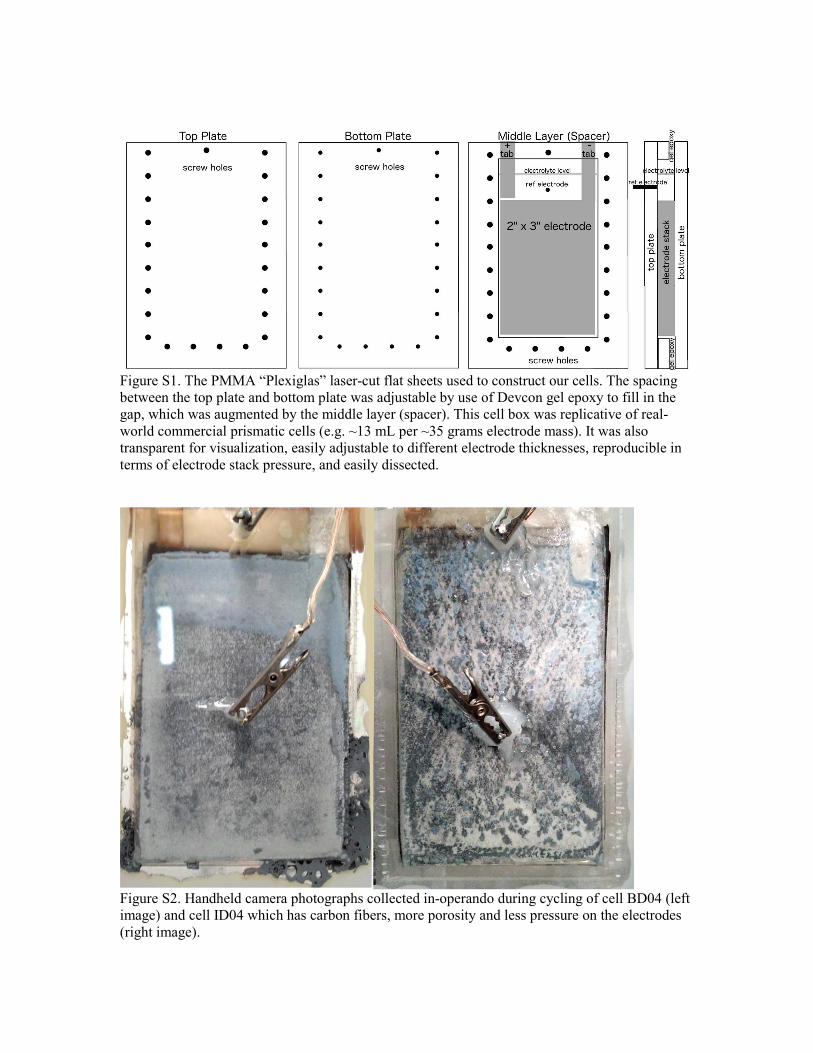
Figure S1. The PMMA “Plexiglas” laser-cut flat sheets used to construct our cells. The spacing
between the top plate and bottom plate was adjustable by use of Devcon gel epoxy to fill in the
gap, which was augmented by the middle layer (spacer). This cell box was replicative of real-
world commercial prismatic cells (e.g. ~13 mL per ~35 grams electrode mass). It was also
transparent for visualization, easily adjustable to different electrode thicknesses, reproducible in
terms of electrode stack pressure, and easily dissected.
Figure S2. Handheld camera photographs collected in-operando during cycling of cell BD04 (left
image) and cell ID04 which has carbon fibers, more porosity and less pressure on the electrodes
(right image).
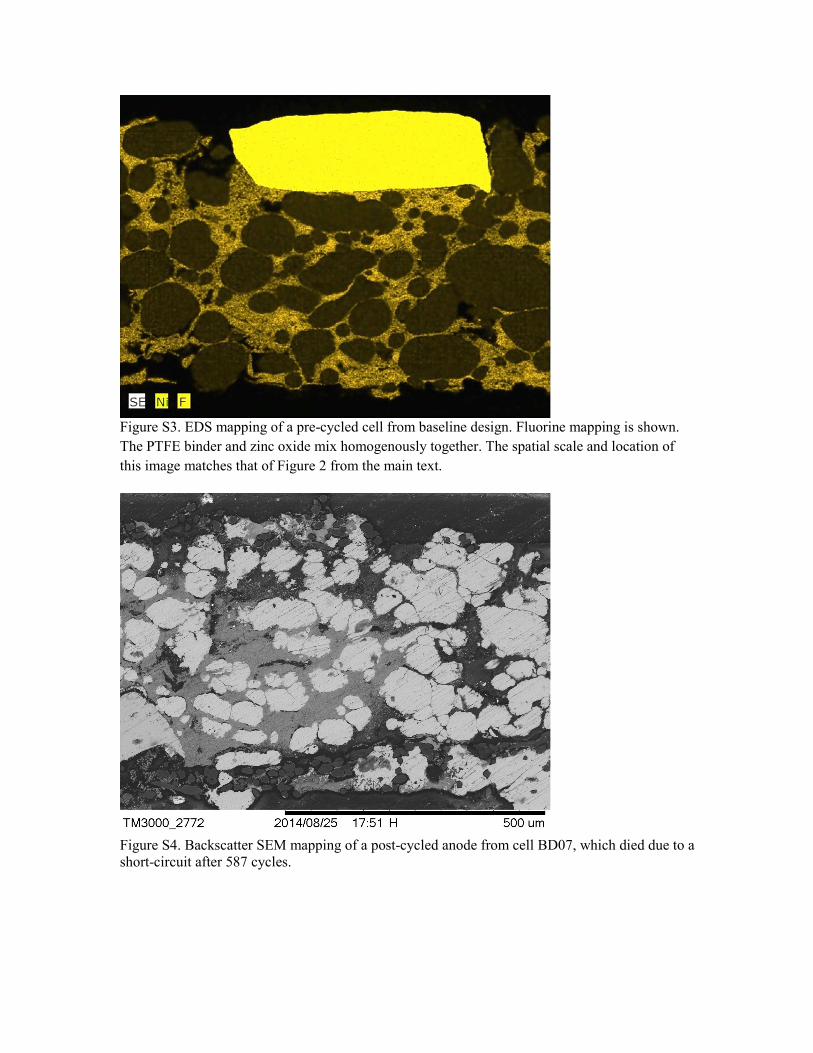
Figure S3. EDS mapping of a pre-cycled cell from baseline design. Fluorine mapping is shown.
The PTFE binder and zinc oxide mix homogenously together. The spatial scale and location of
this image matches that of Figure 2 from the main text.
Figure S4. Backscatter SEM mapping of a post-cycled anode from cell BD07, which died due to a
short-circuit after 587 cycles.
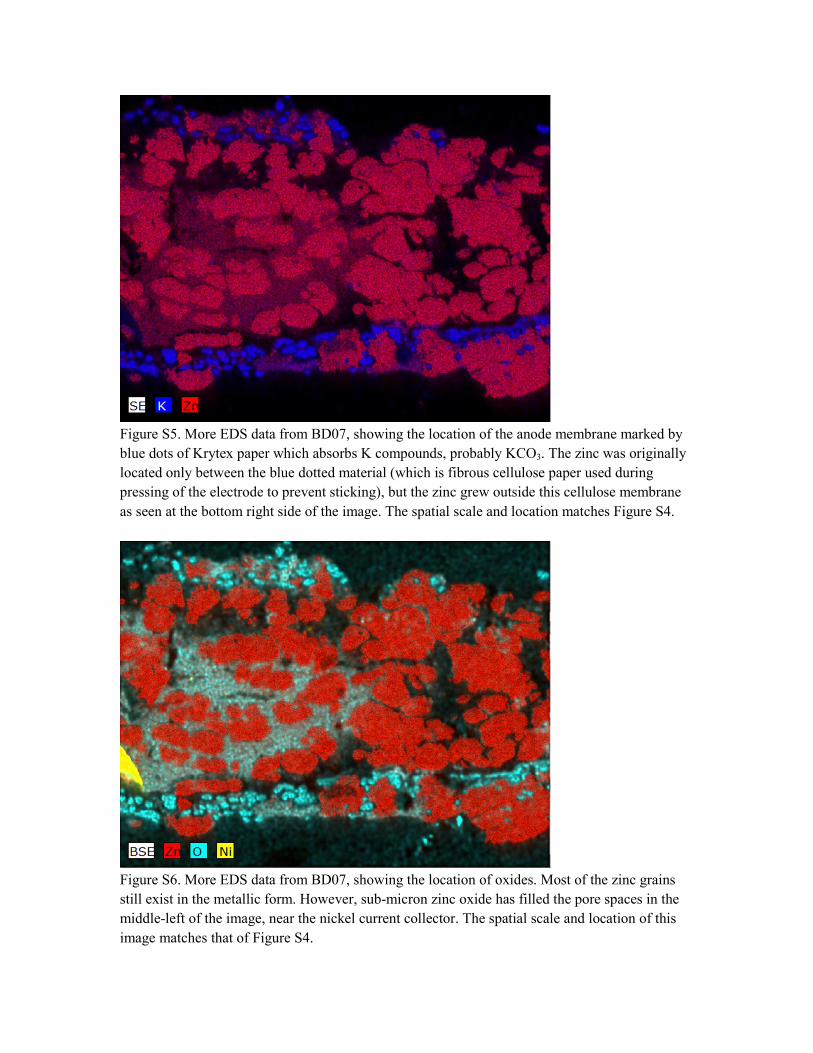
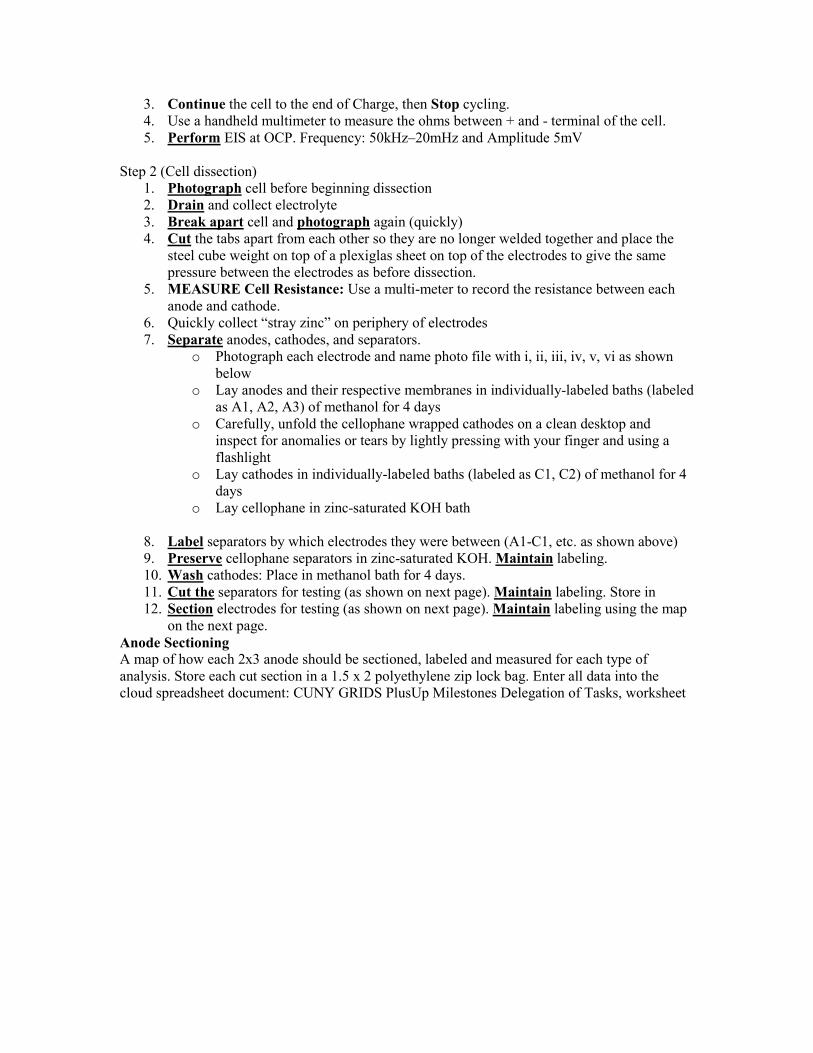
Figure S5. More EDS data from BD07, showing the location of the anode membrane marked by
blue dots of Krytex paper which absorbs K compounds, probably KCO3. The zinc was originally
located only between the blue dotted material (which is fibrous cellulose paper used during
pressing of the electrode to prevent sticking), but the zinc grew outside this cellulose membrane
as seen at the bottom right side of the image. The spatial scale and location matches Figure S4.
Figure S6. More EDS data from BD07, showing the location of oxides. Most of the zinc grains
still exist in the metallic form. However, sub-micron zinc oxide has filled the pore spaces in the
middle-left of the image, near the nickel current collector. The spatial scale and location of this
image matches that of Figure S4.

Figure S7. More EDS data from BD07, showing that PTFE binder in some locations binder has
lost all of it’s zinc oxide while in locations close to the nickel current collector it has become
heavily populated with zinc oxide. This spatial distribution could be due to electrochemical
cycling of nano-scale zinc material near the current collector, and dissolution of zinc oxide
elsewhere. The spatial scale and location of this image matches that of Figure S4.
Figure S8. Backscatter SEM of post-cycled anode from cell BD01 which was purposefully
stopped while still healthy after 914 cycles.

Figure S9. EDS mapping of BD01 again . The spatial scale and location of this image matches
that of Figure S8.
Figure S10. Backscatter SEM of cell ID01.

Figure S11. EDS mapping of cell ID01. The spatial scale and location of this image matches that
of Figure S10.
Figure S12. Cross-section EDS mapping of ID01 at different location from Figure S15. The tight
packing of KS44 and PTFE that clogged the pore pathways is apparent. The spatial scale is
similar to Figure S10.

Figure S13. Backscatter SEM of cell ID04, showing the carbon fiber cross-sections as small black
circles.
Figure S14. Cross-sectional EDS mapping of cell ID04 in the same location as Figure S13. All
zinc has converted to ZnO, and the electrode was completely white. The spatial scale and location
matches Figure S13.

Figure S15. Backscatter SEM image of cell ID14 .
Figure S16. Cross-sectional EDS mapping of cell ID14. The spatial scale and location matches
Figure S15.

Figure S17. Cross-sectional EDS mapping of cell ID14. The spatial scale and location matches
Figure S15.
Figure S18. Cross-sectional EDS mapping of cell ID19. The spatial scale is similar to Figure
S15.

Fig. 19. H2 generation in a cell with nickel current collectors used on the anode as compared to
that from a cell with copper current collectors. Gas generation was highest during the first hour
after electrolyte was first added to the cell. Zinc grains and current collector have minimal oxide
surface layers initially, thus the corrosion reactions have high rates initially. An additional effect
may be due to changes of pH in the tight pore spaces of a highly pressed anode, which initially
would be ~15 (i.e. 45% KOH) but possibly could fall to pH ~10 after zinc corrosion occurs and
thereby passivates the corrosion reactions. Mass transfer of OH- and the ratio of pore volume to
corrosion rate would therefore both be important factors. Gas generation rates during cell cycling
are shown in the right plot of Fig. 7, showing higher gas generation during the charge step and
lower generation during discharge. In all cases, gas generation is much lower when a copper
current collector is used rather than a nickel collector, in agreement with known kinetics of the
hydrogen evolution reaction. Gas generation is occasionally negative due to recombination of H2
and O2 gases. The measurement method was tripled checked during these negative excursions,
but no error was found. To confirm the effect of the nickel current collector, we soaked a piece of
anode paste in excess electrolyte for 300 hours and measured rise of zincate concentration. We
repeated the experiment with and without nickel current collector pressed into the paste. The
paste alone caused the zincate concentration to asymptote to 0.06 M after 100 hours and remain
there, but when the nickel current collector was pressed into the paste the zincate increased
linearly without bounds and was 0.35 M after 300 hours, which suggests HER to be the limiting
process in the corrosion of the zinc-paste anode.

Figure S20. BD09 showed potassium and oxides aggregating around the current collectors and
the electrode separator. The spatial thickness of the electrode here is ~0.6 mm.
Figure 21. Cross-sectional EDS mapping of cell ID04 showed oxides and potassium compounds
aggregated around the current collectors and carbon fibers. The diameter of the circular carbon
fiber seen in the lower left here is ~0.02 mm.

Figure S22. Choosing unsuccessful ID improvements for an MI results in a poor performing MI
cell.
Figure S23. XANES interrogation areas, used to create the XANES spectra of Figure 6.
After 4th charge After 5th discharge

Figure S23. Electrode labeling sheme for dissection study
Figure S24. Cuts made in the anodes to split up the electrode for various destructive materials
characterization measurements.
Cell Dissection Protocol:
Step 1 (Prior to breaking open cell):
1. During the final discharge, drill a “vampire” hole into cell and suck ~2ml from the
anode pore space and titrate for OH- concentration and zincate concentration. Drill the
hole through the PMMA at the exact middle of the anode, but don’t drill into the anode.
2. Use long syringe needle to take a sample of electrolyte from the headspace.
3. Continue the cell to the end of Charge, then Stop cycling.
4. Use a handheld multimeter to measure the ohms between + and - terminal of the cell.
5. Perform EIS at OCP. Frequency: 50kHz–20mHz and Amplitude 5mV
Step 2 (Cell dissection)
1. Photograph cell before beginning dissection
2. Drain and collect electrolyte
3. Break apart cell and photograph again (quickly)
4. Cut the tabs apart from each other so they are no longer welded together and place the
steel cube weight on top of a plexiglas sheet on top of the electrodes to give the same
pressure between the electrodes as before dissection.
5. MEASURE Cell Resistance: Use a multi-meter to record the resistance between each
anode and cathode.
6. Quickly collect “stray zinc” on periphery of electrodes
7. Separate anodes, cathodes, and separators.
o Photograph each electrode and name photo file with i, ii, iii, iv, v, vi as shown
below
o Lay anodes and their respective membranes in individually-labeled baths (labeled
as A1, A2, A3) of methanol for 4 days
o Carefully, unfold the cellophane wrapped cathodes on a clean desktop and
inspect for anomalies or tears by lightly pressing with your finger and using a
flashlight
o Lay cathodes in individually-labeled baths (labeled as C1, C2) of methanol for 4
days
o Lay cellophane in zinc-saturated KOH bath
8. Label separators by which electrodes they were between (A1-C1, etc. as shown above)
9. Preserve cellophane separators in zinc-saturated KOH. Maintain labeling.
10. Wash cathodes: Place in methanol bath for 4 days.
11. Cut the separators for testing (as shown on next page). Maintain labeling. Store in
12. Section electrodes for testing (as shown on next page). Maintain labeling using the map
on the next page.
Anode Sectioning
A map of how each 2x3 anode should be sectioned, labeled and measured for each type of
analysis. Store each cut section in a 1.5 x 2 polyethylene zip lock bag. Enter all data into the
cloud spreadsheet document: CUNY GRIDS PlusUp Milestones Delegation of Tasks, worksheet
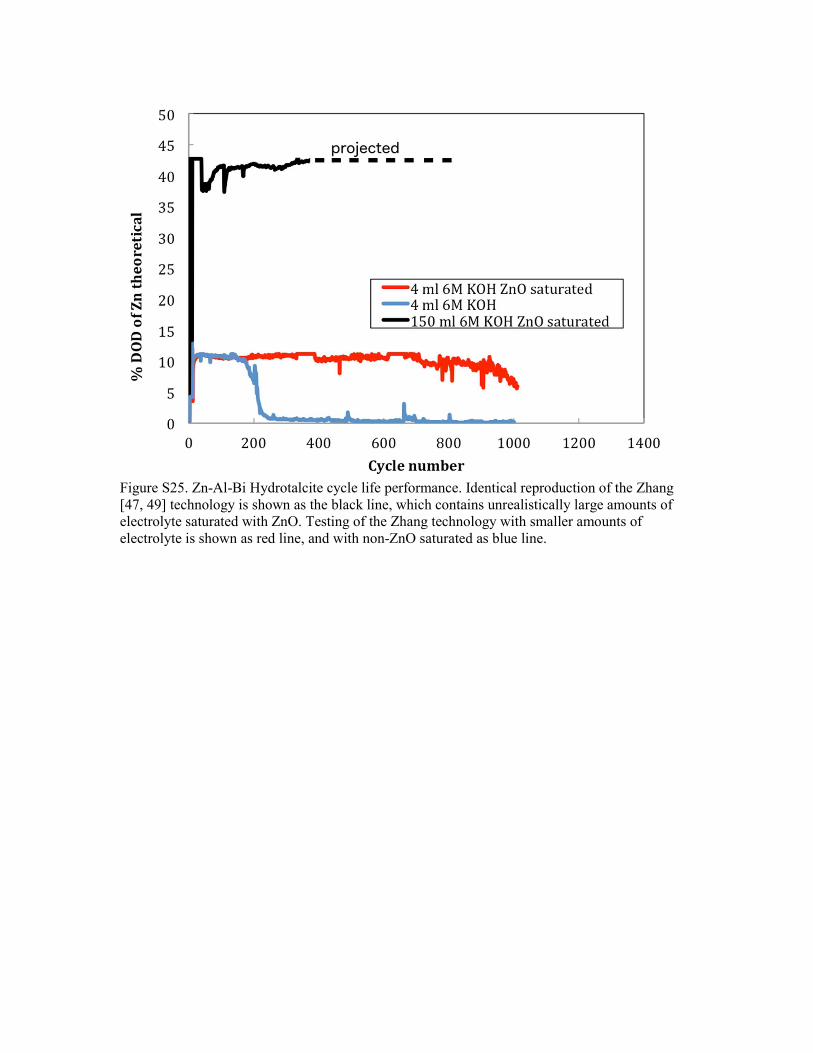
Figure S25. Zn-Al-Bi Hydrotalcite cycle life performance. Identical reproduction of the Zhang
[47, 49] technology is shown as the black line, which contains unrealistically large amounts of
electrolyte saturated with ZnO. Testing of the Zhang technology with smaller amounts of
electrolyte is shown as red line, and with non-ZnO saturated as blue line.

Figure S26. Our baseline design cycled to deeper depths of discharge.
Figure S27. Voltage and current time series during a soft short-circuit.

Figure S28. Cross-section EDS mapping after ten cycles (80% of theoretical Zn capacity) of an
electrode comprised of 64.5% ZnO, 25% Ca(OH)2, 8% Bi2O3, 2.5% Teflon binder. The cycling
was ended after 80% charge up. The electrode was bathed in deionized water for three days,
which dissolved away much of the calcium oxides. The spatial scale is 700 microns from top to
bottom.