2.4 operational demonstration of a convective forecast process
TRANSCRIPT

2.4 OPERATIONAL DEMONSTRATION OF A CONVECTIVE FORECAST PROCESS FOR TRAFFIC FLOW DECISION MAKING AT A MAJOR AIRPORT: USER & PRODUCER PERSPECTIVES
Thomas H. Fahey III, Northwest Airlines*, Minneapolis, MN; and M. Bardou, A. Berge, D. Francisco,
D. Fulmer, J. Margraf, G. Schmeling and I. Aslakson
1. INTRODUCTION A collaboratively developed forecast product, for the volume of airspace, surface and above, within an approximate 100 nautical mile (nm) radius of the Minneapolis-St. Paul International Airport (KMSP), was operationally demonstrated during the summer of 2007. The process of applying the forecasts as input to decisions made by air traffic managers within both an airline and the Federal Aviation Administration (FAA) was also included in this demonstration (demo). A number of prior efforts provided motivation and influenced the decision to initiate this effort and to focus on convection only.
From the National Weather Service (NWS) perspective, there had been prior efforts to introduce the development of Tactical Decision Aids (Graf et al 2006). From an Air Traffic Management perspective, Fahey et al (2006) identified a need for a convective forecast product that filled the gap between two existing products, the Terminal Aerodrome Forecast (TAF) and the Collaborative Convective Forecast Product (CCFP). It was specifically noted by Fahey et al (2006) that, since the TAF addresses the immediate 5nm radius around the airport; and since the CCFP addresses convection for the en route phase of flight; there is no operational convective forecast product that addresses the climb and descent phase of flight.
In February 2006, The Collaborative Decision Making (CDM) organization tasked the Weather Evaluation Team (WET) to prepare a preliminary report describing FAA and Commercial Operator needs for weather products covering the Terminal Radar Approach CONtrol (TRACON) area, which includes the airport arrival and departure airspace structure. It was envisioned that such a forecast would facilitate additional planning for more efficient air traffic flows in terminal areas with large volume of aircraft.
The WET report, (Sims, et al 2007) was delivered to the CDM Steering Group (CSG) in early 2007. The report acknowledged that Air Traffic Management decision makers within the FAA have a need for forecasts in the 0-2 hours range, while on the other hand, most commercial operators, due to the role played by flight dispatchers, have a need for information in the 2- 6 hour or more, time range. The report identified the general need to combine resources where possible for product production and to reduce the amount of conflicting information
* Corresponding author address:Northwest Airlines, F7050 Meteorology, 7200 34th Ave. So., Minneapolis, MN 55450; e-mail: [email protected] or [email protected]
currently available to operational users. Finally the report specified both short term (1-2 years) and long term (greater than 2 years) recommendations and urged that the short term focus be solely on forecasts of convection.
As a result of these and other influencing factors, it was proposed to begin testing three hypothesizes. During periods of convective activity if both forecast products produced via collaboration for the 2 to 6 hour time period and user decision-making collaborative processes were implemented:
1. Volume of air traffic in and out of a major airport or major airports could be increased and/or
2. Average amount of fuel used per aircraft could be reduced and/or
3. Total flight delay minutes and/or number of cancellations could be reduced.
2. INITIAL DEMO PREPARATIONS
There are several entities that provide weather information to decision makers involved with management of air traffic in and out of KMSP. These weather information providers include the NWS Weather Forecast Office (WFO) in Chanhassen, MN; the NWS Center Weather Service Unit (CWSU) located in Farmington, MN; and Northwest Airlines (NWA) Meteorology in Minneapolis. The NWS WFO is responsible for the KMSP TAF as well as watch, warning, and forecast service for the bulk of the Minneapolis (M98) TRACON area. The NWS CWSU provides weather support for the Minneapolis (ZMP) Air Route Traffic Control Center (ARTCC) within which the M98 TRACON lies. Air traffic decision makers also have access to information provided by NWA Meteorology which includes published products such as a NWA KMSP TAF; weather hazard information contained in the NWA Turbulence Plot messages as well as verbally provided forecasts and briefings. With these three offices providing a large quantity of weather information to the local aviation community, it was determined that collaboration among all three during the demo was necessary for two reasons:
1. Efficient use of available resources and 2. Reduction in potential conflicting information
distributed to air traffic decision makers. Planning for the demo was initiated by the
corresponding author and involved communications with NWS representatives during the December 2006 through February 2007 period. But the producers were only half of the equation. In order for a meaningful product to be developed and assessed, users of the new product from the FAA ARTCC, TRACON & Tower and NWA Strategic Planning Team

(SPT) needed to be involved (see Section 5.1 for NWA SPT description). By March 2007 the team was being finalized and scheduled planning telephone conferences (telcons) were underway.
2.1 Demo Team Charter
A charter was established to guide the development
of the product and execution of the demo: 1. Keep the Demo simple. 2. Focus of the demo needs to be as much on
processes as product. 3. Any product or process demonstrated needs to be
easy to do; rapid to update and not negatively impact current products and workload management priorities.
4. Product Production issues: a. All 3 stakeholder groups: CWSU, NWS WFO &
Industry Meteorology “singing same song”. b. When agreement not reached – Production
method needs to accommodate this also. 5. Access to the Final Product: Any product produced
with NWS resources needs to be available to anyone interested.
6. Ability to participate in the product production: Any collaboration conducted w/ NWS participants will be open to any organization currently approved to collaborate on CCFP as well as any NWS Forecast Office.
7. Two Demo locations proposed: Minneapolis (MSP) & Atlanta (ATL).
8. Methods to measure the meteorological accuracy (Verification) and the use (Value) of the demonstrated product(s) and the Value of new process (es) will be included in the demo.
9. Demo concept is being based on 2 manuscripts documenting User Needs: a. “TRACON Weather Forecast Requirements
Recommendations" by CDM WET, 11Jan2007 b. "Forecasts of Convection for ATM Strategic
Decision Making: Comparison of User Needs & Available Products"
10. A follow on step, prior to implementation as an operational product &/or process, will be development of a “Concept of Operations” document and a “User & Producer Requirements” document.
2.2 Team & Collaboration Tool
In addition to team members already mentioned (three Producers: NWS WFO, ARTCC CWSU & NWA Meteorology; Users: FAA & NWA), representatives from the following organizations participated in some or all of the telcons held from March 2007 through the end of the demo in September 2007: NWS Aviation Services Branch (representatives stationed at both headquarters and at the FAA System Command Center); NWS Aviation Weather Center (AWC); NWS Central & Western Region Headquarters; NWS Seattle CWSU; and MITRE. The FAA Air Traffic Control System Command Center (ATCSCC) was informed of
the demo, but an ATCSCC User representative was unavailable and did not participate in the test planning or implementation.
Initially, a second demo site at the Atlanta TRACON was proposed to simultaneously test the collaboration effort; product; and user application process. Atlanta area representatives participated in the March through June 2007 demo planning telcons. It was proposed that the Atlanta CWSU, Atlanta WFO, and Delta Airlines Meteorology would produce a similar product to that at KMSP. By June 2007, it was decided that the Atlanta area offices would continue their existing collaboration methods and their existing products which included TAFs and TRACON area forecasts of convection as well as other variables.
The telcons held in spring 2007 focused on both the format of the product as well as a method which could be used to create the product and allow for the desired collaboration. Each of the three offices to be involved in product production, were using three completely different computer systems as their primary production tool. Fortunately a few common computing platforms were shared between the NWS WFO and CWSU. The biggest challenge regarding the collaboration was finding a way for all offices to view and make suggestions to a graphical product in a quick and efficient manner. The solution was a program called GoTo Meeting which is a web based program that facilitates online meetings between remote offices. This program allows one office to “host” the meeting and enables the other offices to view what the “host” has displayed on their computer screen. The “host” was responsible for accessing the TRACON Area Forecast Product graphics for all to see. Each office had the ability to draw over the image thus spurring discussion. There is also a text chat feature in the GoTo Meeting software, but it was decided that a telephone conference call was the easiest way to discuss the forecast. Because of automation limitations at the CWSU, it was agreed that the MPX WFO would be the Go To Meeting host. 3. PRODUCT DESCRIPTION & FORMAT
For consistency and efficiency the following terms will be used to describe the forecasts produced during the MSP demo: “MSP TRACON Area Thunderstorm Forecast Product” or “TRACON Area Forecast Product” or “Product”. Since there are two separate processes being examined in this demo, the Product production and the User decision making component of the test, anytime the term process is used, it will be explicitly stated whether it is the forecast collaboration process or the user decision making process.
This Product was composed of graphical images depicting the chance of thunderstorms within approximately 100nm of KMSP. Four (4) probability categories were used (see Figure 1). These probability categories are similar to those previously used by NWS TDA’s, (Graf et al, 2006) but were further refined based on User input. The highest probability of thunderstorms during the 1-hour forecast period was

depicted. The probability of thunderstorms was defined as the potential for the existence of Level 2 Composite Reflectivity (30 dBZ) or greater and/or lightning.
70% and Greater Probability (red) Fig 1. Color Coding of Convection Probability. A 1 hour time period instead of a snapshot is used. And the value of the highest probability during the time period is displayed.
The 30dBZ threshold was selected based on three separate inputs. Rhoda et al, 2002 demonstrated that during the en route phase of flight over 98% of the flights sampled, (363 of 369) avoided penetration of level 2 returns and no flights penetrated higher reflectivities. Rhoda et al, 2002 also demonstrated that in the terminal area, due to more limited options, pilots frequently penetrated level 2 returns and to a lesser degree levels 3, 4, 5 & even level 6. The second and third inputs were based on both producer and user team member experience. It was agreed that Level 2 was the appropriate threshold for the convection hazard in the terminal area. 3.1 Product Format & Production Options
Once the product components and thresholds were determined a method to actually create and distribute the product had to be developed.
11
OLLEE
GEP
SHONNSKETR
RWF
ZIBBY
KASPR
TWINZ
EAUMSP
Option #1 TRACON PRODUCT DEMOFcst Example: Issued 1515z. Valid for 16-17z
Fig 2. The 1st option considered was a Powerpoint prepared
image with 4 permanently fixed quadrants & a central 5nm radius area around the airport.
A variety of options were tested using available
software applications including Microsoft PowerPoint (Figure 2) and (Figure 3), and the Graphical Forecast Editor (GFE), (Figure 4). Sample graphics were created and distributed to the users for feedback.
17
Option #2 TRACON PRODUCT DEMOFcst Example: Issued 17z. Valid for current & next 5 time periods.
The air mass will be moist and unstable today across the TRACON. Southerly flow aloft will bring a weak disturbance into the area later this morning. Showers and islolated thunderstroms are expected to develop by 17z most gates except EAU expected to be affected at times through 20z.
Fig 3. Option#2 was similar format to Seattle CWSU Tactical
Decision Aid product. The appearance of each graphic was somewhat constrained by the software used to create it. Option #1 (see Figure #2) utilized PowerPoint and divided the TRACON into four permanently fixed quadrants where each quadrant would only display one probability category. Option #2 (see Figure #3) used color coded boxes at the key arrival and departure gates to indicate the probability of convection at each forecast hour. This option was based on previously developed NWS Tactical Decision Aid products available from the Seattle CWSU. In the end, the users selected Option #3, which was created using the GFE, (see Figure #4). Option #3 provided gridded data over the entire M98 TRACON at resolution of 5 kilometer squares and was selected by the users, in part, because of this complete data coverage characteristic. An additional benefit to Option #3 was that it provides data in a digital format, something that the WET identified as a future need, (Sims et al 2007). The users also requested that in addition to displaying key departure and arrival posts, that the arrival routes be included on the base map.
Fig 4. The Users preferred & selected option#3.
Once the Users selected the preferred format (Option #3) their decision dictated the production tool to be used (GFE). Initial technical limitations only
Less than (<) 30% Probability (green) 30% to < 50% Probability (yellow)
50% to < 70% Probability (orange) 70% and Greater Probability (red)
allowed the WFO to produce the graphic. After workload and labor concerns were addressed and the technical limitations solved, it was decided that the CWSU would create the graphic using GFE from the WFO server and post them onto a web site for collaboration. The CWSU would then make adjustments and issue the final product via a web site that was accessible by FAA and NWA air traffic managers and NWA dispatchers, as well as any other interested users. 3.2 Product Production
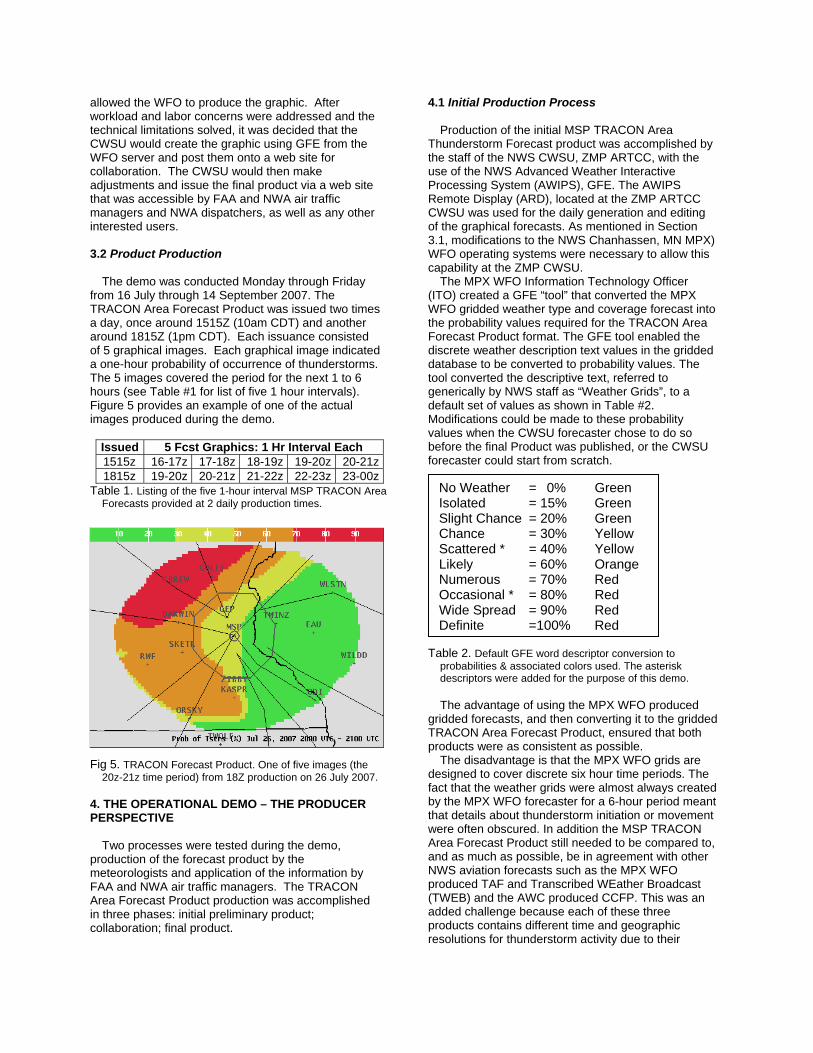
The demo was conducted Monday through Friday from 16 July through 14 September 2007. The TRACON Area Forecast Product was issued two times a day, once around 1515Z (10am CDT) and another around 1815Z (1pm CDT). Each issuance consisted of 5 graphical images. Each graphical image indicated a one-hour probability of occurrence of thunderstorms. The 5 images covered the period for the next 1 to 6 hours (see Table #1 for list of five 1 hour intervals). Figure 5 provides an example of one of the actual images produced during the demo.
Issued 5 Fcst Graphics: 1 Hr Interval Each 1515z 16-17z 17-18z 18-19z 19-20z 20-21z1815z 19-20z 20-21z 21-22z 22-23z 23-00z
Table 1. Listing of the five 1-hour interval MSP TRACON Area Forecasts provided at 2 daily production times.
Fig 5. TRACON Forecast Product. One of five images (the
20z-21z time period) from 18Z production on 26 July 2007. 4. THE OPERATIONAL DEMO – THE PRODUCER PERSPECTIVE
Two processes were tested during the demo, production of the forecast product by the meteorologists and application of the information by FAA and NWA air traffic managers. The TRACON Area Forecast Product production was accomplished in three phases: initial preliminary product; collaboration; final product.
4.1 Initial Production Process
Production of the initial MSP TRACON Area Thunderstorm Forecast product was accomplished by the staff of the NWS CWSU, ZMP ARTCC, with the use of the NWS Advanced Weather Interactive Processing System (AWIPS), GFE. The AWIPS Remote Display (ARD), located at the ZMP ARTCC CWSU was used for the daily generation and editing of the graphical forecasts. As mentioned in Section 3.1, modifications to the NWS Chanhassen, MN MPX) WFO operating systems were necessary to allow this capability at the ZMP CWSU.
The MPX WFO Information Technology Officer (ITO) created a GFE “tool” that converted the MPX WFO gridded weather type and coverage forecast into the probability values required for the TRACON Area Forecast Product format. The GFE tool enabled the discrete weather description text values in the gridded database to be converted to probability values. The tool converted the descriptive text, referred to generically by NWS staff as “Weather Grids”, to a default set of values as shown in Table #2. Modifications could be made to these probability values when the CWSU forecaster chose to do so before the final Product was published, or the CWSU forecaster could start from scratch. Table 2. Default GFE word descriptor conversion to
probabilities & associated colors used. The asterisk descriptors were added for the purpose of this demo.
The advantage of using the MPX WFO produced
gridded forecasts, and then converting it to the gridded TRACON Area Forecast Product, ensured that both products were as consistent as possible.
The disadvantage is that the MPX WFO grids are designed to cover discrete six hour time periods. The fact that the weather grids were almost always created by the MPX WFO forecaster for a 6-hour period meant that details about thunderstorm initiation or movement were often obscured. In addition the MSP TRACON Area Forecast Product still needed to be compared to, and as much as possible, be in agreement with other NWS aviation forecasts such as the MPX WFO produced TAF and Transcribed WEather Broadcast (TWEB) and the AWC produced CCFP. This was an added challenge because each of these three products contains different time and geographic resolutions for thunderstorm activity due to their
No Weather = 0% Green Isolated = 15% Green Slight Chance = 20% Green Chance = 30% Yellow Scattered * = 40% Yellow Likely = 60% Orange Numerous = 70% Red Occasional * = 80% Red Wide Spread = 90% Red Definite =100% Red

separate intended purposes. In order to depict the higher resolution of time and
coverage detail in the TRACON Area Forecast Product, CWSU forecasters often created forecast grids from scratch, filling in data based on current analysis, numerical model output, and other NWS forecast products. This was usually accomplished by drawing the initial 1 hour forecast interval and then modifying the next 4 one hour forecast intervals.
The alternative method used to produce areas of thunderstorm probability, as described above, relied on a MPX WFO public forecast product which had been produced using the GFE tool. The ZMP CWSU meteorologist would use the MPX WFO 6 hour gridded precipitation type and coverage product as either the initial or final, 1 hour interval of the MSP TRACON Area Thunderstorm Forecast Product. The successive or previous times and area(s) were then edited from this beginning or ending 1 hour interval forecast.
Once the CWSU had prepared the five initial hourly forecasts with the AWIPS GFE, the gridded forecasts were converted to images and transmitted, using the MPX AWIPS, to an NWS web server. A listing of all available graphics was available for collaboration via a directory on the NWS web site. The indexed system allowed the collaborators to view the graphics prior to and during the collaboration process.
4.2 Collaboration Process
After the ZMP CWSU had prepared an initial graphic for all 5 one hour time periods, the collaboration process began. The NWS WFO; CWSU and NWA meteorologist used the collaboration process to resolve any differences in opinion regarding the 5 initial graphics.
The actual collaboration was carried out using the internet and a traditional three way telephone conference call. The conference call was conducted at two predetermined times (14:45 UTC and 17:45 UTC). The internet based communications utilized a commercially available application called Go To Meeting. This software allowed all offices to make specific suggestions by adding annotations to any of the five, one hour interval, graphics. Although the Go To Meeting application contained text messaging capability, the telephone conference was more efficient and decreased the amount of time each office spent collaborating. The project Demo Team envisioned that collaboration would only require ten minutes. Actual time spent by the 3 meteorologists during the demo confirmed this assumption (see Section 4.5 for more details).
4.3 Final Forecast Product
Once the collaboration process was completed, the ZMP CWSU made the final edits. Finally a second transmission of the images occurred automatically within a predetermined time window (15:00-1530 UTC and 18:00-1830 UTC for this demo). The second transmission produced graphics for an internet page
made accessible to the users of the product: Thunderstorm Decision Aid - MSP Airport http://www.crh.noaa.gov/zmp/tstmTDA.php. 4.4 Workload Issues
The greatest concern expressed by the offices
involved in the demo was that additional time would be required to produce this product. The workload increase was the highest for staff at the CWSU. This was due to the CWSU’s added responsibilities: initial graphics production and any editing agreed to during the collaboration. The CWSU attempted to monitor the increased workload. Each CWSU forecaster logged the time devoted to the demo and itemized it, based on the three steps in the effort: the initial forecast production; the collaboration; and the final editing of the collaborated forecast.
The FAA’s Weather And Radar Processing (WARP) system is the main tool used by CWSU’s for forecast preparation. Most CWSU offices have never used the AWIPS GFE. As a result, it was necessary for the ZMP CWSU staff to spend time learning how to use the GFE. This GFE familiarization was done during 6 test runs prior to the demo start on 16 July, but also was required after the demo began. There are only very basic similarities in the skills needed to perform work on these two quite different systems.
The ZMP CWSU had one forecaster who had worked in a NWS WFO within a year of the start of the demo. The other three staff members had to learn the GFE skills prior to the start of the demo. It is estimated by the ZMP CWSU MIC that forecasters unfamiliar with the GFE, spent 2-4 hours learning the basics. Training was provided to CWSU staff by the NWS WFO MPX ITO; the MPX Aviation Focal Point; and the ZMP CWSU staff member with recent GFE experience. It is also the CWSU MIC estimation that the individuals unfamiliar with GFE spent another 4-8 hours practicing GFE product generation and editing techniques on their own prior to operationally producing the TRACON Area Forecast Product.
In general, as would be expected, the time spent for each step was dependent on the amount of forecasted thunderstorm activity. Also, the more active days resulted in longer product preparations, collaborations, and product modification times.
4.5 Initial Product Preparation Times
At the MPX WFO, the day shift forecaster responsible for the aviation duties such as the TAFs is also responsible for maintaining the severe weather watch and forecast. This allows the forecaster to be in tune with the convective trends for the day. Although not directly measured, the Demo Team member from the MPX WFO has inferred that because the TRACON Area Forecast Product was a further application of existing duties, there was minimal additional workload.
Some general statements about CWSU time investment during the demo can be made. All statements refer to forecast preparation for which at

least one of the five hourly products contained a probability of thunderstorm activity greater than 30%. During the first two weeks of the demo, initial product preparation times for a CWSU forecaster with little or no GFE experience were as high as 30-45 minutes to complete all five hourly forecasts. By contrast, the one CWSU forecaster with experience using the GFE system, preparation times were in the 5-20 minutes time range.
By the last two weeks of the demo when one or more of the forecast graphics contained at least one or more time period with some part of the forecast area with 30% or greater probability of thunderstorm activity, preparation times had decreased for all CWSU forecasters. In general, time logs indicated that for the CWSU forecasters with just the GFE experienced gained from the previous weeks of this demo product preparation had decreased to about 15-30 minutes. The one forecaster with previous experience using GFE also showed a decrease in the amount of time logged for product preparation. The decrease for this individual was not as pronounced as the other staff members and was generally in the 5-15 minute time range.
Given a staff, all experienced in the use of the AWIPS GFE, it was the opinion of the ZMP CWSU Meteorologist In Charge (MIC), that such a staff would all reach the point where initial product preparation would be on the order of 5-20 minutes in cases where some convection was need to be depicted.
It should be noted that forecasters were not requested to log any time that they spent viewing observational data, analysis, or model data prior to the preparation of the Product. It was likely that there was some extra time devoted to reviewing such information prior to product preparation. Judging how much extra time might have been used would have required subjective interpretation by the individuals and was not recorded.
On days where the threat of thunderstorm activity over the entire M98 TRACON area was less than 30%, initial product preparation time changed little during the time of the demo. Times were generally just a few minutes to as long as five minutes. 4.6 Time Required for Collaboration
The Demo Team’s first preference was for the GoTo
Meeting software to be installed at the CWSU. But due to expediency and FAA security limitations, it was quicker and easier to install at the WFO. As a result the WFO was responsible for establishing the GoTo Meeting session. Once a meeting identification number (ID) was given by the software, the WFO would pass the ID along to the CWSU and NWA meteorologists over the telephone. They would then log into the meeting via the GoTo Meeting web page. This set up time would typically take two to three minutes.
The time required for the actual collaboration portion of the demo changed as experience was gained by all of the collaborating parties. It took several weeks for
most of the staff members at the three offices to all gain some experience using the Go To Meeting application and to adjust to the times (14:45 UTC and 17:45 UTC) that the collaborations were held. Collaboration times during the initial 2-3 week “familiarization period” ranged from 5-20 minutes with or without areas of thunderstorm probability greater than 30%. By the end of the demo there were still times where the telephone conversation continued beyond the 10 minutes envisioned by the designers of the demo. Based on personal experience of the CWSU MIC who, at times, was the actual contributing forecaster, a few of the “longer” collaboration telcons moved from just concerns of thunderstorm activity to other variables likely to impact operations at the MSP airport such as ceiling, visibility and wind changes. This was not an intended purpose of the MSP TRACON Area Thunderstorm forecast but could be considered a benefit as well to the MSP airport users.
4.7 Time Required for Final Edits
The CWSU staff also logged the time used to make
any final changes to the Product. Time required was again dependent on whether significant thunderstorm activity (areas of 30% or greater probability of thunderstorm activity) were depicted and the amount of experience the CWSU forecaster had using the GFE system. During the first two to three weeks of the demo forecasters with no previous GFE system experience required 10-30 minutes for editing. By the end of the demo times logged were half that in the range of 5-15 minutes. The one forecaster with previous experience had no discernible change in the time logged to perform edits. Those times were in the range of 2-10 minutes.
On days where no editing was required no additional time was needed by the CWSU to complete the preparation for sending of the graphics to the final published internet site. 5. THE OPERATIONAL DEMO – USER PERSPECTIVES
Currently many ATM decisions are made during national telcons held every 2 hours in which FAA and airline representatives participate. In general all FAA and airline participants are considered part of the “Strategic Planning Team” by virtue of participation in the every 2 hours SPT telcons. The TRACON Area Forecast Product was intended to be used by FAA personnel (ZMP ARTCC, M98 TRACON, and MSP Tower) involved in air traffic control (ATC) and/or air traffic management (ATM) and by pertinent aviation community members involved in air traffic related decisions, specifically airline flight dispatchers. The Product was intended to be used by Air Traffic Managers at airlines and at the FAA facilities to aid in the decision-making process regarding the adjustment of traffic flow. The Demo Team envisioned that in future years, the Product would at time be used during national SPT telcons. It was also envisioned that it

may be used by airline dispatchers for individual flight fueling decisions. A very basic Concept of Operations was developed and included in a User Training document (see Table 3).
No User Action = Green (< 30% probability) Begin Planning = Yellow (30% - < 50%) Finalize Planning = Orange (50% - < 70%) Activate Plan = Red (70% and greater)
Table 3. Proposed User Actions, related to probability of
convection forecasted by the test Product.
For the 2007 demo, it was envisioned by the Demo Team that, based in part on the Product, evaluation of air traffic flow options would be discussed during local MSP planning telcons when convection was forecasted to impact the M98 TRACON area. It was further envisioned that the FAA ZMP ARTCC representative would lead the effort, with the collaboration of two or three additional Air Traffic Managers, (1 or 2 FAA representatives from the MSP FAA Tower and/or M98 TRACON as well as one ATM Flight Dispatcher at the NWA System Operations Control facility). Finally it was proposed by the Demo Team that the Concept of Operations, outlined in Table #3, would be utilized. 5.1 Northwest Airlines – User perspective
Initially it was envisioned by the demo planners that two groups at NWA would be customers of the MSP TRACON Area Forecast Product: the NWA SPT; and individual dispatchers. Both groups consist of FAA Licensed Flight Dispatchers, with the exception of the SPT Meteorologist, who is FAA Enhanced Weather INformation System (EWINS) certified. Specifically, the NWA SPT consists of four licensed dispatchers (Chief Dispatcher, Operations Planner, and 2 ATC Coordinators (Tactical and Strategic) as well as one SPT Meteorologist. They all coordinate ATC and ATM related issues as well other individual specific duties.
The individual flight dispatcher role at NWA is to prepare each individual flight for departure by issuing the flight plan (route selection, calculate fuel burn and specify additional fuel required, etc.); and issuing the flight release. Once the flight is en route, the dispatcher is required by Federal Air Regulations to monitor the flight’s progress and adjust the original plan if necessary. It was decided by the NWA Dispatch User representatives that it would be best to focus entirely on the SPT group during this initial effort. As a result SPT members were briefed and trained regarding the Product and User decision making process but individual dispatchers were not.
The NWA SPT utilized the Product during both the AM and PM shifts. They accessed this information from the NWS Central Region ZMP CWSU web site. The images helped generate conversation with the NWA SPT Meteorologist during the AM shift. Discussion addressed thunderstorm probabilities and potential impact arrival and/or departure. At this point
the AM shift Strategic SPT Dispatcher would then discuss issues with ZMP ARTCC Traffic Management Unit (TMU). Discussion addressed the likelihood of afternoon or early evening route impacts; possible use of Coded Departure Routes (CDR’s); and necessity for implementing either both normal or modified Playbook routes. The SPT User’s impression was the TRACON images would foster discussions and provide that picture to accompany the thousand words so all players involved in adjusted route planning would have the same images to work with. The SPT User representative on the Demo Team and the AM shift SPT staff agreed that the Product was an effective, quick look depiction of potential weather, and that it trigger discussions, earlier than usual, regarding changing to longer arrival and departure. Specific benefits, although not measured during the demo, was more accurate timing for activating the longer alternate routes, this in turn resulted in less flights requiring additional fuel for the longer routes. The AM shift SPT group was able to provide better detail regarding potential PM impacts to the individual Dispatchers. In other words, individual dispatchers were not adding fuel to individual flight plans for reroutes of arriving or departing flights prior the period when convection was forecast to be a problem.
From the PM shift SPT perspective, the Product images also allowed for more detailed discussions with both the SPT Meteorologist and ZMP TMU. Discussion addressed the development of convection (as planned or not?); alternate route(s) implementation plans (do they need to be adjusted?); Playbook routes or CDR’s (Are they needed and if so, when?). The results of these discussions and ensuing decisions determined whether aircraft were rerouted or kept on flight planned route. The Product in conjunction with real time weather radar allow for more accurate timing of critical weather events.
When it was necessary to implement alternate route plans, the PM shift SPT communicated this information to the group of individual dispatchers, and also kept the ZMP TMU updated as to what, if any changes the SPT Meteorologist anticipated in relation to the Product and potential airport impact (NWA KMSP TAF). Possible need to issue Ground Stops and their time duration and ARTCC affected would also be discussed between NWA SPT and ZMP TMU.
The PM SPT noted that with only two production period per day for the product, no forecast information was produced for periods after 00 UTC. There were a few days during the demo period when convection did not begin to develop until 00UTC or later. It was requested that a third production period be added in 2008.
Although not explicitly demonstrated during the test, it is the SPT representative’s perspective that the Product has the potential to allow the SPT group to assess more accurately the need for CDR’s in various quadrants as the weather system moves through the areas of impact. Assuming that users could apply the info in this manner, speed and direction of movement of both individual cells and the convection area was

requested as an additional graphic feature for 2008. The ability to more proactively flight plan arrivals and departures, and allow the individual dispatchers to be prepared for potential impacts would help minimize fuel costs, reduce the dispatcher stress and workload with unplanned, “pop-up” reroutes, and provide sector fix balancing. 5.2 FAA ARTCC – User Perspective
The ZMP ARTCC Traffic Flow Management (TFM) decision makers that were involved in this test provided a User perspective. There are many additional decision makers in the National Airspace System. Some will be identified later in the manuscript.
The Traffic Management Officer (TMO) is the Manager of System Operations for ZMP ARTCC and has oversight of all Traffic Management functions and Department of Defense liaison.
The Supervisory Traffic Management Coordinator (STMC) has the responsibility of overseeing the work and performance of the Traffic Management Coordinators (TMC’s). They are physically collocated with the TMC and the computer systems routinely used to monitor and manage flight both on the ground and in the air.
The TMC has the responsibility of working individually assigned positions within the Traffic Management Unit (TMU). Each position has a main task assigned to it yet it has an array of associated duties as well. The basic delineation between positions is Arrivals/Departures and En Route.
During the demo test the STMC or TMO held the responsibility of accessing the test Product. It was generally their actions that brought the Minneapolis Air Traffic Control Tower (ATCT) or M98 TRACON and NWA into a discussion about the generated forecast and the anticipated impact to operations in the forecast area. These discussions were quite variable in length and were almost solely dependent upon the forecast Product.
The forecast Product’s five graphics provided a common situational awareness from which the participating entities discussed probable impacts and plans of action from their varying perspectives. It took some time for the participants to become familiar with the Product and the strategies for discussion.
There were some drawbacks to the test. The FAA teams have a number of officially supported weather and traffic computer and display systems from which weather information is accessed. The test added an additional website that had to be visited in order to view the Product. This is problematic as time demands on the STMC during severe weather events are already very high. Asking them to add another product to their weather toolbox was, at times, asking too much. Concurrence with NWA in that we would need to make this product available on existing weather data systems.
Another issue from the ARTCC perspective was that there are a variety of weather products already
available at the ARTCC. The CCFP is produced nationally and forecasts out six hours. Corridor Integrated Weather System (CIWS) and Integrated Terminal Weather System (ITWS) provide real time and highly accurate forecasts out to two hours from MSP to the east coast and the MSP area respectively. It was a challenge to incorporate the additional information the test Product provided with the information from the three existing systems for decision making purposes. Towards the end of the test period Minneapolis ARTCC was getting better at this integration.
One of the initial thoughts was that the test Product might provide some kind of threshold for taking action (see Table 3). This was not the case. Even when the test Product showed a very high probability of impact to the TRACON airspace or to MSP proper we did not take action as a result of the forecast. We simply increased the likelihood of having meaningful conversations with M98 TRACON and NWA SPT representatives about what action might take place and in what order it might happen.
The STMC’s have provided input asking that additional emphasis be given to forecasting actual impact at MSP. There is significant impact to operations when the airport is impacted and having this information further in advance would add greatly to the decision making process.
The TMO’s and STMC’s are in favor of repeating this test with an eye towards refinement of both the product itself and the procedures from which the data will be used.
There is also a need to include the ATCSCC in the next test. A point of contact at the ATCSCC would need to be identified, briefed on the last test, and actively participate in all phases of the next test. 5.3 FAA Tower & TRACON – User Perspective
The FAA MSP tower and M98 TRACON are
located on the KMSP airport property. Although these two facilities are separate from the ZMP ARTCC facility, there is close coordination between all three facilities. Both safe and efficient flow of arriving and departing streams of air traffic are addressed during the coordination. In addition the M98 TRACON and the ZMP ARTCC have similar organizational structures. They both have a Traffic Management Unit (TMU) staffed with Traffic Management Coordinator (TMC). But at the M98 TRACON there is usually only one TMC working the TMU position and that individual coordinates with the ZMP ARTCC TMC’s.
The FAA MSP tower and M98 TRACON personnel had very limited exposure to the TRACON Forecast Product. This was due in part to the fact that the product was not available as a display on the tools normally used by tower or TRACON staff. More specifically, since there is normally only one TMC working the TMU position in the M98 TRACON during a severe weather event, the workload demands are extremely high and time is at a premium. At times when convection is developing, the M98 TMC is much

more apt to use the most familiar tools in order to increase efficiency and save time. If the Product can somehow be integrated into the systems currently used it would much more likely be accepted and used.
The MSP Tower and M98 TMCs are also accustomed to looking at real time weather displays such as the Integrated Terminal Weather System (ITWS) which have very accurate data and forecasts. Weather information for the time period from current to forecasts of 2 hours into the future, maximum are used. This information is then correlated with the real time aircraft position information on the Airport Surveillance Radar display. Because of this short term focus, MSP Tower and M98 are very seldom asked/required to participate in the SPT Telcons. If the MSP TRACON Area Forecast Product, which addressed the one hour to six hour future time frame, was going to be used more extensively by the MSP Tower/ M98 TRACON personnel, an organizational change in roles at MSP Tower/M98 may be required in addition to integration efforts on existing tools. In either case, time and personnel are an issue and this is truly magnified during any type of weather event. 6. VERIFICATION & VALUE
As noted in the Charter of the Demo Team (Section 2.1) measurements of both meteorological accuracy (verification) and utility of the product for the users (value) were both identified as important components to be measured. 6.1 Verification
For the purpose of accuracy verification, all forecasts prepared during the demo were archived on a NWS WFO server in a graphical file format. It was proposed that each forecast would be compared to observed radar images. As a means of doing this for the 2007 demo, it was determined that radar composite reflectivity imagery could be overlaid with each forecast image. Since the forecast images are created using GFE, they are geographically referenced (meaning each grid box has a probability value and corresponding latitude and longitude coordinate). The radar data itself is not geo-referenced (meaning that each bin of reflectivity data does not have a dBz value and corresponding latitude and longitude coordinate) but the image as a whole is. Thus the two data sets can be overlaid where the reflectivity image appears over the geographically correct forecast probability areas. This was tested by taking radar images from the top and bottom of each hour and overlaying them on the forecast images (see Figure #6). The result was 3 images for each forecast hour allowing the highest probability and coverage during each hour to be interpreted. Accuracy of forecast convective coverage as well as the accuracy of timing of initiation, movement, and dissipation can also be qualitatively assessed with this type of overlay graphic. It is proposed that this process be implemented during the upcoming 2008 convective
season to evaluate the forecast accuracy. Forecast verification in this manner, combined with an assessment of value as outlined in section 6.2, allow for a thorough evaluation of the accuracy and benefit provided by the TRACON product.
Fig 6. 1930z Composite reflectivity & 26 July 2007, 19z-20z
Forecast Product. In addition to the above described qualitative
assessment of forecast accuracy, The below quantitative method is proposed to be tested during the upcoming 2008 convective season. Since each 5km square grid in the forecast contains one of the four possible convection probabilities values. It is proposed that 4 accuracy values, one value for each of the Red, Orange, Yellow and Green probability ranges respectively, be calculated for each forecast graphic image.
The composite reflectivity from the MPX Weather Surveillance Radar – 1988 Doppler (WSR-88D) would be used as the observed truth and when available, lightning strike information would also be added. The highest observed composite radar reflectivity during the one hour valid time of the forecast would then be identified for each 5km square grid.
Each of the 4 accuracy values (for the 4 color probability ranges) would be calculated using the ratio of the number of forecasted (for a specific colored probability range) to the number of observed 5km grids containing level 2 or greater composite reflectivity. Each of the 4 accuracy values would be identified “accurate” if the calculated ratio fell within the probability range for the specific color. If the calculated ratio fell below the probability range for the specific color, it would be identified as “under forecasted”. Conversely, if the calculated ratio was above the probability range for the specific color, it would be identified as “over forecasted. This verification scheme can be expressed mathematically as follows:

For time period (X) to (X + 1 hr) Forecasted Info
# of 5km grids forecasted Red (70% or greater
probability of convection). # of 5km grids forecasted Orange (50% to < 70%).
# of 5km grids forecasted Yellow (30% to < 50%).
# of 5km grids forecasted Green (less than 30%).
Observed Info
# of 5km grids observed in forecasted Red area with composite radar (level 2 or > reflectivity) or lightning. # 5km grids observed in forecasted Orange area with
composite radar (level 2 or > reflectivity) or lightning. # 5km grids observed in forecasted Yellow area with composite radar (level 2 or > reflectivity) or lightning. # 5km grids observed in forecasted Green area with
composite radar (level 2 or > reflectivity) or lightning.
Initial radar observation at time X (# of 5km grids observed in the forecasted Red area).
Radar observation at time X + 30 minute (# of 5km grids observed in the forecasted Red area).
Radar observation at time X + 60 minute (# of 5km grids observed in the forecasted Red area).
The proposed four verification formulae for each graphic image produced are as follows: 1. Red probabilities
Ratio of Maximum # of Observed 5km grids vs.Forecasted Red in the 1 hr period =
) / (1)
Red Accurate, if ratio is 70% or greater, OR Red Under forecasted, if ratio is < 70%, and
% Under Forecasted = (70% - measured ratio) (1.1)
2. Orange Probabilities
Ratio of Maximum # of Observed 5km grids vs.Forecasted Orange in the 1 hr period =
) / (2)
Orange Accurate, if ratio is between 50% and < 70%, OR Orange Under Forecasted, if ratio is < 50
% Under Forcasted = (50% - measured ratio) (2.1)
Orange Over Forecasted, if ratio is 70% or greater % Over Forecasted = (measured ratio – 69%) (2.2)
3. Yellow Probabilities Ratio of Maximum # of Observed 5km grids vs.Forecasted Yellow in the 1 hr period =
) / (3)
Yellow Accurate, if ratio is between 30% and < 50%, OR Yellow Under Forecasted, if ratio is < 30%
% Under Forcasted = (30% - measured ratio) (3.1)
Yellow Over Forecasted, if ratio is 50% or greater % Over Forecasted = (measured ratio – 49%) (3.2)
4. Green Probabilities
Ratio of Maximum # of Observed 5km grids vs.Forecasted Green in the 1 hr period =
) / (4)
Green Accurate, if the ratio is < 30%, OR Green Over Forecasted, if the ratio is 30% or greater, and
% Over Forecasted = (measured ratio – 29%) (4.1) The ability to overlay observed weather radar
composite reflectivity and the forecast Product was implemented by the MPX WFO. But the ability to compare forecasted versus observed information for each 5km grid was still in development at the time this manuscript was completed. Once that capability has been implemented, it is planned to produce the 4 accuracy values for each graphic. Once the 4 accuracy values are calculated, more work will be required to determine if it is possible to produce a single accuracy value for each forecast graphic. 6.2 Value
A User survey was prepared by the Demo Team and distributed. The qualitative results, collected by the User representatives on the Demo Team were summarized in Section #5. Three potential quantitative items, which are important to the Users, were identified by the Demo Team: flight schedule, fuel and traffic volume. It was realized that methods would need to be developed to collect information in order to measure impact with or without the new product using some or all of these three metrics. Specifically:
1. Aircraft flight delays and cancellations departing and arriving the KMSP airport &/or
2. Fuel boarded and fuel burned on aircraft departing and arriving KMSP &/or
3. Number of aircraft that departed and arrived at KMSP.
Metrics were not collected during this initial demo. 7. RECOMMENDATIONS
The Demo Team collected a number of suggested items to be included in future demos. The entire Demo Team recommends that a MSP demo be conducted

again in 2008. It was also suggested that additional demos be conducted at two or three more facilities, specifically one or two facilities in highly congested Northeast (NE) United States and a facility significantly impacted indirectly by the air traffic congestion in the NE.
7.1 Producer
It was proposed that the definition of convection be specifically refined to require some level 3 or greater, not just level 2 activity if there is no lightning activity observed. This suggestion was based on a situation observed during the demo on the morning of 28 August 2007. There was an area of Level 2 (Moderate Weather) northwest of KMSP. There was no lightning and no reflectivity higher than Level 2. It was agreed during the collaboration process on the 28th that the area would not be included in the MSP TRACON Area Convection Forecast Product. Based on the 28 August example, the Demo Team has also proposed, from a more general perspective that the definition of probability of convection be redefine to include both intensity and coverage as follows: CONVECTION PROBABILITY: is defined as containing both of the following
Intensity: Area depicted contains at least some Heavy Weather (40dBZ OR greater) &/or Lightning. Coverage: Percent of area with Moderate Weather (30dBZ –39dBZ/Level 2 Reflectivity) AND greater.
For example from a verification perspective: A forecasted area with Convection Probability in the 50%-69% range (Orange) would be considered accurate if actual observed activity contained the following:
Intensity: At least some Heavy Weather (40dBZ OR greater) or lightning observed at some time in the 1 hour period, and
Coverage: At least 50% of the forecasted area contains Moderate Weather (30bBZ OR Greater) observed at some time in the 1 hr period.
7.2 User
From a User perspective the new proposed definition of probability of convection would be defined as follows:
Coverage: Moderate Weather (Level 2 Composite Reflectivity) or greater covering a percentage of the forecasted area equal to at least the lower limit of the probability threshold, sometime during the 1 hour period. For example: Yellow (at least 30% coverage); Orange (at least 50%coverage); Red (at least 70% coverage), and
Intensity: Heavy Weather (Level 3 or 4 Composite Reflectivity) &/or Lightning observed in the forecasted area some time during the 1 hour period (no coverage requirements), and
Percentage Value: Indicates both Coverage and Probability of convection during the 1 hour forecast time period. Since the product is
produced using Probability of Occurrence of Convection for individual 5km square grids both coverage and probability of convection can be represented.
Three suggestions from a User perspective
regarding the Product production and/or format were provided. A 3rd production period each day in the mid-afternoon was requested. The addition of speed and direction of movement of both individual cells and the convection area to the graphic was identified as potentially helpful. Addition of a text box describing the expected intensity and evolution of the forecasted convection (e.g. Tops, Potential for rapid development or decay, overall area extent and geographical orientation of the convection (e.g. Narrow line, clusters, etc) were also proposed.
From an FAA organizational involvement and product display integration perspectives the following suggestions were made:
a. Integrate the TRACON Forecast product into a display that is normally used by ARTCC TMU, M98 TRACON and MSP tower.
b. The Demo Team should include a FAA System Command Center (SCC) point-of-contact who would be responsible for SCC staff familiarization; ensuring that the SCC staff can access the product during the next demo and providing input regarding the Product and the decision making process to the Demo Team.
8. CONCLUSION
The Product itself is not an end-all decision making tool, but to be used in conjunction with other information including the national scale Collaborative Convective Forecast Product (CCFP). It allows a micro-view of a particular area that the broader macro-view of the CCFP lacks and was never intended to provide. It is also important to note, in a broader sense, that weather information is only a very small portion of the entire air traffic manager’s tool kit. Long term solutions to increasing capacity of the National Airspace System will take major integrated efforts that address issues well beyond just meteorological forecast information.
In the opinion of users on the Demo Team, the test was a limited success. From the NWA Users’ perspective, one of the biggest shortcomings was the lack of forecast information for the evening period, 00 UTC to 04 UTC. NWA arrival and departure banks of flights are scheduled during this time period. Since the FAA tower and TRACON had little or no access to the product, they were unable to provide conclusions. This highlights the fact that any new weather forecast tool must be integrated into the existing tools available to the users. From the ZMP ARTCC perspective, the Product was found to be beneficial and that further development would be necessary before it could become a valuable part of ARTCC’s everyday operational practice.

The bulk of this demo effort was focused on the Product production process. From the perspective of the entire Demo Team, this component was an overwhelming success. User directed selection of the Product format; NWS MPX WFO development of the tools to produce and distribute the product; ZMP CWSU lead role in production and distribution; NWA support with resources and leadership role in team formation and planning; NWS management support at all levels of the organization (MPX WFO, Central Region and Aviation Services Branch) as well as local FAA ARTCC and TRACON management resources and support, were all important factors in the success of the Product production effort.
Overall, it is the opinion of the Demo Team that there is great potential for this type of product to assist both Air Carriers and FAA Air Traffic Organization with arrival and departure route planning at congested facilities that are frequently impacted by convection. The ability to ensure that all parties involved in ATM & ATC are communicating much sooner than might otherwise occur can only enhance safe and efficient fight operations. 9. ACKNOWLEDGEMENTS
The Demo Team would like to thank all individuals who supported this effort. From a product production perspective a number of NWS organizations were involved in the planning. The Seattle and Atlanta CWSU offices and the NWS AWC contributed during the planning stages. Individuals of special note for their encouragement and leadership provided via their specific organizations within the NWS include, Kevin Johnston, Director, Aviation Services Branch and Dan Luna, Meteorologist-in-Charge, MPX. From a customer perspective, support within the FAA and Northwest Airlines was also critical for the success of the demo, specifically the FAA Air Traffic Organization and NWA System Operations Control. 10. ACRONYMS ARD: AWIPS Remote Display ARTCC: Air Route Traffic Control Center ATCSCC: Air Traffic Control System Command Center ATC: air traffic control ATCT: Air Traffic Control Tower ATM: air traffic management ATL: Atlanta Hartsfield International Airport (3 letter
IATA identifier) AWC: Aviation Weather Center AWIPS: Advanced Weather Interactive Processing
System CIWS: Corridor Integrated Weather System) CWSU: Center Weather Service Unit CDR: Coded Departure Route CCFP: Collaborative Convective Forecast Product CDM: Collaborative Decision Making CSG: CDM Steering Group Demo Team: Demonstration Team
EWINS: Enhanced Weather INformation System FAA: Federal Aviation Administration GFE: Graphical Forecast Editor ITO: Information Technology Officer ITWS: Integrated Terminal Weather System MSP: Minneapolis-St. Paul International Airport (3
letter IATA identifier) KMSP: Minneapolis-St. Paul International Airport (4
letter ICAO identifier) MPX: NWS Chanhassen, MN WFO ZMP: Minneapolis ARTCC M98: Minneapolis TRACON NWS: National Weather Service NWA: Northwest Airlines Product: MSP TRACON Area Thunderstorm Forecast
Product SPT: Strategic Planning Team STMC: Supervisory Traffic Management Coordinator telephone conference: telcon TAF: Terminal Aerodrome Forecast TRACON: Terminal Radar Approach CONtrol TFM: Traffic Flow Management TMC: Traffic Management Coordinator TMO: Traffic Management Officer TMU: Traffic Management Unit TWEB: Transcribed WEather Broadcast WET: Weather Evaluation Team WFO: Weather Forecast Office WSR-88D: Weather Surveillance Radar–1988 Doppler 11. REFERENCES Fahey, T.H., M. Phaneuf, W. Leber, M. Huberdeau, D.
Morin and D. Sims 2006: Forecasts of Convection for Air Traffic Management Strategic Decision Making: Comparison of User Needs and Available Products. 12th Conference on Aviation, Range, and Aerospace Meteorology, American Meteorological Society, Atlanta, GA, USA, 29 January – 2 February 2006.
Graf, M, M. Peroutka, T. Boyer, G. Trojan, M.
Oberfield, and T. Amis 2006: Prototyping Tactical Decision Aids for Aviation Forecast Preparation System. 12th Conference on Aviation, Range, and Aerospace Meteorology, American Meteorological Society, Atlanta, GA, USA, 29 January – 2 February 2006. (Presented by Kevin Johnston)
Rhoda, D. A., E. A. Kocab, M. L. Pawlak 2002: Aircraft
Encounters with Thunderstorms in Enroute vs. Terminal Airspace above Memphis, Tennessee. 10th Conference on Aviation, Range, and Aerospace Meteorology, American Meteorological Society, Portland, OR, USA, 13-16 May 2002.
Sims, D, T. Fahey and M. Phaneuf 2007: Collaborative
Decision Making (CDM) Weather Evaluation Team (WET) TRACON Weather Forecast Requirements Recommendations. January 11, 2007, document available from authors.