24 effect of dead space - · pdf filecomputer 24 human physiology with vernier 24 - 1 effect...
TRANSCRIPT
Computer
24
Human Physiology with Vernier 24 - 1
Effect of “Dead Space” on Oxygen Availability
In the average adult, approximately 150 mL of the air that is inhaled with each breath never reaches the alveoli. It fills the nose, mouth, larynx, trachea, bronchi, and bronchioles, a volume known as the “dead space.” This air is not available for gas mixing and exchange. It mixes with newly inhaled air and is “recycled” back to the alveoli. The relative size of the “dead space” as compared to functioning lung tissue impacts the efficiency of the respiratory system. Dead space is important in a variety of medical conditions such as asthma, pneumonia, and emphysema, and must be considered in treatments such as artificial ventilation in an intensive care unit. It is also important in physiologic challenges such as diving and high altitude activities.
In this experiment, you will use the O2 Gas Sensor to analyze inhaled and exhaled air while artificially changing the size of the “dead space.” You will calculate the effect that dead space has on oxygen delivery to the lungs and correlate this with various physiologic challenges.
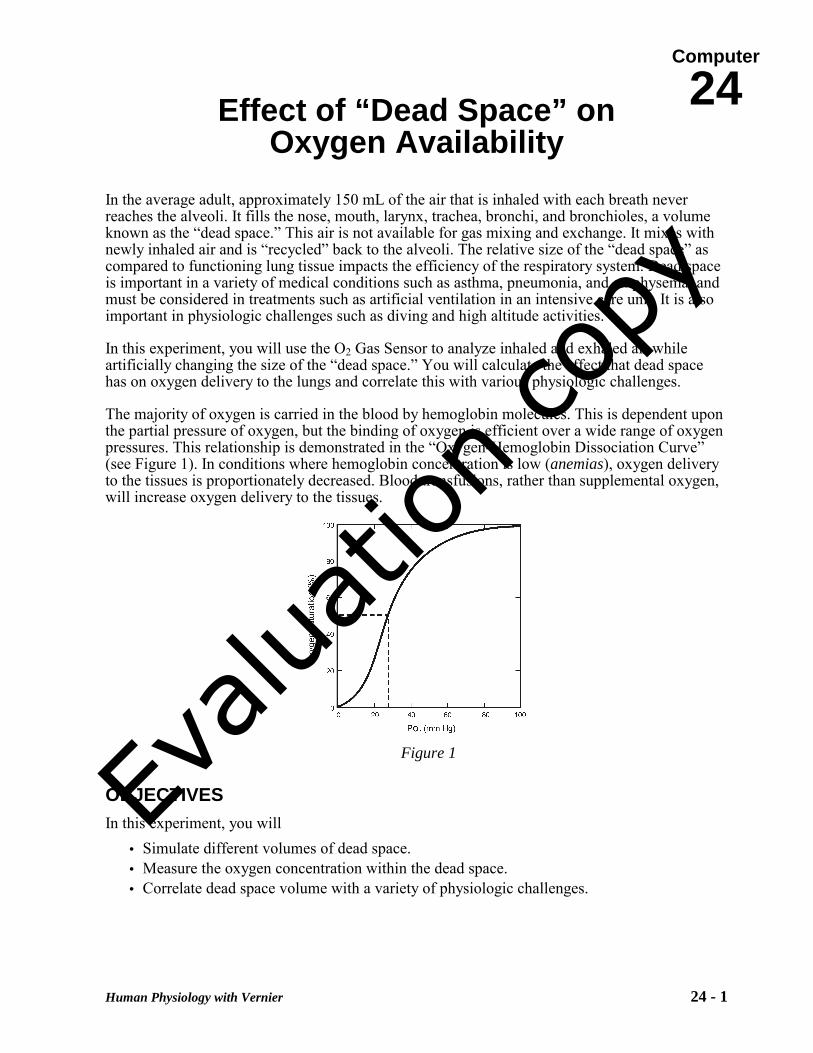
The majority of oxygen is carried in the blood by hemoglobin molecules. This is dependent upon the partial pressure of oxygen, but the binding of oxygen is efficient over a wide range of oxygen pressures. This relationship is demonstrated in the “Oxygen-Hemoglobin Dissociation Curve” (see Figure 1). In conditions where hemoglobin concentration is low (anemias), oxygen delivery to the tissues is proportionately decreased. Blood transfusions, rather than supplemental oxygen, will increase oxygen delivery to the tissues.
OBJECTIVES In this experiment, you will
• Simulate different volumes of dead space. • Measure the oxygen concentration within the dead space. • Correlate dead space volume with a variety of physiologic challenges.
Figure 1
Evalua
tion co
py
Computer 24
24 - 2 Human Physiology with Vernier
MATERIALS computer Vernier CO2-O2 Tee Vernier computer interface 15 cm (¾ in) PVC pipe Logger Pro 30 cm (¾ in) PVC pipe Vernier O2 Gas Sensor
PROCEDURE Part I The Effect of Increasing Dead Space on Oxygen Concentration 1. Connect the O2 Gas Sensor to Channel 1 of the Vernier computer interface. Open the file
“24 Effect of Dead Space” from the Human Physiology with Vernier folder.
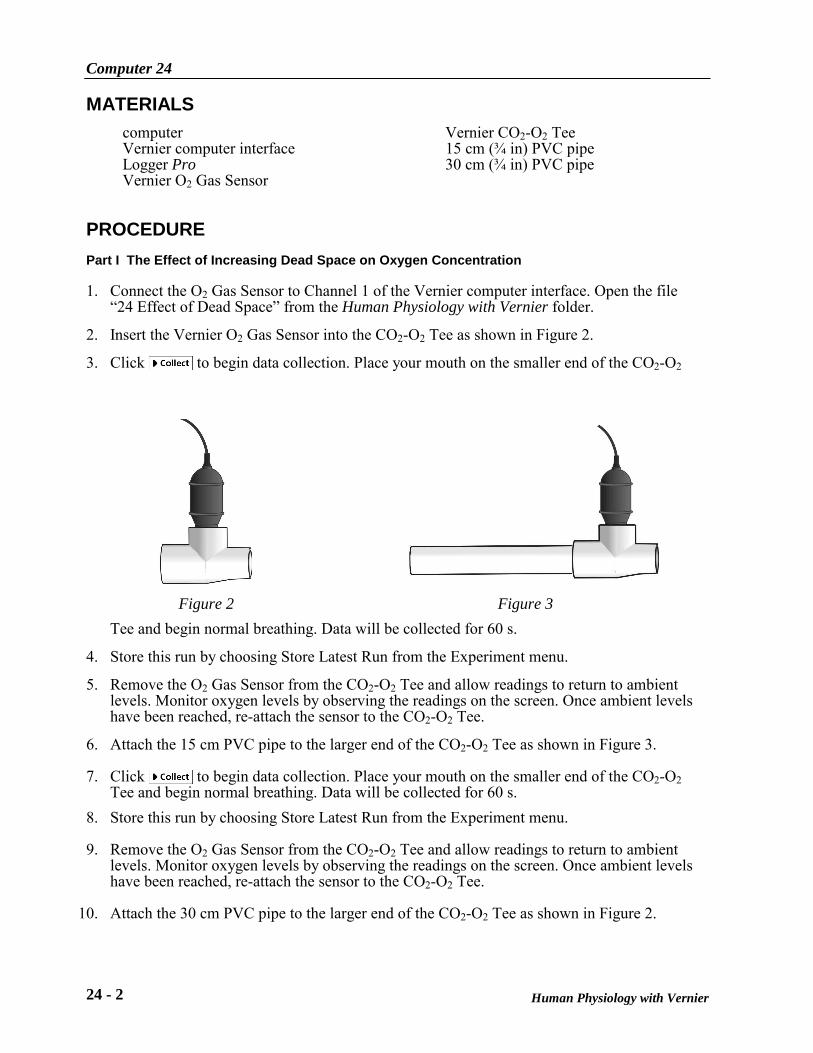
2. Insert the Vernier O2 Gas Sensor into the CO2-O2 Tee as shown in Figure 2.
3. Click to begin data collection. Place your mouth on the smaller end of the CO2-O2
Tee and begin normal breathing. Data will be collected for 60 s.
4. Store this run by choosing Store Latest Run from the Experiment menu.
5. Remove the O2 Gas Sensor from the CO2-O2 Tee and allow readings to return to ambient levels. Monitor oxygen levels by observing the readings on the screen. Once ambient levels have been reached, re-attach the sensor to the CO2-O2 Tee.
6. Attach the 15 cm PVC pipe to the larger end of the CO2-O2 Tee as shown in Figure 3.
7. Click to begin data collection. Place your mouth on the smaller end of the CO2-O2 Tee and begin normal breathing. Data will be collected for 60 s.
8. Store this run by choosing Store Latest Run from the Experiment menu.
9. Remove the O2 Gas Sensor from the CO2-O2 Tee and allow readings to return to ambient levels. Monitor oxygen levels by observing the readings on the screen. Once ambient levels have been reached, re-attach the sensor to the CO2-O2 Tee.
10. Attach the 30 cm PVC pipe to the larger end of the CO2-O2 Tee as shown in Figure 2.
Figure 2 Figure 2 Figure 3
Effect of “Dead Space” on Oxygen Availability
Human Physiology with Vernier 24 - 3
11. Click to begin data collection. Place your mouth on the smaller end of the CO2-O2 Tee and begin normal breathing. Data will be collected for 60 s.
12. Click and drag to highlight all data runs from 20–60 s. Click the Statistics button, . Click the boxes in front of Run 1, Run 2, and Latest and click . Record the mean values to the nearest 0.1% for all three runs in Table 1.
Part II The Effect of Increased Effort on Oxygen Concentration
13. Choose Clear All Data from the Data menu.
14. Remove the 30 cm PVC pipe from the CO2-O2 Tee and ensure that the Tee is well attached to the O2 Gas Sensor.
15. Click to begin data collection. Place your mouth on the smaller end of the CO2-O2 Tee and begin deeply inhaling and exhaling. Allow 3 s for inhalation and 3 s for exhalation to prevent dizziness. Data will be collected for 60 s.
16. Store this run by choosing Store Latest Run from the Experiment Menu.
17. Remove the O2 Gas Sensor from the CO2-O2 Tee and allow readings to return to ambient levels. Monitor oxygen levels by observing the readings in the Logger Pro tool bar. Once ambient levels have been reached, re-attach the sensor to the CO2-O2 Tee.
18. Attach the 15 cm PVC pipe to the larger end of the CO2-O2 Tee as shown in Figure 2.
19. Click to begin data collection. Place your mouth on the smaller end of the CO2-O2 Tee and begin deep breathing, as instructed in Step 16. Data will be collected for 60 s.
20. Store this run by choosing Store Latest Run from the Experiment Menu.
21. Remove the O2 Gas Sensor from the CO2-O2 Tee and allow readings to return to ambient levels. Monitor oxygen levels by observing the readings in the Logger Pro tool bar. Once ambient levels have been reached, re-attach the sensor to the CO2-O2 Tee.
22. Attach the 30 cm PVC pipe to the larger end of the CO2-O2 Tee as shown in Figure 2.
23. Click to begin data collection. Place your mouth on the smaller end of the CO2-O2 Tee and begin deep breathing, as instructed in Step 16. Data will be collected for 60 s.
24. Click and drag to highlight all data runs from 20–60 s. Click the Statistics button, . Click the boxes in front of Run 1, Run 2, and Latest and click . Record the mean values for all three runs in Table 2.
Computer 24
24 - 4 Human Physiology with Vernier
DATA
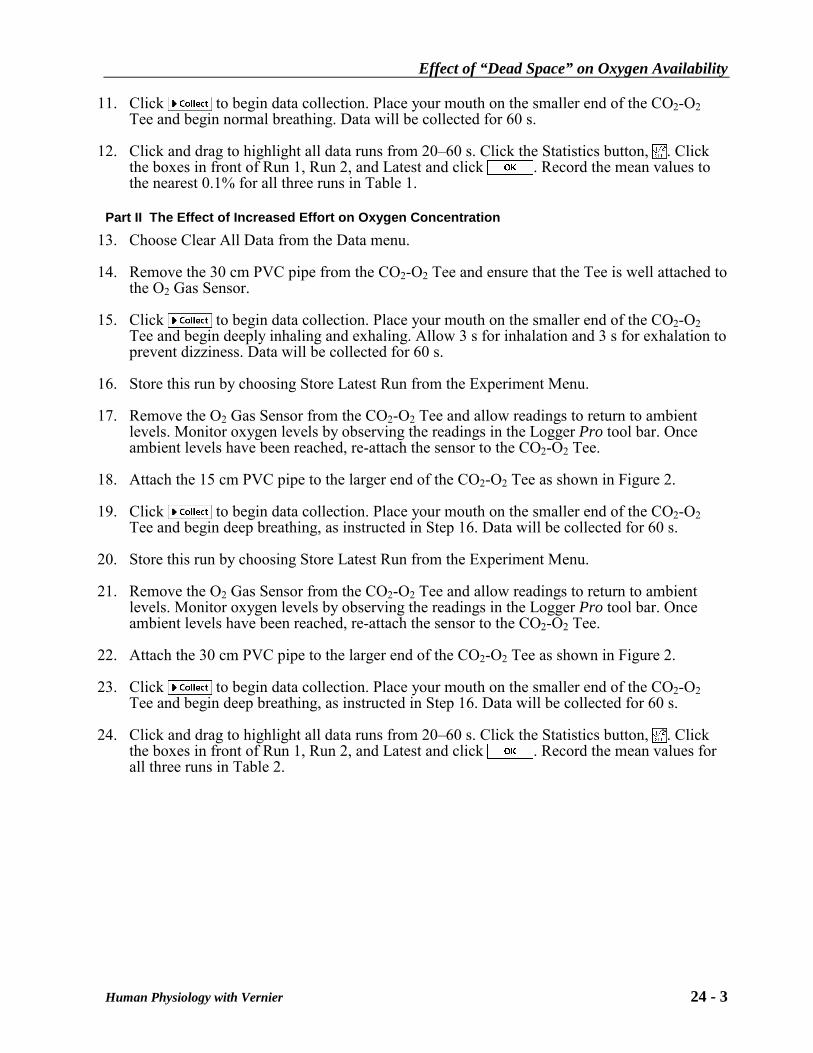
Table 1–Normal Breathing
Run Description Mean O2 concentration (%)
1 CO2-O2 Tee alone
2 CO2-O2 Tee + 15 cm PVC pipe
3 CO2-O2 Tee + 30 cm PVC pipe
Table 2–Deep Breathing
Run Description Mean O2 concentration (%)
1 CO2-O2 Tee alone
2 CO2-O2 Tee + 15 cm PVC pipe
3 CO2-O2 Tee + 30 cm PVC pipe
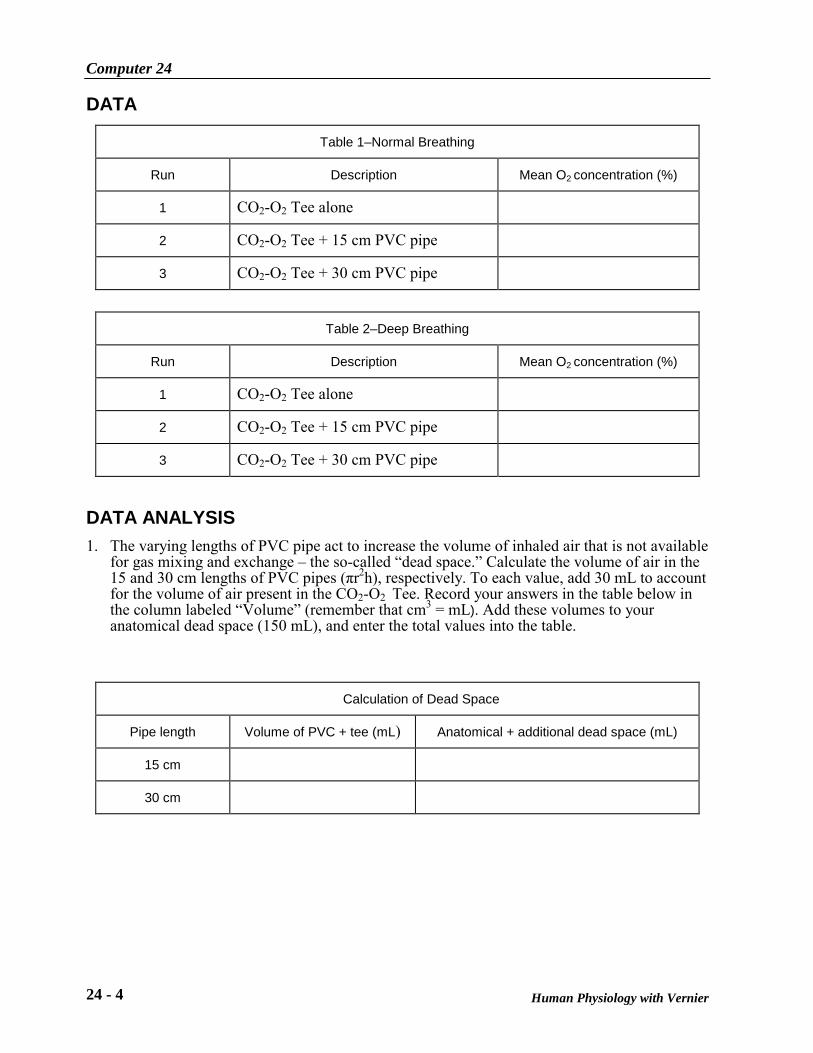
DATA ANALYSIS 1. The varying lengths of PVC pipe act to increase the volume of inhaled air that is not available
for gas mixing and exchange – the so-called “dead space.” Calculate the volume of air in the 15 and 30 cm lengths of PVC pipes (πr2h), respectively. To each value, add 30 mL to account for the volume of air present in the CO2-O2 Tee. Record your answers in the table below in the column labeled “Volume” (remember that cm3 = mL). Add these volumes to your anatomical dead space (150 mL), and enter the total values into the table.
Calculation of Dead Space
Pipe length Volume of PVC + tee (mL) Anatomical + additional dead space (mL)
15 cm
30 cm
Effect of “Dead Space” on Oxygen Availability
Human Physiology with Vernier 24 - 5
2. Using the table you completed in Question 1, estimate the proportion by which your anatomical dead space was artificially increased by
(a) the 15 cm tube.
(b) the 30 cm tube.
3. Describe the trend in mean oxygen concentration seen in the data entered in Table 1.
4. Air is humidified as it passes through the anatomical dead space, becoming fully saturated with water. If 6.3 kPa (47 mm Hg) of H2O is added, it displaces the equivalent pressure of inhaled air. This must be considered when calculating the partial pressure of oxygen. Calculate (to the nearest whole number) the partial pressure of oxygen for each of the runs in Part I using the following formula (if you do not know the barometric pressure, use 101.3 kPa (760 mm Hg) or the normal barometric pressure for your location):
Partial Pressure [O2] = (Barometric Pressure – 6.3 kPa)(Mean Oxygen Concentration)
(a) Run 1
(b) Run 2
(c) Run 3
5. In normal breathing, the addition of CO2 and H2O to air in the alveoli reduces the partial pressure of oxygen to approximately 13.3 kPa (100 mm Hg). Subtract the partial pressure of O2 that you calculated for Run 3 from the value you calculated for Run 1 in question 4. If the alveolar oxygen is reduced by the same amount does this affect the amount of oxygen bound to hemoglobin (see Figure 1).
6. The average amount of air breathed in and out during normal respirations is approximately 500 mL (this is called tidal volume). The volume of air inhaled and exhaled during deep breaths is approximately 4000 mL (this is called vital capacity). Use these values to explain the difference in trends seen in Table 1 and Table 2.
Vernier Lab Safety Instructions Disclaimer
THIS IS AN EVALUATION COPY OF THE VERNIER STUDENT LAB. This copy does not include:
Safety information Essential instructor background information Directions for preparing solutions Important tips for successfully doing these labs
The complete Human Physiology with Vernier lab manual includes 24 labs and essential teacher information. The full lab book is available for purchase at: http://www.vernier.com/cmat/hpa.html
Vernier Software & Technology
13979 S.W. Millikan Way • Beaverton, OR 97005-2886 Toll Free (888) 837-6437 • (503) 277-2299 • FAX (503) 277-2440
[email protected] • www.vernier.com