2.3 the biodiversity portfolio approach to coastal valuation in iczm€¦ · the biodiversity...
TRANSCRIPT

The Biodiversity Portfolio Approach to Coastal
Valuation in ICZM: A case study from Baile Sear, North Uist, Scotland
May 2007 Margaret Carlisle (University of Aberdeen)
David Muir (Comhairle nan Eilean Siar)
Biodiversity Portfolio Approach in Baile Sear May 2007
Executive Summary
__________________________________________________________ A novel technique, termed the ‘Biodiversity Portfolio Approach’ is used here for an
assessment of the services provided by the coastal environment of Baile Sear, North
Uist, as well as an assessment of the risks faced by this environment. The selected
area was split into a number of biomes, and a list of services provided and potential
threats were developed after stakeholder consultation in July 2006.
The returns for each service were identified on the basis of the stakeholder
discussions, placing values on the coastal biomes using Costanza’s approach
(Costanza et al 1997). The risks were identified on the basis of the stakeholder
discussions, placing values using the experiential knowledge of the stakeholders as
well as that of the above named workshop managers. The key dynamics of the
portfolio are then based on the type of interaction between biome components.
The first aim of this exercise was to assemble a biodiversity portfolio of biomes for
the Baile Sear, North Uist, Coast and develop risk return values and a risk-return
profile based upon this portfolio. By doing this it is intended to provide the Baile
Sear stakeholders and ICZM managers with new insight into management strategies.
The second aim of this paper is to evaluate the sensitivity vs. robustness of the
technique. It was found that the technique had a very high sensitivity to area of
biomes. This high sensitivity in combination with a potentially high level of error
(due to a lack of mapped data for certain biomes) greatly reduced the robustness of
the technique. The approach was only moderately sensitive to selection of values
with the matrix, however, and had a low sensitivity to selection of the service and

Biodiversity Portfolio Approach in Baile Sear May 2007
threat criteria. In both these regards the technique can be regarded as being quite
robust.
The approach proved useful at comparing services with a very high ‘existence’
value, such as conservation, with services with a more standard economic measure,
such as agriculture. By doing this the biodiversity portfolio technique proves a
useful tool for further stakeholder discussion, as well as being potentially useful as a
tool for environmental education and understanding and for participatory planning.
The technique also proved useful at establishing that the Baile Sear biodiversity
portfolio is highly sensitive to threats, and is therefore an area requiring higher than
average levels of environmental protection. Finally, the biodiversity portfolio
method is shown to be a useful one for simulating the effect of management
decisions.
Biodiversity Portfolio Approach in Baile Sear May 2007
Acknowledgments The authors, Margaret Carlisle (Corepoint, University of Aberdeen) and David Muir
(ICZM Co-ordinator, Comhairle nan Eilean Siar), gratefully acknowledge the help
of Jeremy Hills (Corepoint, Envision Management Ltd. - a consultancy partner with
Newcastle University) in the design of the stakeholder workshops in Summer 2006,
based on his previous work on the Biodiversity Portfolio Approach: They also
gratefully acknowledge the assistance of Dr Hills in the running of the workshops,
together with Martin Graham (Geography undergraduate, University of Aberdeen)
and Sam MacDonald (Geography post-graduate, University of Strathclyde).
The authors would like to thank Envision Ltd and the Corepoint project, who
provided the travel and time funds for Dr Hills, also Aberdeen University and the
Corepoint project who provided the travel funds for Dr Carlisle, and the Comhairle
nan Eilean Siar who provided funds for the running of the workshops and time funds
for Mr Muir. Dr Carlisle’s time spent at the workshops and on the subsequent
analysis was personal time donated by her to the Corepoint project on a pro bono
publico basis1.
Finally, Dr Carlisle would also like to thank the Aberdeen Corepoint Team for their
continuing support: David R. Green, William Ritchie and Martin Solan.
1 This report should be referenced as follows: Carlisle M.A. & Muir D. (2007) The Biodiversity Portfolio Approach to Coastal Valuation in ICZM: A case study from Baile Sear, North Uist, Scotland. Corepoint project, University of Aberdeen, Scotland. The intellectual copyright remains with Dr Carlisle [email protected]. Use of text or figures is permitted provided that copyright is acknowledged or the authors are referenced.

Biodiversity Portfolio Approach in Baile Sear May 2007
Contents
__________________________________________________________ 1. Introduction 1 2. Methods 5 2.1 Case study area 5 2.2 Stakeholder discussion 8 2.3. Risk-return values 11 2.4 Risk-return profile 11 2.5 Trading off risks to maintain returns 12 2.6 Simulating management decisions in the Biodiversity 13 Portfolio Approach 3. Results 14 4. Discussion 22 4.1 Sensitivity of technique to selection of biomes 22 4.2 Sensitivity of technique to selection of services and threats 23 4.3 Sensitivity of technique to selection of values 23 4.4 Sensitivity of technique to stakeholder simplification 25 4.5 Portfolio sensitivity to threats 26 4.6 Simulating management decisions in the Biodiversity 26 Portfolio Approach 5. Conclusion 28 References 31
Biodiversity Portfolio Approach in Baile Sear May 2007
Figures & Tables
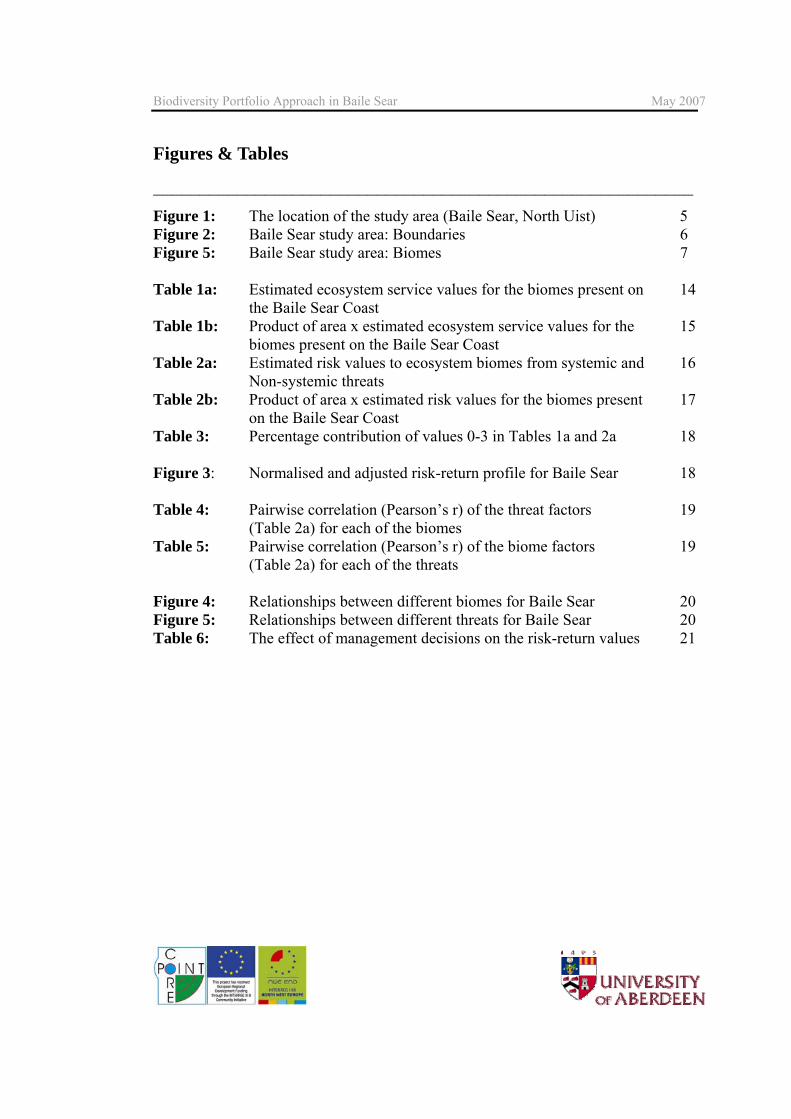
__________________________________________________________ Figure 1: The location of the study area (Baile Sear, North Uist) 5 Figure 2: Baile Sear study area: Boundaries 6 Figure 5: Baile Sear study area: Biomes 7 Table 1a: Estimated ecosystem service values for the biomes present on 14
the Baile Sear Coast Table 1b: Product of area x estimated ecosystem service values for the 15
biomes present on the Baile Sear Coast Table 2a: Estimated risk values to ecosystem biomes from systemic and 16 Non-systemic threats Table 2b: Product of area x estimated risk values for the biomes present 17 on the Baile Sear Coast Table 3: Percentage contribution of values 0-3 in Tables 1a and 2a 18 Figure 3: Normalised and adjusted risk-return profile for Baile Sear 18 Table 4: Pairwise correlation (Pearson’s r) of the threat factors 19 (Table 2a) for each of the biomes Table 5: Pairwise correlation (Pearson’s r) of the biome factors 19 (Table 2a) for each of the threats Figure 4: Relationships between different biomes for Baile Sear 20 Figure 5: Relationships between different threats for Baile Sear 20 Table 6: The effect of management decisions on the risk-return values 21

Biodiversity Portfolio Approach in Baile Sear May 2007
1
1. Introduction
__________________________________________________________
ICZM (Integrated Coastal Zone management) is defined by DEFRA (UK
Department of Environment, Food and Rural Affairs) as follows:
“The objective of ICZM is to establish sustainable levels of economic and social
activity in our coastal areas while protecting the coastal environment. It brings
together all those involved in the development, management and use of the coast
within a framework that facilitates the integration of their interests and
responsibilities. Successful integrated coastal zone management may involve
adopting the following principles:
• A long term view
• A broad holistic approach
• Adaptive management
• Working with natural processes
• Support and involvement of all relevant administrative bodies
• Use of a combination of instruments
• Participatory planning
• Reflecting local characteristics”
The coastline of the Outer Hebrides is over 2,000km in length and forms the
predominant landscape feature of the islands. The coastal land, sea lochs and inshore
waters of the Western Isles are rich in natural resources, wildlife, cultural and
archaeological heritage. Most of the population of the islands live on the coast or
nearby and many derive an income from it and the surrounding inshore waters.

Biodiversity Portfolio Approach in Baile Sear May 2007
2
Comhairle nan Eilean Siar, the local authority for the region, is committed to ICZM
and has led the establishment of a local coastal partnership, the Outer Hebrides
Coastal Marine Partnership (known as ‘CoastHebrides’). This will enable
stakeholders with an interest in economic development, tourism and recreation, the
environment, archaeology, erosion and flooding, such as businesses, community
organisations and individuals, and statutory agencies, to share information, plan, and
help to implement ways of managing the valuable assets on the coast and inshore
waters of the Outer Hebrides.
As a local authority Comhairle nan Eilean Siar has a significant role to play in
implementing actions and policies that will influence the long-term sustainability
and quality of life within the islands. The Comhairle endeavours to ensure its policy
decisions and services compliment sustainable development within its area.
The Comhairle therefore has a responsibility to make management decisions, via the
planning process, that takes into account ecological and social factors as well as
economic factors. In other words, the Comhairle must encourage sustainability in
local economic development. This has been widely accepted as being a prime
function of any Local Authority’s planning service for many years. However there is
still much debate as how to combine analytical techniques and planning instruments
in order to optimise the achievement of above eight ICZM principles.
In particular, there is still some difficulty in achieving an approach that is both
broadly holistic and yet usefully quantitative. According to Turner et al 2003,
“There is a predominance of single function valuation studies. Studies valuing
multiple functions and uses, and studies which seek to capture the ‘before and after’
states as environmental changes take place, are rare. By and large it is the latter
types of analyses that are most important as aids to more rational decision taking in

Biodiversity Portfolio Approach in Baile Sear May 2007
3
ecosystem conservation versus development situations involving different
stakeholders (local, national and global).”
Pearce et al (1989) describe the paradigm of use and non-use values in
environmental economic theory. Direct use values, such as food and mineral prices,
are easily quantified in monetary values. Indirect use values, such as the
attractiveness of a landscape resulting in tourism related income, are only slightly
more difficult to quantify in monetary values. Non-use values such as existence,
option and bequest values have proved considerably more difficult to value, and are
still the subject of much academic interest 17 years on.
Many different valuation methods have been used to value environmental services.
However each method can produce different results for the same area depending on
methodology, lack of data and lack of rigour in the quantification process. The
economic values thus derived are therefore easily challenged and so are of
questionable use as a tool to support the planning process (Corepoint 2005).
The valuation method used in this study is the ‘biodiversity portfolio method’. As
described by Figge (2004) “Portfolio theory, like few other economic theories, has
dramatically transformed the practical work of banks and insurance companies.
Before portfolio theory was developed about 50 years ago, asset managers were
confronted with a situation similar to the situation the research on biodiversity faces
today”.
The theory behind the biodiversity portfolio approach takes the view that the a
selected area can be split into a number of biomes. Each of these biomes provide
ecosystem services or return, but this return is usually subject to risk. Risk for
coastal biomes can be identified using a collection of known threats to the biomes in
Biodiversity Portfolio Approach in Baile Sear May 2007
4
question and return can be identified by placing values on the coastal biomes using
Costanza’s approach (Costanza et al 1997). The key dynamics of the portfolio are
then based on the type of interaction between biome components.
To date, for coastal zones in North-West Europe, this approach has been tested at a
national level (Corepoint 2005). There is one example of the approach being tested
at a local level (Robinson 2006). However, in order to assess the usefulness of the
technique it is necessary to test it at local level in other areas.
The first aim of this paper, therefore, is to assemble a biodiversity portfolio of
biomes for the coast of Baile Sear, North Uist, and develop risk return values and a
risk-return profile based upon this portfolio.
The second aim of this paper is to evaluate the technique, using sensitivity analysis
to determine the sensitivity of the results to:
a.) Changes in the selection of biomes and their resulting changes in surface area;
b.) Changes in the selection of services and threats, and;
c.) Changes in the selection of values within the biome-service and biome-threat
matrices.
The third aim is to provide the Baile Sear stakeholders and ICZM managers with
new insight into management strategies.
Biodiversity Portfolio Approach in Baile Sear May 2007
5
2. Methods
__________________________________________________________ 2.1 Case study area
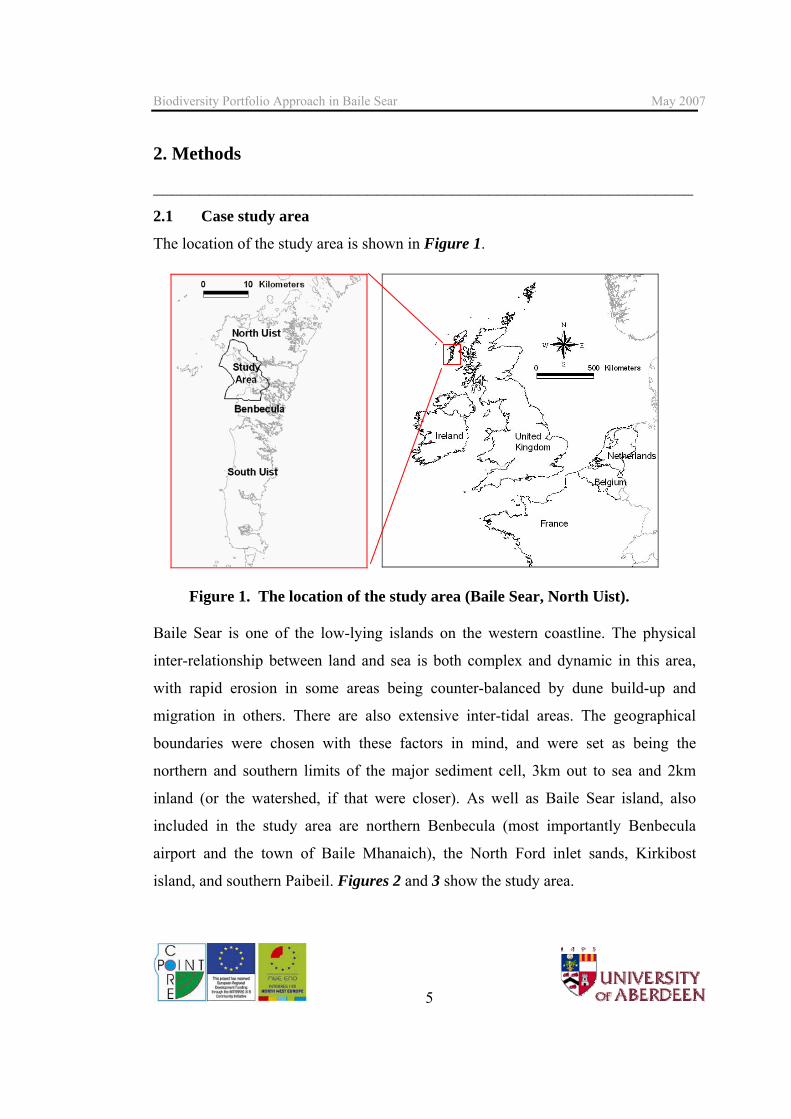
The location of the study area is shown in Figure 1.
Figure 1. The location of the study area (Baile Sear, North Uist). Baile Sear is one of the low-lying islands on the western coastline. The physical
inter-relationship between land and sea is both complex and dynamic in this area,
with rapid erosion in some areas being counter-balanced by dune build-up and
migration in others. There are also extensive inter-tidal areas. The geographical
boundaries were chosen with these factors in mind, and were set as being the
northern and southern limits of the major sediment cell, 3km out to sea and 2km
inland (or the watershed, if that were closer). As well as Baile Sear island, also
included in the study area are northern Benbecula (most importantly Benbecula
airport and the town of Baile Mhanaich), the North Ford inlet sands, Kirkibost
island, and southern Paibeil. Figures 2 and 3 show the study area.
Biodiversity Portfolio Approach in Baile Sear May 2007
6
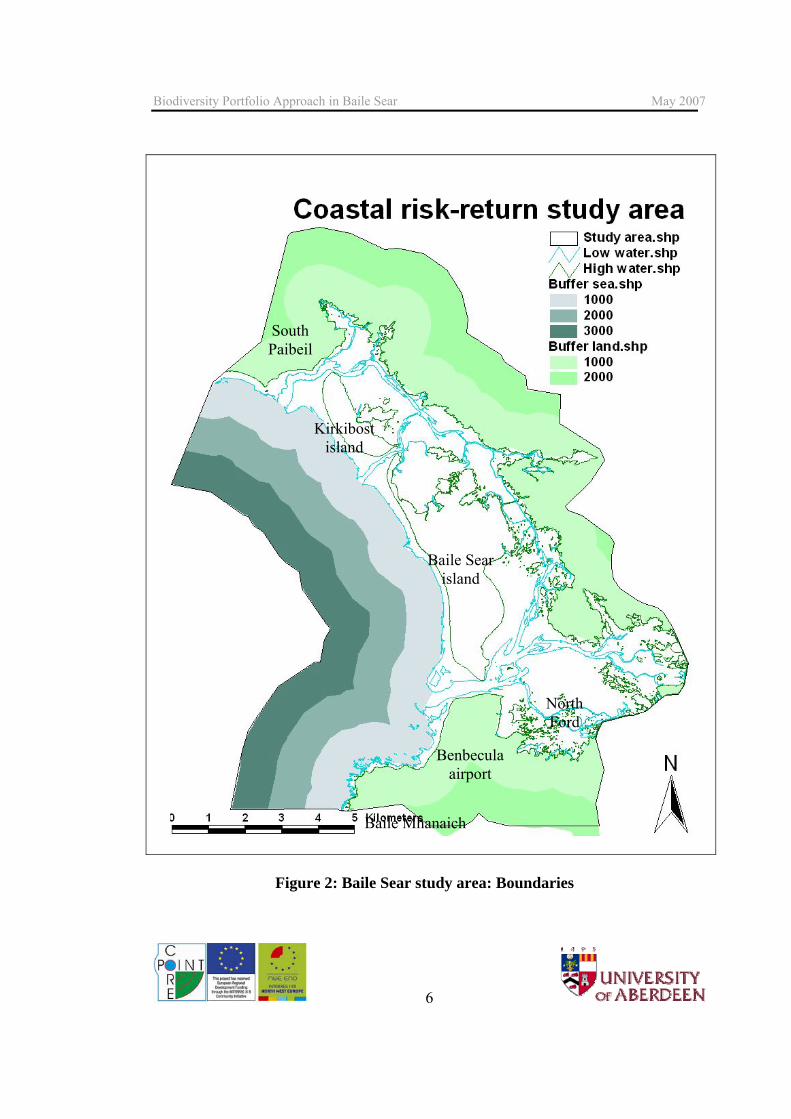
Figure 2: Baile Sear study area: Boundaries
Baile Sear island
Kirkibost island
South Paibeil
Benbecula airport
Baile Mhanaich
North Ford
Biodiversity Portfolio Approach in Baile Sear May 2007
7
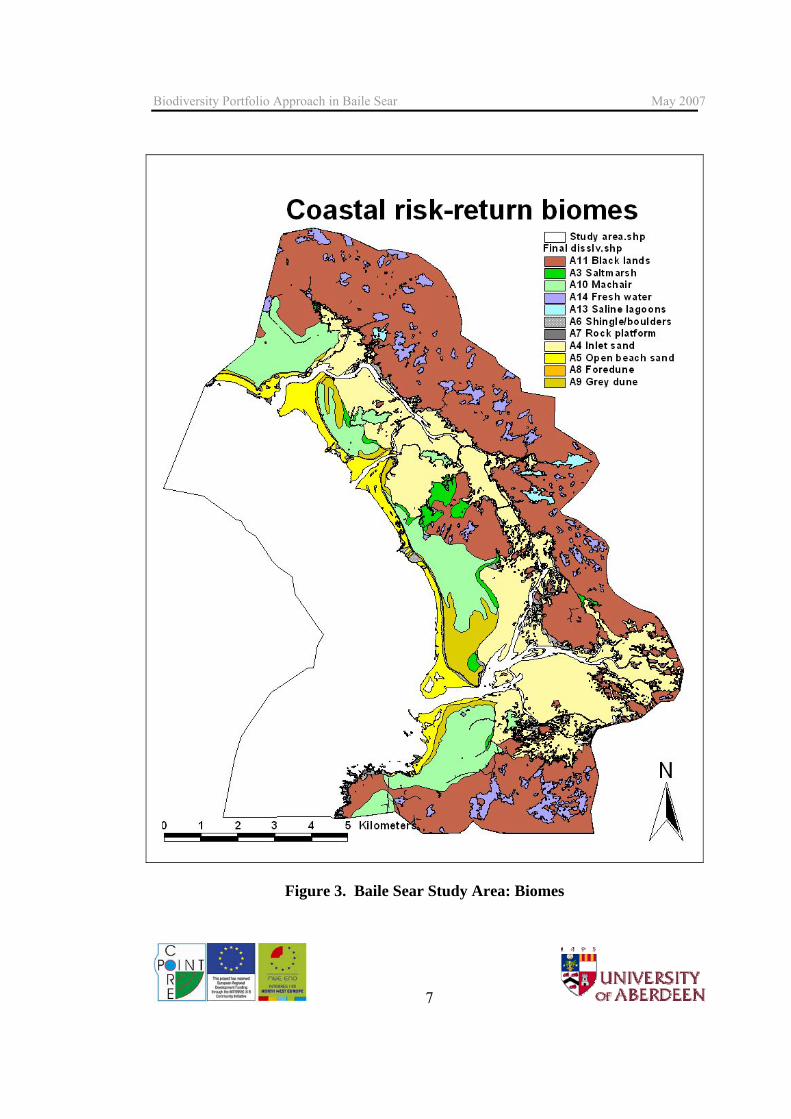
Figure 3. Baile Sear Study Area: Biomes
Biodiversity Portfolio Approach in Baile Sear May 2007
8
2.2 Stakeholder discussion
In July 2006, semi-structured workshops were carried out with members of key
stakeholder groups for the Baile Sear Study Area. These stakeholder groups were:
local residents, mostly crofters (agriculture); national government bodies including
SEERAD (agriculture) and Scottish Natural Heritage (conservation); and local
industry (quarrying and the local game estate). Through stakeholder discussion the
following sets were agreed upon:
(i) A set of biomes which reflect the local resource use and exploitation patterns of
the area. These biomes are illustrated in Figure 3;
Most of the ecosystem categories shown in Figure 3 are self-explanatory. However
two are very specific to the local area. These are:
a.) The machair, which is defined as a type of dune pasture, with a high shell content
(sometimes 90%), that is subject to local cultivation, and which has developed in
wet and windy conditions. It is one of the rarest habitats in Europe, found only in the
north and west of Britain and Ireland. Almost half of the Scottish machair occurs in
the Outer Hebrides, with the best and most extensive in the Uists, Barra, and Tiree.
b.) The ‘black lands’, so called because of the dark peaty soils. This biome is of low
fertility and is not used for cultivation (unlike the machair), but is extensively used
for sheep grazing. It is also an internationally rare habitat of conservation
importance.
Costanza et al (1997) use 16 biome categories, as shown below:
6. open ocean; 7. coastal estuaries; 8. coastal seagrass/algae; 9. coastal coral reef; 10. coastal shelf;

Biodiversity Portfolio Approach in Baile Sear May 2007
9
11. tropical forest; 12. temperate/boreal forest; 13. grass/rangelands; 14. tidal marsh/mangrove wetlands; 15. swamp/floodplain wetlands; 16. lakes/rivers; 17. desert; 18. tundra; 19. ice/rock; 20. cropland; 21. urban.
It was not possible to use exactly the same biomes as Costanza and still have a set of
biomes that encompassed the local ecosystem in a meaningful way. For example,
there is no Costanza biome that is exactly equivalent to the complex of shell sand
based habitats (sand inlet, sand open beach, foredunes, vegetated or ‘grey’ dunes
and the machair), a complex that is almost unique to this area. The very rarity of the
coastal shell sand habitats is the reason why they do not appear on a list of global
biomes such as Costanza’s – and this rarity means that they must appear on the list
of biomes for use in this study.
Another issue relates to lack of data. It would certainly be useful to have the
locations of the seaweed (algae) beds for the shallow waters part of the study area,
but unfortunately this data was not publicly available.
Three major data sources were used in developing Figure 3. The first of these is the
Comhairle nan Eilean Siar, who provided the shapefiles for mean high water springs
and mean low water springs (allowing definition of the inter-tidal areas), as well as
shapefiles for the many fresh water lochans in the study area. The second data
source is the MAGIC (Multi-Agency Geographic Information for the Countryside)
online public database, which provided useful data on the location and extent of

Biodiversity Portfolio Approach in Baile Sear May 2007
10
many of the biomes, specifically the inter-tidal biomes of saltmarsh, sand inlet, sand
open beach, shingle beach, rock platform and saline lagoons. The foredunes, grey
dunes and machair are shown as one category in MAGIC, so the work of W. Ritchie
(1971) was used to map the boundaries between these three categories. The black
lands and fresh lochs comprise the rest of the terrestrial biomes, and were easily
identified from the shapefiles provided by the Comhairle nan Eilean Siar.
(ii) A set of ecosystem services which reflect the local use and dependency upon
them.
Costanza et al (1997) recommend the use of seventeen ecosystem services. Seven of
the Baile Sear services are the same or very closely equivalent: Food production
(agriculture), Raw materials (Sand/gravel/rock/peat extraction), Refugia
(Conservation interest), Waste treatment (Nutrient/waste absorption), Recreation
(Recreation & tourism), Cultural (Cultural/educational) and Disturbance regulation
(Flood protection/coastal defence). This leaves ten Costanza ecosystem services not
used in this study; gas regulation, climate regulation, water regulation, water supply,
soil formation, nutrient cycling, pollination, biological control and genetic resources.
There are five extra services used in this study. Three of these represent local Baile
Sear interests that the stakeholders considered important enough to be kept separate;
Fishing, Angling/shooting and Intertidal gathering. These could have been
incorporated into the existing services; Angling/shooting in Recreation, Fishing and
Intertidal gathering in with Agriculture in Food production. The last two Baile Sear
services - Renewable energy generation and Landtake - are economically very
important, but do not have a direct correspondent in Costanza’s list.

Biodiversity Portfolio Approach in Baile Sear May 2007
11
The ecosystem services were subsequently rated on a scale of 0 to 3 (0 = no or
negligible ecosystem service provided; 3 = extensive to complete service provided).
The results are shown in Tables 1a and 1b;
(iii) a set of threats/risks to these biomes/services. The impact of each threat upon
each biome was subsequently determined by rating each threat on a scale of 0 to 3
(0 = threat factor has no impact; 3 = threat could destroy biome function). The
results are shown in Tables 2a and 2b.
The proportions of cell values 0, 1, 2 and 3 were calculated for Tables 1 and 2, in
order to ascertain any pattern in the distribution. The results are shown in Table 3.
2.3 Risk-return values
The risk to the provision of ecosystem services is dependant upon the area of the
biome present and the return value. The risk-return profile of the Baile Sear Study
Area was thus determined by calculating the risks to the biomes and the returns of
each biome weighted by area using the following equations:
Biome A return = ∑ Biome A return x biome A area
Biome A risk = ∑ Biome A risk x biome A area
The results are ordinal values and are therefore have no units. The values are shown
in the penultimate rows and columns of Tables 1b and 2b.
The total service and total risk values are such large numbers that there is a potential
for stakeholders to misinterpret them as parametric values. The final columns and
rows of Tables 1b and 2b are therefore the total values (for biome, service and

Biodiversity Portfolio Approach in Baile Sear May 2007
12
biome, risk) from the penultimate rows and columns normalised to a percentage
scale.
2.4 Risk-return profile
The risk-return values are of interest in terms of their proportional contribution to
the total (i.e. 100%) service provision and to the total (i.e. 100%) risk. The risk-
return profile (normalised) graph was then obtained by plotting normalised return
(x) against normalised risk (y). Using the normalised results protects against
misinterpretation of the results as parametric values.
The risk-return profile (normalised) is shown in Figure 4. Minor adjustments were
made to (i), the set of biomes which reflect the local resource use. The risk-return
profile was then re-calculated. This was in order to ascertain the sensitivity of the
Biodiversity Portfolio Approach to initial assumptions. The adjusted risk-return
profile (normalised) is also shown in Figure 4.
2.5 Trading off risks to maintain returns
To determine viable management options for the biomes to reduce risk yet maximise
return, it is essential to know the interaction between each of the biomes. The risk
return profile of a portfolio of biomes which respond differently to threats is lower
compared to a portfolio with biomes that respond in the same way. Pairwise
Correlation (Pearson’s r) of the risk factors for each biome was used to determine
the interaction between the biomes:
Where correlation between any pair of biomes is not significant, then the threat
factors of the biomes are not related: These pairs can be termed INDEPENDENT
pairs. Where the correlation between any pair of biomes is significant and positive,
then the threat factors impact upon the biomes in a relatively similar way to the

Biodiversity Portfolio Approach in Baile Sear May 2007
13
biomes, thus their response to threats is similar. These are termed ASSOCIATED
pairs. Sets of associated biome pairs join to form SECTORS. Where the correlation
between any pair of biomes is significant and negative, then the threats which can
greatly impact upon ecosystem services in one biome tend to have little impact upon
the other biome. There is no positive effect except that one biome is resilient to the
threats which impact the other. These are termed PAIRWISE RESILIENT pairs.
The results are shown in Table 4 and the relationships between the different biomes
are illustrated in Figure5.
Portfolio impact sensitivity was then calculated by the sum of pairings with scoring
of:
ASSOCIATED pairs = +1; RESILIENT pairs = -1; INDEPENDENT pairs = 0
This result is shown in Figure 5.
Pairwise Correlation (Pearson’s r) of the risk factors for each biome was also used to
determine the interaction between the threats:
In a similar process to that described above for the biomes, the threats can then be
assessed as INDEPENDENT pairs, ASSOCIATED pairs, sets of associated threat
pairs joining to form SECTORS and RESILIENT pairs. The results are shown in
Table 5 and in Figure 6.
2.6 Simulating management decisions in the Biodiversity Portfolio
Approach
Finally, adjustments were made to the risk values in order to simulate the effects of
management decisions resulting in resource input to minimise two different risk
areas. The two sets of adjusted, but not normalised, risk-return values are shown in
Biodiversity Portfolio Approach in Baile Sear May 2007
14
Table 5. Also shown in Table 5, for comparison, are the original, non-normalised
risk-return values from Tables 1 & 2.
__________________________________________________________
3. Results
__________________________________________________________ (Pages 14 to 21)

Biodiversity Portfolio Approach in Baile Sear May 2007
Page 14
Table 1a. Estimated ecosystem service values for the biomes present on the Baile Sear Coast. Rating is on an ordinal scale from 0 = negligible ecosystem service provided to 3 = extensive to complete ecosystem service provided.
BIOMES SERVICE
Shallow water
Salt marsh
Sand inlet
Sand open beach
Shingle Rock platform
Fore dunes
Grey Dunes
Machair Black lands
Saline lagoons
Fresh lochs
Agriculture 0 1 1 1 0 0 0 2 3 3 0 2 Fishing 3 0 0 0 0 0 0 0 0 0 0 0 Intertidal gathering 0 0 1 1 0 3 0 0 0 0 0 0 Sand/gravel/rock/peat extraction 0 0 0 0 0 0 0 0 0 3 0 0 Conservation interest 1 2 1 1 2 0 3 3 3 3 3 1 Recreation & tourism 1 0 3 3 0 0 3 3 3 3 3 3 Cultural/educational 1 1 1 1 0 0 3 3 3 3 2 2 Flood protection/coastal defence 1 0 0 2 2 0 3 3 0 0 0 0 Nutrient/waste absorption 0 0 0 0 0 0 0 0 3 3 1 1 Re. energy generation 3 0 3 0 0 0 0 0 1 3 0 0 Angling & shooting 1 0 0 0 0 0 0 0 3 3 3 3 Landtake (airport/range/causeways)
1 0 1 0 0 0 3 3 3 0 0 0
Total Service 12 4 11 9 4 3 15 17 22 24 12 12 Area of each biome (sq km) 49.5 1.4 21.9 4.3 3.4 0.3 0.3 2.8 11.7 39.8 0.6 4.5
Biodiversity Portfolio Approach in Baile Sear May 2007
Page 15
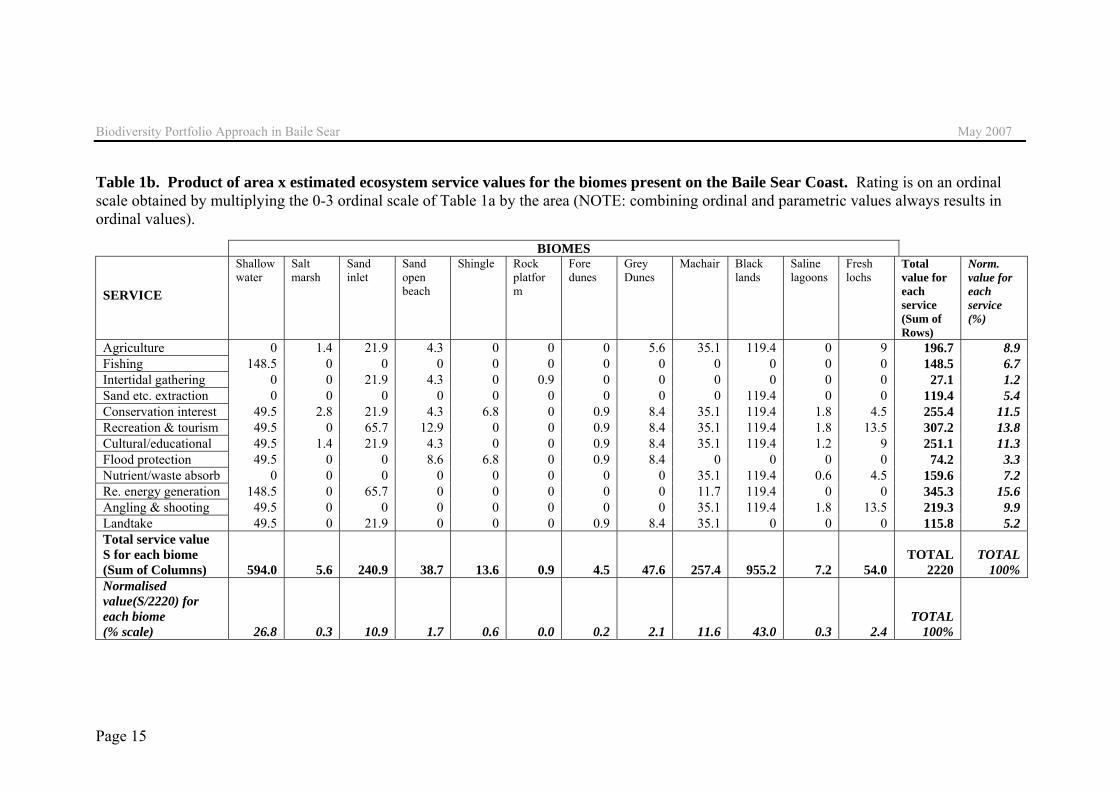
Table 1b. Product of area x estimated ecosystem service values for the biomes present on the Baile Sear Coast. Rating is on an ordinal scale obtained by multiplying the 0-3 ordinal scale of Table 1a by the area (NOTE: combining ordinal and parametric values always results in ordinal values).
BIOMES SERVICE
Shallow water
Salt marsh
Sand inlet
Sand open beach
Shingle Rock platform
Fore dunes
Grey Dunes
Machair Black lands
Saline lagoons
Fresh lochs
Total value for each service (Sum of Rows)
Norm. value for each service (%)
Agriculture 0 1.4 21.9 4.3 0 0 0 5.6 35.1 119.4 0 9 196.7 8.9 Fishing 148.5 0 0 0 0 0 0 0 0 0 0 0 148.5 6.7 Intertidal gathering 0 0 21.9 4.3 0 0.9 0 0 0 0 0 0 27.1 1.2 Sand etc. extraction 0 0 0 0 0 0 0 0 0 119.4 0 0 119.4 5.4 Conservation interest 49.5 2.8 21.9 4.3 6.8 0 0.9 8.4 35.1 119.4 1.8 4.5 255.4 11.5 Recreation & tourism 49.5 0 65.7 12.9 0 0 0.9 8.4 35.1 119.4 1.8 13.5 307.2 13.8 Cultural/educational 49.5 1.4 21.9 4.3 0 0 0.9 8.4 35.1 119.4 1.2 9 251.1 11.3 Flood protection 49.5 0 0 8.6 6.8 0 0.9 8.4 0 0 0 0 74.2 3.3 Nutrient/waste absorb 0 0 0 0 0 0 0 0 35.1 119.4 0.6 4.5 159.6 7.2 Re. energy generation 148.5 0 65.7 0 0 0 0 0 11.7 119.4 0 0 345.3 15.6 Angling & shooting 49.5 0 0 0 0 0 0 0 35.1 119.4 1.8 13.5 219.3 9.9 Landtake 49.5 0 21.9 0 0 0 0.9 8.4 35.1 0 0 0 115.8 5.2 Total service value S for each biome (Sum of Columns) 594.0 5.6 240.9 38.7 13.6 0.9 4.5 47.6 257.4 955.2 7.2 54.0
TOTAL2220
TOTAL
100% Normalised value(S/2220) for each biome (% scale) 26.8 0.3 10.9 1.7 0.6 0.0 0.2 2.1 11.6 43.0 0.3 2.4
TOTAL 100%
Biodiversity Portfolio Approach in Baile Sear May 2007
Page 16
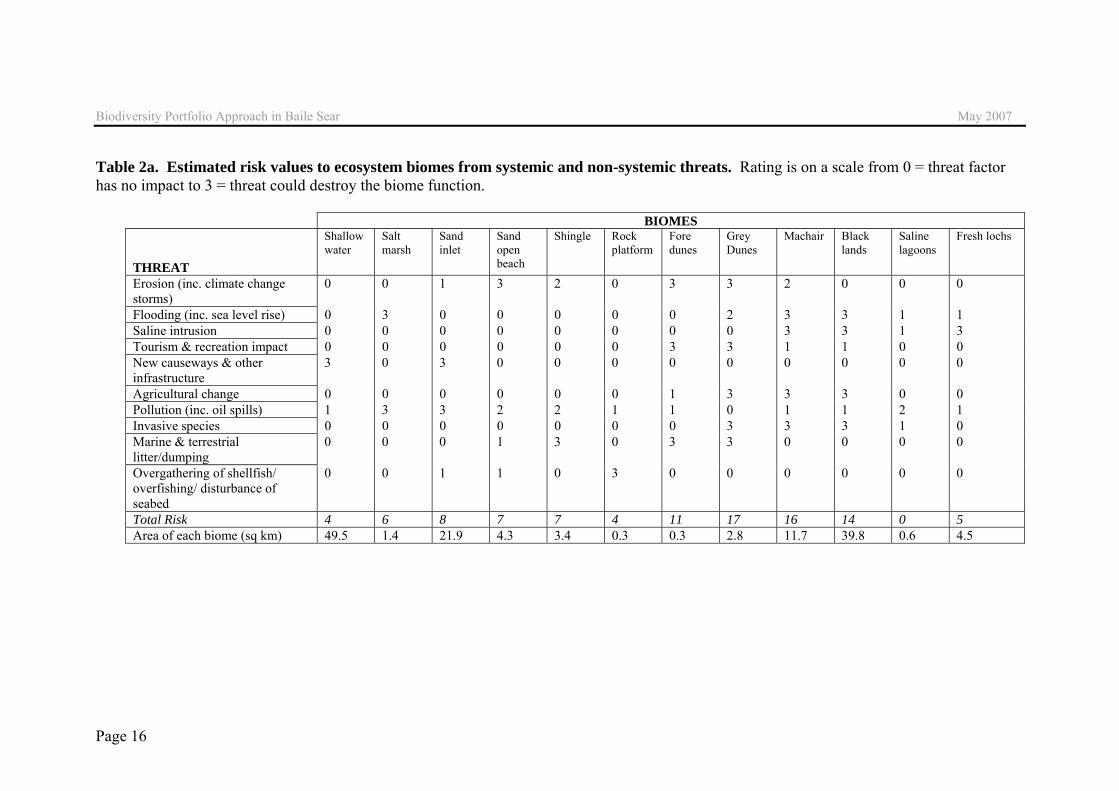
Table 2a. Estimated risk values to ecosystem biomes from systemic and non-systemic threats. Rating is on a scale from 0 = threat factor has no impact to 3 = threat could destroy the biome function.
BIOMES THREAT
Shallow water
Salt marsh
Sand inlet
Sand open beach
Shingle Rock platform
Fore dunes
Grey Dunes
Machair Black lands
Saline lagoons
Fresh lochs
Erosion (inc. climate change storms)
0 0 1 3 2 0 3 3 2 0 0 0
Flooding (inc. sea level rise) 0 3 0 0 0 0 0 2 3 3 1 1 Saline intrusion 0 0 0 0 0 0 0 0 3 3 1 3 Tourism & recreation impact 0 0 0 0 0 0 3 3 1 1 0 0 New causeways & other infrastructure
3 0 3 0 0 0 0 0 0 0 0 0
Agricultural change 0 0 0 0 0 0 1 3 3 3 0 0 Pollution (inc. oil spills) 1 3 3 2 2 1 1 0 1 1 2 1 Invasive species 0 0 0 0 0 0 0 3 3 3 1 0 Marine & terrestrial litter/dumping
0 0 0 1 3 0 3 3 0 0 0 0
Overgathering of shellfish/ overfishing/ disturbance of seabed
0 0 1 1 0 3 0 0 0 0 0 0
Total Risk 4 6 8 7 7 4 11 17 16 14 0 5 Area of each biome (sq km) 49.5 1.4 21.9 4.3 3.4 0.3 0.3 2.8 11.7 39.8 0.6 4.5

Biodiversity Portfolio Approach in Baile Sear May 2007
Page 17
Table 2b. Product of area x estimated risk values for the biomes present on the Baile Sear Coast. Rating is on an ordinal scale obtained by multiplying the 0-3 ordinal scale of Table 2a by the area (NOTE: combining ordinal and parametric values always results in ordinal values).
BIOMES THREAT / RISK
Shallow water
Salt marsh
Sand inlet
Sand open beach
Shingle Rock platform
Fore dunes
Grey Dunes
Machair Black lands
Saline lagoons
Fresh lochs
Total value for each risk (Sum of Rows)
Norm. value for each risk (%)
Erosion (inc. climate change storms) 0 0 21.9 12.9 6.8 0 0.9 8.4 23.4 0 0 0 74.3 5.9 Flooding (inc. sea level rise) 0 4.2 0 0 0 0 0 5.6 35.1 119.4 0.6 4.5 169.4 13.5 Saline intrusion 0 0 0 0 0 0 0 0 35.1 119.4 0.6 13.5 168.6 13.4 Tourism & recreation impact 0 0 0 0 0 0 0.9 8.4 11.7 39.8 0 0 60.8 4.8 New causeways & other infrastructure 148.5 0 65.7 0 0 0 0 0 0 0 0 0 214.2 17.0 Agricultural change 0 0 0 0 0 0 0.3 8.4 35.1 119.4 0 0 163.2 13.0 Pollution (inc. oil spills) 49.5 4.2 65.7 8.6 6.8 0.3 0.3 0 11.7 39.8 1.2 4.5 192.6 15.3 Invasive species 0 0 0 0 0 0 0 8.4 35.1 119.4 0.6 0 163.5 13.0 Marine & terrestrial litter/dumping 0 0 0 4.3 10.2 0 0.9 8.4 0 0 0 0 23.8 1.9 Overgathering of shellfish/ overfishing 0 0 21.9 4.3 0 0.9 0 0 0 0 0 0 27.1 2.2 Total threat value R for each biome (Sum of Columns) 198.0 8.4 175.2 30.1 23.8 1.2 3.3 47.6 187.2 557.2 3.0 22.5
TOTAL1258
TOTAL
100% Normalised value (R/1258) for each biome (% scale) 15.7 0.7 13.9 2.4 1.9 0.1 0.3 3.8 14.9 44.3 0.2 1.8
TOTAL
100%

Biodiversity Portfolio Approach in Baile Sear May 2007
18
Table 3: Percentage contribution of values 0-3 in Tables 1a & 2a.
Value Return count
Risk count
Total count
% of total count
% of counts
1-3 3 36 25 61 23 55 2 8 6 14 5 13 1 21 15 36 14 32 0 79 72 151 58 N/A
Sum 144 118 262 100% 100%
Black land
Shallow water
Machair
Sandy inlets
0
10
20
30
40
50
0 10 20 30 40 50
Normalised risk x area (%)
Nor
mal
ised
retu
rn x
are
a (%
)
Adjusted valuesOriginal values
Figure 4. Normalised and adjusted risk-return profile for Baile Sear.

Biodiversity Portfolio Approach in Baile Sear May 2007
Page 19
Table 4. Pairwise correlation (Pearson’s r) of the threat factors (Table 2a) for each of the BIOMES.
Shallow water
Salt marsh Sand inlet Sand open beach
Shingle Rock platform
Foredune Vegetated Dunes
Machair Black lands
Saline lagoons
Fresh lochs
Shallow water 1 Salt marsh 0.055 1 Sand inlet 0.823 ** 0.300 1 Sand open beach -0.087 0.149 0.375 1 Shingle -0.079 0.136 0.187 0.733 ** 1 Rock platform -0.071 0.055 0.262 0.239 -0.079 1 Foredune -0.285 -0.231 -0.185 0.482 0.650 * -0.285 1 Vegetated Dunes -0.523 -0.247 -0.641 * 0.007 0.199 -0.523 0.613 * 1 Machair -0.460 0.156 -0.522 -0.249 -0.369 -0.460 -0.276 0.319 1 Black lands -0.370 0.221 -0.518 -0.572 -0.523 -0.370 -0.476 0.166 0.898 ** 1 Saline lagoons 0.000 0.745 ** 0.256 0.074 0.068 0.000 -0.401 -0.368 0.349 0.440 1 Fresh lochs -0.118 0.271 -0.093 -0.162 -0.148 -0.118 -0.375 -0.497 0.423 0.480 0.566 1
** = r>0.708, highly significant at 0.01 threshold, * = 0.576<r<0.708, significant at 0.05 threshold, r< 0.576, not significant Table 5. Pairwise correlation (Pearson’s r) of the biome factors (Table 2a) for each of the THREATS.
Erosion Flooding Saline intrusion
Tourism Infrastructure
Agric. changes
Pollution Invasive species
Litter Over-harvesting
Erosion 1 Flooding -0.164 1 Saline intrusion -0.288 0.579 1 Tourism 0.628* 0.200 -0.039 1 Infrastructure -0.233 -0.386 -0.291 -0.270 1 Agric change 0.322 0.683* 0.492 0.667* -0.291 1 Pollution -0.225 -0.115 -0.301 -0.60*9 0.258 -0.601* 1 Invasive species 0.169 0.734** 0.542 0.491 -0.291 0.949** -0.526 1 Litter 0.780** -0.251 -0.424 0.667* -0.291 0.186 -0.301 0.034 1 Overharvesting -0.138 -0.417 -0.315 -0.291 0.043 -0.315 0.056 -0.315 -0.239 1
** = r>0.728, highly significant at 0.01 threshold, * = 0.589<r<0.728, significant at 0.05 threshold, r< 0.589, not significant
Biodiversity Portfolio Approach in Baile Sear May 2007
20
Sandy inlets
Vegetated dunes
Shallow water
Foredunes
Saline lagoons
Shingle
Salt marsh
Sandy open beaches
Machair
Rock platform
Black lands
Fresh lochs
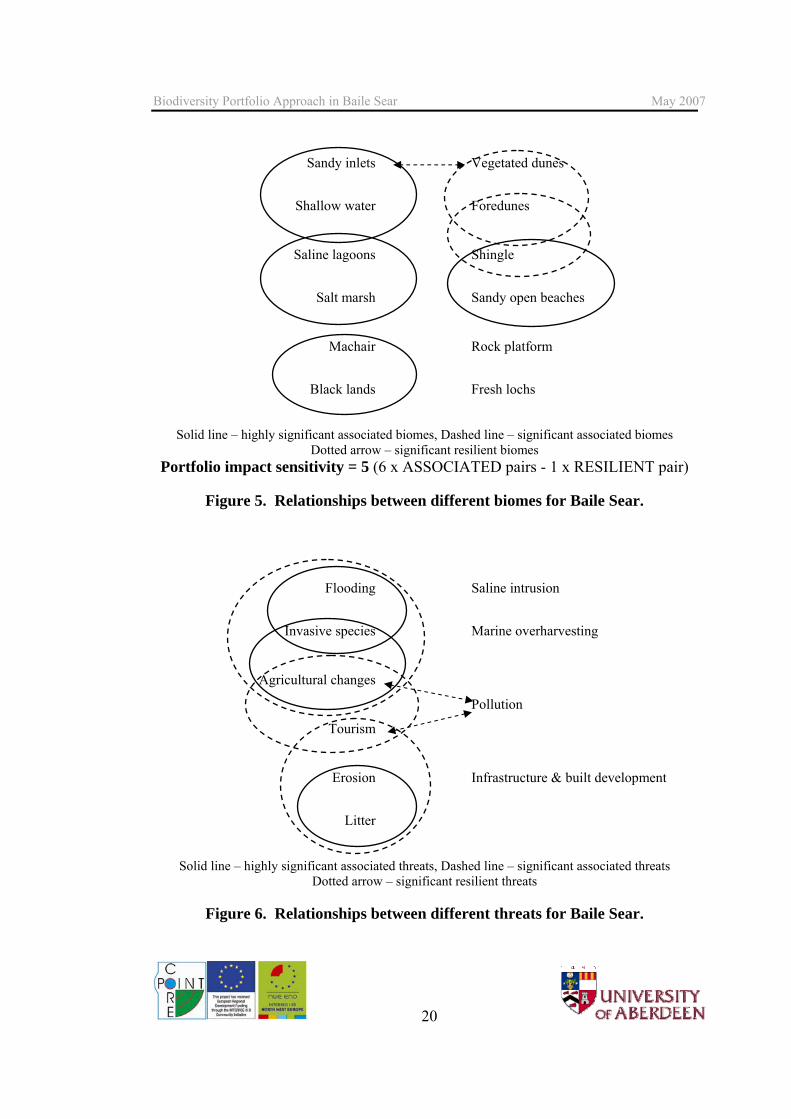
Solid line – highly significant associated biomes, Dashed line – significant associated biomes Dotted arrow – significant resilient biomes
Portfolio impact sensitivity = 5 (6 x ASSOCIATED pairs - 1 x RESILIENT pair)
Figure 5. Relationships between different biomes for Baile Sear.
Flooding
Saline intrusion
Invasive species
Marine overharvesting
Agricultural changes
Pollution
Tourism
Erosion
Infrastructure & built development
Litter
Solid line – highly significant associated threats, Dashed line – significant associated threats Dotted arrow – significant resilient threats
Figure 6. Relationships between different threats for Baile Sear.

Biodiversity Portfolio Approach in Baile Sear May 2007
21
22
Original
return Original risk
Adjusted Return #1
Adjusted Risk #1
Adjusted Return #2
Adjusted Risk #2
Shallow water 594.0 198.0 544.5 49.5 594.0 198.0 Salt marsh 5.6 8.4 5.6 8.4 5.6 8.4 Sand inlet 240.9 175.2 219.0 109.5 240.9 175.2 Sand open beach 38.7 30.1 38.7 30.1 38.7 30.1 Shingle 13.6 23.8 13.6 23.8 13.6 23.8 Rock platform 0.9 1.2 0.9 1.2 0.9 1.2 Foredune 4.5 3.3 4.5 3.3 4.5 3.0 Vegetated Dunes 47.6 47.6 47.6 47.6 42.0 36.4 Machair 257.4 187.2 257.4 187.2 257.4 152.1 Black lands 955.2 557.2 955.2 557.2 955.2 437.8 Saline lagoons 7.2 3.0 7.2 3.0 7.2 3.0 Fresh lochs 54.0 22.5 54.0 22.5 54.0 22.5 TOTALS 2219.6 1257.5 2148.2 1043.3 2214.0 1091.5 Ret/Ris = 1.8 Ret/Ris = 2.1 Ret/Ris = 2.0
Table 6: The effect of management decisions on the risk-return values

Biodiversity Portfolio Approach in Baile Sear May 2007
22
4. Discussion
__________________________________________________________
4.1 Sensitivity of technique to selection of biomes
Figure 4 illustrates the risk-return profile for Baile Sear. The effect of a large land
area is considerably more important to the risk-return profile value for a given
biome than the effect of a large risk or return value. Because of this, only four
biomes have substantial risk-return values – the black lands, shallow waters, sandy
inlets and the machair. All other biomes, including the biome vegetated dunes
(which has the highest risk value, 17, and the third highest service value, also 17),
are grouped in the bottom left corner of the graph. This indicates a very high
sensitivity to the area of the biomes.
For most of the terrestrial biomes the geographical boundaries are clearly defined
and uncontested. The very large biome of shallow waters, however, could
potentially be further subdivided, according to the substrate (sandy, muddy, rocky or
shingle). There is no trawling in the shallow water biome, only creeling for prawns
(Nephrops norvegicus) and lobsters. Both these species prefer specific habitats.
According to the Marine Life Information Network for Britain and Ireland “There
are many records of Nephrops norvegicus populations <20 m in Scottish Sea Lochs.
They live in shallow burrows and are common on grounds with fine cohesive mud
which is stable enough to support their unlined burrows”, and also “Lobster
Homarus gammarus are found on rocky substrata, living in holes and excavated
tunnels from the lower shore to about 60 m depth”. It could therefore be inferred that
prawn creels are only put down in the muddy areas and lobster pots in the rocky
areas. The active area supporting this service has therefore probably been
overestimated, leading to an overestimation of the return value for shallow waters.
Biodiversity Portfolio Approach in Baile Sear May 2007
23
4.2 Sensitivity of technique to selection of services and of threats
As a thought experiment, 3 extra services were added to the matrix in Table 1a.
These were:
a.) Fish nursery (value 3 being given to shallow waters)
b.) Renewable energy generation – tidal (value 3 being given to shallow waters
and sandy inlets)
c.) Renewable energy generation – wave (value 3 being given to shallow waters
and sandy inlets)
The results are shown as the adjusted values in Figure 3. This shows that the
proportional return of the shallow waters biome, has, as expected, increased from
25% to 37%. The black land biome has concomitantly decreased from 44.5% to
34%. Given that there was an increase of number of services from 12 to 15 (an
increase of 25%, all focused on increasing the value of the shallow waters biome),
this appears to demonstrate a relatively low sensitivity to the initial selection of
services.
As the threat/risk criteria are in the same mathematical relationship to the output as
the service criteria, the above result also supports the statement that there will be a
relatively low sensitivity to the initial selection of threats
4.3 Sensitivity of technique to selection of values
The final columns of Tables 1b and 2b show the normalised total service and risk
respectively.
The highest service value is 15.6% for renewable energy generation, followed by
13.8% for tourism, and 11.5% for conservation. Agriculture is only placed 6th, with

Biodiversity Portfolio Approach in Baile Sear May 2007
24
8.9%. This may not be in accordance with traditional understanding of the economic
importance of different services. There are three reasons why this may be so:
a.) It may be because a particular service – for example conservation interest –
has always been difficult to evaluate using classical economics and so has
traditionally had its importance undervalued.
b.) It may be because values are given that reflect potential, rather than current
use – for example, there are at present no extensive renewable energy
generation schemes, so if the shallow waters, sandy inlets and black lands are
assigned a value of 1, rather than 3., then renewable energy generation has a
total service value of 6.2%, putting it at 8th place rather than 1st.
c.) Finally, in some cases it may be because the traditional understanding is, in
fact, wrong.
The biodiversity portfolio technique thus provides a valuable tool for examining the
service return, providing a basis for further stakeholder discussion and deepening the
understanding of the direct and indirect economic return. In some cases – for
example comparing the 8.9% service return of agriculture with the 13.8% service
return of recreation and tourism – it may be possible to compare actual economic
data in order to confirm or refute the service values and placings.
The highest risk value is 17% for causeways and other infrastructure, followed by
15.3% for pollution. Flooding, saline intrusion, agricultural change and invasive
species have similar risk values of around 13%. Litter is placed 10th, with a risk
value of 1.9%. In Table 2a, Litter is given a value of 0 for the shallow water biome,
but it can be argued that the issue of marine litter is relevant here and that it should
be given a value of at least 1. Doing so increases the risk value to 5.6%, and
increases the placing to 8th.

Biodiversity Portfolio Approach in Baile Sear May 2007
25
It can be concluded that the technique is moderately sensitive to selection of values,
though this is only important for those biomes with extensive geographical areas.
4.4 Sensitivity of technique to stakeholder simplification (nominalization).
Table 3 shows the proportional contribution of values 0-3 in the two tables derived
directly from stakeholder workshops (Tables 1a and 2a). 58% of values are zero,
14% are 1, 5% are 2 and 23% are 3. This illustrates a slight tendency in
stakeholders to categorise each valuation nominally (two classes only – yes, there is
a value/no, there is no value) rather than ordinally (scalar, multiple classes). In other
words, having agreed that a particular biome does provide a service or is exposed to
a threat, there was then a tendency to rate that service or threat as being the highest
value possible, i.e. 3.
This tendency to nominalization diminishes the amount of variability in the dataset.
The high percentage of values set at zero is not the problem. This merely reflects the
fact that many biomes only contribute to a small number of services or threats. For
example, shingle beaches only contribute to conservation and coastal protection
services. The optimum spread of non-zero values, with the most variability, would
be 33% of non-zero values for each of 1, 2 and 3. In this case, the proportion of non-
zero values set at 1 is 32%, close to the ideal. The problem, therefore, is in the high
number of non-zero values set at 3 (55%), rather than 2 (13%).
In order to avoid this problem in future workshops it is recommended that the
workshop facilitator calculate the percentages after the initial set of valuations, and
if necessary come back to the stakeholders requesting selection of those cells which
should have their values reduced from 3 to 2.
Biodiversity Portfolio Approach in Baile Sear May 2007
26
4.5 Portfolio sensitivity to threats
It can be seen from Figure 4 that the Baile Sear portfolio is highly sensitive to
threats, with 6 associated pairs and only 1 resilient pair, leading to a portfolio impact
sensitivity rating of 5.
Figure 4 also shows that there is one complex sector of biome relationships, that of
the dynamic shore system. This encompasses the progression from sandy open
beaches and shingle beaches to foredunes and then to vegetated dunes. There are
also three simple sectors, of one biome pair each – sandy inlets/shallow waters,
saline lagoons/saltmarsh, machair/black lands.
Doing the same analysis on the threats gives Figure 6, which shows one very
complex sector of threats incorporating flooding, invasive species, agricultural
changes, tourism impact, storm erosion and litter. The first three of these threats –
flooding, invasive species and agricultural change – are very significantly
associated, and make up a sub-sector comprising 39.5% of the total risk. Any
management strategy that aims to deal with one of these threats, in order to protect
the machair biome, for example, must also deal with the other threats in the sub-
sector.
4.6 Simulating management decisions in the Biodiversity Portfolio
Approach
Management scenario 1 is that there is an embargo on further causeways or other
major infrastructure elements built on the inlet sands or shallow waters. This brings
down the return (Table 6, column 3) as well as the risk (Table 6, column 4). The
ratio of return to risk rises from 1.8 to 2.1.

Biodiversity Portfolio Approach in Baile Sear May 2007
27
Management scenario 2 is that financial incentives are put in place to maintain
agricultural activity at the optimum balance for maintaining the machair and black
lands. Additionally it is postulated that agricultural activity ceases on the vegetated
dunes (one of the main threats being erosion due to livestock activity). Again, this
brings down the return (Table 6, column 5) but also the risk (Table 6, column 6),
and the return/risk ratio rises from 1.8 to 2.0.
It can be seen from this exercise that the Biodiversity Portfolio Approach is a useful
one for simulating the effect of management decisions.

Biodiversity Portfolio Approach in Baile Sear May 2007
28
5. Conclusion
__________________________________________________________
The biodiversity portfolio method succeeds as a technique valuing multiple
functions and uses, being both broadly holistic and specifically quantitative.
However the usefulness of the technique depends on its robustness, its ability to
stand up to challenge. Robustness can be defined here as being the combination of
sensitivity and measurement accuracy or levels of error due to mis-categorization.
Low sensitivity plus high measurement accuracy/low levels of error is the most
robust combination, and low sensitivity plus low measurement accuracy/high levels
of error is still reasonably robust. However, a low sensitivity level is also the least
informative - a certain amount of sensitivity is required in order to obtain enough
variation for the technique to be informative. Therefore the ideal is high sensitivity
plus high measurement accuracy/low error.
The discussion sections show that the technique is highly sensitive to the selection
of biomes. This is actually due to the very high sensitivity to the area of biomes.
This in turn is dependent on the availability of data – in this instance lack of data on
shallow water substrates certainly had a major effect. Therefore the technique has a
very high sensitivity to geographical data, in combination with a potentially high
level of error (low measurement accuracy) with regard to that geographical data, and
this must be taken into account in any future application. This is the least robust
aspect of the method.
The technique showed a moderate sensitivity to selection of values within the
matrix. In this study values were selected after consultation with stakeholders on a
group basis, so consensus was achieved prior to the assignation of values. If going
through the exercise with groups of stakeholders with very different interests it may
Biodiversity Portfolio Approach in Baile Sear May 2007
29
be that the values will be subtly different, but because of the merely moderate
sensitivity this should rarely lead to a major difference in the matrix as a whole. The
reason for any such major difference will be very easy to identify, and an ICZM
manager could then work on achieving a consensus value for this ‘sticking point’.
Additionally, because of the moderate sensitivity, the tendency for stakeholders to
over-use the highest value and under-use the middle values is not a serious problem.
The moderate sensitivity in combination with a low measurement accuracy leads to
a medium level of robustness for this aspect of the method.
The final part of the sensitivity analysis was the sensitivity to selection of services
and threats. The sensitivity was low, and this was the most robust aspect of the
method.
By providing estimates of % contribution for each ecosystem service and each
ecosystem threat, the biodiversity portfolio technique proves a useful tool for further
stakeholder discussion. Results such as those obtained here, with 11.5% service
contribution from conservation vs. 8.9% from agriculture, may be in conflict with
established belief. This will be difficult to prove one way or the other with this
particular pair of services, conservation having a great deal of non-monetary
‘existence value’. However, if it proves possible to compare actual economic data
for other services – agriculture and tourism, for example – then this has the potential
to support or refute the estimates of % contribution for the other services.
The method may indeed prove useful as an educational tool as well. Both the dataset
itself and the arithmetic required to undertake the initial analysis of the dataset are
very simple and highly transparent. It could therefore be an important tool for
participatory planning.
Biodiversity Portfolio Approach in Baile Sear May 2007
30
The technique has proved useful at establishing that the Baile Sear biodiversity
portfolio is highly sensitive to threats. It is therefore an area requiring higher than
average levels of environmental protection. Finally, the biodiversity portfolio
method is shown to be a useful one for simulating the effect of management
decisions.

Biodiversity Portfolio Approach in Baile Sear May 2007
31
References COREPOINT Envision. Quantification of the economic benefits of natural coastal ecosystems, 2005. Costanza R, D’Arge R, De Groot R, Farber S, Grasso M, Hannon B, Limburg k, Naeem S, O’Neill RV, Paruelo J, Raskin RG, Sutton P, Van Den Belt M. The value of the world’s ecosystem services and natural capital. Nature 1997; 387: 253-260. Figge F. Bio-folio: applying portfolio theory to biodiversity. Biodiversity and Conservation 2004; 13: 827-849. Perace D., Markandya A. & Barbier E.B., 1989. Blueprint for a Green Economy. Earthscan, London. 192 pp. Ritchie, W., 1971. The Beaches of Barra and the Uists. A survey of the beach, dune and machair areas of Barra, South Uist, Benbecula, North Uist and Berneray. Department of Geography, University of Aberdeen, for the Countryside Commission for Scotland. Reprinted 2004 by Scottish Natural Heritage as a Commissioned Report No. 047. Robinson, C. (2006). The biodiversity portfolio approach to coastal valuation: Using it as a tool within an ICZM framework at a local scale. MSc Thesis, University of Newcastle upon Tyne. Turner RK, Paavola J, Cooper P, Farber S, Jessamy V, Georgiou S. Valuing nature: lessons learned and future research directions. Ecological Economics 2003; 46: 493-510. http://www.defra.gov.uk/environment/water/marine/uk/iczm/index.htm http://www.magic.gov.uk/ http://www.marlin.ac.uk/species/Nephropsnorvegicus.htm http://www.marlin.ac.uk/species/Homarusgammarus.htm