22556 public disclosure authorized - documents & reports ... fileeases discussion paper series...
TRANSCRIPT

22556June 2001
-eas9t vA41 tr;r4n#Dt
*d 3ocjFl-~A-opmet
EASES Discussion Paper Series
PUBLIC ENVIRONMENTAL EXPENDITURE
IN INDONESIA
Jeffrey R. VincentJean Aden
Magda AdrianiGiovanna DoreVivianti RambeThomas Walton
Pub
lic D
iscl
osur
e A
utho
rized
Pub
lic D
iscl
osur
e A
utho
rized
Pub
lic D
iscl
osur
e A
utho
rized
Pub
lic D
iscl
osur
e A
utho
rized
Pub
lic D
iscl
osur
e A
utho
rized
Pub
lic D
iscl
osur
e A
utho
rized
Pub
lic D
iscl
osur
e A
utho
rized
Pub
lic D
iscl
osur
e A
utho
rized
This publication was developed and produced by the Environment and Social Development Unit (EASES), EastAsia and Pacific Region of the World Bank. The Environment, Rural Development, and Social Development arepart of the Environmentally and Socially Sustainable Development (ESSD) Network.
Papers in the EASES Discussion Paper Series are not formal publications of the World Bank. They are publishedand circulated to encourage discussion and comment within the development community. The findings,interpretations, judgments, and conclusions expressed in this paper are those of the author(s) and should not beattributed to the World Bank, to its affiliated organizations, or to members of the Board of Executive Directors orthe governments they represent.
Copies of this paper are available from:Giovanna DoreEASES, Room MCS-214

EASES Discussion Paper Series
PUBLIC ENVIRONMENTALEXPENDITURE IN INDONESIA
JeffreyR. VincentJean AdenMagda AdrianiGiovanna DoreVivianti RambeThomas Walton
June 2001

Abbreviations and Acronyms
AMDAL Procedures for environmental impact assessmentANDAL Environmental assessment reportAPBD Regional budgetAPBN National budgetBAPEDAL Environmental Impact Management AgencyDIP Authorized investment amount for a development project (Daftar Isian Projek)DOE Department of Environment (Malaysia)FY Fiscal year (April 1 to March 31)GDP Gross domestic productIMF International Monetary FundINPRES Transfers to regions (Instruksi Presiden)MLH Ministry of EnvironmentMoF Ministry of FinancePDAM Regional water supply companyPLP Environmental Program for Settlements (Penataan Lingkungan Pernukiman)WATSAL Water Sector Adjustment Loan ProjectWUA Water user association

Environmental Expenditure iii
Table of Contents
Executive Summary ....................................................... v
1. Introduction ....................................................... 1
2. Core Environmental Expenditures in the National Budget .............................................. 7
3. Core Environmental Expenditures at a Regional Level .......................................... ..... 16
4. Conclusions ....................................................... 20
Bibliography ....................................................... 21
Appendix I. Econometric Analysis of Provincial Environmental Expenditures . ................. .22

iv Environmental Expenditure
Acknowledgments
This report was prepared as part of the World Bank country study, Indonesia: Environment andNatural Resource Management in a Time of Transition, under the guidance of Ms. Kristalina Georgieva,Director of the Environrnent Department (ENV), and Mr. Zafer Ecevit, Director of the Environment andSocial Development Unit (EASES) of the East Asia & Pacific Region at the World Bank.
The report was prepared by Mr. Jeffrey R. Vincent (Harvard University), with contributions by Ms.Jean Aden (EASES), Ms. Magda Adriani (EASES), Ms. Giovanna Dore (EASES), Ms. Vivianti Rambe(EACIF), and Mr. Thomas Walton (EACEF). Comments by John Dixon (ENV) and Sudarshan Gooptu(EASPR) are gratefully acknowledged.

Environmental Expenditure v
Executive Summary
The economic rationale for public expenditure is particularly strong in the case of environmentalmanagement. Yet, an environmental analysis is not a routine feature of public expenditure reviews by theWorld Bank or other development organizations. This paper represents an initial step toward anenvironmental analysis of the government budget in the Republic of Indonesia. It examines mainly theexpenditure side of the budget. Its objective is to provide baseline information on trends and patterns inenvironmental expenditures. It focuses on "core environmental expenditures": discrete budget allocationswhose sole or at least primary purpose is environmental management. Data limitations prevented it fromincluding other types of public expenditures that generate environmental benefits.
The paper analyzes environmental expenditures during the second half of the 1 990s, payingparticular attention to shifts that occurred after the onset of the economic crisis. It mainly analyzesexpenditures in the development (investment) budget. The analysis of the development budget drew upona complete list of individual development projects in the national budget for each fiscal year duringFY94/95-FY98/99, provided by the Ministry of Finance.
The analysis points toward two broad conclusions. The first is that public expenditures onenvironmental management and protection in Indonesia are extremely low compared to levels in otherAsian countries and have fallen further behind. This is true whether the expenditures are expressed in percapita terms, as a percentage of GDP, or as a percentage of the government budget. Environmentalexpenditures declined during the economic crisis in Indonesia more than in other countries affected by thecrisis, and more than GDP and overall government expenditure fell in Indonesia. The cuts fell moreheavily on environmental units in line agencies than on core environmental agencies. This reversed thelimited progress that had been made toward integrating environmental management principles into theactivities of production-oriented agencies (i.e., mainstreaming). In view of the major increases inpressure on Indonesia's natural resources that have occurred since the early 1990s, additional funding, notless, is needed.
The second conclusion is that the economic crisis prompted reductions in enviromnentalexpenditures at regional levels as deep, or deeper, than the cuts in the national budget. Consequently, theshare of environmental expenditures allocated to the regions decreased. In view of Indonesia's far-reaching decentralization reforms, which began in late 1997, the regional share needs to increase, notdecrease. Regional government officials and civil society, who are about to assume increased authorityand responsibility for natural resources management for the first time, need to be aware of theimplications of environmental expenditure trends for their jurisdictions. The extent to which futureregional budgets include environmental expenditures conmnensurate with increasing pressures on theresource base will be a critical indicator of regional political will to support adequate environmentalsafeguards. Central budget support for a substantial share of the environmental and sustainable naturalresources management activities conducted at the regional level will surely continue to be essential.

Section 1: Introduction
1. Introduction
The economic rationale for public expenditure is particularly strong in the case of enviromnentalmanagement. Unfettered markets tend to undersupply public goods, which include many forms ofenvironmental quality, and to oversupply goods whose production or consumption causes negativeexternalities, including environmental damage that hurts other sectors. These reasons justify governmentactions, and government expenditure, to ensure the provision of environmental public goods and to reducenegative environmental extemalities (see Box l).
Despite this strong rationale, an environmental analysis is not a routine feature of publicexpenditure reviews by the World Bank or other development organizations. This paper represents aninitial step toward an environmental analysis of the govermnent budget in the Republic of Indonesia. Itexamines mainly the expenditure side of the budget. It tracks trends in public expenditures onenvironmental management, and it identifies shifts in priorities relative to expenditures on othergovemment activities. It focuses on the second half of the 1990s, paying particular attention to shifts inexpenditure that occurred after the onset of the economic crisis.
The paper mainly analyzes expenditures in the development (investment) budget. Data limitationsconstrained the analysis of routine (operating) expenditures. The analysis of the development budgetdrew upon detailed data from the Ministry of Finance (MoF), which provided a complete list of individualdevelopment projects in the national budget (APBN) for each fiscal year' during the five-year periodFY94/95-FY98/99. The number of projects ranged from 3,736 to 4,795 per year. For each project, theMoF also provided information on authorized investment amounts as of May 31, 1999 (Daftar IsianProjek, DIP). These amounts were the most up-to-date information on actual (vs. planned) expenditureson development projects that was available at the time of the analysis.2 The detailed nature of the datafacilitated the identification of projects with environmental objectives and the aggregation of expenditureson them in different ways.
The paper's objective is to provide baseline information on trends and patterns in environmentalexpenditures, not to assess the cost-effectiveness of the expenditures or the net benefits they generate.Nevertheless, the paper should provide a useful reference point for current and future debates aboutproposed environmental expenditure levels in Indonesia.
The paper is organized in four chapters. The rest of this chapter provides an overview of thestructure of the Indonesian government budget and presents a three-way classification scheme for publicenvironmental expenditures in Indonesia. The three classes are core, mitigating, and incidentalenvironmental expenditures. For reasons given below, the estimates presented in this paper concern justthe first class. Chapter 2 presents information on trends in environmental expenditures in the nationalbudget. It includes comparisons to other components of the Indonesian budget, to macroeconomicvariables (e.g., GDP), and to environmental expenditures in other Asian countries that were affected bythe economic crisis. Chapter 3 presents information on environmental expenditures at the regional(provincial and district/municipal) levels. It attempts to relate the pattern of expenditures acrossprovinces to provincial characteristics like population, protected area, and average income. Chapter 4concludes the report by summarizing the main findings.
i The Indonesian fiscal year is from April I to March 31.2 The amounts for FY98/99 are preliminary estimates.

2 Sectionl: Introduction
Box 1. Environmental Management and Public Finance
Public goods. Public goods are typically defined as having two characteristics (Randall 1987): use of thegood by a given person does not reduce the amount available for others (nonrivalry), and restricting use to a givengroup of users (e.g., only those who pay a price) is difficult or impossible (nonexclusiveness). The health benefits ofclean air and the existence and option values of biodiversity are prime examples of environmental public goods.These characteristics make the creation of private mnarkets for public goods difficult. Even if markets could becreated, they would tend to undersupply the goods. Hence, some degree of public provision is necessary.
Externalities. Externalities provide a second rationale for public expenditure on environmental management.Externalities refer to missing markets: one party's production or consumption decisions affect another's well-being,but these effects are not accomnpanied by payments from one party to the other. Consequently, too many negativeexternalities occur, and too few positive ones. Prime examnples of environmental externalities include soil erosioncaused by the logging of upland forests, which degrades water quality downstream, and the destruction of spawningand feeding grounds when mangroves are converted, which reduces stocks of fish and other marine organisms.
As long as environmental externalities do not have strong public good features, they can, in theory anyway,be corrected by extending property rights to include environmental resources. Then, the resource owner can set alevel of environmental quality that is economically justified on the basis of payments received for the environmentalservices provided. But this approach is often not practically or politically possible. Instead, governments typicallyaddress environmental externalities by regulating private activities and including mitigating actions or compensationschemes in public projects.
Userfees, royalties, and charges. Financing environmental management from general tax revenues is themost appropriate option when the public good characteristics of environmental quality are strong. When this is notthe case-in particular, when the beneficiaries of environmental services form a reasonably well-defined group andthe costs of providing the services rise with the number of beneficiaries-then management activities can instead bepartially or fully fnanced by user fees. User fees cover the incremental (marginal) costs of supplying additionalbeneficiaries. User fees for water supply, recreational use of public parks, and, to a lesser degree, sanitation services(because the public good element is stronger) can generate the funds needed to cover supply costs withoutintroducing major distortions.3
User fees can also be levied on government-owned stocks of commercially valuable natural resources likeoil, gas, hard minerals, timber, and fish. In this case, they cover the marginal depletion costs that result fromextracting or harvesting the resources. Typically termed royalties, they stand in for the resource rental prices thatmarkets would determine if the resources were privately owned.
Most countries have traditionally funded regulatory programs and environmental components of publicprojects from general tax revenues. An increasingly popular alternative is to apply the "polluter pays principle" bylevying direct or indirect charges ("Pigovian taxes") on enviromnentally damaging activities. These chargesgenerate funds while simultaneously discouraging environmental damage. They make the marginal environmentalcosts of economic activities explicit. Like royalties on government-owned natural resources, they stand in formissing market prices, in this case the price of environmental damage.
Subsidies. Expenditure-demanding subsidies that worsen environmental externalities are more common inmost countries' budgets than are revenue-raising charges that reduce externalities. Prime examples include energysubsidies, which promote excessive use of coal and other fossil fuels that lead to air pollution, and subsidies onagrochemicals, whose overuse contaminates surface water and groundwater supplies. Reducing such subsidies istypically the least costly first step toward addressing environmental externalities.
3 User fees create inefficiencies in the case of pure public goods, because the marginal cost of supplying additional users is zero(nonrivalry).

Section 1: Introduction 3
Structure of the Indonesian Government Budget
Routine and development budgets. The MoF follows international practice in reporting publicexpenditures according to two budgets, routine and development. The routine budget nominally refers tooperating expenditures by government agencies, while the development budget refers to expenditures onpublic investment projects.
The distinction between the two budgets is not clear or consistent in Indonesia. Specifically, thereis much mingling of operating expenditures between the two. The main reason is that most agencies areunderfunded for operations, and they tap development funds to make up the shortfall. The Bureau ofEnvironment and Technology in the Ministry of Mining and Energy illustrates this practice in the case ofenvironmental management. The Bureau reviews environmental assessments of proposed mining projectsand evaluates environmental aspects of mining license applications. These are regular functions thatinvolve mainly staff time and travel. Logically, they should be funded under the routine budget. Instead,they are funded under the development budget. This blurring of the two budgets implies that changes inthe development budget can have short-run as well as long-run impacts on environmental management.
Budget sectors. The MoF classifies expenditures in both budgets into twenty budget sectors.These sectors refer to functional categories, like defense and education. The sector that nominallypertains to environmental management is Sector 10, "Environment and Spatial Planming." As the analysisin this paper will demonstrate, however, not all expenditures in this sector are "enviromnental." Theanalysis will also demonstrate that a substantial amount of environmental expenditures occur in sectorswhose primary functions are nonenvironmental, especially Sector 14, "Housing and Human Settlements,"and Sector 16, "Science and Technology."
Environmental management is often considered a social issue. The Indonesian budget containsthree explicit social sectors: Sector 11, "Education, Culture, Belief in Almighty God, Youth, and Sports";Sector 12, "Population"; and Sector 13, "Social Welfare, Health, Role of Women, Children, andAdolescents." The analysis of the national budget includes a comparison of environmental expendituresto expenditures in these sectors.
Funding sources for the development budget. The MoF further disaggregates developmentexpenditures in each sector according to the source of funding: own resources (rupiah financing), whichrefer to funds from domestic sources like general tax revenue; andforeign resources, which includegrants and loans from bilateral and multilateral development organizations. The data on individualdevelopment projects provided by the MoF included information only on expenditures of own resources.Hence, aggregate estimates generated by summing these data understate the actual level of environmentalexpenditures in the development budget, which also includes expenditures of foreign resources.
National and regional budgets. Much of the expenditure in the national budget supports projectsand programs at the regional level, not activities at the center (pusat). The regional level refers to bothprovincial governments (Tingkat I) and district/municipal governments (Tingkat IT). For example, theroutine budget includes transfers to the regions for personnel in provincial and district offices of centralgovernment agencies.
The analysis of regional environmental expenditures in this paper covers only the expenditure ofown resources in the development budget. In the national budget (APBN), own resources are allocatedmainly between two aggregate expenditure categories: allocations to govermnent departments andinstitutions, and transfers to regions (Instruksi Presiden, or INPRES). The first category includesexpenditures at all govemment levels, regional as well as central, while the second includes only regionalexpenditures. Local contributions (pendapatan asli daerah) from the regional budget (APBD) sometimes

4 Sectionl: Introduction
supplement the allocations in the national budget. This paper presents two types of data on regionalenvironmental expenditures: data on environmental projects in Sector 10 in the regional developmentbudget, and data on enviromnental INPRES programs in the national development budget.
Classification of Public Environmental Expenditures
Constructing a practical definition of "environmental expenditure" is an essential first step inconducting a public environmental expenditure review. Environmental programs and projects occur inmany ministries and departments. The line items labeled "environment" in most countries' budgets,which typically include only expenditures by the one or two agencies exclusively dedicated toenvironmental management (such as a Ministry of Environment), tell only part of the story. Both coreenvironmental agencies and line agencies make environmental expenditures, and the definition mustreflect this. The definition must be applicable across agencies and should include a range ofenvironmental objectives and a variety of environmental management roles. In terms of objectives, anenvironmental expenditure might have as its main intention the generation of environmental benefits orthe prevention of environmental damage, or it might be an add-on-an incremental expenditure intendedto mitigate the environmental impacts of a project that otherwise does not have environmental objectives.In terms of roles, a line agency might be purely reactive, merely following (or failing to follow)environmental regulations, or it might take a more active self-regulatory stance.
These considerations and the characteristics of available budget data in Indonesia point toward athree-part definition of environmental expenditures: core expenditures, which are the focus of the analysisin this paper, and two other categories, mitigating and incidental expenditures.
Core environmental expenditures. Core enviroiunental expenditures refer to discrete budgetallocations whose sole, or at least primary, puTpose is either to provide environmental public goods or toaddress adverse environmental impacts (i.e., negative externalities). They include:
* routine expenditures by agencies that exist solely for environmental management;
* routine expenditures by environmental units in line agencies;
* routine expenditures on conservation, protection, and rehabilitation units in natural resourcemanagement agencies (but not units that primarily support resource production);
* development expenditures on projects and programs that are totally or primarily for environmentalmanagement.
Examples of core environmental expenditures by core environmental agencies and environmentalunits in line agencies in Indonesia include monitoring, analyzing, and disseminating information onenvironmental quality and pollution sources (inventarisasi, pemantauan, pemanfaatan data, pemetaan,penyusunan neraca sumberdaya); setting environmental standards (baku mutu); enforcing environmentalstandards; reviewing and overseeing AMDAL; and institutional strengthening and capacity-building ofstaff responsible for environmental activities. Examples of core environrnental expenditures by naturalresource management agencies include budgets for national parks and protection forests; budgets forintegrated conservation-development projects and social forestry projects; and expenditures onreforestation. Examples of other projects and programs under this definition include government-sponsored industrial pollution control programs and sewerage and sanitation projects.
The detailed DIP data from MoF enabled us to identify projects within each budget sector whoseobjectives were explicitly environmental and to construct aggregate core environmental expenditureestimates for each sector. These estimates provide the basis for most of the analysis in the paper.

Section 1: Introduction 5
Mitigating environmental expenditures. Mitigating envirom-nental expenditures support activitiesthat prevent or mitigate the negative environmental externalities of nonenviromnental developmentprojects that potentially deplete natural resources or generate pollution. They represent the differencebetween least-cost expenditures to achieve a project's primary objective-for example, to build a powerplant or a road-and the full cost of achieving this objective while ensuring the sustainability of theaffected resources: building a power plant with appropriate pollution control equipment, or building aroad with proper drainage.
Examples of mitigating expenditures include:
* expenditures on pollution control equipment included in power plant construction;* expenditures on protection of upstream water sources in irrigation projects;
* expenditures on environmental assessment preparation and implementation in highwayconstruction projects and logging concessions managed by state-owned enterprises;
* expenditures on drainage systems and borrow pit management to control erosion and otherenvironmental impacts associated with road construction.
Although mitigating expenditures are included in development projects' budgets, they are usuallynot identified separately in MoF data for individual projects. Quantifying the portion of projectexpenditures that goes beyond least cost and addresses externalities is therefore difficult in practice. Forexample, although expenditures on pollution control appear to be relatively uniform across powergeneration projects in Indonesia-experts estimate 3% of total investment-water resource projects aremuch more diverse. Environmental safeguards are by and large integrated into earth moving,construction of work roads, and erosion and noise control, but construction of reservoirs, irrigation canals,and flood control structures is typically guided solely by least-cost considerations. Upstream measures,like check dams and bank reinforcement, are sometimes implemented to reduce reservoir siltation, butfew if any measures are implemented to protect water quality in irrigation schemes. Experts estimate thatmitigating expenditures account for 10% of the cost of swamp development projects and 5% of the cost ofirrigation projects, water resource management projects, and flood control projects in Indonesia.Mitigating expenditures are typically absent from the budgets of groundwater development projects.
For mining projects in Indonesia, experts estimate that pollution abatement during the developmentand operating stages of mines and environmentally satisfactory reclamation following mine closure wouldtypically cost less than 1% of production (not investment) value. State-owned coal mines in Indonesiagenerally do not make these expenditures, however (McMahon et al. 2001). Estimates of mitigatingexpenditures are not available for any of the six main types of roadprojects in Indonesia (planning roadnetworks and bridges, road and bridge construction, road and bridge maintenance/rehabilitation, roadimprovement and bridge replacement, planming and technical monitoring of road improvement,emergency actions on roads and bridges).
In view of the lack of direct data, this paper does not estimate mitigating expenditures.
Incidental environmental expenditures. Like mitigating expenditures, incidental environmentalexpenditures also pertain to nonenvironmental development projects. The difference is that these projectsprovide environmental benefits-positive environmental extemalities-despite their being undertaken fornonenvironmental reasons.
Examples of incidental expenditures include:
* water supply projects, which reduce exposure to contaminants in traditional water sources, inaddition to providing other social benefits;

6 Section:l. Introduction
* traffic management projects, which reduce not only congestion but also mobile source pollution;
* industrial energy efficiency projects, which reduce stationary source air pollution, in addition toreducing production costs;
* projects that promote the use of recycled scrap in manufacturing processes, which reduce bothdepletion of natural resources and costs of production.
Expenditures on such projects do not divide as neatly into environmental and nonenvironmentalportions as do expenditures on projects with mitigating activities. In theory, the purely environmentalportion could be estimated by calculating the cost of the least-cost alternative means of providing just theenviromnental benefits of the projects. This amount would probably, but not necessarily, be less thantotal expenditure on the projects. Another complication is that the same project can potentially involveboth mitigating and incidental expenditures. An example would be a water supply project with a pipelinesufficiently long to require an ANDAL.
Due to these estimation difficulties, this paper does not estimate incidental expenditures.

Section 2: Core Environmental Expenditures in the National Budget 7
2. Core Environmental Expenditures in the National Budget
Expenditures in Sector 10, "Environment and Spatial Planning"
Core environmental expenditure vs. total expenditure Figure 1 compares the sum of routine anddevelopment expenditures on all activities in Sector 10 to core environmental expenditures in the sector.The estimates of development expenditures include expenditures of own resources only. To facilitatecomparisons over time, the data are in inflation-adjusted terms (constant 1993/94 prices), calculated usingthe Indonesian GDP deflator. Unless otherwise noted, data in all subsequent figures and tables will alsobe in constant 1993/94 rupiah.
Core environmental expenditures were about only a fifth of total expenditures on all activities inthe sector in most years. Hence, official statistics on total routine and development expenditures in Sector10 greatly exaggerate core environmental expenditures in the sector. The data underlying the figureindicate that core environmental expenditures were a minority of own development expenditures in everyyear, ranging from about a sixth in FY97/98 to a high of a third in FY95/96 and FY98/99. Thediscrepancy between core environmental expenditures and total expenditures was even greater for thesector's routine budget. Sector 10 includes core environmental agencies like the Ministry of Environment(MLH) and the Environmental Impact Management Agency (BAPEDAL). These agencies' share of totalroutine expenditures in the sector was less than 5 percent in all years.
Figure 1 also shows that core environmental expenditures in Sector 1O rose through FY96/97 butdeclined sharply, by more than half, in FY97/98. Total expenditures did not fall nearly as much.Although this suggests that the government was more prone to cut environmental expenditures than otherexpenditures, the former fell much less than the latter did in the subsequent year, FY98/99. Due to thedeclines in these two years, core enviromnental expenditures in FY98/99 were only three-fifths of theamount in FY94/95.
E,romente1 wepiwronaedafter f97/98 in Sweor I a
M.o1 "..p ea Swo, 10 - -, e-i-re,a nlgur 2. Care environniertai explibtre in Sector 10 of the national budget
Fig re1. Sum *f devdap.neot expenditure (o.e reborrees) ad routine ependit.reis Sector io ot t ie nationaI bud. d
o4, , , , 1 94d95 9s1i 96157 97/91 99/999X095 95/96 96-97 97/S 98/9
Components of core environmental expenditure. Figure 2 shows that the decrease in coreenvironmental expenditures in Sector 1O was due to cuts in both the routine budget and, especially, thedevelopment budget. The former fell by nearly a quarter and the latter by nearly three-fifths betweenFY96/97 and FY98/99. The relatively smaller cut in the routine budget is not surprising: this part of thebudget includes civil servant salaries, which are politically more difficult to cut than project expenditures.

8 Section 2: Core Environmental Expenditures in the National Budget
As noted, Figures 1 and 2 exclude development expenditures funded by foreign resources. TheMoF DIP data included infornation on expenditures of foreign resources for just one year, FY95/96. Inthat year, foreign resources were about two-thirds as large as domestic resources as a source of fundingfor core environmental projects in Sector 10. This share was identical to that for all projects in the sector.Due to the lack of information for other years, the possibility that increased foreign resources might haveoffset some of the drop in expenditure of own resources on environmental development projects inFY97/98 and FY98/99 cannot be assessed here.
Expenditures Across Sectors
Environmental expenditures in the routine budget. Sector 10 is not the only sector with coreenvironmental expenditures in its routine budget. For example, Sector 7, "Mining and Energy," includesthe Ministry of Mining and Energy, whose Mining Inspectorate conducts environmental inspections oflarge mines.4 Sector 1, "Industry," includes the Ministry of Industry and Trade, whose Industrial Zoneand Environlent Division reviews ANDALs and handles other envirom-nental matters. Table 1 showsexpenditures on core environmental activities in the routine budgets of these two units. For comparison,it also shows the routine budget for environmental agencies in Sector 10, from Figure 2.
Table 1. Expenditures on environmental activities in the routine budgets of theMining Inspectorate (Ministry of Mining and Energy) and Industrial Zone and
Environment Division (Ministry of Industry and Trade)All amounts are in million rupiah, at constant 1993/94 prices
Mining Inspectorate Industrial Zone Environmental agencies,Fiscalyear Mining Inspectorate and Environment Division Sector 10(planned expenditure) (planned expenditure) (actual expenditure)
1994/95 457 858 3,3301995/96 364 666 3,6301996/97 415 704 5,4061997/98 271 606 4,6301998/99 56 163 4,167
Sources: Ministry of Mining and Energy, Ministry of Industry and Trade.
Both environmental units in the two nonenvironmental ministries suffered much greater budgetcuts during the economic crisis than did the environmental agencies in Sector 10. Not surprisingly,sources in both units report that the cuts severely constrained their ability to perform their duties. Sourcesin the Mining Inspectorate report that, under ideal circumstances, they would have adequate resources tosend two-person teams twice a year to conduct extended field inspections of each of the 50 large minesthat are operating under ANDALs (detailed Environmental Impact Assessments). They would also havesufficient funds for some staff training, equipment purchase, and staff involvement in environmentalremediation. In FY99/00, this level of activity would have required about Rp. 435 million in constant1993/94 prices-nearly ten times the planned routine budget in that year. In the case of the IndustrialZone and Environment Division, the amount of funds for ANDAL review fell from nearly Rp. 2 millionper ANDAL in FY97/98 to less than Rp. 0.5 million in FY98/99 (both figures are in constant 1993/94pnces).S
4 Small mines are inspected by the kanwils (regional branch offices of line rministries).5 These estimnates are based on infornation in Table 19 of an unpublished report by Jorge Garcia-Garcia, "Indonesia EnvironmentExpenditure" (East Asia Environment and Social Development Unit, World Bank, Washington, D.C., 1999).

Section 2: Core Environmental Expenditures in the National Budget 9
The level of environmental expenditures by line agencies is probably a good indicator of the extentto which those agencies have "mainstreamed" environmental management. "Mainstreaming" means thatline agencies assume increasing responsibility for managing the potential environmental consequences(externalities) of activities in their sectors. Initially, core environmental agencies like those in Sector 10would be expected to make most or all of the expenditures on "pure" environmental managementactivities like environmental assessment, monitoring, and enforcement. With mainstreaming,environmental units in line agencies begin implementing these activities and consequently increase theirenvironmental expenditures.
The evidence in Table 1 that line agencies cut environmental management activities more deeplyduring the economic crisis than did core environmental agencies signals a sharp retreat frommainstreaming.
Environmental expenditures in the development budget. Unfortunately, routine budget data arenot available for environmental units in other line agencies. An analysis of core enviroiunentalexpenditures throughout the national budget must therefore rely on the MoF data on individualdevelopment projects. Although these data exclude routine expenditures, they probably provide areasonably accurate picture of trends in total expenditure of own resources on environmental activities,for two reasons. First, experts familiar with environmental management in Indonesia report that theroutine budgets of environmental units in line agencies are typically relatively small comnpared to theroutine budgets for core environmental agencies in Sector 10. The data in Table 1 are consistent with thisimpression. Second, as discussed in Chapter 1, low routine budgets have induced many agencies to shiftactivities that would ordinarily be considered routine-civil service salaries, O&M, etc.-into thedevelopment budget. This situation is not unique to environmental management, but it appears to beespecially prevalent there. Hence, putative development expenditures actually include a significantportion of expenditures on routine activities.
Figure 3 shows the sum of expenditure of own resources on core environmental projects in allsectors in the development budget, not just Sector 1 0. In addition to the sum across all sectors, the figureshows subtotals for three sectors: Sector 10 (the same amounts as in Figure 2); Sector 14, "Housing andHuman Settlements"; and Sector 16, "Science and Technology."
Much environmental ependiture occurs outside Sector 10, and it loo fell after FY97/98
Figure 3. Core environmental expenditure across sectorsin the ntional development budget (own resources)
350-
2S*tector lo
2 150- 4 l B . - - ts S eA.=;Ia150 . y 1
94ns 9s96 96197 97/98 9V/99
Fisca yea

10 Section 2: Core Environmental Expenditures in the National Budget
The sum rose strongly through FY97/98: core environmental expenditures in the nationaldevelopment budget rose, even during the first year of the economic crisis. The increase in FY97/98 wasentirely due to a huge increase in Sector 14, however. This increase reflected expenditure on theEnvironmental Program for Settlements (Penataan Lingkungan Permukiman, or PLP), which funds thedevelopment of wastewater treatment plants and solid waste management facilities. Without thisprogram, the sum in FY97/98 would have been lower than in FY96/97 and scarcely larger than inFY94/95. Between FY97/98 and FY98/99, the sum fell by more than 80 percent. Core environmentalexpenditures across sectors in FY98/99 were only about a third of the amount in FY94/95.
Collectively, the three sectors accounted for 85-98 percent of the sum in each year. Sector 10 hadthe highest expenditure during FY94/95 and FY95/96, but it was overtaken by Sector 16 in FY96/97 andby Sector 14 as well in FY97/98. Although this shift might appear to be consistent with mainstreaming,the ranking in FY97/98 was determined mainly by the combination of the sharp cut in expenditures inSector 10 and the large allocation for the PLP in Sector 14. In FY98/99, the ranking reverted to the sameas in FY94/95, with substantially lower expenditure levels in each sector, especially Sectors 14 and 16.As with the routine budget, there is thus evidence of a reversal in mainstreaming in the developmentbudget.
Comparison to Trends in Other Budget Items
Comparison to social sector expenditures. Figure 4 compares the trend in the sum of coreenvironmental expenditures from Figure 3 to the corresponding trends for the three main social sectors:Sector 11, "Education, Culture, Belief in Almighty God, Youth, and Sports"; Sector 12, "Population";and Sector 13, "Social Welfare, Health, Role of Women, Children, and Adolescents." To facilitatecomparisons, the expenditure data have been rescaled to equal 1 in FY94195. Hence, a value of say 0.40in FY98/99 indicates that expenditure in that year was only 40 percent of the level in FY94/95.
Expenditure declined morefor en viron,n ental projects than for most social projects.
Figure 4. Core environmental expenditure compared to expenditure in social sectorsin the national development budget (own resourcea)
2.50 44
2.00
21.50 Yg
e1.00
0 so
9495 9ff9 96M> 97i9S NMU5
FkS year
T'hrough FY97/98, and thanks in large part to the unusually large allocation for the PLP, coreenvironmental expenditures actually grew more rapidly than expenditures in the social sectors. hIn

Section 2: Core Environmental Expenditures in the National Budget 11
FY98/99, however, only Sector 12 suffered as deep a cut. Expenditures on health and education projectsdecreased, but not nearly as much. In sum, core environmental expenditures tended to be cut more deeplythan expenditures on social projects.
Comparison to expenditures on subsidies. Both the routine and development budgets includesubsidies that promote excessive use of inputs associated with environmental pollution. The routinebudget includes petroleum and electricity subsidies, while the development budget includes fertilizersubsidies for farmers and gas price subsidies for the fertilizer industry. Figure 5 shows that the totalamount of these subsidies was smaller than the sum of core environmental expenditures (again, fromFigure 3) in FY94/95 and FY95/96. After FY95/96, however, subsidies grew rapidly, especially ones onpetroleum and other energy products. The petroleum subsidy increased six-fold (in constant prices) inFY97/98 and by more than half in FY98/99. Substantial electricity and gas subsidies were alsointroduced in FY98/99. Subsidies were more than 100 times as large as core environmental expendituresin that year. The govemment spent much more on subsidies that potentially damage the environment thanon activities that protect it.
Under pressure from the IMF, in early 1998 the government agreed to reduce subsidies onpetroleum products and to increase prices for premium gasoline, industrial diesel, and kerosene by 71, 39,and 25 percent, respectively. Strong public reaction forced the government to reverse this decision withinone week. Later in 1998, the World Bank again highlighted the "vast increase" in subsidies andreconmmended reducing the subsidies as quickly as possible for reasons of efficiency, and in some cases,equity (e.g., relatively well-off urban consumers benefit most from energy subsidies) (World Bank 1998).By encouraging more efficient use of polluting inputs and the adoption of cleaner production practicesand technologies, such reductions would also provide environmental benefits. So far, however, thegovernment has not made any final decision on the future role and amount of fuel subsidies.
En-ronmensaly damaging subsdies now dw,afen-,ronmental expendauriue as do e e-basd revenues
Flgure 5 Core environmental expenditure In the natioal developnenl budget (own resources) Fipre 6. Core environmetal eape.distr in the national developmn.t budget (own resourese)cmpared to environmentally damaging subsdies (FY9tv9) mesad to resoore.baed -ea. (FY99/00)
14500~~~~~~~~~~~~~~~~~~~~~~~~~~~~~~1,O
Into~~~~~~~~~~~~~~~~~~~~1A
10,OOO-000 AII. L,
6.0oo =r , t- --
1c-v040 c- 09 06/07 91/00 0./..0.
Comparison to natural resouarce revenues. As is well known, natural resources generate asubstantial portion of Indonesian government revenue, with oil being especially important. Figure 6shows that resource-based revenues in FY99/00 were enormous compared to the sum of coreenvironmental expenditures in FY98/99. Core environmental expenditures were equivalent to less than Ipercent of total resource-based revenues, and less than 20 percent of revenues from just logging andmining. Expenditures on environmental management in Indonesia were thus a small fraction of therevenues generated by the natural environment.

12 Section 2: Core Environmental Expenditures in the National Budget
The earmarking of resource-based revenue for only natural resource management andenvironmental protection would clearly be inappropriate. Efficient budgeting requires spending revenueson the activities that generate the highest retums, and those activities might occur in sectors other than theones that generate the revenues. Yet, some reinvestment is just as obviously needed to ensure thesustainability of natural resources and the benefits they provide, including future streams of revenue.
Revenues from environmental resources other than commercial natural resources are small inIndonesia. Despite high levels of air and water pollution in Jakarta and other urban centers, Indonesia hasmade less progress than neighboring countries like Malaysia, the Philippines, and China in introducingpollution charges (Asian Development Bank 1997). The government has, however, endorsed, and to alimited extent implemented, policies to increase user fees for water supply (see Box 2).
Box 2. User Fees in the Water Sector
River basin management. River basin authorities in a few regions charge a wide range of users for the abstraction ofraw water from surface sources. The table below shows charge rates for the two main river basin authorities on Java:Perum Jasa Tirta in East Java, and Perum Otorita Jatiluhur in West Java. In both cases, all institutional users arecurrently charged except irrigation schemes, and charge rates have risen over time. Despite these increases, charges arenot sufficiently high to cover the full costs of river basin management.
River Basin AuthorityPerum Otorita Jatiluhur Perum Jasa Tirta
1991 16 rupiah/mWater supply: 1997-99 Pam Jaya: 35 rupiah/m33
PDAM Other PDAM: 23 rupiah/m3 1998 35 rupiah/m3
2000-03 Pam Jaya: 65 rupiahlm3
Other PDAM: 48 rupiah/m&
Water supply: 1997-99 23 rupiah/m3 1998 52 rupiah/m3
industry 2000-03 48 rupiah/m3 -
Imgation Currenta 0 rupiah/m3 Currentb 0 rupiab/m3
Hydropower 1991 2.6 rupiah/m3 1991 6.0 rupiah/m3
1994 3.3 rupiah/m3 -
1997 7.0 rupiah/m' 1998 12.4 rupiaah/m1999 8.6 rupiah/n' -
2000 11.9 rupiah/&a Charge likely to be introduced in 4-6 years.b Charge likely to be introduced in 3-4 years.
Irrigation schemes. According to World Bank (1998), user fees cover less than 10 percent of the O&M costs ofirrigation systems in Indonesia. As a consequence of the water sector reform supported by the Water SectorAdjustment Loan Project (WATSAL), water user associations (WUAs) are being created as autonomous, legal entities.They have the authority and obligation to operate and maintain most of the irrigation system and to collect fees to beused solely for this purpose. Local governments agencies maintain the larger works only. They are increasinglyproviding matching grants to WUAs to create incentives for WUAs to generate revenues earmarked for proper O&M.
Urban water supply services. Water supply services are not fully self-financing. Government funds mainly subsidizecapital costs. PDAMs do not receive grants for routine expenditures, and they are sometimes comnpelled to payadvance "dividends" to local governments, even if they are losing money. This practice is gradually being stopped,following concerns raised by donors.
Section 2: Core Environmental Expenditures in thie National Budget 13
Comparison to Macroeconomic Trends
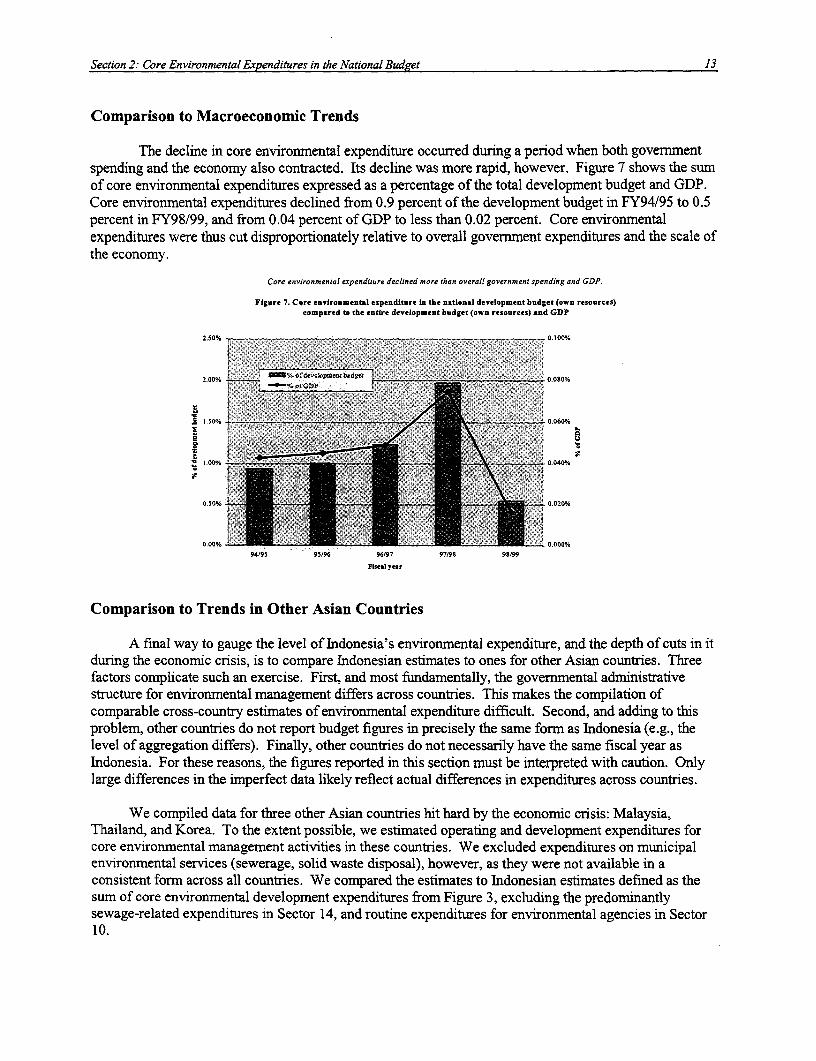
The decline in core environmental expenditure occurred during a period when both governmentspending and the economy also contracted. Its decline was more rapid, however. Figure 7 shows the sumof core environmental expenditures expressed as a percentage of the total development budget and GDP.Core environmental expenditures declined from 0.9 percent of the development budget in FY94/95 to 0.5percent in FY98/99, and from 0.04 percent of GDP to less than 0.02 percent. Core environmentalexpenditures were thus cut disproportionately relative to overall governnent expenditures and the scale ofthe economy.
Core environmental expenditure declined more than overall government spending and GDP.
Figure 7. Core environmental expenditure in the national development budget (own resources)compared to the entire development budget (own resources) and GDP
2.50% 0. I 00%.
2.00% %.-.-.._________________________________ 01080%.! -. .' ' J
2 00 n t _ 0.040%
0.5 0 %0 0.020%
0.00%94195 95196 96/97 97/90 9599
FWisal year
Comparison to Trends in Other Asian Countries
A final way to gauge the level of Indonesia's environmental expenditure, and the depth of cuts in itduring the economic crisis, is to compare Indonesian estimates to ones for other Asian countries. Threefactors complicate such an exercise. First, and most fundamentally, the governmental administrativestructure for environmental management differs across countries. This makes the compilation ofcomparable cross-country estimates of environmental expenditure difficult. Second, and adding to thisproblem, other countries do not report budget figures in precisely the same form as Indonesia (e.g., thelevel of aggregation differs). Finally, other countries do not necessarily have the same fiscal year asIndonesia. For these reasons, the figures reported in this section must be interpreted with caution. Onlylarge differences in the imperfect data likely reflect actual differences in expenditures across countries.
We compiled data for three other Asian countries hit hard by the economic crisis: Malaysia,Thailand, and Korea. To the extent possible, we estimated operating and development expenditures forcore environmental management activities in these countries. We excluded expenditures on municipalenvironmental services (sewerage, solid waste disposal), however, as they were not available in aconsistent form across all countries. We compared the estimates to Indonesian estimates defined as thesum of core environmental development expenditures from Figure 3, excluding the predominantlysewage-related expenditures in Sector 14, and routine expenditures for environmental agencies in Sector10.

14 Section 2: Core Environmental Expenditures in the National Budget
Environmental expenditure in Malaysia was defined as the sum of operating and developmentexpenditures by the Department of Environment (DOE) in the Ministry of Science, Technology, andEnvironment, as reported in the Department's annual Environmental Quality Reports. Based on datafrom earlier years, we estimate that the inclusion of expenditures by other core enviromnental agencies, inparticular the Department of Wildlife and National Parks, would approximately double the reportedamounts for the DOE. For Thailand, environmental expenditure also referred to expenditure within theMinistry of Science, Technology, and Environment. The estimates were compiled by the World Bankfrom information provided by the Ministry of Finance (see Bapna et al. 1999), and they includedexpenditures in four broad program areas, "Environment quality control," "Pollution control," "Naturalresources management" (but excluding production-oriented programs, which are in the Ministry ofAgriculture), and "Enviromnental research projects." For Korea, environmental expenditure included theitems labeled "Environmental management & misc.," "Air quality," "Nature conservation," and"Environmental policy development and R&D" (see Table 27 of Lee et al. 2000). It included operatingand development expenditures, excluding ones on the items labeled "Tap water/sewage treatment" and"Waste treatment."
We compiled data for two years, 1997 and 1998. Fiscal years are identical to calendar years inKorea and Malaysia. In Thailand, however, the fiscal year is October 1-September 30. This means that" 1997" data include expenditures during the first 9 months of calendar year 1997 in the case of Thailandand the last 9 months in the case of Indonesia. Data for Thailand thus reflect earlier stages of the crisis,while data for Indonesia reflect later stages, relative to the data for Korea and Malaysia.
Table 2 shows the cross-country environ-mental expenditure estimates expressed in four ways:
* per capita expenditures in current U.S. dollars;* total expenditures as a percentage of GDP;* total expenditures as a percentage of total government expenditures (operating and development);* total expenditures in local currency at constant 1997 prices, expressed as an index (1997 =1).
In both years, expenditures were lower in Indonesia than in all three other countries in per capita terms,and lower than in Thailand and Korea relative to GDP and government expenditure. Indonesia andMalaysia were the only countries that spent less than US$1 per capita on core environmental managementactivities in both years.
Table 2. Environmental Expenditures in Asian Countries Affected by the Financial CrisisPer capita Y Total
Country Year' (current prices, % of GDP eoxpenditure (constant prices,US$) xpniue1997=1)
Indonesi 1997 $0.36 0.030% 0.163% 1.00Indonesia 1998 $0.08 0.017% 0.079% 0.47
1997 $0.67 0.015% 0.067% 1.00Malaysia 1998 $0.53 0.016% 0.070% 1.06
'Thailand 1997 $5.47 0.22% 1.19% 1.001998 $3.25 0.18% 0.98% 0.72
1997 $28.09 0.27% 1.56% 1.00Korea 1998 $19.78 0.29% 1.38% 0.99
a Defnitiorn varies across counries. See text.

Section 2: Core Environmental Expenditures in the National Budget 15
In addition to starting from a low base, Indonesia's expenditures fell more between 1997 and 1998han expenditures in any of the other three Asian countries. The relative cut in Indonesia (53%) almostdoubled that in Thailand (28%), while the cut in Korea was negligible (1%). Malaysia was the onlycountry among the four that increased the amount of environmental expenditure in inflation-adjusted localcurrency between 1997 and 1998 (by 6%).
Due to currency depreciations, per capita expenditure expressed in current U.S. dollars fell bysubstantial amounts in all countries, even Malaysia and Korea. The decrease in Indonesia was again thelargest, due to the combination of the largest reduction in expenditures and the steepest depreciation. Percapita expenditures in Indonesia were less than 10¢ in 1998.
In sum, although Indonesia was hit hardest by the crisis, it cut environmental expendituresdisproportionately compared to other Asian countries relative to the declines in its GDP and governmentbudget.
16 Section 3: Core Environmental Expenditures at the Regional Level
3. Core Environmental Expenditures at a Regional Level
This section provides information on two issues: the similarity of trends in regional environmentalexpenditures to those in the national budget, and the allocation of environmental expenditures acrossprovinces.
Trends in aggregate regional expenditures
Core environmental expenditures in the Sector 10 development budget. Several sources of dataon core environmental expenditures are available at the regional level in Indonesia. The one mostcomparable to the national data presented in Chapter 2 is expenditure of own resources on coreenviromnental projects in the regional development budget (APBD). The MoF provided such data forSector 10. The data pertain to projects at both the provincial level (Tingkat I) and the district/municipallevel (Tingkat I7). The following examples from West Java North Sumatra illustrate the types of projectsincluded in the regional development budget:
* Land Administration Improvement Program
* West Java Mangrove Development
* Inventory and Strengthening of Region 1 Forest in Medan
* Planning and Evaluation of Catchment Area Management in Ciujung
* West Java Conservation Area Development
* Ujong Kulon National Park Development.
As these examples suggest, most of the projects in Sector 10 of the regional budget pertain tomanagement of land resources, in particular forests, national parks, and other protected areas.
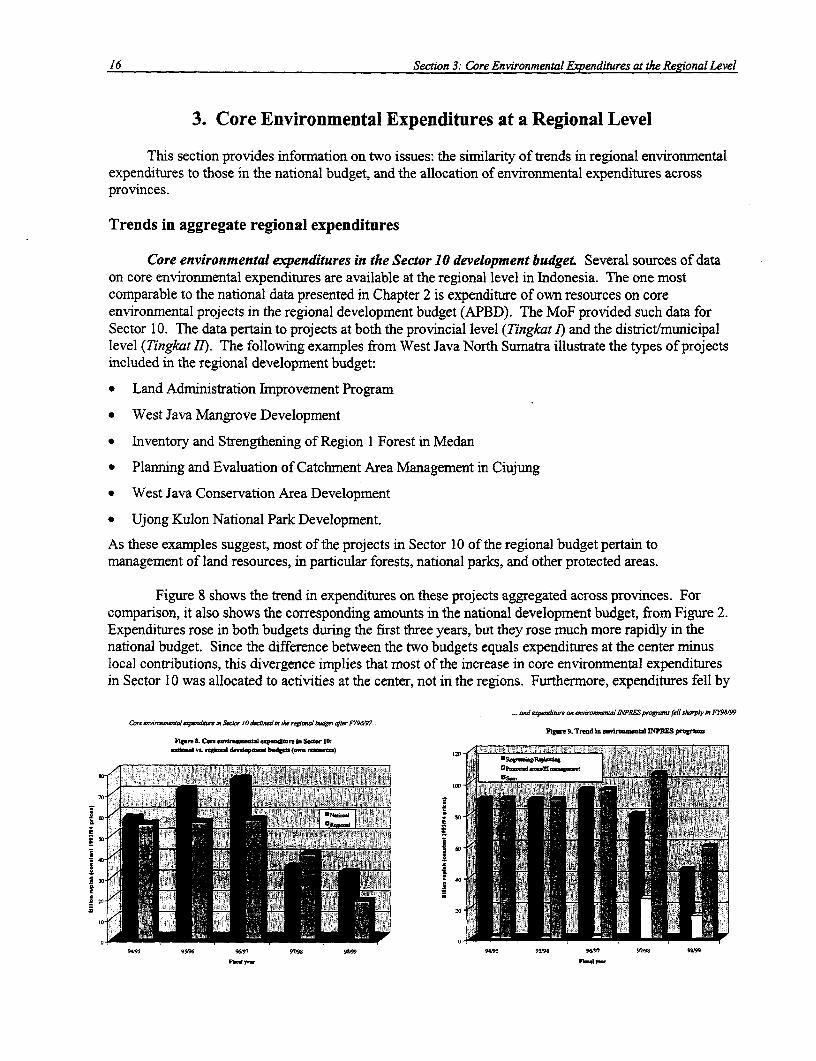
Figure 8 shows the trend in expenditures on these projects aggregated across provinces. Forcomparison, it also shows the corresponding amounts in the national development budget, from Figure 2.Expenditures rose in both budgets during the first three years, but they rose much more rapidly in thenational budget. Since the difference between the two budgets equals expenditures at the center minuslocal contributions, this divergence implies that most of the increase in core environmental expendituresin Sector 10 was allocated to activities at the center, not in the regions. Furthermore, expenditures fell by
...ad apue,ar o Iw,.NPRdESprVamsfeilshvpdyk F79&'Cor,,4,ai c.u l J a.6 O S.d.., 10*d9..d.& t mrai 6 ..J1.
}ur 9. Trend In arirna. NPtiS p.rMFit.. rCe nlim..'dweR in S. er a10:_d. vo. d-lpr bdVU (e)izo sfiEhsy AQgi- sJ'¢i'Sm0CksiiS
70' E. ~~~~~~~~~~~~~~~~~~~~~~~~~~~~~~100 2E
130
9995 996 9697 97M9 9199 9995 996 9697 9796 9199
F~ y- F. _

Section 3: Core Environmental Expenditures at the Regional Level 17
a somewhat larger amount in the regional budget (68 percent) than in the national budget (58 percent)during the final two years. Although this difference is not great, it suggests that the government made aneffort to protect the funding of central activities at the expense of regional activities during the economiccrisis.
Environmental INPRES programs. The other data sources pertain to four environmental INPRESprograms. They tell a similar story of large cuts during the crisis. The first column for each fiscal year inFigure 9 shows combined expenditures on two programs related to reforestation, the INPRES forregreening (INPRES Dati II untuk Penghijauan) and the INPRES for replanting (INPRES Dati I untukReboisasi). As the names indicate, funds under the first program are transferred directly todistricts/municipalities, while funds under the second program are administered by provinces.
These INPRES reforestation programs support activities predominantly in Sector 2, "Agricultureand forestry." Hence, they represent funding that is in addition to the regional amounts in Sector 10,shown in Figure 8. A comparison of the amounts in the two figures reveals that expenditures on theINPRES reforestation programs exceeded regional environmental expenditures in Sector 1O in every year.This illustrates again the point that much environmental expenditure occurs outside Sector 10. Like theexpenditures in Sector 10, the INPRES reforestation programs were cut especially deeply in FY98/99, bynearly half. At the regional level as well as at the national level, both core environmental agencies andenvironmental units in line agencies suffered budget cuts during the economic crisis.
The second column for each fiscal year in Figure 9 shows the sum of expenditures on the other twoenvironmental INPRES programs, the INPRES for protected areas (INPRES Dati I untuk KawasanLindung) and the INPRES for environmental impact management (INPRES Dati II untuk PengendalianDampak Lingkungan). Both programs began in FY97/98. Funds under the first program are transferredto the provinces, principally Dinas Kehutanan. Pimpro Tingkat I retains 17.8 percent for coordinationand allocates the rest to agencies at Tingkat II. Under the second program, Dati Iand II receive separatebudgets, for coordination and implementation, respectively. The program's budget for Dati Iwasunchanging in current prices, at Rp. 50 million per province in both FY97/98 and FY98/99. Its budget forDati II was much larger and varied in both current and constant terms. For these reasons, the data inFigure 9 include only the budget for Dati II in the case of the INPRES for environmental impactmanagement.
In contrast to the INPRES reforestation programs, these two environmental protection programssupport activities predominantly in Sector 10. A comparison of the expenditure on them, shown in Figure9, to the estimates of regional environmental expenditures in Sector 10, shown in Figure 8, reveals thatthey accounted for considerably more than half of the expenditures in Sector 10 in both FY97/98 andFY98/99. This suggests that local contributions toward core environmental management activities in theregions were relatively modest, especially in FY98/99. The regions were dependent on the center forfunding of core environmental activities, and they became more dependent during the economic crisis.
The final column for each fiscal year in Figure 9 shows the sum of expenditure across all fourINPRES programs. The introduction of the INPRES programs for protected areas and environmentalimpact management more than offset the cuts in the INPRES reforestation programs in FY97/98, as thesum rose to more than Rp. 1 00 million (in constant 1993/94 prices). All four programs were cut inFY98/99, however, and this caused the sum to fall by nearly half.
Variation in expenditures across provinces
As noted, the MoF provided the regional data on environmental expenditures in Sector 1O at thelevel of individual projects, and it indicated the provinces where the project's activities occurred.

18 Section 3: Core Environmental Expenditures at the Regional Level
Similarly, the MoF provided the data on the environmental INPRES programs disaggregated by province.This regional detail in the five data sources permitted an analysis of the factors that affected expenditurelevels across provinces during the five-year period.
Influence of land area, population, and per capita GDP. The fact that most of the projects andprograms funded by the regional expenditure measures pertain to land resources of one sort or anothersuggests that the level of expenditures across provinces might be related in some way to the variation inland area. It might also be influenced by population and income, which could affect the politicalimportance of provinces. Table 3 summarizes the findings of an econometric analysis that tested thesehypotheses (see Appendix I). The table expresses the impacts of the three variables on provincialexpenditures in terms of elasticities. For example, the 0.163 value in the "Area" column and the "Sector10" row means that a 1-percent higher value for provincial land area is associated with a 0.163-percenthigher level of core environmental expenditures in Sector 10.
Table 3. Impact of socioeconomic factors on provincial environmental expenditures,expressed in elasticity form. a
Measure of Socioeconomic factor benvironmental expenditure Area Population Per capita GDP
Sector 10: core envirominental 1.expenditures 0.163 0.251 0.236
INPRES: regreening 0.141* 0.565 -0.440
INPRES: replanting 0.221 0.774' -0.759"
INPRES: protected areas 0.532* -0.204 0.216
INPRES: environmental impact 0.0319 0.670' -0.107management
i.e., a 1 -percent increase in an individual factor is associated with a percentage increase in expenditure equal to the arnountgiven in the table.b Statistical significance level: 1 percent, = 5 percent, = 10 percent.
Population is the variable that most consistently had a statistically significant impact onexpenditure levels. Its impact was significant at the 5 percent level or better for all measures except theINPRES for protected areas. In all four of these cases, the impact was positive: provinces with largerpopulations received larger allocations. The relationship was less than proportional. In the case of coreenvironmental expenditures in Sector 10, a 1-percent increase in population was associated with a 0.25 1-percent increase in expenditure. At the opposite extreme, in the case of the replanting INPRES, a 1-percent increase in population was associated with a 0.774-percent increase in expenditure. Thepopulation elasticities for the other two measures lay between these two values.
Population had only a marginally significant (10-percent level) impact on the INPRES forprotected areas. Moreover, its impact was negative. This odd result probably indicates that less denselypopulated provinces tend to have larger areas of remaining natural habitat, and thus larger protected areasto be funded by the INPRES program. Consistent with this explanation, the most important variable inthe case of the INPRES for protected areas was land area. In fact, this was the only expenditure measurethat was significantly affected by land area at the 5-percent level or better.
Negative impacts also occurred for per capita GDP in the case of the INPRES programs forregreening and replanting, and they were statistically significant. In theory, this could reflect an inverse
Section 3: Core Environmental Expenditures at the Regional Level 19
relationship between per capita GDP and the relative economic importance of primary sectors: in manycountries, provinces with higher incomes tend to be ones that are more industrialized and less dependenton primary sectors like mining and logging, which generate the need for reforestation programs. InIndonesia, however, four of the five provinces with the highest per capita GDP in FY96/97 were Aceh,Irian Jaya, Kalimantan Timur, and Riau, whose economic base is highly resource-dependent.6 This resulttherefore remains somewhat of a puzzle.
In sum, provinces with larger populations tended to have higher expenditure levels according toall measures except the INPRES for protected areas. This finding might reflect the greater political cloutof more populous provinces. For the INPRES for protected areas, the most significant variable was landarea, which is perhaps not surprising: on the basis of sheer land mass, and after controlling for population,larger provinces might be expected to have larger areas under protection. The third variable, per capitaprovincial GDP, was not significantly associated with most expenditure measures. Hence, wealthierprovinces are generally not more likely to receive funds for environmental management. Indeed, resultsfor the INPRES regreening and replanting programs indicate that funds tend to be allocated to provinceswith lower per capita income.
Deviations between actual and expected expenditure levels. For the three expenditure measureswith five years of data-i.e., environmental expenditures in Sector 10, and the INPRES reforestationprograms-the regression results were also used to identify provinces with levels of environmentalexpenditures that were higher or lower than expected on the basis of their land area, population, and percapita GDP. Several provinces-Jambi, Kalimantan Barat, Riau, Timor Timur (still a province ofIndonesia during the period analyzed), and Yogyakarta-had lower-than-expected expenditure levels forall measures. A few others-Bengkulu, Sulawesi Selatan, and Sulawesi Utara-had consistently higher-than-expected expenditure levels. Especially notable were unusually high levels of certain expendituremeasures in certain provinces: in particular, Bali and Sulawesi Utara for environmental expenditures inSector 10; Nusa Tenggara Barat, Sulawesi Selatan, and Sulawesi Utara for the regreening INPRES; andDista Aceh, Kalimantan Timur, Nusa Tenggara Timur, Sulawesi Selatan, Sulawesi Utara, and SumateraBarat for the replanting INPRES.
The finding of unusually high expenditures in Bali is not surprising, given the province'simportance as an intemational tourist destination. Whether this and the other large deviations werefiscally appropriate or not is a question that cannot be answered without further analysis. In theory,expenditures should be allocated across provinces to maximize the total benefits of the activities theysupport. Although one might expect the supply of environmental goods and services to be related to area,and the demand for those goods and services to be related to population and income, the analysis is toocrude to be interpreted as revealing the efficiency of expenditure allocations across provinces. It leavesout many factors, and the deviations reflect those omitted factors.7 Nevertheless, the analysis has value inidentifying expenditure discrepancies that could be a sign of under- or overfunding.
6 The fifth was Jakarta.7For example, the high level of the replanting INPRES in Kalimantan Timur might reflect a response to the fire damage in 1997-98.

20 Section 4: Conclusions
4. Conclusions
The analysis in this paper points toward two broad conclusions. The first is that publicexpenditures on environmental management and protection in Indonesia are extremely low compared tolevels in other Asian countries, and they have fallen further behind. This is true whether the expendituresare expressed in per capita terms, as a percentage of GDP, or as a percentage of the government budget.Environmental expenditures declined during the economic crisis in Indonesia more than in other countriesaffected by the crisis, and more than GDP and overall government expenditure fell in Indonesia. The cutsfell more heavily on environmental units in line agencies than on core environmental agencies. Thisreversed the limited progress that had been made toward integrating environmental managementprinciples into the activities of production-oriented agencies (i.e., mainstreaming).
Major increases in pressure on Indonesia's natural resources have occurred since the early 1990s(World Bank 2001). Additional funding, not less, is needed to keep pace with these natural resource-related trends, as well with as urban and industrial pollution. Among other activities, expenditures arerequired to rehabilitate degraded forests, to expand replanting programs, to improve forest fire-management, to protect and manage parks better, to establish credible environmental databases, to buildtechnical capacity in government agencies, and to support public awareness programs.
The second conclusion is that the economic crisis prompted reductions in environmentalexpenditures at regional levels as deep, or deeper, than the cuts in the national budget. Consequently, theshare of environmental expenditures allocated to the regions decreased. In view of Indonesia's far-reaching decentralization reforms, which began in late 1997, the regional share needs to increase, notdecrease. Improved local environmental management will not be possible in Indonesia without increasedprovision of human and financial resources.

Bibliography 21
Bibliography
Asian Development Bank. 1997. Strategy for the Use of Market-Based Instruments in Indonesia'sEnvironmental Management. Environment Division, Asian Development Bank, Manila.
Bapna, Manish, Giovanna Dore, Ellangovan Patchamuthu, and Manida Unkulvasapaul. 1999. "Thailand:Building Partnerships for Environmental and Natural Resources Management." Mimeo. East AsiaEnvironment and Social Development Unit, World Bank, Washington, D.C.
Lee, Sang-Don, Taek-Whan Han, Young-Kul Won, Jean Aden, Giovanna Dore, and Judith Moore.2000. "Korea-The Environmental Dimension of the Crisis: A Step Back or a New WayForward?" Mimeo. East Asia Environment and Social Development Unit, World Bank,Washington, D.C.
McMahon, Gary, Elly Rasdiani Subdibjo, Jean Aden, Aziz Bouzaher, Giovanna Dore, and RamanieKunanayagam. 2000. "Mining and the Environment in Indonesia." EASES Discussion Paper. EastAsia Environment and Social Development Unit, World Bank, Washington, D.C.
Randall, Alan. 1987. Resource Economics. John Wiley & Son, New York.
World Bank. 1998. Indonesia Public Expenditure Review: The Budget, Off-Budget Items, State-OwnedEnterprises. Report No. 18691-IND. World Bank, Washington, D.C.
World Bank. 2001. Indonesia: Environment and Natural Resource Management in Time of Transition.East Asia Environment and Social Development Unit, World Bank, Washington, D.C.

22 Appendix 1: Econometric Analysis
Appendix I. Econometric Analysis of Provincial Environmental Expenditures
The econometric analysis involved regressing each of the five expenditure measures, pooled acrossprovinces and over time, on three main explanatory variables: total provincial land area (which of courseis fixed over time), total provincial population (which varies by year), and provincial GDP per capita(which we fixed at the FY96/97 level, due to incomplete data in more recent years). We had five years ofdata for three of the measures of provincial enviromnental expenditures-core environmentalexpenditures in Sector 10, the regreening INPRES, and the replanting INPRES-and two years of data forthe other two-the INPRES programs for protected areas and environmental impact management. Thenumber of observations was 135 for core environmental expenditures in Sector 10 (5 years, 27 provinces),130 for the regreening INPRES, and 105 for the replanting INPRES. The number was lower for the lattertwo measures because no expenditure occurred in a few provinces. The number of observations for thetwo newer INPRES programs was of course much less, 54 for protected areas and 48 for environmentalimpact management.
We regressed the natural logarithm of environmental expenditure, in million rupiah (constant1993/94 prices), on the following variables:
• Ipop: natural logarithm of provincial population (varied each year)
i lgdppc: natural logarithm of provincial GDP per capita (1996 value, in constant prices)
* larea: natural logarithm of total area of each province (did not vary over time)
e fy95/96, fy96/97, fy97/98, fy98/99: dunmny variables for fiscal year (only the last one for the INPRESprograms for protected areas and environmental impact management)
* -cons: an intercept.
We included the dumrnmy variables for fiscal year to control for time-related factors affecting the overalllevel of expenditure (e.g., the financial crisis). We also experimented with the inclusion of the naturallogarithm of provincial manufacturing GDP (1996 value, in constant prices), to capture differences inpollution loads across provinces, but we found that this variable was not statistically significant.
We ran the regressions using the econometrics program STATA. We used the generalized leastsquares (GLS) random-effects estimator (the xtreg command in STATA) to analyze the three expendituremeasures with five years of data, and the ordinary least squares estimator (thefit command) to analyze theother two measures. Given the short time series, we did not attempt any tests or corrections for serialcorrelation.
The elasticities in Table 3 are the coefficient estimates from these regressions. The deviationsreferred to in the last section of Chapter 3 are the random effects from the GLS regressions, converted todiscrete percentage terms. If ,A, is the random effect for province i predicted by a particular regression,then its value in discrete percentage terms is given by I 00(eM - 1) . For all three GLS regressions, thetest statistics from the Breusch-Pagan Lagrangian multiplier test for random effects rejected the nullhypothesis that the A's equaled zero (p < 0.000 1), and the test statistics from the Hausman specificationtest failed to reject the null hypothesis that the ,Ap's were uncorrelated with the explanatory variables (p =0.22-0.36).