22 september 2017 lamprell plc interim financial...
TRANSCRIPT
22 September 2017
LAMPRELL PLC ("Lamprell" and with its subsidiaries the “Group”)
INTERIM FINANCIAL RESULTS
FOR SIX MONTHS TO 30 JUNE 2017
Robust balance sheet and discipline in a challenging market
Transformational joint venture in Saudi Arabia progressing as planned
Financial highlights
Revenue of USD 159.2 million, broadly in line with our expectations
Net profit of USD 1.1 million
Strong balance sheet maintained; robust net cash position of USD 305.9 million strengthened due
to rig deliveries in 1H; moderate net cash reduction expected in 2H due to initial investment in
the Maritime Yard in Saudi Arabia and increased working capital requirements
Gross margin of 13.0% achieved in 1H 2017 due to successful close-out of three remaining
jackup rig projects and HMC Kaombo project; two major projects ongoing with delivery in 2018
Operational highlights
Total recordable incident rate (TRIR) for the period of 0.41 (31 December 2016: 0.29), safety
and quality remain management priorities
Three remaining jackup rigs delivered successfully, two to National Drilling Company (NDC)
and one to Shelf Drilling, on schedule and on budget
Buoyancy tanks for HMC Kaombo and final modules for UZ750 project all delivered and both
projects now completed
Construction phase commenced on the East Anglia One offshore windfarm project, consisting of
60 foundations
Master Marine major upgrade project in respect of the mobile operating unit "Haven" for use
offshore Norway progressing to schedule
New contract award for two land rigs for Schlumberger
As at 30 June 2017, backlog of USD 300 million (31 December 2016: USD 393 million)
Strategic and corporate highlights
John Malcolm appointed as new Non-Executive Chairman with effect from 20 September 2017
Transformational joint venture agreement signed with Saudi Aramco, Bahri and Hyundai Heavy
Industries (HHI) for major maritime yard development in Saudi Arabia and approved by
shareholders on 26 June 2017; formation activities for the joint venture company well under way
Pre-qualification process for Long Term Agreement (LTA) with Saudi Aramco ongoing
Growing profile in renewables sector following award of East Anglia One windfarm project,
resulting in new bidding opportunities
Current trading and outlook
Maintain strong balance sheet and disciplined approach in a challenging market
Strategic business review continues with a focus on bid optimisation, further operational
efficiencies and geographical and sector diversification
Revenue for FY2017 expected to be in the range of USD 370-390 million, marginally below
previous guidance due primarily to the continuing low levels of walk-in work reflecting market
conditions

FY2018 outlook remains challenging with revenue currently expected to be around 10% lower
than FY2017 levels, contingent on the timing of potential contract awards
Continued margin pressure anticipated at these revenue levels as we look to retain our core
competitive strengths and upskill our workforce to implement our strategic initiatives. Focus on
disciplined cost control unchanged.
Bid pipeline increased to USD 3.1 billion (31 December 2016: USD 2.5 billion), underpinned by
opportunities in core markets as well as new strategic initiatives in the renewables and EPC
sectors; while the increased levels of bidding activity are encouraging, we do not expect to see
revenue growth from potential contract awards until 2019.
1H 2017 FINANCIAL RESULTS
1H 2017 1H 2016
(USD million, unless stated)
Revenue 159.2 451.3
Gross margin 13.0% 6.1%
Underlying gross margin 13.0% 13.1%
EBITDA 13.5 10.0
Profit/(Loss) from continuing operations after income tax and after
exceptional items
1.1 (4.4)
Reported diluted earnings/(loss) per share (US cents) 0.30 (1.27)
Net cash as at 30 June 305.9 151.5
Christopher McDonald, Chief Executive Officer said: “The business continues to deliver solid results broadly in line with our expectations despite the
challenging market environment. Our balance sheet remains robust due to the combination of the
efficiency measures we have taken over the past two years and our tight cost control measures. This
places us in a good position to be cost competitive and maintain our discipline in bidding for new work.
Lamprell continues to be well positioned with a strong balance sheet, and our strategy is designed to
support near-term resilience and secure long-term sustainable growth.
In particular, I am delighted that we secured an unprecedented opportunity to partner with Saudi
Aramco, Bahri and Hyundai Heavy Industries to create a major new maritime yard in Saudi Arabia,
establishing a significant long-term foothold in the largest and one of the most dynamic oil and gas
markets. The project will further strengthen our position in the region and will provide exposure to
significant new opportunities in a key market for the energy industry.”
The management team will hold a presentation on 22 September at 9.30am at Holborn Bars (138-142
Holborn, London EC1 2NQ). The live webcast will be accessible on Lamprell’s website or on the
following link: http://webcasting.brrmedia.co.uk/broadcast/59a942e1d1178550cf77404b or through
conference call dial in: +44 (0)330 336 9411 (UK local), with confirmation code: 4224850.
- Ends -
Enquiries:
Lamprell plc
Christopher McDonald, Chief Executive Officer +971 (0) 4 803 9308
Tony Wright, Chief Financial Officer +971 (0) 4 803 9308
Maria Babkina, Investor Relations +44 (0) 7852 618 046
Tulchan Communications, London +44 (0) 207 353 4200
Martin Robinson
Martin Pengelley
Notes to editors Lamprell, based in the United Arab Emirates (“UAE”) and with over 40 years’ experience, is a leading
provider of fabrication, engineering and contracting services to the offshore and onshore oil & gas and
renewable energy industries. The Group has established leading market positions in the fabrication of
shallow-water drilling jackup rigs, liftboats, land rigs, and rig refurbishment projects, and it also has an
international reputation for building complex offshore and onshore process modules and fixed platforms.
Lamprell employs more than 5,000 people across multiple facilities, with its primary facilities located in
Hamriyah, Sharjah and Jebel Ali, all of which are in the UAE. In addition, the Group has facilities in
Saudi Arabia (through a joint venture agreement). Combined, the Group’s facilities cover approximately
828,000 m2 with 1.9 km of quayside.
Lamprell is listed on the London Stock Exchange (symbol “LAM”).
Chief Executive Officer’s Review
As expected, 2017 is proving to be challenging as the Company experiences a prolonged period of lower
activity levels across the industry. As a result, Group revenues in the first half of 2017 were significantly
lower than during the comparative period in the prior year. However, we are encouraged by increased
levels of bidding activity resulting from implementation of our strategic initiatives although due to the
timing of potential contract awards, we do not expect to see revenue growth from them until 2019.
Lamprell is now focused on harnessing the combined results from its recent cost control measures,
internal restructuring and strong cash management efforts to be competitive in targeting new business
opportunities in Saudi Arabia as well as in the renewables and EPC sectors.
Operational performance in 1H
The Group delivered three jackup drilling rigs in the first half of the year. We completed our largest ever
project comprising nine jackup rigs built over the course of eight years with the delivery of the “Al
Hudairiyat” and the “Al Lulu” jackup rigs to NDC in February and April respectively. We delivered the
third rig of the year in Q2 2017 to Shelf Drilling, which has been deployed alongside its previously-
constructed sister rig operating offshore Thailand. Our operational team showed great determination and
resilience to deliver all three rigs on schedule and on budget, overcoming the technical issues
experienced in 2016. In addition, the modules fabrication project for Petrofac also completed in April
2017, having delivered a total of 45 modules for use on the Upper Zakum project in Abu Dhabi.
Project completions and the slow pace of new contract awards have brought yard activities to a relatively
low level, but fabrication work has commenced on our flagship renewables contract for ScottishPower
Renewables in relation to the East Anglia One project. The major upgrade of the ‘Haven’ mobile
operating unit for Master Marine is progressing well and is on track for completion of construction works
in our Hamriyah facility later in 2017, with installation in Norway scheduled in 1H 2018.
As announced in August 2017, we reached an amicable settlement with Cameron, a subsidiary of
Schlumberger, in respect of the issues associated with their jacking equipment in 2016, which impacted
both our financial and operational performance in 2016. We are pleased to have successfully resolved
the issues. Lamprell has preserved a strong relationship with Schlumberger, which has commissioned
Lamprell to fabricate two land rigs according to the client’s ‘rig of the future’ design. This opportunity
further strengthens Lamprell’s credentials in the land rig sector.
In the first six months of 2017, our rolling TRIR increased to 0.41, driven by unsatisfactory safety
processes at an external site which contracted the services of some of our workers. We have taken the
necessary measures to protect our workforce and terminated the contractual relationship with the site.
Our focus on safety remains unchanged and, with the appointment of a new VP of HSESQ (Health,
Safety, Environment, Security and Quality), we are continuing our internal efforts to ensure that the
health and wellbeing of our employees remains a top priority and that our safety track record returns to
our historic strong performance levels.
Saudi Maritime Joint Venture
On 31 May 2017, the Group signed a joint venture agreement with Saudi Aramco, Bahri and HHI to
establish and operate a maritime yard in the Kingdom of Saudi Arabia through a joint venture company
(“JVCo”). The joint venture was approved by our shareholders on 26 June 2017 and we anticipate
satisfaction of all conditions precedent by the end of year including the formation of the JVCo.
Once commissioned, the maritime yard will become one of the largest yards in the Arabian Gulf with
4.1km of quayside and 640,000 m2 of workshops. Lamprell will be the technical partner in two zones
focusing on construction of jackup drilling rigs as well as maintenance, repair and overhaul ("MRO")
services for jackup drilling rigs and commercial vessels, with HHI taking responsibility for the two zones
focusing on the construction and MRO services for offshore support vessels and the construction of
commercial vessels. The yard is expected to be partially operational by 2019 with full functionality
reached by 2021.
As part of the project documents for the joint venture, Saudi Aramco and JVCo will sign an offtake
agreement for construction of 20 offshore jackup drilling rigs over a 10-year period as well as provision
of MRO services for jackup drilling rigs. The offtake agreement allows Saudi Aramco to nominate its
newly-formed Saudi drilling joint venture between Saudi Aramco and Rowan as the offtaker. Until the
maritime yard is operational, JVCo is expected to subcontract some of this work, with significant
component parts of the first two jackup drilling rigs expected to be subcontracted to Lamprell’s yards in
the UAE in 2018.
Work on the project is progressing well with the first contract for dredging works at the yard awarded
during the summer and further construction contracts expected to be placed by year-end. We will update
the market on major milestones as the development progresses.
Board changes
On 11 September, we announced the appointment of John Malcolm as Lamprell’s new Non-Executive
Chairman to take effect following John Kennedy’s retirement on 20 September 2017. John Malcolm has
been an independent Non-Executive Director of the Company since 27 May 2013 and the Board
determined that his strong industry experience and deep knowledge of the Company presented an
excellent candidate for the Chairman role from existing Board members. On behalf of everyone at
Lamprell, I would like to thank John Kennedy for his contribution to the Group’s development and
transformation over the last five years.

Market overview and bid pipeline
We recognised the key marketing needs: to expand the Company’s business development (“BD”)
function, to maintain a competitive and attractive offering, and to broaden Lamprell’s addressable
markets. With this in mind, in 1H 2017 we recruited a new VP of BD and our risk-based, structured
approach to bidding ensures that we only pursue opportunities that fit well with our skillset, experience
and growth ambition whilst generating satisfactory margins. This approach is designed to ensure that
reward is aligned with the risk profile for any given project. Despite the widely reported market
downturn in 2017, there are early indications of a potential market recovery. We are seeing improved
bidding levels, both in our core markets and especially in the renewables sector, and our bid pipeline has
grown to USD 3.1 billion from USD 2.5 billion at the end of 2016. The 2016 contract award in the
renewables sector for the East Anglia One project has positioned Lamprell as an important participant in
that market. As we move through project execution, we are on a learning curve with start-up costs and
inefficiencies which we are working through. Although this will impact our margins on this first project,
it has reinforced our view of the significant potential that the renewables market presents to the growth of
the Group. Furthermore, and given our experience in constructing complex jackup windfarm installation
vessels, we are seeing an increase in bid requests for both foundations and installation vessels.
One of the key Group priorities is the strategic partnership with Saudi Aramco, one of the few oil and gas
majors still committed to rig commissioning in the current market. The joint development of a major
maritime facility in the Middle East region will provide new revenue streams for Lamprell and the Group
is also in the process of pre-qualifying to bid for a long-term agreement with Saudi Aramco. The
outcome of this highly competitive process is expected to be announced in the coming six months. If
successful, Lamprell would have access to a significant project pipeline of non-rig work – awards under
the long-term agreements with existing contractors amounted to USD 4 billion in 2016 alone.
We are also determined to build on our credentials in EPC projects within the energy industry and we are
reviewing partnering options to help access this market. We are currently progressing discussions with a
small number of established and reputable partners to bid for much larger scale projects in new
geographies. Converting the pipeline into contract awards requires significant ongoing effort, but we are
investing in our capabilities for this market, both by developing our infrastructure and attracting
specialist talent to support our core competenices and expertise. Consequently, we are hiring various
specialists with extensive expertise in EPC projects to support and complement our existing
competencies and are currently installing a state-of-the-art pipeshop near our Hamriyah facility.
Outlook
We continue to expect 2017 to be a difficult year. Top-line performance will remain subdued as a result
of the slow pace of the new major contract awards that we have seen over the past 24 months. We do not
expect to see the potential improvement in market conditions impacting our business in 2018 due to the
lag between improved market conditions and project awards in our business streams. In the meantime,
we remain focused on the immediate challenges facing the business and on implementing our growth
strategy for the medium term. The slow pace of contract awards (for walk-in work in particular) has
resulted in our adjusting the revenue guidance for the full year to USD 370-390 million, with revenue
weighted towards 2H 2017 as the major projects enter their high activity phases of construction. Our
revenue expectations for 2018 are around 10% lower than 2017 and are conditional upon the timing of
potential contract awards. We are encouraged by increased levels of bidding activity but do not expect to
see revenue growth until 2019 on the basis of such awards in late 2018. Our investment in a skilled
workforce will help to ensure delivery of our projects and, in combination with our bidding strategies, to
convert a robust pipeline of profitable projects in existing business streams and in the renewables and
EPC sectors. While this may result in near-term margin pressure, we consider that this is an important
investment for our future as we implement our strategy.
Christopher McDonald
Chief Executive Officer
Lamprell plc

Financial Review
The Group’s financial performance was broadly in line with our expectations. Reduced levels of new
contract awards in prior years have affected revenue levels as compared to 1H 2016, but successful
closure of various major projects drove strong margins for the reporting period. In addition, the balance
sheet remains robust with healthy cash reserves.
Results from operations
The Group’s total revenue for the six-month period ended 30 June 2017 was USD 159.2 million,
significantly lower than the USD 451.3 million reported for the same period last year. The reduction
reflects the adverse market conditions, particularly in the new build jackup rig sector and low levels of
contract awards in 2016 and 2017 to date.
Revenue breakdown reflects current industry activity with new build jackup rigs representing just over
31% of total Group revenue for the period or USD 49.4 million, significantly down on the previous year.
Revenues from oil and gas contracting services and offshore platforms have improved, contributing USD
42.3 million and USD 40.2 million respectively as Master Marine and the Scottish Power project activity
intensifies.
Our services businesses, particularly the manpower segment, have performed well contributing revenues
of USD 24.3 million.
Modules revenues decreased to USD 3.0 million from USD 22.6 million during the comparative period
in the prior year as we completed the Petrofac UZ750 project.
Margin performance
Gross profit decreased to USD 20.6 million compared to USD 27.5 million during the comparative
period.
Gross margin was 13.0%, an increase on the figure of 6.1% reported for the same period last year, and in
line with the 13.1% underlying margin before the impact of the Ensco settlement in 2016. The gross
margin in 1H 2017 was driven by the succeesful completion of the three new build jack up rigs and the
HMC Kaombo project. These project completions offset the impact that the low revenue levels had on
recovery of the Group’s fixed cost base.
Further cost reduction measures, announced in March 2017, have led to a reduction in overheads as we
continue to align the business with the market outlook. Our overheads in 1H have reduced accordingly by
USD 14.5 million in line with our expectations.
EBITDA, from continuing operations and including exceptional items for the period, was USD 13.5
million (1H 2016: USD 10.0 million). The Group’s EBITDA margin was 8.5% reflecting the stable gross
margin and reduction in overhead.
Finance costs and financing activities
Net finance costs in the first half of 2017 decreased further to USD 3.1 million (1H 2016: USD 5.5
million) due to the lower levels of debt, facility commitment fees and bonding commissions.
Net profit/loss after exceptional items and earnings per share
The Group generated a net profit of USD 1.1 million (1H 2016: net loss of USD 4.4 million). The diluted
earnings per share for the six-month period ended 30 June 2017 was USD 0.30 cents (1H 2016: diluted
loss per share of USD 1.27 cents).
Capital expenditure
The Group’s capital expenditure on tangible assets during the six-month period ended 30 June 2017 was
USD 13.7 million, largely similar with 1H 2016, as we continue to improve yard efficiencies and invest
in the pipe shop. We expect capital expenditure on our existing yards to be broadly flat over the the rest
of the year.
The Group will also make the initial investment in the Saudi Maritime Yard of USD 20 million in the
second half of the year. This represents the first instalment of our capital injection into the joint venture
and JVCo will use the monies to fund the joint venture formation. Further instalments are expected to be
required from the joint venture partners by the Saudi Maritime Yard on an annual basis over the coming
years. We expect to fund this project from our balance sheet.
Lamprell retains significant flexibility in capital expenditure on its existing operations and our current
commitments reflect the strength of the balance sheet and our net cash position.
Cash flow and liquidity
The Group's net cash flow from operating activities for 1H 2017 reflected a net inflow of USD 56.7
million (1H 2016: net outflow of USD 38.2 million), which was driven primarily by decreased working
capital requirements as milestone payments on completed projects were collected. Prior to working
capital movements and the payment of employees' end of service benefits, the Group's net cash inflow
was USD 20.0 million (1H 2016: inflow of USD 17.1 million).
Cash and bank balances increased by USD 20.6 million to USD 355.2 million during the first half of the
year resulting from net cash inflow from operations, repayment of debt and a net cash outflow from
investing activities. Net cash is expected to trend downwards moderately by the end of the year as we
invest in the continuing efficiency improvements in our yard facilities, make the initial investment in the
Saudi Maritime yard joint venture and complete the acquisition of two S116E kits which we initiated the
purchase of in 2015 from Cameron LeTourneau to secure our supply chain.
Balance sheet
The Group’s net cash increased further to USD 305.9 million in line with our expectations as milestone
payments on delivery of the three new build jack up rigs were collected (31 December 2016: USD 275.2
million).
The Group’s total current assets at the period-end were USD 588.5 million (31 December 2016: USD
616.8 million). Trade and other receivables decreased to USD 196.5 million (31 December 2016: USD
275.3 million).
Shareholders’ equity remained relatively unchanged at USD 559.3 million (31 December 2016: USD
555.4 million).
Borrowings
Borrowings at the end of the first half of 2017 were USD 49.3 million (31 December 2016: USD 59.5
million).
At 30 June 2017, the Group's facilities comprised (a) a USD 100 million term loan amortised over five
years, of which USD 50 million had been repaid by the end of the reporting period; (b) USD 50 million
for general working capital purposes which remained unutilised; and (c) USD 100 million of working
capital for project financing (reduced from USD 200 million), also undrawn. During 1H, the USD 150
million committed bonding facility (which had been reduced from USD 250 million in 2016) to be used
in connection with new contract awards funded by the above working capital facility, was reduced by a

further USD 100 million as it was replaced by lower cost bilateral bonding facilities. The Group's debt to
equity ratio at the 30 June 2017 was low at 8.8%.
Amendments to debt facility covenants
The Group’s balance sheet remains strong with USD 305.9 million in net cash. The Board believes that
maintaining significant liquidity is beneficial to the Group. As a result, during 1H the Group obtained
debt facility amendments from its lenders in relation to certain of the financial covenants, to provide
financial flexibility. These include a waiver of the ratio of EBITDA to Debt Service covenant up to the
period ended 31 December 2018 and the ratio of Borrowings to EBITDA covenant for the periods ended
31 December 2017 and 30 June 2018. Securing these waivers further demonstrates the strong,
continuing support that the Group receives from its lender group.
Going concern
After reviewing its cash flow forecasts for a period of not less than 12 months from the date of signing
these half-yearly financial statements, the Directors have a reasonable expectation that the Group will
have adequate resources to continue in operational existence for the foreseeable future. The Group
therefore continues to adopt the going concern basis in preparing its financial statements.
Dividends
In the context of ongoing market challenges, the low revenue levels in 2017 and the investment for future
growth in the Saudi Maritime Yard, the Directors do not recommend the payment of an interim dividend
for the period in relation to current financial year ending 31 December 2017. The Directors will continue
to review this position in light of market conditions at the relevant time.
Principal risks and uncertainties
Principal risks are a risk or combination of risks that, given the Group’s current position, could seriously
affect the performance, future prospects or reputation of the Group. They include those risks that could
materially threaten the Company’s business model, performance, solvency or liquidity, or prevent it from
meeting its strategic objectives.
In terms of identifying and managing the principal risks and uncertainties, the Group has an established
risk management framework which requires all risk owners to identify, evaluate and monitor risks and
take steps to reduce, manage or eliminate the risk. The Board has oversight of enterprise risk
management. Responsibility for monitoring and reviewing the integrity and effectiveness of the Group’s
overall systems of risk management and internal controls is delegated to the Audit & Risk Committee.
For details of the principal risks and uncertainties faced by the Group, please refer to the Notes to
Financial Statements in the Company’s 2016 Annual Report as well as the Risk Report on pages 14 to 17
in the same document. The Audit & Risk Committee and the Board as a whole have continued to review
the Group’s risks throughout the first half of 2017 and the directors consider that, in addition to the
principal risks and uncertainties included in the Annual Report for the year ended 31 December 2016,
there is an additional risk arising from project execution in light of the Group’s movement into the
renewables and EPC sectors, consistent with its strategy. One example is the East Anglia One project in
the renewables sector, discussed above in the Chief Executive Officer’s Review.
Tony Wright
Chief Financial Officer
Lamprell plc
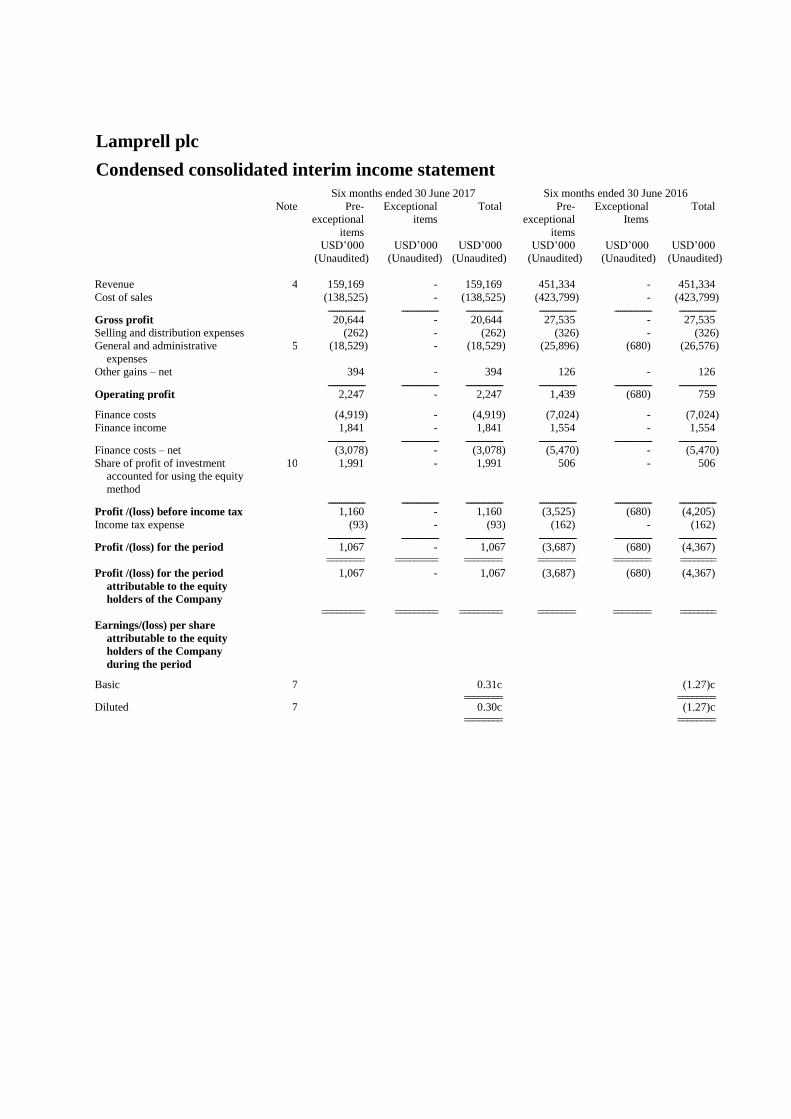
Lamprell plc
Condensed consolidated interim income statement
Six months ended 30 June 2017 Six months ended 30 June 2016
Note Pre-
exceptional
items
Exceptional
items
Total Pre-
exceptional
items
Exceptional
Items
Total
USD’000 USD’000 USD’000 USD’000 USD’000 USD’000
(Unaudited) (Unaudited) (Unaudited) (Unaudited) (Unaudited) (Unaudited)
Revenue 4 159,169 - 159,169 451,334 - 451,334
Cost of sales (138,525) - (138,525) (423,799) - (423,799)
-------------------- -------------------- -------------------- -------------------- -------------------- -------------------- Gross profit 20,644 - 20,644 27,535 - 27,535
Selling and distribution expenses (262) - (262) (326) - (326)
General and administrative
expenses
5 (18,529) - (18,529) (25,896) (680) (26,576)
Other gains – net 394 - 394 126 - 126
-------------------- -------------------- -------------------- -------------------- -------------------- -------------------- Operating profit 2,247 - 2,247 1,439 (680) 759
Finance costs (4,919) - (4,919) (7,024) - (7,024)
Finance income 1,841 - 1,841 1,554 - 1,554
-------------------- -------------------- -------------------- -------------------- -------------------- -------------------- Finance costs – net (3,078) - (3,078) (5,470) - (5,470)
Share of profit of investment
accounted for using the equity
method
10 1,991 - 1,991 506 - 506
-------------------- -------------------- -------------------- -------------------- -------------------- -------------------- Profit /(loss) before income tax 1,160 - 1,160 (3,525) (680) (4,205)
Income tax expense (93) - (93) (162) - (162)
-------------------- -------------------- -------------------- -------------------- -------------------- -------------------- Profit /(loss) for the period 1,067 - 1,067 (3,687) (680) (4,367)
======== ========= ======== ======== ======== ========
Profit /(loss) for the period
attributable to the equity
holders of the Company
1,067 - 1,067 (3,687) (680) (4,367)
========= ========= ========= ======== ======== ========
Earnings/(loss) per share
attributable to the equity
holders of the Company
during the period
Basic 7 0.31c (1.27)c
======== ======== Diluted 7 0.30c (1.27)c
======== ========
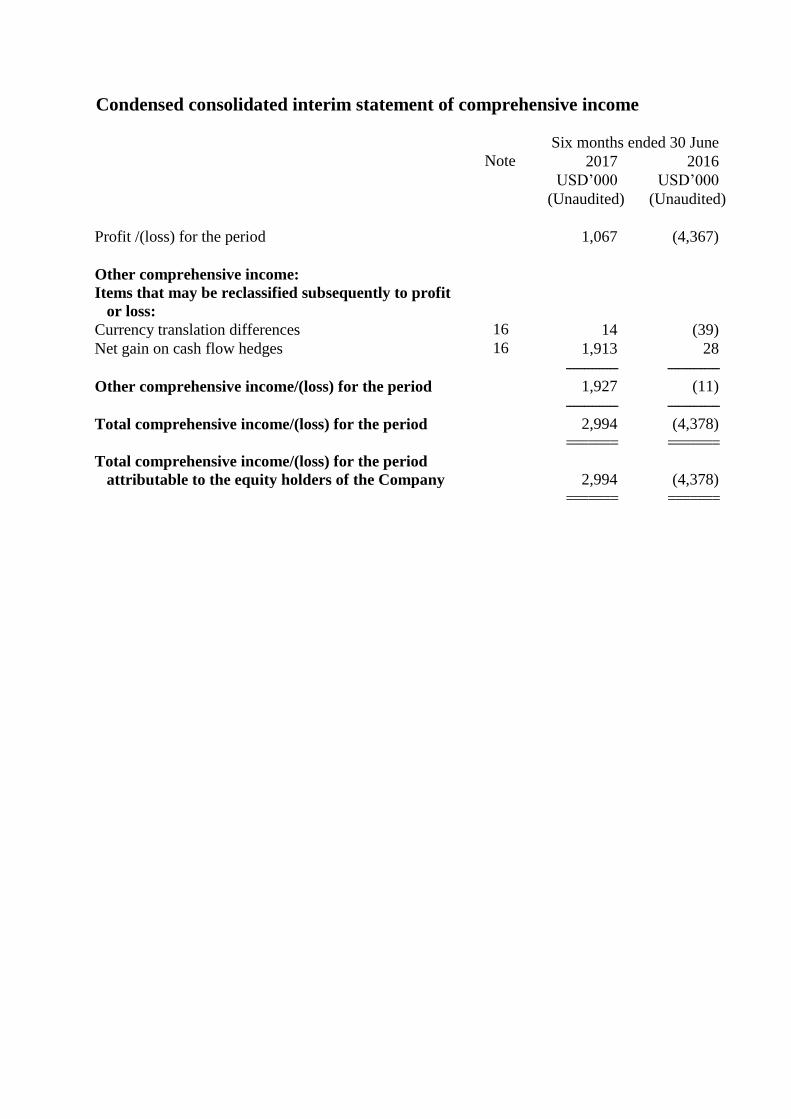
Condensed consolidated interim statement of comprehensive income
Six months ended 30 June
Note 2017 2016
USD’000 USD’000
(Unaudited) (Unaudited)
Profit /(loss) for the period 1,067 (4,367)
Other comprehensive income:
Items that may be reclassified subsequently to profit
or loss:
Currency translation differences 16 14 (39)
Net gain on cash flow hedges 16 1,913 28
-------------- --------------
Other comprehensive income/(loss) for the period 1,927 (11)
-------------- --------------
Total comprehensive income/(loss) for the period 2,994 (4,378)
======= =======
Total comprehensive income/(loss) for the period
attributable to the equity holders of the Company
2,994 (4,378)
======= =======

Condensed consolidated interim balance sheet
At 30 June At 31 December
Note 2017 2016
USD’000 USD’000
(Unaudited) (Audited)
ASSETS
Non-current assets
Property, plant and equipment 8 174,840 172,328
Intangible assets 9 32,755 24,951
Investment accounted for using the equity method 10 9,220 7,229
Trade and other receivables 11 1,690 10,905
Term and margin deposits 12 13,297 6,777
Derivative financial instruments 20 110 115 ------------------------ ------------------------ Total non-current assets 231,912 222,305 ------------------------ ------------------------ Current assets
Inventories 13 51,001 24,415
Trade and other receivables 11 194,811 264,417
Derivative financial instruments 20 726 58
Cash and bank balances 12 341,928 327,893 ------------------------ ------------------------ Total current assets 588,466 616,783 ------------------------ ------------------------ Total assets 820,378 839,088 ------------------------ ------------------------ LIABILITIES
Current liabilities
Borrowings 21 (20,003) (20,321)
Trade and other payables 18 (170,710) (180,021)
Derivative financial instruments 20 - (465)
Provision for warranty costs and other liabilities 19 (8,454) (7,958)
Current tax liability (223) (223) ------------------------ ------------------------ Total current liabilities (199,390) (208,988) ------------------------ ------------------------ Net current assets 389,076 407,795
------------------------ ------------------------
Non-current liabilities
Borrowings 21 (29,323) (39,163)
Derivative financial instruments 20 - (794)
Provision for employees’ end of service benefits 17 (32,288) (34,745) ------------------------ ------------------------ Total non-current liabilities (61,611) (74,702) ------------------------ ------------------------
Total liabilities (261,001) (283,690)
------------------------ ------------------------
Net assets 559,377 555,398
========== ==========
EQUITY
Share capital 15 30,346 30,346
Share premium 15 315,995 315,995
Other reserves 16 (18,766) (20,693)
Retained earnings 231,802 229,750 ----------------------- ----------------------- Total equity attributable to the equity holders of the Company 559,377 555,398
========= =========
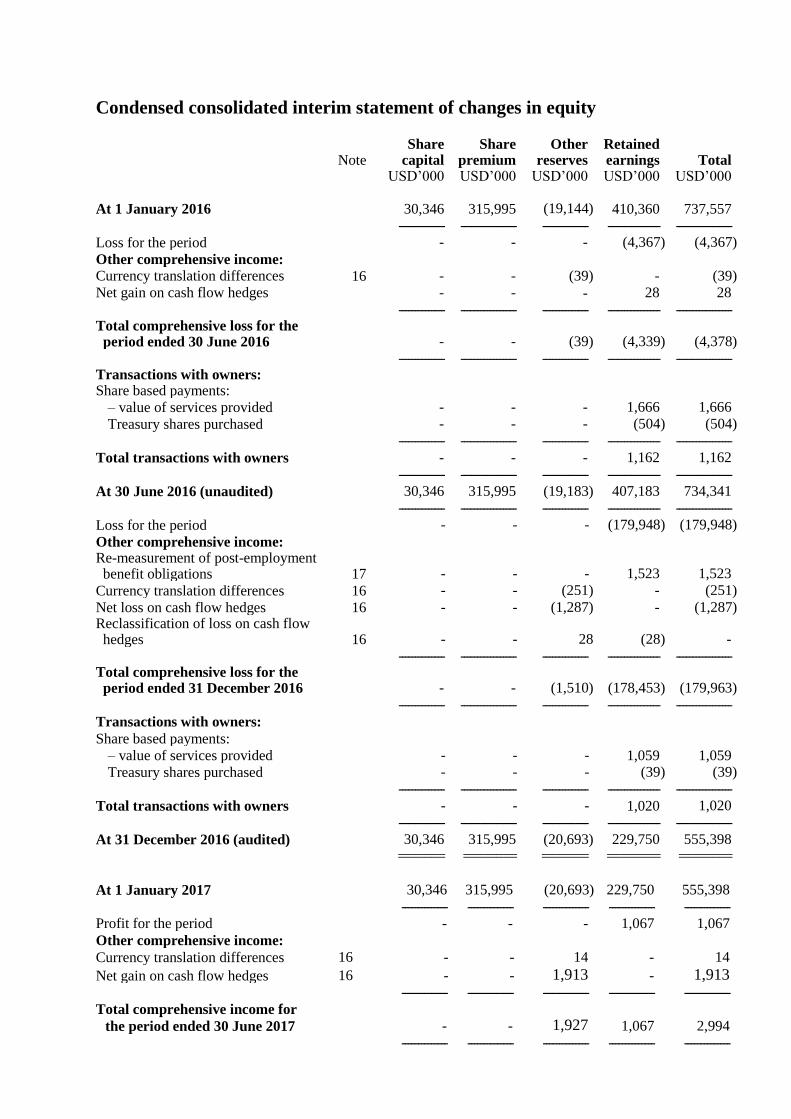
Condensed consolidated interim statement of changes in equity
Note
Share capital
Share premium
Other reserves
Retained earnings
Total
USD’000 USD’000 USD’000 USD’000 USD’000
At 1 January 2016 30,346 315,995 (19,144) 410,360 737,557
-------------- ----------------- -------------- ---------------- -----------------
Loss for the period - - - (4,367) (4,367)
Other comprehensive income:
Currency translation differences 16 - - (39) - (39)
Net gain on cash flow hedges - - - 28 28
-------------- ----------------- -------------- ---------------- ----------------- Total comprehensive loss for the period ended 30 June 2016 - - (39) (4,339) (4,378)
-------------- ----------------- -------------- ---------------- ----------------- Transactions with owners: Share based payments:
– value of services provided - - - 1,666 1,666
Treasury shares purchased - - - (504) (504)
-------------- ----------------- -------------- ---------------- -----------------
Total transactions with owners - - - 1,162 1,162
-------------- ----------------- -------------- ---------------- -----------------
At 30 June 2016 (unaudited) 30,346 315,995 (19,183) 407,183 734,341
-------------- ----------------- -------------- ---------------- -----------------
Loss for the period - - - (179,948) (179,948)
Other comprehensive income: Re-measurement of post-employment benefit obligations 17 - - - 1,523 1,523
Currency translation differences 16 - - (251) - (251)
Net loss on cash flow hedges 16 - - (1,287) - (1,287) Reclassification of loss on cash flow hedges 16 - - 28 (28) -
-------------- ----------------- -------------- ---------------- ----------------- Total comprehensive loss for the period ended 31 December 2016 - - (1,510) (178,453) (179,963)
-------------- ----------------- -------------- ---------------- -----------------
Transactions with owners:
Share based payments:
– value of services provided - - - 1,059 1,059
Treasury shares purchased - - - (39) (39)
-------------- ----------------- -------------- ---------------- -----------------
Total transactions with owners - - - 1,020 1,020
-------------- ----------------- -------------- ---------------- -----------------
At 31 December 2016 (audited) 30,346 315,995 (20,693) 229,750 555,398
======= ======== ======= ======== ========
At 1 January 2017 30,346 315,995 (20,693) 229,750 555,398
-------------- -------------- -------------- -------------- --------------
Profit for the period - - - 1,067 1,067
Other comprehensive income:
Currency translation differences 16 - - 14 - 14
Net gain on cash flow hedges 16 - - 1,913 - 1,913
-------------- -------------- -------------- -------------- --------------
Total comprehensive income for
the period ended 30 June 2017 - - 1,927 1,067 2,994
-------------- -------------- -------------- -------------- --------------

Transactions with owners:
Share based payments:
– value of services provided - - - 985 985
-------------- --------------- -------------- --------------- -----------------
Total transactions with owners - - - 985 985
-------------- --------------- -------------- ---------------- -----------------
At 30 June 2017 (unaudited) 30,346 315,995 (18,766) 231,802 559,377
======= ======= ======= ======= ========
Condensed consolidated interim statement of cash flows Note Six months ended 30 June 2017 2016 USD’000 USD’000 (Unaudited) (Unaudited) Operating activities Cash generated from/(used in) operating activities 26 56,826 (38,087) Tax paid (93) (67) ---------------- ---------------- Net cash generated from/(used in) operating activities 56,733 (38,154) ---------------- ---------------- Investing activities
Additions to property, plant and equipment 8 (13,669) (13,404)
Proceeds from sale of property, plant and equipment 109 825
Additions to intangible assets 9 (9,396) (2,024)
Finance income 1,841 1,554 Movement in deposits with an original maturity of more than
three months (5,105) 2,124
Movement in margin deposits/short term deposits under lien 2,101 (2,751) ---------------- ----------------
Net cash used in investing activities (24,119) (13,676) ---------------- ---------------- Financing activities
Treasury shares purchased 15 - (504)
Repayment of borrowings 21 (10,000) (10,000)
Finance costs (5,077) (7,082) ---------------- ----------------
Net cash used in financing activities (15,077) (17,586) ---------------- ----------------
Net increase/(decrease) in cash and cash equivalents 17,537 (69,416)
Cash and cash equivalents, beginning of the period 12 245,514 224,164
Exchange rate translation 14 (39) ------------------ ------------------
Cash and cash equivalents at end of the period 12 263,065 154,709 ========= =========

Notes to the condensed consolidated interim financial information
1 Legal status and activities
There has been no change in the legal status or principal activities of the Company during the
current period.
During the period, Lamprell Saudi Arabia Company (“LSAC"), a fully owned subsidiary, was
incorporated but is not yet operational. Other than this, there are no changes to the Company and
its subsidiaries (together referred to as “the Group”) since the publication of our most recent
annual financial statements.
This condensed consolidated interim financial information has been reviewed, not audited. The
information for the year ended 31 December 2016 do not constitute statutory accounts as
defined in the Isle of Man Companies Act. A copy of the statutory accounts for that year has
been delivered to the Registrar of Companies. The auditor’s report on those accounts was not
qualified and did not include a reference to any matters to which the auditors drew attention by
way of emphasis without qualifying the report.
2 Summary of significant accounting policies
2.1 Basis of preparation
The condensed consolidated interim financial information for the six months ended 30 June
2017 have been prepared in accordance with the Disclosure and Transparency Rules (“DTR”) of
the United Kingdom’s Financial Conduct Authority (“FCA”) and with International Accounting
Standard (“IAS”) 34, “Interim Financial Reporting” as adopted by the European Union (“EU”).
The consolidated interim financial information should be read in conjunction with the annual
financial statements for the year ended 31 December 2016, which have been prepared in
accordance with IFRSs as adopted by the EU.
2.2 Accounting policies
The accounting policies applied in the preparation of the condensed consolidated interim
financial information are consistent with those of the annual financial statements for the year
ended 31 December 2016 except for the adoption of new standards and interpretations effective
as of 1 January 2017. The Group has not early adopted any other standard, interpretation or
amendment that has been issued but is not yet effective. The annual financial statements for the
year ended 31 December 2016 are available on the Company’s website (www.lamprell.com).
(a) New and amended standards adopted by the Group
IAS 12 (amendments), ‘Income Taxes’ – Recognition of Deferred Tax Assets for
Unrealised Losses.
IFRS 12 (amendments) ‘Disclosure of Interests in Other Entities’ - Annual Improvements to
IFRSs 2014–2016 Cycle.
These amendments have had no impact on the Group as they clarify existing standards.
3 Critical accounting judgements and key sources of estimation uncertainty
The preparation of interim financial statements requires management to make judgements,
estimates and assumptions that affect the application of accounting policies and the reported

amounts of assets and liabilities, income and expense. Actual results may differ from these
estimates.
3.1 Critical judgements in applying the Group’s accounting policies
During the period there were no critical judgements made applying the Group’s accounting
policies.
3.2 Key sources of estimation uncertainty
The significant judgements made by management in applying the Group’s key sources of
estimation uncertainty were the same as those that applied to the consolidated financial
statements for the year ended 31 December 2016, except as stated otherwise below.
Revenue recognition
The Group uses the percentage-of-completion method for accounting its contract revenue. Use
of the percentage-of-completion method requires the Group to estimate the stage of completion
of the contract to date as a proportion of the total contract work to be performed in accordance
with the Group’s accounting policy. As a result, the Group is required to estimate the total cost
to completion of all outstanding projects at each period end. The application of a 10% sensitivity
to management estimates of the total costs to completion of all outstanding projects at the period
end would result in an increase in assets by USD 2.6 million (H1 2016: USD 18.2 million) if the
total costs to completion are decreased by 10% and a decrease liabilities by USD 2.1 million (H1
2016: USD 17.2 million) if the total costs to completion are increased by 10%.
4 Segment information
The Group is organised into business units, which are the Group’s operating segments and are
reported to the Board of Directors, the chief operating decision maker. These operating segments
are aggregated into two reportable segments – ‘Fabrication & Engineering’ and ‘Services’ based
on similar nature of the products and services, type of customer and economic characteristics.
The Fabrication & Engineering segment contains business from New Build Jack up Rigs
(“NBJR”), Modules, (“MOD”), Offshore Platform (“OP”) and Oil and Gas Contracting Services
(“OGCS”) excluding that from the Operations & Maintenance manpower business. The Services
segment contains business from Operations & Maintenance and safety services.
NBJR derives its revenue from assembly and new build construction for the offshore oil and gas
and renewables sectors; MOD derives its revenue from fabricating packaged, pre-assembled and
modularised units and constructing accommodation and complex process modules for onshore
downstream projects; OP derives its revenue from construction of complex living quarters,
wellhead decks, topsides, jackets and other offshore fixed facilities; and OGCS derives its
revenue from rig refurbishment, land rig services, engineering and construction. Operations &
maintenance derives its revenue from manpower supply and safety services.
Fabrication &
Engineering
Services Total
USD’000 USD’000 USD’000
Six months ended 30 June 2017
Revenue from external customers 134,873 24,296 159,169
========= ========= =========
Gross operating profit 38,917 8,599 47,516
========= ========= =========
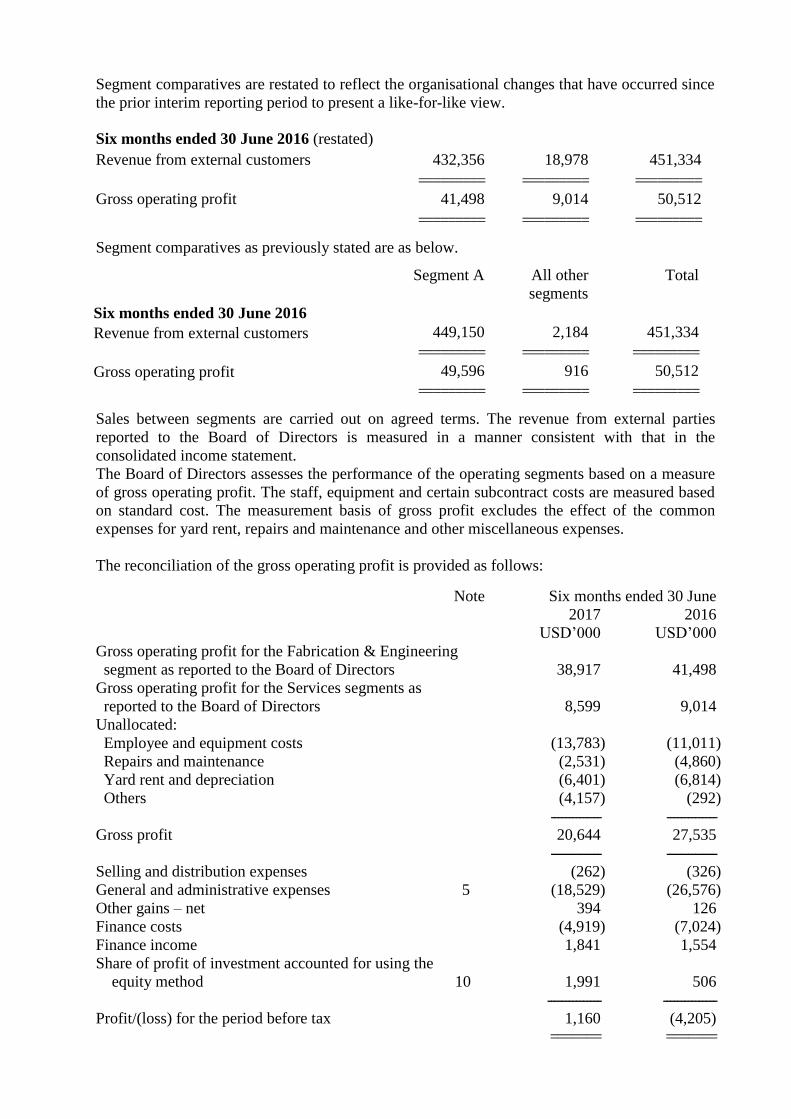
Segment comparatives are restated to reflect the organisational changes that have occurred since
the prior interim reporting period to present a like-for-like view.
Six months ended 30 June 2016 (restated)
Revenue from external customers 432,356 18,978 451,334
========= ========= =========
Gross operating profit 41,498 9,014 50,512
========= ========= =========
Segment comparatives as previously stated are as below.
Segment A All other
segments
Total
Six months ended 30 June 2016
Revenue from external customers 449,150 2,184 451,334
========= ========= =========
Gross operating profit 49,596 916 50,512
========= ========= =========
Sales between segments are carried out on agreed terms. The revenue from external parties
reported to the Board of Directors is measured in a manner consistent with that in the
consolidated income statement.
The Board of Directors assesses the performance of the operating segments based on a measure
of gross operating profit. The staff, equipment and certain subcontract costs are measured based
on standard cost. The measurement basis of gross profit excludes the effect of the common
expenses for yard rent, repairs and maintenance and other miscellaneous expenses.
The reconciliation of the gross operating profit is provided as follows:
Note Six months ended 30 June
2017 2016
USD’000 USD’000
Gross operating profit for the Fabrication & Engineering
segment as reported to the Board of Directors 38,917 41,498
Gross operating profit for the Services segments as
reported to the Board of Directors 8,599 9,014
Unallocated:
Employee and equipment costs (13,783) (11,011)
Repairs and maintenance (2,531) (4,860)
Yard rent and depreciation (6,401) (6,814)
Others (4,157) (292)
-------------- --------------
Gross profit 20,644 27,535
-------------- --------------
Selling and distribution expenses (262) (326)
General and administrative expenses 5 (18,529) (26,576)
Other gains – net 394 126
Finance costs (4,919) (7,024)
Finance income 1,841 1,554
Share of profit of investment accounted for using the
equity method 10 1,991 506
--------------- ---------------
Profit/(loss) for the period before tax 1,160 (4,205)
======= =======
Information about segment assets and liabilities is not reported to or used by the Board of
Directors and accordingly no measures of segment assets and liabilities are reported.
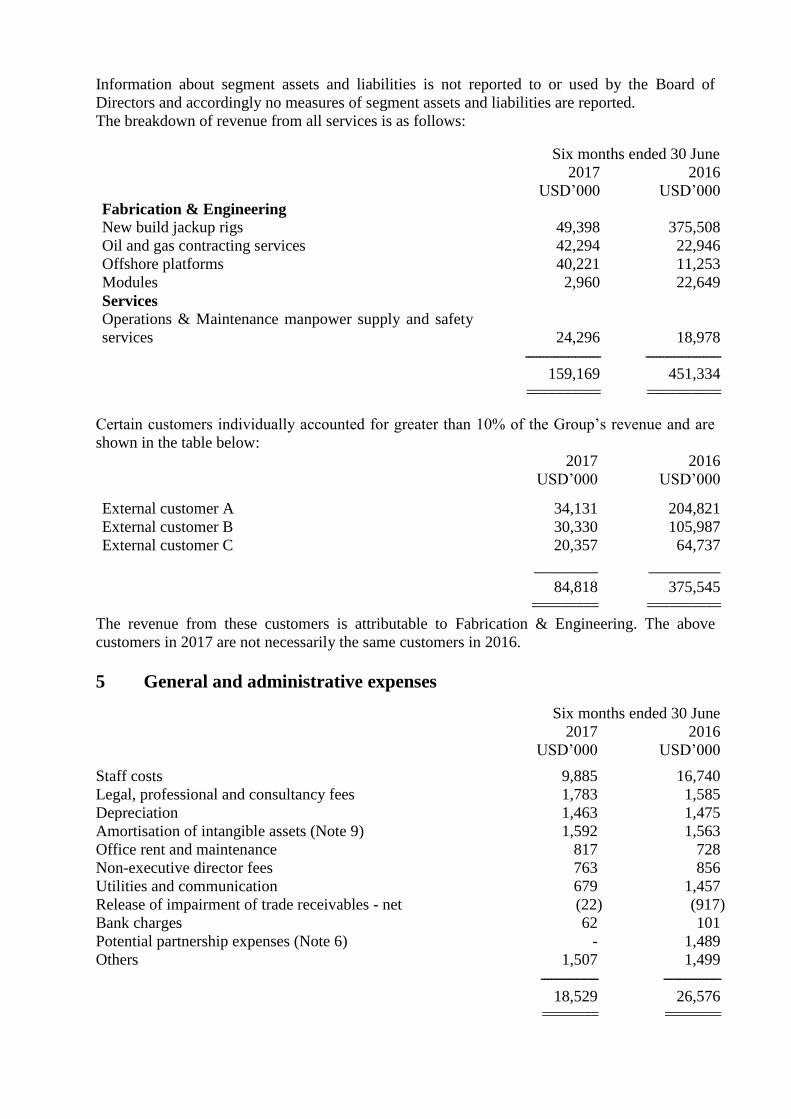
The breakdown of revenue from all services is as follows:
Six months ended 30 June
2017 2016
USD’000 USD’000
Fabrication & Engineering
New build jackup rigs 49,398 375,508
Oil and gas contracting services 42,294 22,946
Offshore platforms 40,221 11,253
Modules 2,960 22,649
Services
Operations & Maintenance manpower supply and safety
services 24,296 18,978
--------------------- ---------------------
159,169 451,334
========== ==========
Certain customers individually accounted for greater than 10% of the Group’s revenue and are
shown in the table below:
2017 2016
USD’000 USD’000
External customer A 34,131 204,821
External customer B 30,330 105,987
External customer C 20,357 64,737
________ _________
84,818 375,545
========= ==========
The revenue from these customers is attributable to Fabrication & Engineering. The above
customers in 2017 are not necessarily the same customers in 2016.
5 General and administrative expenses
Six months ended 30 June
2017 2016
USD’000
USD’000
Staff costs 9,885 16,740
Legal, professional and consultancy fees 1,783 1,585
Depreciation 1,463 1,475
Amortisation of intangible assets (Note 9) 1,592 1,563
Office rent and maintenance 817 728
Non-executive director fees 763 856
Utilities and communication 679 1,457
Release of impairment of trade receivables - net (22) (917)
Bank charges 62 101
Potential partnership expenses (Note 6) - 1,489
Others 1,507 1,499
---------------- ----------------
18,529 26,576
======== ========

6 Investment in Maritime Yard
The Group’s proposed investment in the Maritime Yard within the King Salman International
Complex for Maritime Industries & Services (‘Maritime Yard’) was approved by the
Shareholders at an extraordinary general meeting held on 26 June 2017. The circular (‘Proposed
Joint Venture’) detailing the investment is available on the Company’s website
(www.lamprell.com).
As at 30 June 2017, other than certain costs incurred in connection with the preparatory steps no
direct investment had been made by the Group pending formation of the Company that will
operate the Maritime Yard. It is intended that a new limited liability company will be established
under the laws of the Kingdom by the partners to operate, maintain and manage the Maritime
Yard.
The Group’s investment commitments for the Maritime Yard are disclosed in Note 23.
7 Earnings/(loss) per share
The calculation of the basic and diluted earnings/(loss) per share is based on the following data:
Six months ended 30 June
2017 2016
USD’000 USD’000
The calculations of earnings/(loss) per share are based on
the following profit/(loss) and numbers of shares:
Profit/(loss) for the period 1,067 (4,367)
------------------------- -------------------------
Weighted average number of shares for basic
earnings/(loss) per share 341,710,302 341,710,302
Adjustments for:
- Assumed vesting of performance share plan 3,811,566 - - Assumed vesting of retention share plan 1,000,806 -
------------------------- -------------------------
Weighted average number of shares for diluted
earnings/(loss) per share 346,522,674 341,710,302
------------------------- -------------------------
Earnings/(loss) per share:
Basic 0.31c (1.27)c
=========== ===========
Diluted 0.30c (1.27)c
=========== ===========
During the prior period, assumed vesting of performance and retention share plans amounting to
1,672,494 shares and 67,548 shares respectively were anti-dilutive and therefore excluded.
8 Property, plant and equipment
USD’000
Net book amount at 1 January 2016 175,286
Additions 13,404
Net book amount of disposals (422)
Depreciation (11,888)
--------------
Net book amount at 30 June 2016 176,380
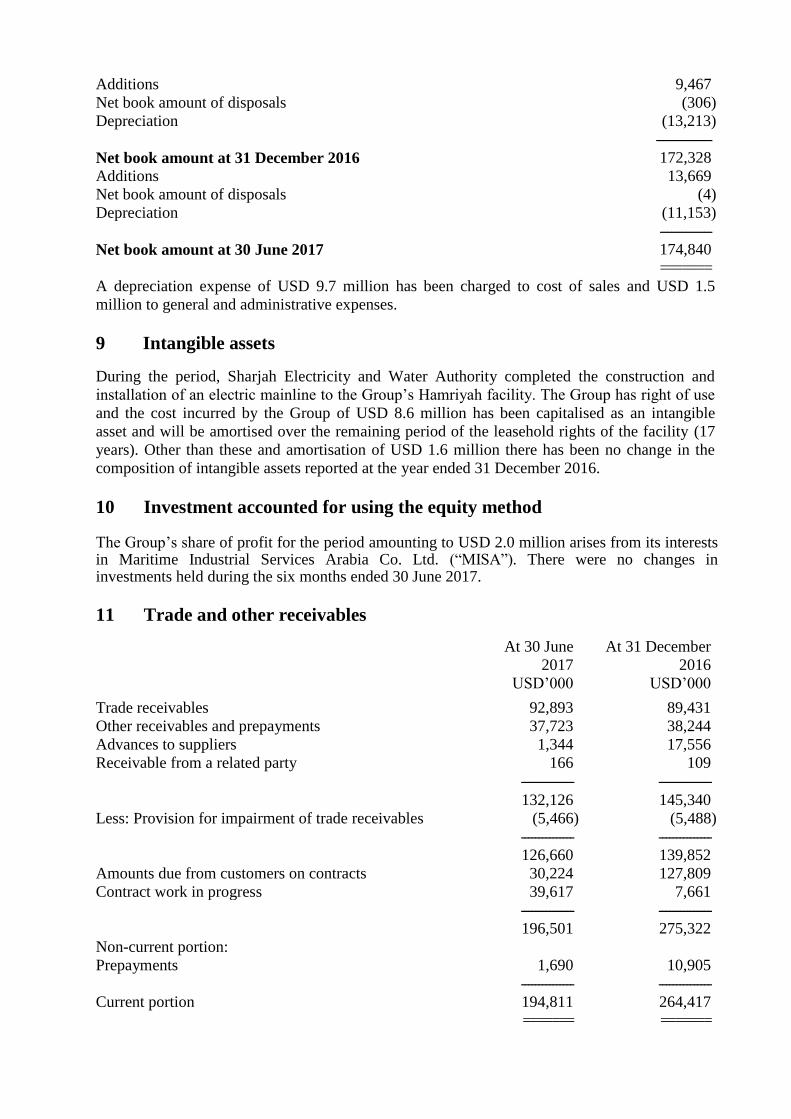
Additions 9,467
Net book amount of disposals (306)
Depreciation (13,213)
---------------
Net book amount at 31 December 2016 172,328
Additions 13,669
Net book amount of disposals (4)
Depreciation (11,153)
--------------
Net book amount at 30 June 2017 174,840
=======
A depreciation expense of USD 9.7 million has been charged to cost of sales and USD 1.5
million to general and administrative expenses.
9 Intangible assets
During the period, Sharjah Electricity and Water Authority completed the construction and
installation of an electric mainline to the Group’s Hamriyah facility. The Group has right of use
and the cost incurred by the Group of USD 8.6 million has been capitalised as an intangible
asset and will be amortised over the remaining period of the leasehold rights of the facility (17
years). Other than these and amortisation of USD 1.6 million there has been no change in the
composition of intangible assets reported at the year ended 31 December 2016.
10 Investment accounted for using the equity method The Group’s share of profit for the period amounting to USD 2.0 million arises from its interests in Maritime Industrial Services Arabia Co. Ltd. (“MISA”). There were no changes in investments held during the six months ended 30 June 2017.
11 Trade and other receivables
At 30 June At 31 December
2017 2016
USD’000 USD’000
Trade receivables 92,893 89,431
Other receivables and prepayments 37,723 38,244
Advances to suppliers 1,344 17,556
Receivable from a related party 166 109
--------------- ---------------
132,126 145,340
Less: Provision for impairment of trade receivables (5,466) (5,488)
--------------- ---------------
126,660 139,852
Amounts due from customers on contracts 30,224 127,809
Contract work in progress 39,617 7,661
--------------- ---------------
196,501 275,322
Non-current portion:
Prepayments 1,690 10,905
--------------- ---------------
Current portion 194,811 264,417
======= =======

12 Cash and bank balances At 30 June At 31 December
2017 2016
USD’000 USD’000
Cash at bank and on hand 117,841 88,491
Term and margin deposits 224,087 239,402
--------------- ---------------
Cash and bank balances – current 341,928 327,893
Term and margin deposits – non-current 13,297 6,777
Less: Margin/short term deposits under lien (8,882) (10,983)
Less: Deposits with an original maturity of more than
three months (83,278)
(78,173)
-------------- ----------------
Cash and cash equivalents (for purpose of the cash
flow statement) 263,065 245,514
======= ========
13 Inventories At 30 June
2017 USD’000
At 31 December 2016
USD’000
Raw Materials, Consumables and Finished Goods 27,793 27,989 Work in Progress 26,253 - Less: Provision for slow moving and obsolete inventories (3,045) (3,574) ------------- ------------- 51,001 24,415 ====== ======
14 Related party balances and transactions The Group entered into the following transactions during the period with related parties at prices and on terms agreed between the related parties.
Six months ended 30 June
2017 2016
USD’000 USD’000
Key management compensation 2,077 4,599
====== ======
Legal and professional services 64 -
====== ======
Sales to a joint venture 166 -
====== ======
Purchases from a joint venture 64 77
====== ======
Sponsorship fees and commissions paid to legal
shareholders of subsidiaries 159 186
====== ======

15 Share capital
There is no movement in issued and fully paid ordinary shares and share premium for the period
ending 30 June 2017 and year ended 31 December 2016. During 2017, Employee Benefit Trust (‘EBT’) acquired nil shares (2016: 321,691 shares) of the
Company. The total amount paid to acquire the shares was USD nil (2016: USD 504,000) and
has been deducted from the consolidated retained earnings. During 2017, nil shares (2016:
321,691 shares) were issued to employees on vesting of the performance shares and 16,268
shares (31 December 2016: 16,268 shares) were held as treasury shares at 30 June 2017.
16 Other reserves
Legal reserve
Merger Reserve
Hedge reserve
Translation reserve
Total
USD’000 USD’000 USD’000 USD’000 USD’000
At 1 January 2016 98 (18,572) - (670) (19,144)
Currency translation differences - - - (39) (39)
------------- ----------------- ------------- ------------- ----------------
At 30 June 2016 (Unaudited) 98 (18,572) - (709) (19,183)
Currency translation differences - - - (251) (251)
Loss on cash flow hedges - - (1,287) - (1,287) Reclassification of loss on cash flow hedges - - 28 - 28
------------- ----------------- ------------- ------------- ----------------
At 31 December 2016 (Audited) 98 (18,572) (1,259) (960) (20,693)
Currency translation differences - - - 14 14
Gain on cash flow hedges - - 1,913 - 1,913
------------- ----------------- ------------- ------------- ----------------
At 30 June 2017 (Unaudited) 98 (18,572) 654 (946) (18,766) ======== =========== ======== ======== ==========
17 Provision for employees’ end of service benefits
The end of service benefits obligation as at 30 June 2017 is calculated on a year to date basis,
using the latest actuarial valuation as at 31 December 2016. There have not been any significant
fluctuations or onetime events since that time that would require adjustments to the actuarial
assumptions as at 31 December 2016.
18 Trade and other payables
At 30 June At 31 December 2017 2016 USD’000 USD’000 Trade payables 61,194 31,662 Accruals 87,048 111,022 Payables to a related party 292 228 Amounts due to customers on contracts 22,176 37,109 ---------------------------------------------------- ------------------------------------------------------
170,710 180,021 ======= =======

19 Provision for warranty costs and other liabilities
During the period, the Group has incurred a charge of USD 1.0 million for estimated warranty
costs on completed projects. This is partly offset by release of previous provisions amounting to
USD 0.5 million.
20 Derivative financial instruments
The table below analyses financial instruments carried at fair value, by valuation method. The
different levels have been defined as follows:
a. Quoted prices (unadjusted) in active markets for identical assets or liabilities (Level 1);
b. Inputs other than quoted prices included within Level 1 that are observable for the asset or
liability, either directly (that is, as prices) or indirectly (that is, derived from prices) (Level
2); and
c. Inputs for the asset or liability that are not based on observable market data (that is,
unobservable inputs) (Level 3).
The following table presents the Group’s assets that are measured at fair value at:
Level 1 Level 2 Level 3 Total
USD’000 USD’000 USD’000 USD’000
At 30 June 2017
Derivative financial instruments
-
==========
836
==========
-
==========
836
==========
At 31 December 2016 Derivative financial instruments
-
==========
173
==========
-
==========
173
==========
There are no liabilities at 30 June 2017 measured at fair value.
The following table presents the Group’s liabilities that are measured at fair value at:
Level 1 Level 2 Level 3 Total
USD’000 USD’000 USD’000 USD’000
At 31 December 2016 Derivative financial instruments
-
==========
1,259
==========
-
==========
1,259
==========
The fair value of financial instruments that are not traded in an active market is determined by
using valuation techniques. These valuation techniques maximise the use of observable market
data where it is available and rely as little as possible on entity specific estimates. If all
significant inputs required to fair value an instrument are observable, the instrument is included
in Level 2. If one or more of the significant inputs is not based on observable market data, the
instrument is included in Level 3.
There were no transfers between Level 1, 2 and 3 during the period.
There were no changes in valuation techniques during the period.

21 Borrowings
Repayments of borrowings amounting to USD 10.0 million were made during the period. As at 30 June 2017, the Group’s borrowings amount to USD 49.3 million. At 30 June 2017, the Group has banking facilities of USD 1,049 million (31 December 2016: USD 1,362 million) with commercial banks. The facilities include bank overdrafts, letters of guarantees, letters of credit and short-term loans and there has been no significant change in the nature of security pledged against these facilities as at 30 June 2017. During the six months end 30 June 2017, the Group obtained debt facility amendments from its lenders in relation to certain of the financial covenants, to provide financial flexibility. These include a waiver of the ratio of EBITDA to Debt Service covenant up to the period ended 31 December 2018 and the ratio of Borrowings to EBITDA covenant for the periods ended 31 December 2017 and 30 June 2018.
22 Dividends
There were no dividends declared or paid during the six months period ended 30 June 2017.
23 Commitments
(a) Operating lease commitments
The Group leases land and staff accommodation under various operating lease agreements. The
future minimum lease payments payable under operating leases are as follows:
At 30 June At 31 December 2017 2016 USD’000 USD’000 Not later than one year 8,658 6,528 Later than one year but not later than five years 24,229 23,997 Later than five years 80,892 76,264 ------------- ------------- 113,779 106,789 ====== ======
(b) Maritime yard commitments
As stated in Note 6, the Group has entered into commitments associated with the establishment
of a Maritime yard, at Ras Al Khair, in eastern Saudi Arabia. Under the Shareholders’
Agreement, the Group will invest up to a maximum of USD 140.0 million in relation to its
commitment over the course of construction of the Maritime Yard between 2017 and 2022. The
forecast contributions are as follows:
At 30 June At 31 December 2017 2016 USD’000 USD’000 Not later than one year 20,000 - Later than one year but not later than four years 120,000 - ------------- ------------- 140,000 - ====== ======

(c) Other commitments At 30 June At 31 December 2017 2016 USD’000 USD’000
Capital commitments for purchase of operating equipment and computer software 958 345 ====== ====== Capital commitments for construction of facilities 13,221 10,347 ====== ====== Purchase commitments 41,199 51,659 ====== ======
24 Bank guarantees
At 30 June At 31 December
2017 2016
USD’000 USD’000
Performance/bid bonds 124,730 163,812 Advance payment, labour visa and payment guarantees 47,613 240,383
--------------- -----------------------
172,343 404,195 ======= ========
The various bank guarantees, as above, were issued by the Group’s bankers in the ordinary
course of business. Certain guarantees are secured by cash margins, assignments of receivables
from some customers and in respect of guarantees provided by banks to the Group companies,
some have been secured by parent company guarantees. In the opinion of the management, the
above bank guarantees are unlikely to result in any liability to the Group.
25 Events after the balance sheet date
On 14 August 2017 the Group reached an amicable settlement with Cameron International
Corporation ("Cameron"), a subsidiary of Schlumberger Limited ("Schlumberger") in respect of
the issues associated with the jacking equipment supplied by Cameron in 2016.
The settlement results in the Group receiving a proportion of the remedial costs incurred in
rectifying the issues associated with the jacking equipment. After taking account of the
outstanding payment to Cameron in respect of the jacking equipment and the settlement, the
Group anticipates its current net cash position will be largely unchanged.

26 Cash flow from operating activities
Note Six months ended 30 June 2017 2016 USD’000 USD’000
(Unaudited) (Unaudited) Operating activities Profit/(loss) for the period before income tax 1,160 (4,205) Adjustments for: Depreciation 8 11,153 11,888 Amortisation of intangible assets 9 1,592 1,563 Share of profit from investment in a joint venture 10 (1,991) (506) Share based payments value of services provided 985 1,666
Release of excess tax provision - (260) Profit on disposal of property, plant and equipment (105) (403) Provisions/(release) for warranty costs(net) 19 496 (370) Provision for slow moving and obsolete
inventories
(529)
(187)
Release of impairment of trade receivables, net (22) (917) Provision for employees’ end of service benefits 17 2,271 3,325 Finance costs 4,919 7,024 Finance income (1,841) (1,554) Net gain on cash flow hedges 16 1,913 28 ------------- -------------
Operating cash flows before payment of employees’ end of service benefits and changes in working capital
20,001
17,092 Payment of employees’ end of service benefits 17 (4,728) (5,513) Changes in working capital:
Inventories before movement in provision (26,057) (2,855) Derivative financial instruments (1,922) 640 Trade and other receivables before movement in
provision for impairment of trade receivables
78,843
5,954 Trade and other payables (9,311) (53,405) ------------- -------------
Net cash generated from/(used in) operating activities
56,826
(38,087)
--------------- ---------------
Alternative performance measures
As set out in our most recent annual report, we use a range of financial and non-financial
measures to assess our performance. The tables below set out the definitions of such measures,
reconciliations to amounts presented in the interim financial statements and the reason for their
inclusion in the report. The metrics presented are consistent with those presented in our previous
annual report and there has been no changes to the bases of calculation.
EBITDA
In addition to measuring financial performance of the group based on operating profit, we also
measure performance based on EBITDA and underlying EBITDA (also referred to as adjusted
EBITDA). EBITDA is defined as the profit/(loss) for the period from continuing operation
before depreciation, amortisation, interest on bank borrowings, finance income and taxation.
Underlying EBITDA is defined as EBITDA before non-recurring items or certain accounting
adjustments that do not reflect changes in performance.
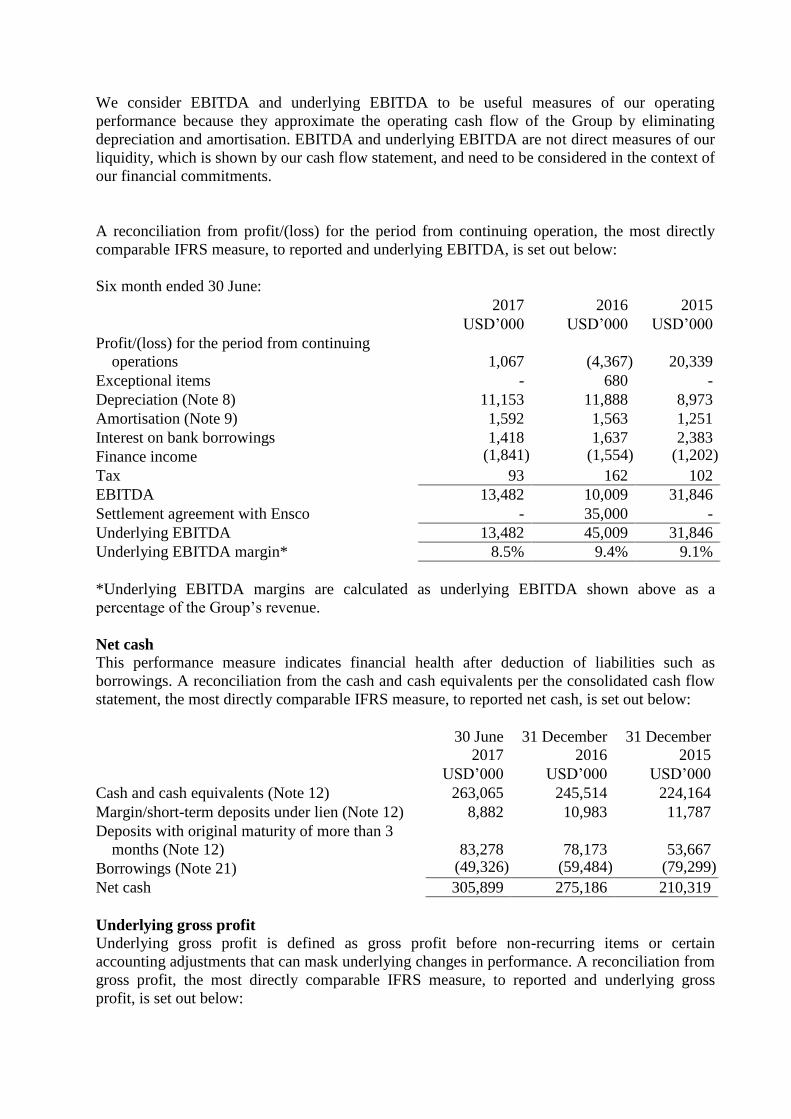
We consider EBITDA and underlying EBITDA to be useful measures of our operating
performance because they approximate the operating cash flow of the Group by eliminating
depreciation and amortisation. EBITDA and underlying EBITDA are not direct measures of our
liquidity, which is shown by our cash flow statement, and need to be considered in the context of
our financial commitments.
A reconciliation from profit/(loss) for the period from continuing operation, the most directly
comparable IFRS measure, to reported and underlying EBITDA, is set out below:
Six month ended 30 June:
2017 2016 2015
USD’000 USD’000 USD’000
Profit/(loss) for the period from continuing
operations
1,067
(4,367)
20,339
Exceptional items - 680 -
Depreciation (Note 8) 11,153 11,888 8,973
Amortisation (Note 9) 1,592 1,563 1,251
Interest on bank borrowings 1,418 1,637 2,383
Finance income (1,841) (1,554) (1,202)
Tax 93 162 102
EBITDA 13,482 10,009 31,846
Settlement agreement with Ensco - 35,000 -
Underlying EBITDA 13,482 45,009 31,846
Underlying EBITDA margin* 8.5% 9.4% 9.1%
*Underlying EBITDA margins are calculated as underlying EBITDA shown above as a
percentage of the Group’s revenue.
Net cash
This performance measure indicates financial health after deduction of liabilities such as
borrowings. A reconciliation from the cash and cash equivalents per the consolidated cash flow
statement, the most directly comparable IFRS measure, to reported net cash, is set out below:
30 June
2017
31 December
2016
31 December
2015
USD’000 USD’000 USD’000
Cash and cash equivalents (Note 12) 263,065 245,514 224,164
Margin/short-term deposits under lien (Note 12) 8,882 10,983 11,787
Deposits with original maturity of more than 3
months (Note 12)
83,278
78,173
53,667
Borrowings (Note 21) (49,326) (59,484) (79,299)
Net cash 305,899 275,186 210,319
Underlying gross profit
Underlying gross profit is defined as gross profit before non-recurring items or certain
accounting adjustments that can mask underlying changes in performance. A reconciliation from
gross profit, the most directly comparable IFRS measure, to reported and underlying gross
profit, is set out below:

Six month ended 30 June:
2017 2016 2015
USD’000 USD’000 USD’000
Gross profit 20,644 27,535 40,786
Settlement agreement with Ensco* - 35,000 -
Underlying gross profit 20,644 62,535 40,786
Normalised underlying margins** 13.0% 13.1% 11.6%
*Refer to prior year interim financial statements Note 4 for an explanation of the agreement.
**Normalised underlying margins are calculated as underlying gross profit shown above as a
percentage of the Group’s revenue.
Underlying profitability
Underlying profitability is defined as profit for the period from continuing operation before non-
recurring items or certain accounting adjustments that do not reflect changes in performance. A
reconciliation from profit/(loss) for the period from continuing operations, the most directly
comparable IFRS measure, to reported and underlying profitability, is set out below:
Six month ended 30 June:
2017 2016 2015
USD’000 USD’000 USD’000
Profit/(loss) for the period from continuing operations 1,067 (4,367) 20,339
Exceptional items - 680 -
Settlement agreement with Ensco* - 35,000 -
Underlying profitability 1,067 31,313 20,339
*Refer to prior year interim financial statements Note 4 for an explanation of the agreement.
Statement of Directors’ responsibilities
The directors confirm that, to the best of their knowledge, this condensed consolidated interim
financial information has been prepared in accordance with IAS 34 as adopted by the EU. The
interim management report includes a fair review of the information required by Disclosure and
Transparency Rules 4.2.7R and 4.2.8R, namely:
an indication of important events that have occurred during the first six months of the
financial year and their impact on the condensed consolidated interim financial
information, and a description of the principal risks and uncertainties for the remaining six
months of the financial year; and
material related party transactions in the first six months of the financial year and any
material changes in the related party transactions described in the last annual report.
The Directors of Lamprell plc are listed in the Lamprell plc Annual Report for
31 December 2016. A list of current directors is maintained on the Lamprell plc website
www.lamprell.com.