22 december 2020 real estate equity research hotel
TRANSCRIPT
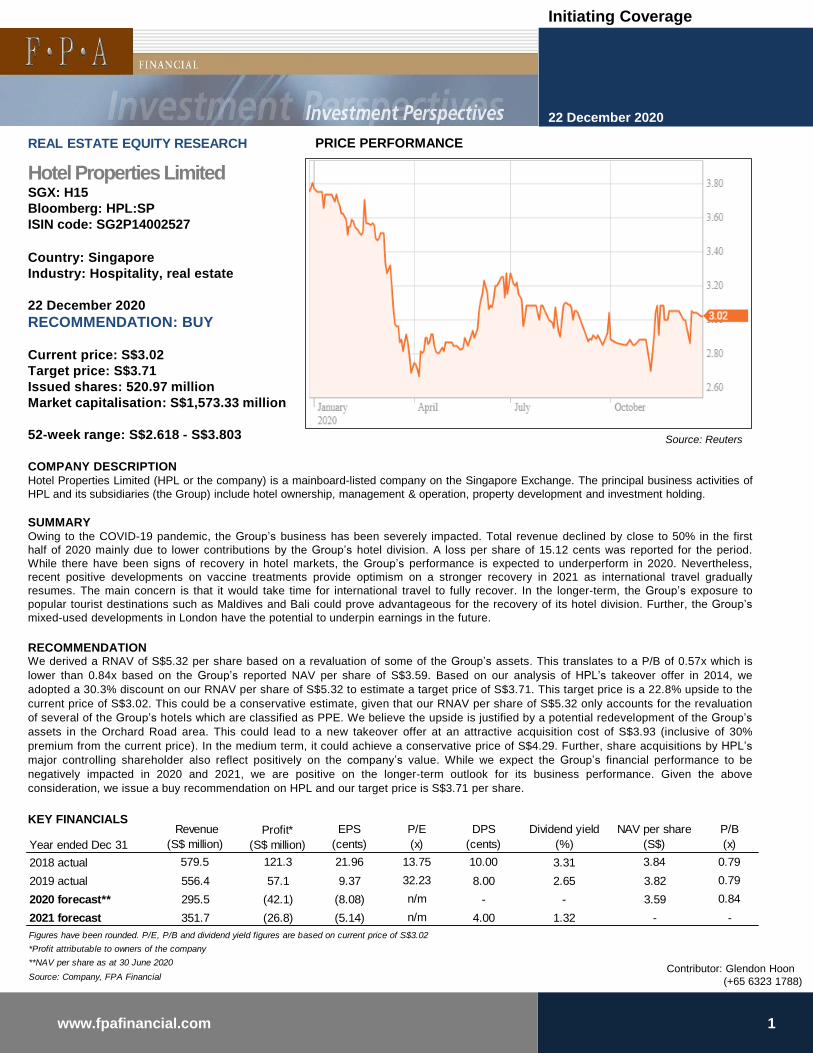
Country: Singapore
Industry: Hospitality, real estate
22 December 2020
RECOMMENDATION: BUY
Current price: S$3.02
Target price: S$3.71
Issued shares: 520.97 million
Market capitalisation: S$1,573.33 million
52-week range: S$2.618 - S$3.803
COMPANY DESCRIPTIONHotel Properties Limited (HPL or the company) is a mainboard-listed company on the Singapore Exchange. The principal business activities of
HPL and its subsidiaries (the Group) include hotel ownership, management & operation, property development and investment holding.
SUMMARYOwing to the COVID-19 pandemic, the Group’s business has been severely impacted. Total revenue declined by close to 50% in the first
half of 2020 mainly due to lower contributions by the Group’s hotel division. A loss per share of 15.12 cents was reported for the period.
While there have been signs of recovery in hotel markets, the Group’s performance is expected to underperform in 2020. Nevertheless,
recent positive developments on vaccine treatments provide optimism on a stronger recovery in 2021 as international travel gradually
resumes. The main concern is that it would take time for international travel to fully recover. In the longer-term, the Group’s exposure to
popular tourist destinations such as Maldives and Bali could prove advantageous for the recovery of its hotel division. Further, the Group’s
mixed-used developments in London have the potential to underpin earnings in the future.
RECOMMENDATIONWe derived a RNAV of S$5.32 per share based on a revaluation of some of the Group’s assets. This translates to a P/B of 0.57x which is
lower than 0.84x based on the Group’s reported NAV per share of S$3.59. Based on our analysis of HPL’s takeover offer in 2014, we
adopted a 30.3% discount on our RNAV per share of S$5.32 to estimate a target price of S$3.71. This target price is a 22.8% upside to the
current price of S$3.02. This could be a conservative estimate, given that our RNAV per share of S$5.32 only accounts for the revaluation
of several of the Group’s hotels which are classified as PPE. We believe the upside is justified by a potential redevelopment of the Group’s
assets in the Orchard Road area. This could lead to a new takeover offer at an attractive acquisition cost of S$3.93 (inclusive of 30%
premium from the current price). In the medium term, it could achieve a conservative price of S$4.29. Further, share acquisitions by HPL’s
major controlling shareholder also reflect positively on the company’s value. While we expect the Group’s financial performance to be
negatively impacted in 2020 and 2021, we are positive on the longer-term outlook for its business performance. Given the above
consideration, we issue a buy recommendation on HPL and our target price is S$3.71 per share.
KEY FINANCIALS
REAL ESTATE EQUITY RESEARCH
Hotel Properties LimitedSGX: H15
Bloomberg: HPL:SP
ISIN code: SG2P14002527
22 December 2020
1www.fpafinancial.com
Source: Reuters
PRICE PERFORMANCE
Contributor: Glendon Hoon
(+65 6323 1788)
Initiating Coverage
Year ended Dec 31
Revenue
(S$ million)
Profit*
(S$ million)
EPS
(cents)
P/E
(x)
DPS
(cents)
Dividend yield
(%)
NAV per share
(S$)
P/B
(x)
2018 actual 579.5 121.3 21.96 13.75 10.00 3.31 3.84 0.79
2019 actual 556.4 57.1 9.37 32.23 8.00 2.65 3.82 0.79
2020 forecast** 295.5 (42.1) (8.08) n/m - - 3.59 0.84
2021 forecast 351.7 (26.8) (5.14) n/m 4.00 1.32 - -
Figures have been rounded. P/E, P/B and dividend yield figures are based on current price of S$3.02
*Profit attributable to owners of the company
**NAV per share as at 30 June 2020
Source: Company, FPA Financial
CONTENTS
COMPANY OVERVIEW ……………………………………….................................................................. 3-6
(I) CORPORATE PROFILE
(II) OVERVIEW OF THE GROUP’S PORTFOLIO
FINANCIAL ANALYSIS …......................................................................................................... ........ 7-10
(I) FINANCIAL REVIEW
(II) CAPITAL MANAGEMENT
POTENTIAL CATALYSTS ………………………………………………………………………………………. 11
(I) BANKSIDE YARDS PROJECT
(II) PADDINGTON SQUARE
FINANCIAL PROJECTIONS …...................................................................................................... . 12-21
(I) REVENUE PROJECTION
(II) EARNINGS PROJECTION
(III) DIVIDENDS PROJECTION
VALUATION ANALYSIS ……………………………………................................................................. 22-37
(I) BALANCE SHEET REVIEW
(II) PEER COMPARISON
(III) HPL TAKEOVER OFFER IN 2014
SWOT AND COMPETITIVE ANALYSIS …………………..…………………………………..…….......... 38-39
(I) STRENGTHS
(II) WEAKNESSES
(III) OPPORTUNITIES
(IV) THREATS
INVESTMENT RECOMMENDATION ...………………………………………………………………............. 40
RISKS TO THE TARGET PRICE ………………………………………………………………………………. 41
(I) WEAK GLOBAL ECONOMIC RECOVERY
(II) CONCERNS OVER SUBDUED BUSINESS TRAVEL
(III) RISK OF EXCHANGE RATE VOLATILITY
SUSTAINABILITY INFORMATION ……………………………………………………………………..….. 42-43
APPENDIX ………………………...………………..….………………………………………..................... 44-55
(I) HOTEL MARKET REVIEW
(II) REAL ESTATE SECTOR MARKET REVIEW
DISCLOSURES/DISCLAIMERS ………………………………………………………………………..………. 56
2www.fpafinancial.com
22 December 2020

COMPANY OVERVIEW
(I) Corporate profile
Hotel Properties Limited (HPL or the company) was incorporated in Singapore as a private limited company on 28
January 1980. The company was converted into a public company on 4 May 1982 and subsequently listed on the
Mainboard of the Singapore Exchange on 17 June 1982.
The principal business activities of HPL and its subsidiaries (collectively referred herein as the Group) include hotel
ownership, management & operation, property development and investment holding. As of 30 June 2020, the Group
had total assets of S$3.5 billion and total equity attributable to shareholders of the company of S$1.9 billion.
HPL’s major controlling shareholder is Mr. Ong Beng Seng, who is also the Managing Director of the company. As
at 19 March 2020, Mr. Ong held a total stake of 60.49% in the company, made up of a 21.07% direct interest and
39.42% deemed interest. His deemed interest, equivalent to 205,429,232 shares, comprised 179,020,924 shares
held by 68 Holdings Pte Ltd (68 Holdings), 23,457,308 shares held by his spouse Mrs. Christina Ong and 2,951,000
shares held by Reef Holdings Pte Ltd. In percentage terms, 68 Holdings Pte Ltd, Mrs. Christina Ong and Reef
Holdings respectively held a 34.35%, 4.50% and 0.57% stake in the company.
A summary of HPL’s substantial shareholders is shown in Exhibit 1 below.
Exhibit 1: HPL’s register of substantial shareholders
Source: Company
22 December 2020
3www.fpafinancial.com

(II) Overview of the Group’s portfolio
Hotel division
The Group owns hotels, resorts and shopping galleries in 15 countries, namely, Singapore, Malaysia, Thailand,
Indonesia, Maldives, Seychelles, Vanuatu, the United States of America, Bhutan, Tanzania, South Africa, Vietnam, the
United Kingdom, Italy and Sri Lanka.
The Group has interests in hotels under prestigious hospitality brands such as Four Seasons, Hilton International,
Como Hotels, InterContinental Hotels Group, Six Senses Hotels and Marriott International. The Group also manages its
own portfolio of hotels under well-established brands such as Hard Rock Hotels and Concorde Hotels & Resorts.
In 2019, the Group expanded its hotel division through acquisitions, openings and upgrading of existing properties.
During the year, its hotel division acquired the 198-key 5-star resort Weligama Bay Marriot Resort & Spa for US$22.6
million, funded through the Group’s internal funds and bank borrowings. The luxury hotel is situated in Weligama, Sri
Lanka, centrally located near top tourist destinations of Mirissa Beach, Galle Fort, Jungle Beach and Yala National
Park and boasts spectacular views of the Weligama bay. Further, the division commenced operations for its newly
constructed InterContinental Maldives Maamunagau Resort in September 2019. The resort is located close to the
UNESCO Biosphere Reserve of the Baa Atoll that offers its guests easy access to the area’s rich marine diversity. The
division also reopened its renovated eco-resort Gili Lankanfushi in Maldives on 1 December 2019. The resort’s 45 villas
were refurbished with new interiors and a completely revised wellness programmes to further enrich the guest
experience.
In 2020, the Group had in February acquired a new hotel in Italy through HPL Dolomites (UK) Limited (HPL Dolomites).
HPL Dolomites, a joint venture company that is 80% owned by the company’s indirect wholly-owned subsidiary HPL
(Europe) Pte Ltd, acquired 90% of the corporate capital and voting rights in Alpina Dolomites SRL (AD) for €40.6
million. AD owns the 56-key 5-star luxury hotel Alpina Dolomites Hotel, Gardena Health Lodge & Spa located in
Compatsch, Alpe di Siusi, Castelrotto, Bozen. The acquisition was funded through internal funds and bank borrowings.
We have summarized the portfolio of the Group’s hotel division as shown in Exhibit 2 on the next page.
22 December 2020
4www.fpafinancial.com

Exhibit 2: Portfolio of the Group’s hotel division
22 December 2020
5www.fpafinancial.com
Country Name of hotel/resort No. of rooms/villas Effective interest Tenure (4)
UMA by COMO, Paro 29 - -
UMA by COMO, Punakha 11 - -
Four Seasons Private Estates at Jimbaran Bay (1)
(2)
9 100% Leasehold
Four Seasons Resort Bali at Jimbaran Bay (1)
(2)
147 93.3% Leasehold
Four Seasons Resort Bali at Sayan (1)
(2)
60 100% Leasehold
Hard Rock Hotel Bali (1)
(2)
418 100% Leasehold
Alpina Dolomites (3)
56 72% -
COMO Castello Del Nero (3)
50 50% -
Casa del Mar Langkawi 34 - -
Concorde Hotel Kuala Lumpur 581 - -
Concorde Hotel Shah Alam 381 - -
Four Seasons Resort Langkawi (3)
91 50% -
Hard Rock Hotel Penang (3)
250 100% Freehold
The Lakehouse Cameron Highlands (1)
(2)
19 100% Leasehold
Four Seasons Maldives Private Island at Voavah (1)
7 - Leasehold
Four Seasons Resort Maldives at Kuda Huraa (1)
(2)
96 70% Leasehold
Four Seasons Resort Maldives at Landaa Giraavaru (1)
(2)
103 70% Leasehold
Gili Lankanfushi 45 - -
Holiday Inn Resort Kadooma Maldives (1)
(2)
160 70% Leasehold
InterContinental Maldives Maamunagau Resort (3)
81 70% -
Six Senses Laamu (1)
(2)
97 70% Leasehold
Four Seasons Resort Seychelles 67 - -
Four Seasons Seychelles at Desroches Island 71 - -
Concorde Hotel Singapore (1)
(2)
407 100% Leasehold
Four Seasons Hotel Singapore (1)
(2)
255 100% Freehold
Hilton Hotel Singapore (1)
(2)
421 100% Freehold
South Africa Four Seasons Hotel The Westcliff, Johannesburg 117 - -
Sri Lanka Weligama Bay Marriot Resort & Spa (3)
198 100% -
Tanzania Four Seasons Safari Lodge Serengeti (3)
77 70% -
Hard Rock Hotel Pattaya (1)
(2)
323 100% Freehold
Metropolitan by COMO, Bangkok (1)
(2)
169 100% Freehold
Point Yamu by COMO, Phuket 106 - -
The Boathouse, Phuket (1)
(3)
39 74% Freehold
DoubleTree by Hilton Hotel London - Ealing (3)
189 70% -
Hilton London Olympia (3)
405 80% -
United States Concorde Hotel New York (1)
(2)
123 100% Freehold
Vanuatu Holiday Inn Resort Vanuatu and Palms Casino (1)
(3)
148 100% Leasehold
Vietnam Four Seasons Resort The Nam Hai, Hoi An (3)
100 50% -
(1) Assets classified under PPE on the Group's balance sheet as disclosed in HPL's 2017 annual report
(2) Effective interest as disclosed in HPL's takeover circular in 2014
(3) As estimated by FPA
(4) Details of tenure as disclosed in HPL's 2017 annual report
Source: Company, respective hotel websites, FPA Financial
Singapore
Thailand
United Kingdom
Bhutan
Indonesia
Italy
Malaysia
Maldives
Seychelles

Property division
Under its property division, the Group is involved in property development in the geographical markets of Singapore,
Thailand, and in the UK through its joint ventures. At the same time, the Group also owns prime commercial and retail
properties in Singapore.
In Singapore, we note that units at the Group’s Tomlinson heights residential development were fully sold in 2018.
Currently, we note that there are no new launches, and the Group does not hold any completed properties for sale in
Singapore. Meanwhile, the Group owns office and shop units at Forum The Shopping Mall and HPL House. It also
owns 64 shop units at Concorde Shopping Mall and 7 shop units at Ming Arcade. The portfolio of the Group’s
investment properties is as summarized in Exhibit 3.
Exhibit 3: Group’s investment properties
In Bangkok, the Group’s condominium development, The Met, has won a multitude of design awards through the years.
We note that there are 11 remaining condominium units with an aggregate floor area of approximately 25,142 square
feet, in which the Group holds as completed properties for sale, as at the end of 2019. The list of the Group’s
completed properties held for sale is as summarized in Exhibit 4.
Exhibit 4: Group’s completed properties held for sale
In London, the Group has established its presence with four joint-venture freehold developments, namely – Burlington
Gate, Holland Park Villa, Paddington Square and Bankside Yards. The two residential schemes, Holland Park Villas
and Burlington Gate, had received continued sales in 2019. As of April 2020, we note that the two residential schemes
have been substantially sold, with 2 remaining apartments for Holland Park Villas and one unit remaining for Burlington
Gate. Meanwhile, the Group’s mixed-use projects – Bankside Yards and Paddington Square – are in early
development stages. We will further discuss these two development projects on page 11.
22 December 2020
6www.fpafinancial.com
Investment property Effective interest Title
7 shop units at 21 Cuscaden Road, Ming Arcade, Singapore 249720 100% Freehold
Office and shop units at 50 Cuscaden Road, Singapore 249724 (HPL House) 100% Freehold
Office and shop units at 583 Orchard Road, Singapore 238884 (Forum The Shopping Mall) 100% Freehold
64 shop units at 100 Orchard Road, Concorde Shopping Mall, Singapore 238840 100% Leasehold
Source: Company
Location Description Title
The Met, 125 South Sathorn Road, Bangkok, Thailand11 (2018: 12) condominium units with an aggregate floor area of
approximately 25,142 (2018: 27,220) square feetFreehold
Source: Company
FINANCIAL ANALYSIS
In this section, we will review the Group’s financial performance and provide our financial projections for 2020 and
2021.
(I) Financial review
Review of half-year 2020 results
For the half year ended 30 June 2020 (1H 2020), the Group reported a 47.8% year-on-year (y-o-y) decrease in
revenue to S$144.8 million, mainly due to lower contribution from its hotel division that was severely impacted by the
COVID-19 pandemic. Lower revenue was also recorded for the Group’s investment property division due to rental
relief provided to tenants. Cost of sales decreased by 27.7% y-o-y to S$148.4 million, resulting in a gross loss of
S$3.7 million compared to a gross profit of S$71.8 million a year ago.
Other operating income decreased by 87.6% y-o-y to S$1.6 million, mainly due to the absence of non-recurring
income that was received in 1H 2019.
During the period, lower administrative expenses of S$27.3 million and lower finance costs of S$16.5 million were
incurred. However, the declines were offset by an increase in other operating expenses to S$36.2 million from
S$13.7 million a year ago. The increase in other operating expenses was mainly due to higher net fair value loss in
investments of S$33.8 million compared to S$9.6 million a year ago.
Meanwhile, the Group’s share of results of associates & jointly controlled entities decreased to S$4.2 million from
S$15.5 million in 1H FY2019. This was contributed by losses incurred by hotel owning associates & jointly controlled
entities, which offset higher profit from the Group’s Holland Park Villas development in London.
As a result, the Group reported a loss before income tax of S$77.8 million compared to a profit of S$34.7 million a
year. Income tax expense of S$1.2 million was incurred in 1H 2020, thus resulting in an after-tax loss of S$79.0
million. This comprised a S$71.8 million loss attributable to shareholders of the company and a S$7.2 million loss
attributable to non-controlling interest.
During the period, the Group issued a S$7.0 million provision for distribution to perpetual capital securities holders.
Consequently, a loss attributable to ordinary shareholders of S$78.8 million was recorded after deducting for the
provision. Thus, the Group reported a loss per share of 15.12 cents for 1H 2020, based on S$78.8 million loss
attributable to ordinary shareholders. No dividends were distributed for the period.
The Group’s 1H 2020 financial results are summarised in Exhibit 5 on the next page.
22 December 2020
7www.fpafinancial.com

Exhibit 5: Group’s 1H 2020 financial results
Review of historical financials
Given the severe impact of the COVID-19 pandemic on the Group’s business, we will also review the Group’s historical
financials to gather an objective view on its performance. With reference to Exhibit 6, we note that revenue performance
had weakened in 2019. During the financial year, the Group’s revenue decreased to S$556.4 million from S$579.5 million
in 2018. The decrease was mainly due to lower contribution from the Group’s property division, given that the remaining
completed condominium units at Tomlinson Heights development in Singapore were fully sold in 2018. Revenue from
sales of completed properties held for sale decreased to S$1.3 million in 2019 compared to S$45.6 million in 2018.
Exhibit 6: Group’s 5-year historical financials
22 December 2020
8www.fpafinancial.com
2015 2016 2017* 2018 2019
Revenue 579,541 577,616 659,160 579,473 556,359
Gross profit 161,732 141,481 169,560 148,804 137,714
Net profit 90,731 108,559 179,457 124,686 54,688
Gross profit margin (%) 27.9% 24.5% 25.7% 25.7% 24.8%
Net profit margin (%) 15.7% 18.8% 27.2% 21.5% 9.8%
ROE (%) 5.3% 6.2% 9.6% 6.3% 2.7%
ROA (%) 2.8% 3.4% 5.5% 3.8% 1.6%
* Based on restated figures
Source: Company data, FPA Financial
[S$'000]
For year ended Dec 31
[S$'000] 1H 2020 1H 2019 y-o-y change
Revenue 144,763 277,151 -47.8%
Cost of sales (148,436) (205,351) -27.7%
Gross profit (3,673) 71,800 n/m
Other operating income 1,588 12,789 -87.6%
Administrative expenses (27,275) (32,679) -16.5%
Other operating expenses (36,193) (13,650) 165.2%
Finance costs (16,480) (19,051) -13.5%
Share of results of associates & jointly controlled entities 4,229 15,511 -72.7%
Profit before income tax (77,804) 34,720 n/m
Income tax expense (1,178) (15,794) -92.5%
Profit after income tax (78,982) 18,926 n/m
Attributable to:
Shareholders of the company (71,773) 16,585 n/m
Non-controlling interest (7,209) 2,341 n/m
(78,982) 18,926 n/m
Profit attributable to shareholders of the company (71,773) 16,585 n/m
Less: distribution to perpetual capital securities holders (6,987) (3,459) 102.0%
Profit attributable to ordinary shareholders of the company (78,760) 13,126 n/m
EPS (cents) (15.12) 2.51 -
n/m: not meaningful
Source: Company data, FPA Financial
Meanwhile, earnings performance also deteriorated in 2019. Net profit, or profit after income tax, decreased sharply
to S$54.7 million from S$124.7 million in 2018, as shown in Exhibit 6 on the previous page. This was largely
attributed to a lower share of results of associates & jointly controlled entities, which decreased to S$28.9 million from
S$92.8 million in 2018. The decrease in share of results was mainly due to lower profits from the Group’s Holland
Park Villas development in London. During the period, the Group’s 50% jointly controlled entity, GC Campden Hill
LLP, which is responsible for the Holland Park property development, recorded a sharp decline in net profit to S$34.6
million from S$146.6 million in 2018.
Overall, we note that the Group’s profitability has decreased since 2017, as reflected by lower gross and net profit
margins. Most notably, net profit margin for 2019 declined sharply to 9.8% from 21.5% in 2018. Further, we note that
other profitability metrics like return on equity (ROE) and return on assets (ROA) also suggest weaker profitability
after 2017. The Group’s ROE and ROA stood at 2.7% and 1.6% respectively in 2019, the lowest levels in the last 5
years.
(II) Capital management
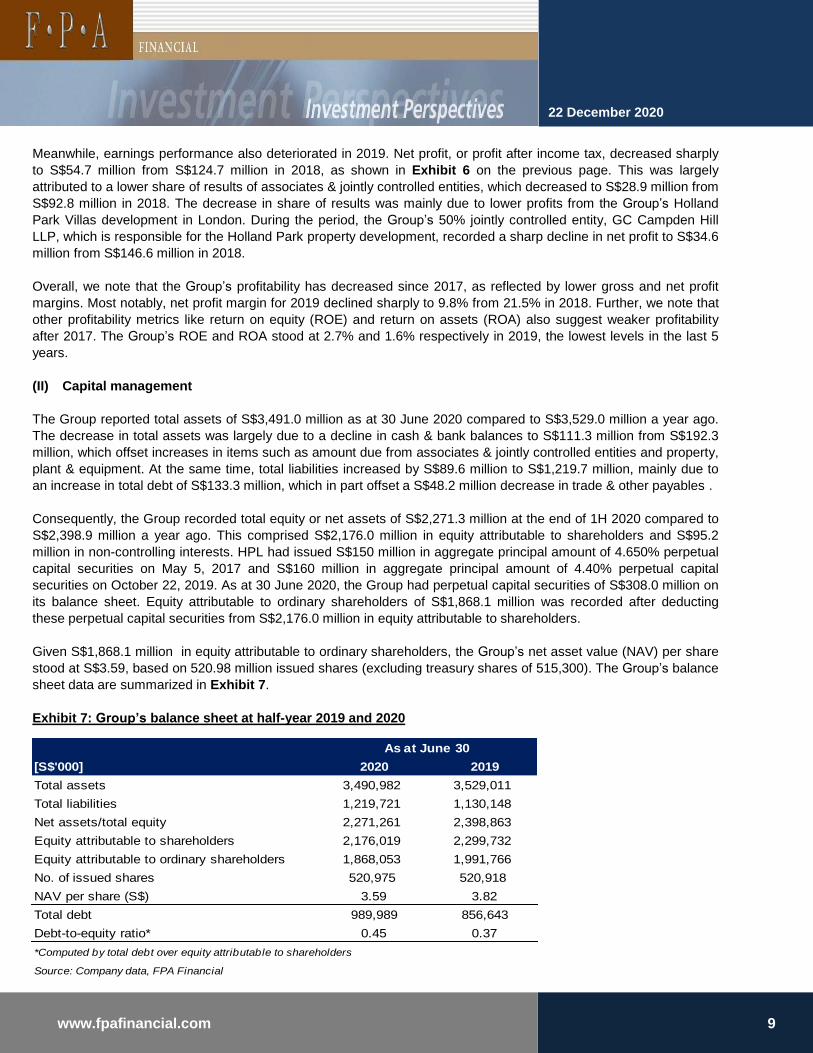
The Group reported total assets of S$3,491.0 million as at 30 June 2020 compared to S$3,529.0 million a year ago.
The decrease in total assets was largely due to a decline in cash & bank balances to S$111.3 million from S$192.3
million, which offset increases in items such as amount due from associates & jointly controlled entities and property,
plant & equipment. At the same time, total liabilities increased by S$89.6 million to S$1,219.7 million, mainly due to
an increase in total debt of S$133.3 million, which in part offset a S$48.2 million decrease in trade & other payables .
Consequently, the Group recorded total equity or net assets of S$2,271.3 million at the end of 1H 2020 compared to
S$2,398.9 million a year ago. This comprised S$2,176.0 million in equity attributable to shareholders and S$95.2
million in non-controlling interests. HPL had issued S$150 million in aggregate principal amount of 4.650% perpetual
capital securities on May 5, 2017 and S$160 million in aggregate principal amount of 4.40% perpetual capital
securities on October 22, 2019. As at 30 June 2020, the Group had perpetual capital securities of S$308.0 million on
its balance sheet. Equity attributable to ordinary shareholders of S$1,868.1 million was recorded after deducting
these perpetual capital securities from S$2,176.0 million in equity attributable to shareholders.
Given S$1,868.1 million in equity attributable to ordinary shareholders, the Group’s net asset value (NAV) per share
stood at S$3.59, based on 520.98 million issued shares (excluding treasury shares of 515,300). The Group’s balance
sheet data are summarized in Exhibit 7.
Exhibit 7: Group’s balance sheet at half-year 2019 and 2020
22 December 2020
9www.fpafinancial.com
2020 2019
Total assets 3,490,982 3,529,011
Total liabilities 1,219,721 1,130,148
Net assets/total equity 2,271,261 2,398,863
Equity attributable to shareholders 2,176,019 2,299,732
Equity attributable to ordinary shareholders 1,868,053 1,991,766
No. of issued shares 520,975 520,918
NAV per share (S$) 3.59 3.82
Total debt 989,989 856,643
Debt-to-equity ratio* 0.45 0.37
*Computed by total debt over equity attributable to shareholders
Source: Company data, FPA Financial
[S$'000]
As at June 30
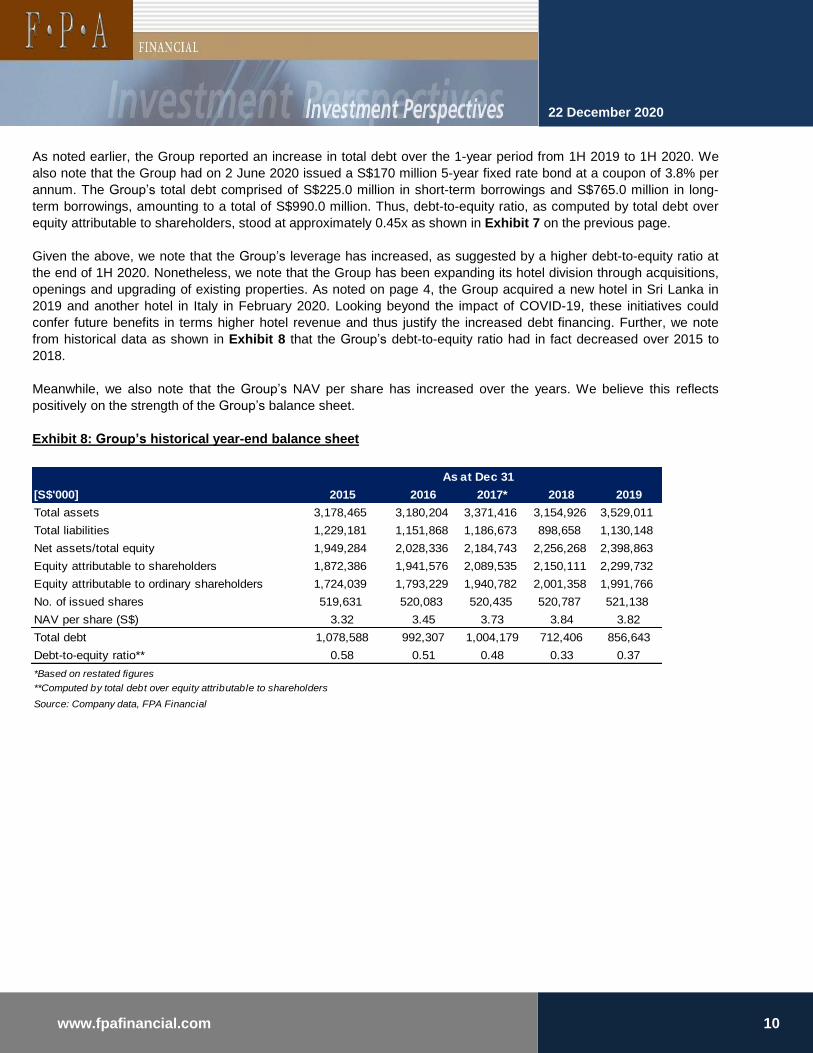
As noted earlier, the Group reported an increase in total debt over the 1-year period from 1H 2019 to 1H 2020. We
also note that the Group had on 2 June 2020 issued a S$170 million 5-year fixed rate bond at a coupon of 3.8% per
annum. The Group’s total debt comprised of S$225.0 million in short-term borrowings and S$765.0 million in long-
term borrowings, amounting to a total of S$990.0 million. Thus, debt-to-equity ratio, as computed by total debt over
equity attributable to shareholders, stood at approximately 0.45x as shown in Exhibit 7 on the previous page.
Given the above, we note that the Group’s leverage has increased, as suggested by a higher debt-to-equity ratio at
the end of 1H 2020. Nonetheless, we note that the Group has been expanding its hotel division through acquisitions,
openings and upgrading of existing properties. As noted on page 4, the Group acquired a new hotel in Sri Lanka in
2019 and another hotel in Italy in February 2020. Looking beyond the impact of COVID-19, these initiatives could
confer future benefits in terms higher hotel revenue and thus justify the increased debt financing. Further, we note
from historical data as shown in Exhibit 8 that the Group’s debt-to-equity ratio had in fact decreased over 2015 to
2018.
Meanwhile, we also note that the Group’s NAV per share has increased over the years. We believe this reflects
positively on the strength of the Group’s balance sheet.
Exhibit 8: Group’s historical year-end balance sheet
22 December 2020
10www.fpafinancial.com
2015 2016 2017* 2018 2019
Total assets 3,178,465 3,180,204 3,371,416 3,154,926 3,529,011
Total liabilities 1,229,181 1,151,868 1,186,673 898,658 1,130,148
Net assets/total equity 1,949,284 2,028,336 2,184,743 2,256,268 2,398,863
Equity attributable to shareholders 1,872,386 1,941,576 2,089,535 2,150,111 2,299,732
Equity attributable to ordinary shareholders 1,724,039 1,793,229 1,940,782 2,001,358 1,991,766
No. of issued shares 519,631 520,083 520,435 520,787 521,138
NAV per share (S$) 3.32 3.45 3.73 3.84 3.82
Total debt 1,078,588 992,307 1,004,179 712,406 856,643
Debt-to-equity ratio** 0.58 0.51 0.48 0.33 0.37
*Based on restated figures
**Computed by total debt over equity attributable to shareholders
Source: Company data, FPA Financial
[S$'000]
As at Dec 31
POTENTIAL CATALYSTS
As noted on page 6, the Group joint venture projects in London comprise of 2 residential schemes and 2 mixed-used
development projects. We noted that the two residential schemes have been substantially sold as of April 2020.
Looking ahead, we identify the Group’s mixed-use projects – Bankside Yards and Paddington Square – as potential
catalysts that could underpin revenue and earnings moving forward. We will now provide the details of the projects.
(I) Bankside Yards
Bankside Yards is a mixed-use development project that is located in Southbank, London. HPL had in March 2015, through
its indirect wholly-owned subsidiary, HPL (Southbank) Pte Ltd, acquired a 30% interest in Bankside Quarter (Jersey)
Limited (BQJ) to purchase two Jersey holding companies namely, CEREP Ludgate House Limited and CEREP Sampson
House Limited. The two holding companies respectively own the freehold interests in two properties located in Bankside;
Ludgate House and Sampson House, which were acquired by BQJ at a sales consideration of £308 million. The two
properties comprise Ludgate House and Sampson House, two existing office buildings, and Falcon Point, a neighbouring
residential building let on long-leasehold interest to the London Borough of Southwark.
Situated in Central London, the Bankside Yards project site is on the south side of the River Thames, opposite the City of
London and equidistant from London Bridge. The development will create a new neighbourhood for Bankside and will
reconnect space between the Tate Modern Gallery and Blackfriars station. The scheme will provide high quality residential
apartments, premium commercial office accommodation, retail and a luxury hotel as well as culture and new public open
space around fourteen historic railway arches.
The project site is currently being developed in phases, with sections of the Western part of the site being progressed first.
Demolition of the old buildings on the site have been completed in late 2019. In early June 2020, HPL’s management noted
that there are ongoing discussions with several large institutions on pre let and the development will be phased in tandem
with market conditions
(II) Paddington Square
Paddington Square is a mixed-use development located in Paddington, London. HPL had in October 2014, through its
wholly-owned subsidiary HPL (Paddington) Pte Ltd (HPL Paddington), acquired the property through a joint venture with
Anchorage View Pte Ltd at a sales consideration of £111 million. A joint venture company, Great Western Enterprises
Limited, was established for the purposes of undertaking the joint venture. The Group holds a 70% effective interest in the
joint venture company through HPL Paddington.
Situated in the heart of Paddington, the property site, formerly the Royal Mail Delivery Offices, is adjacent to the main
entrance of Paddington Railway and is bounded by London Street to the west, Winsland Street to the north and Praed
Street to the south. The development in expected to be completed in 2022 and will offer 360,000 square feet of high-tech
headquarters office space, four tiers of curated retail, 1.35 acres of comprehensive public realm improvements and West
London’s highest rooftop bar and dining experience, with views across the City skyline and Hyde Park. HPL’s
management had in June 2020 noted that the development has continued to receive good pre let interests.
22 December 2020
11www.fpafinancial.com

FINANCIAL PROJECTIONS
In this section, we provide our projections for the Group’s revenue, earnings and dividends.
(I) Revenue projection
We first review the Group’s revenue breakdown in terms of the individual business segments. We note that hotel
revenue has been contributing significantly to the Group’s total revenue recently, making up nearly 95% of total
revenue in 2019, as shown in Exhibit 9.
Exhibit 9: Breakdown of the Group’s revenue by business segment
We also note from Exhibit 9 that rental income typically makes up 5% of total revenue. The proportion for the sale of
completed properties held for sale dropped to 0.2% in 2019 from 7.9% in 2018, given that the remaining completed
condominium units at Tomlinson Heights development in Singapore were fully sold in 2018. While the Group has 11
remaining condominium units at The Met in Bangkok, we note that sales appears to have stagnated. We would assume
that there would be no unit sales for the project in 2020 and 2021, and in turn zero revenue contribution from property
sales. Lastly, we note that the proportion for management fee has been relatively stable and was 0.3% in 2019.
Given the above, we will estimate a weighted change in total revenue based on the expected change in revenue for
hotel revenue, rental income and management fee. We would assume the allocated weightings for hotel revenue,
rental income and management fee to be 95.0%, 4.8% and 0.2% respectively. This will apply to our revenue
projections for 2020 and 2021.
22 December 2020
12www.fpafinancial.com
S$'000 % of total S$'000 % of total
Sales of completed properties held for sale 1,320 0.2% 45,643 7.9%
Hotel revenue 526,760 94.7% 505,253 87.2%
Rental income 26,592 4.8% 26,397 4.6%
Management fee 1,687 0.3% 2,180 0.4%
Total 556,359 100.0% 579,473 100.0%
Source: Company, FPA Financial
2019 2018
Revenue breakdown
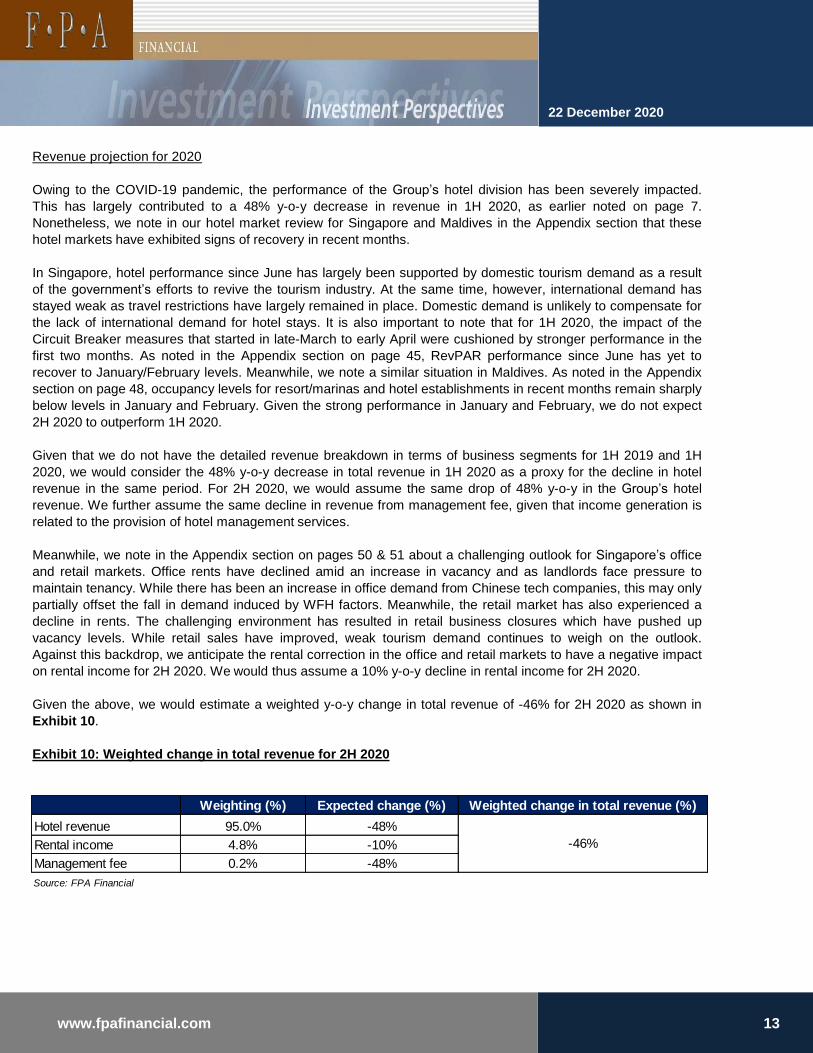
Revenue projection for 2020
Owing to the COVID-19 pandemic, the performance of the Group’s hotel division has been severely impacted.
This has largely contributed to a 48% y-o-y decrease in revenue in 1H 2020, as earlier noted on page 7.
Nonetheless, we note in our hotel market review for Singapore and Maldives in the Appendix section that these
hotel markets have exhibited signs of recovery in recent months.
In Singapore, hotel performance since June has largely been supported by domestic tourism demand as a result
of the government’s efforts to revive the tourism industry. At the same time, however, international demand has
stayed weak as travel restrictions have largely remained in place. Domestic demand is unlikely to compensate for
the lack of international demand for hotel stays. It is also important to note that for 1H 2020, the impact of the
Circuit Breaker measures that started in late-March to early April were cushioned by stronger performance in the
first two months. As noted in the Appendix section on page 45, RevPAR performance since June has yet to
recover to January/February levels. Meanwhile, we note a similar situation in Maldives. As noted in the Appendix
section on page 48, occupancy levels for resort/marinas and hotel establishments in recent months remain sharply
below levels in January and February. Given the strong performance in January and February, we do not expect
2H 2020 to outperform 1H 2020.
Given that we do not have the detailed revenue breakdown in terms of business segments for 1H 2019 and 1H
2020, we would consider the 48% y-o-y decrease in total revenue in 1H 2020 as a proxy for the decline in hotel
revenue in the same period. For 2H 2020, we would assume the same drop of 48% y-o-y in the Group’s hotel
revenue. We further assume the same decline in revenue from management fee, given that income generation is
related to the provision of hotel management services.
Meanwhile, we note in the Appendix section on pages 50 & 51 about a challenging outlook for Singapore’s office
and retail markets. Office rents have declined amid an increase in vacancy and as landlords face pressure to
maintain tenancy. While there has been an increase in office demand from Chinese tech companies, this may only
partially offset the fall in demand induced by WFH factors. Meanwhile, the retail market has also experienced a
decline in rents. The challenging environment has resulted in retail business closures which have pushed up
vacancy levels. While retail sales have improved, weak tourism demand continues to weigh on the outlook.
Against this backdrop, we anticipate the rental correction in the office and retail markets to have a negative impact
on rental income for 2H 2020. We would thus assume a 10% y-o-y decline in rental income for 2H 2020.
Given the above, we would estimate a weighted y-o-y change in total revenue of -46% for 2H 2020 as shown in
Exhibit 10.
Exhibit 10: Weighted change in total revenue for 2H 2020
22 December 2020
13www.fpafinancial.com
Weighting (%) Expected change (%) Weighted change in total revenue (%)
Hotel revenue 95.0% -48%
Rental income 4.8% -10%
Management fee 0.2% -48%
Source: FPA Financial
-46%

Given a total revenue of S$279.2 million for 2H 2019, we project the total revenue for 2H 2020 to be S$150.8
million = [54% x S$279.2 million], as shown in Exhibit 11.
Exhibit 11: Projected total revenue for 2H 2020
Consequently, the projected total revenue for full-year 2020 would amount to S$295.5 million, as shown in
Exhibit 12. This would imply a 47% y-o-y revenue decline for full-year 2020.
Exhibit 12: Projected total revenue for full-year 2020
Revenue projection for 2021
We note that the availability of vaccine treatments could provide optimism about a recovery in international
travel, and in turn hotel market performance in 2021. However, we are of the view that international travel would
remain weak in 2021. As it stands, health concerns in US and Europe remain elevated due to high daily
infection numbers, albeit the rollout of vaccine treatments. Further, a new strain of coronavirus has recently
been detected in the UK and concerns have surfaced on the spread of the new strain to other parts of the world.
Given the above, we expect border controls to remain in place for many parts of the world going forward. The
main concern is that it could take a few years for international travel to fully recover. The speed at which
travel restrictions are lifted could vary across different countries. In the case of Singapore, the government
has announced that vaccines are expected to be made widely available by Q3 2021. In addition, people may
still be apprehensive about travelling abroad. As a result, it is highly unlikely that hotel markets would recover
to pre-COVID levels in 2021. Given the above consideration, we would assume the Group’s hotel revenue to
recover by 20% in 2021. We would also assume the same increase in management fee revenue.
Meanwhile, we anticipate a modest recovery in both office and retail rents in Singapore in 2021. On the office
market, we are likely to see some improvement in vacancy as more people return to the workplace once the
nation enters into ‘Phase 3’ on December 28. This in conjunction with increasing demand from Chinese tech
companies could help to support a modest upward revision in office rents. As for retail, the outlook largely
depends on the speed of recovery in international travel. Overall, we would assume a modest 5% increase in
the Group’s rental income for 2021.
Nevertheless, we are positive on the longer-term outlook for the Group’s business performance. As border
restrictions are lifted, we expect the Group’s exposure to popular tourist destinations like Maldives and Bali to
bode well for the recovery in its hotel division.
22 December 2020
14www.fpafinancial.com
2019 2020 y-o-y change 2019 2020F y-o-y change
Total revenue 277,151 144,763 -48% 279,208 150,772 -46%
Source: Company, FPA Financial
First half of year Second half of year
S$'000
Period Total revenue (S$'000) y-o-y change
1H 2020 144,763 -48%
2H 2020F 150,772 -46%
Full-year 2020F 295,535 -47%
Source: FPA Financial
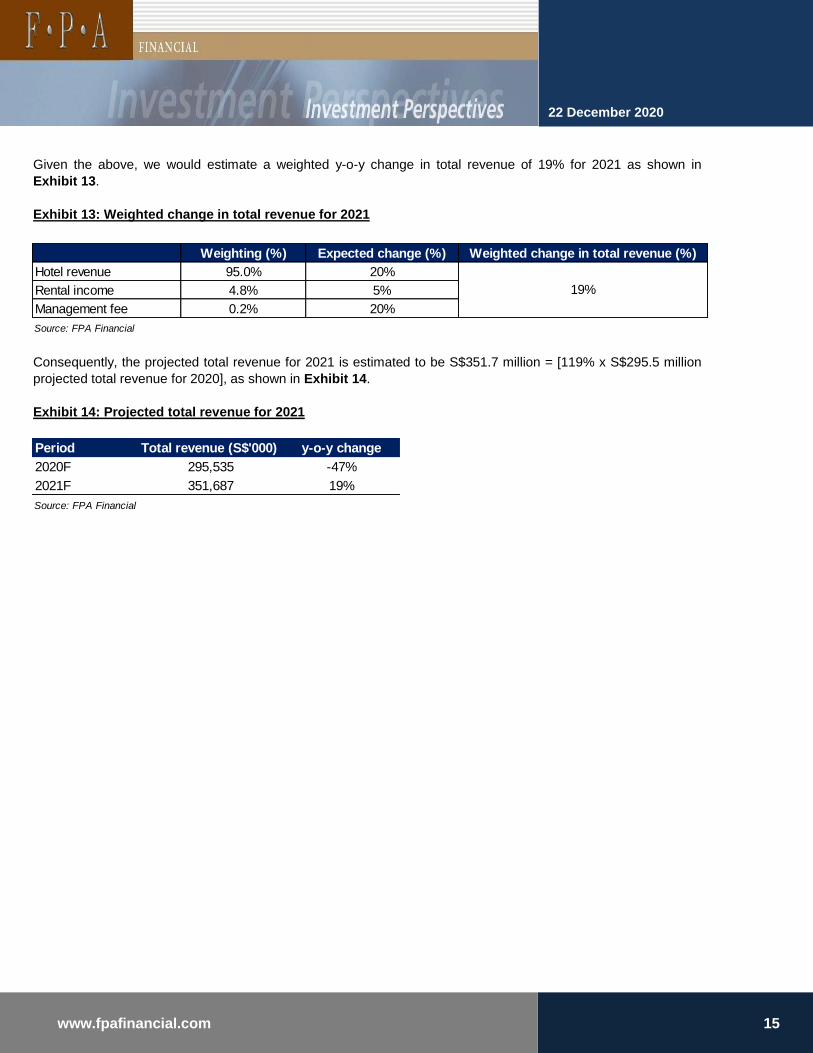
Given the above, we would estimate a weighted y-o-y change in total revenue of 19% for 2021 as shown in
Exhibit 13.
Exhibit 13: Weighted change in total revenue for 2021
Consequently, the projected total revenue for 2021 is estimated to be S$351.7 million = [119% x S$295.5 million
projected total revenue for 2020], as shown in Exhibit 14.
Exhibit 14: Projected total revenue for 2021
22 December 2020
15www.fpafinancial.com
Weighting (%) Expected change (%) Weighted change in total revenue (%)
Hotel revenue 95.0% 20%
Rental income 4.8% 5%
Management fee 0.2% 20%
Source: FPA Financial
19%
Period Total revenue (S$'000) y-o-y change
2020F 295,535 -47%
2021F 351,687 19%
Source: FPA Financial

(II) Earnings projection
Given our projected revenue figure for 2020 and 2021, we now estimate the Group’s earnings for each period. To
do so, we will estimate the Group’s cost of sales, expenses, share of profits of associates and joint ventures, and
other components such as other operating income.
Cost of sales
We would estimate cost of sales based on the expected gross margin for the period. With reference to Exhibit 15,
we note that the Group’s gross margin decreased in 2019 to 24.8% from 25.7% in 2018, after remaining stable
over 2017-2018.
Exhibit 15: Gross margin over the years
In our projection, we would assume a gross margin of 25.7% for 2020 and 2021, based on the average over 2015
to 2019. Thus, the estimated gross profit would be S$67.3 million and S$80.1 million for 2020 and 2021
respectively, as shown in Exhibit 16.
Exhibit 16: Projected gross margin and gross profit for 2020 and 2021
Other operating income
As noted on page 7, other operating income decreased by 87.6% y-o-y to S$1.6 million in 1H 2020, mainly due to
the absence of non-recurring income that was received in 1H 2019. For 2H 2020, we would assume the same
amount of S$1.6 million. This would imply total other operating income of S$3.2 million in 2020. We would also
assume this figure for 2021.
22 December 2020
16www.fpafinancial.com
2015 2016 2017 2018 2019
S$'000 S$'000 S$'000 S$'000 S$'000
Revenue 579,541 577,616 659,160 579,473 556,359
Gross profit 161,732 141,481 169,560 148,804 137,714
Gross margin 27.9% 24.5% 25.7% 25.7% 24.8%
Source: Company, FPA Financial
2020 forecast 2021 forecast
S$'000 S$'000
Revenue 295,535 351,687
Gross profit 75,952 90,384
Gross margin 25.7% 25.7%
Source: FPA Financial
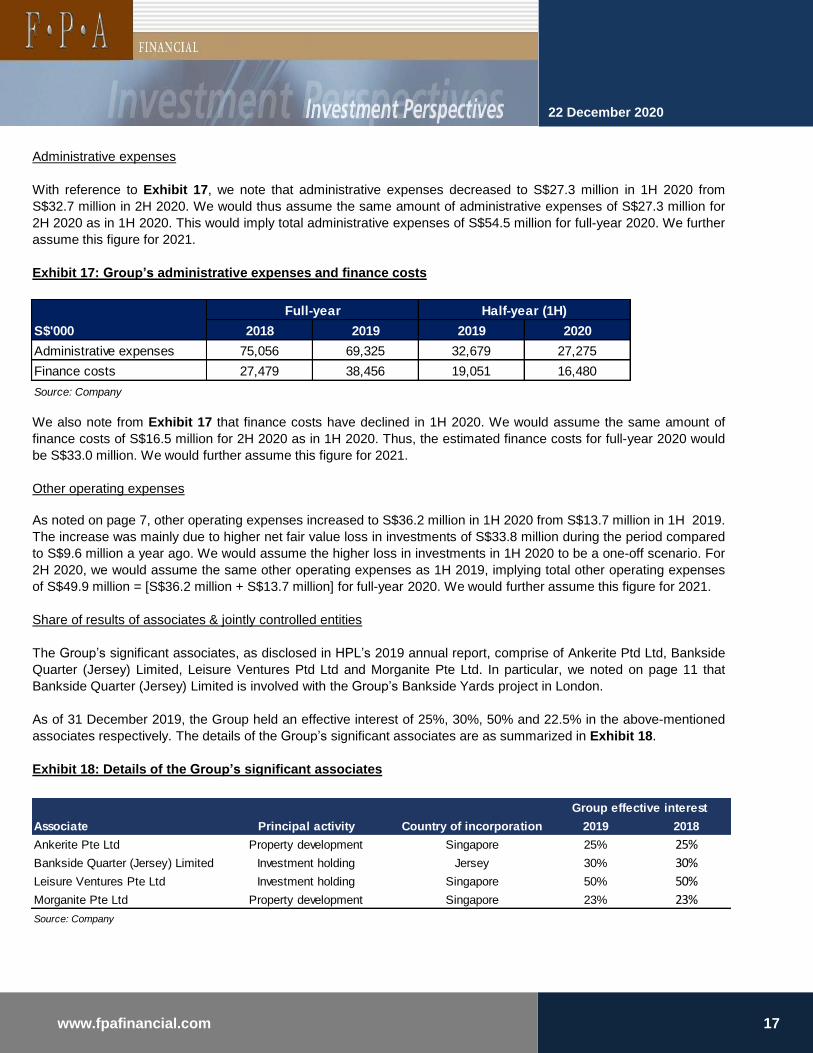
Administrative expenses
With reference to Exhibit 17, we note that administrative expenses decreased to S$27.3 million in 1H 2020 from
S$32.7 million in 2H 2020. We would thus assume the same amount of administrative expenses of S$27.3 million for
2H 2020 as in 1H 2020. This would imply total administrative expenses of S$54.5 million for full-year 2020. We further
assume this figure for 2021.
Exhibit 17: Group’s administrative expenses and finance costs
We also note from Exhibit 17 that finance costs have declined in 1H 2020. We would assume the same amount of
finance costs of S$16.5 million for 2H 2020 as in 1H 2020. Thus, the estimated finance costs for full-year 2020 would
be S$33.0 million. We would further assume this figure for 2021.
Other operating expenses
As noted on page 7, other operating expenses increased to S$36.2 million in 1H 2020 from S$13.7 million in 1H 2019.
The increase was mainly due to higher net fair value loss in investments of S$33.8 million during the period compared
to S$9.6 million a year ago. We would assume the higher loss in investments in 1H 2020 to be a one-off scenario. For
2H 2020, we would assume the same other operating expenses as 1H 2019, implying total other operating expenses
of S$49.9 million = [S$36.2 million + S$13.7 million] for full-year 2020. We would further assume this figure for 2021.
Share of results of associates & jointly controlled entities
The Group’s significant associates, as disclosed in HPL’s 2019 annual report, comprise of Ankerite Ptd Ltd, Bankside
Quarter (Jersey) Limited, Leisure Ventures Ptd Ltd and Morganite Pte Ltd. In particular, we noted on page 11 that
Bankside Quarter (Jersey) Limited is involved with the Group’s Bankside Yards project in London.
As of 31 December 2019, the Group held an effective interest of 25%, 30%, 50% and 22.5% in the above-mentioned
associates respectively. The details of the Group’s significant associates are as summarized in Exhibit 18.
Exhibit 18: Details of the Group’s significant associates
22 December 2020
17www.fpafinancial.com
2019 2018
Ankerite Pte Ltd Property development Singapore 25% 25%
Bankside Quarter (Jersey) Limited Investment holding Jersey 30% 30%
Leisure Ventures Pte Ltd Investment holding Singapore 50% 50%
Morganite Pte Ltd Property development Singapore 23% 23%
Source: Company
Associate Principal activity Country of incorporation
Group effective interest
2018 2019 2019 2020
Administrative expenses 75,056 69,325 32,679 27,275
Finance costs 27,479 38,456 19,051 16,480
Source: Company
S$'000
Full-year Half-year (1H)
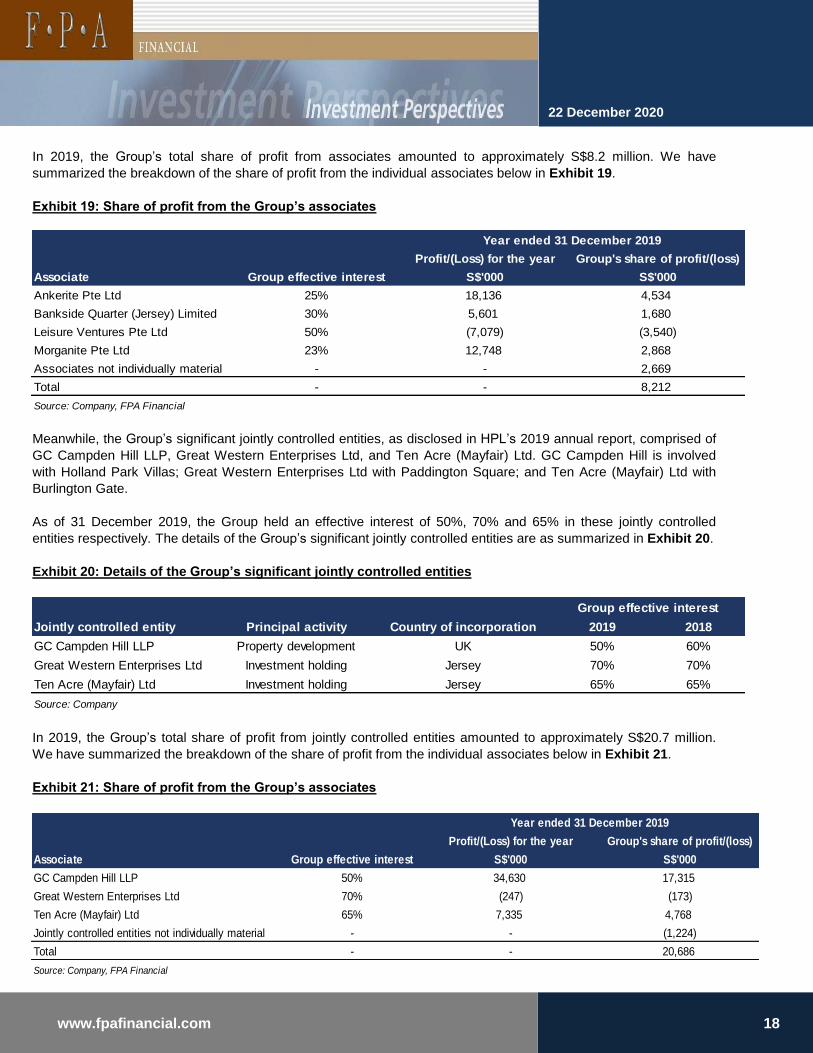
In 2019, the Group’s total share of profit from associates amounted to approximately S$8.2 million. We have
summarized the breakdown of the share of profit from the individual associates below in Exhibit 19.
Exhibit 19: Share of profit from the Group’s associates
Meanwhile, the Group’s significant jointly controlled entities, as disclosed in HPL’s 2019 annual report, comprised of
GC Campden Hill LLP, Great Western Enterprises Ltd, and Ten Acre (Mayfair) Ltd. GC Campden Hill is involved
with Holland Park Villas; Great Western Enterprises Ltd with Paddington Square; and Ten Acre (Mayfair) Ltd with
Burlington Gate.
As of 31 December 2019, the Group held an effective interest of 50%, 70% and 65% in these jointly controlled
entities respectively. The details of the Group’s significant jointly controlled entities are as summarized in Exhibit 20.
Exhibit 20: Details of the Group’s significant jointly controlled entities
In 2019, the Group’s total share of profit from jointly controlled entities amounted to approximately S$20.7 million.
We have summarized the breakdown of the share of profit from the individual associates below in Exhibit 21.
Exhibit 21: Share of profit from the Group’s associates
22 December 2020
18www.fpafinancial.com
Profit/(Loss) for the year Group's share of profit/(loss)
S$'000 S$'000
Ankerite Pte Ltd 25% 18,136 4,534
Bankside Quarter (Jersey) Limited 30% 5,601 1,680
Leisure Ventures Pte Ltd 50% (7,079) (3,540)
Morganite Pte Ltd 23% 12,748 2,868
Associates not individually material - - 2,669
Total - - 8,212
Source: Company, FPA Financial
Associate Group effective interest
Year ended 31 December 2019
2019 2018
GC Campden Hill LLP Property development UK 50% 60%
Great Western Enterprises Ltd Investment holding Jersey 70% 70%
Ten Acre (Mayfair) Ltd Investment holding Jersey 65% 65%
Source: Company
Jointly controlled entity Principal activity Country of incorporation
Group effective interest
Profit/(Loss) for the year Group's share of profit/(loss)
S$'000 S$'000
GC Campden Hill LLP 50% 34,630 17,315
Great Western Enterprises Ltd 70% (247) (173)
Ten Acre (Mayfair) Ltd 65% 7,335 4,768
Jointly controlled entities not individually material - - (1,224)
Total - - 20,686
Source: Company, FPA Financial
Associate Group effective interest
Year ended 31 December 2019

Given a share of profit of S$8.2 million and S$20.7 million from associates and jointly controlled entities
respectively, the Group recorded a share of results of associates & jointly controlled entities of S$28.9 million in
2019.
Focusing on 2020, we noted on page 7 that losses incurred by hotel owning associates & jointly controlled entities
had offset higher profit from the Group’s Holland Park Villas development in London. As a result, the Group’s
share of results of associates & jointly controlled entities decreased to S$4.2 million in 1H 2020 from S$15.5
million in 1H 2019.
For 2H 2020, we expect the Group to potentially record a lower share of results of associates & jointly controlled
entities. As we have noted on page 13, hotel performance across the Group’s geographical markets is expected to
remain weak. Thus, we anticipate lower share of profits from its hotel owning associates & jointly controlled
entities in 2H 2020.
In addition, we noted on page 11 that Burlington Gate and Holland Park Villas in London have been substantially
sold as of April 2020. Thus, we anticipate a lower share of profit from Ten Acre (Mayfair) Ltd and GC Campden
Hill LLP going forward. Further, we also noted that the Group’s mixed-use developments in London are not
expected for completion till 2022. Thus, we do not expect the Group to benefit materially from Great Western
Enterprises Ltd and Bankside Quarter (Jersey) Limited in the short term..
Given the above consideration, we would assume zero share of results of associates & jointly controlled entities in
2H 2020. This would imply a total share of profit of S$4.2 million for 2020. In view of a modest recovery in hotel
markets in 2021, we would assume a 20% increase which implies a total share of profit of S$5.0 million = [120% x
S$4.2 million] for the period.
22 December 2020
19www.fpafinancial.com

Net fair value gain in investment properties
We note that the Group revalues its investment properties on a yearly basis. The net fair value adjustments for the
investment properties are accounted for on the income statement at the end of the year. We note that the Group
had recorded a net fair value gain in investment properties of S$3.2 million and S$3.9 million in 2018 and 2019
respectively. However, owing to the impact of COVID-19, we anticipate that property valuations would have
declined. To account for this, we would assume no net fair value gain in investment properties for 2020 and 2021.
Based on the above projections for the Group, we derive a loss attributable to shareholders of S$42.1 million and
S$26.8 million for 2020 and 2021 respectively. We would assume no distribution to perpetual capital securities
holders. Thus, loss attributable to ordinary shareholders would be S$42.1 million and S$26.8 million for 2020 and
2021 respectively. Based on a weighted average number of issued units of 520.97 million, which we would
assume to remain unchanged in 2020 and 2021, a loss per share of 8.08 cents and 5.14 cents is estimated for
2020 and 2021 respectively. We have summarised our earnings projection in Exhibit 22 below.
Exhibit 22: Earnings projection for 2020 and 2021
22 December 2020
20www.fpafinancial.com
2020 forecast 2021 forecast
S$ million S$ million
Revenue 295.5 351.7
Cost of sales (219.6) (261.3)
Gross profit 75.9 90.4
Other operating income 3.2 3.2
Administrative expenses (54.5) (54.5)
Other operating expenses (49.9) (49.9)
Finance costs (33.0) (33.0)
Share of results of associates & jointly controlled entities 4.2 5.0
Profit before income tax and fair value changes in investment properties (54.1) (38.8)
Net fair value gain in investment properties - -
Profit before income tax (54.1) (38.8)
Income tax expense* (2.4) (2.4)
Profit for the year (56.5) (41.2)
Profit attributable to:
Shareholders of the company (42.1) (26.8)
Non-controlling interest** (14.4) (14.4)
(56.5) (41.2)
Profit attributable to shareholders of the company (42.1) (26.8)
Less: distribution to perpetual capital securities holders*** - -
Profit attributable to ordinary shareholders of the company (42.1) (26.8)
Weighted average no. of units in issue (million) 520.97 520.97
EPS (cents) (8.08) (5.14)
*Assumed to be the same in 2H 2020 as 1H 2020 at S$1.2 million, totaling S$2.4 million for 2020. Assume same figures for 2020 and 2021
**Assumed to be the same in 2H 2020 as 1H 2020 at -S$7.2 million, totaling -S$14.4 million for 2020. Assume same figures for 2020 and 2021
***Assumed no distribution due to impact of virus pandemic
Source: FPA Financial

(III) Dividends projection
We note that HPL paid out final dividends of 8.0 cents per share for 2019, following annual dividends of 10 cents
per share in 2017 and 2018. Owing to the impact of COVID-19, we would expect no dividends to be issued for
2020. For 2021, we anticipate that dividends of 4.0 cents per share could be paid out.
22 December 2020
21www.fpafinancial.com

VALUATION ANALYSIS
We will present our valuation analysis in three segments. First, we will provide a balance sheet review to determine if
HPL could be undervalued based on its NAV. Second, we will perform a peer comparison analysis to review how HPL
is faring against industry peers in terms of valuation metrics. Lastly, we will support our valuation analysis by
discussing the takeover offer for HPL in 2014.
(I) Balance sheet review
As noted on page 10, the Group has managed to maintain a relatively strong balance sheet position over the last few
years. It has managed to grow the value of its net assets steadily and maintain an appropriate level of financial
leverage. As at the end of 1H 2020, the Group’s NAV per share stood at S$3.59. At the current price of S$3.02, we
note that HPL is trading at a price-to-book (PB) multiple of 0.84x. In turn, HPL is trading at a slight 16% discount to
NAV at the current price.
Meanwhile, we note that the Group’s hotels are classified under Property, Plant & Equipment (PPE) on its balance
sheet, which are stated at cost or valuation, less accumulated depreciation and impairment loss. The Group’s PPE are
thus recorded at historical cost without revaluation, unlike for its investment properties which are revalued annually
and stated at fair value. Thus, we are inclined to believe that the value of the Group’s hotels may be understated on
the Group’s balance sheet. In turn, this would imply that HPL is undervalued based on the current book value.
Given the above, we will further estimate a revalued NAV by performing a revaluation of the Group’s hotels and a plot
of land in Phuket. We will focus our analysis on the assets as listed in Exhibit 23.
Exhibit 23: List of hotels to be revalued
While we do not have sufficient information to estimate a revaluation for the Group’s hotels in Bali and Pattaya, we
would be using the valuation of the hotels as at 31 March 2014, as disclosed in HPL’s takeover offer circular in 2014,
as a proxy.
We will provide an estimated revalued worth of the hotels by adopting a sales comparison approach. In other words,
we will estimate the value of the hotels based on the valuation of comparable assets that have been transacted
recently in these cities. We will compare the hotels in Exhibit 23 with the comparable assets based on comparison
factors such as location, age of property and land tenure. Based on our evaluation, we will determine a valuation for
the above listed hotels by adjusting the value of the comparable asset based on how each hotel fares against it in
terms of the comparison factors.
22 December 2020
22www.fpafinancial.com
Country Asset No. of rooms/villas
Four Seasons Resort Maldives at Kuda Huraa 96
Six Senses Laamu 97
Holiday Inn Resort Kadooma Maldives 160
Concorde Hotel Singapore 407
Four Seasons Hotel Singapore 255
Hilton Hotel Singapore 421
Thailand Metropolitan by COMO, Bangkok 169
The Boathouse, Phuket 38
Plot of land located at Rawai Sub-district, Phuket, Thailand 230,383 sqm
United States Concorde Hotel New York 123
Source: Company
Maldives
Singapore

Revaluation of the hotels in Singapore
To determine a valuation for the Group’s Hilton and Concorde hotels in Singapore, We note the valuation of
Mandarin Orchard Hotel in 2019 and will be using it as a comparable asset. We believe Mandarin Orchard
Hotel to be an appropriate comparison to the 2 hotels given its location and hotel category. Mandarin
Orchard Hotel is situated in the Orchard Road precinct and categorised within the upscale tier, similar to the
2 hotels. We note that Mandarin Orchard Hotel was valued at S$1,228 million as disclosed in the merger
circular for OUE Commercial Trust and OUE Hospitality REIT in Q3 2019 . Based on a total of 1,077 rooms,
the price per key for Mandarin Orchard would be S$1.14 million.
We first evaluate Hilton Singapore based on based on location, age and land tenure, as shown in Exhibit 24.
Exhibit 24: Evaluation of Hilton Singapore
In terms of location, Hilton Singapore and Mandarin Orchard are positioned in relatively close proximity in the
Orchard Road precinct. Thus, we would assume no change in valuation.
In terms of age, we note that Hilton Singapore opened close to a decade later compared to Mandarin
Orchard opening. To account for the age factor, we would assume a 5% valuation premium for Hilton
Singapore. Further, we believe Hilton Singapore’s freehold tenure compared to Mandarin Orchard’s 99-year
leasehold tenure would warrant a 15% valuation premium.
Given the above, the overall net effect for Hilton Singapore would be a 20% increase in valuation. Adjusting
for this, the total estimated price per key for Hilton Singapore in Q3 2019 market conditions would be S$1.37
million = [120% x S$1.14 million]
However, we would also need to consider the impact of COVID-19 on hotel valuations. For this, we would
assume a 20% decrease in current valuation. Consequently, the current value per key for Hilton Singapore is
estimated to be S$1.10 million = [80% x S$1.37 million].
Based on a total of 421 rooms, the total estimated valuation of Hilton Singapore would be S$463 million, as
shown in Exhibit 25.
Exhibit 25: Estimated valuation of Hilton Singapore
22 December 2020
23www.fpafinancial.com
Comparison factor Mandarin Orchard Hilton Singapore Valuation adjustment
Location Orchard Road Orchard Road -
Age Opened in 1971 Opened in 1980 5%
Land tenure 99-year leasehold
(from 1 July 1957)
Freehold 15%
Source: Company, OUE Commercial Trust, FPA Financial
Hotel name No. of rooms Price per key (S$ million) Valuation (S$ million)
Mandarin Orchard Hotel 1,077 1.14 1,228
Hilton Singapore 421 1.10 463
Source: OUE Commercial Trust, FPA Financial

We also evaluated Concorde Singapore based on location, age and land tenure, as shown in Exhibit 26.
Exhibit 26: Evaluation of Concorde Singapore
In terms of location, we note that Concorde Singapore is positioned closer to the end of the Orchard Road belt,
nearer to the Dhoby Ghaut area. Mandarin Orchard is more centrally-located within the Orchard Road belt.
Thus, we would assume a 5% valuation discount for Concorde Singapore due to its less prime location. In
terms of age, we note that Concorde Singapore opened later in 1984 and is a newer hotel compared to
Mandarin Orchard. To account for the age factor, we would assume a 5% valuation premium for Concorde
Singapore. Lastly, we note that both hotels have a 99-year leasehold tenure and would assume no change in
valuation.
Given the above, the overall net effect on Concorde Singapore’s price per key would be zero. Thus, the
estimated price per key for Concorde Singapore in Q3 2019 market conditions would be S$1.14 million.
To account for the impact of COVID-19, we would assume a 20% decrease in current valuation. Consequently,
the current value per key for Concorde Singapore is estimated to be S$0.91 million = [80% x S$1.14 million].
Based on a total of 407 rooms, the total estimated valuation of Concorde Singapore would be S$370 million,
as shown in Exhibit 27.
Exhibit 27: Estimated valuation of Concorde Singapore
22 December 2020
24www.fpafinancial.com
Comparison factor Mandarin Orchard Concorde Singapore Valuation adjustment
Location Orchard Road Orchard Road -5%
Age Opened in 1971 Opened in 1984 5%
Land tenure 99-year leasehold
(from 1 July 1957)
99-year leasehold
(from 17 August 1979)
-
Source: Company, OUE Commercial Trust, FPA Financial
Hotel name No. of rooms Price per key (S$ million) Valuation (S$ million)
Mandarin Orchard Hotel 1,077 1.14 1,228
Concorde Hotel Singapore 407 0.91 370
Source: OUE Commercial Trust, FPA Financial

In determining a valuation for the Group’s Four Seasons hotel in Singapore, we note the sale of Andaz Singapore in
October 2019 and will be using it as a comparable asset. Both Andaz Singapore and Four Seasons Singapore are
categorised as luxury hotels. We note that M+S Pte Ltd had sold Andaz Singapore to Hoi Hup Realty Pte Ltd at a
transaction price of S$475 million in October 2019. Based on a total of 342 rooms, the price per key for the hotel
would be S$1.39 million.
We now evaluate Four Seasons Singapore based on location, age and land tenure, as shown in Exhibit 28.
Exhibit 28: Evaluation of Four Seasons Singapore
In terms of location, Four Seasons Singapore is positioned in Orchard Road which is more prime compared to Fraser
Street where Andaz Singapore is located. We would thus assume a 10% valuation premium for Four Seasons
Singapore. Further, we believe Four Seasons Singapore’s freehold tenure compared to Mandarin Orchard’s 99-year
leasehold tenure would warrant a 15% valuation premium. However, we also note that Four Seasons Singapore is
more than 20 years older than Andaz Singapore. For this, we would assume a 20% valuation discount.
Given the above, the overall net effect for Four Seasons Singapore would be a 5% increase in valuation. Adjusting for
this, the total estimated price per key for Four Seasons Singapore in October 2019 market conditions would be
S$1.46 million = [105% x S$1.39 million]
To account for the impact of COVID-19, we would assume a 20% decrease in current valuation. Consequently, the
current value per key for Four Seasons Singapore is estimated to be S$1.17 million = [80% x S$1.46 million].
Based on a total of 255 rooms, the total estimated valuation of Four Seasons Singapore would be S$298 million, as
shown in Exhibit 29.
Exhibit 29: Estimated valuation of Four Seasons Singapore
22 December 2020
25www.fpafinancial.com
Comparison factor Andaz Singapore Four Seasons Singapore Valuation adjustment
Location Fraser Street Orchard Road 10%
Age Opened in 2017 Opened in 1994 -20%
Land tenure 99-year leasehold
(from 1 July 2011)
Freehold 15%
Source: Company, Hoi Hup Realty, Business Times, FPA Financial
Hotel name No. of rooms Price per key (S$ million) Valuation (S$ million)
Andaz Singapore 342 1.39 475
Four Seasons Singapore 255 1.17 298
Source: Hoi Hup Realty, Business Times, FPA Financial
Revaluation of the hotels and plot of land in Thailand
Revaluation of COMO Metropolitan hotel in Bangkok
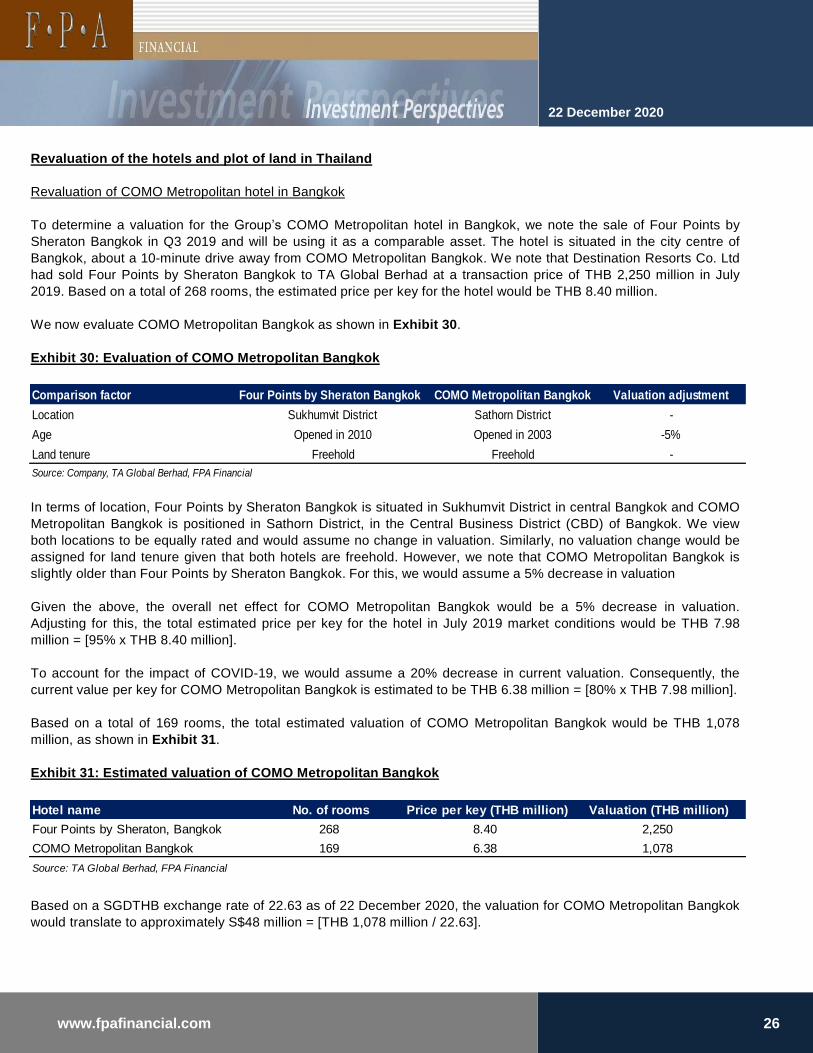
To determine a valuation for the Group’s COMO Metropolitan hotel in Bangkok, we note the sale of Four Points by
Sheraton Bangkok in Q3 2019 and will be using it as a comparable asset. The hotel is situated in the city centre of
Bangkok, about a 10-minute drive away from COMO Metropolitan Bangkok. We note that Destination Resorts Co. Ltd
had sold Four Points by Sheraton Bangkok to TA Global Berhad at a transaction price of THB 2,250 million in July
2019. Based on a total of 268 rooms, the estimated price per key for the hotel would be THB 8.40 million.
We now evaluate COMO Metropolitan Bangkok as shown in Exhibit 30.
Exhibit 30: Evaluation of COMO Metropolitan Bangkok
In terms of location, Four Points by Sheraton Bangkok is situated in Sukhumvit District in central Bangkok and COMO
Metropolitan Bangkok is positioned in Sathorn District, in the Central Business District (CBD) of Bangkok. We view
both locations to be equally rated and would assume no change in valuation. Similarly, no valuation change would be
assigned for land tenure given that both hotels are freehold. However, we note that COMO Metropolitan Bangkok is
slightly older than Four Points by Sheraton Bangkok. For this, we would assume a 5% decrease in valuation
Given the above, the overall net effect for COMO Metropolitan Bangkok would be a 5% decrease in valuation.
Adjusting for this, the total estimated price per key for the hotel in July 2019 market conditions would be THB 7.98
million = [95% x THB 8.40 million].
To account for the impact of COVID-19, we would assume a 20% decrease in current valuation. Consequently, the
current value per key for COMO Metropolitan Bangkok is estimated to be THB 6.38 million = [80% x THB 7.98 million].
Based on a total of 169 rooms, the total estimated valuation of COMO Metropolitan Bangkok would be THB 1,078
million, as shown in Exhibit 31.
Exhibit 31: Estimated valuation of COMO Metropolitan Bangkok
Based on a SGDTHB exchange rate of 22.63 as of 22 December 2020, the valuation for COMO Metropolitan Bangkok
would translate to approximately S$48 million = [THB 1,078 million / 22.63].
22 December 2020
26www.fpafinancial.com
Comparison factor Four Points by Sheraton Bangkok COMO Metropolitan Bangkok Valuation adjustment
Location Sukhumvit District Sathorn District -
Age Opened in 2010 Opened in 2003 -5%
Land tenure Freehold Freehold -
Source: Company, TA Global Berhad, FPA Financial
Hotel name No. of rooms Price per key (THB million) Valuation (THB million)
Four Points by Sheraton, Bangkok 268 8.40 2,250
COMO Metropolitan Bangkok 169 6.38 1,078
Source: TA Global Berhad, FPA Financial
Revaluation of The Boathouse in Phuket
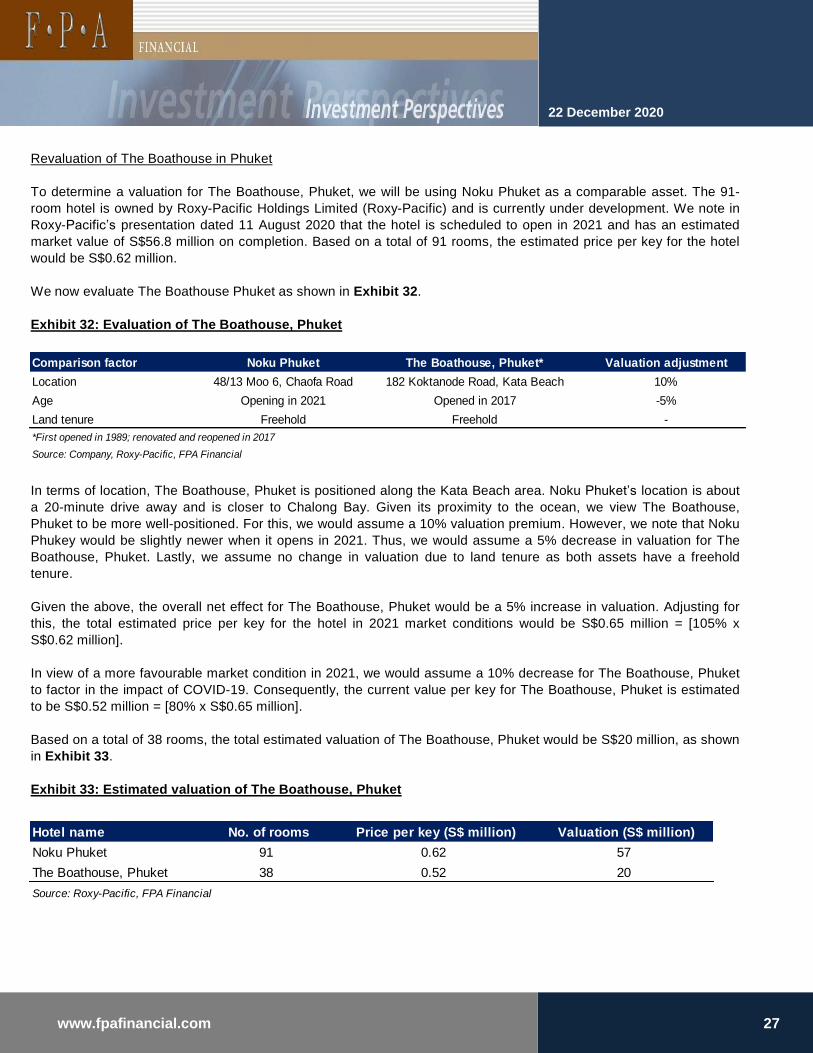
To determine a valuation for The Boathouse, Phuket, we will be using Noku Phuket as a comparable asset. The 91-
room hotel is owned by Roxy-Pacific Holdings Limited (Roxy-Pacific) and is currently under development. We note in
Roxy-Pacific’s presentation dated 11 August 2020 that the hotel is scheduled to open in 2021 and has an estimated
market value of S$56.8 million on completion. Based on a total of 91 rooms, the estimated price per key for the hotel
would be S$0.62 million.
We now evaluate The Boathouse Phuket as shown in Exhibit 32.
Exhibit 32: Evaluation of The Boathouse, Phuket
In terms of location, The Boathouse, Phuket is positioned along the Kata Beach area. Noku Phuket’s location is about
a 20-minute drive away and is closer to Chalong Bay. Given its proximity to the ocean, we view The Boathouse,
Phuket to be more well-positioned. For this, we would assume a 10% valuation premium. However, we note that Noku
Phukey would be slightly newer when it opens in 2021. Thus, we would assume a 5% decrease in valuation for The
Boathouse, Phuket. Lastly, we assume no change in valuation due to land tenure as both assets have a freehold
tenure.
Given the above, the overall net effect for The Boathouse, Phuket would be a 5% increase in valuation. Adjusting for
this, the total estimated price per key for the hotel in 2021 market conditions would be S$0.65 million = [105% x
S$0.62 million].
In view of a more favourable market condition in 2021, we would assume a 10% decrease for The Boathouse, Phuket
to factor in the impact of COVID-19. Consequently, the current value per key for The Boathouse, Phuket is estimated
to be S$0.52 million = [80% x S$0.65 million].
Based on a total of 38 rooms, the total estimated valuation of The Boathouse, Phuket would be S$20 million, as shown
in Exhibit 33.
Exhibit 33: Estimated valuation of The Boathouse, Phuket
22 December 2020
27www.fpafinancial.com
Comparison factor Noku Phuket The Boathouse, Phuket* Valuation adjustment
Location 48/13 Moo 6, Chaofa Road 182 Koktanode Road, Kata Beach 10%
Age Opening in 2021 Opened in 2017 -5%
Land tenure Freehold Freehold -
*First opened in 1989; renovated and reopened in 2017
Source: Company, Roxy-Pacific, FPA Financial
Hotel name No. of rooms Price per key (S$ million) Valuation (S$ million)
Noku Phuket 91 0.62 57
The Boathouse, Phuket 38 0.52 20
Source: Roxy-Pacific, FPA Financial

Revaluation of the plot of land in Phuket
To determine a valuation for the Group’s plot of land in Phuket (Phuket land), we note the valuation of land parcels in
the announcement of Mercurius Capital Investment Limited’s acquisition of a 50% stake in Grand Bay Hotel Co. Ltd
(Grand Bay) in June 2019. We note from the announcement that Grand Bay owns land parcels (Grand Bay land
parcels) at Ao Po, Phuket, held under 6 land title deeds, which measure about 35.31 rai, or 56,496 square metres
(sqm). We also note that the fair value of the land parcels as at 30 August 2018 was THB 564.96 million, based on the
market value basis. Thus, the estimated price per sqm for the land parcels would be THB 0.01 million.
In terms of location, we note that the Phuket land is situated in Rawai Sub-district, Muang Phuket District, Phuket
province in Thailand, which is about an hour’s drive apart from the Grand Bay land parcels. As noted above, the Grand
Bay land parcels are in Ao Po, a popular destination for yacht lovers given the presence of marinas. We also note that
the room rates for villas in the Ao Po area are more expensive compare to those in the Rawaii. Thus, we view the
Grand Bay land parcels to be more well-positioned and should fetch a higher value per sqm compared to the Phuket
land. That said, we would assume a 20% valuation discount for the Phuket land. This would imply an estimated price
per sqm of THB 0.008 million = [80% x THB 0.01 million] for the Phuket land in August 2018 market conditions.
To account for the impact of COVID-19, we would assume a 20% decrease in current valuation. Consequently, the
current price per sqm for the Phuket land is estimated to be S$0.0064 million = [80% x S$0.008 million].
Based on a total plot size of 240,383 sqm, the total estimated valuation of the Phuket land would be THB 1,474 million,
as shown in Exhibit 34.
Exhibit 34: Estimated valuation of the Phuket land
Based on a SGDTHB exchange rate of 22.63 as of 22 December 2020, the valuation for the Phuket land would
translate to approximately S$65 million = [THB 1,474 million / 22.63].
22 December 2020
28www.fpafinancial.com
Land Plot size (sqm) Price per sqm (THB million) Valuation (THB million)
Grand Bay land parcels 56,496 0.01 565
Phuket land 230,383 0.0064 1,474
Source: Mercurius Capital Investment Limited, FPA Financial

Revaluation of the hotels in Maldives
To determine a valuation for the Group’s Four Seasons Resort Maldives at Kuda Huraa (Kuda Huraa hotel), Six
Senses Laamu and Holiday Inn Resort Kandooma (Holiday Inn Kandooma), we note the sale of Finolhu Maldives in
April 2019 and will be using it as a comparable asset. We note from Jones Lang LaSalle (JLL) that German-based
Seaside Hotels & Resorts had acquired Finolhu Maldives from the Coastline Group of Companies for approximately
US$90 million in April 2019. This would be equivalent to an estimated price per key of US$0.72 million based on a
total of 125 villas.
Revaluation of the Kuda Huraa hotel
Our evaluation for the Kuda Huraa hotel is as shown in Exhibit 35.
Exhibit 35: Evaluation of the Kuda Huraa hotel
In terms of age, we note that the Kuda Huraa hotel is nearly 20 years older than Finolhu Maldives. For this, we would
assume a 10% drop in valuation. However, we also note that the room rate of the Kuda Huraa hotel is about 80%
higher compared to that of Finolhu Maldives. We believe this warrants a 10% valuation premium for the Kuda Huraa
hotel. Lastly, we would assume no change in valuation due to location and land tenure.
Given the above, the overall net effect for the Kuda Huraa hotel would be no change in valuation. Thus, the estimated
price per key for the hotel in April 2019 market conditions would be US$0.72 million.
To account for the impact of COVID-19, we would assume a 20% decrease in current valuation. Consequently, the
current value per key for the Kuda Huraa hotel is estimated to be US$0.58 million = [80% x US$0.72 million].
Based on a total of 96 villas, the total estimated valuation of Kuda Huraa hotel would be US$56 million, as shown in
Exhibit 36.
Exhibit 36: Estimated valuation of the Kuda Huraa hotel
Based on a USDSGD exchange rate of 1.33 as of 22 December 2020, the valuation of Kuda Huraa hotel would
translate to approximately S$74 million = [US$56 million x 1.33].
22 December 2020
29www.fpafinancial.com
Hotel name No. of villas Price per key (US$ million) Valuation (US$ million)
Finolhu Maldives 125 0.72 90
Kuda Huraa hotel 96 0.58 56
Source: JLL, FPA Financial
Comparison factor Finolhu Maldives Kuda Huraa hotel Valuation adjustment
Location Baa Atoll North Male Atoll -
Age Opened in 2016 Opened in 1998 -10%
Room rate* US$814 per night US$1,484 per night 10%
Land tenure - Leasehold -
*Room rates for 1-night stay from 31 Jan to 1 Feb 2021. Booking.com rates based on lowest-priced room for 1 adult.
Source: Company, JLL, Booking.com, FPA Financial

Revaluation of Six Senses Laamu
Our evaluation for Six Senses Laamu is as shown in Exhibit 37.
Exhibit 37: Evaluation of Six Senses Laamu
In terms of age, we note that Six Senses Laamu is slightly older than Finolhu Maldives by about 5 years. For this, we
would assume a 5% drop in valuation. However, we also note that the room rate of Six Senses Laamu is more than
double that of Finolhu Maldives. We believe this warrants a 15% valuation premium for Six Senses Laamu. Lastly, we
would assume no change in valuation due to location and land tenure.
Given the above, the overall net effect for Six Senses Laamu would be a 10% increase in valuation. Thus, the
estimated price per key for the hotel in April 2019 market conditions would be US$0.79 million = [110% x US$0.72
million]
To account for the impact of COVID-19, we would assume a 20% decrease in current valuation. Consequently, the
current value per key for Six Senses Laamu is estimated to be US$0.63 million = [80% x US$0.79 million].
Based on a total of 97 villas, the total estimated valuation of Six Senses Laamu would be US$61 million, as shown in
Exhibit 38.
Exhibit 38: Estimated valuation of Six Senses Laamu
Based on a USDSGD exchange rate of 1.33 as of 22 December 2020, the valuation of Six Senses Laamu would
translate to approximately S$81 million = [US$61 million x 1.33].
22 December 2020
30www.fpafinancial.com
Hotel name No. of villas Price per key (US$ million) Valuation (US$ million)
Finolhu Maldives 125 0.72 90
Six Senses Laamu 97 0.63 61
Source: JLL, FPA Financial
Comparison factor Finolhu Maldives Six Senses Laamu** Valuation adjustment
Location Baa Atoll Laamu Atoll -
Age Opened in 2016 Opened in 2011 -5%
Room rate* US$814 per night US$1,826 per night 15%
Land tenure - Leasehold -
*Room rates for 1-night stay from 31 Jan to 1 Feb 2021. Booking.com rates based on lowest-priced room for 1 adult.
**Average per night rate for 4-night stay from 29 Jan to 2 Feb
Source: Company, JLL, Booking.com, FPA Financial
Revaluation of Holiday Inn Kandooma
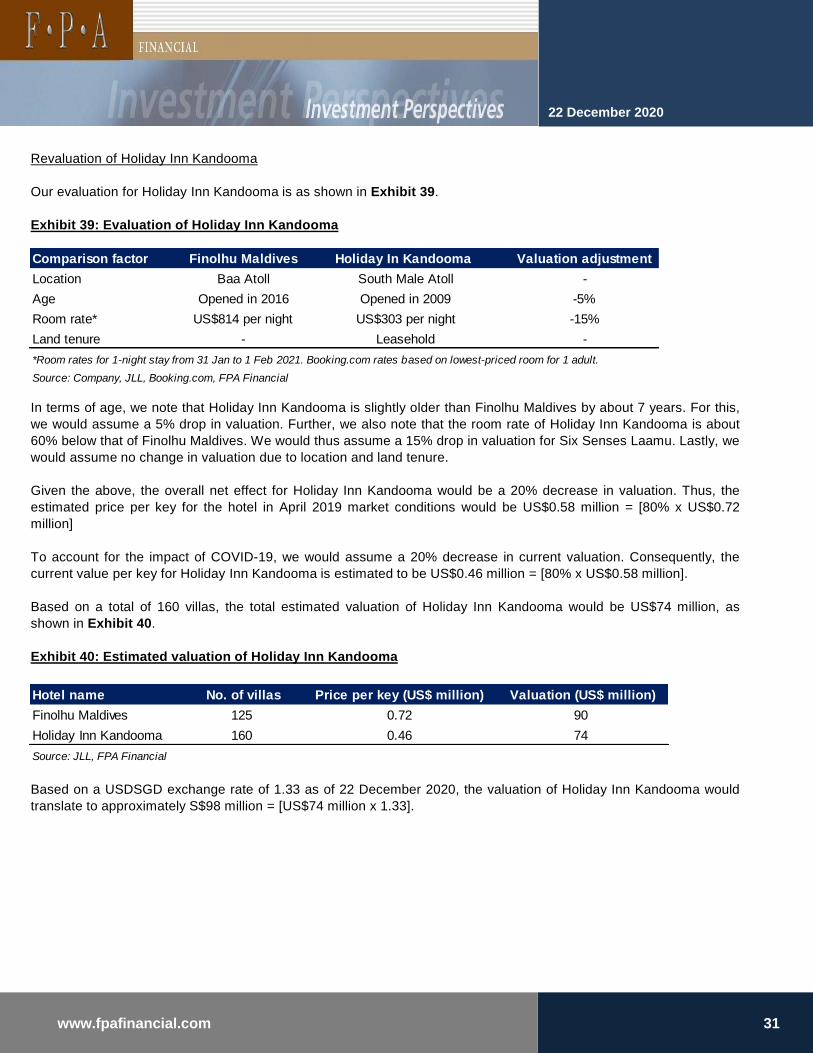
Our evaluation for Holiday Inn Kandooma is as shown in Exhibit 39.
Exhibit 39: Evaluation of Holiday Inn Kandooma
In terms of age, we note that Holiday Inn Kandooma is slightly older than Finolhu Maldives by about 7 years. For this,
we would assume a 5% drop in valuation. Further, we also note that the room rate of Holiday Inn Kandooma is about
60% below that of Finolhu Maldives. We would thus assume a 15% drop in valuation for Six Senses Laamu. Lastly, we
would assume no change in valuation due to location and land tenure.
Given the above, the overall net effect for Holiday Inn Kandooma would be a 20% decrease in valuation. Thus, the
estimated price per key for the hotel in April 2019 market conditions would be US$0.58 million = [80% x US$0.72
million]
To account for the impact of COVID-19, we would assume a 20% decrease in current valuation. Consequently, the
current value per key for Holiday Inn Kandooma is estimated to be US$0.46 million = [80% x US$0.58 million].
Based on a total of 160 villas, the total estimated valuation of Holiday Inn Kandooma would be US$74 million, as
shown in Exhibit 40.
Exhibit 40: Estimated valuation of Holiday Inn Kandooma
Based on a USDSGD exchange rate of 1.33 as of 22 December 2020, the valuation of Holiday Inn Kandooma would
translate to approximately S$98 million = [US$74 million x 1.33].
22 December 2020
31www.fpafinancial.com
Comparison factor Finolhu Maldives Holiday In Kandooma Valuation adjustment
Location Baa Atoll South Male Atoll -
Age Opened in 2016 Opened in 2009 -5%
Room rate* US$814 per night US$303 per night -15%
Land tenure - Leasehold -
*Room rates for 1-night stay from 31 Jan to 1 Feb 2021. Booking.com rates based on lowest-priced room for 1 adult.
Source: Company, JLL, Booking.com, FPA Financial
Hotel name No. of villas Price per key (US$ million) Valuation (US$ million)
Finolhu Maldives 125 0.72 90
Holiday Inn Kandooma 160 0.46 74
Source: JLL, FPA Financial

Revaluation of the hotel in New York
To determine a valuation for the Group’s Concorde Hotel New York (Concorde New York), we note the sale of W New
York - Union Square in October 2019 and will be using it as a comparable asset. We note that Marriot International
had purchased the hotel from Westbrook Partners for US$206 million or US$0.76 million per key, based on a total of
270 rooms.
We now evaluate Concorde New York as shown in Exhibit 41.
Exhibit 41: Evaluation of Concorde New York
In terms of location, both hotels are primely situated in Midtown Manhattan, the central portion of the New York City
borough of Manhattan. The hotels are about a 10-minute drive apart from one another. We note that Concorde New
York is positioned much closer to Fifth Avenue that is ranked as one of the most expensive streets in the world. Given
a more prime positioning, we would assume a 10% premium in valuation for Concorde New York. However, we note
that Concord New York is about 15 years older compared to W New York – Union Square. For this, we would assume
a 10% valuation decrease for Concorde New York. Further, we also note that Concorde New York has a lower tier
rating and room rate compared to W New York – Union Square. For this, we would assume a 15% discount to
valuation for Concorde New York. Lastly, we would assume no change in valuation due to land tenure.
Given the above, the overall net effect for Concorde New York would be a 15% decrease in valuation. Thus, the
estimated price per key for the hotel in October 2019 market conditions would be US$0.65 million = [85% x US$0.76
million]
To account for the impact of COVID-19, we would assume a 20% decrease in current valuation. Consequently, the
current value per key for Concorde New York is estimated to be US$0.52 million = [80% x US$0.65 million].
Based on a total of 123 rooms, the total estimated valuation of Concorde New York would be US$64 million, as shown
in Exhibit 42.
Exhibit 42: Estimated valuation of Concorde New York
Based on a USDSGD exchange rate of 1.33 as of 22 December 2020, the valuation of Concorde New York would
translate to approximately S$85 million = [US$64 million x 1.33].
22 December 2020
32www.fpafinancial.com
Hotel name No. of rooms Price per key (US$ million) Valuation (US$ million)
W New York - Union Square 270 0.76 206
Concorde Hotel New York 123 0.52 64
Source: Marriot International, FPA Financial
Comparison factor W New York - Union Square Concorde New York Valuation adjustment
Location 201 Park Avenue South 127 East 55th Street 10%
Age Opened in 2000 Opened in 1985 -10%
Room rate US$415 per night US$330 per night -15%
Land tenure - Freehold -
*Room rate for 1-night stay from 29 Jun to 30 Jun 2021. Booking.com rates based on lowest-priced room for 1 adult
Source: Company, Marriot International, FPA Financial

Impact of the revaluations
We have summarized the historical cost of the revalued hotels and Phuket land in Exhibit 43. The historical cost of
the assets are based on the disclosed figures in HPL’s 2016 annual report which are as at 31 December 2016. They
include the total value of the hotel buildings and the land on which they are situated. The figures do not account for
accumulated depreciation and any renovation & upgrade costs from 2017 onwards. Given the value of the assets
based on historical cost, we estimate a total valuation surplus of S$904 million.
Exhibit 43: Historical cost and valuation surplus of the revalued hotels
22 December 2020
33www.fpafinancial.com
Valuation Adjusted for effective interest
(%) S$ million S$ million S$ million S$ million
Hilton Singapore 100.0% 215 463 463 248
Concorde Hotel Singapore 100.0% 80 370 370 290
Four Seasons Hotel Singapore 100.0% 123 298 298 175
COMO Metropolitan Bangkok 100.0% 35 48 48 13
The Boathouse, Phuket 74.0% 24 20 15 -9
Phuket land 90.0% 84 65 59 -26
Four Seasons Resort Maldives at Kuda Huraa 70.0% 43 74 52 9
Six Senses Laamu 70.0% 94 81 57 -37
Holiday Inn Kandooma 70.0% 41 98 69 28
Concorde Hotel New York 100.0% 44 85 85 41
Four Seasons Resort Bali at Jimbaran Bay* 93.3% 94 149 139 45
Four Seasons Resort at Sayan* 100.0% 20 41 41 21
Four Seasons Private Estates at Jimbaran Bay* 100.0% 4 12 12 8
Hard Rock Hotel Bali* 100.0% 38 103 103 65
Hard Rock Hotel Pattaya* 100.0% 34 67 67 33
Total 973 1,974 1,877 904
*Revaluation is proxied by open market valuation as disclosed in HPL's takeover offer circular in 2014
** Based on revaluation after adjustment for effective interest
Source: Company, FPA Financial
Hotel name
Effective interest Total historical cost Valuation surplus**
Revaluation

Balance sheet adjustments
Given the above revaluation, we will include the total valuation surplus of S$904.0 million to the Group’s book value of
S$2,271.3 million to derive a revalued NAV (RNAV) of S$3,175.3 million, as shown in Exhibit 44. Consequently, the
RNAV attributable to ordinary shareholders would be S$2,772.1 million, after netting out non-controlling interests and
perpetual capital securities. This would translate to a RNAV per share of S$5.32, implying a PB ratio of 0.57x based
on the current price of S$3.02. Therefore, if the appreciation values of the hotels are taken into account, we estimate
that HPL’s P/B will be lower than 0.84x as noted on page 22.
Exhibit 44: Adjusted balance sheet
Further, given that the adjustments only consider several of the Group’s hotels, it could suggest that HPL’s P/B could
be lower than 0.57x if the valuation surplus of the Group’s other hotels are considered. While we do not have sufficient
information to revalue all the other hotels, we believe they could have appreciated in value as well. We are therefore
inclined to believe that HPL is undervalued at its current share price.
22 December 2020
34www.fpafinancial.com
S$ million
Book value/NAV 2,271.3
Add: valuation surplus 904.0
RNAV 3,175.3
Less: non-controlling interests (95.2)
RNAV attributable to shareholders 3,080.1
Less: perpetual capital securities (308.0)
RNAV attributable to ordinary shareholders 2,772.1
No. of issued shares (million) 520.97
RNAV per share 5.32
Price-to-book (x) 0.57
Source: Company, FPA Financial
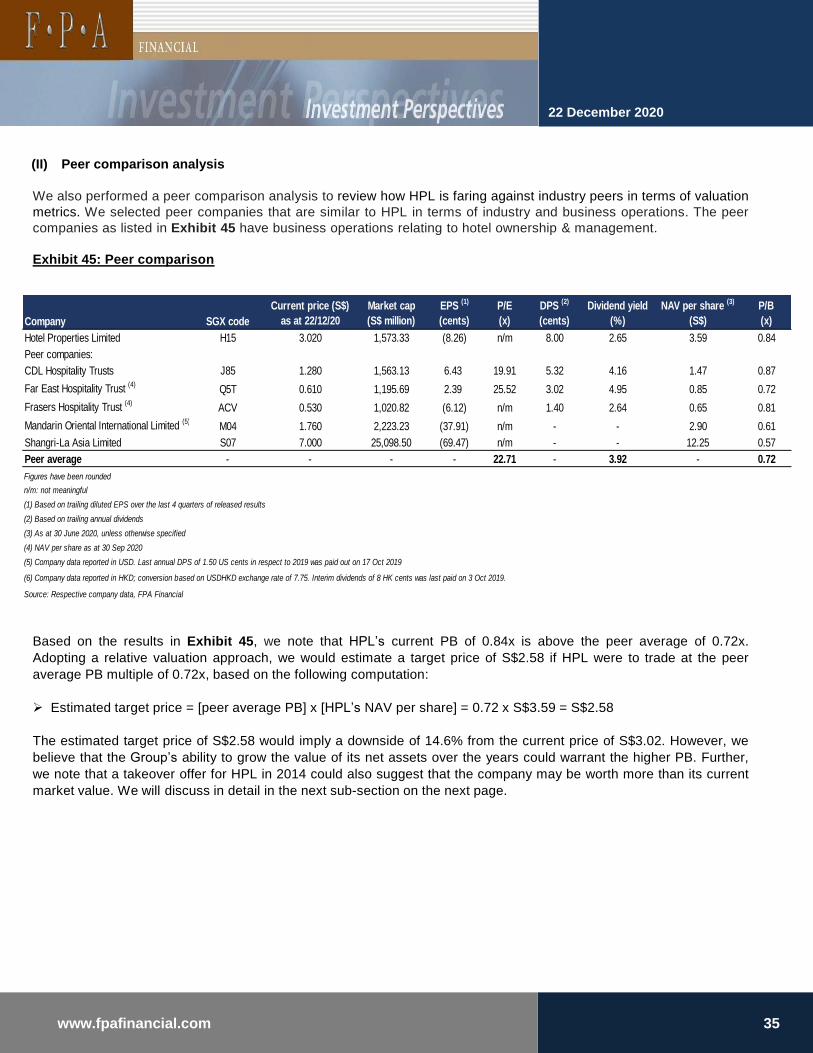
(II) Peer comparison analysis
We also performed a peer comparison analysis to review how HPL is faring against industry peers in terms of valuation
metrics. We selected peer companies that are similar to HPL in terms of industry and business operations. The peer
companies as listed in Exhibit 45 have business operations relating to hotel ownership & management.
Exhibit 45: Peer comparison
Based on the results in Exhibit 45, we note that HPL’s current PB of 0.84x is above the peer average of 0.72x.
Adopting a relative valuation approach, we would estimate a target price of S$2.58 if HPL were to trade at the peer
average PB multiple of 0.72x, based on the following computation:
➢ Estimated target price = [peer average PB] x [HPL’s NAV per share] = 0.72 x S$3.59 = S$2.58
The estimated target price of S$2.58 would imply a downside of 14.6% from the current price of S$3.02. However, we
believe that the Group’s ability to grow the value of its net assets over the years could warrant the higher PB. Further,
we note that a takeover offer for HPL in 2014 could also suggest that the company may be worth more than its current
market value. We will discuss in detail in the next sub-section on the next page.
22 December 2020
35www.fpafinancial.com
Company SGX code
Current price (S$)
as at 22/12/20
Market cap
(S$ million)
EPS (1)
(cents)
P/E
(x)
DPS (2)
(cents)
Dividend yield
(%)
NAV per share (3)
(S$)
P/B
(x)
Hotel Properties Limited H15 3.020 1,573.33 (8.26) n/m 8.00 2.65 3.59 0.84
Peer companies:
CDL Hospitality Trusts J85 1.280 1,563.13 6.43 19.91 5.32 4.16 1.47 0.87
Far East Hospitality Trust (4)
Q5T 0.610 1,195.69 2.39 25.52 3.02 4.95 0.85 0.72
Frasers Hospitality Trust (4)
ACV 0.530 1,020.82 (6.12) n/m 1.40 2.64 0.65 0.81
Mandarin Oriental International Limited (5)
M04 1.760 2,223.23 (37.91) n/m - - 2.90 0.61
Shangri-La Asia Limited S07 7.000 25,098.50 (69.47) n/m - - 12.25 0.57
Peer average - - - - 22.71 - 3.92 - 0.72
Figures have been rounded
n/m: not meaningful
(1) Based on trailing diluted EPS over the last 4 quarters of released results
(2) Based on trailing annual dividends
(3) As at 30 June 2020, unless otherwise specified
(4) NAV per share as at 30 Sep 2020
(5) Company data reported in USD. Last annual DPS of 1.50 US cents in respect to 2019 was paid out on 17 Oct 2019
(6) Company data reported in HKD; conversion based on USDHKD exchange rate of 7.75. Interim dividends of 8 HK cents was last paid on 3 Oct 2019.
Source: Respective company data, FPA Financial

(III) HPL takeover offer in 2014
On 14 April 2014, an offer announcement was issued to note that 68 Holdings had agreed to acquire 213,980,130 HPL
shares, representing a 41.91% stake in HPL, at S$3.50 per share. This 41.91% stake was acquired from Mr Ong Beng
Seng and companies controlled by him, his wife Mrs Christina Ong, Nassim Developments, Mr David Ban and his
spouse. 68 Holdings was 60% owned by Cuscaden Partners Pte Ltd, an investment holding company in which Mr. Ong
and Mr. David Ban held a 90% interest and 10% interest respectively. The remaining 40% interest in 68 Holdings was
then held by Nassim Developments, an indirect wholly-owned subsidiary of Wheelock Properties (Singapore) Limited
(Wheelock Singapore), which is currently known as Wharf Estates Singapore Ptd Ltd.
On top of the acquisition of the 41.91% stake, 68 Holdings had also issued a takeover offer to acquire the remaining
stake in HPL at an offer price of S$3.50. We note that the rationale for the takeover was for Mr. Ong, Mr. David Ban and
Wheelock Singapore to consolidate their shareholdings in HPL so as to be in a position to cooperate and implement
their shared objectives for HPL and to enhance value over time.
Revisions of offer price
On 19 May 2014, it was announced that the offer price had been revised upward, where 68 Holdings agreed to acquire
17,109,000 shares at a revised offer price of S$4.00. We also note in HPL’s circular dated 19 May 2014 that the
revalued NAV (RNAV) per HPL share as at 31 March 2014 was reported to be S$5.02 based on open market value.
This reinforces our view that the value of the Group’s hotel assets may be understated on its balance sheet.
On 27 May 2014, the offer price was further revised upward, with 68 Holdings agreeing to acquire 6,696,600 shares at
S$4.05 per share. From this point onwards, no further revisions were made to the offer price.
Given the above, we note that the original offer price (S$3.50), revised offer price (S$4.00) and second revised offer
price (S$4.05) were respectively at a discount of 30.3%, 20.3% and 19.3% to the reported RNAV per share of S$5.02.
Given our estimated RNAV per share of S$5.32 as noted on page 34, we would estimate a target price of S$3.71,
S$4.24 and S$4.29 based on the discount to RNAV for the 3 offer price scenarios during the takeover offer, as shown in
Exhibit 46.
Exhibit 46: Estimated target price for HPL
Our baseline target price would be S$3.71 based on Scenario (1), which would represent a 22.8% upside to the current
price of S$3.02. We note that this could be a conservative estimate, given that our RNAV per share of S$5.32 only
accounts for the revaluation of several of the Group’s assets which are classified as PPE. We are inclined to believe that
the other assets could have appreciated in value as well.
22 December 2020
36www.fpafinancial.com
Offer price (S$) RNAV per share Discount to RNAV Target price (S$) RNAV per share Discount to RNAV
(1) - original offer price 3.50 5.02 30.3% 3.71 5.32 30.3%
(2) - revised offer price 4.00 5.02 20.3% 4.24 5.32 20.3%
(3) - 2nd revised offer price 4.05 5.02 19.3% 4.29 5.32 19.3%
Source: Company, FPA Financial
Scenario
As at 31 Mar 2014 As at 22 Dec 2020

Closure of takeover offer
On 26 June 2014, 68 Holdings announced the closure of the takeover offer. At the offer closure, we note that 68
Holdings held a total of 293,368,206 shares in HPL, representing a 56.36% stake in the company.
Potential of a new takeover offer
While the takeover offer was not completed in 2014, there could be a potential for another takeover offer in the future.
We earlier noted that Mr. Ong, Mr. David Ban and companies related to the Wheelock Group had plans to cooperate
and implement their shared objectives for HPL. We believe this could include plans for a redevelopment project in the
Orchard Road area. Several of HPL’s assets in the area - Forum, Hilton Singapore, Four Seasons Hotel Singapore and
HPL House - sit on a large adjoining land site estimated at about 212,000 sq ft, according to the Straits Times.
Given the sharp sell-down in HPL’s share price owing to the COVID-19 pandemic, we see the possibility of a new
takeover offer. With reference to Exhibit 47, Mr. Ong, his spouse and Nassim Developments - herein referred to as the
parties acting in concert - collectively held a 83.10% ownership in HPL as of 19 March 2019.
Exhibit 47: Collective HPL ownership by the parties acting in concert
Based on this collective ownership, the estimated cost of acquiring the remaining 16.99% stake would be
approximately S$267 million = [16.99% x current market capitalisation of S$1,573.33 million]. Assuming a 30%
premium, the acquisition cost would be S$347 million = [130% x S$267 million], equivalent to approximately S$3.93
per share.
We note that the above acquisition cost of S$3.93 per share is lower than the S$4.05, and this could provide an
incentive for a new takeover offer. Further, this may be a good opportunity for the parties acting in concert to redevelop
Hilton Singapore and Four Seasons Singapore given the age of the buildings. We foresee a potential redevelopment
project to form an integrated complex comprising of commercial, hotel, residential and retail elements that would
incorporate latest technology to meet the requirements of tech savvy occupiers and health care requirements due to
COVID-19.
It is important to note that our valuation analysis to derive our estimated target price does not take into account the
potential benefits from the above-mentioned redevelopment project. As such, any potential valuation upside has not
been factored into our baseline target price of S$3.71. Thus, we believe that this reinforces our view on the potential
upside for HPL’s share price.
Meanwhile, we also note that HPL’s major controlling shareholder, Mr. Ong Beng Seng, had increased his stake in
the company through two separate share purchases in 2019. Through 68 Holdings Pte Ltd, Mr. Ong had acquired
2,951,000 ordinary shares in HPL at S$3.80 per share on 23 August 2019 and 3,000,000 ordinary shares at S$3.45
per share on 27 September 2019. The average price per share for both purchases would be S$3.62. We believe
that such share purchases reflect positively on the value of the company.
22 December 2020
37www.fpafinancial.com
No. of shares %
Ong Beng Seng and wife 315,241,487 60.49
Nassim Developments Pte Ltd 117,347,282 22.52
Total 432,588,769 83.01
Source: Company, FPA Financial
Shareholder
Ownership

SWOT AND COMPETITIVE ANALYSIS
In this section, we undertake a SWOT analysis in Exhibit 48 to evaluate the various components of the
analysis thus far.
Exhibit 48: SWOT analysis
(I) Strengths
As noted earlier on page 3, Mr. Ong Beng Seng, the Managing Director of HPL, is the major controlling
shareholder of the company with a 60.49% stake. He is also the founder of HPL and a shareholder in many other
businesses. According to Forbes, Mr. Ong and his wife Christina Ong are ranked 22nd in Singapore’s top 50
richest list as of August 2020, with a net worth of $1.45 billion. Given the credentials and financial capabilities of
its founder and major controlling shareholder, we think that HPL is backed with strong financial support which
provides assurance on the company’s financial stability.
Meanwhile, we note that the Group’s hotels have been awarded with numerous accolades over the years, a
testament to the quality of its properties. In 2019, several of its Maldives hotels had won numerous awards. Four
Seasons Resort Maldives at Landaa Giraavaru was the winner of the TripAdvisor 2019 Travellers’ Choice Top
10 Hotels for Maldives. Both Four Seasons Private Island Maldives at Voavah and Four Seasons Resort
Maldives at Kuda Huraa defended their prestigious titles of ‘Maldives’ Leading Honeymoon Resort in 2019’ and
‘Maldives’ Leading Water Villa Resort in 2019’ at the World Travel Awards 2019. Six Senses Laamu won several
awards such as ‘Leading Eco Resort’ at the Maldives Travel Awards, Favourite Spa Retreat’ by Condé Nast
Traveller and ‘Best for Wildlife & Nature Conservation’ at the prestigious World Tourism Market World
Responsible Tourism Awards 2019, to name a few. In addition, the newly renovated Gili Lankanfushi was
previously voted ‘Best Hotel in the World’ by TripAdvisor.
In the Seychelles, we note that Four Seasons Resort Seychelles at Desroches Island also won a list of awards
including ‘Landscaping & Outdoor Spaces’ at the AHEAD MEA Awards 2019, ‘Best Beach Hotel 2019’ and ‘Best
Restaurant – Africa and Gulf States for The Lighthouse’ at the International Hotel & Property Awards 2019.
22 December 2020
38www.fpafinancial.com
SWOT analysisStrengths
• Strong financial backing
• Award-winning hotels
Weaknesses
• Focus on affluent customer base
Opportunities
• New London mixed-use developments
• Potential redevelopment project in
Orchard Road
Threats
• Weak global economic recovery
• Subdued business travel

(II) Weaknesses
We note that the Group’s hotel portfolio comprise of luxury hotels which are catered towards affluent customers.
We identify this as a potential weakness in the current COVID-19 environment. Travel demand has been greatly
stifled by border and travel restrictions. Luxury hotels are more susceptible amid weak economic sentiment as
consumers may opt for more affordable hotel stays. Further, we note that the impact on luxury hotels is
potentially greater in this COVID-19 environment as business travel is greatly impeded.
(III) Opportunities
We noted earlier on page 11 that the Group’s has two mixed-used projects in London, Bankside yards and
Paddington Square, which are still currently in the development stages. We identify these projects as potential
catalyst which could deliver favourable returns for the Group. While the UK real estate market - particularly for
London - could take some time to recover, we are positive on the longer-term outlook as the COVID-19 health
concerns subside and the economy gets back on track.
Meanwhile, we also noted on a potential redevelopment project in the Orchard Road area. With technological
advancement and new health & safety requirements, there could be an opportunity for a redevelopment of the
Group’s assets in the Orchard Road area to form an integrated complex to incorporate latest technology to meet
the requirements of tech savvy occupiers and health care requirements due to COVID-19.
(IV) Threats
The COVID-19 pandemic has severely impacted the hotel markets globally. The Group’s performance will very
much be determined by the recovery in international travel. Given recent positive news on vaccine treatment, we
can expect a shorter time horizon for this to be achieved. However, the main concern is that it could take a few
years for international travel to fully recover. At the same time, a protracted recovery in the global economy could
also limit the demand for travel, and in turn negatively affect the demand for hotel stays. Further, there are
concerns over business travel dynamics. The need for business travel could be reduced as companies shift
toward virtual conference meetings.
22 December 2020
39www.fpafinancial.com

INVESTMENT RECOMMENDATION
Based on HPL’s reported book value of S$3.59 as at 30 June 2020, it currently has a P/B of 0.84x and is
trading at a slight 15% discount to NAV.
We note that the Group’s hotels are classified under PPE on its balance sheet and recorded at historical cost
without revaluation. To adjust the hotels to reflect current market conditions, we performed a revaluation of
several of the Group’s hotels and a plot of land in Phuket (which are classified as PPE). Based on our
revaluation, we derived a RNAV per share of S$5.32, which would imply a P/B of 0.57x at the current price of
S$3.02. This is lower than the PB of 0.84x based on the Group’s reported NAV. We believe this may suggest
that HPL may be undervalued at the current price.
Our view is supported by an estimated RNAV of S$5.02 that was disclosed in HPL’s takeover circular in
2014. Based on the takeover offer example, we noted that the original offer price (S$3.50) was at a discount
of 30.3% to the disclosed RNAV per share of S$5.02. Thus, we adopted a 30.3% discount on our RNAV per
share of S$5.32 to estimate a baseline target price of S$3.71. Our baseline target price of S$3.71 is a 22.8%
upside to the current price of S$3.02. This could be a conservative estimate, given that our RNAV per share of
S$5.32 only accounts for the revaluation of several of the Group’s hotels which are classified as PPE.
Meanwhile, we see the possibility of a new takeover offer at an attractive acquisition cost. We estimate an
acquisition cost of S$347 million, or S$3.93 per share, for a complete takeover of HPL, given a collective
ownership of 83.01% by Mr. Ong, his spouse and Nassim Developments. We note that the acquisition cost of
S$3.93 could be a possible target price scenario after factoring in a 30% premium. In the medium term, we also
note that a conservative price of S$4.29 per share could be reached in a new takeover offer based on how
the company was valued by the takeover parties previously. The potential takeover could stem from a vision
by the parties acting in concert to redevelop the Group’s assets in the Orchard Road area. We believe this could
involve a massive project to develop an integrated complex that would meet current technology demands and
health care requirements. Given that this has not been factored into our baseline target price of S$3.71, we
believe that justifies the potential upside for HPL’s share price. Further, share acquisitions by HPL’s major
controlling shareholder also reflect positively on the company’s value.
Owing to the severe impact of the COVID-19 pandemic, we expect the Group’s financial performance to be
negatively impacted for 2020. For 2021, we anticipate the availability of early vaccine treatments to support a
recovery in hotel performance. However, international travel is unlikely to revert to pre-COVID levels in 2021.
Business travel demand could remain subdued due to changes in business travel dynamics. As a result, the
we expect the Group’s performance in 2021 to remain weaker compared to pre-COVID times. Nonetheless,
we are positive on the longer-term outlook for performance of the Group’s hotel division. In addition, we
identify the Group’s mixed-used projects in London as potential catalysts that could underpin performance in
the future.
Given the above consideration, we believe a buy is warranted on HPL. We issue a buy recommendation and
our target price is S$3.71 per share. However, there are still risks to our target price which we will highlight in
the Risk section.
22 December 2020
40www.fpafinancial.com
RISKS TO THE TARGET PRICE
In this section, we highlight 3 risk factors that may limit the potential upside in HPL’s share price.
(I) Weak global economic recovery
Owing to the COVID-19 pandemic, travel restrictions and renewed border lockdowns have significantly stifled
economic activity in many economies. To cushion against the economic fallout, countries have responded by
introducing unprecedented fiscal and monetary stimulus to support their economies. In its latest World
Economic Outlook (October), the International Monetary Fund said it expects the global economy to contract
by 4.4% in 2020, an improvement from its June forecast of a 4.9% decline.
Looking ahead, the pace of recovery would differ across different economies. In Singapore, where the virus
situation has largely stabilized, many parts of the economy have safely reopened and thus economic activity
has picked up. However, latest forecasts by Singapore’s Ministry of Trade and Industry (MTI) indicate that
the economy is still expected to contract in a range of 6.0% to 6.5%. Further, growth in the economy will be
uneven, with aviation and tourism-related sectors expected to be laggards. MTI noted that economic activity
in these sectors is not likely to return to pre-COVID levels even by end-2021. Meanwhile, renewed
lockdowns in countries in the Europe region continue to weigh on economic activity. Further, unresolved US-
China tensions pose as risks to the global economy.
A protracted global economic recovery will weigh on economic sentiment, which in turn has a negative
impact on travel demand. This could weigh on the performance of the Group’s hotel division.
(II) Concerns over subdued business travel
As noted in our SWOT analysis, there are concerns over the potential of subdued business travel. Business
travel dynamics could be permanently changed due to COVID-19. The need for business travel could be
reduced as companies shift toward virtual conference meetings. This is likely to have a more pronounced
impact on luxury hotels.
(III) Risk of exchange rate fluctuations
We note that the Group is exposed to foreign exchange risk arising from various currency exposures
primarily with respect to United States dollars, Sterling pounds, Euro dollars, Malaysian ringgit and Japanese
yen. Amid the current COVID-19 environment, we anticipate that the Singapore dollar may strengthen due to
increased capital inflow as a result of its safe-haven status. A stronger SGD could have a negative impact on
the Group’s earnings due to currency exchange losses.
22 December 2020
41www.fpafinancial.com

SUSTAINABILITY INFORMATION
Management Approach
As part of its sustainability efforts, the Group consults and shares its sustainability performance with key
stakeholders and balance their interest with the Group’s objectives. Its business divisions are responsible for
identifying, implementing sustainability initiatives while the Board and Audit Committee set the direction and tone
for the Group and have an overview of it.
Stakeholder engagement and materiality review
In 2017, the Group identified key stakeholder groups that influence its performance and provide key insights to
enhance its sustainability practice. A stakeholder engagement exercise was conducted where the key stakeholders
recorded their expectations and concerns on sustainability matters for HPL. Based on the responses by
stakeholders, the Group identified four key ESG aspects that impact its business, including employee health &
safety, employee training & education, energy consumption and water consumption.
In 2019, the Group continued to focus on the above four key ESG aspects and also identified an additional aspect
that is material to its operations – phasing out of plastic packaging in its hotels. The following table in Exhibit 49
summarises the Group’s stakeholder engagement framework.
Exhibit 49: Group’s stakeholder engagement framework
Source: Company
22 December 2020
42www.fpafinancial.com
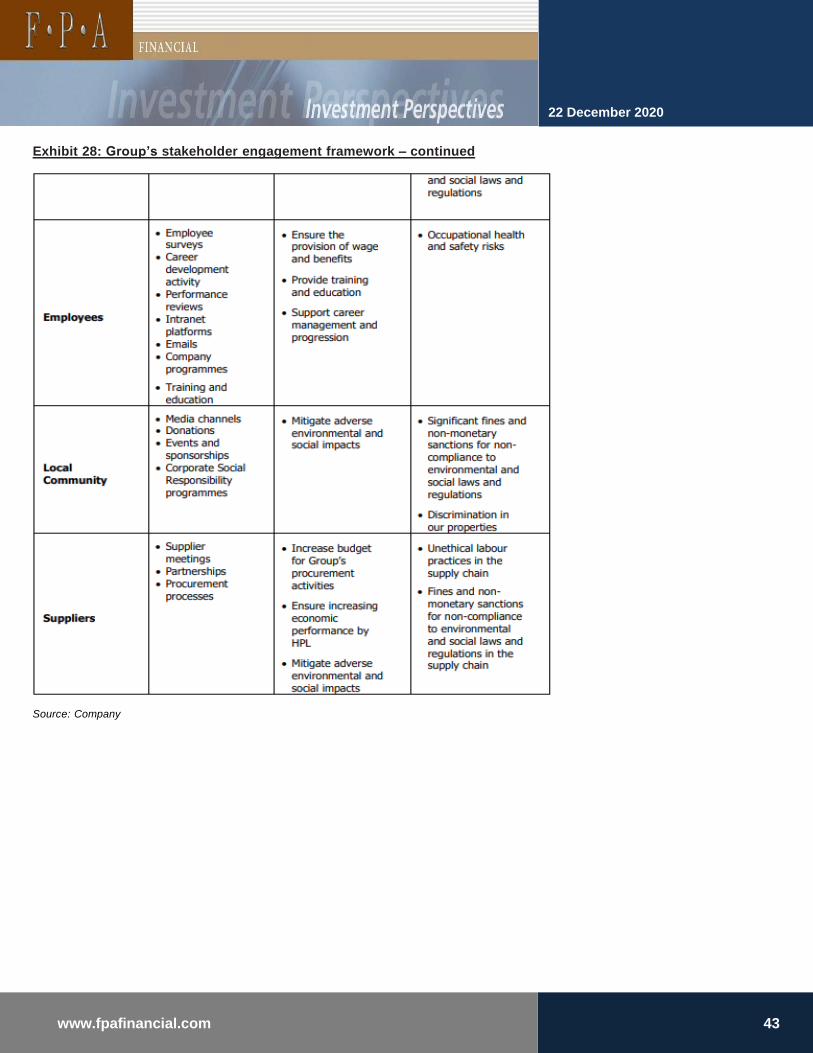
Exhibit 28: Group’s stakeholder engagement framework – continued
Source: Company
22 December 2020
43www.fpafinancial.com
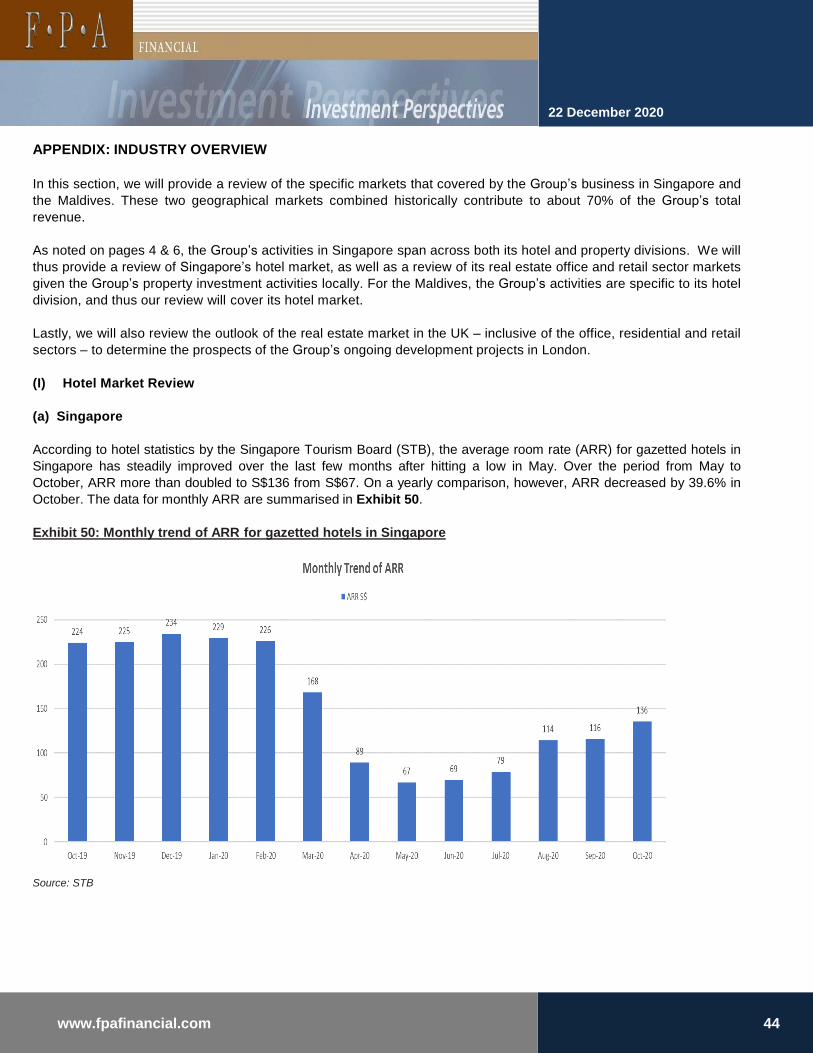
APPENDIX: INDUSTRY OVERVIEW
In this section, we will provide a review of the specific markets that covered by the Group’s business in Singapore and
the Maldives. These two geographical markets combined historically contribute to about 70% of the Group’s total
revenue.
As noted on pages 4 & 6, the Group’s activities in Singapore span across both its hotel and property divisions. We will
thus provide a review of Singapore’s hotel market, as well as a review of its real estate office and retail sector markets
given the Group’s property investment activities locally. For the Maldives, the Group’s activities are specific to its hotel
division, and thus our review will cover its hotel market.
Lastly, we will also review the outlook of the real estate market in the UK – inclusive of the office, residential and retail
sectors – to determine the prospects of the Group’s ongoing development projects in London.
(I) Hotel Market Review
(a) Singapore
According to hotel statistics by the Singapore Tourism Board (STB), the average room rate (ARR) for gazetted hotels in
Singapore has steadily improved over the last few months after hitting a low in May. Over the period from May to
October, ARR more than doubled to S$136 from S$67. On a yearly comparison, however, ARR decreased by 39.6% in
October. The data for monthly ARR are summarised in Exhibit 50.
Exhibit 50: Monthly trend of ARR for gazetted hotels in Singapore
Source: STB
22 December 2020
44www.fpafinancial.com
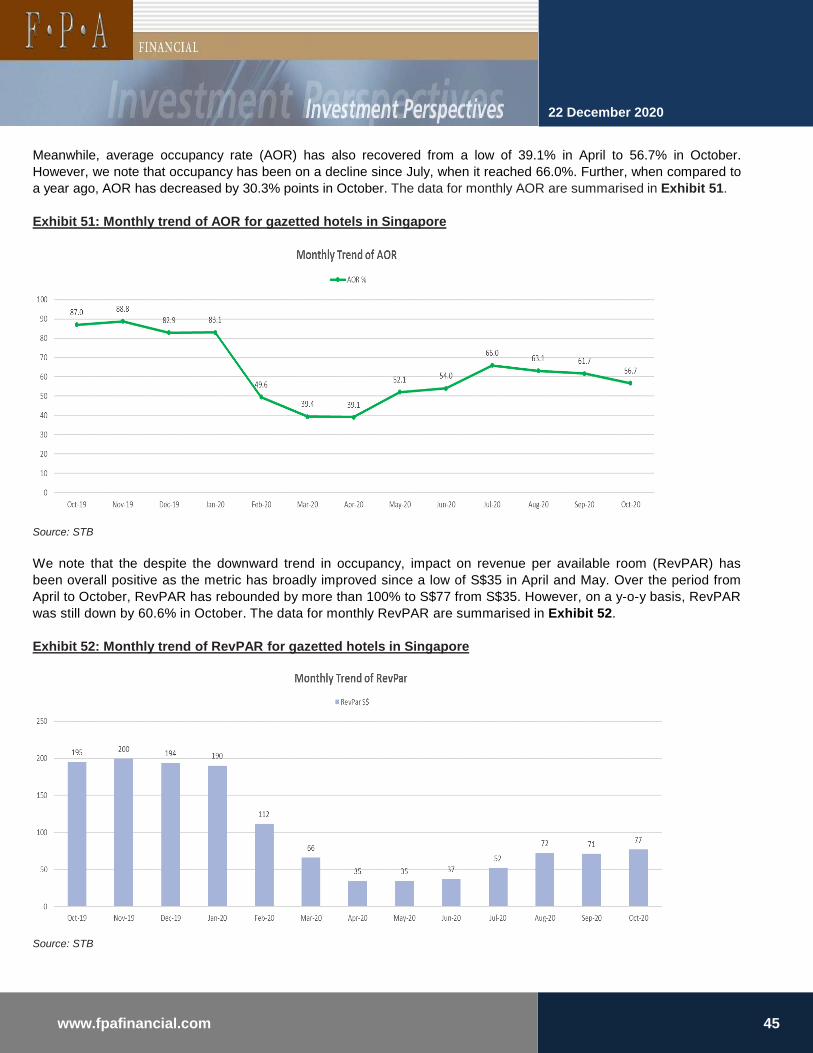
Meanwhile, average occupancy rate (AOR) has also recovered from a low of 39.1% in April to 56.7% in October.
However, we note that occupancy has been on a decline since July, when it reached 66.0%. Further, when compared to
a year ago, AOR has decreased by 30.3% points in October. The data for monthly AOR are summarised in Exhibit 51.
Exhibit 51: Monthly trend of AOR for gazetted hotels in Singapore
Source: STB
We note that the despite the downward trend in occupancy, impact on revenue per available room (RevPAR) has
been overall positive as the metric has broadly improved since a low of S$35 in April and May. Over the period from
April to October, RevPAR has rebounded by more than 100% to S$77 from S$35. However, on a y-o-y basis, RevPAR
was still down by 60.6% in October. The data for monthly RevPAR are summarised in Exhibit 52.
Exhibit 52: Monthly trend of RevPAR for gazetted hotels in Singapore
Source: STB
22 December 2020
45www.fpafinancial.com
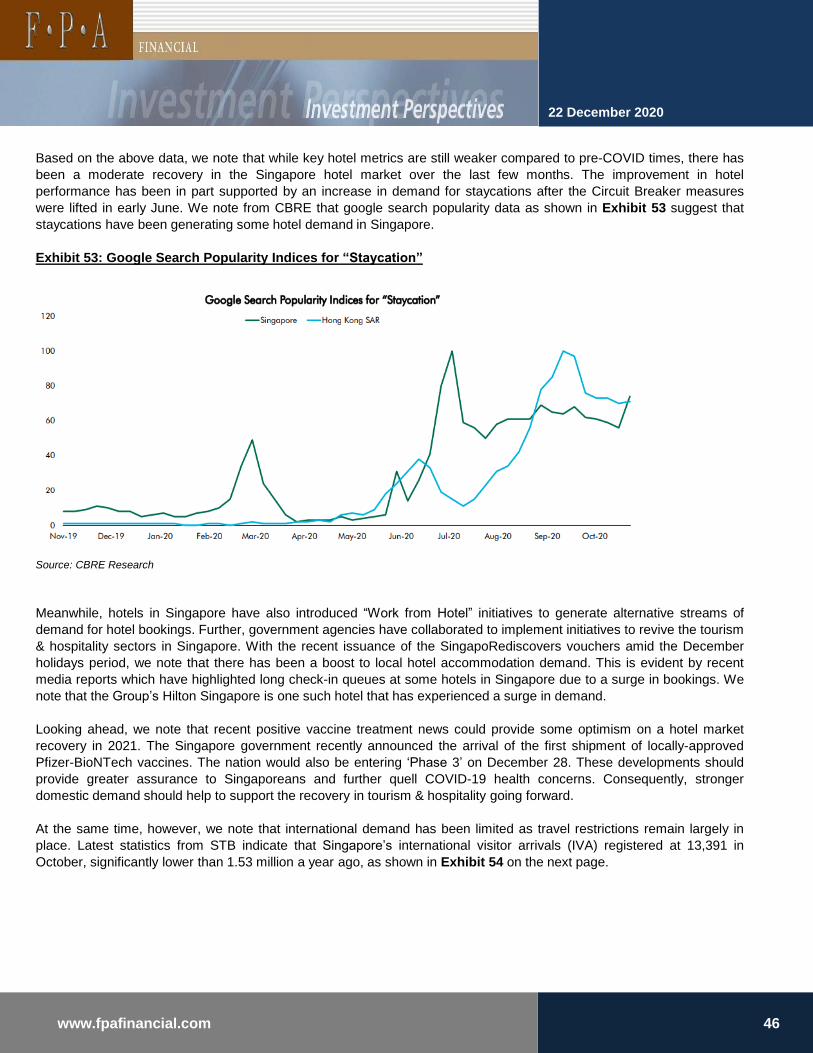
Based on the above data, we note that while key hotel metrics are still weaker compared to pre-COVID times, there has
been a moderate recovery in the Singapore hotel market over the last few months. The improvement in hotel
performance has been in part supported by an increase in demand for staycations after the Circuit Breaker measures
were lifted in early June. We note from CBRE that google search popularity data as shown in Exhibit 53 suggest that
staycations have been generating some hotel demand in Singapore.
Exhibit 53: Google Search Popularity Indices for “Staycation”
Source: CBRE Research
Meanwhile, hotels in Singapore have also introduced “Work from Hotel” initiatives to generate alternative streams of
demand for hotel bookings. Further, government agencies have collaborated to implement initiatives to revive the tourism
& hospitality sectors in Singapore. With the recent issuance of the SingapoRediscovers vouchers amid the December
holidays period, we note that there has been a boost to local hotel accommodation demand. This is evident by recent
media reports which have highlighted long check-in queues at some hotels in Singapore due to a surge in bookings. We
note that the Group’s Hilton Singapore is one such hotel that has experienced a surge in demand.
Looking ahead, we note that recent positive vaccine treatment news could provide some optimism on a hotel market
recovery in 2021. The Singapore government recently announced the arrival of the first shipment of locally-approved
Pfizer-BioNTech vaccines. The nation would also be entering ‘Phase 3’ on December 28. These developments should
provide greater assurance to Singaporeans and further quell COVID-19 health concerns. Consequently, stronger
domestic demand should help to support the recovery in tourism & hospitality going forward.
At the same time, however, we note that international demand has been limited as travel restrictions remain largely in
place. Latest statistics from STB indicate that Singapore’s international visitor arrivals (IVA) registered at 13,391 in
October, significantly lower than 1.53 million a year ago, as shown in Exhibit 54 on the next page.
22 December 2020
46www.fpafinancial.com
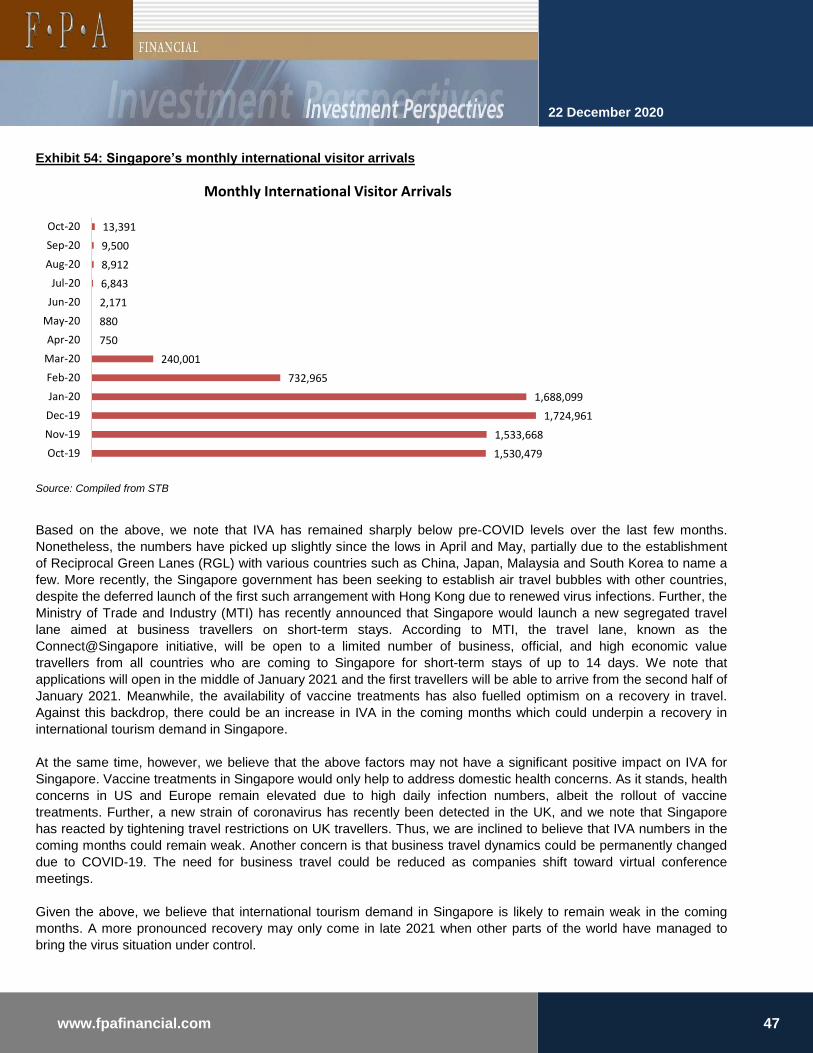
Exhibit 54: Singapore’s monthly international visitor arrivals
Source: Compiled from STB
Based on the above, we note that IVA has remained sharply below pre-COVID levels over the last few months.
Nonetheless, the numbers have picked up slightly since the lows in April and May, partially due to the establishment
of Reciprocal Green Lanes (RGL) with various countries such as China, Japan, Malaysia and South Korea to name a
few. More recently, the Singapore government has been seeking to establish air travel bubbles with other countries,
despite the deferred launch of the first such arrangement with Hong Kong due to renewed virus infections. Further, the
Ministry of Trade and Industry (MTI) has recently announced that Singapore would launch a new segregated travel
lane aimed at business travellers on short-term stays. According to MTI, the travel lane, known as the
Connect@Singapore initiative, will be open to a limited number of business, official, and high economic value
travellers from all countries who are coming to Singapore for short-term stays of up to 14 days. We note that
applications will open in the middle of January 2021 and the first travellers will be able to arrive from the second half of
January 2021. Meanwhile, the availability of vaccine treatments has also fuelled optimism on a recovery in travel.
Against this backdrop, there could be an increase in IVA in the coming months which could underpin a recovery in
international tourism demand in Singapore.
At the same time, however, we believe that the above factors may not have a significant positive impact on IVA for
Singapore. Vaccine treatments in Singapore would only help to address domestic health concerns. As it stands, health
concerns in US and Europe remain elevated due to high daily infection numbers, albeit the rollout of vaccine
treatments. Further, a new strain of coronavirus has recently been detected in the UK, and we note that Singapore
has reacted by tightening travel restrictions on UK travellers. Thus, we are inclined to believe that IVA numbers in the
coming months could remain weak. Another concern is that business travel dynamics could be permanently changed
due to COVID-19. The need for business travel could be reduced as companies shift toward virtual conference
meetings.
Given the above, we believe that international tourism demand in Singapore is likely to remain weak in the coming
months. A more pronounced recovery may only come in late 2021 when other parts of the world have managed to
bring the virus situation under control.
22 December 2020
47www.fpafinancial.com
1,530,479
1,533,668
1,724,961
1,688,099
732,965
240,001
750
880
2,171
6,843
8,912
9,500
13,391
Oct-19
Nov-19
Dec-19
Jan-20
Feb-20
Mar-20
Apr-20
May-20
Jun-20
Jul-20
Aug-20
Sep-20
Oct-20
Monthly International Visitor Arrivals

(b) Maldives
Owing to the COVID-19 pandemic, Maldives tourism performance was severely impacted as the government closed
the country’s borders on 27 March 2020. As a result, there was effectively no tourism arrivals to Maldives during the
period following its border closure. After nearly 4 months of closure, the country re-opened its borders on 15 July
2020 and there has since been a gradual increase in tourist arrivals. However, year-to-date (YTD) in October, tourist
arrivals were still down by about 70% compared to the same period a year ago, according to latest statistics by
Maldives’ Ministry of Tourism (MOT).
Given the weak tourism performance, Maldives’ hotel market performance was severely impacted as well.
Occupancy rate for resorts/marinas and hotels declined sharply in April from March due to the border closures.
Maldives’ MOT data showed that hotel occupancy stood at zero from May to June, while resort/marinas occupancy
remained low over the period. Occupancy only picked up slightly after borders were reopened in July. In October,
occupancy for resorts/marinas registered at 14.9% and that for hotels was at 7.2%. Over the period from January to
October, the average occupancy for resorts/marinas stood at 26.1% and that for hotels was at 16.2%. The data for
occupancy rate of tourist establishments in Maldives are summarized in Exhibit 55.
Exhibit 55: Occupancy rate for tourist establishments in 2020
Source: Ministry of Tourism, Maldives
We note from STR that the lack of domestic demand in Maldives has continued to depress occupancy. Nonetheless,
a gradual pick up in tourist arrivals has stimulated minor occupancy improvements. Looking ahead, we note from
Colliers that while the short-term outlook for the tourism sector has been clouded by COVID-19, the long-term
outlook for Maldives remains positive given its reputation as a sought-after tourist destination. Recently, Maldives’
MOT announced that the nation had received the World’s Leading Destination award at the Grand Final of the World
Travel Awards 2020.
Further, we also note from Colliers that key significant initiatives in Maldives support the positive long-term outlook
for its tourism sector. A summary of these key initiatives is shown in Exhibit 56 on the next page.
22 December 2020
48www.fpafinancial.com

Exhibit 56: Key initiatives in Maldives
22 December 2020
49www.fpafinancial.com
Key initiative Description
Following the launch of the Fourth Tourism Master Plan 2013-2017
(4TMP), Maldives plans to attract the growing middle class
population, especially in key emerging source countries around Asia.
Plans are also on the way to market Maldives as a holiday destination
not only to key source markets, but to markets such as Middle East
and Africa.
Diversification of tourism offerings Promoting community based tourism and development of new attractions that
offer a wide range of experiences and can serve a variety of market spectra,
ranging from families and adventurers.
Expansion of infrastructure In anticipation of the growing demand of international visitor arrivals, the Velena
International Airport (Maldives’ main international airport) is currently
undergoing expansion which will be able to accommodate up to 7.5 million
passengers a year upon its scheduled completion in 2022. In addition, the
seaplane terminal which has undergone expansion will boast 20 departure
gates and 45 stands.
Source: Colliers
Diversification of source markets and profile of tourism arrivals
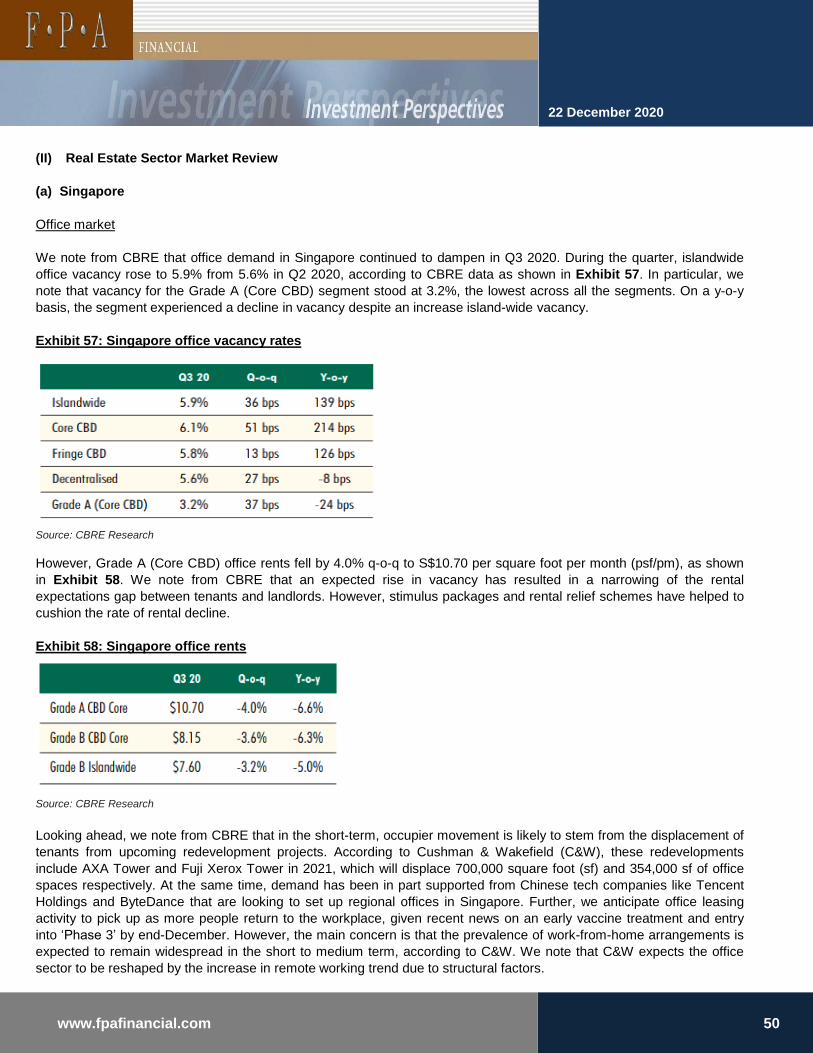
(II) Real Estate Sector Market Review
(a) Singapore
Office market
We note from CBRE that office demand in Singapore continued to dampen in Q3 2020. During the quarter, islandwide
office vacancy rose to 5.9% from 5.6% in Q2 2020, according to CBRE data as shown in Exhibit 57. In particular, we
note that vacancy for the Grade A (Core CBD) segment stood at 3.2%, the lowest across all the segments. On a y-o-y
basis, the segment experienced a decline in vacancy despite an increase island-wide vacancy.
Exhibit 57: Singapore office vacancy rates
Source: CBRE Research
However, Grade A (Core CBD) office rents fell by 4.0% q-o-q to S$10.70 per square foot per month (psf/pm), as shown
in Exhibit 58. We note from CBRE that an expected rise in vacancy has resulted in a narrowing of the rental
expectations gap between tenants and landlords. However, stimulus packages and rental relief schemes have helped to
cushion the rate of rental decline.
Exhibit 58: Singapore office rents
Source: CBRE Research
Looking ahead, we note from CBRE that in the short-term, occupier movement is likely to stem from the displacement of
tenants from upcoming redevelopment projects. According to Cushman & Wakefield (C&W), these redevelopments
include AXA Tower and Fuji Xerox Tower in 2021, which will displace 700,000 square foot (sf) and 354,000 sf of office
spaces respectively. At the same time, demand has been in part supported from Chinese tech companies like Tencent
Holdings and ByteDance that are looking to set up regional offices in Singapore. Further, we anticipate office leasing
activity to pick up as more people return to the workplace, given recent news on an early vaccine treatment and entry
into ‘Phase 3’ by end-December. However, the main concern is that the prevalence of work-from-home arrangements is
expected to remain widespread in the short to medium term, according to C&W. We note that C&W expects the office
sector to be reshaped by the increase in remote working trend due to structural factors.
22 December 2020
50www.fpafinancial.com

Retail market
Since the end of the Circuit Breaker period, retail malls have largely resumed operations and shopper traffic has
improved as COVID-19 health concerns subside. In turn, retail sales performance has improved as the y-o-y decline in
retail sales has moderated to 8.6% in October compared to 40.5% in April, according to data by the Department of
Statistics Singapore. However, the absence of international tourists and WFH measures continue to affect the retail
market, according to CBRE. At the same time, we note from CBRE that underperforming retail businesses have been
forced to downsize or exit the market as they are unable to sustain current rental and labour costs. Notably, Robinsons
has announced plans to wind up its business in Singapore and has recently closed down its flagship store at The
Heeren.
We also note from CBRE that landlords have become more realistic in their rental expectations as they attempt to strike
a balance between rental and occupancy. According to CBRE, rental correction accelerated in Q3 2020 as rental rebates
have mostly expired by the end of the quarter. During the quarter, average prime islandwide retail rents declined by 3.1%
q-o-q, a steeper drop compared to the 1.8% q-o-q decline in Q2 2020.
In terms of segment, we note that shopper traffic has recovered strongly in the suburban segment, given lower reliance
on tourist footfall. In turn, prime retail rents in the suburban segment remained unchanged on a q-o-q basis in Q3 2020,
as shown in Exhibit 59. In contrast, prime retail rents in the Orchard Road segment experienced a 3.4% q-o-q decline in
Q3 2020. Nonetheless, tenant support and government measures have cushioned the decline in rents, and thus the
rental correction has been less severe.
Exhibit 59: Singapore prime retail rents
Source: CBRE Research
However, CBRE said that the retail sector is still plagued by uncertainty over the recovery of the tourism industry, lifting
of safety management measures and prolonged disruptions from the global pandemic. As a result, occupancy and rents
are expected to remain under pressure, although the extent will be mitigated by limited new retail supply. Nonetheless,
we anticipate that these concerns could be eased by recent positive developments on the availability of vaccine
treatment by the end of December.
22 December 2020
51www.fpafinancial.com

(b) UK
Office market
We note from CBRE that increasing flexibility in work arrangements could reduce the need for physical offices going
forward. In addition, increasing employee density has also led to more efficient occupation of space, according to
CBRE. With reference to Exhibit 60, we note that the office space requirements for an employee in Central London
has broadly decreased over the last two decades, with space requirements forecasted by CBRE to moderate further
in the coming years.
Exhibit 60: Central London office space per employee, estimated index (1990 = 100)
Source: UK Office of National Statistics, CBRE Research
However, we note from CBRE that flexible working has been long-established in the UK, with 22% of UK-based
employees ‘occasionally’ working from home, according to Eurostat. Thus, CBRE expects any big increase in
remote working as a fresh acceleration of an existing trend rather than a new phenomenon. Nonetheless, a shift
towards lower office attendance may be counteracted by more generous typical densities as firms move towards a
higher proportion of team space, breakout and event areas, according to CBRE. As a result, the net impact on office
demand is uncertain.
Meanwhile, we also note from CBRE that UK office take-up fell to a record low owing to the COVID-19 lockdown and
is unlikely to return to trend levels in 2021, given that office demand is strongly correlated with employment growth.
While job growth is expected to be positive in 2021, CBRE does not expect total employment to recover to pre-
pandemic levels until the second half of 2022. Consequently, CBRE’s rent forecasts reflect a 3% decline in nominal
rental values across UK offices as a whole in 2021. We further note from CBRE that UK regional office rents are
expected to hold up better than Central London rents, in part due to a slower recovery expected in London
employment compared to the rest of the UK.
22 December 2020
52www.fpafinancial.com

Residential market
We note from CBRE that UK’s residential sector has been resilient in the face of the pandemic. According to CBRE,
total residential returns for YTD Q3 2020 was 2.4%, outperforming office (-0.7%) and retail (-10.4%). CBRE expects
this trend to continue into 2021.
Given the sector’s resilience and strong long-term fundamentals, CBRE expects residential investment to reach
record levels during its forecast period. According to CBRE forecasts, residential as proportion of total real estate
investment in the UK is expected to peak close to 30% in 2020 and maintain close to 20% from 2021-2025, above
historical levels, as shown in Exhibit 61.
Exhibit 61: UK residential investment, 2015 – 2025(F)
Source: CBRE Research
Meanwhile, we also note from CBRE that a surge of pent-up demand has resulted in a sharp rebound in residential
sales in the wake of the initial UK lockdown. This rebound has been further supported by the Government’s Stamp
Duty Land Tax (SDLT) holiday introduced in July, which lasts until 31 March 2021. According to CBRE, the demand
surge has also led to the highest rates of house price growth since 2015, with Nationwide recording annual growth of
5.8% in October 2020. CBRE expects this momentum will continue into 2021, and for a surge of sales in the first
quarter before the SDLT holiday ends.
However, CBRE highlighted that weaker GDP growth and higher unemployment in the UK could potentially have a
negative impact on UK’s housing market performance throughout 2021. In addition, the winding down of policy
support such as the Job Retention Scheme and the ending of mortgage payment holidays will put further downward
pressure on the market.
In terms of capital value, we note that housing prices are forecasted to rise by 4.9% in 2020 and moderate to a 1.0%
growth in 2021, as shown in Exhibit 62 on the next page. Subsequently, residential capital value growth is expected
exhibit an upward trend over 2022-2024.
22 December 2020
53www.fpafinancial.com

Exhibit 62: UK residential capital value and rent forecasts, 2020-2024
Source: CBRE Research
22 December 2020
54www.fpafinancial.com

Retail market
Owing to the COVID-19 pandemic, the UK retail real estate market has been the hardest hit. We note from CBRE
that the closure of non-essential retail stores during lockdowns has put severe pressure on retailers’ revenues and
will continue to affect their performance in 2021 and thereafter. The resulting shift towards shorter, more flexible
lease structures and turnover leases will fundamentally change retail real estate, according to CBRE.
Retail sales is expected to rebound sharply in 2021 before moderating to close to zero growth over 2022-2025, as
shown in Exhibit 63.
Exhibit 63: UK retail sales growth, nominal rental growth and online penetration (%)
Source: CBRE Research
We also note in Exhibit 62 that nominal rental growth for all retail is forecasted to remain in negative territory in the
coming years, though the decline is expected to moderate over the years. Meanwhile, we further note from CBRE
that online retail is expected to become more prevalent in the coming years as retailers continue to invest in their
online platforms and move a larger proportion of their sales online. CBRE forecasts indicate that online penetration
will reach 26% in 2021 and 30% in 2025, as shown in Exhibit 62.
22 December 2020
55www.fpafinancial.com

DISCLOSURES/DISCLAIMERS
This report is prepared for general circulation. It does not have regard to the specific
investment objectives, financial situation and the particular needs of any recipient
hereof. Advice should be sought from a financial adviser regarding the suitability of the
investment product, taking into account the specific investment objectives, financial
situation or particular needs of any person in receipt of the recommendation, before
the person makes a commitment to purchase the investment product.
This report is confidential. This report may not be published, circulated, reproduced or
distributed in whole or in part by any recipient of this report to any other person without
the prior written consent of FPA Financial Corporation Pte Ltd (“FPA”). This report is
not directed to or intended for distribution to or use by any person or any entity who is
a citizen or resident of or located in any locality, state, country or any other jurisdiction
as FPA may determine in its absolute discretion, where the distribution, publication,
availability or use of this report would be contrary to applicable law or would subject
FPA and its connected persons (as defined in the Financial Advisers Act, Chapter 110
of Singapore) to any registration, licensing or other requirements within such
jurisdiction.
The information or views in the report (“Information”) has been obtained or derived
from sources believed by FPA to be reliable. However, FPA makes no representation
as to the accuracy or completeness of such sources or the Information and FPA
accepts no liability whatsoever for any loss or damage arising from the use of or
reliance on the Information. FPA and its connected persons may have issued other
reports expressing views different from the Information and all views expressed in all
reports of FPA and its connected persons are subject to change without notice. FPA
reserves the right to act upon or use the Information at any time, including before its
publication herein.
22 December 2020
56www.fpafinancial.com