210854orig1s000 - accessdata.fda.gov · center for drug evaluation and research application number:...
TRANSCRIPT

CENTER FOR DRUG EVALUATION AND RESEARCH
APPLICATION NUMBER:
210854Orig1s000
CLINICAL MICROBIOLOGY/VIROLOGY REVIEW(S)
DIVISION OF ANTIVIRAL PRODUCTS (HFD-530)VIROLOGY REVIEW
NDA: 210854 SDN: 000 (SN 0000) DATE REVIEWED: 09/10/2018Virology Reviewers: William Ince, Ph.D. and Michael Thomson, Ph.D.
1
New Drug Application # Supporting Document Number210854 000
Sponsor ContactShionogi Inc.300 Campus DriveSuite 300Florham Park, NJ 07932
Priyanka Kamath, MSManager, US Regulatory Affairs973-307-3742 (tel.)973-307-3719 (fax)[email protected]
ReviewersWilliam Ince, Ph.D. and Michael Thomson, Ph.D.
CDER Receipt Date Assigned Date Review Complete Date PDUFA Date4/24/2018 4/24/2018 9/10/2018 12/24/2018
Amendments: None
Additional Submissions ReviewedSDN eCTD
(SN)Received Descriptiona Appendixb
002 0001 5/2/2018 Response to IR: Reformatted virology datasets for trials T0831 and T0821 H003 0002 5/3/2018 Sample handling SOPs and stability testing reports for virologic samples
(96-hour stability evaluated)NA
004 0003 5/8/2018 Sponsor request for clarification regarding dataset formatting I005 0004 5/11/2018 PA amino acid sequences of viruses included phylogenetic analyses of
strains evaluated for susceptibility (studies FRI-2017-S-033188-01 andFRI-2017-S-033188-02)
NA
006 0005 5/14/2018 Response to IR: Reformatted virology datasets for studies T0821 and T0831 NA007 0006 5/15/2018 Approved labeling for baloxavir marboxil tablets in Japan NA009 0008 5/29/2018 Response to IR: Virology datasets for pediatric study T0822010 0009 5/30/2018 Response to IR: Lab protocols for virologic analyses in studies T0822 and
T0831 and clarification of dataset variableNA
11 0010 5/31/2018 Information on polymorphisms associated with variable activity of enzymes that affect S-033188 metabolism
J
013 0012 6/11/2018 Response to IR: Updated virology datasets for studies T0822 and T0831 including PB1 and PB2 sequencing data
NA
014 0013 6/13/2018 PB1/PB2 Genotypic analysis of virus serially passagedin the presence of S-033447 (study report EF-300-N)
NA
021 0020 7/27/2018 Response to IR: Information regarding EC50 values for H5N1 and H7N9 viruses, influenza antibody titer assay information, and T0821 RT-PCR assay information previously submitted to IND126653
NA
028 0027 8/22/2018 120-Day Safety Update. T0832 top-line efficacy data NA031 0030 09/05/2018 Sponsor proposed USPI revision 1 NA
a. IR: Information requestb. Appendices include correspondence regarding the submission and additional actions taken. NA – Not applicable (material was
reviewed and relevant information was incorporated into the NDA body).
Reference ID: 4324543

DIVISION OF ANTIVIRAL PRODUCTS (HFD-530)VIROLOGY REVIEW
NDA: 210854 SDN: 000 (SN 0000) DATE REVIEWED: 09/10/2018Virology Reviewers: William Ince, Ph.D. and Michael Thomson, Ph.D.
2
Related/Supporting Documents: IND 126653
Product Name(s): Proprietary Name: XOFLUZA®
Non-Proprietary/USAN: baloxavir marboxil (active metabolite: baloxavir)Code Name/Number: S-033188 (prodrug), (active metabolite: S-033447 or RSC-033447)
Chemical Name: ({(12aR)-12-[(11S)-7,8-difluoro-6,11-dihydrodibenzo[b,e]thiepin-11-yl]-6,8-dioxo-3,4,6,8,12,12a-hexahydro-1H-[1,4]oxazino[3,4-c]pyrido[2,1-f][1,2,4]triazin-7-yl}oxy)methyl methyl carbonate
Structural formula:
S-033188
Molecular Formula: C27H23F2N3O7SMolecular Weight: 571.55 Da (482 Da, active metabolite S-033447)Drug category: AntiviralDosage Form(s): Route(s) of Administration: Indication(s): Treatment of acute uncomplicated influenza in patients 12 years of age and older.Dispensed: Rx _X OTC ___
Abbreviations: BID, twice daily; CPE, cytopathic effect; EC, effective concentration; HA, hemagglutinin; IC, inhibitory concentration; ITTI, intent-to-treat-infected; IV, intravenous; MDCK, Madin-Darby canine kidney; MOI, multiplicity of infection; NA, neuraminidase; NAI, neuraminidase inhibitor; OSE, oseltamivir; PBO, placebo; PER, peramivir; PK, pharmacokinetics ; PPV, positive predictive value; QD, once daily; RAT, rapid antigen test; RIDT, rapid influenza diagnostic test; RSV, respiratory syncytial virus; RT-PCR, reverse transcription-polymerase chain reaction; SOP, standard operating procedure; TCID50, 50% tissue culture infectious dose; TTAS, time to alleviation of symptoms; USPI, United States Prescribing Information; ZAN, zanamivir.
Reference ID: 4324543
DIVISION OF ANTIVIRAL PRODUCTS (HFD-530)VIROLOGY REVIEW
NDA: 210854 SDN: 000 (SN 0000) DATE REVIEWED: 09/10/2018Virology Reviewers: William Ince, Ph.D. and Michael Thomson, Ph.D.
3
TABLE OF CONTENTSEXECUTIVE SUMMARY ......................................................................................................................................5
1 Recommendations .........................................................................................................................................51.1 Recommendation and Conclusion on Approvability ................................................................................51.2 Recommendation on Phase 4 (Post-Marketing) Commitments, Agreements, and/or Risk Management:.......................................................................................................................................................................5
2. Summary of OND Virology Assessment .......................................................................................................62.1 Nonclinical Virology (OND Virology Review Section 2) ...........................................................................62.2 Clinical Virology (OND Virology Review Section 3) .................................................................................7
3. Administrative..............................................................................................................................................123.1 Reviewers’ Signatures ......................................................................................................................123.2 Concurrence .....................................................................................................................................12HFD-530/NDA..............................................................................................................................................12HFD-530/Division File..................................................................................................................................12HFD-530/RPM/Tyson ..................................................................................................................................12
OND Virology Review .........................................................................................................................................131. Introduction and Background ......................................................................................................................13
1.1 Influenza natural history.........................................................................................................................131.2 Important Milestones in Product Development ......................................................................................151.3 Methodology ..........................................................................................................................................151.4 Prior FDA virology reviews ....................................................................................................................181.5 Major virology issues that arose during product development...............................................................181.6 State of antivirals used for the indication sought ...................................................................................19
2. Nonclinical Virology .....................................................................................................................................202.1 Mechanism of action..............................................................................................................................202.2 Cell culture studies ................................................................................................................................222.3 Antiviral activity in animal models ..........................................................................................................262.4 Resistance analyses in cell culture........................................................................................................34
3 Clinical Virology ReVIEW of efficacy............................................................................................................403.1 Summary of Key Efficacy Trials.............................................................................................................403.2 Study T0821 ..........................................................................................................................................403.3 Study T0831 (NTC02954354)................................................................................................................533.4 Supportive clinical studies .....................................................................................................................673.5. Pooled analyses of key virologic endpoints ..........................................................................................733.6 Conclusions ...........................................................................................................................................74
4. Resistance...................................................................................................................................................74
Reference ID: 4324543
DIVISION OF ANTIVIRAL PRODUCTS (HFD-530)VIROLOGY REVIEW
NDA: 210854 SDN: 000 (SN 0000) DATE REVIEWED: 09/10/2018Virology Reviewers: William Ince, Ph.D. and Michael Thomson, Ph.D.
4
4.1 Baseline resistance (FDA analysis) .......................................................................................................744.2 Treatment-emergent substitutions .........................................................................................................814.3 Association of non-RAS treatment-emergent substitutions with virologic responses ............................904.4 Identification of subjects with unexplained virus rebound......................................................................954.5 Conclusions ...........................................................................................................................................95
5. Package Insert ...........................................................................................................................................965.1 Original proposed USPI .........................................................................................................................965.2 Amended USPI as of 9/18/2018 ............................................................................................................97
6. APPENDICES ...........................................................................................................................................1016.1 APPENDIX A: Antiviral activity of baloxavir marboxil in animal models of influenza ..........................1016.2 APPENDIX B: Subject-level listings of treatment-emergent amino acid substitutions in trials T0821 T0831 and T0822. .....................................................................................................................................1146.3 APPENDIX C: Subjects with un-evaluated virus rebound ...................................................................1186.4 APPENDIX D: RT-PCR and sequencing primers for trial T0821 (study report CF-122-N)..................1196.5 APPENDIX E: RT-PCR and sequencing primers for studies T0831 and T0822 (RPT-VAL039-FNL):1216.6 APPENDIX F: Pooled analysis (FDA analysis) of key virologic endpoint data for studies T0821 and T0831.........................................................................................................................................................1306.7 APPENDIX G: Virus shedding kinetics for subjects with A/S60V/P (A) or E623G/K (B) substitutions....................................................................................................................................................................1346.8 APPENDIX H: SDN 002 (SN 0001): Reformatted virology datasets for study T0831 and T0821 .......1346.9 APPENDIX I: SDN 004 (SN 0003) Sponsor request for clarification regarding dataset formatting. ....1356.10 APPENDIX J: SDN 011 (SN 0010): Response to information request regarding information on polymorphism associated with variable activity of enzymes that affect S-033188 metabolism. ................1366.11 APPENDIX K: Study report EB-286-N (5.3.1.1): Effect of S-033447 on Influenza Virus Titer Testing....................................................................................................................................................................1376.12 APPENDIX L: Substitutions identified as requiring further evaluation for their impact on susceptibility to baloxavir ................................................................................................................................................140
Reference ID: 4324543


DIVISION OF ANTIVIRAL PRODUCTS (HFD-530)VIROLOGY REVIEW
NDA: 210854 SDN: 000 (SN 0000) DATE REVIEWED: 09/10/2018Virology Reviewers: William Ince, Ph.D. and Michael Thomson, Ph.D.
7
MDCK cells, the median EC90 value of baloxavir against non-human strains of influenza virus, including two zoonotic avian strains (A/Hong Kong/483/97 [H5N1] and A/Anhui/1/2013 [H7N9]), was 0.96 nM (range: 0.73-1.64 nM, n=7).
2.1.3 Combination Antiviral Activity (OND Virology Review Section 2.2)The antiviral activity of baloxavir was assessed in combination with oseltamivir, peramivir and zanamivir in MDCK cells infected with A/H1N1 virus. Baloxavir was not antagonistic in any combination of drugs tested. The antiviral activity of baloxavir was not assessed in combination with adamantanes.
2.1.4 Antiviral Activity in Animal Models (OND Virology Review Section 2.3)The antiviral activity of baloxavir marboxil following oral administration was assessed in several therapeutic treatment studies using non-lethal and lethal mouse models of influenza virus infection, in immunocompromised mouse models of influenza virus infection, and in a non-lethal ferret model. Therapeutic treatment with baloxavir marboxil was associated with a significant reduction in lung virus titer and improved survival compared with vehicle control. In some studies, a reduction or prevention of influenza virus-induced weight loss was observed in animals dosed with baloxavir marboxil. In a combination study with oseltamivir, some dose combinations resulted in a statistically significant improvement in survival time and protection from weight loss compared with mice dosed with the individual drugs.
2.1.5 Resistance Analyses in Cell Culture (OND Virology Review Section 2.4)Influenza virus with reduced susceptibility to baloxavir was selected in cell culture using A/H1N1 and A/H3N2 strains; under the conditions used; type B virus with reduced susceptibility was not selected. For both A/H1N1 and A/H3N2 viruses exhibiting reduced susceptibility, a single amino acid substitution of I38T in the PA coding region was identified that caused a 40-fold increase in the EC50 value of baloxavir. For A/H3N2 virus, a single amino acid substitution of E199G was also identified that increased the EC50 value of baloxavir by approximately 3-fold. The I38 amino acid, which is near the catalytic center of PA, was >99.9% conserved in PA sequences of type A and B viruses.
2.1.5 Cross-Resistance (OND Virology Review Section 2.4)The cell culture antiviral activity of baloxavir was not reduced against influenza virus strains harboring known neuraminidase inhibitor substitutions. Influenza virus harboring substitutions that caused reduced susceptibility to baloxavir retained sensitivity to the neuraminidase inhibitor oseltamivir. Cross-resistance to adamantanes was not evaluated but is not expected because baloxavir and adamantanes target different viral proteins with distinct functions.
2.2 Clinical Virology (OND Virology Review Section 3)The NDA for baloxavir marboxil is supported by efficacy data from two randomized placebo-controlled trials in subjects ranging in age from 12 to <65 years. Treatment with baloxavir marboxil had a statistically significant impact overall on time to alleviation of symptoms (the primary endpoint) in both trials; however, the impact of baloxavir marboxil treatment in subjects infected with type B virus, as measured by the time to alleviation of symptoms, was inconsistent between trials and did not achieve statistical significance in either trial or in an analysis of data combined from both trials. Treatment effects based on virologic endpoints were reduced against influenza type B virus compared to influenza type A viruses. These effects were consistent between trials T0821 and T0831. Resistance analyses were supported by data from studies T0821, T0831 and a single-arm, phase 3 pediatric study, T0822; among these three trials, treatment-emergent resistance occurred in 2.7-11% of adults and adolescents and in 25.6% of pediatric subjects.
2.2.1 Limitations of virus shedding data (Appendix K) Data from an analysis performed by the sponsor indicated that concentrations of baloxavir present in nasal swab specimens had the potential to be carried over and reduce the sensitivity of infectivity assays used to detect and quantify virus shedding. As a result, it is possible that the impact of baloxavir marboxil treatment on
Reference ID: 4324543

DIVISION OF ANTIVIRAL PRODUCTS (HFD-530)VIROLOGY REVIEW
NDA: 210854 SDN: 000 (SN 0000) DATE REVIEWED: 09/10/2018Virology Reviewers: William Ince, Ph.D. and Michael Thomson, Ph.D.
8
the proportions of subjects who were negative for virus at each time point (and time to virus-negative status), may have been exaggerated by drug carryover. The magnitude of the carryover effect is unknown, but the greatest impact of the effect would be expected for low-titer samples, which undergo fewer dilutions in endpoint infectivity assays. It is, however, unlikely that drug carryover exclusively accounts for the differences in virus shedding observed between baloxavir marboxil and placebo and oseltamivir arms; quantitative viral RNA shedding data, which are not expected to be affected by drug carryover, generally correlated with quantitative virus shedding data across treatment arms, although the magnitude in the reduction of viral RNA was not as great as that observed for virus.
2.2.2 Trial T0821 efficacy results (OND Virology Review Section 3.2)T0821 was a randomized, double-blind, placebo-controlled, phase 2 study conducted in Japan of baloxavir marboxil in otherwise healthy adult subjects with influenza. Study T0821 enrolled 400 influenza-virus-positive (by RIDT) subjects (approximately 67% A/H1N1, 9% A/H3N2, and 23% type B virus infections), who were randomized 1:1:1:1 to receive a single dose of 10, 20, or 40 mg of baloxavir marboxil or placebo. The primary endpoint was time to alleviation of symptoms. Key virologic (secondary) endpoints included change from baseline in virus and viral RNA, and the proportions of subjects positive for virus at each study day.
Overall primary endpoint analysis (Trial T0821, OND Virology Review Section 3.2.4)Baloxavir marboxil treatment resulted in a statistically significant and dose-dependent reduction in the median time to alleviation of symptoms (TTAS). The median TTAS was 77.7 hours in the placebo group, and the reductions in the medians of TTAS relative to median placebo TTAS for the 10 mg, 20 mg, and 40 mg dose groups were 30% (-23.4 hours; p=0.0085), 34% (-26.6 hours; p=0.0182) and 36% (-28.2 hours; p=0.0046) hours, respectively.
Primary endpoint analysis based on virus type/subtype (Trial T0821, OND Virology Review Section 3.2.4)An analysis of TTAS in influenza virus type/subtype subsets revealed reduced activity against type B virus as measured by TTAS. In A/H1N1 infections, the reductions in the medians of TTAS compared to the median TTAS in placebo (n=69) were 25% (-17.7 hours; n=66; p=0.0084), 33% (-23.5 hours; n=71; p=0.0083) and 32% (-22.4 hours; n=61; p=0.0049) for the 10 mg, 20 mg and 40 mg dose groups, respectively, and each difference was statistically significant. In A/H3N2 infections, trends were similar but not statistically significant given the small number of subjects in this subset; the reductions in the medians of TTAS compared to the median TTAS in placebo (n=6) were 34% (-34 hours; n=13; p=0.1254), 34% (-34.2 hours; n=5; p=0.4913) and 55% (-54.6 hours; n=12; p=0.2689) for the 10 mg, 20 mg and 40 mg dose groups, respectively. Reductions in TTAS were least for type B virus infections and were not statistically significant, with reductions in the medians of TTAS relative to the median TTAS of placebo (n=23) of 24% (-19.8 hours; n=21; p=0.2152), 21% (-17.8 hours; n=23; p=0.6608), and 24% (-19.9 hours; n=24; p=0.1604) for the 10 mg, 20 mg and 40 mg dose groups, respectively. In none of the subsets was there a strictly dose-dependent response, although the 10 mg dose group had the weakest response in type A virus infections.
Virologic endpoint analysis (Trial T0821, OND Virology Review Section 3.2.5)VirusOverall, there was a dose-dependent decrease in the proportions of virus-positive subjects at Day 2 (including only subjects who were virus-positive at Day 1, baseline) across treatment arms; however, response to baloxavir marboxil treatment was clearly reduced in subjects with type B virus infections compared to type A virus infections. In the A/H1N1 virus subset, the proportions of subjects who were virus-positive on Day 2 (actual analysis day, baseline is Day 1) in the 10, 20, and 40 mg baloxavir marboxil arms were 89.2% (58/65), 69.0% (49/71), and 43.3% (26/60), respectively, compared to 95.7% (66/69) in the placebo arm. In the A/H3N2 virus subset, the proportions of subjects who were virus-positive on Day 2 in the 10, 20, and 40 mg baloxavir marboxil arms were 61.5% (8/13), 40.0% (2/5), and 9.1% (1/11), respectively, compared to 83.3% (5/6) in the placebo arm. In the type B virus subset, the proportions of subjects who were virus-positive on Day 2 in the 10, 20, and 40 mg baloxavir marboxil arms were 95.2% (20/21), 87.0% (20/23), and 91.7% (22/24), respectively,
Reference ID: 4324543
DIVISION OF ANTIVIRAL PRODUCTS (HFD-530)VIROLOGY REVIEW
NDA: 210854 SDN: 000 (SN 0000) DATE REVIEWED: 09/10/2018Virology Reviewers: William Ince, Ph.D. and Michael Thomson, Ph.D.
9
compared to 95.2% (20/21) in the placebo arm. Only the 20 mg and 40 mg dose groups in the A/H1N1 virus subset were statistically significantly different from placebo.
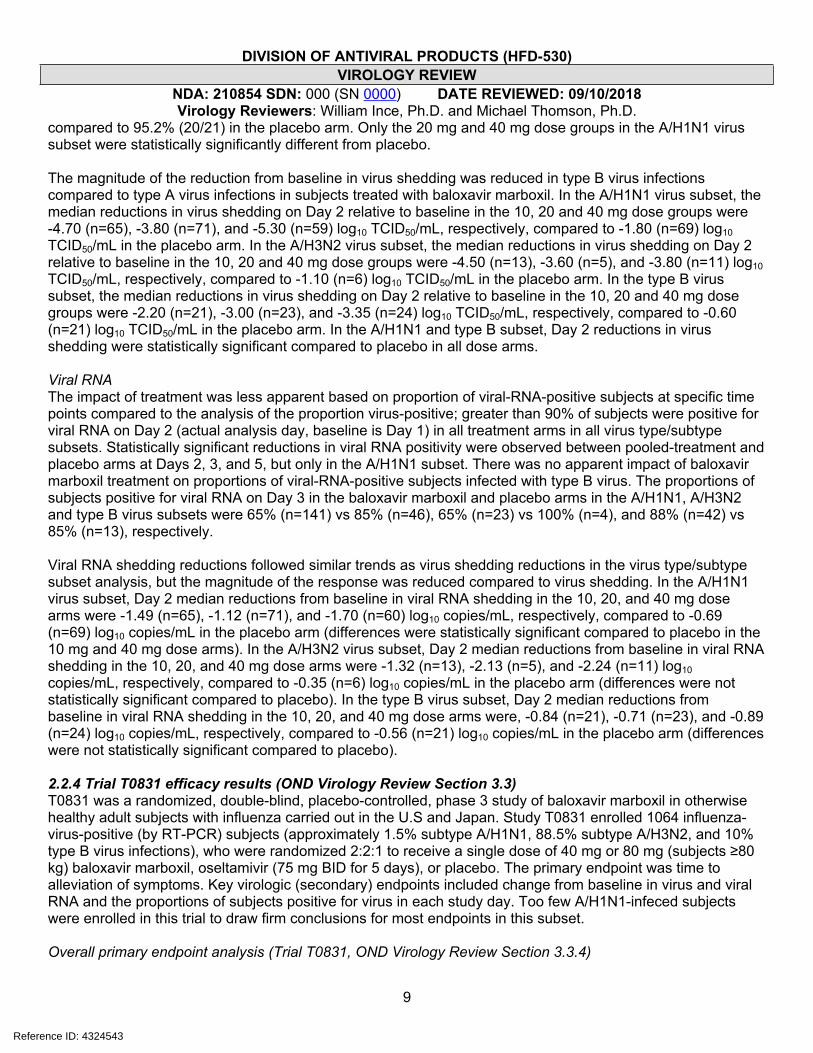
The magnitude of the reduction from baseline in virus shedding was reduced in type B virus infections compared to type A virus infections in subjects treated with baloxavir marboxil. In the A/H1N1 virus subset, the median reductions in virus shedding on Day 2 relative to baseline in the 10, 20 and 40 mg dose groups were -4.70 (n=65), -3.80 (n=71), and -5.30 (n=59) log10 TCID50/mL, respectively, compared to -1.80 (n=69) log10 TCID50/mL in the placebo arm. In the A/H3N2 virus subset, the median reductions in virus shedding on Day 2 relative to baseline in the 10, 20 and 40 mg dose groups were -4.50 (n=13), -3.60 (n=5), and -3.80 (n=11) log10 TCID50/mL, respectively, compared to -1.10 (n=6) log10 TCID50/mL in the placebo arm. In the type B virus subset, the median reductions in virus shedding on Day 2 relative to baseline in the 10, 20 and 40 mg dose groups were -2.20 (n=21), -3.00 (n=23), and -3.35 (n=24) log10 TCID50/mL, respectively, compared to -0.60 (n=21) log10 TCID50/mL in the placebo arm. In the A/H1N1 and type B subset, Day 2 reductions in virus shedding were statistically significant compared to placebo in all dose arms.
Viral RNAThe impact of treatment was less apparent based on proportion of viral-RNA-positive subjects at specific time points compared to the analysis of the proportion virus-positive; greater than 90% of subjects were positive for viral RNA on Day 2 (actual analysis day, baseline is Day 1) in all treatment arms in all virus type/subtype subsets. Statistically significant reductions in viral RNA positivity were observed between pooled-treatment and placebo arms at Days 2, 3, and 5, but only in the A/H1N1 subset. There was no apparent impact of baloxavir marboxil treatment on proportions of viral-RNA-positive subjects infected with type B virus. The proportions of subjects positive for viral RNA on Day 3 in the baloxavir marboxil and placebo arms in the A/H1N1, A/H3N2 and type B virus subsets were 65% (n=141) vs 85% (n=46), 65% (n=23) vs 100% (n=4), and 88% (n=42) vs 85% (n=13), respectively.
Viral RNA shedding reductions followed similar trends as virus shedding reductions in the virus type/subtype subset analysis, but the magnitude of the response was reduced compared to virus shedding. In the A/H1N1 virus subset, Day 2 median reductions from baseline in viral RNA shedding in the 10, 20, and 40 mg dose arms were -1.49 (n=65), -1.12 (n=71), and -1.70 (n=60) log10 copies/mL, respectively, compared to -0.69 (n=69) log10 copies/mL in the placebo arm (differences were statistically significant compared to placebo in the 10 mg and 40 mg dose arms). In the A/H3N2 virus subset, Day 2 median reductions from baseline in viral RNA shedding in the 10, 20, and 40 mg dose arms were -1.32 (n=13), -2.13 (n=5), and -2.24 (n=11) log10 copies/mL, respectively, compared to -0.35 (n=6) log10 copies/mL in the placebo arm (differences were not statistically significant compared to placebo). In the type B virus subset, Day 2 median reductions from baseline in viral RNA shedding in the 10, 20, and 40 mg dose arms were, -0.84 (n=21), -0.71 (n=23), and -0.89 (n=24) log10 copies/mL, respectively, compared to -0.56 (n=21) log10 copies/mL in the placebo arm (differences were not statistically significant compared to placebo).
2.2.4 Trial T0831 efficacy results (OND Virology Review Section 3.3)T0831 was a randomized, double-blind, placebo-controlled, phase 3 study of baloxavir marboxil in otherwise healthy adult subjects with influenza carried out in the U.S and Japan. Study T0831 enrolled 1064 influenza-virus-positive (by RT-PCR) subjects (approximately 1.5% subtype A/H1N1, 88.5% subtype A/H3N2, and 10% type B virus infections), who were randomized 2:2:1 to receive a single dose of 40 mg or 80 mg (subjects ≥80 kg) baloxavir marboxil, oseltamivir (75 mg BID for 5 days), or placebo. The primary endpoint was time to alleviation of symptoms. Key virologic (secondary) endpoints included change from baseline in virus and viral RNA and the proportions of subjects positive for virus in each study day. Too few A/H1N1-infeced subjects were enrolled in this trial to draw firm conclusions for most endpoints in this subset.
Overall primary endpoint analysis (Trial T0831, OND Virology Review Section 3.3.4)
Reference ID: 4324543
DIVISION OF ANTIVIRAL PRODUCTS (HFD-530)VIROLOGY REVIEW
NDA: 210854 SDN: 000 (SN 0000) DATE REVIEWED: 09/10/2018Virology Reviewers: William Ince, Ph.D. and Michael Thomson, Ph.D.
10
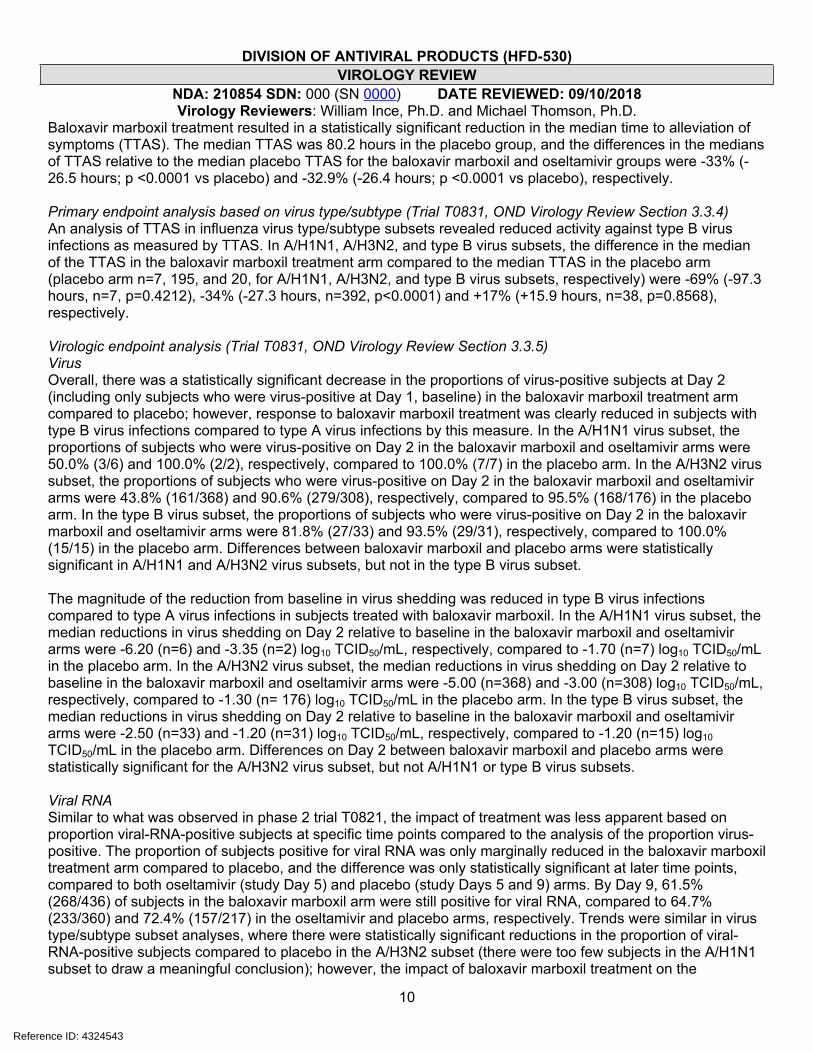
Baloxavir marboxil treatment resulted in a statistically significant reduction in the median time to alleviation of symptoms (TTAS). The median TTAS was 80.2 hours in the placebo group, and the differences in the medians of TTAS relative to the median placebo TTAS for the baloxavir marboxil and oseltamivir groups were -33% (-26.5 hours; p <0.0001 vs placebo) and -32.9% (-26.4 hours; p <0.0001 vs placebo), respectively.
Primary endpoint analysis based on virus type/subtype (Trial T0831, OND Virology Review Section 3.3.4)An analysis of TTAS in influenza virus type/subtype subsets revealed reduced activity against type B virus infections as measured by TTAS. In A/H1N1, A/H3N2, and type B virus subsets, the difference in the median of the TTAS in the baloxavir marboxil treatment arm compared to the median TTAS in the placebo arm (placebo arm n=7, 195, and 20, for A/H1N1, A/H3N2, and type B virus subsets, respectively) were -69% (-97.3 hours, n=7, p=0.4212), -34% (-27.3 hours, n=392, p<0.0001) and +17% (+15.9 hours, n=38, p=0.8568), respectively.
Virologic endpoint analysis (Trial T0831, OND Virology Review Section 3.3.5)VirusOverall, there was a statistically significant decrease in the proportions of virus-positive subjects at Day 2 (including only subjects who were virus-positive at Day 1, baseline) in the baloxavir marboxil treatment arm compared to placebo; however, response to baloxavir marboxil treatment was clearly reduced in subjects with type B virus infections compared to type A virus infections by this measure. In the A/H1N1 virus subset, the proportions of subjects who were virus-positive on Day 2 in the baloxavir marboxil and oseltamivir arms were 50.0% (3/6) and 100.0% (2/2), respectively, compared to 100.0% (7/7) in the placebo arm. In the A/H3N2 virus subset, the proportions of subjects who were virus-positive on Day 2 in the baloxavir marboxil and oseltamivir arms were 43.8% (161/368) and 90.6% (279/308), respectively, compared to 95.5% (168/176) in the placebo arm. In the type B virus subset, the proportions of subjects who were virus-positive on Day 2 in the baloxavir marboxil and oseltamivir arms were 81.8% (27/33) and 93.5% (29/31), respectively, compared to 100.0% (15/15) in the placebo arm. Differences between baloxavir marboxil and placebo arms were statistically significant in A/H1N1 and A/H3N2 virus subsets, but not in the type B virus subset.
The magnitude of the reduction from baseline in virus shedding was reduced in type B virus infections compared to type A virus infections in subjects treated with baloxavir marboxil. In the A/H1N1 virus subset, the median reductions in virus shedding on Day 2 relative to baseline in the baloxavir marboxil and oseltamivir arms were -6.20 (n=6) and -3.35 (n=2) log10 TCID50/mL, respectively, compared to -1.70 (n=7) log10 TCID50/mL in the placebo arm. In the A/H3N2 virus subset, the median reductions in virus shedding on Day 2 relative to baseline in the baloxavir marboxil and oseltamivir arms were -5.00 (n=368) and -3.00 (n=308) log10 TCID50/mL, respectively, compared to -1.30 (n= 176) log10 TCID50/mL in the placebo arm. In the type B virus subset, the median reductions in virus shedding on Day 2 relative to baseline in the baloxavir marboxil and oseltamivir arms were -2.50 (n=33) and -1.20 (n=31) log10 TCID50/mL, respectively, compared to -1.20 (n=15) log10 TCID50/mL in the placebo arm. Differences on Day 2 between baloxavir marboxil and placebo arms were statistically significant for the A/H3N2 virus subset, but not A/H1N1 or type B virus subsets.
Viral RNASimilar to what was observed in phase 2 trial T0821, the impact of treatment was less apparent based on proportion viral-RNA-positive subjects at specific time points compared to the analysis of the proportion virus-positive. The proportion of subjects positive for viral RNA was only marginally reduced in the baloxavir marboxil treatment arm compared to placebo, and the difference was only statistically significant at later time points, compared to both oseltamivir (study Day 5) and placebo (study Days 5 and 9) arms. By Day 9, 61.5% (268/436) of subjects in the baloxavir marboxil arm were still positive for viral RNA, compared to 64.7% (233/360) and 72.4% (157/217) in the oseltamivir and placebo arms, respectively. Trends were similar in virus type/subtype subset analyses, where there were statistically significant reductions in the proportion of viral-RNA-positive subjects compared to placebo in the A/H3N2 subset (there were too few subjects in the A/H1N1 subset to draw a meaningful conclusion); however, the impact of baloxavir marboxil treatment on the
Reference ID: 4324543

DIVISION OF ANTIVIRAL PRODUCTS (HFD-530)VIROLOGY REVIEW
NDA: 210854 SDN: 000 (SN 0000) DATE REVIEWED: 09/10/2018Virology Reviewers: William Ince, Ph.D. and Michael Thomson, Ph.D.
11
proportion of viral-RNA-positive subjects was not apparent for type B virus infections.
Likewise, baloxavir marboxil treatment was not associated with as rapid a decline in viral RNA as it was with virus; in the baloxavir marboxil arm overall, viral RNA shedding at Day 2 was reduced by a median of -1.7 log10 copies/mL compared to -0.74 log10 for placebo, and -1.13 log10 for oseltamivir, although differences were statistically significant at Days 2, 3, and 5 for baloxavir marboxil vs placebo. Similar results were observed in the virus type/subtype subset analyses. Median changes from baseline at Day 2 in the baloxavir marboxil, oseltamivir, and placebo arms were, -2.00 (n=7), -1.62 (n=2), and -0.64 (n=7) log10 copies/mL, respectively, for the A/H1N1 virus subset; -1.74 (n=374), -1.18 (n=314), and -0.77 (n=180) log10 copies/mL, respectively, for the A/H3N2 virus subset; and -0.91 (n=34), -0.68 (n=32), and -0.37 (n=18) log10 copies/mL, respectively, for the type B virus subset. Differences between baloxavir marboxil and placebo were only statistically significant for the A/H3N2 virus subset.
2.2.5 Resistance (OND Virology Review Section Section 4)Baseline polymorphisms (OND Virology Review Section 4.1)An analysis of baseline susceptibility (compared to the distribution of respective type/subtype baseline EC50 values within trials) to baloxavir marboxil and associated substitutions in trials T0821, T0822, and T0831 identified one substitution of note, PA A36V (A/H1N1), identified in one subject (trial T0821), which conferred a 3.6-fold increase in baloxavir EC50 value relative to reference; however, this subject did not exhibit a reduced response to treatment. The association of baseline polymorphisms (observed in ≥5 subjects) in PA with reduced response to treatment was evaluated in pooled subjects from trials T0821 and T0831. There were no baseline polymorphisms identified that were clearly associated with reduced response to treatment with baloxavir marboxil.
Treatment-emergent resistance (OND Virology Review Section 4.2)Subjects in trails T0821, T0822, and T0831 were evaluated for treatment-emergent resistance conferred by substitutions in the PA gene. The rate of emergence of substitutions that were identified in more than one subject or that reduced susceptibility to baloxavir marboxil in cell culture in adult/adolescent trials T0821 and T0831, and pediatric trial T0822, were 2.7%, 11.1%, and 25.6%, respectively. The increased rate observed in pediatric subjects is consistent with what has been observed for neuraminidase inhibitors. PA substitutions that were treatment-emergent in more than one subject (including all changes at amino acid positions exhibiting treatment-emergent variability) were defined as potentially resistance-associated substitutions (RASs) and were, in subtype A/H1N1, E23K (n=1) and I38F (n=2); in subtype A/H3N2, E23G (n=1), E23K (n=1), A37T (n=2), I38M (n=6), I38T (n=50), S60P (n=1), and E623G/K (n=2); and in type B, I38T (n=1) and A60V (n=1). The median day of detection of RASs was analysis Day 5, and all were detected between Days 3 and 11 (analysis Day 1 [study Day 1] is the start of treatment). Substitutions E23G/K, A37T, I38F/M/T, and E199G conferred a >2-fold reduction in susceptibility to baloxavir relative to reference (EC50 value fold change range: 2.4-57). In addition, E23G/K, A37T, I38F/M/T, and E199G were associated with virus rebound in ≥50% of the subjects in whom they were observed. Substitutions E23G/K, A37T, I38F/M/T, and E199G were proposed for inclusion in the USPI as resistance-associated substitutions.
Association of RASs with response to treatment (OND Virology Review Section 4.2)In a pooled analysis of subjects with type A virus infections in studies T0821 and T0831, treatment-emergent RASs were associated with an increase in the TTAS in baloxavir marboxil treatment arms. The medians of the TTAS for subjects with and without a treatment-emergent RAS were 63.32 (n=44) and 49.63 (n=413) hours, respectively, and the difference was statistically significant (p=0.0198, Mann-Whitney test). In a pooled analysis of both type A and B viruses, treatment-emergent RASs were also statistically significantly associated with reduced-response/virus rebound (p <0.0001) and prolonged virus shedding beyond analysis Day 5 (p <0.0001). Among subjects with type A virus infections, the proportion of subjects who were virus positive at Day 5 was statistically significantly higher among baloxavir marboxil-treated subjects with RASs compared to both baloxavir marboxil-treated subjects without RASs and placebo-treated subjects (p <0.0001).
Reference ID: 4324543
DIVISION OF ANTIVIRAL PRODUCTS (HFD-530)VIROLOGY REVIEW
NDA: 210854 SDN: 000 (SN 0000) DATE REVIEWED: 09/10/2018Virology Reviewers: William Ince, Ph.D. and Michael Thomson, Ph.D.
12
2.3 ConclusionsBaloxavir marboxil is approvable for the treatment of uncomplicated influenza virus infection from a Clinical Virology perspective. Baloxavir marboxil is an intracellular inhibitor of influenza virus that significantly reduced time to alleviation of symptoms and virus shedding in clinical studies. The response to treatment was reduced in type B virus infections compared to type A virus infections. Treatment-emergent resistance was observed in 2.7-11% of adult and adolescent subjects and had a significant impact on treatment outcomes; however, in baloxavir marboxil-treated subjects with treatment-emergent resistance, a trend toward a treatment benefit was maintained, compared to placebo-treated subjects. Polymorphisms at amino acid positions associated with reduced susceptibility to baloxavir marboxil were identified in approximately 0.05% of PA sequences in the NCBI/GenBank database, as of August 2018.
3. ADMINISTRATIVE3.1 Reviewers’ Signatures
William L. Ince, Ph.D. Virologist, HFD-530
Michael Thomson, Ph.D. Virologist, HFD-530
3.2 Concurrence
________________________________ Date____________HFD-530/J. O’Rear /TL Micro
cc:
HFD-530/NDAHFD-530/Division FileHFD-530/RPM/Tyson
Reference ID: 4324543

DIVISION OF ANTIVIRAL PRODUCTS (HFD-530)VIROLOGY REVIEW
NDA: 210854 SDN: 000 (SN 0000) DATE REVIEWED: 09/10/2018Virology Reviewers: William Ince, Ph.D. and Michael Thomson, Ph.D.
13
OND VIROLOGY REVIEW1. INTRODUCTION AND BACKGROUND1.1 Influenza natural historyInfluenza is a respiratory disease caused by infection with influenza virus. Disease severity ranges from mild to severe, and infection sometimes results in complications that require hospitalization and can lead to death. Disease severity may depend on the virus strain as well as host factors, such as immune status, age, pregnancy, and underlying health conditions. Global, seasonal influenza epidemics occur during the winter months in the Northern and Southern hemispheres. In the U.S. alone, seasonal epidemics have been estimated to result in 9.2 to 35 million influenza-related illnesses, 140,000 to 710,000 influenza-related hospitalizations, and 12,000 to 56,000 deaths since 2010 (U.S. CDC; Rolfes et al., 2018).
Influenza virus is a member of the Orthomyxoviridae family, which is characterized by a segmented, negative-sense, single-stranded RNA genome. There are three types of influenza viruses known to infect humans, A, B, and C. Influenza A viruses are divided into subtypes defined by the antigenic and genetic identity of the envelope glycoproteins hemagglutinin (HA) and neuraminidase (NA). To date, 18 HA and 11 NA genotypes have been identified for influenza A viruses across mammalian and avian host species. HA and NA are expressed from independent gene segments, which can reassort to generate a number of combinatorial variants. Wild aquatic birds harbor the most diversity of influenza A viruses and are regarded as the key reservoir for emerging zoonic strains (Olsen et al., 2006; Lang et al., 2011; Herfst et al., 2014; Bowman et al., 2015). Influenza A viruses that have persisted in human populations, causing recurring, seasonal epidemics, have historically been limited to three documented subtypes: A/H1N1, A/H2N2, and A/H3N2. Subtypes A/H1N1 and A/H3N2 have been responsible for seasonal influenza A epidemics in recent decades. Zoonotic outbreaks of avian origin, including of subtypes A/H5N1, A/H7N9, and A/H9N2, among others, occur periodically, but such viruses have been poorly communicable and have not persisted in the human population. Occasionally, antigenically novel zoonotic strains emerge from more closely related species, persist in the human population, and replace the previously circulating, antigenically related endemic strains (e.g., the 2009 pandemic A/H1N1, which emerged from swine and replaced the previously circulating A/H1N1 subtype). Influenza B viruses often co-circulate with influenza A virus as the minority influenza type in seasonal epidemics. A non-human reservoir has not been conclusively identified for influenza B virus, and the diversity of influenza B virus is more limited compared to influenza A virus. Two antigenically distinct (based on HA), co-circulating type B lineages (Yamagata and Victoria) have been identified that appear to have diverged in the 1970s (reviewed in van de Sandt et al., 2015). Influenza type C virus infection is rarely diagnosed and typically causes only mild illness in adults and adolescents, although it has been associated with severe disease in young children (Calvo et al., 2006).
Influenza virus infection is initiated in the respiratory tract, and inoculation can occur through fomite contact, physical contact with infected individuals or by inhalation of respiratory droplets. Infection initiates in the upper or lower respiratory tract, depending on the route of inoculation and on the size of the respiratory droplet when inhaled; infection of the lower respiratory tract is often associated with more severe disease (Alford, RH et al., 1966; Douglas, RG, Jr. et al., 1975; Little, JW et al., 1979; Hayden, FG et al., 2000; Kaiser, L et al., 2000; Memoli, MJ et al., 2014). In adults, incubation times can vary between 1 to 3 days, and the onset of symptoms occurs within hours of detectable virus shedding, which typically peaks 2 to 3 days after exposure. Virus shedding typically resolves along with symptoms between 4-8 days after infection (Richman, DD et al., 1976; Hayden, FG et al., 1998; Lessler, J et al., 2009; Winzer, R et al., 2009; Bautista, E et al., 2010; Lau, LL et al., 2010; Yamagishi, T et al., 2010; Memoli, MJ et al., 2014), but can be prolonged in immunocompromised individuals (Memoli, MJ et al., 2014).
In children, infection and disease follow a course similar to that in adults; however, the duration of virus shedding may in some cases be extended in children, and virus may be shed for longer periods prior to the onset of symptoms and after symptoms have resolved (Glezen and Couch, 1978; Frank et al., 1981; Harper et al., 2009; Li et al., 2010; Bhattarai et al., 2011; Ng et al., 2016; American Academy of Pediatrics:
Reference ID: 4324543

DIVISION OF ANTIVIRAL PRODUCTS (HFD-530)VIROLOGY REVIEW
NDA: 210854 SDN: 000 (SN 0000) DATE REVIEWED: 09/10/2018Virology Reviewers: William Ince, Ph.D. and Michael Thomson, Ph.D.
14
Recommendations for prevention and control of influenza in children, 2016–2017). The emergence of variants with reduced susceptibility to neuraminidase inhibitors has also been reported to be more frequent in pediatric subjects (Kiso et al., 2004; Stephenson et al., 2009; TAMIFLU label), although the frequency of emergent and circulating resistant variants, in general, depends on the permissibility of strains to acquire substitutions that reduce susceptibility, which changes as the virus evolves season to season or is replaced by new strains (Bloom et al., 2010).
1.1.2 The relationship between virus inhibition and clinical outcomesWhile there is a clear correlation between the onset and resolution of virus shedding and the onset and resolution of signs and symptoms during the natural course of disease in most subjects (Lau, LL et al., 2010), studies evaluating the relationship between virus or viral RNA shedding and clinical outcome in antiviral treatment trials have generally failed to identify a clear association (Beigel et al., 2017; Bradley et al., 2017). The disconnect between antiviral-mediated reductions in virus shedding and clinical outcomes may be a result of insufficient antiviral activity, such that there is a lack of an effect on clinical outcomes if virus is not inhibited enough or is inhibited too late after the initiation of infection (Aoki et al., 2003; Marty et al., 2017). Alternatively, an association between virus shedding and clinical outcomes may depend on the anatomical site sampled (e.g. upper vs lower respiratory tract), or the analyte evaluated (viral RNA vs virus).
1.1.3 Virus life-cycle and cap-dependent viral gene expressionInfluenza virus entry into respiratory epithelial cells, its primary target cell, is mediated by binding of the viral hemagglutinin (HA) envelope glycoprotein to sialic acid sugars present on cell membrane components (Wagner et al., 2002). After binding to the cell, the virus is endocytosed, and acidic conditions in the late endosome induce a conformational change in HA that results in the fusion of the viral and cellular membranes. The integral membrane protein M2 acts as an ion channel allowing protons in the endosome to move through the viral envelope and acidify the core of the virus. Internal acidification of the influenza virion disrupts protein-protein interactions and releases the viral ribonucleoprotein (RNP) complexes into the cytoplasm after endosomal-virus membrane fusion (Lakadamyali et al., 2003; Bouvier and Palese, 2008). Each RNP complex consists of one of eight antisense, genomic RNA segments bound by nucleoprotein (NP) and members of the heterotrimeric RNA-dependent RNA polymerase complex (PA, PB1, and PB2 subunits). The RNP complexes are then transported into the cell nucleus (mediated by karyopherins recruited to a nuclear localization signal located in NP), where the RNA-dependent RNA polymerase begins transcribing viral mRNA and synthesizing viral genomic RNA (Cros and Palese, 2003).
The influenza virus polymerase complex initiates viral mRNA transcription using a “cap-snatching” mechanism (Plotch et al., 1981; Li et al., 2001; Dias et al., 2009), a strategy shared with Arenaviridae and Bunyaviridae families of negative-sense single-stranded RNA viruses (Morin et al., 2010; Reguera et al., 2010). In order to function in eukaryotic cells, viral mRNA requires 5’ 7-methylguanosine (m7G) capping mediated by methyl transferases. Influenza A virus (IAV) does not encode a methyl transferase but has evolved to bind and cleave off 5’ m7G cap-containing oligomers from host mRNAs which are then used to prime viral transcription to produce functional viral mRNAs with host-derived 5’ m7G caps (Krug et al., 1979). Based on high resolution structural studies, along with mutagenesis, a specific site in PB2 encompassing amino acid residues 324-432 was identified that binds the m7G cap on host mRNA (Guilligay et al., 2008) facilitating endonucleolytic release of the m7G cap from host mRNA by the endonuclease activity of PA, thereby generating 10-13 nucleotide-long 5’ m7G cap-containing oligomers. The endonucleolytic activity of the PA gene resides in the N-terminal domain (within amino acid residues 1-209, approximately), which contains a conserved, divalent-cation-dependent (maximally active with Mn2+) endonuclease site (Dias et al., 2009; Yuan et al., 2009). PA endonucleotytic activity itself does not appear to be m7G-cap-dependent in biochemical assays, outside of the context of the heterotrimeric polymerase complex (Noble et al., 2013). The 5’ m7G-capped oligomers, coordinated by PB2, are then used to prime viral mRNAs synthesized by the RNA-dependent RNA polymerase activity of PB1, which are then polyadenylated at their 3' ends by stuttering of the polymerase at an oligo-U motif near the 5'
Reference ID: 4324543
DIVISION OF ANTIVIRAL PRODUCTS (HFD-530)VIROLOGY REVIEW
NDA: 210854 SDN: 000 (SN 0000) DATE REVIEWED: 09/10/2018Virology Reviewers: William Ince, Ph.D. and Michael Thomson, Ph.D.
15
end of the template (Poon et al., 1999). The separate process of genomic RNA replication does not require 5’ m7G-capped oligomers.
In addition to PA’s role in viral transcription, the endonucleolytic activity of the PA gene, by way of an alternative translation product (arising from ribosomal frameshifting) containing the endonuclease active site, PA-X, has been implicated in shutting down host-cell gene expression and suppressing innate immune responses (Jagger et al., 2012; Desmet et al., 2013; Hayashi et al., 2015; Khaperskyy et al., 2016). RNP-independent PA-X may degrade host-cell mRNAs to effectively reduce host cell gene expression (Jagger et al., 2012; Desmet et al., 2013). Some evidence indicates that PA-X may selectively target host RNA polymerase II transcripts dependent upon unique 3’ end processing by RNA polymerase II, and may also degrade RNA polymerase II-transcribed non-coding RNAs (Hayashi et al., 2015).
Blocking PA endonuclease activity with a small molecule inhibitor has been shown to inhibit viral replication and select for variants with reduced susceptibility to the inhibitor that have substitutions in the PA active site (Song et al., 2016).
1.2 Important Milestones in Product Development1.3 Methodology Virus quantitation:Studies T0821, T0831, and T0822: Virus was quantified from respiratory specimens using a TCID50 assay carried out by Respiratory specimens in universal transport medium (virus stability in universal transport medium was evaluated in study report EB-265-N) were diluted 10-fold (100 to 107) in viral assay medium (containing TPCK-trypsin), and added to confluent MDCK-SIAT1 (Matrosovich et al., 2003) monolayers in 96 well plates (4 dilution series per test sample) followed by centrifuging at 1,000 rpm (Tomy Seiko Co., Ltd.; LC-200 body with TS-4 rotor or LC-230 body with TS-38 rotor) for 30 minutes [Mills et al., 1989; Seno et al., 1991]) at room temperature. Infection medium was removed and cells were washed once with viral assay medium and incubated for 3 days in a humidified incubator at 33˚C in viral assay medium. After the incubation period, virus-induced cytopathic effect (CPE) was evaluated under a microscope, and the viral titers were calculated as TCID50/mL using the Behrens-Karber method (Behrens and Karber, 1935, Wie sind Reihenwersuche für biologische Auswertungen am sweck-mässigten anzuordnen? see Zlotkin et al., 1971). The LLOQ/LOD for the infectivity (virus) assay was 0.7 log10 TCID50/mL (CF-120-N).
Viral RNA quantitation:Study T0821: Viral RNA quantitation and typing for study T0821 were carried out by
RNA extracted from clinical specimens (viral RNA stability in universal transport medium was evaluated in study report EB-266-N) was quantified and typed in one assay followed by influenza A virus subtyping in a separate assay. For viral RNA quantitation and typing, the FTD FLU/HRSV assay (Fast Track Diagnostics, Malta) was used, which is a multiplex, real-time RT-PCR assay that includes 4 probes differentially labeled with fluorophors (indicated in parentheses) that can distinguish influenza A virus (FAM), influenza B virus (ROX), RSV A/B (VIC) (gene target not specified). In the subsequent FTD FLU Differentiation assay (Fast Track Diagnostics, Malta), influenza A virus subtypes were identified using primer/probe sets that distinguish between H1 (Cy-5), H3 (FAM), H5 (VIC), and H7 (ROX) (CF-121-N). The gene target and primer sequences were not made available by the manufacturer of the assay. The assay was validated by the manufacturer on a panel of 60 respiratory specimens including 20 positive for influenza A virus (subtype not specified), 20 positive for influenza B virus and on external quality assurance panels (EQA panels; see Instand e.V. and QCMD). Results reported for a panel containing 5 subtype A/H1N1 (2009 pandemic lineage) strains, 6 subtype A/H3N2 strains, 1 subtype A/H5N1 strain, and 10 type B strains, indicated the assay detected all viruses. In addition, performance on a panel containing 20 subtype A/H3N2 (dated 2009-2012), 20 subtype A/H1N1 (2009 pandemic lineage, dated 2011) and 5 subtype A/H7N9 (dated 2013) viruses, was compared against an “in-house” real-time RT-PCR assay, and the assay successfully typed 44/45 positive samples tested. Insufficient information was provided to evaluate the titer or geographical and temporal breadth of
Reference ID: 4324543
(b) (4)
(b) (4)
DIVISION OF ANTIVIRAL PRODUCTS (HFD-530)VIROLOGY REVIEW
NDA: 210854 SDN: 000 (SN 0000) DATE REVIEWED: 09/10/2018Virology Reviewers: William Ince, Ph.D. and Michael Thomson, Ph.D.
16
diversity of panels (SDN 020; I126653.10). The sponsor carried out an independent validation of the assay using the following strains: A/California/7/2009 (H1N1, 2009 pandemic lineage), A/Brisbane/59/2007 (H1N1), A/Victoria/361/2011 (H3N2), and B/Wisconsin/01/2010. In study report CF-121-N, the sponsor determined the lower limit of quantitation (LLOQ) as 8.25x10³ (3.916 log10) copies/mL; however, based on clinical study data (and the stated LLOQ defined within datasets) the sponsor adjusted the LLOQ to 4.13x10³ (3.616 log10) copies/mL. The detection limit of the assay was reported to be below 4.13x10³ copies/mL, at 2.05x10³, 3.03x10³, and 2.42x10³ copies/mL for subtype A/H1N1 (2009 pandemic lineage), subtype A/H3N2, and type B viruses, respectively (the assay was reported to have low sensitivity for pre-2009-pandemic A/H1N1 virus); however, the limit of detection (LOD) was not established based on ≥95% success (CF-121-N). Values <LLOQ were not reported as detected or not and were imputed as 4.13x10³ (3.616 log10) copies/mL. The limit of detection for the influenza A subtype and differentiation assay (FTD FLU Differentiation assay) was reported as 2.16x10⁴ and 1.69x10⁴, for A/H1N1(2009 pandemic lineage) and A/H3N2, respectively; however, this was not based on a 95% detection rate.
Studies T0831 and T0822: Viral RNA quantitation and typing for phase 3 studies T0831 and T0822 were carried out by
(RPT-VAL-AMD-TYP-FAST-FNL). Multiplex real-time RT-PCR assay (TaqMan®) assays were used for quantitation, typing, and subtyping of influenza virus RNA from clinical specimens.
Reference ID: 4324543
(b) (4)
(b) (4)
(b) (4)

DIVISION OF ANTIVIRAL PRODUCTS (HFD-530)VIROLOGY REVIEW
NDA: 210854 SDN: 000 (SN 0000) DATE REVIEWED: 09/10/2018Virology Reviewers: William Ince, Ph.D. and Michael Thomson, Ph.D.
17
influenza type B viruses (characteristics not otherwise identified). Viruses used to confirm specificity included parainfluenza virus types 1-3, coronavirus strains OC43 and 229e, and RSV A and B clinical isolates. The quantitative ranges (upper and lower) for type A and B influenza viruses were 2.18-10.48 log10 copies/mL and 2.93-9.93 log10 copies/mL (reported as “vp/mL”), respectively. The limits of detection for type A and B viruses were 2.05 log10 copies/mL and 2.83 log10 copies/mL, respectively, based on a 95% detection rate (30 replicates).
Baseline phenotypic analysis:Study T0821: Baseline EC50 values for baloxavir were determined in a plaque number reduction assay performed by (validation of methods, CF-120-N; study data collection, CF-157-N). MDCK-SAIT1 cells (Matrosovich et al., 2003) were plated to 6-well tissue culture plates and incubated for 1 day to confluency. Cells were inoculated with dilutions (targeting 20 and 100 PFU/well) and incubated for 1 hour (33˚C tilting incubator) before virus-containing medium was removed. After absorption, virus medium was removed, cells were washed once, and overlaid with agarose medium containing a range of dilutions of baloxavir. Cultures were inverted after solidification of agarose and incubated for 3 days at 33˚C. After incubation, cells were fixed and stained, and plaques were independently counted under a microscope by two operators. Linear regression was used to determine the EC50 value (CF-120-N). Reference strains for influenza type A (for both A/H1N1 and A/H3N2) and type B viruses were A/Victoria/361/2011 (A/H3N2) and B/Wisconsin/1/2010, respectively. The EC50 values of the reference strains ranged between 0.22-0.92 nM and 2.7-3.4 nM, respectively, in study T0821.
Studies T0831 and T0822: Baseline EC50 values for baloxavir were evaluated using the Virospot assay performed by (validation report: EF-230-N; study data collection: CB-247-N). The Virospot assay uses immunostaining of cells to derive the proportion of cells infected in a 96-well format. Briefly, 90%-100% confluent monolayers of MDCK cells in 96-well tissue culture plates were inoculated with influenza virus isolated from clinical specimens at prepared concentrations ranging from 3 to 10,000 TCID50/well. Virus was then removed, and cells were incubated for 1 or 2 days in the presence of baloxavir (10 concentrations, 0.5 log10 steps, range 0.01 – 316 nM), or in the presence of a control drug (favipiravir). Cultures of virus in the absence of inhibitor or virus served as un-treated controls and cytotoxicity controls, respectively. All concentrations of viruses were measured in parallel plates by back titration with a carboxymethyl cellulose overlay followed by immunostaining of plaques. PFU/well values were used to estimate the TCID50/well input, based on the formula of 1 TCID50 = 0.7 PFU. The proportion of infected cells in a well in the presence and absence of the inhibitors was detected by nucleoprotein-specific immunoperoxidase staining and automated counting of stained cells. A value derived from the proportion of stained cells in a well (well area covered [WAC]) was used as raw data to compute the inhibitor concentration required for 50% inhibition of the maximal signal by nonlinear regression (EC50 value). Reference strains used for type A subtypes A/H1N1 and A/H3N2 and type B virus were A/California/7/2009 (A/H1N1), A/Victoria/361/2011 (A/H3N2), B/Brisbane/60/2008 (Victoria lineage) and B/Wisconsin/1/2010 (Yamagata lineage).
EC50 values obtained with the Virospot assay can range between 2-fold and 15-fold greater than EC50 values obtained with a standard plaque reduction assay for the same virus or virus types (based on the data from study reports EB-235-N, EB-276-N, and EB-290-N, which evaluated susceptibility of cloned wild-type virus and variants with resistance-associated substitutions using a plaque reduction assay). In addition, the measurement capability of the Virospot assay may be more restricted; while the Virospot and plaque reduction assays yield similar fold-changes for viruses with large differences in susceptibility (I38T [see below] confers a 27-fold and 29-fold change in A/H1N1 A/WSN/33 in the plaque reduction [EB-235-N], and Virospot [EF-230-N] assays, respectively), the Virospot assay appears to have lower resolution for viruses with fold-changes <10 in the plaque reductions assay, based on validation reports (EC50 values for influenza B viruses are approximately 10-fold higher than influenza A viruses in the plaque reduction assay [EB-235-N], compared to approximately 4-fold higher in the Virospot assay [EF-230-N]).
Reference ID: 4324543
(b) (4)
(b) (4)
DIVISION OF ANTIVIRAL PRODUCTS (HFD-530)VIROLOGY REVIEW
NDA: 210854 SDN: 000 (SN 0000) DATE REVIEWED: 09/10/2018Virology Reviewers: William Ince, Ph.D. and Michael Thomson, Ph.D.
18
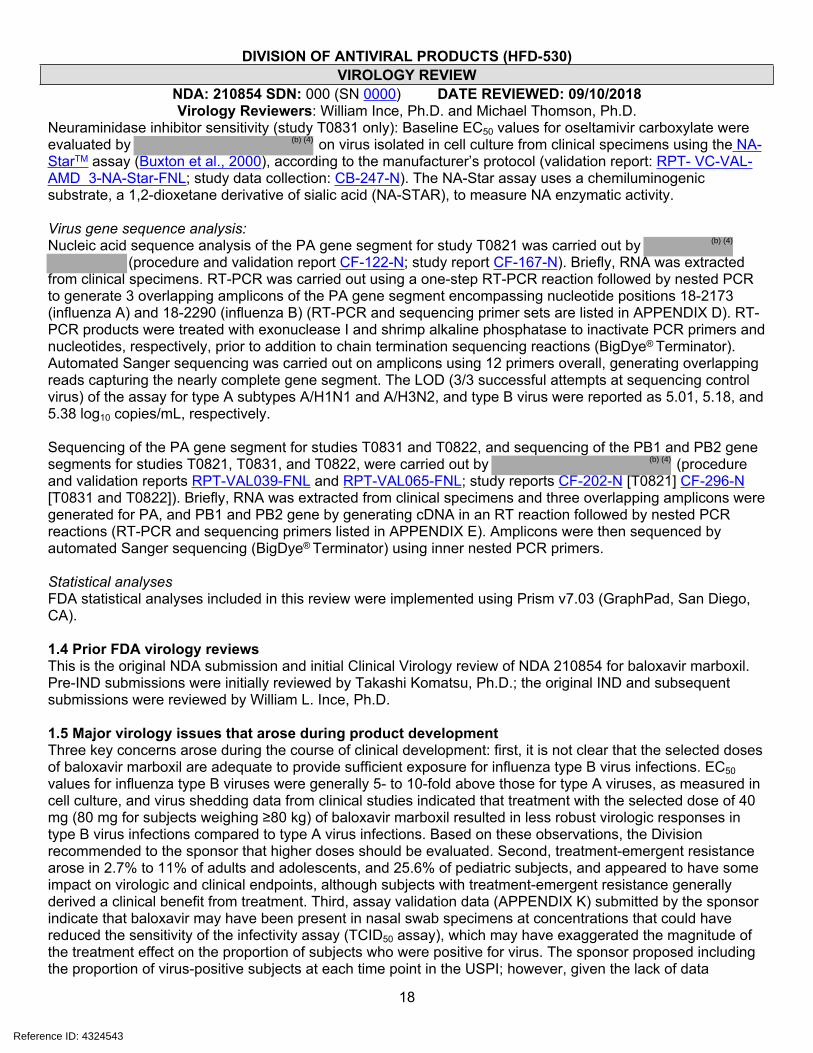
Neuraminidase inhibitor sensitivity (study T0831 only): Baseline EC50 values for oseltamivir carboxylate were evaluated by on virus isolated in cell culture from clinical specimens using the NA-StarTM assay (Buxton et al., 2000), according to the manufacturer’s protocol (validation report: RPT- VC-VAL-AMD 3-NA-Star-FNL; study data collection: CB-247-N). The NA-Star assay uses a chemiluminogenic substrate, a 1,2-dioxetane derivative of sialic acid (NA-STAR), to measure NA enzymatic activity.
Virus gene sequence analysis: Nucleic acid sequence analysis of the PA gene segment for study T0821 was carried out by
(procedure and validation report CF-122-N; study report CF-167-N). Briefly, RNA was extracted from clinical specimens. RT-PCR was carried out using a one-step RT-PCR reaction followed by nested PCR to generate 3 overlapping amplicons of the PA gene segment encompassing nucleotide positions 18-2173 (influenza A) and 18-2290 (influenza B) (RT-PCR and sequencing primer sets are listed in APPENDIX D). RT-PCR products were treated with exonuclease I and shrimp alkaline phosphatase to inactivate PCR primers and nucleotides, respectively, prior to addition to chain termination sequencing reactions (BigDye® Terminator). Automated Sanger sequencing was carried out on amplicons using 12 primers overall, generating overlapping reads capturing the nearly complete gene segment. The LOD (3/3 successful attempts at sequencing control virus) of the assay for type A subtypes A/H1N1 and A/H3N2, and type B virus were reported as 5.01, 5.18, and 5.38 log10 copies/mL, respectively.
Sequencing of the PA gene segment for studies T0831 and T0822, and sequencing of the PB1 and PB2 gene segments for studies T0821, T0831, and T0822, were carried out by (procedure and validation reports RPT-VAL039-FNL and RPT-VAL065-FNL; study reports CF-202-N [T0821] CF-296-N [T0831 and T0822]). Briefly, RNA was extracted from clinical specimens and three overlapping amplicons were generated for PA, and PB1 and PB2 gene by generating cDNA in an RT reaction followed by nested PCR reactions (RT-PCR and sequencing primers listed in APPENDIX E). Amplicons were then sequenced by automated Sanger sequencing (BigDye® Terminator) using inner nested PCR primers.
Statistical analysesFDA statistical analyses included in this review were implemented using Prism v7.03 (GraphPad, San Diego, CA).
1.4 Prior FDA virology reviewsThis is the original NDA submission and initial Clinical Virology review of NDA 210854 for baloxavir marboxil. Pre-IND submissions were initially reviewed by Takashi Komatsu, Ph.D.; the original IND and subsequent submissions were reviewed by William L. Ince, Ph.D.
1.5 Major virology issues that arose during product developmentThree key concerns arose during the course of clinical development: first, it is not clear that the selected doses of baloxavir marboxil are adequate to provide sufficient exposure for influenza type B virus infections. EC50 values for influenza type B viruses were generally 5- to 10-fold above those for type A viruses, as measured in cell culture, and virus shedding data from clinical studies indicated that treatment with the selected dose of 40 mg (80 mg for subjects weighing ≥80 kg) of baloxavir marboxil resulted in less robust virologic responses in type B virus infections compared to type A virus infections. Based on these observations, the Division recommended to the sponsor that higher doses should be evaluated. Second, treatment-emergent resistance arose in 2.7% to 11% of adults and adolescents, and 25.6% of pediatric subjects, and appeared to have some impact on virologic and clinical endpoints, although subjects with treatment-emergent resistance generally derived a clinical benefit from treatment. Third, assay validation data (APPENDIX K) submitted by the sponsor indicate that baloxavir may have been present in nasal swab specimens at concentrations that could have reduced the sensitivity of the infectivity assay (TCID50 assay), which may have exaggerated the magnitude of the treatment effect on the proportion of subjects who were positive for virus. The sponsor proposed including the proportion of virus-positive subjects at each time point in the USPI; however, given the lack of data
Reference ID: 4324543
(b) (4)
(b) (4)
(b) (4)

DIVISION OF ANTIVIRAL PRODUCTS (HFD-530)VIROLOGY REVIEW
NDA: 210854 SDN: 000 (SN 0000) DATE REVIEWED: 09/10/2018Virology Reviewers: William Ince, Ph.D. and Michael Thomson, Ph.D.
19
supporting a link between this endpoint and either clinical outcomes related to the indication or virus transmission, and the questionable reliability of the data due to drug carryover, inclusion of these data in the USPI is not supported.
1.6 State of antivirals used for the indication soughtWhile vaccines are a key public health measure for reducing influenza disease burden, periodic antigenic escape and variable vaccine effectiveness, along with evolving resistance to current therapies, requires the continued development of new treatment options for influenza. Two classes of drugs have been approved by the FDA to treat or prevent influenza virus infection, adamantanes and neuraminidase inhibitors (NAIs). The adamantanes (amantadine [SYMMETREL®, NDAs 16020, 16023, 17118, and 18101; approved October 18, 1966] and rimantadine [FLUMADINE®, NDAs 19649 and 19650; approved September 17, 1993]), are M2 proton channel inhibitors and are licensed for treatment of influenza A virus infection only; however, use of these drugs is currently not recommended due to widespread resistance (Schirmer and Holodniy, 2009; Cheng et al., 2012; McKimm-Breschkin, 2013). FDA-approved neuraminidase inhibitors include zanamivir (RELENZA®, NDA 21036, initially approved July 26, 1999), administered by inhalation and approved for the prevention and treatment of influenza in subjects 7 years and older (5 years or older for prophylaxis); oseltamivir (TAMIFLU®, NDAs 21087 and 21246; initially approved October 27, 1999), administered orally and approved for the prevention and treatment of uncomplicated influenza in subjects 2 weeks and older (1 year or older for prophylaxis); and peramivir (RAPIVAB®, NDA 206426, initially approved December 19, 2014), administered intravenously and approved for the treatment of acute uncomplicated influenza in subjects 2 years and older. Neuraminidase inhibitors exhibit approximately 3- to 25-fold reduced activity against influenza type B virus, compared to influenza A virus, in biochemical neuraminidase inhibition assays (RAPIVAB®; RELENZA®; TAMIFLU®) and limited enrollment of type B subjects in clinical trials used to support initial approval failed to provide strong evidence of clinical efficacy against influenza B virus infections for all three NAIs approved in the U.S.; however, RELENZA and TAMIFLU are currently specifically indicated for treatment of influenza A and B virus infections based on accumulated treatment data for influenza B virus infections. All three NAIs are active in cell culture against the majority of currently circulating influenza A and B virus strains, although subtype A/H1N1 viruses resistant to oseltamivir have circulated as the predominant virus in previous epidemics. All neuraminidase inhibitors are currently indicated for treatment of subjects who have been symptomatic for no more than 2 days.
The rate of treatment-emergent resistance to NAIs varies and may depend on the virus type/subtype, strain, season, and patient population. For oseltamivir, reliable data (genotyping of RNA obtained directly from clinical specimens) on the rates of treatment-emergent resistance are limited, but have been reported to range from 0.9 to 4.9% for A/H1N1 viruses, and from 0.9 to 3.9% for A/H3N2 viruses from season to season in adults (IRIS resistance surveillance study; NCT00884117, I053093.686; healthy adult volunteers experimentally infected with influenza virus and treated with oseltamivir [Gubareva et al., 2001]), and to 17% in immunocompromised subjects (Fraaij et al., 2015; NCT00884117). In pediatric studies of oseltamivir, treatment-emergent resistance rates have been observed to be higher, ranging from 27 to 37% for subtype A/H1N1 virus and 3 to 18% for subtype A/H3N2 virus across studies (TAMIFLU® USPI, 2016; I053093.686) (adequate data are limited for influenza type B virus). The rates of treatment-emergent resistance observed for NAIs may be underestimated due to limitations of the methods used to evaluate resistance in most studies, including the amplification of isolates in cell culture prior to evaluations, which can select for wild type virus; the use of phenotypic assays to detect variants with reduced susceptibility, which has been shown to be relatively insensitive, particularly if resistant variants exist as a mixture with wild type (Wetherall et al., 2003); and the use of allele-specific RT-PCR, which may not capture less-common resistance pathways.
In hospitalized subjects treated with IV zanamivir (NAI113678 [NCT01014988]: A Phase II open-label, multi-center, single arm study to evaluate the safety and tolerability of IV zanamivir in the treatment of hospitalized adult, adolescent and pediatric subjects with confirmed influenza infection [I043776.486; I043776.477]), treatment-emergent resistance (as determined by direct sequencing of clinical specimens) may have been as
Reference ID: 4324543
DIVISION OF ANTIVIRAL PRODUCTS (HFD-530)VIROLOGY REVIEW
NDA: 210854 SDN: 000 (SN 0000) DATE REVIEWED: 09/10/2018Virology Reviewers: William Ince, Ph.D. and Michael Thomson, Ph.D.
20
high as 20%, including all NA and HA substitutions that were observed as treatment-emergent in at least one case (8/38; Yates et al., 2016; I043776.477).
In study NAI114373 [NCT01231620]: A Phase 3 international, randomized, double-blind study to evaluate the efficacy and safety of 300 mg or 600 mg of intravenous zanamivir twice-daily compared to 75 mg of oral oseltamivir twice-daily in the treatment of hospitalized adults and adolescents with influenza (Marty et al., 2017), rates of treatment-emergent resistance (as determined by direct sequencing of clinical specimens) for oseltamivir treatment ranged from 4 to 13% for A/H3N2 and A/H1N1 viruses. Overall treatment-emergent resistance to IV zanamivir was 2 to 4% for A/H3N2 and A/H1N1 viruses (I043776.508; see study report NAI117364, p. 115). These rates do not account for as yet unverified potential resistance-associated substitutions that arose in only one subject.
2. NONCLINICAL VIROLOGY
2.1 Mechanism of action (study numbers R-033188-EB-078-N, R-033188-EB-082-N, S-033188-EB-201-N)
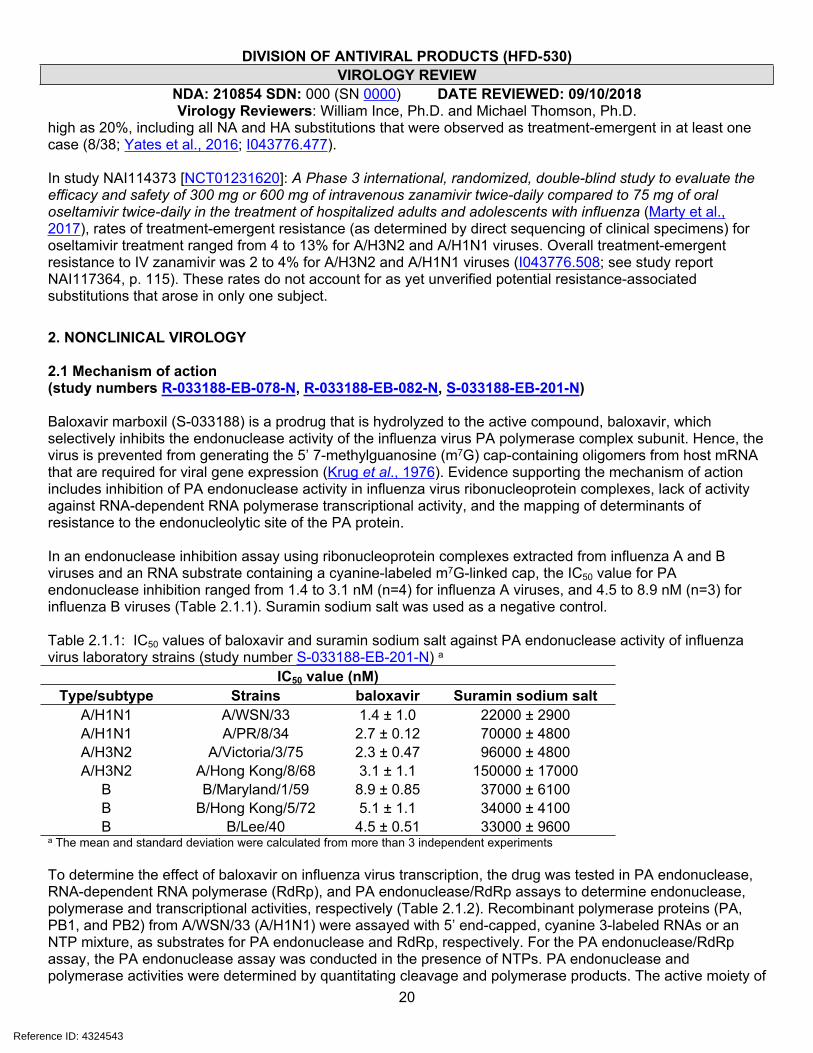
Baloxavir marboxil (S-033188) is a prodrug that is hydrolyzed to the active compound, baloxavir, which selectively inhibits the endonuclease activity of the influenza virus PA polymerase complex subunit. Hence, the virus is prevented from generating the 5’ 7-methylguanosine (m7G) cap-containing oligomers from host mRNA that are required for viral gene expression (Krug et al., 1976). Evidence supporting the mechanism of action includes inhibition of PA endonuclease activity in influenza virus ribonucleoprotein complexes, lack of activity against RNA-dependent RNA polymerase transcriptional activity, and the mapping of determinants of resistance to the endonucleolytic site of the PA protein.
In an endonuclease inhibition assay using ribonucleoprotein complexes extracted from influenza A and B viruses and an RNA substrate containing a cyanine-labeled m7G-linked cap, the IC50 value for PA endonuclease inhibition ranged from 1.4 to 3.1 nM (n=4) for influenza A viruses, and 4.5 to 8.9 nM (n=3) for influenza B viruses (Table 2.1.1). Suramin sodium salt was used as a negative control.
Table 2.1.1: IC50 values of baloxavir and suramin sodium salt against PA endonuclease activity of influenza virus laboratory strains (study number S-033188-EB-201-N) a
IC50 value (nM)Type/subtype Strains baloxavir Suramin sodium salt
A/H1N1 A/WSN/33 1.4 ± 1.0 22000 ± 2900A/H1N1 A/PR/8/34 2.7 ± 0.12 70000 ± 4800A/H3N2 A/Victoria/3/75 2.3 ± 0.47 96000 ± 4800A/H3N2 A/Hong Kong/8/68 3.1 ± 1.1 150000 ± 17000
B B/Maryland/1/59 8.9 ± 0.85 37000 ± 6100B B/Hong Kong/5/72 5.1 ± 1.1 34000 ± 4100B B/Lee/40 4.5 ± 0.51 33000 ± 9600
a The mean and standard deviation were calculated from more than 3 independent experiments
To determine the effect of baloxavir on influenza virus transcription, the drug was tested in PA endonuclease, RNA-dependent RNA polymerase (RdRp), and PA endonuclease/RdRp assays to determine endonuclease, polymerase and transcriptional activities, respectively (Table 2.1.2). Recombinant polymerase proteins (PA, PB1, and PB2) from A/WSN/33 (A/H1N1) were assayed with 5’ end-capped, cyanine 3-labeled RNAs or an NTP mixture, as substrates for PA endonuclease and RdRp, respectively. For the PA endonuclease/RdRp assay, the PA endonuclease assay was conducted in the presence of NTPs. PA endonuclease and polymerase activities were determined by quantitating cleavage and polymerase products. The active moiety of
Reference ID: 4324543

DIVISION OF ANTIVIRAL PRODUCTS (HFD-530)VIROLOGY REVIEW
NDA: 210854 SDN: 000 (SN 0000) DATE REVIEWED: 09/10/2018Virology Reviewers: William Ince, Ph.D. and Michael Thomson, Ph.D.
21
baloxavir marboxil, baloxavir (S-033447), inhibited PA endonuclease activity, but not the RdRp activity when a synthetic PA endonuclease product was supplemented in the polymerase reaction, confirming that baloxavir targeted RNA cleavage activity, rather than polymerase activity. It is possible that baloxavir affects other roles of the PA endonuclease or polymerase complex beyond “cap-snatching” in cell culture, for example interfering with the PA-X ribonuclease host shutoff activities (Khaperskyy et al., 2016); it is interesting to note that the EC50 values for antiviral activity in cell culture (Section 2.2.1) are 2- to 3-fold lower than the IC50 values for PA endonuclease activity in biochemical assays.
Table 2.1.2: IC50 values of baloxavir, baloxavir marboxil, and suramin sodium salt against PA endonuclease, RdRp, and PA endonuclease /RdRp (in vitro transcription) activities of influenza A virus (study number R-033188-EB-082-N)
IC50 value (nM)a
baloxavir baloxavir marboxil Suramin sodium salt
Assay Mean SD Mean SD Mean SDPA endonuclease 2.5 0.78 530 110 11,000 2,800RdRp >40 - >5,000 - 5,700 1,200PA endonuclease/RdRp 1.6 0.17 340 70 7,400 950- Not calculated.a The mean and SD were calculated from 3 independent experiments.RdRp: RNA-dependent RNA polymerase
In silico modeling using the x-ray crystallographic structure of PA (Dias et al., 2009) identified seventeen amino acid residues, based on the sequence of the PA from influenza A/H1N1pdm virus, that appear to interact with baloxavir: A20, M21, Y24, E26, K34, A37, I38, H41, E80, R84, L106, D108, E119, I120, G121, Y130, and K134 (Figure 2.1.1).
Figure 2.1.1: Docking model of baloxavir to N-terminal domain of PA subunit (page 75, NDA Pharmacology Written Summary). Blue spheres represent manganese ions.
The data included in the NDA provide strong evidence for the mechanism of action of baloxavir marboxil as a PA endonuclease inhibitor, which inhibits m7G mRNA cap cleavage needed for priming viral mRNA synthesis; however additional studies could be carried out to further support the mechanism of action of baloxavir marboxil. For example, studies have not been performed to evaluate direct binding of baloxavir to purified PA protein, or to determine the impact of substitutions in the proposed binding site for baloxavir on PA endonuclease activity or protein stability.
Reference ID: 4324543

DIVISION OF ANTIVIRAL PRODUCTS (HFD-530)VIROLOGY REVIEW
NDA: 210854 SDN: 000 (SN 0000) DATE REVIEWED: 09/10/2018Virology Reviewers: William Ince, Ph.D. and Michael Thomson, Ph.D.
22
2.2 Cell culture studies2.2.1 Antiviral activity in cell culture (study numbers R-033188-EB-068-N, R-033188-EB-069-N, S-033188-EB-097-N, S-033188-EB-112-N, S-033188-EB-140-N, S-033188-EB-163-N, S-033188-EB-209-N, S-033188-EF-224-N, S-033188-EB-227-N, S-033188-EB-239-N, S-033188-EB-240-N, S-033188-EB-241-N, S-033188-EB-251-N, S-033188-EB-299-N, FRI-2017-S-033188-02)
Baloxavir (active moiety of baloxavir marboxil/S-033188) was tested for activity in cell culture against many different strains of influenza A and B virus, in a plaque reduction assay (Table 2.2.1.1), a cell protection assay (Table 2.2.1.1), and a virus titer reduction assay (Table 2.2.1.2). EC50 values were obtained for the plaque reduction and cell protection assays, and EC90 values for the virus titer reduction assay; for viruses with both EC50 and EC90 values determined, these values were similar, indicating steep dose response curves and specific inhibition. The different assay types yielded similar potency values, in the low to sub-nanomolar range.
In the Madin-Darby canine kidney (MDCK) cell-based plaque reduction assay, the median EC50 value of baloxavir against different influenza virus strains was 0.75 nM (range: 0.20-1.85 nM, n=21) for subtype A/H1N1 strains, 0.67 nM (range: 0.35-1.87 nM, n=20) for subtype A/H3N2 strains, and 5.97 nM (range: 3.33-13.00 nM, n=18) for type B strains. Hence, the median EC50 value for baloxavir was 8.0-fold and 8.9-fold higher against influenza type B viruses compared with subtype A/H1N1 and A/H3N2 viruses, respectively. The EC50 value of baloxavir against the two zoonotic strains (A/Hong Kong/483/97 [H5N1] and A/Anhui/1/2013 [H7N9]) was not determined, but was predicted to be 1.64 and 0.80 nM, respectively, based on the similarity between EC50 values determined by plaque assay and EC90 values determined by virus titer reduction assay (see below). Baloxavir was also tested in MDCK-SIAT1 cells, which express higher levels of human-like (α2,6-linked) sialic acid receptors compared to conventional MDCK cells (Hatakeyama et al., 2005), against several influenza virus strains (two A/H1N1 strains, four A/H3N2 strains and one B strain) using a plaque reduction assay, and had similar or up to 4-fold lower EC50 values compared with viruses tested in MDCK cells (study report S-033188-EB-239-N). A bridging study was also performed to compare the EC50 values that were obtained in the MDCK cell line used by the sponsor, with the MDCK cell line of the contracting facility used for some of the sponsor’s virologic assessments (study number S-033188-EF-224-N). This study showed good correlation of EC50 values (within 2-fold) for four H1N1 strains, two H3N2 strains and four type B strains.
The median EC90 values of baloxavir against different human influenza virus strains in the MDCK cell-based virus titer reduction assay were 0.83 nM (range: 0.40-0.95 nM, n=6) for subtype A/H1N1 strains, 0.81 nM (range: 0.63-0.98 nM, n=4) for subtype A/H3N2 strains and 4.42 nM (range: 2.05-6.48 nM, n=5) for type B strains. Hence, the median EC90 value for baloxavir against type B viruses was 5.1-fold and 5.4-fold higher compared with type A H1N1 and H3N2 viruses, respectively. Against animal strains of influenza virus, including two zoonotic avian strains (A/Hong Kong/483/97 [H5N1] and A/Anhui/1/2013 [H7N9]), the median EC90 value of baloxavir was 0.96 nM (range: 0.73-1.64 nM, n=7).
In lieu of generating activity data for baloxavir against a broader panel of global isolates, a hierarchical clustering of influenza strains circulating worldwide in the last decade was performed, using NCBI deposited genome sequences, and examining which clusters included 53 strains (17 H1N1, 17 H3N2 and 19 type B), for which baloxavir susceptibility data were available (study number FRI-2017-S-033188-02). For PA sequences of H1N1 and type B viruses at the nucleotide and amino acid level, strains with susceptibility data were distributed in all major hierarchical clusters. For H3N2 viruses, strains with susceptibility data were distributed in three of four major clusters at the nucleotide level, and four of seven clusters at the amino acid level. In the phylogenetic analysis, amino acid sequences of strains evaluated for susceptibility clustered with 98.86% (7031/7041 strains), 95.60% (4479/4685 strains), and 100.00% (3285/3285 strains) of H1N1, H3N2 and type B PA protein sequences, respectively, indicating that these strains were representative of phylogenetically diverse isolates.
Reference ID: 4324543
(b) (4)

DIVISION OF ANTIVIRAL PRODUCTS (HFD-530)VIROLOGY REVIEW
NDA: 210854 SDN: 000 (SN 0000) DATE REVIEWED: 09/10/2018Virology Reviewers: William Ince, Ph.D. and Michael Thomson, Ph.D.
23
Table 2.2.1.1: Mean EC50 values (nM) of baloxavir and favipiravir against different influenza virus strains in MDCK cells using a plaque reduction assay 1
Report Number
Influenza virus
subtypeInfluenza virus strain baloxavir favipiravir
A/H1N1 A/WSN/33 0.76 20237.37A/H1N1 A/WSN/33-NA/H275Y 2 0.49 19708.66A/H3N2 A/Victoria/3/75 0.76 10622.91A/H3N2 A/Hong Kong/8/68 0.35 5061.25
B B/Maryland/1/59 4.85 21061.74
S-033188-EB-112-N
(laboratory strains)
B B/Hong Kong/5/72 4.33 15798.81A/H1N1 A/Kadoma/3/2006 0.94 15921.25A/H1N1 A/Osaka/129/2009 0.26 5997.85A/H1N1 A/Osaka/180/2009 2 0.48 7781.85A/H1N1 A/Nagasaki/10N073/2011 0.20 7107.27A/H1N1 A/Kyoto/10K124/2011 2 0.35 7519.05A/H1N1 A/Kyoto/10K118/2011 0.80 9285.86A/H1N1 A/Hokkaido/13H020/2014 0.99 5699.56A/H1N1 A/Nagasaki/13N019/2014 0.52 5213.67A/H1N1 A/Nagasaki/13N059/2014 2 0.66 5529.57A/H3N2 A/Hyogo/10K051/2011 0.66 8578.24A/H3N2 A/Niigata/10F017/2011 0.43 10898.58A/H3N2 A/Niigata/11F027/2012 0.90 9997.65A/H3N2 A/Tokyo/11IM003/2012 0.49 8608.13A/H3N2 A/Hokkaido/12H048/2013 0.56 20102.12A/H3N2 A/Niigata/12F392/2013 0.68 10986.95A/H3N2 A/Kyoto/13SK042/2014 0.49 9930.30
S-033188-EB-097-N
(clinical isolates)
A/H3N2 A/Nagasaki/13N033/2014 0.42 6246.96A/H1N1 A/Hokkaido/07H002/2008 1.55 12399.34A/H1N1 A/Nagasaki/07N020/2008 2 0.73 9792.83A/H3N2 A/Niigata/05F067/2006 0.38 8474.14A/H3N2 A/Nagasaki/05N007/2006 0.80 5596.88A/H3N2 A/Kyoto/06K110/2007 0.55 7399.62
B B/Niigata/06F075/2007 4.72 9117.34B B/Gunma/06G040/2007 5.97 8695.90B B/Kyoto/08K015/2009 5.04 5057.36B B/Kyoto/11K272/2012 4.39 3839.75B B/Nagasaki/13N013/2013 4.03 7860.73B B/Niigata/13F044/2014 3.33 2376.55
S-033188-EB-227-N
(clinical isolates)
B B/Kyoto/13K042/2014 5.96 8531.80A/H1N1 A/Brisbane/59/2007 1.85 11806.44A/H1N1 A/California/7/2009 1.18 12350.37
S-033188-EB-239-N
A/H3N2 A/Victoria/361/2011 1.87 11431.86
Reference ID: 4324543
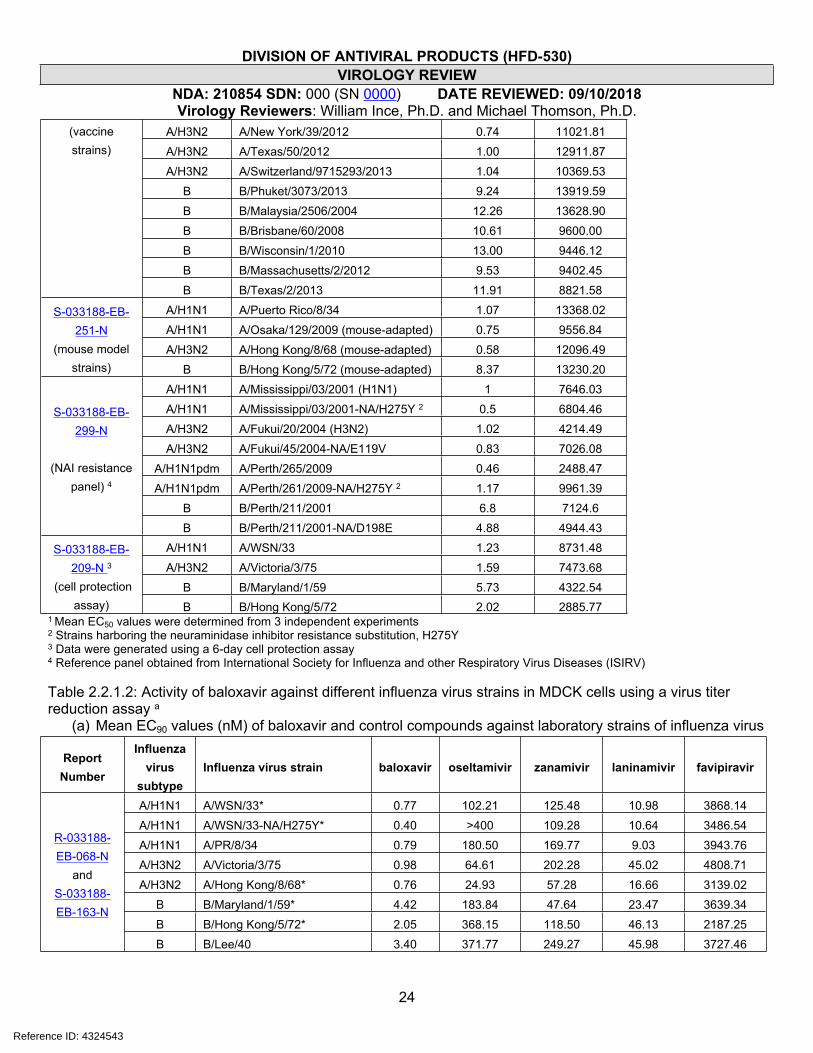
DIVISION OF ANTIVIRAL PRODUCTS (HFD-530)VIROLOGY REVIEW
NDA: 210854 SDN: 000 (SN 0000) DATE REVIEWED: 09/10/2018Virology Reviewers: William Ince, Ph.D. and Michael Thomson, Ph.D.
24
A/H3N2 A/New York/39/2012 0.74 11021.81A/H3N2 A/Texas/50/2012 1.00 12911.87A/H3N2 A/Switzerland/9715293/2013 1.04 10369.53
B B/Phuket/3073/2013 9.24 13919.59B B/Malaysia/2506/2004 12.26 13628.90B B/Brisbane/60/2008 10.61 9600.00B B/Wisconsin/1/2010 13.00 9446.12B B/Massachusetts/2/2012 9.53 9402.45
(vaccine strains)
B B/Texas/2/2013 11.91 8821.58A/H1N1 A/Puerto Rico/8/34 1.07 13368.02A/H1N1 A/Osaka/129/2009 (mouse-adapted) 0.75 9556.84A/H3N2 A/Hong Kong/8/68 (mouse-adapted) 0.58 12096.49
S-033188-EB-251-N
(mouse model strains) B B/Hong Kong/5/72 (mouse-adapted) 8.37 13230.20
A/H1N1 A/Mississippi/03/2001 (H1N1) 1 7646.03A/H1N1 A/Mississippi/03/2001-NA/H275Y 2 0.5 6804.46A/H3N2 A/Fukui/20/2004 (H3N2) 1.02 4214.49A/H3N2 A/Fukui/45/2004-NA/E119V 0.83 7026.08
A/H1N1pdm A/Perth/265/2009 0.46 2488.47A/H1N1pdm A/Perth/261/2009-NA/H275Y 2 1.17 9961.39
B B/Perth/211/2001 6.8 7124.6
S-033188-EB-299-N
(NAI resistance panel) 4
B B/Perth/211/2001-NA/D198E 4.88 4944.43A/H1N1 A/WSN/33 1.23 8731.48A/H3N2 A/Victoria/3/75 1.59 7473.68
B B/Maryland/1/59 5.73 4322.54
S-033188-EB-209-N 3
(cell protection assay) B B/Hong Kong/5/72 2.02 2885.77
1 Mean EC50 values were determined from 3 independent experiments2 Strains harboring the neuraminidase inhibitor resistance substitution, H275Y3 Data were generated using a 6-day cell protection assay4 Reference panel obtained from International Society for Influenza and other Respiratory Virus Diseases (ISIRV)
Table 2.2.1.2: Activity of baloxavir against different influenza virus strains in MDCK cells using a virus titer reduction assay a
(a) Mean EC90 values (nM) of baloxavir and control compounds against laboratory strains of influenza virus
Report Number
Influenza virus
subtypeInfluenza virus strain baloxavir oseltamivir zanamivir laninamivir favipiravir
A/H1N1 A/WSN/33* 0.77 102.21 125.48 10.98 3868.14A/H1N1 A/WSN/33-NA/H275Y* 0.40 >400 109.28 10.64 3486.54A/H1N1 A/PR/8/34 0.79 180.50 169.77 9.03 3943.76A/H3N2 A/Victoria/3/75 0.98 64.61 202.28 45.02 4808.71A/H3N2 A/Hong Kong/8/68* 0.76 24.93 57.28 16.66 3139.02
B B/Maryland/1/59* 4.42 183.84 47.64 23.47 3639.34B B/Hong Kong/5/72* 2.05 368.15 118.50 46.13 2187.25
R-033188-EB-068-N
andS-033188-EB-163-N
B B/Lee/40 3.40 371.77 249.27 45.98 3727.46
Reference ID: 4324543
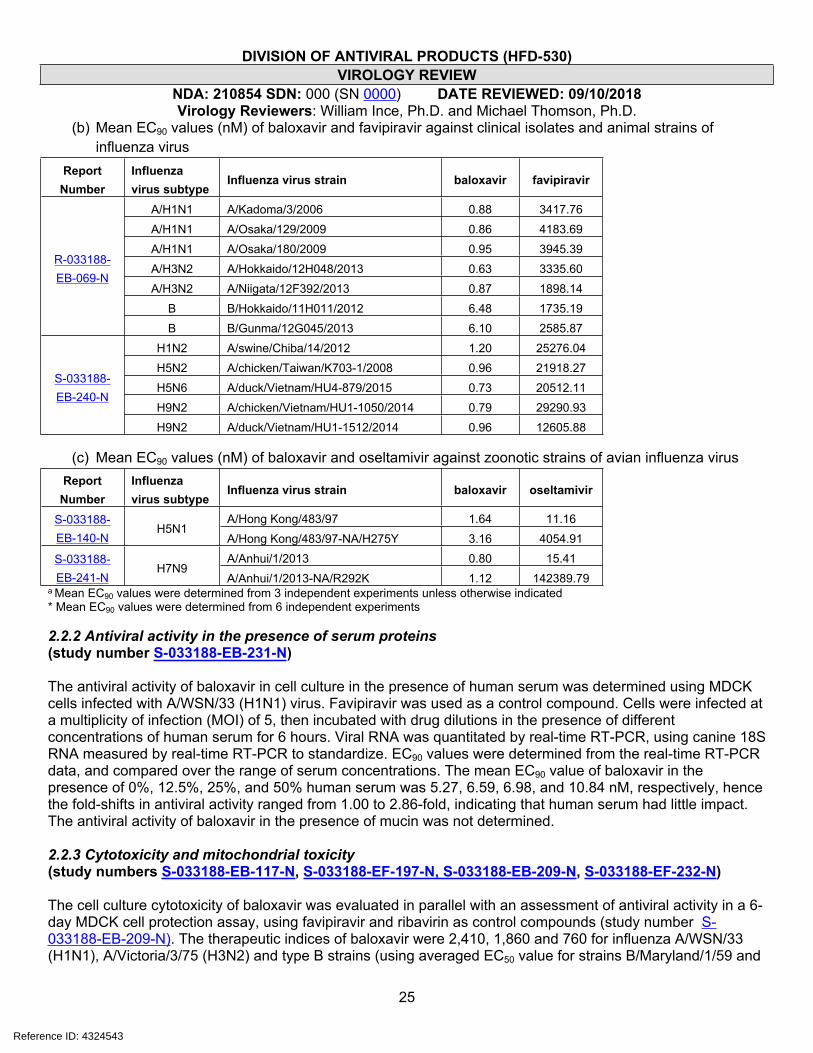
DIVISION OF ANTIVIRAL PRODUCTS (HFD-530)VIROLOGY REVIEW
NDA: 210854 SDN: 000 (SN 0000) DATE REVIEWED: 09/10/2018Virology Reviewers: William Ince, Ph.D. and Michael Thomson, Ph.D.
25
(b) Mean EC90 values (nM) of baloxavir and favipiravir against clinical isolates and animal strains of influenza virus
Report Number
Influenza virus subtype
Influenza virus strain baloxavir favipiravir
A/H1N1 A/Kadoma/3/2006 0.88 3417.76A/H1N1 A/Osaka/129/2009 0.86 4183.69A/H1N1 A/Osaka/180/2009 0.95 3945.39A/H3N2 A/Hokkaido/12H048/2013 0.63 3335.60A/H3N2 A/Niigata/12F392/2013 0.87 1898.14
B B/Hokkaido/11H011/2012 6.48 1735.19
R-033188-EB-069-N
B B/Gunma/12G045/2013 6.10 2585.87H1N2 A/swine/Chiba/14/2012 1.20 25276.04H5N2 A/chicken/Taiwan/K703-1/2008 0.96 21918.27H5N6 A/duck/Vietnam/HU4-879/2015 0.73 20512.11H9N2 A/chicken/Vietnam/HU1-1050/2014 0.79 29290.93
S-033188-EB-240-N
H9N2 A/duck/Vietnam/HU1-1512/2014 0.96 12605.88
(c) Mean EC90 values (nM) of baloxavir and oseltamivir against zoonotic strains of avian influenza virusReport
NumberInfluenza virus subtype
Influenza virus strain baloxavir oseltamivir
A/Hong Kong/483/97 1.64 11.16S-033188-EB-140-N
H5N1A/Hong Kong/483/97-NA/H275Y 3.16 4054.91A/Anhui/1/2013 0.80 15.41S-033188-
EB-241-NH7N9
A/Anhui/1/2013-NA/R292K 1.12 142389.79a Mean EC90 values were determined from 3 independent experiments unless otherwise indicated* Mean EC90 values were determined from 6 independent experiments
2.2.2 Antiviral activity in the presence of serum proteins (study number S-033188-EB-231-N)
The antiviral activity of baloxavir in cell culture in the presence of human serum was determined using MDCK cells infected with A/WSN/33 (H1N1) virus. Favipiravir was used as a control compound. Cells were infected at a multiplicity of infection (MOI) of 5, then incubated with drug dilutions in the presence of different concentrations of human serum for 6 hours. Viral RNA was quantitated by real-time RT-PCR, using canine 18S RNA measured by real-time RT-PCR to standardize. EC90 values were determined from the real-time RT-PCR data, and compared over the range of serum concentrations. The mean EC90 value of baloxavir in the presence of 0%, 12.5%, 25%, and 50% human serum was 5.27, 6.59, 6.98, and 10.84 nM, respectively, hence the fold-shifts in antiviral activity ranged from 1.00 to 2.86-fold, indicating that human serum had little impact. The antiviral activity of baloxavir in the presence of mucin was not determined.
2.2.3 Cytotoxicity and mitochondrial toxicity (study numbers S-033188-EB-117-N, S-033188-EF-197-N, S-033188-EB-209-N, S-033188-EF-232-N)
The cell culture cytotoxicity of baloxavir was evaluated in parallel with an assessment of antiviral activity in a 6-day MDCK cell protection assay, using favipiravir and ribavirin as control compounds (study number S-033188-EB-209-N). The therapeutic indices of baloxavir were 2,410, 1,860 and 760 for influenza A/WSN/33 (H1N1), A/Victoria/3/75 (H3N2) and type B strains (using averaged EC50 value for strains B/Maryland/1/59 and
Reference ID: 4324543
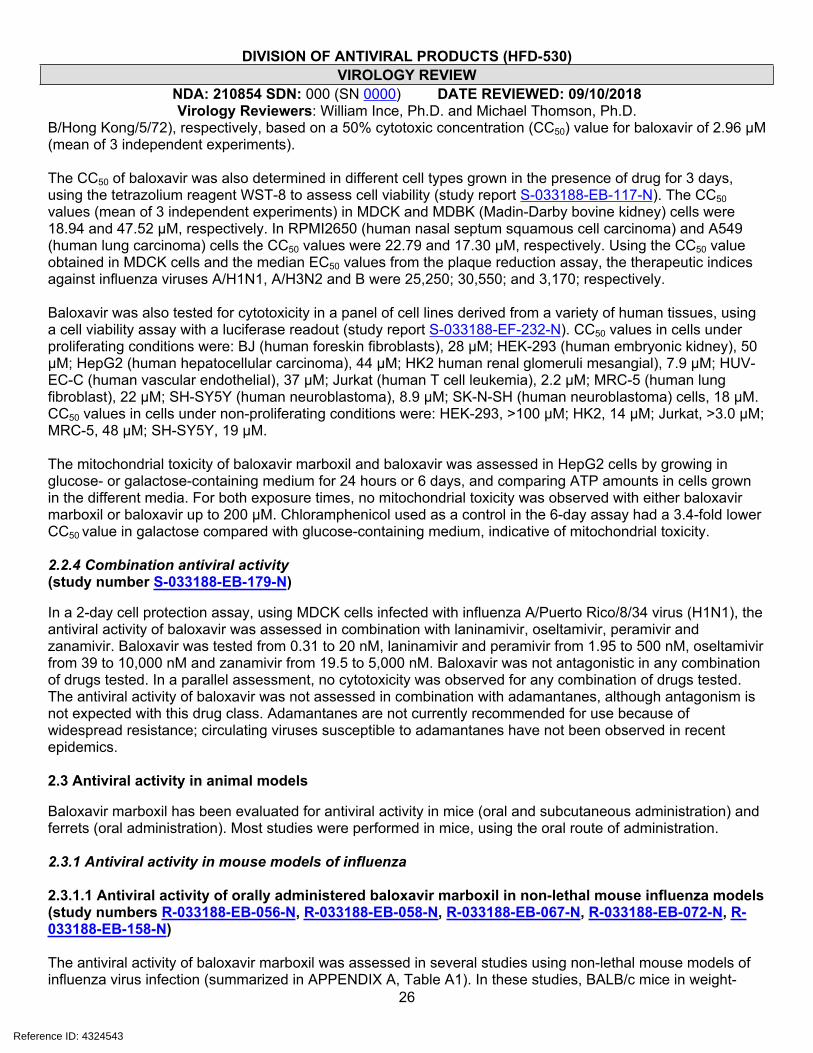
DIVISION OF ANTIVIRAL PRODUCTS (HFD-530)VIROLOGY REVIEW
NDA: 210854 SDN: 000 (SN 0000) DATE REVIEWED: 09/10/2018Virology Reviewers: William Ince, Ph.D. and Michael Thomson, Ph.D.
26
B/Hong Kong/5/72), respectively, based on a 50% cytotoxic concentration (CC50) value for baloxavir of 2.96 μM (mean of 3 independent experiments).
The CC50 of baloxavir was also determined in different cell types grown in the presence of drug for 3 days, using the tetrazolium reagent WST-8 to assess cell viability (study report S-033188-EB-117-N). The CC50 values (mean of 3 independent experiments) in MDCK and MDBK (Madin-Darby bovine kidney) cells were 18.94 and 47.52 μM, respectively. In RPMI2650 (human nasal septum squamous cell carcinoma) and A549 (human lung carcinoma) cells the CC50 values were 22.79 and 17.30 μM, respectively. Using the CC50 value obtained in MDCK cells and the median EC50 values from the plaque reduction assay, the therapeutic indices against influenza viruses A/H1N1, A/H3N2 and B were 25,250; 30,550; and 3,170; respectively.
Baloxavir was also tested for cytotoxicity in a panel of cell lines derived from a variety of human tissues, using a cell viability assay with a luciferase readout (study report S-033188-EF-232-N). CC50 values in cells under proliferating conditions were: BJ (human foreskin fibroblasts), 28 μM; HEK-293 (human embryonic kidney), 50 μM; HepG2 (human hepatocellular carcinoma), 44 μM; HK2 human renal glomeruli mesangial), 7.9 μM; HUV-EC-C (human vascular endothelial), 37 μM; Jurkat (human T cell leukemia), 2.2 μM; MRC-5 (human lung fibroblast), 22 μM; SH-SY5Y (human neuroblastoma), 8.9 μM; SK-N-SH (human neuroblastoma) cells, 18 μM. CC50 values in cells under non-proliferating conditions were: HEK-293, >100 μM; HK2, 14 μM; Jurkat, >3.0 μM; MRC-5, 48 μM; SH-SY5Y, 19 μM.
The mitochondrial toxicity of baloxavir marboxil and baloxavir was assessed in HepG2 cells by growing in glucose- or galactose-containing medium for 24 hours or 6 days, and comparing ATP amounts in cells grown in the different media. For both exposure times, no mitochondrial toxicity was observed with either baloxavir marboxil or baloxavir up to 200 μM. Chloramphenicol used as a control in the 6-day assay had a 3.4-fold lower CC50 value in galactose compared with glucose-containing medium, indicative of mitochondrial toxicity.
2.2.4 Combination antiviral activity (study number S-033188-EB-179-N)
In a 2-day cell protection assay, using MDCK cells infected with influenza A/Puerto Rico/8/34 virus (H1N1), the antiviral activity of baloxavir was assessed in combination with laninamivir, oseltamivir, peramivir and zanamivir. Baloxavir was tested from 0.31 to 20 nM, laninamivir and peramivir from 1.95 to 500 nM, oseltamivir from 39 to 10,000 nM and zanamivir from 19.5 to 5,000 nM. Baloxavir was not antagonistic in any combination of drugs tested. In a parallel assessment, no cytotoxicity was observed for any combination of drugs tested. The antiviral activity of baloxavir was not assessed in combination with adamantanes, although antagonism is not expected with this drug class. Adamantanes are not currently recommended for use because of widespread resistance; circulating viruses susceptible to adamantanes have not been observed in recent epidemics.
2.3 Antiviral activity in animal models
Baloxavir marboxil has been evaluated for antiviral activity in mice (oral and subcutaneous administration) and ferrets (oral administration). Most studies were performed in mice, using the oral route of administration.
2.3.1 Antiviral activity in mouse models of influenza
2.3.1.1 Antiviral activity of orally administered baloxavir marboxil in non-lethal mouse influenza models (study numbers R-033188-EB-056-N, R-033188-EB-058-N, R-033188-EB-067-N, R-033188-EB-072-N, R-033188-EB-158-N)
The antiviral activity of baloxavir marboxil was assessed in several studies using non-lethal mouse models of influenza virus infection (summarized in APPENDIX A, Table A1). In these studies, BALB/c mice in weight-
Reference ID: 4324543

DIVISION OF ANTIVIRAL PRODUCTS (HFD-530)VIROLOGY REVIEW
NDA: 210854 SDN: 000 (SN 0000) DATE REVIEWED: 09/10/2018Virology Reviewers: William Ince, Ph.D. and Michael Thomson, Ph.D.
27
balanced dosing groups of 10-15 were inoculated intranasally with influenza virus, and drug administered orally 5 days after infection. Mice were sacrificed 24 hours after the first drug administration and the virus titer in lungs determined by observing cytopathic effect of endpoint dilutions in MDCK cells to derive the 50% tissue culture infectious dose (TCID50). Statistical analyses were performed on the differences in the log10 TCID50/mL values between baloxavir marboxil treated mice and mice dosed with vehicle or comparator drug, and between mice dosed with comparator drug and those with vehicle. The impact of drug treatment on the body weight or other pathological features of influenza virus infection was not determined in these studies.
The influenza strains tested were A/WSN/33 (H1N1) at 100 TCID50 per mouse, A/Osaka/129/2009 (H1N1) at 4.3 x 10³ TCID50 per mouse, A/WSN/33-NA/H275Y (H1N1) at 100 TCID50 per mouse, A/Hong Kong/8/68 (H3N2; mouse adapted) at 100 TCID50 per mouse, and B/Hong Kong/5/72 (mouse adapted) at 1.1 x 10³ TCID50 per mouse, against which baloxavir marboxil had EC50 values in a plaque reduction assay of 0.76, 0.75, 0.49, 0.58, 8.37 nM, respectively. These EC50 values all lie within approximately 0.4-fold of the median for each respective subtype. The neuraminidase inhibitor, oseltamivir phosphate, was used as a comparator compound, at doses based on the pharmacokinetic data of the human clinical dose. One study also used the neuraminidase inhibitors laninamivir and zanamivir (administered intranasally), and the putative polymerase inhibitor favipiravir (administered orally), as comparator compounds. The sponsor did not perform an independent assessment of the exposures of comparator compounds in mice for these studies.
Table 2.3.1.1.1 (derived from APPENDIX A, Tables A1 and A2) summarizes the effect of baloxavir marboxil on mean lung viral titers in mice infected with non-lethal doses of different influenza virus strains; for comparison, data from lethal and immunocompromised mouse influenza models are included, which are discussed in Sections 2.3.1.3 and 2.3.1.6, respectively. There was a dose-response relationship in mice inoculated with influenza type A virus, with higher levels of drug causing reductions in titers of up to 3.4 log10 TCID50/mL relative to vehicle control animals, when dosed 5 days after inoculation with virus and measured 24 hours after drug administration. Note that there is a possibility that drug carryover into the infectivity assay affected the values for virus titer reductions. The sponsor could have determined whether this was a possibility by measuring virus 30 minutes after administration of the drug, for example. Against type B virus, there was also a dose response, but the maximum reduction in mean virus titer at the highest dose (100 mg/kg/day), was approximately 1.7 log10 TCID50/mL less than the highest reduction recorded against a type A virus, which may reflect the lower susceptibility of type B influenza virus to baloxavir marboxil.
Table 2.3.1.1.1: Summary of mean lung virus titer differences in baloxavir marboxil treated mice compared with vehicle control mice at 24 hours following oral administration of drug a
Study Number Virus
Dosing Time
Relative to Infection
Dose Range Tested
(mg/kg/day)
Lung Titer Difference vs
Vehicle Control at 24 h (TCID50/mL)
R-033188-EB-056-N
A/WSN/33 (H1N1) 5 dpi 1 to 100 -0.74 to -3.39
R-033188-EB-067-N
A/Osaka/129/2009 (H1N1) 5 dpi 1 and 10 -1.79 and -2.58
R-033188-EB-158-N
A/WSN/33-NA/H275Y (H1N1) 5 dpi 1 to 100 -1.09 to -3.35
R-033188-EB-158-N
A/Hong Kong/8/68 (H3N2) (mouse 5 dpi 1 to 100 -1.24 to -2.63
Reference ID: 4324543
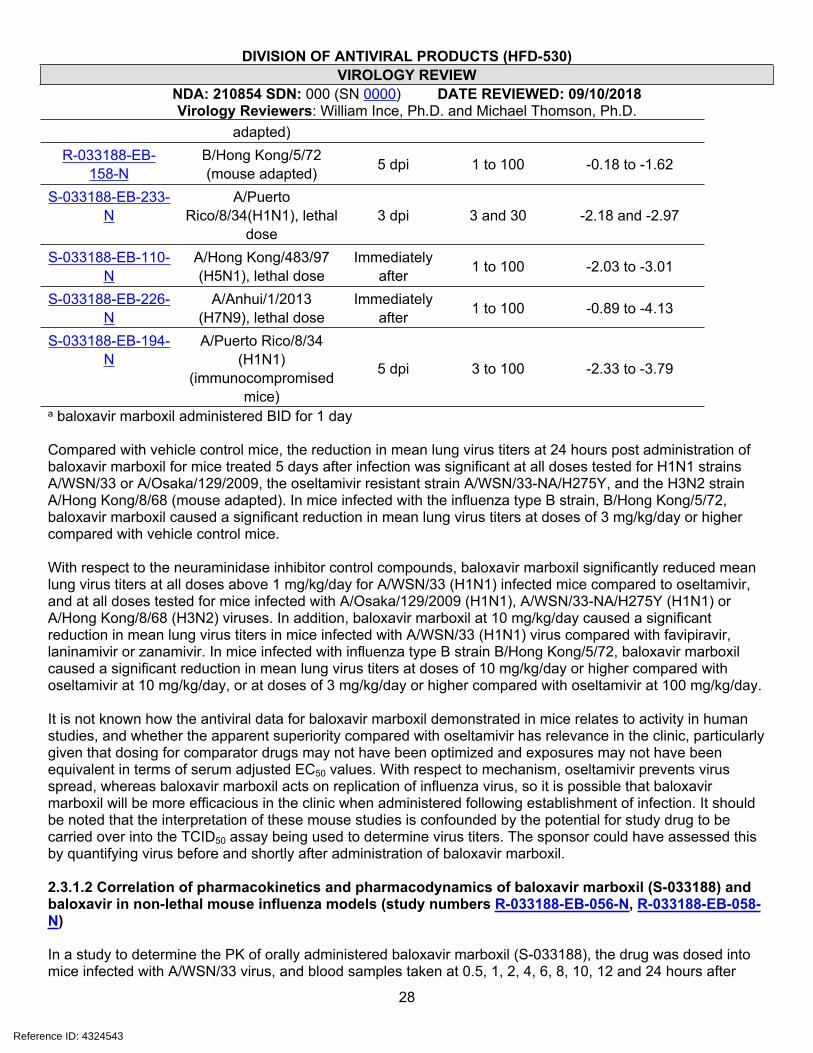
DIVISION OF ANTIVIRAL PRODUCTS (HFD-530)VIROLOGY REVIEW
NDA: 210854 SDN: 000 (SN 0000) DATE REVIEWED: 09/10/2018Virology Reviewers: William Ince, Ph.D. and Michael Thomson, Ph.D.
28
adapted) R-033188-EB-
158-NB/Hong Kong/5/72 (mouse adapted) 5 dpi 1 to 100 -0.18 to -1.62
S-033188-EB-233-N
A/Puerto Rico/8/34(H1N1), lethal
dose 3 dpi 3 and 30 -2.18 and -2.97
S-033188-EB-110-N
A/Hong Kong/483/97 (H5N1), lethal dose
Immediately after 1 to 100 -2.03 to -3.01
S-033188-EB-226-N
A/Anhui/1/2013 (H7N9), lethal dose
Immediately after 1 to 100 -0.89 to -4.13
S-033188-EB-194-N
A/Puerto Rico/8/34 (H1N1)
(immunocompromised mice)
5 dpi 3 to 100 -2.33 to -3.79
a baloxavir marboxil administered BID for 1 day
Compared with vehicle control mice, the reduction in mean lung virus titers at 24 hours post administration of baloxavir marboxil for mice treated 5 days after infection was significant at all doses tested for H1N1 strains A/WSN/33 or A/Osaka/129/2009, the oseltamivir resistant strain A/WSN/33-NA/H275Y, and the H3N2 strain A/Hong Kong/8/68 (mouse adapted). In mice infected with the influenza type B strain, B/Hong Kong/5/72, baloxavir marboxil caused a significant reduction in mean lung virus titers at doses of 3 mg/kg/day or higher compared with vehicle control mice.
With respect to the neuraminidase inhibitor control compounds, baloxavir marboxil significantly reduced mean lung virus titers at all doses above 1 mg/kg/day for A/WSN/33 (H1N1) infected mice compared to oseltamivir, and at all doses tested for mice infected with A/Osaka/129/2009 (H1N1), A/WSN/33-NA/H275Y (H1N1) or A/Hong Kong/8/68 (H3N2) viruses. In addition, baloxavir marboxil at 10 mg/kg/day caused a significant reduction in mean lung virus titers in mice infected with A/WSN/33 (H1N1) virus compared with favipiravir, laninamivir or zanamivir. In mice infected with influenza type B strain B/Hong Kong/5/72, baloxavir marboxil caused a significant reduction in mean lung virus titers at doses of 10 mg/kg/day or higher compared with oseltamivir at 10 mg/kg/day, or at doses of 3 mg/kg/day or higher compared with oseltamivir at 100 mg/kg/day.
It is not known how the antiviral data for baloxavir marboxil demonstrated in mice relates to activity in human studies, and whether the apparent superiority compared with oseltamivir has relevance in the clinic, particularly given that dosing for comparator drugs may not have been optimized and exposures may not have been equivalent in terms of serum adjusted EC50 values. With respect to mechanism, oseltamivir prevents virus spread, whereas baloxavir marboxil acts on replication of influenza virus, so it is possible that baloxavir marboxil will be more efficacious in the clinic when administered following establishment of infection. It should be noted that the interpretation of these mouse studies is confounded by the potential for study drug to be carried over into the TCID50 assay being used to determine virus titers. The sponsor could have assessed this by quantifying virus before and shortly after administration of baloxavir marboxil.
2.3.1.2 Correlation of pharmacokinetics and pharmacodynamics of baloxavir marboxil (S-033188) and baloxavir in non-lethal mouse influenza models (study numbers R-033188-EB-056-N, R-033188-EB-058-N)
In a study to determine the PK of orally administered baloxavir marboxil (S-033188), the drug was dosed into mice infected with A/WSN/33 virus, and blood samples taken at 0.5, 1, 2, 4, 6, 8, 10, 12 and 24 hours after
Reference ID: 4324543

DIVISION OF ANTIVIRAL PRODUCTS (HFD-530)VIROLOGY REVIEW
NDA: 210854 SDN: 000 (SN 0000) DATE REVIEWED: 09/10/2018Virology Reviewers: William Ince, Ph.D. and Michael Thomson, Ph.D.
29
dosing for determination of the plasma concentrations of baloxavir marboxil and baloxavir (the active form of baloxavir marboxil). Doses of 1 to 100 mg/kg/day were based on the pharmacological study of baloxavir marboxil in A/WSN/33 infected mice. The plasma concentration of baloxavir reached maximum levels (Cmax) at 0.5 to 1.0 and 2.0 hours after dosing with 1.0 to 30 and 100 mg/kg/day, respectively, then decreased with t1/2 values of 2.24 to 3.14 hours for all doses. In the pharmacological study, the lowest dose to show significant activity against A/WSN/33 virus compared with vehicle control was 1.0 mg/kg/day; at this dose in the PK study, the Cmax of baloxavir was approximately 10 nM (5.05 ng/mL), equivalent to 13x the mean EC50 value against this strain. The plasma concentration of baloxavir increased dose proportionally between 1 and 30 mg/kg/day, but there was a less than dose proportional increase at 100 mg/kg/day.
Another PK/PD study using baloxavir was performed to evaluate the parameter(s) best predicting virus titers at 24 hours after the first administration of drug. In the PD experiment to evaluate effects on virus titer, mice infected with A/WSN/33 (H1N1) were dosed subcutaneously with 0.25 to 8 mg/kg/day baloxavir, with the drug administered once, or every 12 or 6 hours for one day (APPENDIX A, Table A1). There was a dose-dependent decrease in mean lung virus titers in each dose frequency group, with more frequent dosing generally causing greater decreases. In a separate PK experiment, mice infected with A/WSN/33 (H1N1) were dosed subcutaneously once with 0.125, 0.25, 2 or 8 mg/kg baloxavir and the plasma concentration determined at 0.083, 0.25 (or 0.333 in the 8 mg/kg group), 0.5, 1, 2, 4, 6, 8, and 24 hours after dosing. From this PK experiment, the plasma concentration showed dose proportionality, and comparing with the PD experiment, the concentration at the time point of the dosing interval after the first dosing, or at 24 hours in the case of a single dose (Ctau), was determined to be the best PK parameter predicting the virus titers at 24 hours after the first administration of baloxavir.
2.3.1.3 Antiviral activity of orally administered baloxavir marboxil in lethal mouse influenza models (study numbers S-033188-EB-110-N, S-033188-EB-114-N, S-033188-EB-124-N, S-033188-EB-226-N)
Several studies were performed to assess the impact of baloxavir marboxil (S-033188) on mortality in groups of 5-10 BALB/c mice infected intranasally with lethal amounts of influenza virus (APPENDIX A, Table A2). Note that for these studies, mice were euthanized and regarded as dead if their body weights were 30% lower than those at the day of virus infection. Of note, the sponsor did not assess in any of these studies the development of resistance in mice failing treatment with baloxavir. Some of these studies also assessed the impact on lung virus titers and virus induced body weight loss. The influenza virus strains tested were A/Puerto Rico/8/34 (H1N1) at 1.38 x 10³ or 4.42 x 10⁴ TCID50 per mouse, A/Hong Kong/483/97 (H5N1) at 75 TCID50 per mouse, A/Anhui/1/2013 (H7N9) at 4 x 10⁵ TCID50 per mouse, and B/Hong Kong/5/72 (mouse adapted) at 3.3 x 10⁵ or 1.98 x 10⁶ TCID50 per mouse. Formal determinations of the 50% lethal dose (LD50) of each virus were not performed. In all studies, all mice in the placebo groups died or were euthanized for weight loss. In most studies, baloxavir marboxil or comparator drug oseltamivir phosphate were dosed immediately after intranasal administration of influenza virus, using regimens of twice a day for 1, 3 or 5 days. Some studies also assessed the effect of delayed drug administration. In some studies, including those testing against A/Hong Kong/483/97 and B/Hong Kong/5/72 viruses, mice were monitored for 14 days, which is less than the recommended time of 4-5x the mean time to death of untreated animals that is needed to assess delayed death. In other studies, including those testing against A/Puerto Rico/8/34 (H1N1) and A/Anhui/1/2013 (H7N9) viruses, animals were monitored for 21 or 28 days (approximately 3-5x the mean time to death).
Reference ID: 4324543

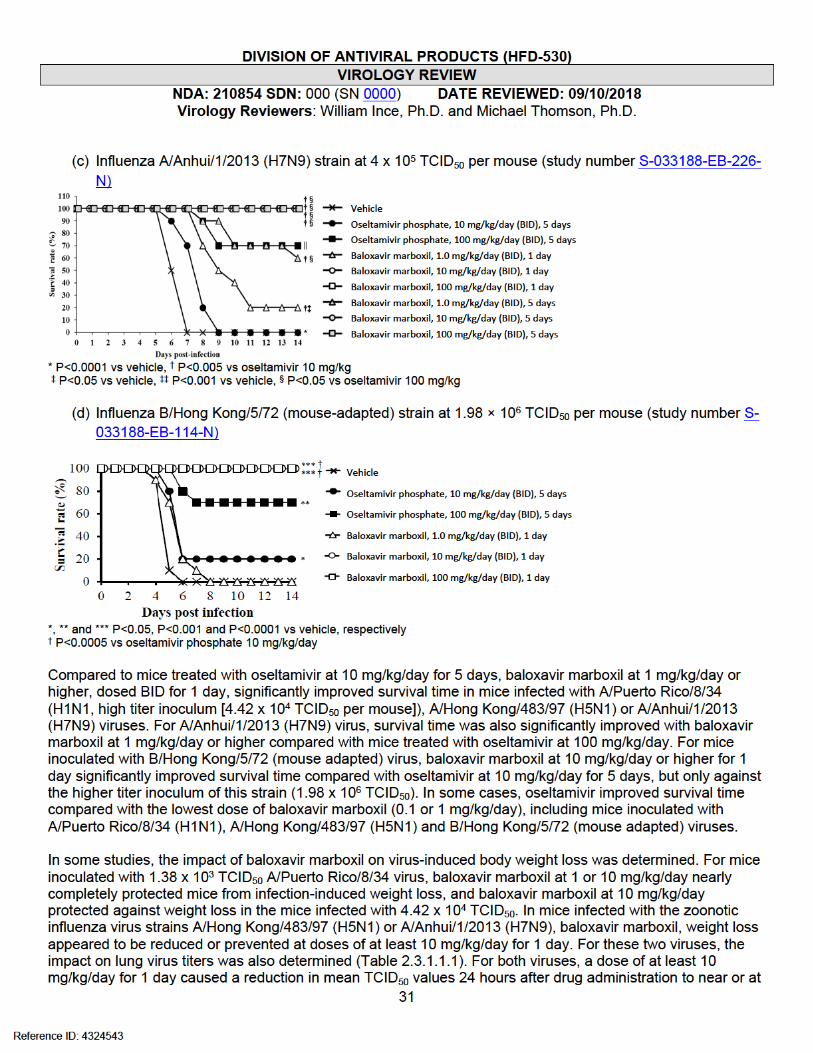

DIVISION OF ANTIVIRAL PRODUCTS (HFD-530)VIROLOGY REVIEW
NDA: 210854 SDN: 000 (SN 0000) DATE REVIEWED: 09/10/2018Virology Reviewers: William Ince, Ph.D. and Michael Thomson, Ph.D.
32
the limit of detection, reflecting a 3-4 log10 decline. Notably, however, titers increased over 5 days after dosing in A/Anhui/1/2013 (H7N9) infected mice, to less than 1 log10 TCID50/mL difference compared with vehicle control mice. However, like the non-lethal influenza mouse studies, the interpretation of lung virus titer data is confounded by the potential for study drug to be carried over into the TCID50 assay.
For B/Hong Kong/5/72 (mouse adapted) virus, baloxavir marboxil at any dose did not prevent infection-induced weight loss in mice inoculated with the higher titer of virus (1.98 x 10⁶ TCID50), but doses of at least 10 mg/kg/day reduced or prevented weight loss in mice inoculated with a lower, but still lethal, titer of virus (3.3 x 10⁵ TCID50).
Overall for the lethal mouse models of influenza, baloxavir marboxil had a dose-dependent protective effect, which correlated with reduction in virus titers and virus-induced body weight loss. While baloxavir marboxil at all but the lowest doses generally appeared to be superior compared with oseltamivir with respect to survival, viral titer reduction and weight loss in mice, it is not known whether these benefits predict improved efficacy in the clinic.
2.3.1.4 Antiviral activity of baloxavir marboxil with delayed oral administration in lethal mouse influenza models (study numbers S-033188-EB-188-N, S-033188-EB-233-N)
In two separate studies, the antiviral activity of baloxavir marboxil orally administered 24 to 96 hours after infection was determined in BALB/c mice infected intranasally with a lethal dose (1.38 x 10³ TCID50 per mouse) of A/Puerto Rico/8/34 virus (APPENDIX A, Table A3). In the first study, baloxavir marboxil at 3 or 30 mg/kg/day and oseltamivir at 10 mg/kg/day were dosed BID for 5 days at 24, 48, 72 and 96 hours after infection, and mice followed for 28 days. All mice treated with baloxavir marboxil at 3 or 30 mg/kg/day up to 72 hours after infection survived, whereas all vehicle control mice died or were euthanized within 8 days, and 9/10, 7/10 or 1/10 mice treated with oseltamivir for 24, 48 or 72 hours, respectively, survived. For dosing initiated 96 hours after infection, 5/10 or 7/10 mice treated with baloxavir marboxil at 3 or 30 mg/kg/day, respectively, and 1/10 mice treated with oseltamivir, survived. The survival time for baloxavir marboxil treated mice was statistically significant for all treatment regimens compared with vehicle control or oseltamivir treated mice. Also, baloxavir marboxil at 3 or 30 mg/kg/day significantly suppressed body weight loss from virus infection compared with mice dosed with vehicle for all dosing initiation times.
In the second study, mice infected intranasally with a lethal dose (1.38 x 10³ TCID50 per mouse) of A/Puerto Rico/8/34 virus were treated 72 hours after infection with baloxavir marboxil at 3 or 30 mg/kg/day or oseltamivir at 10 mg/kg/day, BID for 1, 3 or 5 days. Lung virus titers were determined at 3 days after drug cessation for 1 and 3 day regimens, and at 3 and 5 days after drug cessation for the 5-day regimen. Because all the control mice died or were euthanized by 8 days after infection, no statistical comparisons were made for mice dosed for 5 days. However, for both baloxavir marboxil and oseltamivir treated mice dosed for 5 days, mean virus titers were at the limit of detection when assessed at 8 and 10 days after infection. In mice treated with baloxavir marboxil at 3 or 30 mg/kg/day for 1 or 3 days, mean virus titers were reduced by approximately 2 log10 TCID50 at 4 or 6 days post infection, respectively, which was statistically significant compared with vehicle control mice or mice treated with oseltamivir for 1 or 3 days.
2.3.1.5 Antiviral activity of baloxavir marboxil combined with oseltamivir with delayed oral administration in a lethal mouse influenza model (study number S-033188-EB-234-N)
The effect of combining baloxavir marboxil with oseltamivir on antiviral activity compared with the individual drugs was determined in BALB/c mice infected intranasally with a lethal dose (8.0 x 10² TCID50 per mouse) of A/Puerto Rico/8/34 virus (APPENDIX A, Table A3). Mice were dosed 96 hours after infection with the two drugs alone or in combination, BID for 5 days, and monitored for 28 days after infection. For mice dosed with baloxavir marboxil at 1, 3, 30 and 100 mg/kg/day, 4/10, 7/10, 10/10 and 10/10 survived, respectively, and there
Reference ID: 4324543

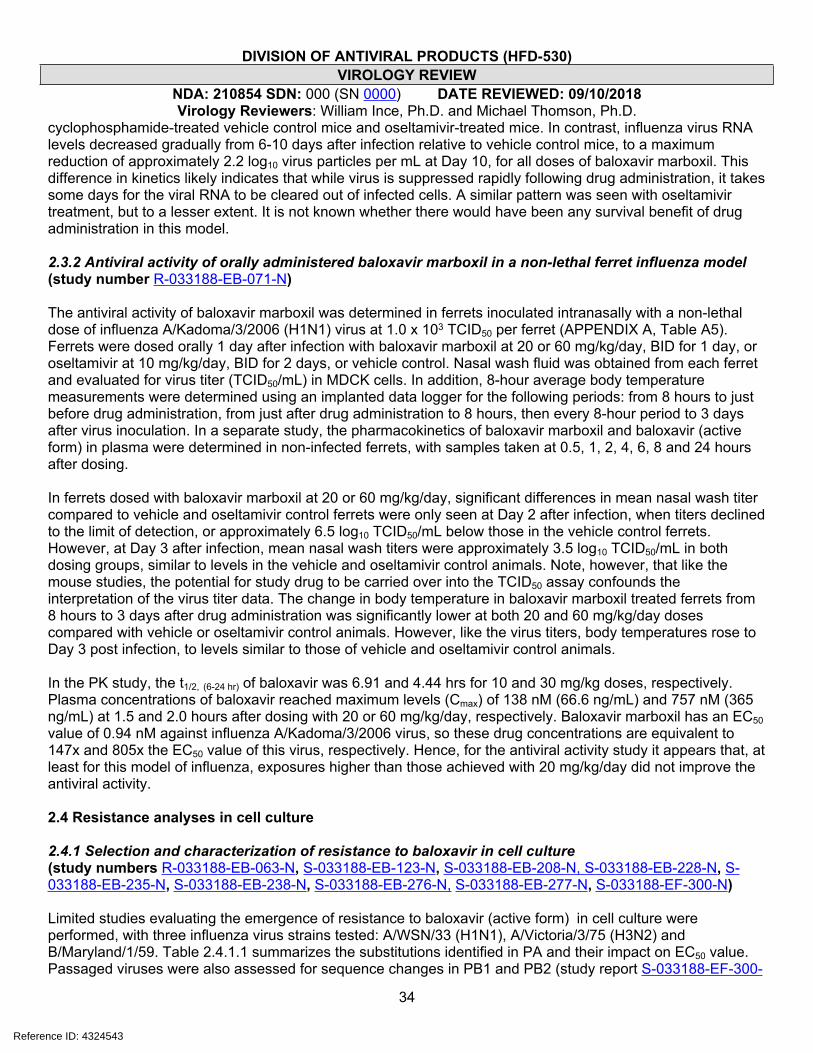
DIVISION OF ANTIVIRAL PRODUCTS (HFD-530)VIROLOGY REVIEW
NDA: 210854 SDN: 000 (SN 0000) DATE REVIEWED: 09/10/2018Virology Reviewers: William Ince, Ph.D. and Michael Thomson, Ph.D.
34
cyclophosphamide-treated vehicle control mice and oseltamivir-treated mice. In contrast, influenza virus RNA levels decreased gradually from 6-10 days after infection relative to vehicle control mice, to a maximum reduction of approximately 2.2 log10 virus particles per mL at Day 10, for all doses of baloxavir marboxil. This difference in kinetics likely indicates that while virus is suppressed rapidly following drug administration, it takes some days for the viral RNA to be cleared out of infected cells. A similar pattern was seen with oseltamivir treatment, but to a lesser extent. It is not known whether there would have been any survival benefit of drug administration in this model.
2.3.2 Antiviral activity of orally administered baloxavir marboxil in a non-lethal ferret influenza model (study number R-033188-EB-071-N)
The antiviral activity of baloxavir marboxil was determined in ferrets inoculated intranasally with a non-lethal dose of influenza A/Kadoma/3/2006 (H1N1) virus at 1.0 x 10³ TCID50 per ferret (APPENDIX A, Table A5). Ferrets were dosed orally 1 day after infection with baloxavir marboxil at 20 or 60 mg/kg/day, BID for 1 day, or oseltamivir at 10 mg/kg/day, BID for 2 days, or vehicle control. Nasal wash fluid was obtained from each ferret and evaluated for virus titer (TCID50/mL) in MDCK cells. In addition, 8-hour average body temperature measurements were determined using an implanted data logger for the following periods: from 8 hours to just before drug administration, from just after drug administration to 8 hours, then every 8-hour period to 3 days after virus inoculation. In a separate study, the pharmacokinetics of baloxavir marboxil and baloxavir (active form) in plasma were determined in non-infected ferrets, with samples taken at 0.5, 1, 2, 4, 6, 8 and 24 hours after dosing.
In ferrets dosed with baloxavir marboxil at 20 or 60 mg/kg/day, significant differences in mean nasal wash titer compared to vehicle and oseltamivir control ferrets were only seen at Day 2 after infection, when titers declined to the limit of detection, or approximately 6.5 log10 TCID50/mL below those in the vehicle control ferrets. However, at Day 3 after infection, mean nasal wash titers were approximately 3.5 log10 TCID50/mL in both dosing groups, similar to levels in the vehicle and oseltamivir control animals. Note, however, that like the mouse studies, the potential for study drug to be carried over into the TCID50 assay confounds the interpretation of the virus titer data. The change in body temperature in baloxavir marboxil treated ferrets from 8 hours to 3 days after drug administration was significantly lower at both 20 and 60 mg/kg/day doses compared with vehicle or oseltamivir control animals. However, like the virus titers, body temperatures rose to Day 3 post infection, to levels similar to those of vehicle and oseltamivir control animals.
In the PK study, the t1/2, (6-24 hr) of baloxavir was 6.91 and 4.44 hrs for 10 and 30 mg/kg doses, respectively. Plasma concentrations of baloxavir reached maximum levels (Cmax) of 138 nM (66.6 ng/mL) and 757 nM (365 ng/mL) at 1.5 and 2.0 hours after dosing with 20 or 60 mg/kg/day, respectively. Baloxavir marboxil has an EC50 value of 0.94 nM against influenza A/Kadoma/3/2006 virus, so these drug concentrations are equivalent to 147x and 805x the EC50 value of this virus, respectively. Hence, for the antiviral activity study it appears that, at least for this model of influenza, exposures higher than those achieved with 20 mg/kg/day did not improve the antiviral activity.
2.4 Resistance analyses in cell culture
2.4.1 Selection and characterization of resistance to baloxavir in cell culture (study numbers R-033188-EB-063-N, S-033188-EB-123-N, S-033188-EB-208-N, S-033188-EB-228-N, S-033188-EB-235-N, S-033188-EB-238-N, S-033188-EB-276-N, S-033188-EB-277-N, S-033188-EF-300-N)
Limited studies evaluating the emergence of resistance to baloxavir (active form) in cell culture were performed, with three influenza virus strains tested: A/WSN/33 (H1N1), A/Victoria/3/75 (H3N2) and B/Maryland/1/59. Table 2.4.1.1 summarizes the substitutions identified in PA and their impact on EC50 value. Passaged viruses were also assessed for sequence changes in PB1 and PB2 (study report S-033188-EF-300-
Reference ID: 4324543

DIVISION OF ANTIVIRAL PRODUCTS (HFD-530)VIROLOGY REVIEW
NDA: 210854 SDN: 000 (SN 0000) DATE REVIEWED: 09/10/2018Virology Reviewers: William Ince, Ph.D. and Michael Thomson, Ph.D.
35
N). PB1-K757N emerged concurrently with PA I38T in H1N1 P9-6 virus, and PB2-S12L emerged concurrently with PA E199G in H3N2 12.5 nM-1-P1 virus. These two changes were not analyzed independently of the respective PA substitutions found in these viruses.
In the study with A/WSN/33 virus, MDBK cells in 12-well plates were initially infected with a multiplicity of infection (MOI) of 0.01 PFU/cell (approximately 4,000 PFU per well, assuming 4 x 10⁵ cells per well at confluency) and cultured in the presence of baloxavir at final concentrations of 0.02, 0.1, 0.5, 2.5, and 12.5 nM (approximately 1/40x to 16x the EC50 value of baloxavir against A/WSN/33 virus [0.76 nM]). Virus was serially passaged ten times in the presence of 2-fold increasing concentrations of baloxavir, then passaged once in the absence of drug. Susceptibility of passaged virus to baloxavir was assessed by determining the EC50 value in a plaque reduction assay, and comparing with the value against wild-type A/WSN/33 virus. Viral RNA was extracted, and the N-terminal region of the PA gene amplified by RT-PCR for Sanger sequencing.
Table 2.4.1.1: Amino acid substitutions identified in PA after serial passage of influenza virus in the presence of baloxavir
Passaged Virus(Study Number) Isolate Amino Acid
SubstitutionEC50 Value
(nM)
Fold Change
from Parent
Parent - 0.29 -P8-6-1P9-6-1
I38T aI38T
6.6212.18
22.541.4
A/WSN/33 (H1N1)
(R-033188-EB-063-N and S-033188-EB-238-
N)P6-9-1P7-9-1
I38TI38T
8.8111.66
29.939.6
Parent - 5.6 -0.1 nM-1-P5 K362K/R 6.1 1.10.1 nM-3-P4 K362K/R 5.5 1.00.5 nM-1-P4 I38T/I 195.4 34.912.5 nM-1-P1 E199G 17.8 3.2
A/Victoria/3/75 (H3N2) b
(S-033188-EB-208-N)
Purified 0.5 nM-1-P4 samples I38T 178.00 to
591.1031.8 to 105.6
B/Maryland/1/59(S-033188-EB-228-N) No resistant isolates None identified - -
a Detected as a mixture of I38T/I prior to passage in absence of drugb Susceptibility to S-33447 determined using ViroSpot microneutralization assay
Reduced susceptibility of passaged virus to baloxavir was observed in expanded virus derived from the 7th and 9th passages (A/WSN/33-P7-9-1 and A/WSN/33-P9-6-1) initiated in the presence of 0.1 nM and 0.02 nM of drug, respectively, with maximum concentrations of drug tested of 6.4 and 5.1 nM, respectively. Susceptibility was reduced by approximately 40-fold in both viruses, and a single amino acid substitution of I38T in the PA coding region was identified near the catalytic center of PA. For the two passage lines, reduced susceptibility and the I38T substitution were also observed in the 6th and 8th passages, but not in the preceding passages. In a follow-up study, RNA from virus that had not undergone an additional passage in the absence of drug was sequenced. In this study, the same substitution was identified in the viruses with reduced susceptibility to baloxavir, although in one passage line, a mixture of I38T/I was detected in virus from passage 8, which became only I38T in the following passage.
Reference ID: 4324543

DIVISION OF ANTIVIRAL PRODUCTS (HFD-530)VIROLOGY REVIEW
NDA: 210854 SDN: 000 (SN 0000) DATE REVIEWED: 09/10/2018Virology Reviewers: William Ince, Ph.D. and Michael Thomson, Ph.D.
36
The I38T substitution was inserted into A/WSN/33 virus by reverse genetics, and recombinant virus had reduced susceptibility to baloxavir of 33-fold, indicating that this was probably the only substitution responsible for the reduced susceptibility of passaged virus. Table 2.4.1.2 shows the EC90 values that were also determined by TCID50 assay for passaged (A/WSN/33-P9-6-1) and recombinant (rgA/WSN/33-PA-I38T) virus, including favipiravir as a control compound. Viruses harboring the PA I38T substitution did not appear to lose susceptibility to favipiravir.
Table 2.4.1.2: EC90 values of baloxavir against passaged and recombinant A/WSN/33 harboring the PA I38T substitution (study number S-033188-EB-123-N)
EC90 (nM) a
baloxavir Favipiravir
Strain Mean SD Fold change Mean SD Fold
changeA/WSN/33 0.82 0.04 - 4540.49 597.51 -
A/WSN/33-P9-6-1 29.52 5.79 35.9 2002.75 842.53 0.4rgA/WSN/33 0.47 0.03 - 3752.56 999.69 -
rgA/WSN/33-PA/I38T 15.55 0.98 33.0 4232.09 1920.94 1.1a Mean and SD were determined from 3 independent experiments
Resistance emergence in cell culture was also assessed using influenza strain A/Victoria/3/75 (H3N2). Virus was passaged at an MOI of 0.01 PFU/cell (approximately 4,000 PFU per well), using baloxavir starting concentrations of 0.02, 0.1, 0.5, 2.5, and 12.5 nM (approximately 1/40x to 16x the EC50 value of baloxavir against A/Victoria/3/75 virus [0.76 nM], although in this experiment the parental A/Victoria/3/75 virus had an EC50 value of 5.6 nM by ViroSpot assay), then increasing by 2-fold in ten sequential passages. For each starting drug concentration, passages were performed in triplicate. Virus titers were determined using the influenza ViroSpot microneutralization assay (Baalen et al., 2017; study number S-033188-EF-230-N). In total, viral RNA from 4 separate passages had genotypic changes in the PA region. Two of these were K362K/R (from passages 4 and 5 of two separate passages in 0.1 nM starting concentration of drug), one was I38T/I (from passage 4 in 0.5 nM starting concentration of drug), and one was E199G (from first passage in 12.5 nM drug). Passaged virus in which the K362K/R mixture was detected did not appear to have reduced susceptibility to baloxavir. For passaged virus harboring I38T/I, there was an increase in EC50 value compared with wild-type A/Victoria/3/75 virus of 35-fold; for E199G this was 3-fold. Purification of passaged viruses was attempted by culturing in the presence of 10, 32 and 100 nM baloxavir to eliminate wild-type virus. It was only possible to purify viruses harboring the I38T substitution by this methodology, and these purified viruses had up to a 105-fold decrease in susceptibility to baloxavir. The sponsor did not plaque purify viruses to isolate variants, so the virus containing a mixture of K362K/R may not have shown a phenotype.
The substitutions identified on serial passage of A/Victoria/3/75 (H3N2) in the presence of baloxavir were assessed using reverse genetics and determining EC50 values of recombinant viruses by plaque reduction assay. Compared with wild type A/Victoria/3/75 virus derived using reverse genetics, the I38T substitution caused an increase in EC50 value of 57-fold, the E199G substitution an increase of 4.5-fold, and the E362R substitution did not reduce susceptibility.
A resistance analysis was also performed using B/Maryland/1/59 virus, in which virus was sequentially passaged at an MOI of 0.01 PFU/cell in MDCK cells in the presence of baloxavir at starting concentrations of 0.2, 1, 5, 25, and 125 nM (approximately 1/24x to 26x the EC50 value of baloxavir against B/Maryland/1/59 virus [4.85 nM]). Passaging was continued until viruses could not be propagated further; the highest concentration of baloxavir used where it was possible to continue to the next passage was 25 nM
Reference ID: 4324543

DIVISION OF ANTIVIRAL PRODUCTS (HFD-530)VIROLOGY REVIEW
NDA: 210854 SDN: 000 (SN 0000) DATE REVIEWED: 09/10/2018Virology Reviewers: William Ince, Ph.D. and Michael Thomson, Ph.D.
37
(approximately 5x the EC50 value). Genotypic analysis of passaged viruses did not identify any amino acid substitutions. Introduction of I38T into B/Maryland/1/59 using reverse genetics caused a decrease in susceptibility to baloxavir of approximately 6-fold.
2.4.2 Replicative capacity of recombinant influenza viruses harboring resistance-associated substitutions in cell culture (study numbers S-033188-EB-116-N, S-033188-EB-278-N, S-033188-EB-289-N)
The impact of the I38T substitution on the replicative capacity of passaged or recombinant A/WSN/33 viruses was assessed in four cell lines: MDCK, MDBK, A549 and RPMI2650. Virus replication was assessed by measuring the TCID50
in MDCK cells of supernatants harvested up to 72 hours after infection, and comparing to wild-type virus. Table 2.4.2.1 shows the mean virus titers (log10 TCID50/mL) observed for each cell line at 24 hours or 36 hours (A549 cells), and difference with wild-type virus.
Table 2.4.2.1: Mean Log10 TCID50 values of viruses harboring the PA I38T substitution compared with wild-type viruses (Study Number S-033188-EB-116-N) a
MDBK at 24 hours MDCK at 24 hours A549 at 36 hours RPMI2650 at 24 hours
Virus Mean Difference Mean Difference Mean Difference Mean Difference
A/WSN/33 4.67 - 6.72 - 2.91 - 4.48 -
A/WSN/33-NA/H275Y 4.22 -0.45 6.00 -0.72 3.50 -0.59 3.83 -0.65
A/WSN/33-P9-6-1 3.72 -0.95 4.83 -1.89 1.56 -1.35 2.85 -1.63
A/WSN/33-P7-9-1 3.83 -0.84 2.56 -4.16 1.50 -1.41 2.80 -1.68
rgA/WSN/33 4.00 - 5.06 - 4.72 - 4.33 -
rgA/WSN/33-PA/I38T 3.28 -0.72 3.72 -1.34 3.59 -1.13 3.06 -1.27a Log10 TCID50 values are the mean of 3 independent experiments
In general, the mean TCID50 values of viruses harboring I38T were 0.7 to 1.9 log10 lower than wild-type at 24 hours, and 36 hours in A549 cells. The exception was A/WSN/33-P7-9-1 virus in MDCK cells, which was reduced by 4.16 log10 TCID50 compared with wild-type virus at 24 hours. It is not apparent why this virus did not propagate so well in this cell line. While these data indicate that PA I38T may impact virus propagation in cell culture, it’s not known whether it would have the same effect in infected subjects. Also, the likelihood and rapidity of compensatory substitutions arising that might restore the replicative capacity of the virus is not known. In viruses harboring H275Y, for example, secondary substitutions can restore viral fitness and potentially permit the general circulation of NAI resistant strains (Bloom et al., 2010).
Similar replication studies were performed in MDCK and RPMI2650 cells for recombinant H1N1, H3N2 and type B viruses harboring different substitutions at the I38 position and at other sites where polymorphic or treatment-emergent substitutions occurred concurrently with the I38F/M/T substitution in clinical studies T0821 and T0822. Table 2.4.2.2 summarizes the data from these replication studies. Virus titers were measured up to 72 hours post infection for MDCK cells, and 96 hours for RPMI2650 cells. The peak measured titer in MDCK cells occurred at 48 hours, whereas in RPMB2650 cells it occurred at 72 hours or later.
Table 2.4.2.2: Mean Log10 TCID50 values of viruses harboring PA substitutions compared with wild-type viruses a
MDCK at 24 hours MDCK at 48 hours RPMI2650 at 48 hoursVirus Mean Difference Mean Difference Mean Difference
Study Number S-033188-EB-278-N C
rgA/WSN/33 (H1N1) 5.56 - 6.94 - 7.06 -
Reference ID: 4324543

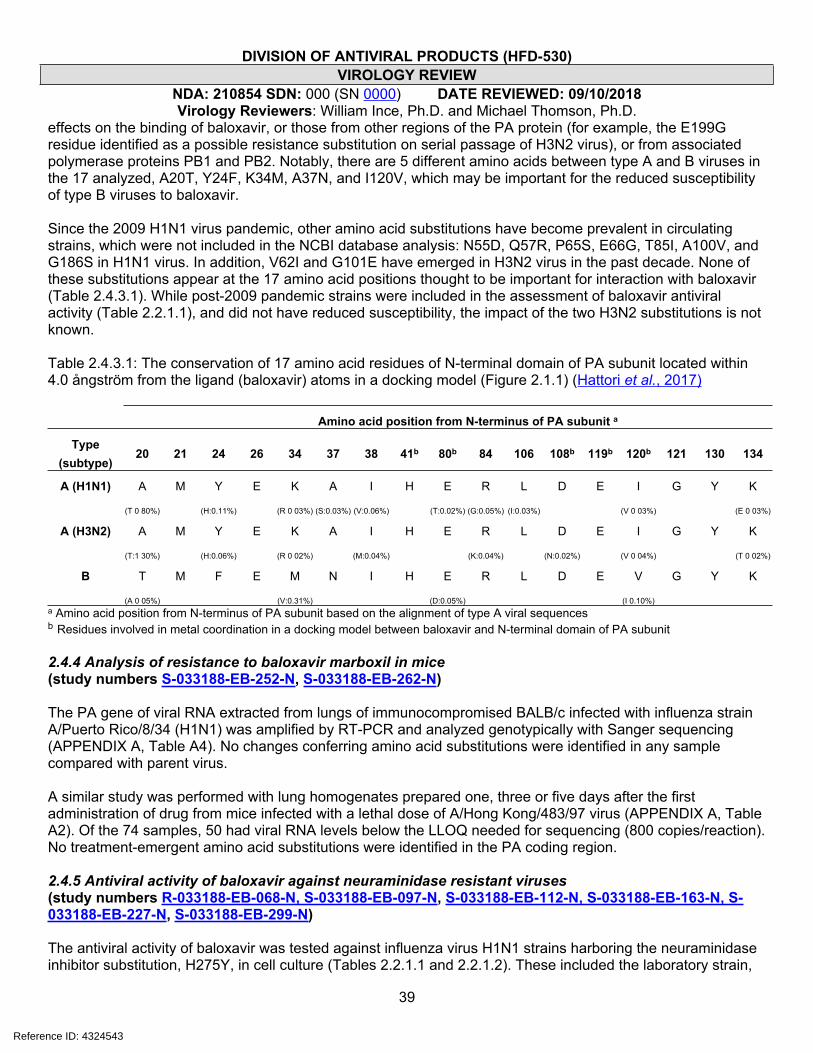
DIVISION OF ANTIVIRAL PRODUCTS (HFD-530)VIROLOGY REVIEW
NDA: 210854 SDN: 000 (SN 0000) DATE REVIEWED: 09/10/2018Virology Reviewers: William Ince, Ph.D. and Michael Thomson, Ph.D.
39
effects on the binding of baloxavir, or those from other regions of the PA protein (for example, the E199G residue identified as a possible resistance substitution on serial passage of H3N2 virus), or from associated polymerase proteins PB1 and PB2. Notably, there are 5 different amino acids between type A and B viruses in the 17 analyzed, A20T, Y24F, K34M, A37N, and I120V, which may be important for the reduced susceptibility of type B viruses to baloxavir.
Since the 2009 H1N1 virus pandemic, other amino acid substitutions have become prevalent in circulating strains, which were not included in the NCBI database analysis: N55D, Q57R, P65S, E66G, T85I, A100V, and G186S in H1N1 virus. In addition, V62I and G101E have emerged in H3N2 virus in the past decade. None of these substitutions appear at the 17 amino acid positions thought to be important for interaction with baloxavir (Table 2.4.3.1). While post-2009 pandemic strains were included in the assessment of baloxavir antiviral activity (Table 2.2.1.1), and did not have reduced susceptibility, the impact of the two H3N2 substitutions is not known.
Table 2.4.3.1: The conservation of 17 amino acid residues of N-terminal domain of PA subunit located within 4.0 ångström from the ligand (baloxavir) atoms in a docking model (Figure 2.1.1) (Hattori et al., 2017)
Amino acid position from N-terminus of PA subunit a
Type (subtype)
20 21 24 26 34 37 38 41b 80b 84 106 108b 119b 120b 121 130 134
A (H1N1) A M Y E K A I H E R L D E I G Y K
(T 0 80%) (H:0.11%) (R 0 03%) (S:0.03%) (V:0.06%) (T:0.02%) (G:0.05%) (I:0.03%) (V 0 03%) (E 0 03%)
A (H3N2) A M Y E K A I H E R L D E I G Y K
(T:1 30%) (H:0.06%) (R 0 02%) (M:0.04%) (K:0.04%) (N:0.02%) (V 0 04%) (T 0 02%)
B T M F E M N I H E R L D E V G Y K
(A 0 05%) (V:0.31%) (D:0.05%) (I 0.10%)a Amino acid position from N-terminus of PA subunit based on the alignment of type A viral sequencesb Residues involved in metal coordination in a docking model between baloxavir and N-terminal domain of PA subunit
2.4.4 Analysis of resistance to baloxavir marboxil in mice(study numbers S-033188-EB-252-N, S-033188-EB-262-N)
The PA gene of viral RNA extracted from lungs of immunocompromised BALB/c infected with influenza strain A/Puerto Rico/8/34 (H1N1) was amplified by RT-PCR and analyzed genotypically with Sanger sequencing (APPENDIX A, Table A4). No changes conferring amino acid substitutions were identified in any sample compared with parent virus.
A similar study was performed with lung homogenates prepared one, three or five days after the first administration of drug from mice infected with a lethal dose of A/Hong Kong/483/97 virus (APPENDIX A, Table A2). Of the 74 samples, 50 had viral RNA levels below the LLOQ needed for sequencing (800 copies/reaction). No treatment-emergent amino acid substitutions were identified in the PA coding region.
2.4.5 Antiviral activity of baloxavir against neuraminidase resistant viruses (study numbers R-033188-EB-068-N, S-033188-EB-097-N, S-033188-EB-112-N, S-033188-EB-163-N, S-033188-EB-227-N, S-033188-EB-299-N)
The antiviral activity of baloxavir was tested against influenza virus H1N1 strains harboring the neuraminidase inhibitor substitution, H275Y, in cell culture (Tables 2.2.1.1 and 2.2.1.2). These included the laboratory strain,
Reference ID: 4324543

DIVISION OF ANTIVIRAL PRODUCTS (HFD-530)VIROLOGY REVIEW
NDA: 210854 SDN: 000 (SN 0000) DATE REVIEWED: 09/10/2018Virology Reviewers: William Ince, Ph.D. and Michael Thomson, Ph.D.
40
A/WSN/33-NA/H275Y, and four clinical isolates. In addition, the reference panel from the International Society for Influenza and other Respiratory Virus Diseases (ISIRV) was tested, which includes four isolates harboring NAI resistance substitutions: H1N1 and H1N1pdm viruses with H275Y, an H3N2 virus with E119V, and a type B virus with D198E. None of these viruses had reduced susceptibility to baloxavir compared with A/WSN/33 virus and other clinical H1N1 isolates. Baloxavir marboxil was also tested against two zoonotic avian influenza strains (A/H5N1 and A/H7N9 viruses) harboring the H275Y or equivalent substitution, and had <2-fold reduced susceptibility compared with the respective wild-type virus (Table 2.2.1.2c).
2.4.6 Activity of neuraminidase inhibitors in cell culture against viruses with reduced susceptibility to baloxavir (study numbers S-033188-EB-236-N, S-033188-EB-277-N, S-033188-EB-288-N)
The susceptibility to oseltamivir of recombinant influenza viruses harboring substitutions in PA identified in cell culture or in Phase 2 and Phase 3 clinical studies was assessed using a neuraminidase inhibition assay to derive IC50 values. All the recombinant viruses listed in Table 4.2.6 were assessed, which includes ones harboring the substitutions identified in cell culture, I38T in H1N1 and H3N2 viruses, E199G and K362R in H3N2 virus. The IC50 values of all the variants fell within 0.47- to 1.68-fold of their respective wild-type viruses, indicating that none of the substitutions caused reduced susceptibility to oseltamivir. As a control, recombinant virus harboring a known neuraminidase inhibitor resistance substitution, rgA/WSN/33-NA/H275Y (H1N1) virus was evaluated, and the IC50 value for this variant was over 200-fold higher than for the wild type rg/A/WSN/33 virus.
3 CLINICAL VIROLOGY REVIEW OF EFFICACY3.1 Summary of Key Efficacy TrialsThe NDA for baloxavir marboxil is supported by efficacy data from two randomized placebo-controlled trials in subjects ranging in age from 12 to 65 years. Phase 2 trial T0821 enrolled 400 subjects who were positive for influenza virus based on a rapid influenza diagnostic test (ITTI population). Subjects were randomized 1:1:1:1 into single-dose 10 mg, 20 mg, 40 mg baloxavir marboxil arms and a placebo arm. Approximately 66% of infections were subtype A/H1N1, 11% were subtype A/H3N2, and 23% were type B virus. Phase 3 trial T0831 enrolled 1064 influenza-virus-positive (by RT-PCR; ITTI) subjects who were randomized 2:2:1 to receive a single dose of 40 mg or 80 mg (subjects ≥80 kg) baloxavir marboxil, oseltamivir (75 mg BID for 5 days), or placebo. Approximately 1.5% of infections were subtype A/H1N1, 88.5% were subtype A/H3N2, and 10% were type B infections. Treatment with baloxavir marboxil had a statistically significant impact overall on time to alleviation of symptoms (the primary endpoint) in both trials; however, the impact of baloxavir marboxil treatment in subjects infected with type B virus, as measured by the time to alleviation of symptoms, was inconsistent between trials and did not achieve statistical significance in either trial. Resistance analyses were supported by data from studies T0821, T0831 and the single-arm phase 3 pediatric study T0822, in which treatment-emergent resistance occurred in 2.7-11.1% of adults and adolescents and of 25.6% in pediatric subjects.
3.2 Study T08213.2.1 Study overviewTitle: A randomized, double-blind, placebo-controlled, phase 2 study of baloxavir marboxil in otherwise healthy adult subjects with influenza
Protocol SummaryPrimary objective: To evaluate the efficacy of baloxavir marboxil (10, 20 and 40 mg doses) versus placebo as measured by the time to alleviation of influenza symptoms in patients with influenza virus infection. Secondary objectives:
Reference ID: 4324543

DIVISION OF ANTIVIRAL PRODUCTS (HFD-530)VIROLOGY REVIEW
NDA: 210854 SDN: 000 (SN 0000) DATE REVIEWED: 09/10/2018Virology Reviewers: William Ince, Ph.D. and Michael Thomson, Ph.D.
41
1. To assess the efficacy of baloxavir marboxil (10, 20 and 40 mg doses) versus placebo as measured by the secondary endpoints in patients with influenza virus infection.
2. To assess the safety of baloxavir marboxil (10, 20 and 40 mg doses) as measured by the frequencies of adverse events (AEs) and treatment-related AEs in patients with influenza virus infection.
3. To determine the pharmacokinetics of the active form of baloxavir marboxil (S-033447) in patients with influenza virus infection.
Virology-related endpoints: Primary:
- Time to alleviation of influenza symptoms.
Secondary:- Change in the total score of 7 influenza symptoms.- Time to alleviation of each influenza symptom.- Time to resolution of fever (axillary temperature < 37ºC).- Percentage of subjects with resolution of fever.- Percentage of subjects with virus titer detected [presumed to mean at any sampling time point].- Change in virus titer.- Change in virus load.- Time to return to normal activities of daily life.- Incidence of influenza-related complications (sinusitis, bronchitis, otitis media, and pneumonia).
Virology-related inclusion criteria:- Patients aged ≥ 20 and < 65 years of age- Subjects with a diagnosis of influenza virus infection confirmed by all of the following:
o Positive rapid antigen test (RAT) for influenza with nasal or throat swabs;o Fever ≥ 38ºC (axillary temperature); and having at least one each of the following general and
respiratory symptoms associated with influenza virus infection. General symptoms (headache, feverishness or chills, muscle or joint pain, and fatigue). Respiratory symptoms (cough, sore throat, and nasal congestion).
- The time interval between the onset of symptoms and enrollment is 48 hours or less. The onset of symptoms is defined as either:
o Time of the first increase in body temperature (an increase of at least 1ºC from normal body temperature); or
o Time when the subject experiences at least one general or respiratory symptom.
Virology-related exclusion criteria:- Subjects with severe influenza virus infection requiring inpatient treatment.- Subjects with any of the following risk factors:
o Chronic respiratory diseases including bronchial asthma.o Compromised immune system (including patients receiving immunosuppressant therapy, or
those with cancer or human immunodeficiency virus [HIV] infection).- Subjects with concurrent infections requiring antimicrobial therapy (excluding skin infections). - Subjects who have received peramivir, laninamivir, oseltamivir, zanamivir, or amantadine within 7 days
prior to enrollment.- Subjects who have been exposed to an investigational drug within 90 days prior to enrollment.- Subjects who have received baloxavir marboxil previously.
Study Design:
Reference ID: 4324543
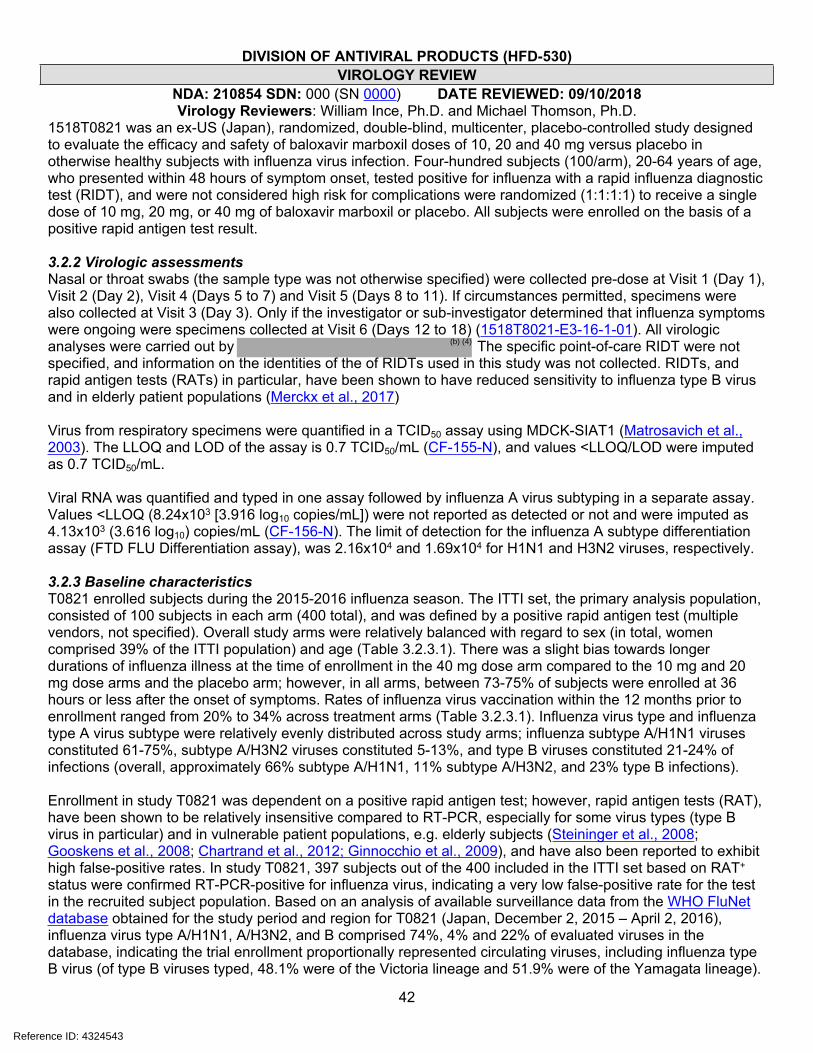
DIVISION OF ANTIVIRAL PRODUCTS (HFD-530)VIROLOGY REVIEW
NDA: 210854 SDN: 000 (SN 0000) DATE REVIEWED: 09/10/2018Virology Reviewers: William Ince, Ph.D. and Michael Thomson, Ph.D.
42
1518T0821 was an ex-US (Japan), randomized, double-blind, multicenter, placebo-controlled study designed to evaluate the efficacy and safety of baloxavir marboxil doses of 10, 20 and 40 mg versus placebo in otherwise healthy subjects with influenza virus infection. Four-hundred subjects (100/arm), 20-64 years of age, who presented within 48 hours of symptom onset, tested positive for influenza with a rapid influenza diagnostic test (RIDT), and were not considered high risk for complications were randomized (1:1:1:1) to receive a single dose of 10 mg, 20 mg, or 40 mg of baloxavir marboxil or placebo. All subjects were enrolled on the basis of a positive rapid antigen test result.
3.2.2 Virologic assessmentsNasal or throat swabs (the sample type was not otherwise specified) were collected pre-dose at Visit 1 (Day 1), Visit 2 (Day 2), Visit 4 (Days 5 to 7) and Visit 5 (Days 8 to 11). If circumstances permitted, specimens were also collected at Visit 3 (Day 3). Only if the investigator or sub-investigator determined that influenza symptoms were ongoing were specimens collected at Visit 6 (Days 12 to 18) (1518T8021-E3-16-1-01). All virologic analyses were carried out by The specific point-of-care RIDT were not specified, and information on the identities of the of RIDTs used in this study was not collected. RIDTs, and rapid antigen tests (RATs) in particular, have been shown to have reduced sensitivity to influenza type B virus and in elderly patient populations (Merckx et al., 2017)
Virus from respiratory specimens were quantified in a TCID50 assay using MDCK-SIAT1 (Matrosavich et al., 2003). The LLOQ and LOD of the assay is 0.7 TCID50/mL (CF-155-N), and values <LLOQ/LOD were imputed as 0.7 TCID50/mL.
Viral RNA was quantified and typed in one assay followed by influenza A virus subtyping in a separate assay. Values <LLOQ (8.24x10³ [3.916 log10 copies/mL]) were not reported as detected or not and were imputed as 4.13x10³ (3.616 log10) copies/mL (CF-156-N). The limit of detection for the influenza A subtype differentiation assay (FTD FLU Differentiation assay), was 2.16x10⁴ and 1.69x10⁴ for H1N1 and H3N2 viruses, respectively.
3.2.3 Baseline characteristicsT0821 enrolled subjects during the 2015-2016 influenza season. The ITTI set, the primary analysis population, consisted of 100 subjects in each arm (400 total), and was defined by a positive rapid antigen test (multiple vendors, not specified). Overall study arms were relatively balanced with regard to sex (in total, women comprised 39% of the ITTI population) and age (Table 3.2.3.1). There was a slight bias towards longer durations of influenza illness at the time of enrollment in the 40 mg dose arm compared to the 10 mg and 20 mg dose arms and the placebo arm; however, in all arms, between 73-75% of subjects were enrolled at 36 hours or less after the onset of symptoms. Rates of influenza virus vaccination within the 12 months prior to enrollment ranged from 20% to 34% across treatment arms (Table 3.2.3.1). Influenza virus type and influenza type A virus subtype were relatively evenly distributed across study arms; influenza subtype A/H1N1 viruses constituted 61-75%, subtype A/H3N2 viruses constituted 5-13%, and type B viruses constituted 21-24% of infections (overall, approximately 66% subtype A/H1N1, 11% subtype A/H3N2, and 23% type B infections).
Enrollment in study T0821 was dependent on a positive rapid antigen test; however, rapid antigen tests (RAT), have been shown to be relatively insensitive compared to RT-PCR, especially for some virus types (type B virus in particular) and in vulnerable patient populations, e.g. elderly subjects (Steininger et al., 2008; Gooskens et al., 2008; Chartrand et al., 2012; Ginnocchio et al., 2009), and have also been reported to exhibit high false-positive rates. In study T0821, 397 subjects out of the 400 included in the ITTI set based on RAT+ status were confirmed RT-PCR-positive for influenza virus, indicating a very low false-positive rate for the test in the recruited subject population. Based on an analysis of available surveillance data from the WHO FluNet database obtained for the study period and region for T0821 (Japan, December 2, 2015 – April 2, 2016), influenza virus type A/H1N1, A/H3N2, and B comprised 74%, 4% and 22% of evaluated viruses in the database, indicating the trial enrollment proportionally represented circulating viruses, including influenza type B virus (of type B viruses typed, 48.1% were of the Victoria lineage and 51.9% were of the Yamagata lineage).
Reference ID: 4324543
(b) (4)

DIVISION OF ANTIVIRAL PRODUCTS (HFD-530)VIROLOGY REVIEW
NDA: 210854 SDN: 000 (SN 0000) DATE REVIEWED: 09/10/2018Virology Reviewers: William Ince, Ph.D. and Michael Thomson, Ph.D.
43
RAT-negative results were not reported; however, the use of RAT+ as an enrollment criterion did not appear to significantly skew enrollment with respect to virus type. It is unclear if a disproportionate number of subjects near the upper age limit of the study (<65 years) might have been excluded as a result of requiring a positive RAT result.
Table 3.2.3.1: Selected baseline characteristics of the ITTI set of trial T0821. baloxavir marboxil Placebo
Metrica 10 mg 20 mg 40 mg baloxavir marboxil All
n 100 100 100 300 100Age (years)b
Median (range)
36.0 (20-62) 36.5 (20-60)
38.0 (20-63) 37 (20-63) 37.0 (20-64)
% (n) % (n) % (n) % (n) % (n)20 to ≤29 26 (26) 26 (26) 27 (27) 26 (79) 28 (28)30 to ≤39 32 (32) 33 (33) 30 (30) 32 (95) 28 (28)40 to ≤49 24 (24) 24 (24) 28 (28) 25 (76) 32 (32)
50 to ≤59 13 (13) 16 (16) 11 (11) 13 (39) 9 (9)
Age ranges (years)b
60 to ≤64 5 (5) 1 (1) 4 (4) 3 (10) 3 (3)
Male 68 (68) 58 (58) 60 (60) 62 (186) 61 (61)Sex
Female 32 (32) 42 (42) 40 (40) 38 (114) 39 (39)
0 to ≤12 7 (7) 15 (15) 12 (12) 11 (34) 11 (11)
>12 to ≤24 38 (38) 40 (40) 28 (28) 35 (106) 42 (42)
>24 to ≤36 30 (30) 18 (18) 36 (36) 28 (84) 22 (22)
Duration of influenza symptoms at the time of dosing
>36 to ≤48 25 (25) 27 (27) 24 (24) 25 (76) 25 (25)
RT-PCR ≥LLOQ at baselinec
100 (100) 100 (100) 98 (98) 99.3 (298) 99 (99)
A 79 (79) 76 (76) 73 (73) 76 (228) 75 (75)
A/H1N1d 84 (66) 93 (71) 84 (61) 87 (198) 92 (69)
A/H3N2d 16 (13) 7 (5) 16 (12) 13 (30) 8 (6)
B 21 (21) 23 (23) 24 (24) 23 (68) 23 (23)
A/H1N1 + A/H3N2
0 (0) 0 (0) 0 (0) 0 (0) 1 (1)
A + B 0 (0) 1 (1) 1 (1) 1 (2) 1 (1)
Virus type/subtypec
Unknown 0 (0) 0 (0) 2 (2) 1 (2) 0 (0)
Median (n) Median (n) Median (n) Median (n) Median (n)
A/H1N1 6.8 (65) 5.7 (71) 6.5 (60) 6.2 (196) 6.5 (69)
A/H3N2 5.2 (13) 4.3 (5) 4.6 (12) 4.85 (30) 6.1 (6)
Baseline virus titer (TCID50/mL)c
B 6.8 (21) 5.7 (23) 6.8 (24) 6.5 (68) 5.7 (23)
Yes 34 (34) 20 (20) 37 (37) 30 (91) 31 (31)Influenzab vaccination status (within 12 months) No 66 (66) 80 (80) 63 (63) 70 (209) 69 (69)
a. Source: CSR 1518T0821 Table 14.1.3.1 unless noted otherwise.
Reference ID: 4324543
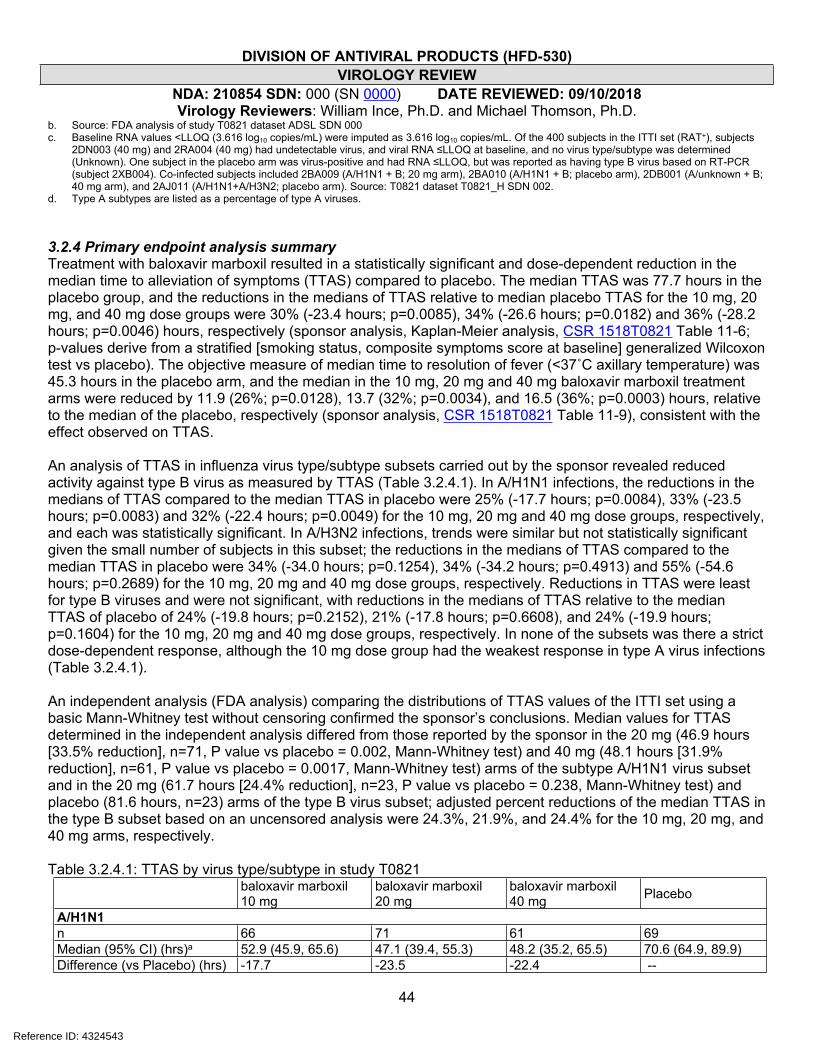
DIVISION OF ANTIVIRAL PRODUCTS (HFD-530)VIROLOGY REVIEW
NDA: 210854 SDN: 000 (SN 0000) DATE REVIEWED: 09/10/2018Virology Reviewers: William Ince, Ph.D. and Michael Thomson, Ph.D.
44
b. Source: FDA analysis of study T0821 dataset ADSL SDN 000c. Baseline RNA values <LLOQ (3.616 log10 copies/mL) were imputed as 3.616 log10 copies/mL. Of the 400 subjects in the ITTI set (RAT+), subjects
2DN003 (40 mg) and 2RA004 (40 mg) had undetectable virus, and viral RNA ≤LLOQ at baseline, and no virus type/subtype was determined (Unknown). One subject in the placebo arm was virus-positive and had RNA ≤LLOQ, but was reported as having type B virus based on RT-PCR (subject 2XB004). Co-infected subjects included 2BA009 (A/H1N1 + B; 20 mg arm), 2BA010 (A/H1N1 + B; placebo arm), 2DB001 (A/unknown + B; 40 mg arm), and 2AJ011 (A/H1N1+A/H3N2; placebo arm). Source: T0821 dataset T0821_H SDN 002.
d. Type A subtypes are listed as a percentage of type A viruses.
3.2.4 Primary endpoint analysis summaryTreatment with baloxavir marboxil resulted in a statistically significant and dose-dependent reduction in the median time to alleviation of symptoms (TTAS) compared to placebo. The median TTAS was 77.7 hours in the placebo group, and the reductions in the medians of TTAS relative to median placebo TTAS for the 10 mg, 20 mg, and 40 mg dose groups were 30% (-23.4 hours; p=0.0085), 34% (-26.6 hours; p=0.0182) and 36% (-28.2 hours; p=0.0046) hours, respectively (sponsor analysis, Kaplan-Meier analysis, CSR 1518T0821 Table 11-6; p-values derive from a stratified [smoking status, composite symptoms score at baseline] generalized Wilcoxon test vs placebo). The objective measure of median time to resolution of fever (<37˚C axillary temperature) was 45.3 hours in the placebo arm, and the median in the 10 mg, 20 mg and 40 mg baloxavir marboxil treatment arms were reduced by 11.9 (26%; p=0.0128), 13.7 (32%; p=0.0034), and 16.5 (36%; p=0.0003) hours, relative to the median of the placebo, respectively (sponsor analysis, CSR 1518T0821 Table 11-9), consistent with the effect observed on TTAS.
An analysis of TTAS in influenza virus type/subtype subsets carried out by the sponsor revealed reduced activity against type B virus as measured by TTAS (Table 3.2.4.1). In A/H1N1 infections, the reductions in the medians of TTAS compared to the median TTAS in placebo were 25% (-17.7 hours; p=0.0084), 33% (-23.5 hours; p=0.0083) and 32% (-22.4 hours; p=0.0049) for the 10 mg, 20 mg and 40 mg dose groups, respectively, and each was statistically significant. In A/H3N2 infections, trends were similar but not statistically significant given the small number of subjects in this subset; the reductions in the medians of TTAS compared to the median TTAS in placebo were 34% (-34.0 hours; p=0.1254), 34% (-34.2 hours; p=0.4913) and 55% (-54.6 hours; p=0.2689) for the 10 mg, 20 mg and 40 mg dose groups, respectively. Reductions in TTAS were least for type B viruses and were not significant, with reductions in the medians of TTAS relative to the median TTAS of placebo of 24% (-19.8 hours; p=0.2152), 21% (-17.8 hours; p=0.6608), and 24% (-19.9 hours; p=0.1604) for the 10 mg, 20 mg and 40 mg dose groups, respectively. In none of the subsets was there a strict dose-dependent response, although the 10 mg dose group had the weakest response in type A virus infections (Table 3.2.4.1).
An independent analysis (FDA analysis) comparing the distributions of TTAS values of the ITTI set using a basic Mann-Whitney test without censoring confirmed the sponsor’s conclusions. Median values for TTAS determined in the independent analysis differed from those reported by the sponsor in the 20 mg (46.9 hours [33.5% reduction], n=71, P value vs placebo = 0.002, Mann-Whitney test) and 40 mg (48.1 hours [31.9% reduction], n=61, P value vs placebo = 0.0017, Mann-Whitney test) arms of the subtype A/H1N1 virus subset and in the 20 mg (61.7 hours [24.4% reduction], n=23, P value vs placebo = 0.238, Mann-Whitney test) and placebo (81.6 hours, n=23) arms of the type B virus subset; adjusted percent reductions of the median TTAS in the type B subset based on an uncensored analysis were 24.3%, 21.9%, and 24.4% for the 10 mg, 20 mg, and 40 mg arms, respectively.
Table 3.2.4.1: TTAS by virus type/subtype in study T0821baloxavir marboxil10 mg
baloxavir marboxil20 mg
baloxavir marboxil40 mg Placebo
A/H1N1n 66 71 61 69Median (95% CI) (hrs)a 52.9 (45.9, 65.6) 47.1 (39.4, 55.3) 48.2 (35.2, 65.5) 70.6 (64.9, 89.9)Difference (vs Placebo) (hrs) -17.7 -23.5 -22.4 --
Reference ID: 4324543
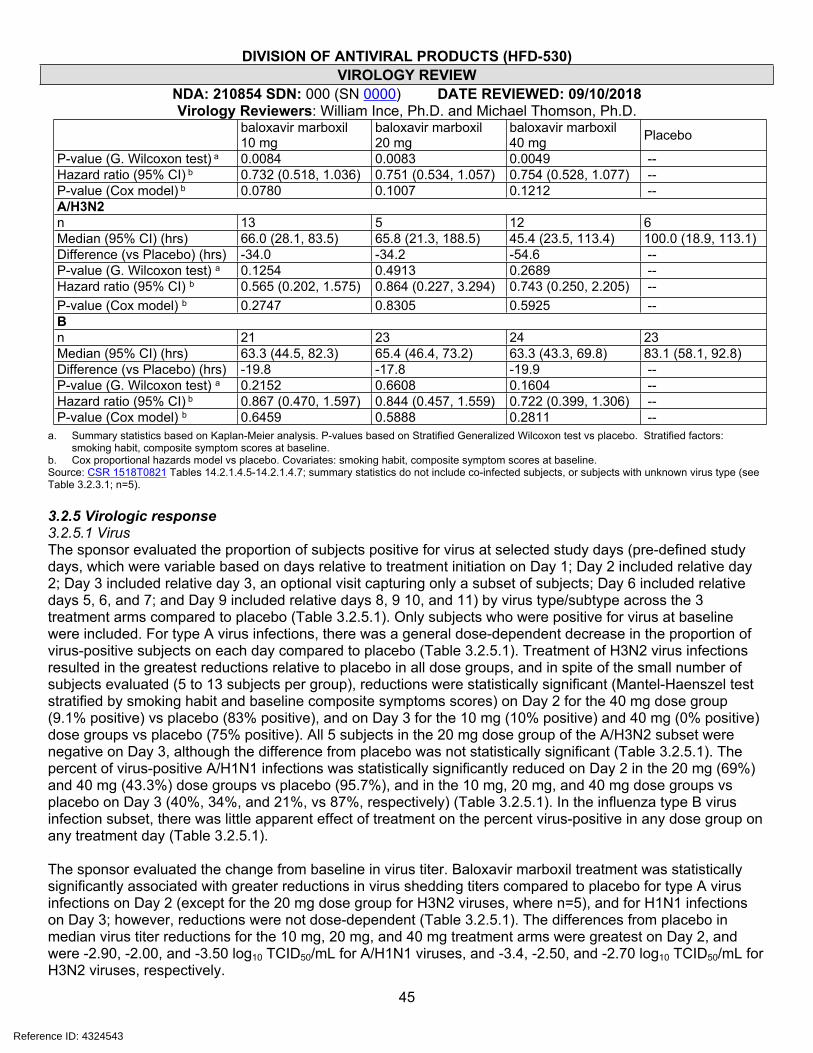
DIVISION OF ANTIVIRAL PRODUCTS (HFD-530)VIROLOGY REVIEW
NDA: 210854 SDN: 000 (SN 0000) DATE REVIEWED: 09/10/2018Virology Reviewers: William Ince, Ph.D. and Michael Thomson, Ph.D.
45
baloxavir marboxil10 mg
baloxavir marboxil20 mg
baloxavir marboxil40 mg Placebo
P-value (G. Wilcoxon test) a 0.0084 0.0083 0.0049 --Hazard ratio (95% CI) b 0.732 (0.518, 1.036) 0.751 (0.534, 1.057) 0.754 (0.528, 1.077) --P-value (Cox model) b 0.0780 0.1007 0.1212 --A/H3N2n 13 5 12 6Median (95% CI) (hrs) 66.0 (28.1, 83.5) 65.8 (21.3, 188.5) 45.4 (23.5, 113.4) 100.0 (18.9, 113.1)Difference (vs Placebo) (hrs) -34.0 -34.2 -54.6 --P-value (G. Wilcoxon test) a 0.1254 0.4913 0.2689 --Hazard ratio (95% CI) b 0.565 (0.202, 1.575) 0.864 (0.227, 3.294) 0.743 (0.250, 2.205) --P-value (Cox model) b 0.2747 0.8305 0.5925 --Bn 21 23 24 23Median (95% CI) (hrs) 63.3 (44.5, 82.3) 65.4 (46.4, 73.2) 63.3 (43.3, 69.8) 83.1 (58.1, 92.8)Difference (vs Placebo) (hrs) -19.8 -17.8 -19.9 --P-value (G. Wilcoxon test) a 0.2152 0.6608 0.1604 --Hazard ratio (95% CI) b 0.867 (0.470, 1.597) 0.844 (0.457, 1.559) 0.722 (0.399, 1.306) --P-value (Cox model) b 0.6459 0.5888 0.2811 --
a. Summary statistics based on Kaplan-Meier analysis. P-values based on Stratified Generalized Wilcoxon test vs placebo. Stratified factors: smoking habit, composite symptom scores at baseline.
b. Cox proportional hazards model vs placebo. Covariates: smoking habit, composite symptom scores at baseline.Source: CSR 1518T0821 Tables 14.2.1.4.5-14.2.1.4.7; summary statistics do not include co-infected subjects, or subjects with unknown virus type (see Table 3.2.3.1; n=5).
3.2.5 Virologic response3.2.5.1 VirusThe sponsor evaluated the proportion of subjects positive for virus at selected study days (pre-defined study days, which were variable based on days relative to treatment initiation on Day 1; Day 2 included relative day 2; Day 3 included relative day 3, an optional visit capturing only a subset of subjects; Day 6 included relative days 5, 6, and 7; and Day 9 included relative days 8, 9 10, and 11) by virus type/subtype across the 3 treatment arms compared to placebo (Table 3.2.5.1). Only subjects who were positive for virus at baseline were included. For type A virus infections, there was a general dose-dependent decrease in the proportion of virus-positive subjects on each day compared to placebo (Table 3.2.5.1). Treatment of H3N2 virus infections resulted in the greatest reductions relative to placebo in all dose groups, and in spite of the small number of subjects evaluated (5 to 13 subjects per group), reductions were statistically significant (Mantel-Haenszel test stratified by smoking habit and baseline composite symptoms scores) on Day 2 for the 40 mg dose group (9.1% positive) vs placebo (83% positive), and on Day 3 for the 10 mg (10% positive) and 40 mg (0% positive) dose groups vs placebo (75% positive). All 5 subjects in the 20 mg dose group of the A/H3N2 subset were negative on Day 3, although the difference from placebo was not statistically significant (Table 3.2.5.1). The percent of virus-positive A/H1N1 infections was statistically significantly reduced on Day 2 in the 20 mg (69%) and 40 mg (43.3%) dose groups vs placebo (95.7%), and in the 10 mg, 20 mg, and 40 mg dose groups vs placebo on Day 3 (40%, 34%, and 21%, vs 87%, respectively) (Table 3.2.5.1). In the influenza type B virus infection subset, there was little apparent effect of treatment on the percent virus-positive in any dose group on any treatment day (Table 3.2.5.1).
The sponsor evaluated the change from baseline in virus titer. Baloxavir marboxil treatment was statistically significantly associated with greater reductions in virus shedding titers compared to placebo for type A virus infections on Day 2 (except for the 20 mg dose group for H3N2 viruses, where n=5), and for H1N1 infections on Day 3; however, reductions were not dose-dependent (Table 3.2.5.1). The differences from placebo in median virus titer reductions for the 10 mg, 20 mg, and 40 mg treatment arms were greatest on Day 2, and were -2.90, -2.00, and -3.50 log10 TCID50/mL for A/H1N1 viruses, and -3.4, -2.50, and -2.70 log10 TCID50/mL for H3N2 viruses, respectively.
Reference ID: 4324543

DIVISION OF ANTIVIRAL PRODUCTS (HFD-530)VIROLOGY REVIEW
NDA: 210854 SDN: 000 (SN 0000) DATE REVIEWED: 09/10/2018Virology Reviewers: William Ince, Ph.D. and Michael Thomson, Ph.D.
46
Reductions in virus shedding titer in the treatment arms compared to placebo were not as great for type B virus infections, relative to type A virus infections, and were only statistically significant on Day 2, where median shedding reductions differed from placebo median in the 10 mg, 20 mg, and 40 mg dose groups by -1.6, -2.4, and -2.75 log10 TCID50/mL, respectively. Note that unlike type A virus infections, virus titer reductions trended toward dose-dependence in type B virus infection (Table 3.2.5.1). An independent (FDA) analysis of the change from baseline in virus shedding of pooled baloxavir marboxil treatment arms compared to placebo over analysis days (relative to the start of treatment) generally confirmed the results of the sponsor’s analysis based on pre-defined analysis days.
Table 3.2.5.1: Virologic response based on virus infectivity assay (TCID50): Proportion virus-positive and change from baseline at Study Days 2, 3, 6, and 9.
Study Daya
Summary statisticb 10 mg 20 mg 40 mg Placebo
H1N1% positive (n/N) 89.2%
(58/65)69.0% (49/71)
43.3% (26/60)
95.7% (66/69)
P vs placebo % positivec 0.1298 <0.0001 <0.0001 ---Change from baseline n 65 71 59 69Mean change from baseline (log10 TCID50/mL)
-4.49 -3.74 -5.13 -1.49
Median change from baseline (log10 TCID50/mL)
-4.70 -3.80 -5.30 -1.80
Day 2
P- vs placebo change from baselined <0.0001 <0.0001 <0.0001 ---
% positive (n/N) 40.0% (18/45)
34.6% (18/52)
20.9% (9/43) 87.0% (40/46)
P vs placebo % positivec <0.0001 <0.0001 <0.0001 ---Change from baseline n 45 52 43 46Mean change from baseline -5.16 -4.73 -5.37 -3.06Median change from baseline -5.50 -4.50 -5.50 -3.35
Day 3
P- vs placebo change from baselined <0.0001 0.0008 <0.0001 ---% positive (n/N) 10.9% (7/64) 12.9% (9/70) 10.0% (6/60) 27.5%
(19/69)P vs placebo % positivec 0.0096 0.0276 0.0088 ---Change from baseline n 64 70 59 69Mean change from baseline (log10 TCID50/mL)
-5.68 -4.68 -5.54 -5.11
Median change from baseline (log10 TCID50/mL)
-6.10 -4.90 -5.80 -5.50
Day 6
P- vs placebo change from baselined 0.0712 0.2634 0.2751 ---% positive (n/N) 0 0 1.7% (1/59) 1.5% (1/68)P vs placebo % positivec 0.3173 0.3173 0.9400 ---Change from baseline n 64 70 59 68Mean change from baseline -5.71 -4.83 -5.53 -5.44Median change from baseline -6.10 -5.00 -5.80 -5.80
Day 9
P- vs placebo change from baselined 0.3676 0.1020 0.9812 ---H3N2Day 2 % positive (n/N) 61.5% (8/13) 40.0% (2/5) 9.1% (1/11) 83.3% (5/6)
Reference ID: 4324543
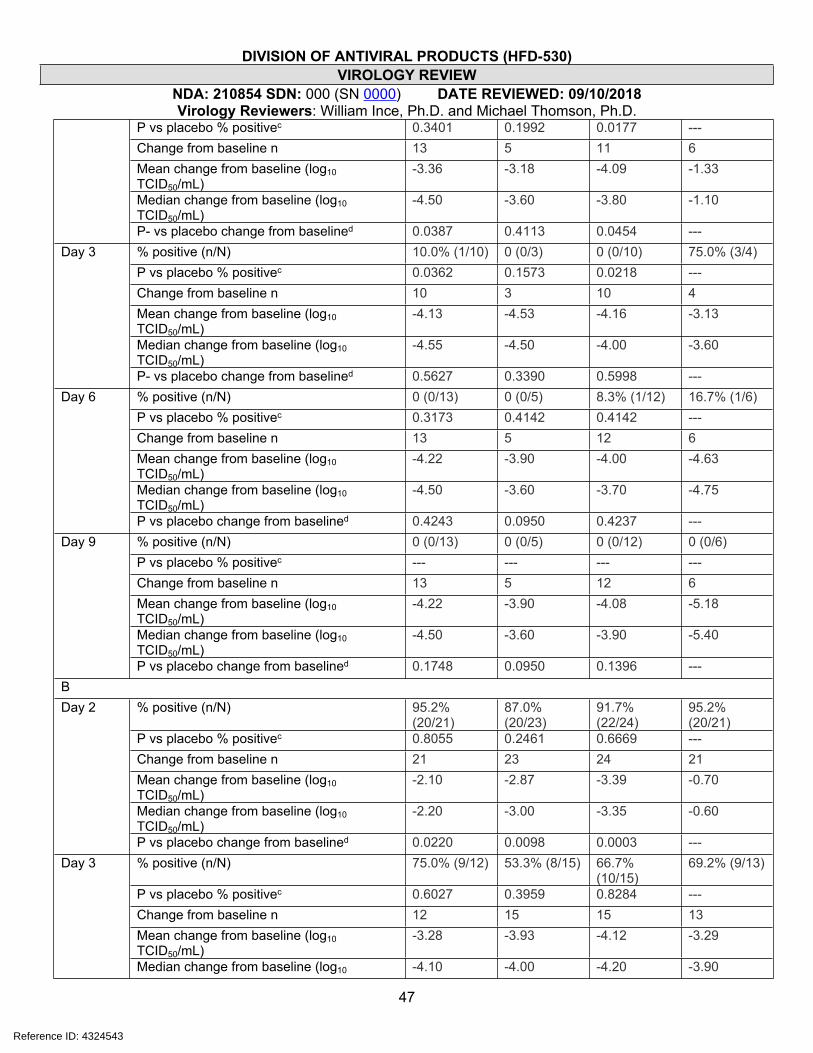
DIVISION OF ANTIVIRAL PRODUCTS (HFD-530)VIROLOGY REVIEW
NDA: 210854 SDN: 000 (SN 0000) DATE REVIEWED: 09/10/2018Virology Reviewers: William Ince, Ph.D. and Michael Thomson, Ph.D.
47
P vs placebo % positivec 0.3401 0.1992 0.0177 ---Change from baseline n 13 5 11 6Mean change from baseline (log10 TCID50/mL)
-3.36 -3.18 -4.09 -1.33
Median change from baseline (log10 TCID50/mL)
-4.50 -3.60 -3.80 -1.10
P- vs placebo change from baselined 0.0387 0.4113 0.0454 ---% positive (n/N) 10.0% (1/10) 0 (0/3) 0 (0/10) 75.0% (3/4)P vs placebo % positivec 0.0362 0.1573 0.0218 ---Change from baseline n 10 3 10 4Mean change from baseline (log10 TCID50/mL)
-4.13 -4.53 -4.16 -3.13
Median change from baseline (log10 TCID50/mL)
-4.55 -4.50 -4.00 -3.60
Day 3
P- vs placebo change from baselined 0.5627 0.3390 0.5998 ---% positive (n/N) 0 (0/13) 0 (0/5) 8.3% (1/12) 16.7% (1/6)P vs placebo % positivec 0.3173 0.4142 0.4142 ---Change from baseline n 13 5 12 6Mean change from baseline (log10 TCID50/mL)
-4.22 -3.90 -4.00 -4.63
Median change from baseline (log10 TCID50/mL)
-4.50 -3.60 -3.70 -4.75
Day 6
P vs placebo change from baselined 0.4243 0.0950 0.4237 ---% positive (n/N) 0 (0/13) 0 (0/5) 0 (0/12) 0 (0/6)P vs placebo % positivec --- --- --- ---Change from baseline n 13 5 12 6Mean change from baseline (log10 TCID50/mL)
-4.22 -3.90 -4.08 -5.18
Median change from baseline (log10 TCID50/mL)
-4.50 -3.60 -3.90 -5.40
Day 9
P vs placebo change from baselined 0.1748 0.0950 0.1396 ---B
% positive (n/N) 95.2% (20/21)
87.0% (20/23)
91.7% (22/24)
95.2% (20/21)
P vs placebo % positivec 0.8055 0.2461 0.6669 ---Change from baseline n 21 23 24 21Mean change from baseline (log10 TCID50/mL)
-2.10 -2.87 -3.39 -0.70
Median change from baseline (log10 TCID50/mL)
-2.20 -3.00 -3.35 -0.60
Day 2
P vs placebo change from baselined 0.0220 0.0098 0.0003 ---% positive (n/N) 75.0% (9/12) 53.3% (8/15) 66.7%
(10/15)69.2% (9/13)
P vs placebo % positivec 0.6027 0.3959 0.8284 ---Change from baseline n 12 15 15 13Mean change from baseline (log10 TCID50/mL)
-3.28 -3.93 -4.12 -3.29
Day 3
Median change from baseline (log10 -4.10 -4.00 -4.20 -3.90
Reference ID: 4324543

DIVISION OF ANTIVIRAL PRODUCTS (HFD-530)VIROLOGY REVIEW
NDA: 210854 SDN: 000 (SN 0000) DATE REVIEWED: 09/10/2018Virology Reviewers: William Ince, Ph.D. and Michael Thomson, Ph.D.
48
TCID50/mL)P vs placebo change from baselined 0.5008 0.7355 0.4885 ---% positive (n/N) 19.0% (4/21) 9.1% (2/22) 16.7% (4/24) 14.3% (3/21)P vs placebo % positivec 0.6836 0.7328 0.7236 ---Change from baseline n 21 22 24 21Mean change from baseline (log10 TCID50/mL)
-5.30 -5.27 -5.69 -4.16
Median change from baseline (log10 TCID50/mL)
-5.30 -5.15 -6.10 -4.50
Day 6
P vs placebo change from baselined 0.2455 0.1842 0.1630 ---% positive (n/N) 0 (0/21) 0 (0/21) 0 (0/24) 0 (0/21)P vs placebo % positivec --- --- --- ---Change from baseline n 21 21 24 21Mean change from baseline (log10 TCID50/mL)
-5.60 -5.50 -5.74 -4.50
Median change from baseline (log10 TCID50/mL)
-6.10 -5.30 -6.10 -5.00
Day 9
P vs placebo change from baselined 0.1530 0.2365 0.1953 ---a. Treatment was initiated in Day 1.b. Positive was defined as a ≥0.07 log10 TCID50/mL (target detected). LLOQ: 0.07 log10 TCID50/mL. Change from baseline is reported as the log10 change
in TCID50/mL. Undetectable virus was imputed as the LLOQ for calculating change from baseline. Analysis population included only subjects who were positive for influenza virus titer at baseline.
c. Mantel-Haenszel test. Stratified factors: smoking habit, composite symptom scores at baseline. Subset of patients who were positive for influenza virus titer at baseline.
d. van Elteren test. Covariates: smoking habit, composite symptom scores at baseline. Subset of patients who were positive for influenza virus titer at baseline.
Source: CSR 1518T0821; Tables 14.2.7.2-4 (proportion virus-positive); Tables 14.2.8.2-4 (change from baseline in virus). Proportion virus-positive included subject with missing data (A/H1N1 40 mg, Days 2, 3, and 6, subject 2PK008).
In an independent analysis of the data (FDA analysis) of treated (pooled dose groups) vs placebo arms, the proportion of subjects who were virus positive at each analysis day (sample collection day relative to the start of treatment) were evaluated and generally confirmed the sponsor’s findings (Figure 3.2.5.1).
In the A/H1N1 and A/H3N2 subsets, >50% of subjects were virus-negative by analysis Day 3 and Day 2, respectively, compared to Day 5 for placebo subjects. Differences in the percent-positive in treatment arms compared to placebo were statistically significant at days 2-5 in the A/H3N2 subset and at Day 3 in the A/H1N1 subset (Fisher’s exact test, not corrected for multiple comparisons; proportions are not considered independent between days). In the type B subset, there was no clear difference between treatment and placebo at any analysis day (Figure 3.2.5.1).
Reference ID: 4324543
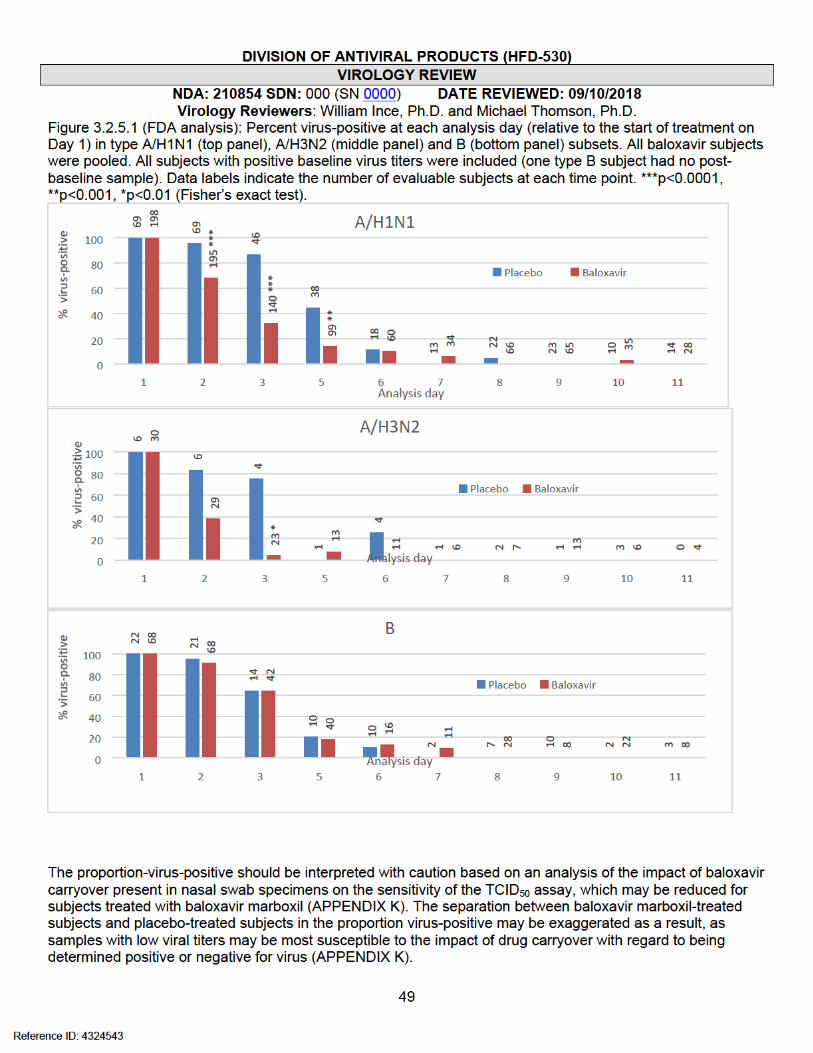
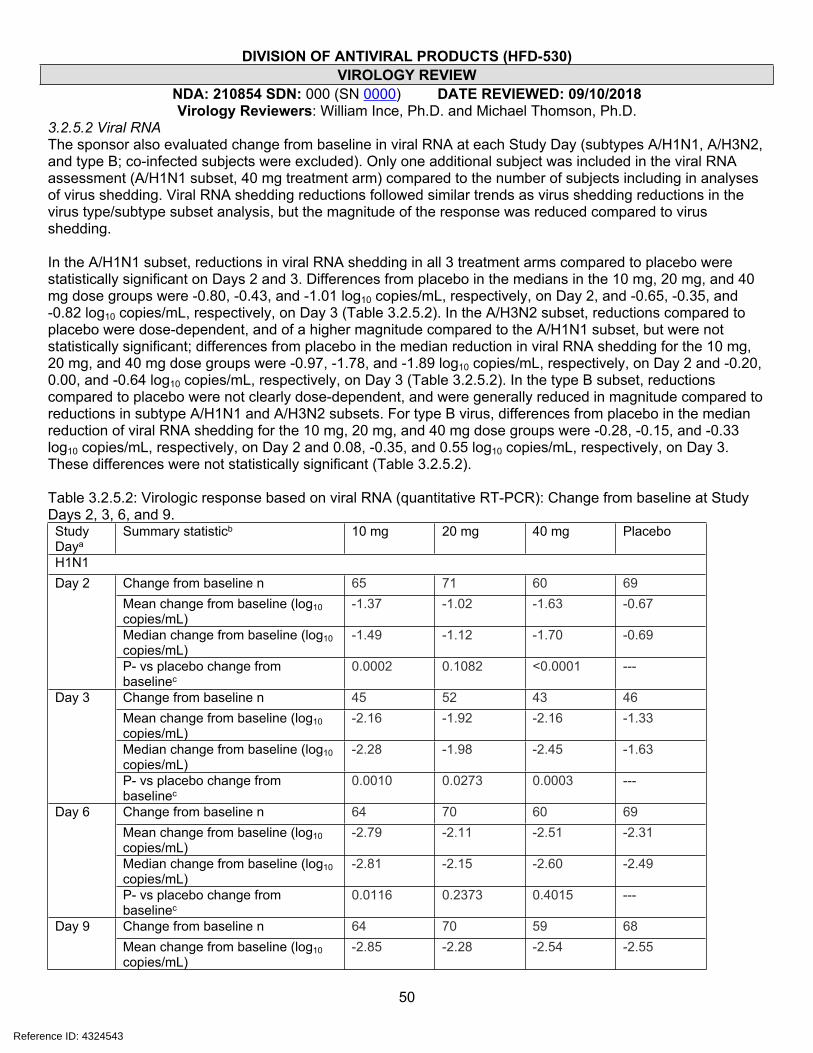
DIVISION OF ANTIVIRAL PRODUCTS (HFD-530)VIROLOGY REVIEW
NDA: 210854 SDN: 000 (SN 0000) DATE REVIEWED: 09/10/2018Virology Reviewers: William Ince, Ph.D. and Michael Thomson, Ph.D.
50
3.2.5.2 Viral RNAThe sponsor also evaluated change from baseline in viral RNA at each Study Day (subtypes A/H1N1, A/H3N2, and type B; co-infected subjects were excluded). Only one additional subject was included in the viral RNA assessment (A/H1N1 subset, 40 mg treatment arm) compared to the number of subjects including in analyses of virus shedding. Viral RNA shedding reductions followed similar trends as virus shedding reductions in the virus type/subtype subset analysis, but the magnitude of the response was reduced compared to virus shedding.
In the A/H1N1 subset, reductions in viral RNA shedding in all 3 treatment arms compared to placebo were statistically significant on Days 2 and 3. Differences from placebo in the medians in the 10 mg, 20 mg, and 40 mg dose groups were -0.80, -0.43, and -1.01 log10 copies/mL, respectively, on Day 2, and -0.65, -0.35, and -0.82 log10 copies/mL, respectively, on Day 3 (Table 3.2.5.2). In the A/H3N2 subset, reductions compared to placebo were dose-dependent, and of a higher magnitude compared to the A/H1N1 subset, but were not statistically significant; differences from placebo in the median reduction in viral RNA shedding for the 10 mg, 20 mg, and 40 mg dose groups were -0.97, -1.78, and -1.89 log10 copies/mL, respectively, on Day 2 and -0.20, 0.00, and -0.64 log10 copies/mL, respectively, on Day 3 (Table 3.2.5.2). In the type B subset, reductions compared to placebo were not clearly dose-dependent, and were generally reduced in magnitude compared to reductions in subtype A/H1N1 and A/H3N2 subsets. For type B virus, differences from placebo in the median reduction of viral RNA shedding for the 10 mg, 20 mg, and 40 mg dose groups were -0.28, -0.15, and -0.33 log10 copies/mL, respectively, on Day 2 and 0.08, -0.35, and 0.55 log10 copies/mL, respectively, on Day 3. These differences were not statistically significant (Table 3.2.5.2).
Table 3.2.5.2: Virologic response based on viral RNA (quantitative RT-PCR): Change from baseline at Study Days 2, 3, 6, and 9.Study Daya
Summary statisticb 10 mg 20 mg 40 mg Placebo
H1N1Change from baseline n 65 71 60 69Mean change from baseline (log10 copies/mL)
-1.37 -1.02 -1.63 -0.67
Median change from baseline (log10 copies/mL)
-1.49 -1.12 -1.70 -0.69
Day 2
P- vs placebo change from baselinec
0.0002 0.1082 <0.0001 ---
Change from baseline n 45 52 43 46Mean change from baseline (log10 copies/mL)
-2.16 -1.92 -2.16 -1.33
Median change from baseline (log10 copies/mL)
-2.28 -1.98 -2.45 -1.63
Day 3
P- vs placebo change from baselinec
0.0010 0.0273 0.0003 ---
Change from baseline n 64 70 60 69Mean change from baseline (log10 copies/mL)
-2.79 -2.11 -2.51 -2.31
Median change from baseline (log10 copies/mL)
-2.81 -2.15 -2.60 -2.49
Day 6
P- vs placebo change from baselinec
0.0116 0.2373 0.4015 ---
Change from baseline n 64 70 59 68Day 9Mean change from baseline (log10 copies/mL)
-2.85 -2.28 -2.54 -2.55
Reference ID: 4324543

DIVISION OF ANTIVIRAL PRODUCTS (HFD-530)VIROLOGY REVIEW
NDA: 210854 SDN: 000 (SN 0000) DATE REVIEWED: 09/10/2018Virology Reviewers: William Ince, Ph.D. and Michael Thomson, Ph.D.
51
Median change from baseline (log10 copies/mL)
-2.81 -2.47 -2.69 -2.76
P- vs placebo change from baselinec
0.1469 0.1160 0.8377 ---
H3N2Change from baseline n 13 5 11 6Mean change from baseline (log10 copies/mL)
-1.00 -1.44 -2.02 -0.50
Median change from baseline (log10 copies/mL)
-1.32 -2.13 -2.24 -0.35
Day 2
P- vs placebo change from baselinec
0.1018 0.9273 0.0624 ---
Change from baseline n 10 3 10 4Mean change from baseline (log10 copies/mL)
-2.21 -2.30 -2.93 -2.09
Median change from baseline (log10 copies/mL)
-2.19 -2.39 -3.03 -2.39
Day 3
P- vs placebo change from baselinec
0.8852 0.8111 0.1684 ---
Change from baseline n 13 5 12 6Mean change from baseline (log10 copies/mL)
-2.64 -2.64 -2.98 -2.91
Median change from baseline (log10 copies/mL)
-2.84 -2.80 -2.95 -2.99
Day 6
P- vs placebo change from baselinec
0.6140 0.5228 0.6444 ---
Change from baseline n 13 5 12 6Mean change from baseline (log10 copies/mL)
-2.67 -2.64 -3.04 -3.33
Median change from baseline (log10 copies/mL)
-2.84 -2.80 -2.95 -3.51
Day 9
P- vs placebo change from baselinec
0.0411 0.1003 0.3401 ---
BChange from baseline n 21 23 24 21Mean change from baseline (log10 copies/mL)
-0.68 -0.93 -0.86 -0.40
Median change from baseline (log10 copies/mL)
-0.84 -0.71 -0.89 -0.56
Day 2
P- vs placebo change from baselinec
0.4714 0.4387 0.2815 ---
Change from baseline n 12 15 15 13Mean change from baseline (log10 copies/mL)
-1.41 -1.87 -1.44 -1.69
Median change from baseline (log10 copies/mL)
-1.61 -2.04 -1.14 -1.69
Day 3
P- vs placebo change from baselinec
0.3535 0.7206 0.9059 ---
Change from baseline n 21 22 24 21Mean change from baseline (log10 copies/mL)
-2.76 -3.03 -2.96 -2.21Day 6
Median change from baseline (log10 -2.72 -3.15 -3.16 -2.78
Reference ID: 4324543
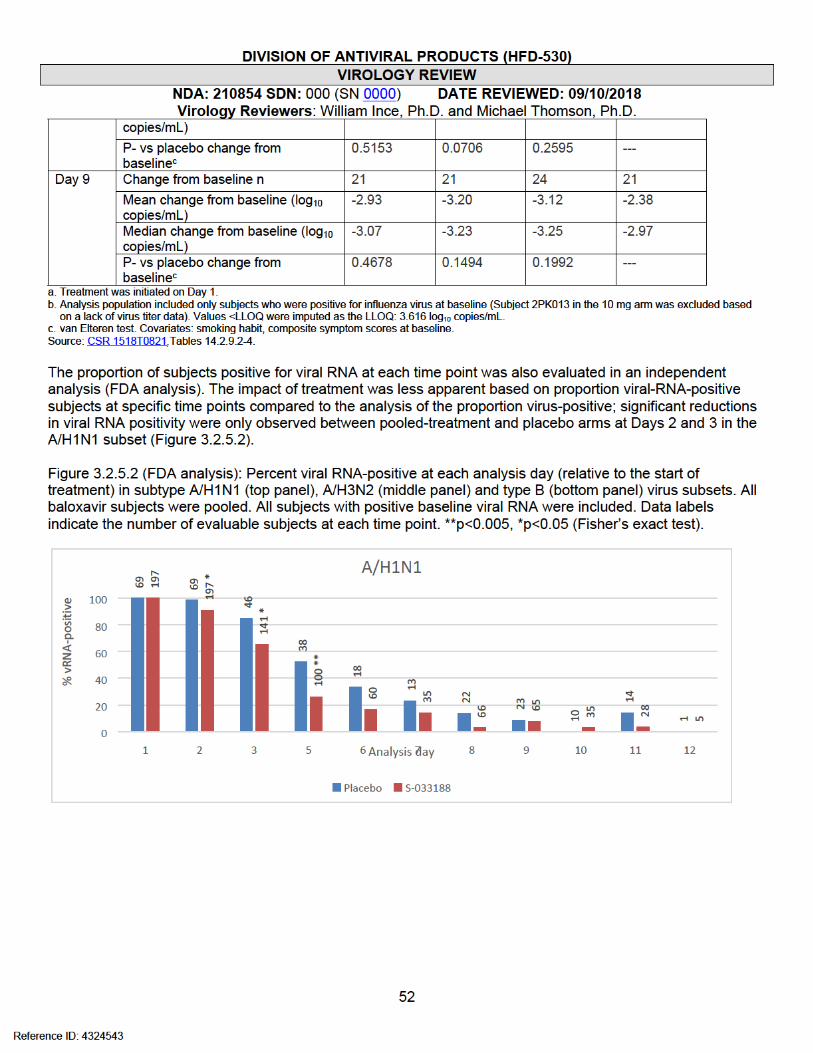
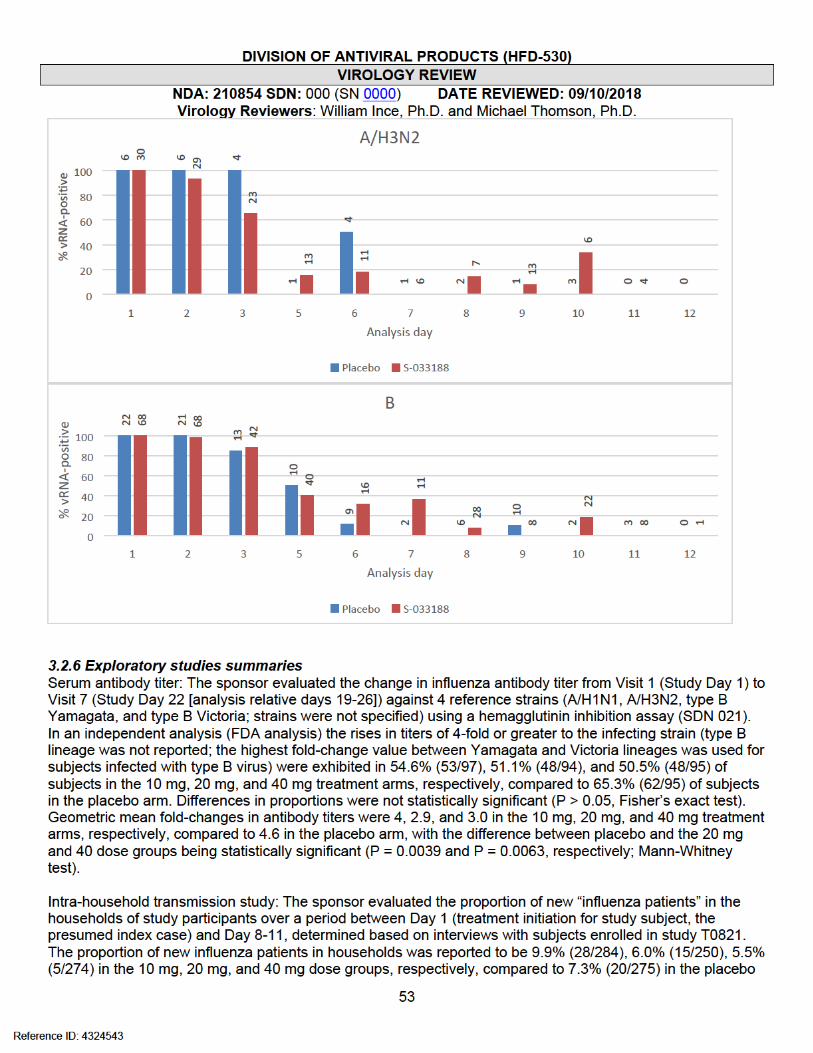
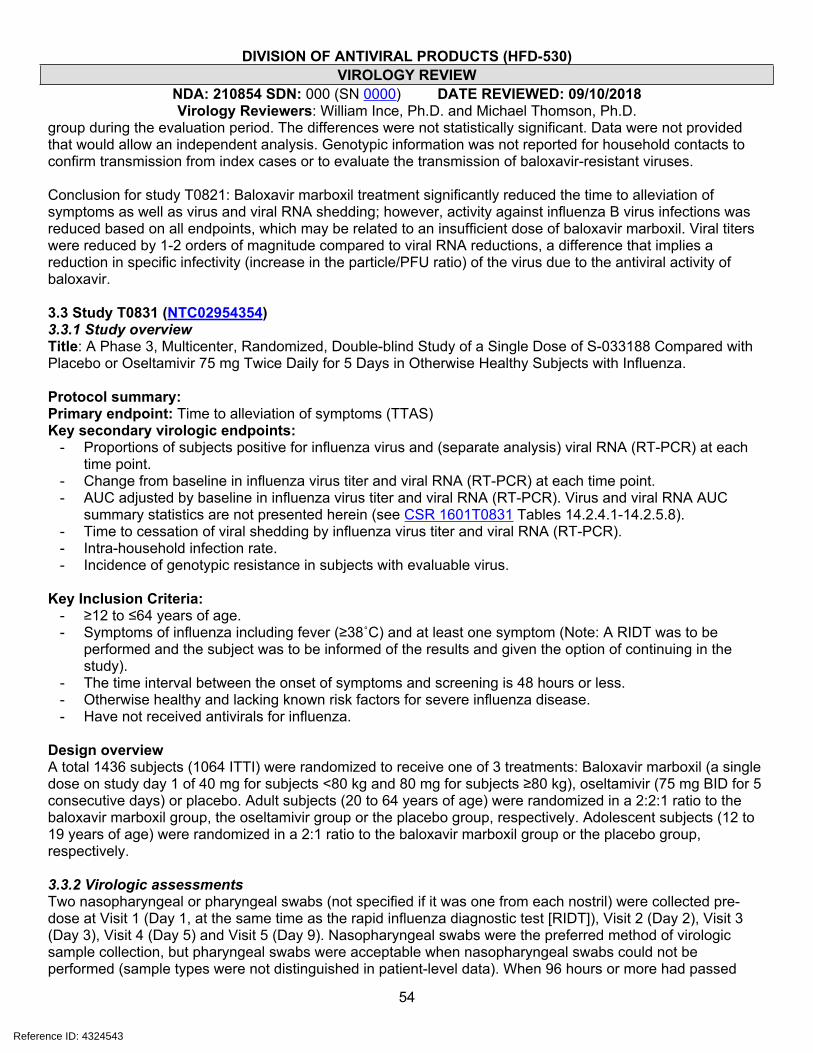
DIVISION OF ANTIVIRAL PRODUCTS (HFD-530)VIROLOGY REVIEW
NDA: 210854 SDN: 000 (SN 0000) DATE REVIEWED: 09/10/2018Virology Reviewers: William Ince, Ph.D. and Michael Thomson, Ph.D.
54
group during the evaluation period. The differences were not statistically significant. Data were not provided that would allow an independent analysis. Genotypic information was not reported for household contacts to confirm transmission from index cases or to evaluate the transmission of baloxavir-resistant viruses.
Conclusion for study T0821: Baloxavir marboxil treatment significantly reduced the time to alleviation of symptoms as well as virus and viral RNA shedding; however, activity against influenza B virus infections was reduced based on all endpoints, which may be related to an insufficient dose of baloxavir marboxil. Viral titers were reduced by 1-2 orders of magnitude compared to viral RNA reductions, a difference that implies a reduction in specific infectivity (increase in the particle/PFU ratio) of the virus due to the antiviral activity of baloxavir.
3.3 Study T0831 (NTC02954354)3.3.1 Study overviewTitle: A Phase 3, Multicenter, Randomized, Double-blind Study of a Single Dose of S-033188 Compared with Placebo or Oseltamivir 75 mg Twice Daily for 5 Days in Otherwise Healthy Subjects with Influenza.
Protocol summary:Primary endpoint: Time to alleviation of symptoms (TTAS)Key secondary virologic endpoints:
- Proportions of subjects positive for influenza virus and (separate analysis) viral RNA (RT-PCR) at each time point.
- Change from baseline in influenza virus titer and viral RNA (RT-PCR) at each time point.- AUC adjusted by baseline in influenza virus titer and viral RNA (RT-PCR). Virus and viral RNA AUC
summary statistics are not presented herein (see CSR 1601T0831 Tables 14.2.4.1-14.2.5.8).- Time to cessation of viral shedding by influenza virus titer and viral RNA (RT-PCR).- Intra-household infection rate.- Incidence of genotypic resistance in subjects with evaluable virus.
Key Inclusion Criteria:- ≥12 to ≤64 years of age.- Symptoms of influenza including fever (≥38˚C) and at least one symptom (Note: A RIDT was to be
performed and the subject was to be informed of the results and given the option of continuing in the study).
- The time interval between the onset of symptoms and screening is 48 hours or less.- Otherwise healthy and lacking known risk factors for severe influenza disease.- Have not received antivirals for influenza.
Design overviewA total 1436 subjects (1064 ITTI) were randomized to receive one of 3 treatments: Baloxavir marboxil (a single dose on study day 1 of 40 mg for subjects <80 kg and 80 mg for subjects ≥80 kg), oseltamivir (75 mg BID for 5 consecutive days) or placebo. Adult subjects (20 to 64 years of age) were randomized in a 2:2:1 ratio to the baloxavir marboxil group, the oseltamivir group or the placebo group, respectively. Adolescent subjects (12 to 19 years of age) were randomized in a 2:1 ratio to the baloxavir marboxil group or the placebo group, respectively.
3.3.2 Virologic assessmentsTwo nasopharyngeal or pharyngeal swabs (not specified if it was one from each nostril) were collected pre-dose at Visit 1 (Day 1, at the same time as the rapid influenza diagnostic test [RIDT]), Visit 2 (Day 2), Visit 3 (Day 3), Visit 4 (Day 5) and Visit 5 (Day 9). Nasopharyngeal swabs were the preferred method of virologic sample collection, but pharyngeal swabs were acceptable when nasopharyngeal swabs could not be performed (sample types were not distinguished in patient-level data). When 96 hours or more had passed
Reference ID: 4324543

DIVISION OF ANTIVIRAL PRODUCTS (HFD-530)VIROLOGY REVIEW
NDA: 210854 SDN: 000 (SN 0000) DATE REVIEWED: 09/10/2018Virology Reviewers: William Ince, Ph.D. and Michael Thomson, Ph.D.
55
before cryopreservation, the virologic data associated with such swab samples were excluded from the efficacy analyses. If circumstances permitted, specimens were also to have been collected at Optional Visit 1 (Day 4) and Optional Visit 2 (Day 6). If the investigator or sub-investigator determined that influenza symptoms were ongoing, specimens were also to have been collected at Visit 6 (Day 15) and Visit 7 (Day 22) (or at early termination).
The virologic evaluations for treatment response endpoints were carried out by The LLOQ/LOD for the infectivity (virus)
assay was 0.7 log10 TCID50/mL (CF-246-N), and the LLOQ and LOD for the quantitative RT-PCR assay were 2.18 and 2.05 log10 copies/mL, respectively, for type A virus, and 2.93 and 2.83 log10 copies/mL, respectively, for type B virus (RPT-VAL-INFA/8-FAST-FNL). Note that RT-PCR values are reported in the CSR as “vp” [virus particle equivalent units]/mL, but are referred to as “copies/mL” throughout this review.
3.3.3 Baseline characteristicsA total of 1,436 subjects were enrolled, and of these, 1,064 (74%) were included in the ITTI set based on RT-PCR-confirmed infection. The final numbers of subjects in the ITTI population in each treatment arm were 456, 377, and 231 in the baloxavir marboxil, oseltamivir, and placebo, arms, respectively. Overall, baseline demographics were generally equally represented across arms (subjects younger than 20 years of age were excluded from the oseltamivir arm), although the proportion of females was slightly lower in the oseltamivir arm compared to the baloxavir marboxil and placebo arms (42% vs 49% and 48%, respectively). The median age of subjects ranged between 32 and 35 years across the 3 arms (Table 3.3.3.1). Of note, the median baseline virus titer was approximately 0.3-2 log10 lower in the placebo arm compared to treatment arms across virus type/subtype, but this did not appear to be related to time since symptoms onset, which was relatively balanced across arms (Table 3.3.3.1).
Influenza type A virus comprised 89.9%, 89.3% and 90% of infections in the baloxavir marboxil, oseltamivir, and placebo arms, respectively. Of type A infections, subtype A/H1N1 comprised 1.7%, 0.6% and 3.4%, and subtype A/H3N2 comprised 95.9%, 98.5%, and 94.2% of infections in the baloxavir marboxil, oseltamivir, and placebo arms, respectively. Influenza type B virus comprised 8.3%, 9%, and 8.7% for the baloxavir marboxil, oseltamivir, and placebo arms, respectively (Table 3.3.3.1). Based on an analysis of available surveillance data from the WHO FluNet database obtained for the study period and regions for T0831 (Japan and U.S., December 8, 2016 – April 24, 2017), influenza virus type A and B viruses comprised 72% (2.7% A/H1N1 and 97.3% A/H3N2) and 28% of evaluated viruses, respectively, indicating that influenza B virus may have been under-represented in the trial. Type A viruses comprised 82.7% and 71.4% of infections in Japan and U.S., respectively, and type A subtypes proportions (of type A) were the same in Japan and the U.S. Victoria and Yamagata lineages represented 58.1% and 41.9% of type B viruses in Japan, respectively, and 26.8% and 73.2% of type B viruses in the U.S., respectively. Circulating resistance to oseltamivir has remained low since the emergence of the A/H1N1 2009 pandemic lineage (CDC – Influenza Antiviral Medications: Summary for Clinicians; Influenza Resistance Information Study [IRIS; NCT00884117]).
Clinical diagnostic testing was employed at screening, and while subjects were ostensibly enrolled regardless of the clinical test result, they were informed of the test result and given the option to continue enrollment. An influenza diagnostic test result distinguishing between influenza type A and B virus was obtained for 1434 of 1436 subjects. A rapid influenza diagnostic test (RIDT) was identified for 98.4% (1413/1436) of subjects. Overall, at least 40 different test kits were used, but the sponsor-supplied Clearview® Exact II influenza A and B Test (Abbot; FDA-cleared, K1030610) was used most frequently (38.9%, 559 subjects), followed by QuickNavi-Flu® (Denka Sieken) (14%, 201 subjects) with the next 15 most common kits used in 1-8% of subjects. A total of 1420 subjects had both influenza diagnostic test results and central-lab RT-PCR results. Based on an FDA analysis of the data, the overall sensitivity and specificity of diagnostic tests (including 21 subjects with unidentified influenza diagnostic tests) relative to centralized RT-PCR testing for influenza virus was 91% (968/1064) and 75% (267/356), respectively. For type A virus detection, the sensitivity and specificity
Reference ID: 4324543
(b) (4)
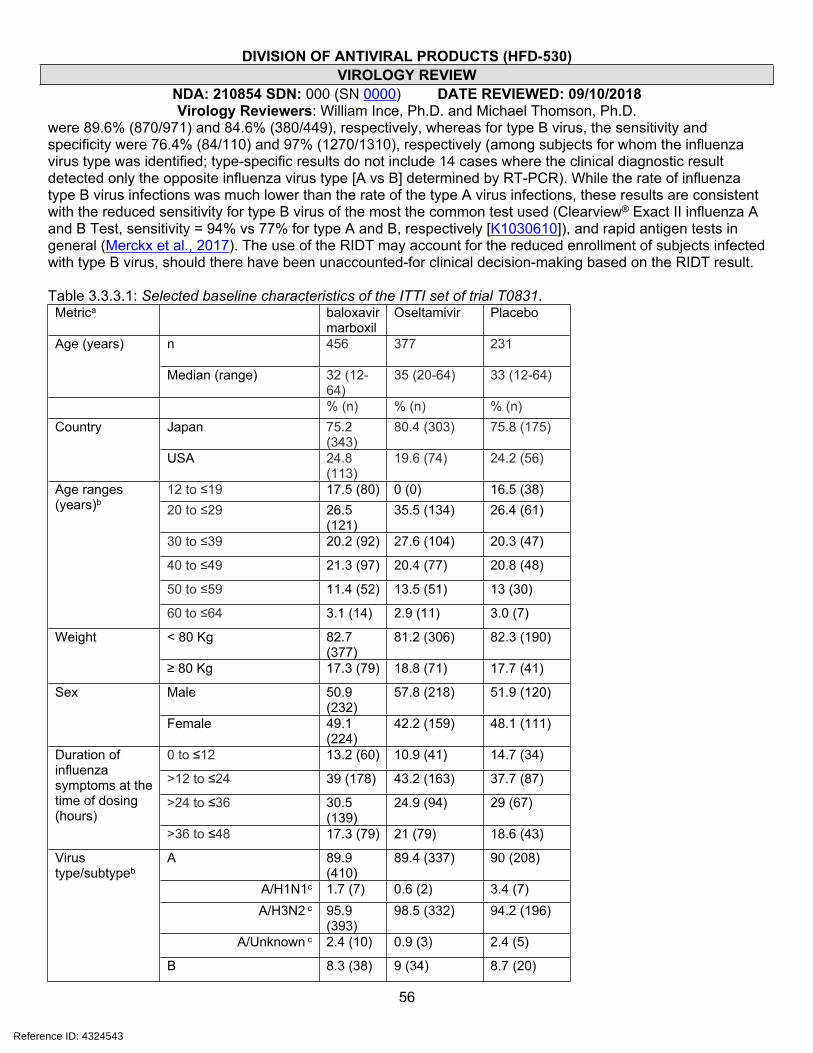
DIVISION OF ANTIVIRAL PRODUCTS (HFD-530)VIROLOGY REVIEW
NDA: 210854 SDN: 000 (SN 0000) DATE REVIEWED: 09/10/2018Virology Reviewers: William Ince, Ph.D. and Michael Thomson, Ph.D.
56
were 89.6% (870/971) and 84.6% (380/449), respectively, whereas for type B virus, the sensitivity and specificity were 76.4% (84/110) and 97% (1270/1310), respectively (among subjects for whom the influenza virus type was identified; type-specific results do not include 14 cases where the clinical diagnostic result detected only the opposite influenza virus type [A vs B] determined by RT-PCR). While the rate of influenza type B virus infections was much lower than the rate of the type A virus infections, these results are consistent with the reduced sensitivity for type B virus of the most the common test used (Clearview® Exact II influenza A and B Test, sensitivity = 94% vs 77% for type A and B, respectively [K1030610]), and rapid antigen tests in general (Merckx et al., 2017). The use of the RIDT may account for the reduced enrollment of subjects infected with type B virus, should there have been unaccounted-for clinical decision-making based on the RIDT result. Table 3.3.3.1: Selected baseline characteristics of the ITTI set of trial T0831. Metrica baloxavir
marboxilOseltamivir Placebo
n 456 377 231Age (years)
Median (range) 32 (12-64)
35 (20-64) 33 (12-64)
% (n) % (n) % (n)Japan 75.2
(343)80.4 (303) 75.8 (175)Country
USA 24.8 (113)
19.6 (74) 24.2 (56)
12 to ≤19 17.5 (80) 0 (0) 16.5 (38)20 to ≤29 26.5
(121)35.5 (134) 26.4 (61)
30 to ≤39 20.2 (92) 27.6 (104) 20.3 (47)
40 to ≤49 21.3 (97) 20.4 (77) 20.8 (48)
50 to ≤59 11.4 (52) 13.5 (51) 13 (30)
Age ranges (years)b
60 to ≤64 3.1 (14) 2.9 (11) 3.0 (7)
< 80 Kg 82.7 (377)
81.2 (306) 82.3 (190)Weight
≥ 80 Kg 17.3 (79) 18.8 (71) 17.7 (41)
Male 50.9 (232)
57.8 (218) 51.9 (120)Sex
Female 49.1 (224)
42.2 (159) 48.1 (111)
0 to ≤12 13.2 (60) 10.9 (41) 14.7 (34)
>12 to ≤24 39 (178) 43.2 (163) 37.7 (87)
>24 to ≤36 30.5 (139)
24.9 (94) 29 (67)
Duration of influenza symptoms at the time of dosing (hours)
>36 to ≤48 17.3 (79) 21 (79) 18.6 (43)
A 89.9 (410)
89.4 (337) 90 (208)
A/H1N1c 1.7 (7) 0.6 (2) 3.4 (7)A/H3N2 c 95.9
(393)98.5 (332) 94.2 (196)
A/Unknown c 2.4 (10) 0.9 (3) 2.4 (5)
Virus type/subtypeb
B 8.3 (38) 9 (34) 8.7 (20)
Reference ID: 4324543
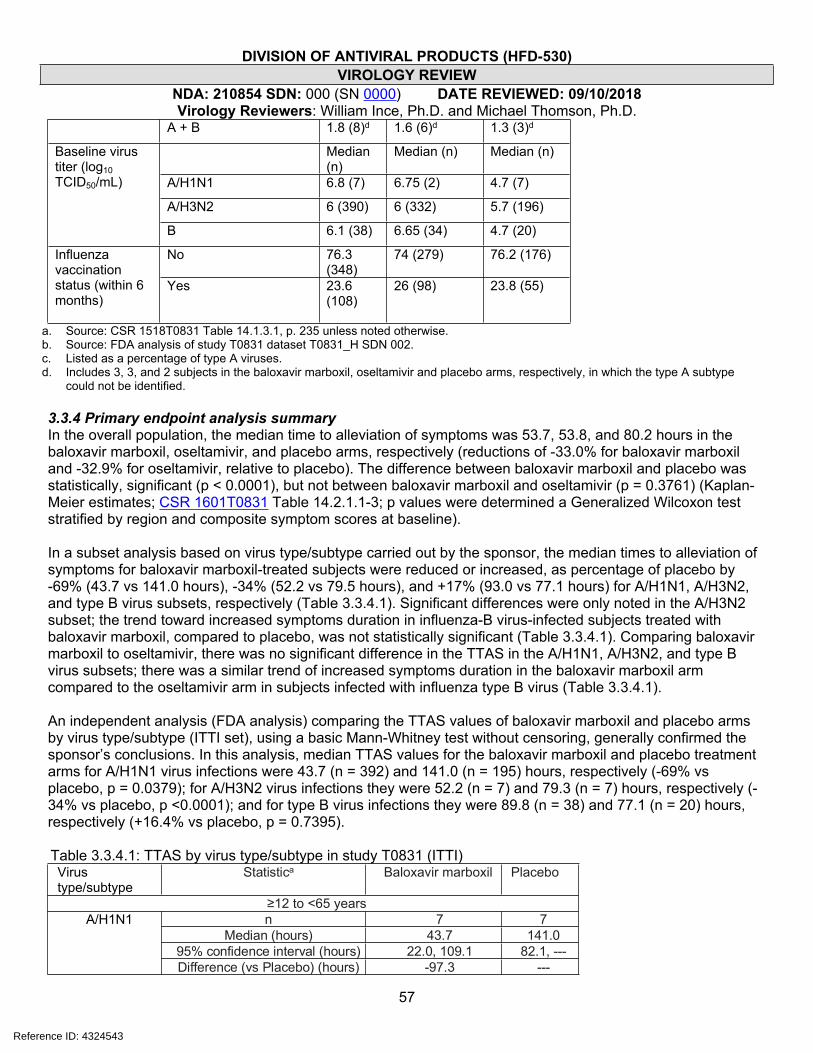
DIVISION OF ANTIVIRAL PRODUCTS (HFD-530)VIROLOGY REVIEW
NDA: 210854 SDN: 000 (SN 0000) DATE REVIEWED: 09/10/2018Virology Reviewers: William Ince, Ph.D. and Michael Thomson, Ph.D.
57
A + B 1.8 (8)d 1.6 (6)d 1.3 (3)d
Median (n)
Median (n) Median (n)
A/H1N1 6.8 (7) 6.75 (2) 4.7 (7)
A/H3N2 6 (390) 6 (332) 5.7 (196)
Baseline virus titer (log10 TCID50/mL)
B 6.1 (38) 6.65 (34) 4.7 (20)
No 76.3 (348)
74 (279) 76.2 (176)Influenza
vaccination status (within 6 months)
Yes 23.6 (108)
26 (98) 23.8 (55)
a. Source: CSR 1518T0831 Table 14.1.3.1, p. 235 unless noted otherwise. b. Source: FDA analysis of study T0831 dataset T0831_H SDN 002. c. Listed as a percentage of type A viruses.d. Includes 3, 3, and 2 subjects in the baloxavir marboxil, oseltamivir and placebo arms, respectively, in which the type A subtype
could not be identified.
3.3.4 Primary endpoint analysis summaryIn the overall population, the median time to alleviation of symptoms was 53.7, 53.8, and 80.2 hours in the baloxavir marboxil, oseltamivir, and placebo arms, respectively (reductions of -33.0% for baloxavir marboxil and -32.9% for oseltamivir, relative to placebo). The difference between baloxavir marboxil and placebo was statistically, significant (p < 0.0001), but not between baloxavir marboxil and oseltamivir (p = 0.3761) (Kaplan-Meier estimates; CSR 1601T0831 Table 14.2.1.1-3; p values were determined a Generalized Wilcoxon test stratified by region and composite symptom scores at baseline).
In a subset analysis based on virus type/subtype carried out by the sponsor, the median times to alleviation of symptoms for baloxavir marboxil-treated subjects were reduced or increased, as percentage of placebo by -69% (43.7 vs 141.0 hours), -34% (52.2 vs 79.5 hours), and +17% (93.0 vs 77.1 hours) for A/H1N1, A/H3N2, and type B virus subsets, respectively (Table 3.3.4.1). Significant differences were only noted in the A/H3N2 subset; the trend toward increased symptoms duration in influenza-B virus-infected subjects treated with baloxavir marboxil, compared to placebo, was not statistically significant (Table 3.3.4.1). Comparing baloxavir marboxil to oseltamivir, there was no significant difference in the TTAS in the A/H1N1, A/H3N2, and type B virus subsets; there was a similar trend of increased symptoms duration in the baloxavir marboxil arm compared to the oseltamivir arm in subjects infected with influenza type B virus (Table 3.3.4.1).
An independent analysis (FDA analysis) comparing the TTAS values of baloxavir marboxil and placebo arms by virus type/subtype (ITTI set), using a basic Mann-Whitney test without censoring, generally confirmed the sponsor’s conclusions. In this analysis, median TTAS values for the baloxavir marboxil and placebo treatment arms for A/H1N1 virus infections were 43.7 (n = 392) and 141.0 (n = 195) hours, respectively (-69% vs placebo, p = 0.0379); for A/H3N2 virus infections they were 52.2 (n = 7) and 79.3 (n = 7) hours, respectively (-34% vs placebo, p <0.0001); and for type B virus infections they were 89.8 (n = 38) and 77.1 (n = 20) hours, respectively (+16.4% vs placebo, p = 0.7395).
Table 3.3.4.1: TTAS by virus type/subtype in study T0831 (ITTI)Virus type/subtype
Statistica Baloxavir marboxil Placebo
≥12 to <65 yearsn 7 7
Median (hours) 43.7 141.095% confidence interval (hours) 22.0, 109.1 82.1, ---
A/H1N1
Difference (vs Placebo) (hours) -97.3 ---
Reference ID: 4324543

DIVISION OF ANTIVIRAL PRODUCTS (HFD-530)VIROLOGY REVIEW
NDA: 210854 SDN: 000 (SN 0000) DATE REVIEWED: 09/10/2018Virology Reviewers: William Ince, Ph.D. and Michael Thomson, Ph.D.
58
P-value 0.4212 ---n 392 195
Median (hours) 52.2 79.595% confidence interval (hours) 47.0, 56.8 69.5, 86.8Difference (vs Placebo) (hours) -27.3 ---
A/H3N2
P-value <0.0001 ---n 38 20
Median (hours) 93.0 77.195% confidence interval (hours) 53.4, 135.4 46.8, 189.0Difference (vs Placebo) (hours) 15.9 ---
B
P-value 0.8568 ---≥20 to <65 years
Virus type/subtype Summary statistic Baloxavir marboxil Oseltamivirn 7 2
Median (hours) 43.7 65.995% confidence interval (hours) 22.0, 109.1 23.0, 108.8
Difference (vs Oseltamivir) (hours) -22.2 ---
A/H1N1
P-value 1.0000 ---
n 320 332Median (hours) 52.1 51.8
95% confidence interval (hours) 46.1, 56.0 48.1, 54.7Difference (vs Oseltamivir) (hours) 0.3 ---
A/H3N2
P-value 0.6651n 33 34
Median (hours) 111.8 87.695% confidence interval (hours) 56.0, 136.6 57.1, 112.4
Difference (vs Oseltamivir) (hours) 24.2 ---
B
P-value 0.4698 --- a. Summary statistics based on Kaplan-Meier analysis; p-values were based on a Stratified Generalized Wilcoxon test where subjects
were stratified by region and composite symptom scores at baseline. Subjects who did not experience alleviation of symptoms were censored at the last observation time point. Source: CSR 1601T0831 Tables 14.2.1.6.13-4.
3.3.5 Virologic response3.3.5.1 VirusThe sponsor evaluated the proportion of subjects positive for virus at Study Days 2-9 (pre-defined study days; treatment was initiated on Day 1, baseline; Day 2 included analysis day 2; Day 3 included relative days 3 and 4; Day 4 [optional; most subjects were not sampled on Day 4] included relative day 4; Day 5 included relative days 5 and 6; Day 6 [optional] included relative days 6; and Day 9 included relative days 7-11) by virus type/subtype. Subjects who were positive at baseline for virus were included in the analysis. Samples that were not processed within 96 hours were excluded from the analysis.
Overall, the proportions of subjects who were influenza virus-positive at each time point were statistically significantly reduced in the baloxavir marboxil treatment arm compared to placebo at Days 2-5, and compared to oseltamivir at Days 2, 3 and 5 (CSR 1601T0831 Tables 14.2.1.7.1-2). This trend was consistent between subjects infected with subtypes A/H1N1 or A/H3N2 viruses, (although the numbers of subjects infected with A/H1N1 were too small to draw a strong conclusion); however, the impact of baloxavir marboxil treatment by this measure was clearly reduced in subjects infected with type B virus (Table 3.3.5.1.1). Overall, Kaplan-Meyer estimates of time to cessation of virus shedding were statistically significantly different in the ITTI set for
Reference ID: 4324543
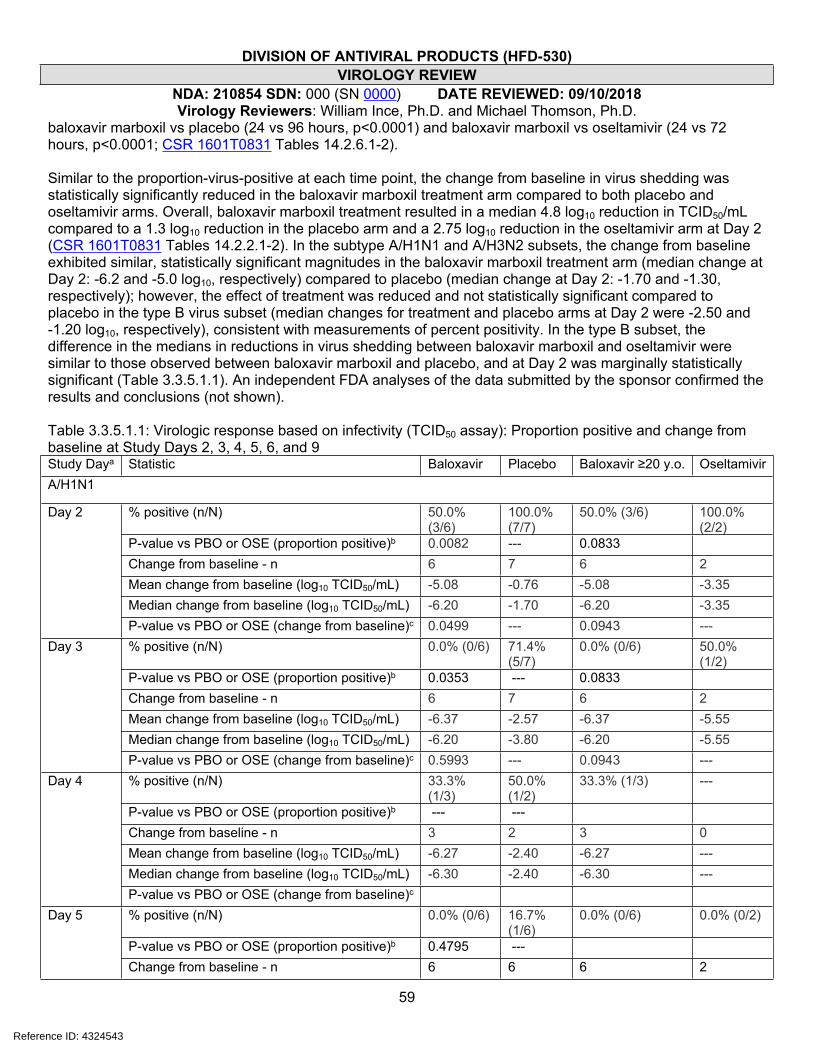
DIVISION OF ANTIVIRAL PRODUCTS (HFD-530)VIROLOGY REVIEW
NDA: 210854 SDN: 000 (SN 0000) DATE REVIEWED: 09/10/2018Virology Reviewers: William Ince, Ph.D. and Michael Thomson, Ph.D.
59
baloxavir marboxil vs placebo (24 vs 96 hours, p<0.0001) and baloxavir marboxil vs oseltamivir (24 vs 72 hours, p<0.0001; CSR 1601T0831 Tables 14.2.6.1-2).
Similar to the proportion-virus-positive at each time point, the change from baseline in virus shedding was statistically significantly reduced in the baloxavir marboxil treatment arm compared to both placebo and oseltamivir arms. Overall, baloxavir marboxil treatment resulted in a median 4.8 log10 reduction in TCID50/mL compared to a 1.3 log10 reduction in the placebo arm and a 2.75 log10 reduction in the oseltamivir arm at Day 2 (CSR 1601T0831 Tables 14.2.2.1-2). In the subtype A/H1N1 and A/H3N2 subsets, the change from baseline exhibited similar, statistically significant magnitudes in the baloxavir marboxil treatment arm (median change at Day 2: -6.2 and -5.0 log10, respectively) compared to placebo (median change at Day 2: -1.70 and -1.30, respectively); however, the effect of treatment was reduced and not statistically significant compared to placebo in the type B virus subset (median changes for treatment and placebo arms at Day 2 were -2.50 and -1.20 log10, respectively), consistent with measurements of percent positivity. In the type B subset, the difference in the medians in reductions in virus shedding between baloxavir marboxil and oseltamivir were similar to those observed between baloxavir marboxil and placebo, and at Day 2 was marginally statistically significant (Table 3.3.5.1.1). An independent FDA analyses of the data submitted by the sponsor confirmed the results and conclusions (not shown).
Table 3.3.5.1.1: Virologic response based on infectivity (TCID50 assay): Proportion positive and change from baseline at Study Days 2, 3, 4, 5, 6, and 9Study Daya Statistic Baloxavir Placebo Baloxavir ≥20 y.o. OseltamivirA/H1N1
% positive (n/N) 50.0% (3/6)
100.0% (7/7)
50.0% (3/6) 100.0% (2/2)
P-value vs PBO or OSE (proportion positive)b 0.0082 --- 0.0833Change from baseline - n 6 7 6 2Mean change from baseline (log10 TCID50/mL) -5.08 -0.76 -5.08 -3.35Median change from baseline (log10 TCID50/mL) -6.20 -1.70 -6.20 -3.35
Day 2
P-value vs PBO or OSE (change from baseline)c 0.0499 --- 0.0943 ---% positive (n/N) 0.0% (0/6) 71.4%
(5/7)0.0% (0/6) 50.0%
(1/2)P-value vs PBO or OSE (proportion positive)b 0.0353 --- 0.0833Change from baseline - n 6 7 6 2Mean change from baseline (log10 TCID50/mL) -6.37 -2.57 -6.37 -5.55Median change from baseline (log10 TCID50/mL) -6.20 -3.80 -6.20 -5.55
Day 3
P-value vs PBO or OSE (change from baseline)c 0.5993 --- 0.0943 ---% positive (n/N) 33.3%
(1/3)50.0% (1/2)
33.3% (1/3) ---
P-value vs PBO or OSE (proportion positive)b --- ---Change from baseline - n 3 2 3 0Mean change from baseline (log10 TCID50/mL) -6.27 -2.40 -6.27 ---Median change from baseline (log10 TCID50/mL) -6.30 -2.40 -6.30 ---
Day 4
P-value vs PBO or OSE (change from baseline)c
% positive (n/N) 0.0% (0/6) 16.7% (1/6)
0.0% (0/6) 0.0% (0/2)
P-value vs PBO or OSE (proportion positive)b 0.4795 ---
Day 5
Change from baseline - n 6 6 6 2
Reference ID: 4324543

DIVISION OF ANTIVIRAL PRODUCTS (HFD-530)VIROLOGY REVIEW
NDA: 210854 SDN: 000 (SN 0000) DATE REVIEWED: 09/10/2018Virology Reviewers: William Ince, Ph.D. and Michael Thomson, Ph.D.
60
Mean change from baseline (log10 TCID50/mL) -6.37 -3.12 -6.37 -6.05Median change from baseline (log10 TCID50/mL) -6.20 -3.30 -6.20 -6.05P-value vs PBO or OSE (change from baseline)c 0.3583 --- 0.0943 ---% positive (n/N) 0.0% (0/4) 50.0%
(1/2)0.0% (0/4) ---
P-value vs PBO or OSE (proportion positive)b --- ---Change from baseline - n 4 2 4 0Mean change from baseline (log10 TCID50/mL) -6.65 -6.30 -6.65 ---Median change from baseline (log10 TCID50/mL) -6.90 -6.30 -6.90 ---
Day 6
P-value vs PBO or OSE (change from baseline)c 0.2207 ---% positive (n/N) 0.0% (0/6) 14.3%
(1/7)0.0% (0/6) 0.0% (0/2)
P-value vs PBO or OSE (proportion positive)b --- ---Change from baseline - n 6 7 6 2Mean change from baseline -6.37 -4.60 -6.37 -6.05Median change from baseline -6.20 -3.80 -6.20 -6.05
Day 9
P-value vs PBO or OSE (change from baseline)c 0.5993 --- 0.0943 --- A/H3N2
% positive (n/N) 43.8% (161/368)
95.5% (168/176)
42.8% (128/299) 90.6% (279/308)
P-value vs PBO or OSE (proportion positive)b <0.0001 <0.0001Change from baseline - n 368 176 299 308
Mean change from baseline (log10 TCID50/mL) -4.64 -1.19 -4.60 -2.70Median change from baseline (log10 TCID50/mL) -5.00 -1.30 -4.90 -3.00
Day 2
P-value vs PBO or OSE (change from baseline)c <0.0001 --- <0.0001% positive (n/N) 17.6%
(63/357)69.0% (116/168)
15.4% (45/292) 54.8% (166/303)
P-value vs PBO or OSE (proportion positive)b <0.0001 <0.0001Change from baseline - n 357 168 292 303Mean change from baseline (log10 TCID50/mL) -4.92 -2.85 -4.89 -4.35Median change from baseline (log10 TCID50/mL) -5.30 -3.30 -5.30 -4.50
Day 3
P-value vs PBO or OSE (change from baseline)c <.0001 --- <.0001 ---% positive (n/N) 12.9%
(13/101)56.0% (28/50)
14.3% (11/77) 27.5% (25/91)
P-value vs PBO or OSE (proportion positive)b <0.0001 0.0633Change from baseline - n 101 50 77 91Mean change from baseline (log10 TCID50/mL) -4.59 -3.34 -4.50 -4.64Median change from baseline (log10 TCID50/mL) -5.00 -3.40 -4.80 -4.80
Day 4
P-value vs PBO or OSE (change from baseline)c 0.0002 --- 0.8079 ---% positive (n/N) 14.2%
(51/360)30.4% (52/171)
13.7% (40/293) 19.2% (57/297)
P-value vs PBO or OSE (proportion positive)b <0.0001 0.0686Change from baseline - n 360 171 293 297Mean change from baseline (log10 TCID50/mL) -4.95 -4.44 -4.92 -4.99Median change from baseline (log10 TCID50/mL) -5.30 -4.80 -5.30 -5.30
Day 5
P-value vs PBO or OSE (change from baseline)c 0.0106 --- 0.9904 ---
Reference ID: 4324543

DIVISION OF ANTIVIRAL PRODUCTS (HFD-530)VIROLOGY REVIEW
NDA: 210854 SDN: 000 (SN 0000) DATE REVIEWED: 09/10/2018Virology Reviewers: William Ince, Ph.D. and Michael Thomson, Ph.D.
61
% positive (n/N) 8.5% (7/82)
9.3% (4/43)
6.6% (4/61) 8.8% (6/68)
P-value vs PBO or OSE (proportion positive)b 0.8757 0.8486Change from baseline - n 82 43 61 68Mean change from baseline (log10 TCID50/mL) -4.60 -4.57 -4.42 -4.95Median change from baseline (log10 TCID50/mL) -5.00 -5.00 -4.80 -4.80
Day 6
P-value vs PBO or OSE (change from baseline)c 0.6915 --- 0.1001 ---% positive (n/N) 3.0%
(11/363)4.7% (8/172)
3.0% (9/297) 3.0% (9/302)
P-value vs PBO or OSE (proportion positive)b 0.3779 0.9644Change from baseline - n 363 172 297 302Mean change from baseline (log10 TCID50/mL) -5.06 -4.84 -5.01 -5.20Median change from baseline (log10 TCID50/mL) -5.30 -5.00 -5.30 -5.30
Day 9
P-value vs PBO or OSE (change from baseline)c 0.1154 0.4762 ---B
% positive (n/N) 81.8% (27/33)
100.0% (15/15)
86.2% (25/29) 93.5% (29/31)
P-value vs PBO or OSE (proportion positive)b 0.0565 0.197Change from baseline - n 33 15 29 31Mean change from baseline (log10 TCID50/mL) -2.42 -0.93 -2.42 -1.25Median change from baseline (log10 TCID50/mL) -2.50 -1.20 -2.00 -1.20
Day 2
P-value vs PBO or OSE (change from baseline)c 0.0856 --- 0.0152 ---% positive (n/N) 57.1%
(20/35)80.0% (12/15)
60.0% (18/30) 75.0% (24/32)
P-value vs PBO or OSE (proportion positive)b 0.1013 0.0903Change from baseline - n 35 15 30 32Mean change from baseline (log10 TCID50/mL) -3.72 -3.01 -3.71 -2.87Median change from baseline (log10 TCID50/mL) -3.60 -2.70 -3.70 -3.10
Day 3
P-value vs PBO or OSE (change from baseline)c 0.2829 --- 0.1016 ---% positive (n/N) 55.6%
(5/9)60.0% (3/5)
33.3% (2/6) 28.6% (4/14)
P-value vs PBO or OSE (proportion positive)b 0.7568 0.9196Change from baseline - n 9 5 6 14Mean change from baseline (log10 TCID50/mL) -2.84 -3.40 -2.83 -4.56Median change from baseline (log10 TCID50/mL) -3.00 -5.00 -2.80 -5.15
Day 4
P-value vs PBO or OSE (change from baseline)c 0.1349 --- 0.0426 ---% positive (n/N) 3.1%
(1/32)25.0% (3/12)
3.7% (1/27) 30.0% (9/30)
P-value vs PBO or OSE (proportion positive)b 0.0712 0.011Change from baseline - n 32 12 27 30Mean change from baseline (log10 TCID50/mL) -4.75 -4.97 -4.88 -4.78Median change from baseline (log10 TCID50/mL) -5.40 -5.25 -5.50 -5.75
Day 5
P-value vs PBO or OSE (change from baseline)c 0.5956 --- 0.8419 ---% positive (n/N) 0.0% (0/7) 33.3%
(1/3)0.0% (0/3) 10.0%
(1/10)Day 6
P-value vs PBO or OSE (proportion positive)b 0.0253 0.6171
Reference ID: 4324543

DIVISION OF ANTIVIRAL PRODUCTS (HFD-530)VIROLOGY REVIEW
NDA: 210854 SDN: 000 (SN 0000) DATE REVIEWED: 09/10/2018Virology Reviewers: William Ince, Ph.D. and Michael Thomson, Ph.D.
62
Change from baseline - n 7 3 3 10Mean change from baseline (log10 TCID50/mL) -3.03 -5.20 -2.77 -4.16Median change from baseline (log10 TCID50/mL) -3.00 -5.80 -3.00 -5.55P-value vs PBO or OSE (change from baseline)c 0.0319 --- 0.6643 ---% positive (n/N) 0.0%
(0/31)0.0% (0/15)
0.0% (0/26) 3.4% (1/29)
P-value vs PBO or OSE (proportion positive)b 0.3173 0.3173Change from baseline - n 31 15 26 29Mean change from baseline (log10 TCID50/mL) -4.76 -4.97 -4.90 -5.32Median change from baseline (log10 TCID50/mL) -5.50 -5.30 -5.50 -6.10
Day 9
P-value vs PBO or OSE (change from baseline)c 0.8853 0.5087 ---a. Treatment was initiated on Day 1.b. Positive was defined as a ≥0.07 log10 TCID50/mL (target detected). LLOQ: 0.07 log10 TCID50/mL. Change from baseline is reported as
the log10 change in TCID50/mL. Undetectable virus was imputed as the LLOQ. Analysis population included only subjects who were positive for influenza virus titer at baseline. Samples not processed within 96 hours were excluded from the analysis.
c. Mantel-Haenszel test vs adjacent placebo (PBO) or oseltamivir (OSE). Stratified factors: Composite symptom scores at baseline and region.
d. van Elteren test vs adjacent placebo (PBO) or oseltamivir (OSE). Covariates: Composite symptom scores at baseline and region. Source: CSR 1601T0831; proportion virus-positive: Tables 14.2.1.7.3-8; change from baseline in virus: Tables 14.2.2.3-8.
An independent analysis (FDA analysis) of the impact of treatment on virus shedding comparing subjects enrolled in the US to those enrolled in Japan was carried out. Median baseline titers were 0.1-1.1 log10 TCID50/mL higher in subjects enrolled at sites in Japan compared to those enrolled at US sites; differences were statistically significant for subtype A/H3N2 and type B viruses, but not for A/H1N1 viruses (Table 3.3.5.1.2). Subjects enrolled in Japan experienced greater reductions in virus titer on analysis days 2 and 3 post treatment initiation for subtype A/H3N2 and type B (too few subjects were infected with A/H1N1 to draw a meaningful conclusion) (Table 3.3.5.1.3). The greater magnitude in virus reductions may be related to having higher baseline virus titers, as the percentage of subjects who were virus positive overall was higher on analysis days 2 and 3 for subjects enrolled in Japan compared to those enrolled in the USA (48.9% [159/325] and 40.8% [40/98] on analysis day 2, respectively; and 22.8% [52/228] and 19.5% [18/92] on analysis day 3, respectively).
Table 3.3.5.1.2 (FDA analysis): Baseline virus titer in subjects enrolled at US and Japanese sites.A/H1N1 A/H3N2 B
Summary statistica Japan USA Japan USA Japan USA
Mean log10 TCID50/mL 6.5 6.1 5.9 5.1 6.5 5.2
Median log10 TCID50/mL 6.6 6.8 6.2 5.5 6.8 5.7
SD 1.5 1.9 1.7 2.0 1.3 2.2
N 4.0 11.0 749.0 155.0 37.0 46.0P value Japan vs USA (Mann-Whitney) 0.6901 <0.0001 0.0079
a. All subjects virus-positive at baseline were included in the analysis. No other censoring was applied.
Reference ID: 4324543

DIVISION OF ANTIVIRAL PRODUCTS (HFD-530)VIROLOGY REVIEW
NDA: 210854 SDN: 000 (SN 0000) DATE REVIEWED: 09/10/2018Virology Reviewers: William Ince, Ph.D. and Michael Thomson, Ph.D.
63
Table 3.3.5.1.3 (FDA analysis): Change from baseline in virus titer in subjects enrolled at US and Japanese sites.
A/H1N1 A/H3N2 B
Japan USA Japan USA Japan USA
Summary statistica Pla
cebo
Bal
oxav
ir
Pla
cebo
Bal
oxav
ir
Pla
cebo
Bal
oxav
ir
Pla
cebo
Bal
oxav
ir
Pla
cebo
Bal
oxav
ir
Pla
cebo
Bal
oxav
ir
Mean log10 TCID50/mL 0.2 -3.0 -1.1 -6.2 -1.0 -4.8 -1.7 -4.1 -0.2 -3.2 -1.6 -1.7Median log10 TCID50/mL 0.2 -3.0 -1.7 -6.2 -1.0 -5.0 -2.0 -4.3 0.3 -3.5 -1.6 -1.6
SD 3.0 5.0 1.3 0.7 2.5 1.8 2.5 2.1 2.0 1.8 2.3 1.9
n 2 2 5 4 155 306 32 77 7 17 8 17
Day 2P value Japan vs USA (Mann-Whitney U) 0.8 0.0067 0.0242
Mean log10 TCID50/mL -1.2 -6.5 -3.1 -6.3 -2.2 -5.1 -2.7 -4.3 -3.1 -4.4 -2.2 -2.3Median log10 TCID50/mL -1.2 -6.5 -3.8 -6.2 -2.5 -5.3 -3.2 -4.7 -2.6 -4.4 -2.3 -2.6
SD 6.4 1.4 3.9 0.9 2.7 1.8 2.7 2.1 1.1 1.1 4.0 2.2
n 2 2 5 4 107 215 32 72 3 11 8 16
Day 3P value Japan vs USA (Mann-Whitney)
0.9333 0.0054 0.0049
a. All subjects virus-positive at baseline were included in the analysis. No other censoring was applied.
As noted above, the proportion-virus-positive should be interpreted with caution based on an analysis of the impact of baloxavir present in nasal swab specimens on the sensitivity of the TCID50 assay, which may be reduced for subjects treated with baloxavir marboxil (APPENDIX K). The separation between baloxavir marboxil-treated subjects and placebo-treated subjects in the proportion-virus positive may be exaggerated as a result, as samples with low viral titers may be most susceptible to the impact of drug carryover with regard to being determined positive or negative for virus (APPENDIX K).
3.3.5.2 Viral RNAOverall, the proportion of subjects positive for viral RNA was only marginally reduced in the baloxavir marboxil treatment arm compared to placebo, and the difference was only statistically significant at later time points, compared to both oseltamivir (Study Day 5) and placebo (study Days 5 and 9) arms. By Day 9, 61.5% (268/436) of subjects in the baloxavir marboxil arm were still positive for viral RNA, compared to 64.7% (233/360) and 72.4% (157/217) in the oseltamivir and placebo arms, respectively (CSR 1601T0831 Tables 14.2.1.8.1-2). Trends were similar in virus type/subtype subset analyses, where there were statistically significant reductions in the proportion of viral RNA-positive subjects compared to placebo in the A/H3N2 subset (there were too few subjects in the A/H1N1 subset to draw a meaningful conclusion); however, the impact of baloxavir marboxil treatment on the proportion of viral RNA-positive subjects was not apparent for type B virus infections (Table 3.3.5.2).
Likewise, baloxavir marboxil treatment was not associated with as rapid a decline in viral RNA as it was with virus; in the baloxavir marboxil arm, viral RNA shedding at Day 2 was reduced by a median of 1.7 log10 copies/mL compared to 0.74 log10 for placebo, and 1.13 log10 for oseltamivir, although both differences were statistically significant at Days 2, 3, and 5 vs placebo (CSR 1601T0831Tables 14.2.3.1-2). Similar results were observed in the virus type/subtype subset analyses. Median changes from baseline at Day 2 in the baloxavir marboxil, oseltamivir, and placebo arms were, -2.00, -1.62, and -0.64 log10 copies/mL for the A/H1N1 virus subset, respectively; -1.74, -1.18, and -0.77 log10 copies/mL for the A/H3N2 virus subset, respectively; and -0.91, -0.68, and -0.37 log10 copies/mL for the type B virus subset, respectively. An independent FDA analyses
Reference ID: 4324543

DIVISION OF ANTIVIRAL PRODUCTS (HFD-530)VIROLOGY REVIEW
NDA: 210854 SDN: 000 (SN 0000) DATE REVIEWED: 09/10/2018Virology Reviewers: William Ince, Ph.D. and Michael Thomson, Ph.D.
64
of the data submitted by the sponsor confirmed the results and conclusions (not shown).
Table 3.3.5.2: Virologic response based on viral RNA (quantitative RT-PCR assay): Change from baseline at Study Days 2, 3, 4, 5, 6, and 9. Study Daya Statistic Baloxavir Placebo Baloxavir ≥ 20
y.o.Oseltamivir
A/H1N1% positive (n/N) 100.0%
(7/7)100.0% (7/7)
100.0% (7/7) 100.0% (2/2)
P-value vs PBO or OSE (proportion positive)b --- --- --- ---
Change from baseline - n 7 7 7 2
Mean change from baseline (log10 copies/mL) -1.83 -0.28 -1.83 -1.62
Median change from baseline (log10 copies/mL) -2.00 -0.64 -2.00 -1.62
Day 2
P-value vs PBO or OSE (change from baseline)c
0.1887 --- 0.2482 ---
% positive (n/N) 100.0% (7/7)
85.7% (6/7)
100.0% (7/7) 100.0% (2/2)
P-value vs PBO or OSE (proportion positive)b 0.3711 --- --- ---
Change from baseline - n 7 7 7 2
Mean change from baseline (log10 copies/mL) -2.89 -1.61 -2.89 -2.51
Median change from baseline (log10 copies/mL) -2.89 -2.56 -2.89 -2.51
Day 3
P-value vs PBO or OSE (change from baseline)c
0.8266 --- 0.2482 ---
% positive (n/N) 100.0% (3/3)
100.0% (2/2)
100.0% (3/3) ---
P-value vs PBO or OSE (proportion positive)b --- --- --- ---
Change from baseline - n 3 2 3 0Mean change from baseline (log10 copies/mL) -3.66 -0.71 -3.66 ---Median change from baseline (log10 copies/mL) -3.78 -0.71 -3.78 ---
Day 4
P-value vs PBO or OSE (change from baseline)c
--- --- --- ---
% positive (n/N) 85.7% (6/7)
83.3% (5/6)
85.7% (6/7) 0.0% (0/2)
P-value vs PBO or OSE (proportion positive)b 1 --- 1.0000 ---Change from baseline - n 7 6 7 2Mean change from baseline (log10 copies/mL) -3.98 -2.04 -3.98 -4.27Median change from baseline (log10 copies/mL) -4.25 -2.61 -4.25 -4.27
Day 5
P-value vs PBO or OSE (change from baseline)c
0.1109 --- 1.0000 ---
% positive (n/N) 75.0% (3/4)
100.0% (2/2)
75.0% (3/4) ---
P-value vs PBO or OSE (proportion positive)b --- --- --- ---
Day 6
Change from baseline - n 4 2 4 0
Reference ID: 4324543

DIVISION OF ANTIVIRAL PRODUCTS (HFD-530)VIROLOGY REVIEW
NDA: 210854 SDN: 000 (SN 0000) DATE REVIEWED: 09/10/2018Virology Reviewers: William Ince, Ph.D. and Michael Thomson, Ph.D.
65
Mean change from baseline (log10 copies/mL) -4.60 -3.20 -4.60 ---Median change from baseline (log10 copies/mL) -4.58 -3.20 -4.58 ---P-value vs PBO or OSE (change from baseline)c
0.2207 --- --- ---
% positive (n/N) 28.6% (2/7)
42.9% (3/7)
28.6% (2/7) 0.0% (0/2)
P-value vs PBO or OSE (proportion positive)b 1 --- 0.6171 ---Change from baseline - n 7 7 7 2Mean change from baseline (log10 copies/mL) -3.81 -3.31 -3.81 -4.27Median change from baseline (log10 copies/mL) -4.60 -3.77 -4.60 -4.27
Day 9
P-value vs PBO or OSE (change from baseline)c
0.8266 --- 0.2482 ---
A/H3N2
% positive (n/N) 99.0% (380/384)
99.5% (186/187)
99.0% (309/312)
99.4% (317/319)
P-value vs PBO or OSE (proportion positive)b 0.5118 --- 0.6964 ---
Change from baseline - n 374 180 305 314
Mean change from baseline (log10 copies/mL) -1.74 -0.60 -1.73 -1.16
Median change from baseline (log10 copies/mL) -1.74 -0.77 -1.72 -1.18
Day 2
P-value vs PBO or OSE (change from baseline)c
<0.0001 --- <0.0001 ---
% positive (n/N) 97.6% (365/374)
100.0% (179/179)
97.4% (298/306)
98.4% (313/318)
P-value vs PBO or OSE (proportion positive)b 0.0299 --- 0.4381 ---
Change from baseline - n 364 172 298 310
Mean change from baseline (log10 copies/mL) -2.96 -1.70 -2.95 -2.57
Median change from baseline (log10 copies/mL) -2.99 -1.96 -3.01 -2.68
Day 3
P-value vs PBO or OSE (change from baseline)c
<0.0001 --- <0.0001 ---
% positive (n/N) 94.2% (98/104)
96.2% (51/53)
95.0% (76/80)
96.9% (95/98)
P-value vs PBO or OSE (proportion positive)b 0.7543 --- 0.8145 ---Change from baseline - n 102 53 78 95Mean change from baseline (log10 copies/mL) -3.32 -2.27 -3.17 -3.07Median change from baseline (log10 copies/mL) -3.53 -2.63 -3.25 -3.36
Day 4
P-value vs PBO or OSE (change from baseline)c
<.0001 --- 0.2812 ---
% positive (n/N) 88.9% (336/378)
94.5% (173/183)
88.3% (272/308)
92.3% (287/311)
P-value vs PBO or OSE (proportion positive)b 0.0395 --- 0.1415 ---Change from baseline - n 367 176 299 303
Day 5
Mean change from baseline (log10 copies/mL) -3.91 -3.16 -3.90 -3.73
Reference ID: 4324543

DIVISION OF ANTIVIRAL PRODUCTS (HFD-530)VIROLOGY REVIEW
NDA: 210854 SDN: 000 (SN 0000) DATE REVIEWED: 09/10/2018Virology Reviewers: William Ince, Ph.D. and Michael Thomson, Ph.D.
66
Median change from baseline (log10 copies/mL) -4.15 -3.39 -4.16 -3.94P-value vs PBO or OSE (change from baseline)c
<0.0001 --- 0.0363 ---
% positive (n/N) 75.0% (63/84)
86.7% (39/45)
69.8% (44/63)
84.5% (60/71)
P-value vs PBO or OSE (proportion positive)b 0.1087 --- 0.0529 ---Change from baseline - n 82 45 61 69Mean change from baseline (log10 copies/mL) -4.14 -3.41 -4.01 -4.05Median change from baseline (log10 copies/mL) -4.46 -3.82 -4.29 -4.29
Day 6
P-value vs PBO or OSE (change from baseline)c
0.0020 --- 0.8229 ---
% positive (n/N) 63.4% (241/380)
76.5% (140/183)
61.7% (192/311)
66.7% (212/318)
P-value vs PBO or OSE (proportion positive)b 0.002 --- 0.2208 ---Change from baseline - n 371 176 304 309Mean change from baseline (log10 copies/mL) -4.60 -4.25 -4.58 -4.62Median change from baseline (log10 copies/mL) -4.86 -4.50 -4.86 -4.82
Day 9
P-value vs PBO or OSE (change from baseline)c
0.0005 0.6137 ---
B% positive (n/N) 97.1%
(34/35)90.0% (18/20)
96.8% (30/31)
90.9% (30/33)
P-value vs PBO or OSE (proportion positive)b 0.263 --- 0.314 ---
Change from baseline - n 34 18 30 32
Mean change from baseline (log10 copies/mL) -0.91 -0.50 -0.86 -0.89
Median change from baseline (log10 copies/mL) -0.91 -0.37 -0.87 -0.68
Day 2
P-value vs PBO or OSE (change from baseline)c
0.3764 --- 0.8647 ---
% positive (n/N) 94.6% (35/37)
90.0% (18/20)
93.8% (30/32)
88.2% (30/34)
P-value vs PBO or OSE (proportion positive)b 0.5058 --- 0.4655 ---
Change from baseline - n 35 18 30 34
Mean change from baseline (log10 copies/mL) -2.17 -1.36 -2.07 -1.61
Median change from baseline (log10 copies/mL) -2.30 -1.88 -2.14 -1.61
Day 3
P-value vs PBO or OSE (change from baseline)c
0.2452 --- 0.1417 ---
% positive (n/N) 100.0% (9/9)
85.7% (6/7)
100.0% (6/6)
68.8% (11/16)
P-value vs PBO or OSE (proportion positive)b 0.2636 --- 0.1077 ---Change from baseline - n 9 6 6 16Mean change from baseline (log10 copies/mL) -1.85 -1.45 -1.89 -2.67Median change from baseline (log10 copies/mL) -2.39 -1.97 -2.47 -2.86
Day 4
P-value vs PBO or OSE (change from baseline)c
0.5346 --- 0.9201 ---
Reference ID: 4324543

DIVISION OF ANTIVIRAL PRODUCTS (HFD-530)VIROLOGY REVIEW
NDA: 210854 SDN: 000 (SN 0000) DATE REVIEWED: 09/10/2018Virology Reviewers: William Ince, Ph.D. and Michael Thomson, Ph.D.
67
% positive (n/N) 85.3% (29/34)
93.8% (15/16)
82.8% (24/29)
93.8% (30/32)
P-value vs PBO or OSE (proportion positive)b 0.4547 --- 0.1591 ---Change from baseline - n 33 14 28 32Mean change from baseline (log10 copies/mL) -3.32 -2.96 -3.51 -2.88Median change from baseline (log10 copies/mL) -3.42 -3.06 -3.69 -3.41
Day 5
P-value vs PBO or OSE (change from baseline)c
0.5014 --- 0.1357 ---
% positive (n/N) 85.7% (6/7)
33.3% (2/6)
66.7% (2/3) 54.5% (6/11)
P-value vs PBO or OSE (proportion positive)b 0.0713 --- 0.8918 ---
Change from baseline - n 7 5 3 11Mean change from baseline (log10 copies/mL) -2.58 -2.37 -1.44 -3.17Median change from baseline (log10 copies/mL) -2.80 -2.03 -2.22 -4.01
Day 6
P-value vs PBO or OSE (change from baseline)c
0.6770 --- 0.2008 ---
% positive (n/N) 51.6% (16/31)
52.6% (10/19)
57.7% (15/26)
48.4% (15/31)
P-value vs PBO or OSE (proportion positive)b 0.5228 --- 0.7825 ---Change from baseline - n 30 17 25 31Mean change from baseline (log10 copies/mL) -4.19 -3.46 -4.36 -3.97Median change from baseline (log10 copies/mL) -4.27 -3.92 -4.36 -4.35
Day 9
P-value vs PBO or OSE (change from baseline)c
0.1552 --- 0.7577 ---
a. Treatment was initiated on Day 1. b. Positive was defined as ≥LOD, target detected. Change from baseline values are reported as log10 copies/mL. Analysis population
included only subjects who were positive for influenza virus RNA at baseline. Detected viral RNA below the LLOQ was imputed as the LLOQ: 2.18 and 2.93 log10 copies/mL, for type A and type B viruses respectively, for determination of the change from baseline. Undetected viral RNA was imputed as the LOD: 2.05 and 2.83 log10 copies/mL, for type A and type B viruses respectively.
c. Mantel-Haenszel test vs adjacent placebo (PBO) or oseltamivir (OSE). Stratified factors: Composite symptom scores at baseline and region.
d. van Elteren test vs adjacent placebo (PBO) or oseltamivir (OSE). Covariates: Composite symptom scores at baseline and region.Source: CSR 1601T0831; proportion viral-RNA-positive: Tables 14.2.1.8.3-8 (included subjects with missing quantitative data but who
had detectable RNA for specific time points); change from baseline in virus: Tables 14.2.3.3-8 (includes subjects with baseline data meeting the criteria for analysis, including positive samples processed within 96 hours).
3.3.6 Exploratory studies summariesChange in anti-influenza antibody titerThe sponsor evaluated anti-influenza antibody titer and the ratio of the value on Day 22 to that on Day 1 in the baloxavir marboxil, oseltamivir, and placebo arms using a focus-reduction neutralization assay (Terletskaia-Ladwig et al., 2013; CSR 1601T0831 Tables 14.2.18.1-6 and 14.2.19.1-6) against the infecting virus type/subtype. The Day 22/Day 1 ratios of anti-influenza virus antibody titer (against a strain of the indicated virus type for subjects infected with the same virus type) ranged from 2.0 to 9.2 for subtype A/H1N1, 3.2 to 4.0 for subtype A/H3N2, 3.6 to 4.3 for type B/Yamagata, and 2.5 to 3.4 for type B/Victoria (type B virus lineage data were not collected in this study). Differences were not statistically significant between the ratios of influenza antibody titers in the baloxavir marboxil group and the placebo group or the 12-19 years and 20-64 years age strata.
Intra-household transmission study
Reference ID: 4324543
DIVISION OF ANTIVIRAL PRODUCTS (HFD-530)VIROLOGY REVIEW
NDA: 210854 SDN: 000 (SN 0000) DATE REVIEWED: 09/10/2018Virology Reviewers: William Ince, Ph.D. and Michael Thomson, Ph.D.
68
Enrolled subjects were interviewed (Japan only) on Days 1 to 15 about the number of household members possibly infected with influenza virus, and the diagnosis date (if any) was recorded. A Poisson regression model was used to evaluate the differences in rates of diagnosed household influenza “infection” between arms (it was not clear from the information provided in the CSR if diagnosis required a positive molecular/ culture test, although RIDTs are commonly used in Japan) (CSR 1601T0831 Tables 14.2.25.1-14.2.25.8, p. 2674). The intra-household infection rate between Days 1 and 3 (the period of greatest separation between groups) was numerically lower in the baloxavir marboxil group compared to the oseltamivir and placebo groups (3.9% [overall; n=268] vs 5.2% [≥20 years; n=209] and 6.8% [n=134], respectively), although the difference was not statistically significant. Over the 15-day evaluation period, the rates in the baloxavir marboxil, oseltamivir, and placebo groups were 9.0% (overall), 8.5%, (≥20 years), and 9.3%, respectively.
Among subjects infected with subtype A/H3N2 virus, a statistically significant difference was found between the baloxavir marboxil arm and the placebo arm (Days 1-3; 4% vs 7.3%, P = 0.0440). For subjects infected with type B virus, the intra-household infection rate was numerically lower in the baloxavir marboxil arm compared to the placebo arm (5.3% vs 6.3%), but not statistically significantly lower. Together, these results indicate that baloxavir marboxil treatment may have reduced or delayed intra-household transmission in study 1601T0831. It was not stated if samples were collected that would allow verification that the infection was acquired from identified index case (enrolled subject) or an evaluation of transmission of baloxavir marboxil-resistant virus.
Conclusions: While baloxavir marboxil had a statistically significant impact overall on TTAS (compared to placebo only) and virus and viral RNA shedding (compared to both placebo and oseltamivir), the effect of baloxavir marboxil treatment on virologic endpoints was diminished in subjects infected with influenza type B virus compared to responses in subjects infected with type A virus in trial 1601T0831, consistent with results from phase 2 trial 1518T0821. In addition, baloxavir marboxil had no effect on time to alleviation of symptoms (primary endpoint) in the type B virus subset, with TTAS trending longer in the baloxavir marboxil arm compared to placebo, and thus an indication for type B virus infections is not adequately supported by the data submitted in this original NDA.
3.4 Supportive clinical studies3.4.1 Study 1601T0822 overview (Japan)Study 1601T0822 was an open-label study to assess the safety, tolerability, pharmacokinetics, and efficacy of baloxavir marboxil after administration of a single dose to otherwise healthy pediatric subjects aged 6 months to <12 years with influenza virus infections, and was submitted to the NDA to provide additional safety information and additional treatment-emergent resistance information, but otherwise does not provide efficacy information (summarized below) pertinent to the indication sought (treatment of patients ≥12 years of age). An independent analysis of study 1601T0822 will be carried out in the context of additional study data submitted to support a supplemental NDA for expansion of the indication to pediatric subjects.
Protocol summary:Objectives:
To assess the PK of baloxavir marboxil after single dose administration and confirm appropriateness of the dose in pediatric subjects aged 6 months to <12 years.
To assess the safety and tolerability of a single dose of baloxavir marboxil in pediatric subjects aged 6 months to <12 years.
To assess the efficacy of single dose of baloxavir marboxil in pediatric subjects aged 6 months to <12 years
Key virology-relevant endpoints:Primary
Time to alleviation of influenza symptomsSecondary
Reference ID: 4324543
DIVISION OF ANTIVIRAL PRODUCTS (HFD-530)VIROLOGY REVIEW
NDA: 210854 SDN: 000 (SN 0000) DATE REVIEWED: 09/10/2018Virology Reviewers: William Ince, Ph.D. and Michael Thomson, Ph.D.
69
Change from baseline in the amount of virus and viral RNA shedding Virus and viral RNA shedding status (positive or negative) at each time point Time to <LOD for virus and viral RNA shedding
Key inclusion criteria: Patients with a diagnosis of influenza virus infection confirmed by all of the following:
o Fever ≥ 38ºC (axillary temperature) at the screening visito In patients aged 7 years or older; at least one of respiratory symptoms (cough and nasal
discharge/nasal congestion) associated with influenza virus infection are present with a severity of moderate or greater.
o Positive rapid influenza diagnostic test (RIDT) with nasal or throat swabs. The time interval between the onset of symptoms and screening is 48 hours or less. The onset of
symptoms is defined as the time when body temperature first exceeded 37.5ºC.
Key exclusion criteria: Severe influenza disease requiring inpatient treatment. Co-morbidities or risk factors
3.4.1.1 Study design and assessmentsWeight-based dosing up to 40 mg (>40 kg) was administered starting with cohort 1, ages 2 to <12 years and continuing down to 6 months of age in cohort 2 after assessments of safety and PK. Virologic samples (nasal or throat swabs) were gathered on days 1, 2, 3, 4, 6, 9, 15 and 22/EOT. Central virologic testing was carried out at The LLOQ/LOD for the infectivity (virus) assay was 0.7 log10 TCID50/mL (CF-120-N), and the LLOQ and LOD for the quantitative RT-PCR assay were 2.18 and 2.05 log10 copies/mL, respectively, for type A virus, and 2.93 and 2.83 log10 copies/mL, respectively, for type B virus (RPT-VAL-INFA/8-FAST-FNL).
3.4.1.2 Baseline demographicsThe study enrolled subjects between November 2016 and April 2017. A total of 104 subjects were included in the ITTI set. The median age was 8 years (range = 1-11 years), and 49% of subjects were female. The proportions of subjects infected with influenza virus types/subtypes A/H1N1, A/H3N2 and B were 1.9% (n=2), 83.7% (n=87), and 7.7% (n=8), respectively (Table 3.4.3.1).
Table 3.4.3.1: Baseline characteristics (ITTI)Metrica baloxavir marboxil
n 104Age (years)Median (range) 8 (1 – 11)
% (n)<6 24.0 (25)6 to <9 34.6 (36)
Age ranges (years)
9 to <12 41.3 (43)
Male 51 (53)Sex
Female 49 (51)
0 to ≤12 45.2 (47)
12< to ≤24 39.4 (41)
Duration of influenza symptoms at the time of dosing
24< to ≤36 13.5 (14)
Reference ID: 4324543
(b) (4)
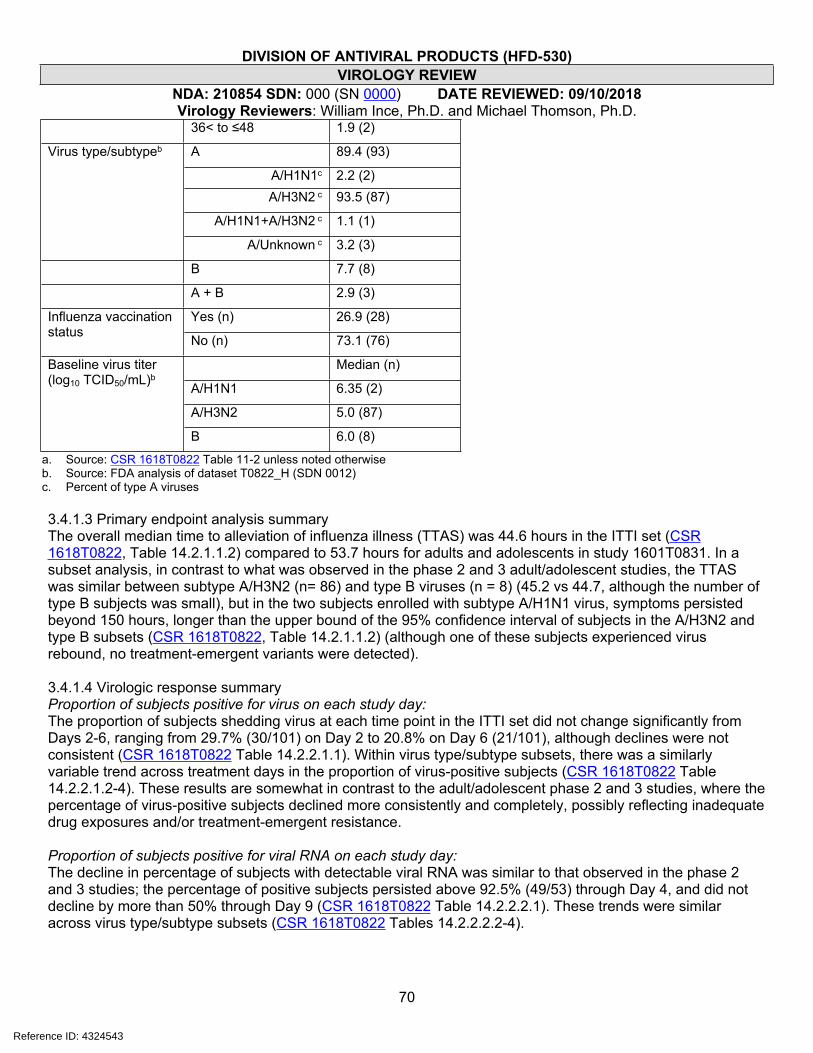
DIVISION OF ANTIVIRAL PRODUCTS (HFD-530)VIROLOGY REVIEW
NDA: 210854 SDN: 000 (SN 0000) DATE REVIEWED: 09/10/2018Virology Reviewers: William Ince, Ph.D. and Michael Thomson, Ph.D.
70
36< to ≤48 1.9 (2)
A 89.4 (93)
A/H1N1c 2.2 (2)A/H3N2 c 93.5 (87)
A/H1N1+A/H3N2 c 1.1 (1)
Virus type/subtypeb
A/Unknown c 3.2 (3)
B 7.7 (8)
A + B 2.9 (3)
Yes (n) 26.9 (28)Influenza vaccination status No (n) 73.1 (76)
Median (n)
A/H1N1 6.35 (2)
A/H3N2 5.0 (87)
Baseline virus titer (log10 TCID50/mL)b
B 6.0 (8)
a. Source: CSR 1618T0822 Table 11-2 unless noted otherwiseb. Source: FDA analysis of dataset T0822_H (SDN 0012)c. Percent of type A viruses
3.4.1.3 Primary endpoint analysis summaryThe overall median time to alleviation of influenza illness (TTAS) was 44.6 hours in the ITTI set (CSR 1618T0822, Table 14.2.1.1.2) compared to 53.7 hours for adults and adolescents in study 1601T0831. In a subset analysis, in contrast to what was observed in the phase 2 and 3 adult/adolescent studies, the TTAS was similar between subtype A/H3N2 (n= 86) and type B viruses (n = 8) (45.2 vs 44.7, although the number of type B subjects was small), but in the two subjects enrolled with subtype A/H1N1 virus, symptoms persisted beyond 150 hours, longer than the upper bound of the 95% confidence interval of subjects in the A/H3N2 and type B subsets (CSR 1618T0822, Table 14.2.1.1.2) (although one of these subjects experienced virus rebound, no treatment-emergent variants were detected).
3.4.1.4 Virologic response summaryProportion of subjects positive for virus on each study day:The proportion of subjects shedding virus at each time point in the ITTI set did not change significantly from Days 2-6, ranging from 29.7% (30/101) on Day 2 to 20.8% on Day 6 (21/101), although declines were not consistent (CSR 1618T0822 Table 14.2.2.1.1). Within virus type/subtype subsets, there was a similarly variable trend across treatment days in the proportion of virus-positive subjects (CSR 1618T0822 Table 14.2.2.1.2-4). These results are somewhat in contrast to the adult/adolescent phase 2 and 3 studies, where the percentage of virus-positive subjects declined more consistently and completely, possibly reflecting inadequate drug exposures and/or treatment-emergent resistance.
Proportion of subjects positive for viral RNA on each study day:The decline in percentage of subjects with detectable viral RNA was similar to that observed in the phase 2 and 3 studies; the percentage of positive subjects persisted above 92.5% (49/53) through Day 4, and did not decline by more than 50% through Day 9 (CSR 1618T0822 Table 14.2.2.2.1). These trends were similar across virus type/subtype subsets (CSR 1618T0822 Tables 14.2.2.2.2-4).
Reference ID: 4324543

DIVISION OF ANTIVIRAL PRODUCTS (HFD-530)VIROLOGY REVIEW
NDA: 210854 SDN: 000 (SN 0000) DATE REVIEWED: 09/10/2018Virology Reviewers: William Ince, Ph.D. and Michael Thomson, Ph.D.
71
Change from baseline in virus shedding:Overall, virus shedding was reduced by a median of ≥4 log10 TCID50/mL by Day 2 and thereafter (CSR 1618T0822 Table 14.2.2.3.1), consistent with the impact of baloxavir marboxil treatment observed in the phase 2 and 3 studies. This trend was similar for subtype A/H1N1 (n=2) and subtype A/H3N2 (n=87) viruses (CSR 1618T0822 Tables 14.2.2.3.2 and 14.2.2.2.3); however, as was observed in the adult/adolescent phase 2 and 3 studies, subjects infected with type B virus (n=8) had a diminished response to treatment in study 1618T0822 as measured by change from baseline in virus shedding, with the median decline in virus shedding not exceeding 2.35 log10 TCID50/mL on Day 2 or Day 3 (CSR 1618T0822 Table 14.2.2.3.4).
Change from baseline in viral RNA shedding:In the ITTI set, viral RNA shedding was reduced by a median of 1.98 log10 copies/mL by Day 2, with a sustained decline thereafter through Day 9. The decline was similar in the magnitude and rate, as observed overall in the phase 3 study 1601T0831 in baloxavir marboxil-treated subjects, and trends were similar across influenza type A subtypes (CSR 1618T0822 Tables 14.2.2.4.2 [A/H1N1] and 14.2.2.4.3 [A/H3N2]); however, similar to what was observed in adult/adolescent phase 2 and 3 studies, the decline in viral RNA shedding was more limited in the type B virus subset, with a median drop in viral RNA of 0.64 log10 copies/mL at Day 2 and 0.57 log10 copies/mL at Day 3 (CSR 1618T0822 Table 14.2.2.4.4).
Anti-influenza virus antibody titer:The sponsor evaluated anti-influenza antibody titer at Day 1 and Day 15. In subtype A/H1N1, subtype A/H3N2, and type B virus subsets, 100% (n=2), 84% (n=87), and 50% (n=8) of subjects had a >4-fold increase in anti-influenza virus antibody titer (CSR 1618T0822 Tables 14.2.9.1.1-3).
3.4.2 Trial 1601T0832 (T0832; NCT02949011) overview (submitted as part of the 120-Day Safety Update)Trial T0832 was a phase 3, randomized, double-blind study of baloxavir marboxil compared with placebo or oseltamivir 75 mg twice daily (BID) for 5 days in adult and adolescent patients with influenza at high risk of influenza complications. Patients were randomized in a 1:1:1 ratio to receive:
- baloxavir marboxil (patients weighing <80 kg were administered 40 mg and patients weighing ≥80 kg were administered 80 mg) as a single oral dose plus oseltamivir placebo;
- oseltamivir (75 mg BID over 5 days plus baloxavir marboxil placebo);- placebo (baloxavir marboxil placebo was 2 or 4 tablets depending on body weight and
oseltamivir placebo was given BID over 5 days).
Efficacy was evaluated over a 14 day period. Safety was evaluated over a 22-day period. Top-line results were submitted as part of the 120-Day Safety Update. Key efficacy results, as reported by the sponsor, are summarized below; however, an independent FDA analysis of the data was not performed.
Protocol summary:Objectives:Primary: To evaluate the efficacy of a single 40 mg dose of S-033188 administered orally compared with placebo on the time to improvement of influenza symptoms in patients with influenza virus infection.
Key virology-relevant endpoints:Primary
Time to improvement of influenza symptoms.Secondary
Proportion of patients with positive influenza virus titer and RNA (RT-PCR) at each time point. Change from baseline in influenza virus titer and RNA (RT-PCR) at each time point. AUC adjusted by baseline in influenza virus titer and RNA (RT-PCR). Time to cessation of virus shedding as measured by the influenza infectivity assay and RNA (RT-PCR). Incidence of genotypic resistance in subjects with evaluable virus.
Reference ID: 4324543
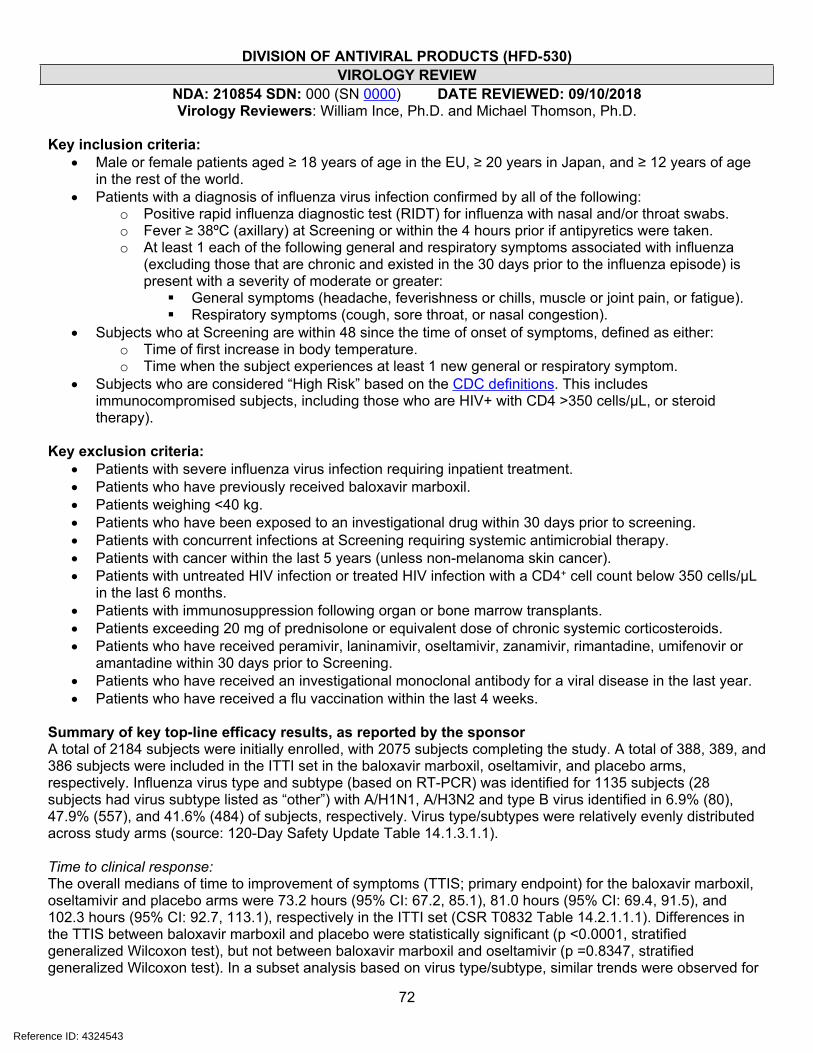
DIVISION OF ANTIVIRAL PRODUCTS (HFD-530)VIROLOGY REVIEW
NDA: 210854 SDN: 000 (SN 0000) DATE REVIEWED: 09/10/2018Virology Reviewers: William Ince, Ph.D. and Michael Thomson, Ph.D.
72
Key inclusion criteria: Male or female patients aged ≥ 18 years of age in the EU, ≥ 20 years in Japan, and ≥ 12 years of age
in the rest of the world. Patients with a diagnosis of influenza virus infection confirmed by all of the following:
o Positive rapid influenza diagnostic test (RIDT) for influenza with nasal and/or throat swabs.o Fever ≥ 38ºC (axillary) at Screening or within the 4 hours prior if antipyretics were taken.o At least 1 each of the following general and respiratory symptoms associated with influenza
(excluding those that are chronic and existed in the 30 days prior to the influenza episode) is present with a severity of moderate or greater: General symptoms (headache, feverishness or chills, muscle or joint pain, or fatigue). Respiratory symptoms (cough, sore throat, or nasal congestion).
Subjects who at Screening are within 48 since the time of onset of symptoms, defined as either:o Time of first increase in body temperature.o Time when the subject experiences at least 1 new general or respiratory symptom.
Subjects who are considered “High Risk” based on the CDC definitions. This includes immunocompromised subjects, including those who are HIV+ with CD4 >350 cells/µL, or steroid therapy).
Key exclusion criteria: Patients with severe influenza virus infection requiring inpatient treatment. Patients who have previously received baloxavir marboxil. Patients weighing <40 kg. Patients who have been exposed to an investigational drug within 30 days prior to screening. Patients with concurrent infections at Screening requiring systemic antimicrobial therapy. Patients with cancer within the last 5 years (unless non-melanoma skin cancer). Patients with untreated HIV infection or treated HIV infection with a CD4+ cell count below 350 cells/µL
in the last 6 months. Patients with immunosuppression following organ or bone marrow transplants. Patients exceeding 20 mg of prednisolone or equivalent dose of chronic systemic corticosteroids. Patients who have received peramivir, laninamivir, oseltamivir, zanamivir, rimantadine, umifenovir or
amantadine within 30 days prior to Screening. Patients who have received an investigational monoclonal antibody for a viral disease in the last year. Patients who have received a flu vaccination within the last 4 weeks.
Summary of key top-line efficacy results, as reported by the sponsorA total of 2184 subjects were initially enrolled, with 2075 subjects completing the study. A total of 388, 389, and 386 subjects were included in the ITTI set in the baloxavir marboxil, oseltamivir, and placebo arms, respectively. Influenza virus type and subtype (based on RT-PCR) was identified for 1135 subjects (28 subjects had virus subtype listed as “other”) with A/H1N1, A/H3N2 and type B virus identified in 6.9% (80), 47.9% (557), and 41.6% (484) of subjects, respectively. Virus type/subtypes were relatively evenly distributed across study arms (source: 120-Day Safety Update Table 14.1.3.1.1).
Time to clinical response:The overall medians of time to improvement of symptoms (TTIS; primary endpoint) for the baloxavir marboxil, oseltamivir and placebo arms were 73.2 hours (95% CI: 67.2, 85.1), 81.0 hours (95% CI: 69.4, 91.5), and 102.3 hours (95% CI: 92.7, 113.1), respectively in the ITTI set (CSR T0832 Table 14.2.1.1.1). Differences in the TTIS between baloxavir marboxil and placebo were statistically significant (p <0.0001, stratified generalized Wilcoxon test), but not between baloxavir marboxil and oseltamivir (p =0.8347, stratified generalized Wilcoxon test). In a subset analysis based on virus type/subtype, similar trends were observed for
Reference ID: 4324543
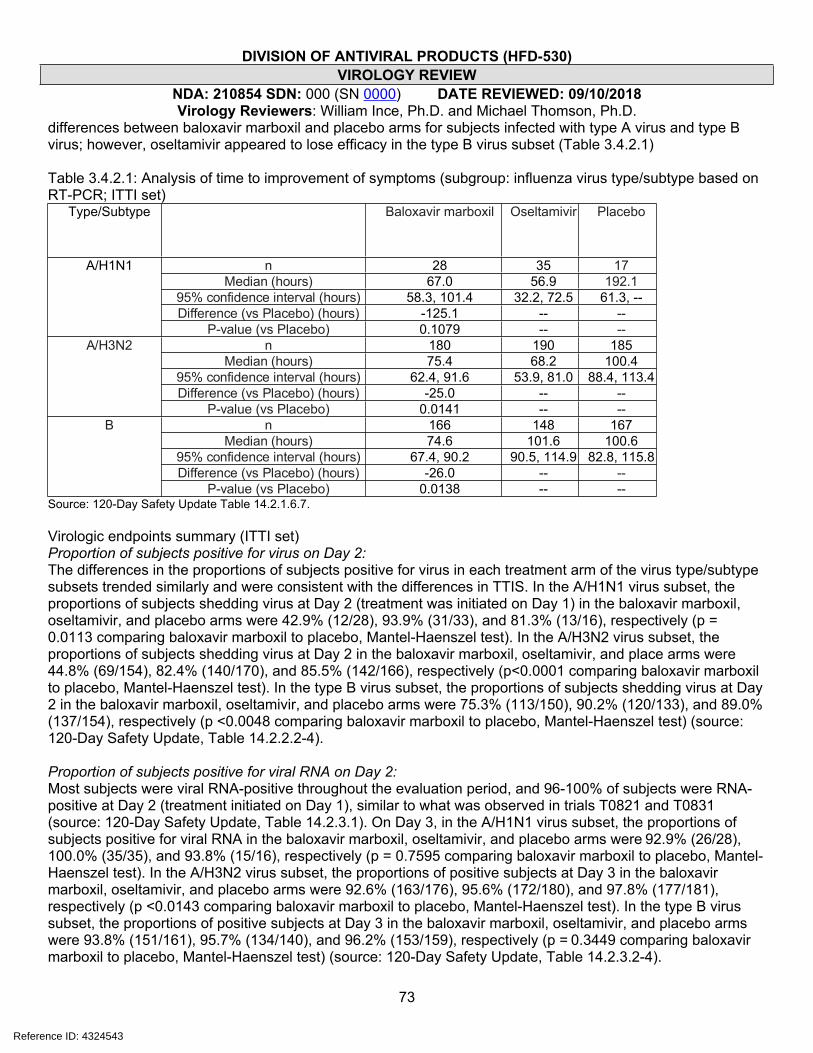
DIVISION OF ANTIVIRAL PRODUCTS (HFD-530)VIROLOGY REVIEW
NDA: 210854 SDN: 000 (SN 0000) DATE REVIEWED: 09/10/2018Virology Reviewers: William Ince, Ph.D. and Michael Thomson, Ph.D.
73
differences between baloxavir marboxil and placebo arms for subjects infected with type A virus and type B virus; however, oseltamivir appeared to lose efficacy in the type B virus subset (Table 3.4.2.1)
Table 3.4.2.1: Analysis of time to improvement of symptoms (subgroup: influenza virus type/subtype based on RT-PCR; ITTI set)
Type/Subtype Baloxavir marboxil Oseltamivir Placebo
n 28 35 17Median (hours) 67.0 56.9 192.1
95% confidence interval (hours) 58.3, 101.4 32.2, 72.5 61.3, --Difference (vs Placebo) (hours) -125.1 -- --
A/H1N1
P-value (vs Placebo) 0.1079 -- --n 180 190 185
Median (hours) 75.4 68.2 100.495% confidence interval (hours) 62.4, 91.6 53.9, 81.0 88.4, 113.4Difference (vs Placebo) (hours) -25.0 -- --
A/H3N2
P-value (vs Placebo) 0.0141 -- --n 166 148 167
Median (hours) 74.6 101.6 100.695% confidence interval (hours) 67.4, 90.2 90.5, 114.9 82.8, 115.8Difference (vs Placebo) (hours) -26.0 -- --
B
P-value (vs Placebo) 0.0138 -- --Source: 120-Day Safety Update Table 14.2.1.6.7.
Virologic endpoints summary (ITTI set)Proportion of subjects positive for virus on Day 2:The differences in the proportions of subjects positive for virus in each treatment arm of the virus type/subtype subsets trended similarly and were consistent with the differences in TTIS. In the A/H1N1 virus subset, the proportions of subjects shedding virus at Day 2 (treatment was initiated on Day 1) in the baloxavir marboxil, oseltamivir, and placebo arms were 42.9% (12/28), 93.9% (31/33), and 81.3% (13/16), respectively (p = 0.0113 comparing baloxavir marboxil to placebo, Mantel-Haenszel test). In the A/H3N2 virus subset, the proportions of subjects shedding virus at Day 2 in the baloxavir marboxil, oseltamivir, and place arms were 44.8% (69/154), 82.4% (140/170), and 85.5% (142/166), respectively (p<0.0001 comparing baloxavir marboxil to placebo, Mantel-Haenszel test). In the type B virus subset, the proportions of subjects shedding virus at Day 2 in the baloxavir marboxil, oseltamivir, and placebo arms were 75.3% (113/150), 90.2% (120/133), and 89.0% (137/154), respectively (p <0.0048 comparing baloxavir marboxil to placebo, Mantel-Haenszel test) (source: 120-Day Safety Update, Table 14.2.2.2-4).
Proportion of subjects positive for viral RNA on Day 2:Most subjects were viral RNA-positive throughout the evaluation period, and 96-100% of subjects were RNA-positive at Day 2 (treatment initiated on Day 1), similar to what was observed in trials T0821 and T0831 (source: 120-Day Safety Update, Table 14.2.3.1). On Day 3, in the A/H1N1 virus subset, the proportions of subjects positive for viral RNA in the baloxavir marboxil, oseltamivir, and placebo arms were 92.9% (26/28), 100.0% (35/35), and 93.8% (15/16), respectively (p = 0.7595 comparing baloxavir marboxil to placebo, Mantel-Haenszel test). In the A/H3N2 virus subset, the proportions of positive subjects at Day 3 in the baloxavir marboxil, oseltamivir, and placebo arms were 92.6% (163/176), 95.6% (172/180), and 97.8% (177/181), respectively (p <0.0143 comparing baloxavir marboxil to placebo, Mantel-Haenszel test). In the type B virus subset, the proportions of positive subjects at Day 3 in the baloxavir marboxil, oseltamivir, and placebo arms were 93.8% (151/161), 95.7% (134/140), and 96.2% (153/159), respectively (p = 0.3449 comparing baloxavir marboxil to placebo, Mantel-Haenszel test) (source: 120-Day Safety Update, Table 14.2.3.2-4).
Reference ID: 4324543
DIVISION OF ANTIVIRAL PRODUCTS (HFD-530)VIROLOGY REVIEW
NDA: 210854 SDN: 000 (SN 0000) DATE REVIEWED: 09/10/2018Virology Reviewers: William Ince, Ph.D. and Michael Thomson, Ph.D.
74
Change from baseline in virus shedding on Day 2:Overall, virus shedding was reduced by a median of -3.45 (n=336) log10 TCID50/mL by Day 2 in the baloxavir marboxil treatment arm compared to -1.8 (n=344) and -1.2 (n=343) log10 TCID50/mL in the oseltamivir and placebo arms, respectively (p <0.0001 comparing baloxavir marboxil to placebo, Elteren test) (source: 120-Day Safety Update, Table 14.2.4.1). In the A/H1N1 virus subtype subsets, Day 2 virus shedding was reduced in the baloxavir marboxil, oseltamivir, and placebo arms by -3.75 (n=28), -2.20 (n=33), and -1.40 (n=16) log10 TCID50/mL, respectively (p =0.0114 comparing baloxavir marboxil to placebo, Elteren test). In the A/H3N2 virus subtype subsets, Day 2 virus shedding was reduced in the baloxavir marboxil, oseltamivir, and placebo arms by -4.00 (n=154), -2.30 (n=170), and -1.40 (n=165) log10 TCID50/mL, respectively (p <0.0001 comparing baloxavir marboxil to placebo, Elteren test). In the type B virus subtype subsets, Day 2 virus shedding was reduced in the baloxavir marboxil, oseltamivir, and placebo arms by -2.80 (n=150), -1.00 (n=133), and -0.80 (n=154) log10 TCID50/mL, respectively (p <0.0001 comparing baloxavir marboxil to placebo, Elteren test) (source: 120-Day Safety Update, Table 14.2.4.2-4).
Change from baseline in viral RNA shedding on Day 2:Overall, viral RNA shedding was reduced by a median of -1.18 (n=369) log10 copies/mL by Day 2 in the baloxavir marboxil treatment arm compared to -0.83 (n=373) and -0.69 (n=370) log10 copies/mL in the oseltamivir and placebo arms, respectively (p <0.0001 comparing baloxavir marboxil to placebo, Elteren test) (source: 120-Day Safety Update, Table 14.2.5.1). In the A/H1N1 virus subtype subsets, Day 2 viral RNA shedding was reduced in the baloxavir marboxil, oseltamivir, and placebo arms by -1.47 (n=28), -0.87 (n=35), and -0.84 (n=16) log10 copies/mL, respectively (p = 0.3961 comparing baloxavir marboxil to placebo, Elteren test). In the A/H3N2 virus subtype subsets, Day 2 virus shedding was reduced in the baloxavir marboxil, oseltamivir, and placebo arms by -1.42 (n=169), -1.13 (n=181), and -0.78 (n=181) log10 copies/mL, respectively (p <0.0001 comparing baloxavir marboxil to placebo, Elteren test). In the type B virus subtype subsets, Day 2 virus shedding was reduced in the baloxavir marboxil, oseltamivir, and placebo arms by -0.86 (n=162), -0.28 (n=142), and -0.55 (n=157) log10 copies/mL, respectively (p =0.2464 comparing baloxavir marboxil to placebo, Elteren test) (source: 120-Day Safety Update, Table 14.2.5.2-4).
Conclusions: Results from study T0832 were consistent with those of phase 2 trial T0821 and phase 3 trial T0831, based on the primary endpoint, time to improvement in symptoms, and virologic endpoints. In contrast to trials T0821 and T0831, in the type B virus subset, baloxavir marboxil treatment was associated with a statistically significant reduction in time to improvement of symptoms as well as reductions in virus and viral RNA shedding in trial T0832. It is not clear if the inconsistent treatment effect of baloxavir marboxil against type B virus infections across trials was due to differences in the circulating lineages of type B virus (Yamagata vs Victoria), as the type B virus lineage was not reported in clinical trials. Resistance data were not included in the update. A more in-depth, independent analysis of the primary and virologic endpoints, as well as exploratory endpoints, will be carried out as part of a future efficacy supplement.
3.5. Pooled analyses of key virologic endpointsThe sponsor performed a pooled analysis of efficacy of studies T0821 and T0831, which were consistent with an independent FDA analysis. The results of the pooled analysis recapitulated the results of the individual studies, but importantly, did not provide statistical significance to the primary endpoint for subtype B infections comparing baloxavir marboxil treatment vs placebo (median TTAS was 65.4 hours vs 81.6 hours, p = 0.1057 in a pooled analysis of studies T0821 and T0831). An independent analysis (FDA analysis) confirmed these conclusions (not shown). An independent analysis (FDA analysis) of pooled data from studies T0821 and T083 for key virologic endpoints confirmed the conclusions drawn from analyses of individual study data and pooled study data (APPENDIX F).
Reference ID: 4324543
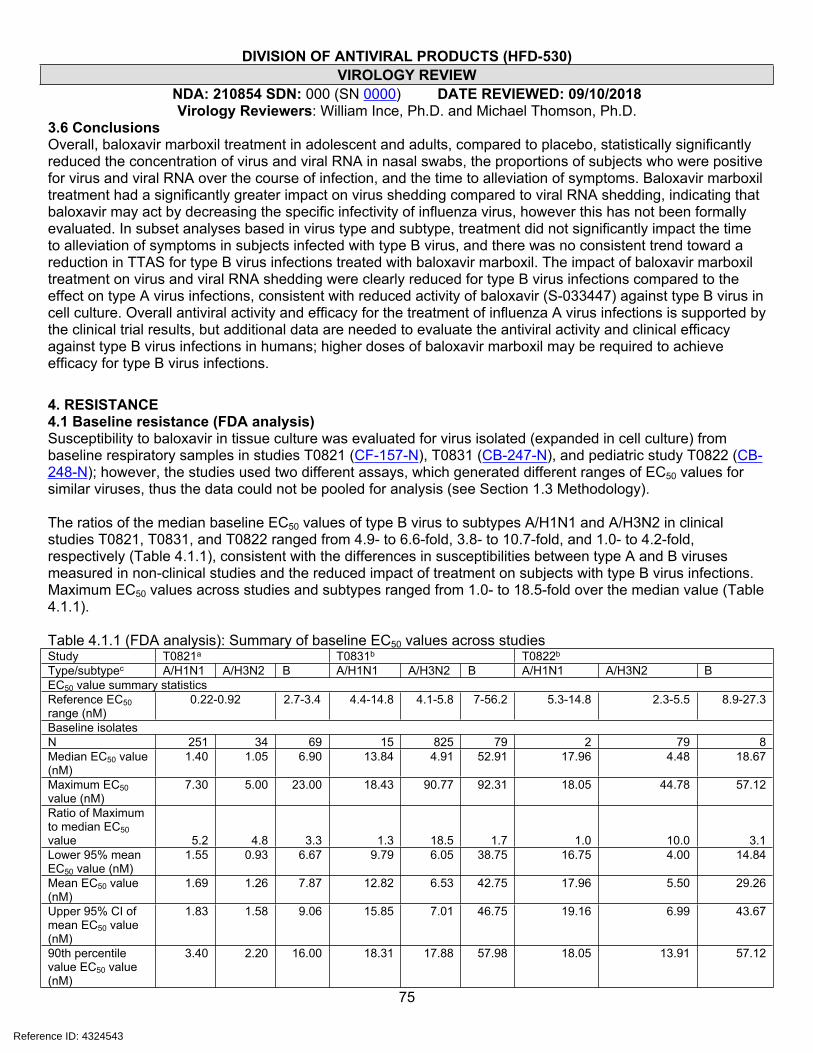
DIVISION OF ANTIVIRAL PRODUCTS (HFD-530)VIROLOGY REVIEW
NDA: 210854 SDN: 000 (SN 0000) DATE REVIEWED: 09/10/2018Virology Reviewers: William Ince, Ph.D. and Michael Thomson, Ph.D.
75
3.6 Conclusions Overall, baloxavir marboxil treatment in adolescent and adults, compared to placebo, statistically significantly reduced the concentration of virus and viral RNA in nasal swabs, the proportions of subjects who were positive for virus and viral RNA over the course of infection, and the time to alleviation of symptoms. Baloxavir marboxil treatment had a significantly greater impact on virus shedding compared to viral RNA shedding, indicating that baloxavir may act by decreasing the specific infectivity of influenza virus, however this has not been formally evaluated. In subset analyses based in virus type and subtype, treatment did not significantly impact the time to alleviation of symptoms in subjects infected with type B virus, and there was no consistent trend toward a reduction in TTAS for type B virus infections treated with baloxavir marboxil. The impact of baloxavir marboxil treatment on virus and viral RNA shedding were clearly reduced for type B virus infections compared to the effect on type A virus infections, consistent with reduced activity of baloxavir (S-033447) against type B virus in cell culture. Overall antiviral activity and efficacy for the treatment of influenza A virus infections is supported by the clinical trial results, but additional data are needed to evaluate the antiviral activity and clinical efficacy against type B virus infections in humans; higher doses of baloxavir marboxil may be required to achieve efficacy for type B virus infections.
4. RESISTANCE4.1 Baseline resistance (FDA analysis)Susceptibility to baloxavir in tissue culture was evaluated for virus isolated (expanded in cell culture) from baseline respiratory samples in studies T0821 (CF-157-N), T0831 (CB-247-N), and pediatric study T0822 (CB-248-N); however, the studies used two different assays, which generated different ranges of EC50 values for similar viruses, thus the data could not be pooled for analysis (see Section 1.3 Methodology).
The ratios of the median baseline EC50 values of type B virus to subtypes A/H1N1 and A/H3N2 in clinical studies T0821, T0831, and T0822 ranged from 4.9- to 6.6-fold, 3.8- to 10.7-fold, and 1.0- to 4.2-fold, respectively (Table 4.1.1), consistent with the differences in susceptibilities between type A and B viruses measured in non-clinical studies and the reduced impact of treatment on subjects with type B virus infections. Maximum EC50 values across studies and subtypes ranged from 1.0- to 18.5-fold over the median value (Table 4.1.1).
Table 4.1.1 (FDA analysis): Summary of baseline EC50 values across studiesStudy T0821a T0831b T0822b
Type/subtypec A/H1N1 A/H3N2 B A/H1N1 A/H3N2 B A/H1N1 A/H3N2 BEC50 value summary statisticsReference EC50 range (nM)
0.22-0.92 2.7-3.4 4.4-14.8 4.1-5.8 7-56.2 5.3-14.8 2.3-5.5 8.9-27.3
Baseline isolatesN 251 34 69 15 825 79 2 79 8Median EC50 value (nM)
1.40 1.05 6.90 13.84 4.91 52.91 17.96 4.48 18.67
Maximum EC50 value (nM)
7.30 5.00 23.00 18.43 90.77 92.31 18.05 44.78 57.12
Ratio of Maximum to median EC50 value 5.2 4.8 3.3 1.3 18.5 1.7 1.0 10.0 3.1Lower 95% mean EC50 value (nM)
1.55 0.93 6.67 9.79 6.05 38.75 16.75 4.00 14.84
Mean EC50 value (nM)
1.69 1.26 7.87 12.82 6.53 42.75 17.96 5.50 29.26
Upper 95% CI of mean EC50 value (nM)
1.83 1.58 9.06 15.85 7.01 46.75 19.16 6.99 43.67
90th percentile value EC50 value (nM)
3.40 2.20 16.00 18.31 17.88 57.98 18.05 13.91 57.12
Reference ID: 4324543
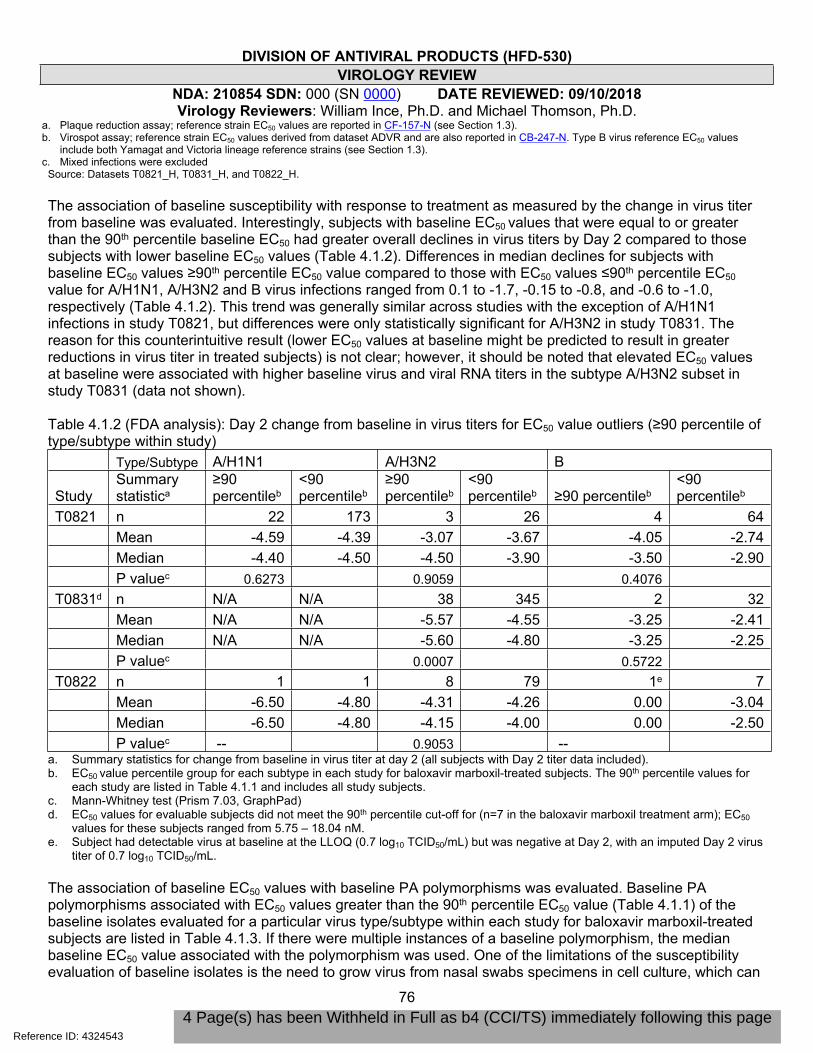
DIVISION OF ANTIVIRAL PRODUCTS (HFD-530)VIROLOGY REVIEW
NDA: 210854 SDN: 000 (SN 0000) DATE REVIEWED: 09/10/2018Virology Reviewers: William Ince, Ph.D. and Michael Thomson, Ph.D.
76
a. Plaque reduction assay; reference strain EC50 values are reported in CF-157-N (see Section 1.3).b. Virospot assay; reference strain EC50 values derived from dataset ADVR and are also reported in CB-247-N. Type B virus reference EC50 values
include both Yamagat and Victoria lineage reference strains (see Section 1.3).c. Mixed infections were excluded
Source: Datasets T0821_H, T0831_H, and T0822_H.
The association of baseline susceptibility with response to treatment as measured by the change in virus titer from baseline was evaluated. Interestingly, subjects with baseline EC50 values that were equal to or greater than the 90th percentile baseline EC50 had greater overall declines in virus titers by Day 2 compared to those subjects with lower baseline EC50 values (Table 4.1.2). Differences in median declines for subjects with baseline EC50 values ≥90th percentile EC50 value compared to those with EC50 values ≤90th percentile EC50 value for A/H1N1, A/H3N2 and B virus infections ranged from 0.1 to -1.7, -0.15 to -0.8, and -0.6 to -1.0, respectively (Table 4.1.2). This trend was generally similar across studies with the exception of A/H1N1 infections in study T0821, but differences were only statistically significant for A/H3N2 in study T0831. The reason for this counterintuitive result (lower EC50 values at baseline might be predicted to result in greater reductions in virus titer in treated subjects) is not clear; however, it should be noted that elevated EC50 values at baseline were associated with higher baseline virus and viral RNA titers in the subtype A/H3N2 subset in study T0831 (data not shown).
Table 4.1.2 (FDA analysis): Day 2 change from baseline in virus titers for EC50 value outliers (≥90 percentile of type/subtype within study)
Type/Subtype A/H1N1 A/H3N2 B
Study Summary statistica
≥90 percentileb
<90 percentileb
≥90 percentileb
<90 percentileb ≥90 percentileb
<90 percentileb
T0821 n 22 173 3 26 4 64Mean -4.59 -4.39 -3.07 -3.67 -4.05 -2.74Median -4.40 -4.50 -4.50 -3.90 -3.50 -2.90P valuec 0.6273 0.9059 0.4076
T0831d n N/A N/A 38 345 2 32Mean N/A N/A -5.57 -4.55 -3.25 -2.41Median N/A N/A -5.60 -4.80 -3.25 -2.25P valuec 0.0007 0.5722
T0822 n 1 1 8 79 1e 7Mean -6.50 -4.80 -4.31 -4.26 0.00 -3.04Median -6.50 -4.80 -4.15 -4.00 0.00 -2.50P valuec -- 0.9053 --
a. Summary statistics for change from baseline in virus titer at day 2 (all subjects with Day 2 titer data included). b. EC50 value percentile group for each subtype in each study for baloxavir marboxil-treated subjects. The 90th percentile values for
each study are listed in Table 4.1.1 and includes all study subjects.c. Mann-Whitney test (Prism 7.03, GraphPad)d. EC50 values for evaluable subjects did not meet the 90th percentile cut-off for (n=7 in the baloxavir marboxil treatment arm); EC50
values for these subjects ranged from 5.75 – 18.04 nM. e. Subject had detectable virus at baseline at the LLOQ (0.7 log10 TCID50/mL) but was negative at Day 2, with an imputed Day 2 virus
titer of 0.7 log10 TCID50/mL.
The association of baseline EC50 values with baseline PA polymorphisms was evaluated. Baseline PA polymorphisms associated with EC50 values greater than the 90th percentile EC50 value (Table 4.1.1) of the baseline isolates evaluated for a particular virus type/subtype within each study for baloxavir marboxil-treated subjects are listed in Table 4.1.3. If there were multiple instances of a baseline polymorphism, the median baseline EC50 value associated with the polymorphism was used. One of the limitations of the susceptibility evaluation of baseline isolates is the need to grow virus from nasal swabs specimens in cell culture, which can
Reference ID: 4324543
4 Page(s) has been Withheld in Full as b4 (CCI/TS) immediately following this page
DIVISION OF ANTIVIRAL PRODUCTS (HFD-530)VIROLOGY REVIEW
NDA: 210854 SDN: 000 (SN 0000) DATE REVIEWED: 09/10/2018
81
Overall, baseline phenotypic and genotypic evaluations did not uncover circulating variation that clearly affected response to treatment within subtypes, but specific substitutions identified above should be evaluated further for their impact on susceptibility and should be monitored for their circulation frequency and impact on treatment outcomes in clinical studies.
The sponsor also evaluated baseline susceptibility of virus isolated from clinical specimens to oseltamivir acid in a biochemical assay of inhibition of NA enzymatic activity (NA-StarTM) (CB-247-N). The median IC50 values for subtype A/H1N1, subtype A/H3N2, and type B viruses were 0.34 nM (n=13; 90th percentile: 0.496 nM; range: 0.12-0.54 nM), 0.35 nM (n=356, 90 h percentile: 0.59 nM; range 0.03-1.09 nM), and 1.52 nM (n=80, 90th percentile: 4 nM; range 0.02-9.78 nM). There were a total of 7 subjects with baseline IC50 values ≥3-fold of the median value within virus type/subtype: 3 in the oseltamivir arm (type B: subject 117113, 4.75 nM; subject 118116, 4.59 nM; and subject 181102, 9.78 nM), 1 in the placebo arm (type B: subject 100105, 5.48 nM), and 3 in the baloxavir marboxil arm (type A/H3N2: subject 111101, 1.09 nM; type B: subject 333105, 6.06 nM; subject 815102, 4.55 nM). The sponsor did not perform genotypic analyses of the NA or HA genes in study T0831; however, based on phenotypic data from study T0831 and available surveillance data (which indicates circulating oseltamivir resistance is low), it does not appear that there was significant baseline resistance that might have impacted treatment outcomes in the oseltamivir arm of T0831.
4.2 Treatment-emergent substitutionsBaseline and post-baseline sequence data of the viral PA gene were collected for all baloxavir marboxil-treated, evaluable (adequate sample material for both baseline and post-baseline sequencing) subjects in pivotal trials T0821 (182 treated subjects) and T0831 (370 treated subjects and 95 placebo-treated subjects)
Reference ID: 4324543
(b) (4)

DIVISION OF ANTIVIRAL PRODUCTS (HFD-530)VIROLOGY REVIEW
NDA: 210854 SDN: 000 (SN 0000) DATE REVIEWED: 09/10/2018Virology Reviewers: William Ince, Ph.D. and Michael Thomson, Ph.D.
82
as well as the supportive pediatric study T0822 (78 treated subjects; T0822 data submitted to the original NDA were used to identify additional treatment-emergent resistant variants; a more in-depth analysis of T0822 resistance will be carried out in the context of complete pediatric data submitted as part of a future, planned supplemental NDA for marketing in pediatric subjects). The rates of treatment-emergent amino acid substitutions, defined as any amino acid substitution that was detected in post-baseline samples but not in the baseline sample, or substitutions that rose in frequency from baseline (substitutions that were identified as a mixture at baseline that were reported as pure populations post baseline), were determined. Across pivotal trials T0821, T0831 and supportive pediatric study T0822, PA treatment-emergent substitutions were detected in 3.8%, 18.4% and 29.5% of subjects, respectively (Table 4.2.1). Emergent substitutions were detected in 8.4% (8/95) of a presumably random sampling of placebo-treated subjects evaluated as a control for the emergence of variation in PA over the course of infections; none of the emergent substitutions observed in treated subjects were observed in placebo-treated subjects, and vice versa (data not shown).
Table 4.2.1 (FDA analysis): Proportion of evaluated subjects with treatment-emergent PA variantsStudy Subtype Number of
subjects with paired PA sequence data
Any Treatment-emergent substitutiona
% (n)
RASb
% (n)RASb
H1N1 112 5.4% (6) 4.5% (5) E23K, I38F/TH3N2 14 0% (0) 0% (0) --Bc 56 1.8% (1) 0% (0) --
T0821
Total 182 3.8% (7) 2.7% (5)H1N1 4 0% (0) 0 % (0) --
H3N2 330 18.8% (62) 12.1% (40) E23G/K, A37T, I38M/T, E623G
B 37 13.5% (5) 5.4% (2) I38T, A60V
T0831
Totald 370 18.4% (68) 11.1% (41)H1N1 2 0% (0) 0% (0) --H3N2 70 32.9% (23) 28.6% (20) A37T, I38M/Te,
S60Pe, E199Gf, E623Ke
B 8 0% (0) 0% (0) --
T0822
Totalg 78 29.5% (23) 25.6% (20)a. Treatment-emergent substitution; includes substitutions that reverted to consensus (n=2 overall).b. RAS: Treatment-emergent substitution potentially associated with resistance. Criteria for potentially resistance-associated:
Treatment-emergent in more than one subject, at a modeled baloxavir marboxil binding pocket residue, confers a 2-fold or greater increase in EC50 value over wild type (molecular clone in plaque reduction assay), or selected in cell culture (PA substitutions E23G/K, A37T, I38I/M/T, A/S60V/P, E199G, E623G/K). Note: Substitutions included in the USPI may not include all those listed (see Section 5 Package Insert).
c. Includes 1 A+B co-infection: Only B was sequenced.d. Includes paired sequencing from 7 co-infected subjects. Data were obtained for both H3N2 and B for 1 subject, H3N2 only for 3
subjects and B only for 3 subjects.e. Includes one subject with I38T+E623G, and one subject with I38T+S60P. f. Selected in cell culture.g. Includes paired sequencing from 4 co-infected subjects. Data were obtained for H3N2 for 3 subjects and B for 1 subject.
Baseline and post baseline PB1 and PB2 sequencing data were collected for a subset of evaluable subjects generally meeting the criteria for virologic rebound; however, these criteria were only defined for study T0831 (virus titer rise of ≥0.6 log10 TCID50/mL between consecutive time points, virus titer >1.5 log10 TCID50/mL at day 5 and beyond, or no change or rise in virus titer between consecutive time points where the titer at each time
Reference ID: 4324543
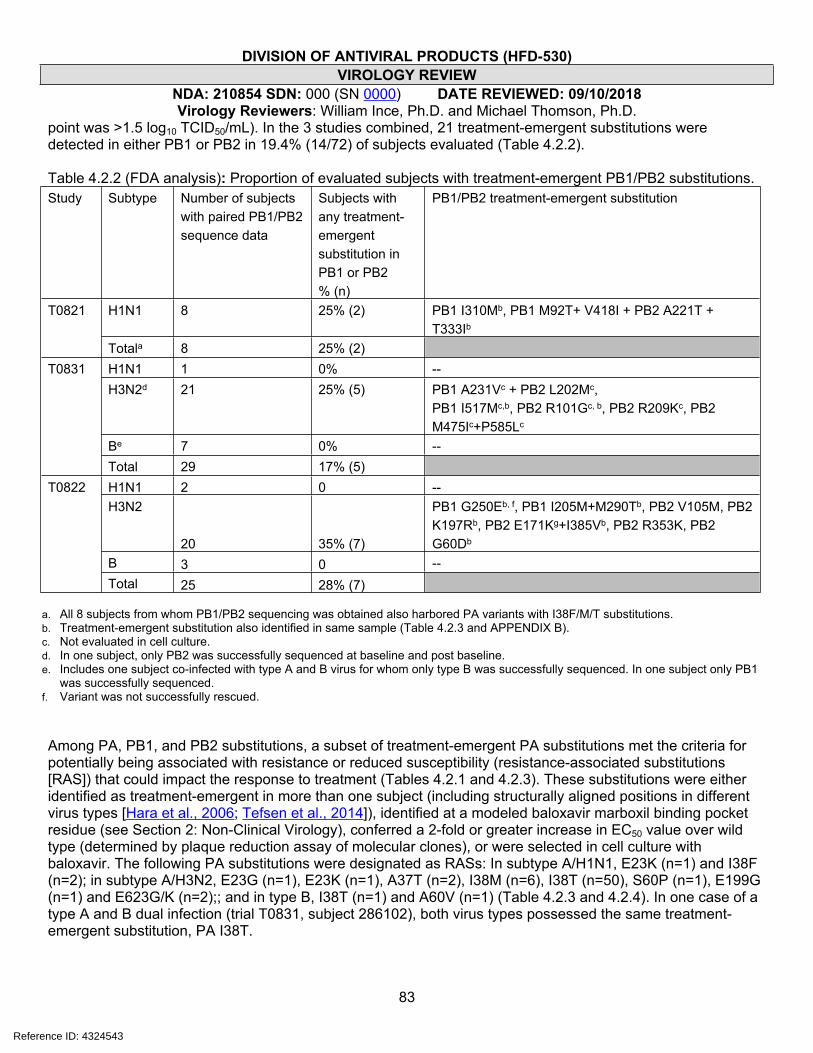
DIVISION OF ANTIVIRAL PRODUCTS (HFD-530)VIROLOGY REVIEW
NDA: 210854 SDN: 000 (SN 0000) DATE REVIEWED: 09/10/2018Virology Reviewers: William Ince, Ph.D. and Michael Thomson, Ph.D.
83
point was >1.5 log10 TCID50/mL). In the 3 studies combined, 21 treatment-emergent substitutions were detected in either PB1 or PB2 in 19.4% (14/72) of subjects evaluated (Table 4.2.2).
Table 4.2.2 (FDA analysis): Proportion of evaluated subjects with treatment-emergent PB1/PB2 substitutions. Study Subtype Number of subjects
with paired PB1/PB2 sequence data
Subjects with any treatment-emergent substitution in PB1 or PB2 % (n)
PB1/PB2 treatment-emergent substitution
H1N1 8 25% (2) PB1 I310Mb, PB1 M92T+ V418I + PB2 A221T + T333Ib
T0821
Totala 8 25% (2)H1N1 1 0% --H3N2d 21 25% (5) PB1 A231Vc + PB2 L202Mc,
PB1 I517Mc,b, PB2 R101Gc, b, PB2 R209Kc, PB2 M475Ic+P585Lc
Be 7 0% --
T0831
Total 29 17% (5)H1N1 2 0 --H3N2
20 35% (7)
PB1 G250Eb, f, PB1 I205M+M290Tb, PB2 V105M, PB2 K197Rb, PB2 E171Kg+I385Vb, PB2 R353K, PB2 G60Db
B 3 0 --
T0822
Total 25 28% (7)
a. All 8 subjects from whom PB1/PB2 sequencing was obtained also harbored PA variants with I38F/M/T substitutions.b. Treatment-emergent substitution also identified in same sample (Table 4.2.3 and APPENDIX B).c. Not evaluated in cell culture.d. In one subject, only PB2 was successfully sequenced at baseline and post baseline. e. Includes one subject co-infected with type A and B virus for whom only type B was successfully sequenced. In one subject only PB1
was successfully sequenced. f. Variant was not successfully rescued.
Among PA, PB1, and PB2 substitutions, a subset of treatment-emergent PA substitutions met the criteria for potentially being associated with resistance or reduced susceptibility (resistance-associated substitutions [RAS]) that could impact the response to treatment (Tables 4.2.1 and 4.2.3). These substitutions were either identified as treatment-emergent in more than one subject (including structurally aligned positions in different virus types [Hara et al., 2006; Tefsen et al., 2014]), identified at a modeled baloxavir marboxil binding pocket residue (see Section 2: Non-Clinical Virology), conferred a 2-fold or greater increase in EC50 value over wild type (determined by plaque reduction assay of molecular clones), or were selected in cell culture with baloxavir. The following PA substitutions were designated as RASs: In subtype A/H1N1, E23K (n=1) and I38F (n=2); in subtype A/H3N2, E23G (n=1), E23K (n=1), A37T (n=2), I38M (n=6), I38T (n=50), S60P (n=1), E199G (n=1) and E623G/K (n=2);; and in type B, I38T (n=1) and A60V (n=1) (Table 4.2.3 and 4.2.4). In one case of a type A and B dual infection (trial T0831, subject 286102), both virus types possessed the same treatment-emergent substitution, PA I38T.
Reference ID: 4324543
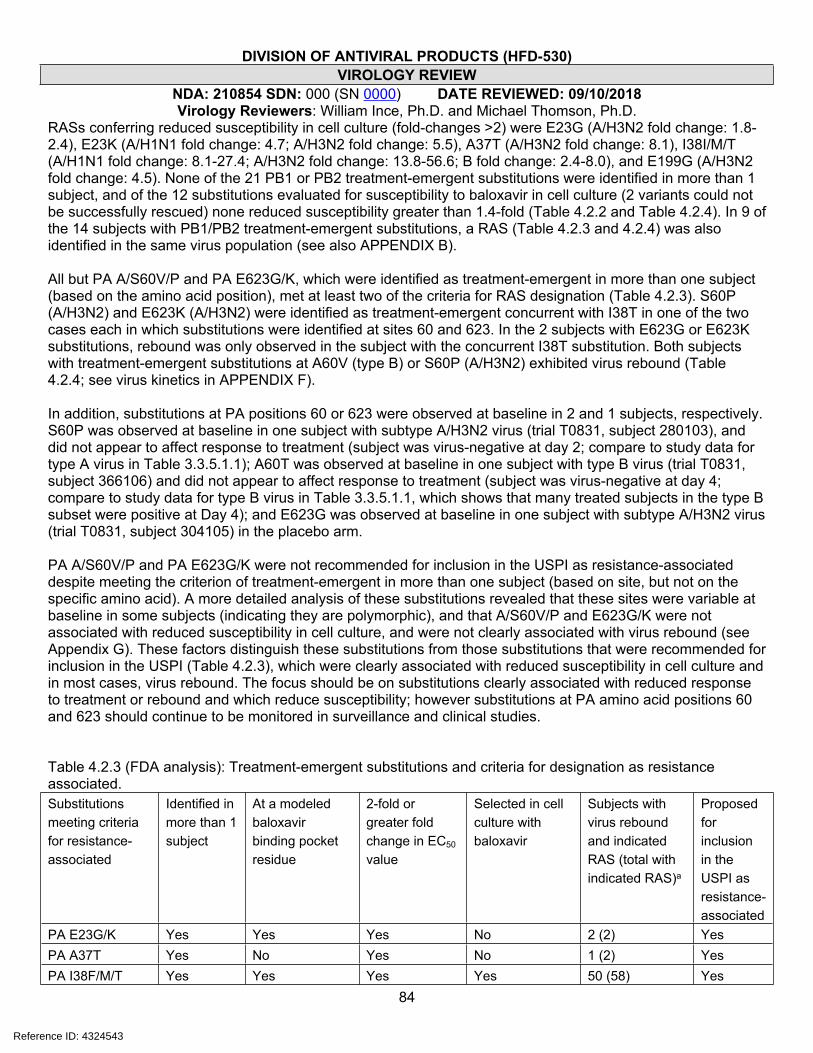
DIVISION OF ANTIVIRAL PRODUCTS (HFD-530)VIROLOGY REVIEW
NDA: 210854 SDN: 000 (SN 0000) DATE REVIEWED: 09/10/2018Virology Reviewers: William Ince, Ph.D. and Michael Thomson, Ph.D.
84
RASs conferring reduced susceptibility in cell culture (fold-changes >2) were E23G (A/H3N2 fold change: 1.8-2.4), E23K (A/H1N1 fold change: 4.7; A/H3N2 fold change: 5.5), A37T (A/H3N2 fold change: 8.1), I38I/M/T (A/H1N1 fold change: 8.1-27.4; A/H3N2 fold change: 13.8-56.6; B fold change: 2.4-8.0), and E199G (A/H3N2 fold change: 4.5). None of the 21 PB1 or PB2 treatment-emergent substitutions were identified in more than 1 subject, and of the 12 substitutions evaluated for susceptibility to baloxavir in cell culture (2 variants could not be successfully rescued) none reduced susceptibility greater than 1.4-fold (Table 4.2.2 and Table 4.2.4). In 9 of the 14 subjects with PB1/PB2 treatment-emergent substitutions, a RAS (Table 4.2.3 and 4.2.4) was also identified in the same virus population (see also APPENDIX B).
All but PA A/S60V/P and PA E623G/K, which were identified as treatment-emergent in more than one subject (based on the amino acid position), met at least two of the criteria for RAS designation (Table 4.2.3). S60P (A/H3N2) and E623K (A/H3N2) were identified as treatment-emergent concurrent with I38T in one of the two cases each in which substitutions were identified at sites 60 and 623. In the 2 subjects with E623G or E623K substitutions, rebound was only observed in the subject with the concurrent I38T substitution. Both subjects with treatment-emergent substitutions at A60V (type B) or S60P (A/H3N2) exhibited virus rebound (Table 4.2.4; see virus kinetics in APPENDIX F).
In addition, substitutions at PA positions 60 or 623 were observed at baseline in 2 and 1 subjects, respectively. S60P was observed at baseline in one subject with subtype A/H3N2 virus (trial T0831, subject 280103), and did not appear to affect response to treatment (subject was virus-negative at day 2; compare to study data for type A virus in Table 3.3.5.1.1); A60T was observed at baseline in one subject with type B virus (trial T0831, subject 366106) and did not appear to affect response to treatment (subject was virus-negative at day 4; compare to study data for type B virus in Table 3.3.5.1.1, which shows that many treated subjects in the type B subset were positive at Day 4); and E623G was observed at baseline in one subject with subtype A/H3N2 virus (trial T0831, subject 304105) in the placebo arm.
PA A/S60V/P and PA E623G/K were not recommended for inclusion in the USPI as resistance-associated despite meeting the criterion of treatment-emergent in more than one subject (based on site, but not on the specific amino acid). A more detailed analysis of these substitutions revealed that these sites were variable at baseline in some subjects (indicating they are polymorphic), and that A/S60V/P and E623G/K were not associated with reduced susceptibility in cell culture, and were not clearly associated with virus rebound (see Appendix G). These factors distinguish these substitutions from those substitutions that were recommended for inclusion in the USPI (Table 4.2.3), which were clearly associated with reduced susceptibility in cell culture and in most cases, virus rebound. The focus should be on substitutions clearly associated with reduced response to treatment or rebound and which reduce susceptibility; however substitutions at PA amino acid positions 60 and 623 should continue to be monitored in surveillance and clinical studies.
Table 4.2.3 (FDA analysis): Treatment-emergent substitutions and criteria for designation as resistance associated.Substitutions meeting criteria for resistance-associated
Identified in more than 1 subject
At a modeled baloxavir binding pocket residue
2-fold or greater fold change in EC50 value
Selected in cell culture with baloxavir
Subjects with virus rebound and indicated RAS (total with indicated RAS)a
Proposed for inclusion in the USPI as resistance-associated
PA E23G/K Yes Yes Yes No 2 (2) YesPA A37T Yes No Yes No 1 (2) YesPA I38F/M/T Yes Yes Yes Yes 50 (58) Yes
Reference ID: 4324543

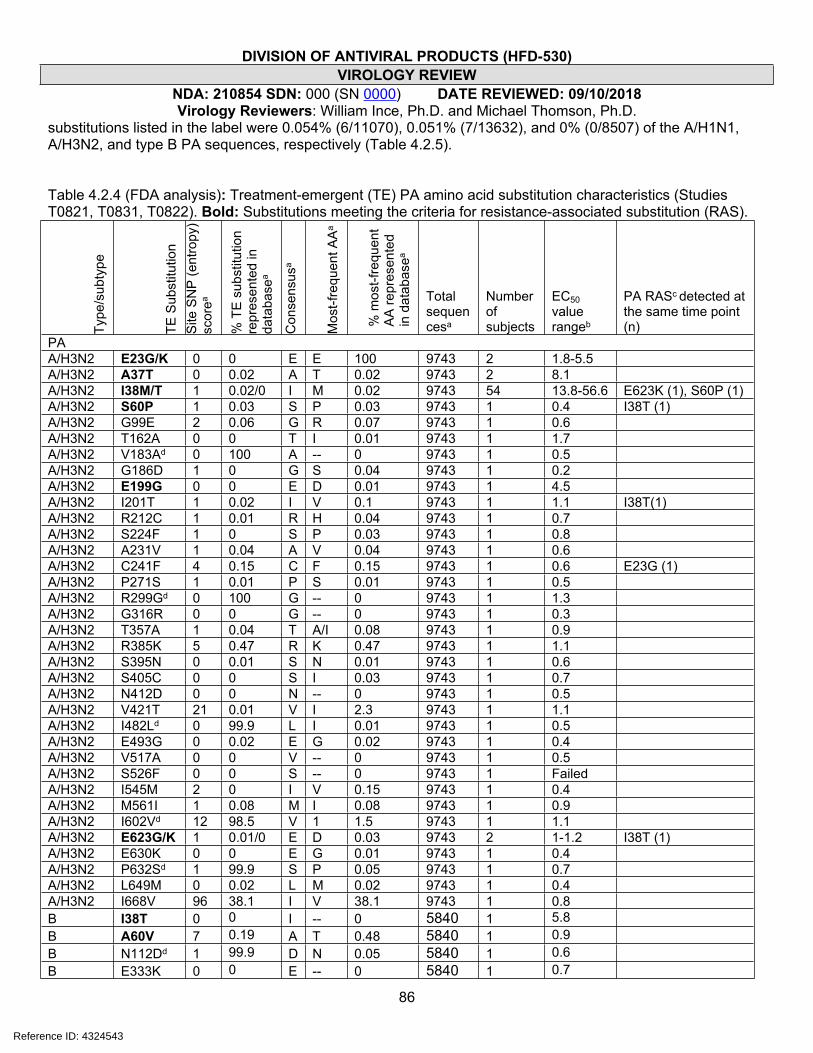
DIVISION OF ANTIVIRAL PRODUCTS (HFD-530)VIROLOGY REVIEW
NDA: 210854 SDN: 000 (SN 0000) DATE REVIEWED: 09/10/2018Virology Reviewers: William Ince, Ph.D. and Michael Thomson, Ph.D.
86
substitutions listed in the label were 0.054% (6/11070), 0.051% (7/13632), and 0% (0/8507) of the A/H1N1, A/H3N2, and type B PA sequences, respectively (Table 4.2.5).
Table 4.2.4 (FDA analysis): Treatment-emergent (TE) PA amino acid substitution characteristics (Studies T0821, T0831, T0822). Bold: Substitutions meeting the criteria for resistance-associated substitution (RAS).
Type
/sub
type
TE S
ubst
itutio
n S
ite S
NP
(ent
ropy
) sc
orea
% T
E s
ubst
itutio
n re
pres
ente
d in
da
taba
sea
Con
sens
usa
Mos
t-fre
quen
t AA
a
% m
ost-f
requ
ent
AA
repr
esen
ted
in d
atab
asea
Total sequencesa
Number of subjects
EC50 value rangeb
PA RASc detected at the same time point (n)
PAA/H3N2 E23G/K 0 0 E E 100 9743 2 1.8-5.5A/H3N2 A37T 0 0.02 A T 0.02 9743 2 8.1A/H3N2 I38M/T 1 0.02/0 I M 0.02 9743 54 13.8-56.6 E623K (1), S60P (1)A/H3N2 S60P 1 0.03 S P 0.03 9743 1 0.4 I38T (1)A/H3N2 G99E 2 0.06 G R 0.07 9743 1 0.6A/H3N2 T162A 0 0 T I 0.01 9743 1 1.7A/H3N2 V183Ad 0 100 A -- 0 9743 1 0.5A/H3N2 G186D 1 0 G S 0.04 9743 1 0.2A/H3N2 E199G 0 0 E D 0.01 9743 1 4.5A/H3N2 I201T 1 0.02 I V 0.1 9743 1 1.1 I38T(1)A/H3N2 R212C 1 0.01 R H 0.04 9743 1 0.7A/H3N2 S224F 1 0 S P 0.03 9743 1 0.8A/H3N2 A231V 1 0.04 A V 0.04 9743 1 0.6A/H3N2 C241F 4 0.15 C F 0.15 9743 1 0.6 E23G (1)A/H3N2 P271S 1 0.01 P S 0.01 9743 1 0.5A/H3N2 R299Gd 0 100 G -- 0 9743 1 1.3A/H3N2 G316R 0 0 G -- 0 9743 1 0.3A/H3N2 T357A 1 0.04 T A/I 0.08 9743 1 0.9A/H3N2 R385K 5 0.47 R K 0.47 9743 1 1.1A/H3N2 S395N 0 0.01 S N 0.01 9743 1 0.6A/H3N2 S405C 0 0 S I 0.03 9743 1 0.7A/H3N2 N412D 0 0 N -- 0 9743 1 0.5A/H3N2 V421T 21 0.01 V I 2.3 9743 1 1.1A/H3N2 I482Ld 0 99.9 L I 0.01 9743 1 0.5A/H3N2 E493G 0 0.02 E G 0.02 9743 1 0.4A/H3N2 V517A 0 0 V -- 0 9743 1 0.5A/H3N2 S526F 0 0 S -- 0 9743 1 FailedA/H3N2 I545M 2 0 I V 0.15 9743 1 0.4A/H3N2 M561I 1 0.08 M I 0.08 9743 1 0.9A/H3N2 I602Vd 12 98.5 V 1 1.5 9743 1 1.1A/H3N2 E623G/K 1 0.01/0 E D 0.03 9743 2 1-1.2 I38T (1)A/H3N2 E630K 0 0 E G 0.01 9743 1 0.4A/H3N2 P632Sd 1 99.9 S P 0.05 9743 1 0.7A/H3N2 L649M 0 0.02 L M 0.02 9743 1 0.4A/H3N2 I668V 96 38.1 I V 38.1 9743 1 0.8B I38T 0 0 I -- 0 5840 1 5.8B A60V 7 0.19 A T 0.48 5840 1 0.9B N112Dd 1 99.9 D N 0.05 5840 1 0.6B E333K 0 0 E -- 0 5840 1 0.7
Reference ID: 4324543

DIVISION OF ANTIVIRAL PRODUCTS (HFD-530)VIROLOGY REVIEW
NDA: 210854 SDN: 000 (SN 0000) DATE REVIEWED: 09/10/2018Virology Reviewers: William Ince, Ph.D. and Michael Thomson, Ph.D.
87
B Y361H 4 0.45 Y H 0.45 5840 1 1.0
B R548Gd 199.9
G R 0.035840
1Not tested
A/H1N1 E23K 1 0.01 E G/K 0.01/0.01 8727 1 4.7A/H1N1 I38F/T 2 0/0 I V 0.07 8727 4 10.6-27.2PB2A/H1N1 A221T 11 0.2 A S 92.9 8502 1 0.90A/H1N1 I310M 2 0.02 I R/M 0.02/0.02 8502 1 0.71 I38TA/H1N1 T333I 2 0.07 T I 0.07 8502 1 0.58 I38FA/H3N2 G60Dd 0 99.9 D N 0.02 9775 1 0.92 I38TA/H3N2 R101G
00
R -- 09775
1Not tested A37T
A/H3N2 V105M 4 0.15 V M 0.15 9775 1 0.58A/H3N2 E171K 0 0 E -- 0 9775 1 Failed I38TA/H3N2 K197R 4 0.35 K R 0.35 9775 1 1.36 I38TA/H3N2 L202Md
199.9
M V/L 0.02/09775
1Not tested
A/H3N2 R209K0
0.01R K 0.01
97751
Not tested
A/H3N2 R353K 39 7.5 R K 7.5 9775 1 0.73A/H3N2 I385V 0 0.01 I V 0.01 9775 1 0.64 I38TA/H3N2 M475I
80.05
M L 0.89775
1Not tested
A/H3N2 P585L0
0P -- 0
97751
Not tested
PB1A/H1N1 M92T 3 0 M L 0.22 8151 1 0.79A/H1N1 V418I 3 0.05 V I 0.05 8151 1 0.71A/H3N2 I205M 1 0.02 I M 0.02 9529 1 0.63 I38TA/H3N2 A231V
00
A -- 09529
1Not tested
A/H3N2 G250E 0 0 G V 0.01 9529 1 Failed I38TA/H3N2 M290T 0 0 M I 0.01 9529 1 0.34 I38TA/H3N2 I517M
30
I V 0.39529
1Not tested E23K
a. Sequences downloaded on 7/5/2018 from www.fludb.org Search parameters: Data Type: Protein; Virus Type: A or B; Subtype: H3N2 or H1N1; Protein: PA; Host: Human; Dates: 11/2008-5/2018; lab strains excluded. SNP analysis was carried out using the SNP tool through the www.fludb.org portal and as described in Crooks et al., 2004.
b. Fold change from WT molecular clone in which the substitution was evaluated. Range includes clone variants with other substitutions that grew out in the same subject sample as the listed amino acid substitution (Table 4.2.6 study reports EB-235-N, EB-276-N, and EB-290-N).
c. Detected with another RAS. RAS: Treatment-emergent, potential resistant variant defined by the following criteria: Treatment-emergent in more than one subject (includes positions at which variability was observed in more than one treated subject), with 4 Ångstroms of the modeled ligand baloxavir, or confers an EC50 value fold-change >2 in cell culture.
d. Reversion to consensus. Bold: Treatment-emergent RAS (Table 4.2.3).
Reference ID: 4324543
(b) (4)
2 Page(s) has been Withheld in Full as b4 (CCI/TS) immediately following this page

DIVISION OF ANTIVIRAL PRODUCTS (HFD-530)VIROLOGY REVIEW
NDA: 210854 SDN: 000 (SN 0000) DATE REVIEWED: 09/10/2018Virology Reviewers: William Ince, Ph.D. and Michael Thomson, Ph.D.
90
4.3 Association of non-RAS treatment-emergent substitutions with virologic responsesAn evaluation of treatment-emergent substitutions that did not meet the criteria for RASs described above was carried out to determine if non-RAS treatment-emergent substitutions were overrepresented among subjects meeting the criteria for reduced-response/rebound (defined as any rise in titer or a lack of decline between two time points where virus titer was greater than the limit of detection) or prolonged shedding (defined as virus positive at time points beyond analysis day 5). In a combined analysis of data from studies T0821, T0831 and T0822, there was no significant association observed between treatment-emergent substitutions, excluding subjects with RASs, and reduced-response/rebound or prolonged shedding. Of subjects with non-RAS treatment-emergent substitutions and those without non-RAS treatment-emergent substitutions, 15.6% (5/32) and 14.2% (76/532), respectively, met the criteria for reduced-response/rebound (p = 0.7961, Fisher’s exact test); and 3.2% and 3.1%, respectively, met the criteria for prolonged shedding (p >0.999, Fisher’s exact test). Virus and viral RNA kinetics of subjects with non-RAS treatment-emergent substitutions who met the criteria for reduced-response/rebound or prolonged shedding are depicted in Figure 4.3.1 with the emergent substitutions indicated. The 5 treatment-emergent substitutions detected in these subjects were either reversions to the consensus (PB2 L202M), polymorphic or did not confer a significant fold-change in susceptibility to baloxavir when evaluated in cloned virus in cell culture (all but PB2 L202M and PB2 R209K were evaluated) (Table 4.2.4). PB2 R209K occurred at a relatively conserved site, and while it was detected after the peak of virus rebound (day 3), the subject in whom it occurred had evaluable viral RNA at day 10, the point at which the substitution was identified. PB2 K209R should be considered for evaluation of susceptibility in cell culture. In general, non-RAS treatment-emergent substitutions likely represent the variation in the virus population not specifically related to baloxavir selective pressure; as noted above, post-baseline substitutions arose in 8.4% of placebo-treated subjects evaluated.
Reference ID: 4324543
(b) (4)
(b) (4)
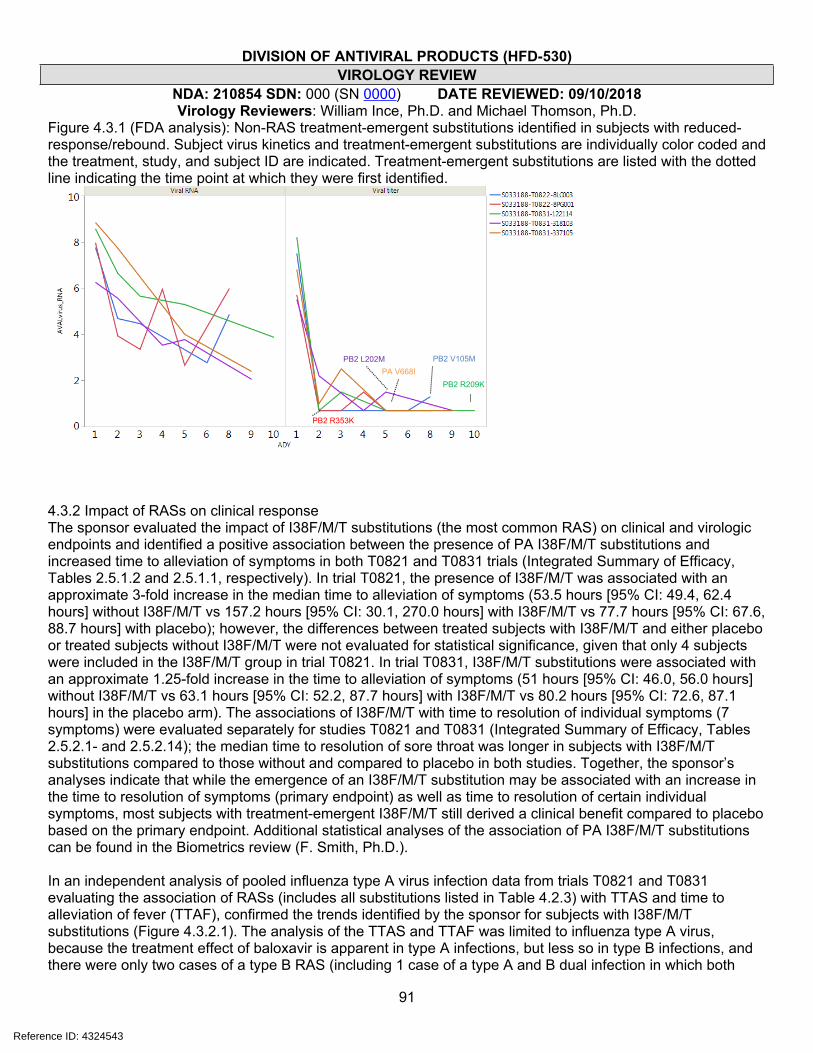
DIVISION OF ANTIVIRAL PRODUCTS (HFD-530)VIROLOGY REVIEW
NDA: 210854 SDN: 000 (SN 0000) DATE REVIEWED: 09/10/2018Virology Reviewers: William Ince, Ph.D. and Michael Thomson, Ph.D.
91
Figure 4.3.1 (FDA analysis): Non-RAS treatment-emergent substitutions identified in subjects with reduced-response/rebound. Subject virus kinetics and treatment-emergent substitutions are individually color coded and the treatment, study, and subject ID are indicated. Treatment-emergent substitutions are listed with the dotted line indicating the time point at which they were first identified.
4.3.2 Impact of RASs on clinical responseThe sponsor evaluated the impact of I38F/M/T substitutions (the most common RAS) on clinical and virologic endpoints and identified a positive association between the presence of PA I38F/M/T substitutions and increased time to alleviation of symptoms in both T0821 and T0831 trials (Integrated Summary of Efficacy, Tables 2.5.1.2 and 2.5.1.1, respectively). In trial T0821, the presence of I38F/M/T was associated with an approximate 3-fold increase in the median time to alleviation of symptoms (53.5 hours [95% CI: 49.4, 62.4 hours] without I38F/M/T vs 157.2 hours [95% CI: 30.1, 270.0 hours] with I38F/M/T vs 77.7 hours [95% CI: 67.6, 88.7 hours] with placebo); however, the differences between treated subjects with I38F/M/T and either placebo or treated subjects without I38F/M/T were not evaluated for statistical significance, given that only 4 subjects were included in the I38F/M/T group in trial T0821. In trial T0831, I38F/M/T substitutions were associated with an approximate 1.25-fold increase in the time to alleviation of symptoms (51 hours [95% CI: 46.0, 56.0 hours] without I38F/M/T vs 63.1 hours [95% CI: 52.2, 87.7 hours] with I38F/M/T vs 80.2 hours [95% CI: 72.6, 87.1 hours] in the placebo arm). The associations of I38F/M/T with time to resolution of individual symptoms (7 symptoms) were evaluated separately for studies T0821 and T0831 (Integrated Summary of Efficacy, Tables 2.5.2.1- and 2.5.2.14); the median time to resolution of sore throat was longer in subjects with I38F/M/T substitutions compared to those without and compared to placebo in both studies. Together, the sponsor’s analyses indicate that while the emergence of an I38F/M/T substitution may be associated with an increase in the time to resolution of symptoms (primary endpoint) as well as time to resolution of certain individual symptoms, most subjects with treatment-emergent I38F/M/T still derived a clinical benefit compared to placebo based on the primary endpoint. Additional statistical analyses of the association of PA I38F/M/T substitutions can be found in the Biometrics review (F. Smith, Ph.D.).
In an independent analysis of pooled influenza type A virus infection data from trials T0821 and T0831 evaluating the association of RASs (includes all substitutions listed in Table 4.2.3) with TTAS and time to alleviation of fever (TTAF), confirmed the trends identified by the sponsor for subjects with I38F/M/T substitutions (Figure 4.3.2.1). The analysis of the TTAS and TTAF was limited to influenza type A virus, because the treatment effect of baloxavir is apparent in type A infections, but less so in type B infections, and there were only two cases of a type B RAS (including 1 case of a type A and B dual infection in which both
PB2 V105M
PB2 R353K
PB2 R209K
PB2 L202MPA V668I
Reference ID: 4324543
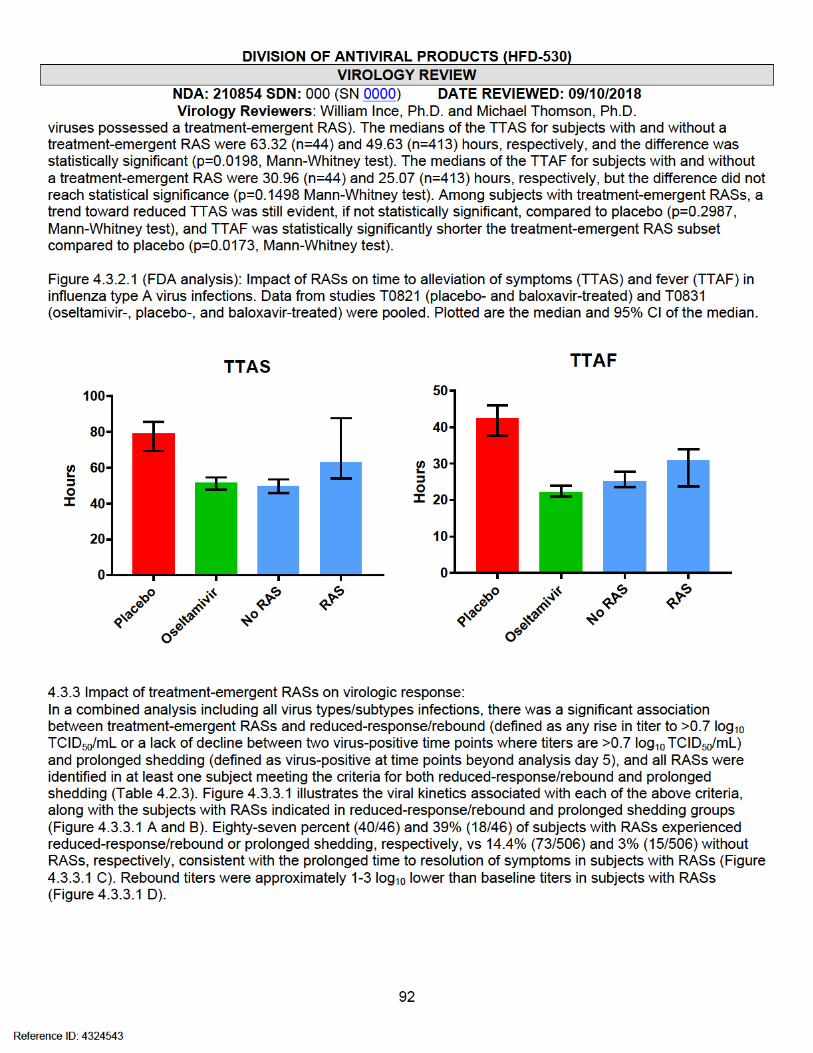

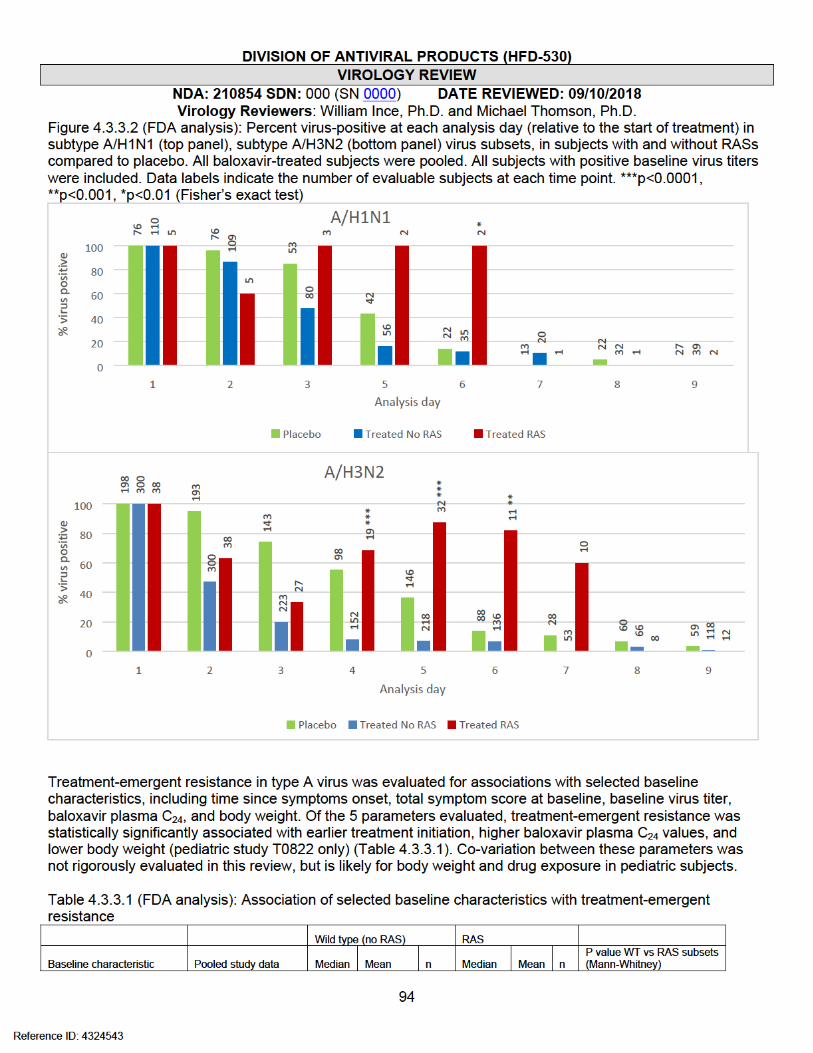
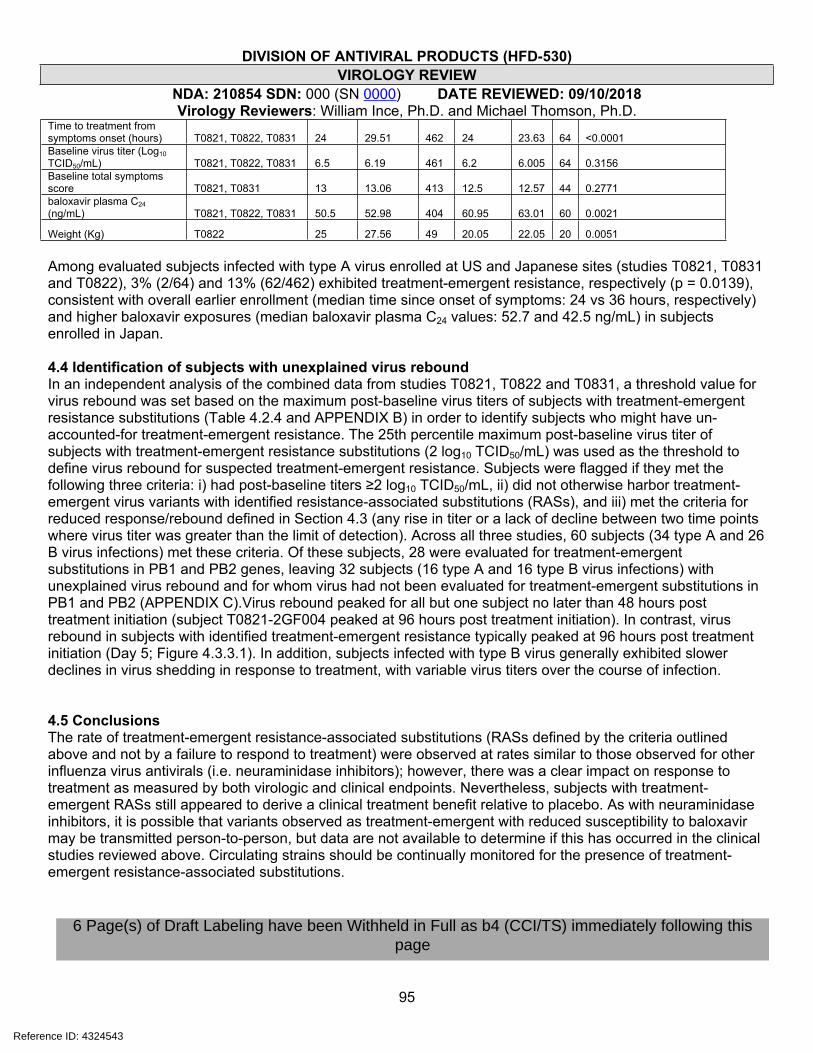
DIVISION OF ANTIVIRAL PRODUCTS (HFD-530)VIROLOGY REVIEW
NDA: 210854 SDN: 000 (SN 0000) DATE REVIEWED: 09/10/2018Virology Reviewers: William Ince, Ph.D. and Michael Thomson, Ph.D.
95
Time to treatment from symptoms onset (hours) T0821, T0822, T0831 24 29.51 462 24 23.63 64 <0.0001Baseline virus titer (Log10 TCID50/mL) T0821, T0822, T0831 6.5 6.19 461 6.2 6.005 64 0.3156Baseline total symptoms score T0821, T0831 13 13.06 413 12.5 12.57 44 0.2771baloxavir plasma C24 (ng/mL) T0821, T0822, T0831 50.5 52.98 404 60.95 63.01 60 0.0021
Weight (Kg) T0822 25 27.56 49 20.05 22.05 20 0.0051
Among evaluated subjects infected with type A virus enrolled at US and Japanese sites (studies T0821, T0831 and T0822), 3% (2/64) and 13% (62/462) exhibited treatment-emergent resistance, respectively (p = 0.0139), consistent with overall earlier enrollment (median time since onset of symptoms: 24 vs 36 hours, respectively) and higher baloxavir exposures (median baloxavir plasma C24 values: 52.7 and 42.5 ng/mL) in subjects enrolled in Japan.
4.4 Identification of subjects with unexplained virus reboundIn an independent analysis of the combined data from studies T0821, T0822 and T0831, a threshold value for virus rebound was set based on the maximum post-baseline virus titers of subjects with treatment-emergent resistance substitutions (Table 4.2.4 and APPENDIX B) in order to identify subjects who might have un-accounted-for treatment-emergent resistance. The 25th percentile maximum post-baseline virus titer of subjects with treatment-emergent resistance substitutions (2 log10 TCID50/mL) was used as the threshold to define virus rebound for suspected treatment-emergent resistance. Subjects were flagged if they met the following three criteria: i) had post-baseline titers ≥2 log10 TCID50/mL, ii) did not otherwise harbor treatment-emergent virus variants with identified resistance-associated substitutions (RASs), and iii) met the criteria for reduced response/rebound defined in Section 4.3 (any rise in titer or a lack of decline between two time points where virus titer was greater than the limit of detection). Across all three studies, 60 subjects (34 type A and 26 B virus infections) met these criteria. Of these subjects, 28 were evaluated for treatment-emergent substitutions in PB1 and PB2 genes, leaving 32 subjects (16 type A and 16 type B virus infections) with unexplained virus rebound and for whom virus had not been evaluated for treatment-emergent substitutions in PB1 and PB2 (APPENDIX C).Virus rebound peaked for all but one subject no later than 48 hours post treatment initiation (subject T0821-2GF004 peaked at 96 hours post treatment initiation). In contrast, virus rebound in subjects with identified treatment-emergent resistance typically peaked at 96 hours post treatment initiation (Day 5; Figure 4.3.3.1). In addition, subjects infected with type B virus generally exhibited slower declines in virus shedding in response to treatment, with variable virus titers over the course of infection.
4.5 ConclusionsThe rate of treatment-emergent resistance-associated substitutions (RASs defined by the criteria outlined above and not by a failure to respond to treatment) were observed at rates similar to those observed for other influenza virus antivirals (i.e. neuraminidase inhibitors); however, there was a clear impact on response to treatment as measured by both virologic and clinical endpoints. Nevertheless, subjects with treatment-emergent RASs still appeared to derive a clinical treatment benefit relative to placebo. As with neuraminidase inhibitors, it is possible that variants observed as treatment-emergent with reduced susceptibility to baloxavir may be transmitted person-to-person, but data are not available to determine if this has occurred in the clinical studies reviewed above. Circulating strains should be continually monitored for the presence of treatment-emergent resistance-associated substitutions.
Reference ID: 4324543
6 Page(s) of Draft Labeling have been Withheld in Full as b4 (CCI/TS) immediately following this page
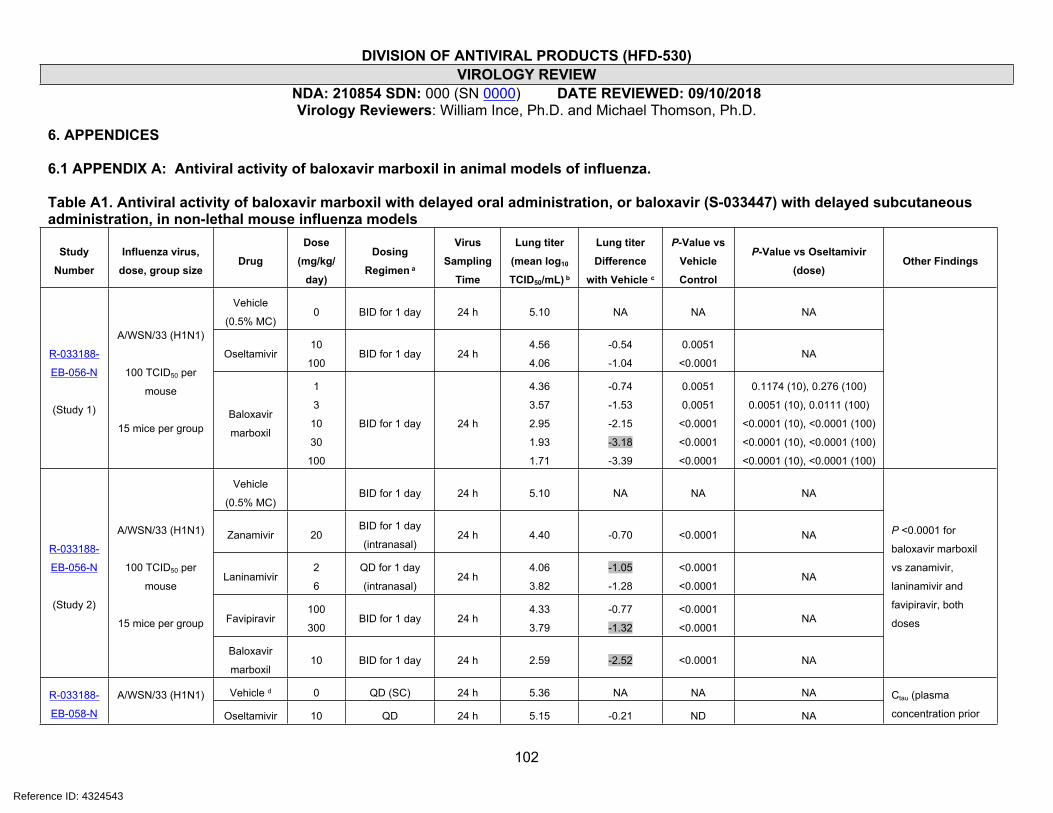
DIVISION OF ANTIVIRAL PRODUCTS (HFD-530)VIROLOGY REVIEW
NDA: 210854 SDN: 000 (SN 0000) DATE REVIEWED: 09/10/2018Virology Reviewers: William Ince, Ph.D. and Michael Thomson, Ph.D.
102
6. APPENDICES
6.1 APPENDIX A: Antiviral activity of baloxavir marboxil in animal models of influenza.
Table A1. Antiviral activity of baloxavir marboxil with delayed oral administration, or baloxavir (S-033447) with delayed subcutaneous administration, in non-lethal mouse influenza models
Study
Number
Influenza virus,
dose, group sizeDrug
Dose
(mg/kg/
day)
Dosing
Regimen a
Virus
Sampling
Time
Lung titer
(mean log10
TCID50/mL) b
Lung titer
Difference
with Vehicle c
P-Value vs
Vehicle
Control
P-Value vs Oseltamivir
(dose)Other Findings
Vehicle
(0.5% MC)0 BID for 1 day 24 h 5.10 NA NA NA
Oseltamivir10
100BID for 1 day 24 h
4.56
4.06
-0.54
-1.04
0.0051
<0.0001NAR-033188-
EB-056-N
(Study 1)
A/WSN/33 (H1N1)
100 TCID50 per
mouse
15 mice per groupBaloxavir
marboxil
1
3
10
30
100
BID for 1 day 24 h
4.36
3.57
2.95
1.93
1.71
-0.74
-1.53
-2.15
-3.18
-3.39
0.0051
0.0051
<0.0001
<0.0001
<0.0001
0.1174 (10), 0.276 (100)
0.0051 (10), 0.0111 (100)
<0.0001 (10), <0.0001 (100)
<0.0001 (10), <0.0001 (100)
<0.0001 (10), <0.0001 (100)
Vehicle
(0.5% MC)BID for 1 day 24 h 5.10 NA NA NA
Zanamivir 20BID for 1 day
(intranasal)24 h 4.40 -0.70 <0.0001 NA
Laninamivir2
6
QD for 1 day
(intranasal)24 h
4.06
3.82
-1.05
-1.28
<0.0001
<0.0001NA
Favipiravir100
300BID for 1 day 24 h
4.33
3.79
-0.77
-1.32
<0.0001
<0.0001NA
R-033188-
EB-056-N
(Study 2)
A/WSN/33 (H1N1)
100 TCID50 per
mouse
15 mice per group
Baloxavir
marboxil10 BID for 1 day 24 h 2.59 -2.52 <0.0001 NA
P <0.0001 for
baloxavir marboxil
vs zanamivir,
laninamivir and
favipiravir, both
doses
Vehicle d 0 QD (SC) 24 h 5.36 NA NA NAR-033188-
EB-058-N
A/WSN/33 (H1N1)
Oseltamivir 10 QD 24 h 5.15 -0.21 ND NA
Ctau (plasma
concentration prior
Reference ID: 4324543

DIVISION OF ANTIVIRAL PRODUCTS (HFD-530)VIROLOGY REVIEW
NDA: 210854 SDN: 000 (SN 0000) DATE REVIEWED: 09/10/2018Virology Reviewers: William Ince, Ph.D. and Michael Thomson, Ph.D.
103
0.25
QD (SC)
BID (SC)
QID (SC)
24 h
3.90
3.90
3.91
-1.46
-1.46
-1.45
ND ND
0.5
QD (SC)
BID (SC)
QID (SC)
24 h
4.12
3.37
3.68
-1.24
-1.99
-1.68
ND ND
1.0
QD (SC)
BID (SC)
QID (SC)
24 h
4.11
3.29
3.29
-1.25
-2.07
-2.07
ND ND
2.0
QD (SC)
BID (SC)
QID (SC)
24 h
3.51
2.39
2.67
-1.85
-2.97
-2.69
ND ND
4.0
QD (SC)
BID (SC)
QID (SC)
24 h
3.71
2.11
2.80
-1.65
-3.25
-2.56
ND ND
(PD/PK
study)
100 TCID50 per
mouse
5 mice per group
baloxavir
8.0
QD (SC)
BID (SC)
QID (SC)
24 h
2.90
2.42
2.50
-2.46
-2.94
-2.86
ND ND
to second
administration or 24
hrs for single dose)
is the best PK
parameter for
predicting virus titers
at 24 hours after first
administration of
drug
Not treated 0 NA 0 h 7.20 NA NA NA
Vehicle
(0.5% MC)0 BID for 1 day
24 h
48 h
72 h
5.41
3.30
1.57
NA NA NA
Oseltamivir 10 BID for 3 days
24 h
48 h
72 h
5.38
3.01
1.60
-0.03
0.01
0.03
ND NA
BID for 1 day
24 h
48 h
72 h
3.62
2.01
1.50
-1.79
-1.29
-0.07
<0.0001
<0.0001
ND
<0.0001
0.0021
ND
R-033188-
EB-067-N
A/Osaka/129/2009
(H1N1)
4.3 x 10³ TCID50
per mouse
5 mice per
sampling group Baloxavir
marboxil1
BID for 3 days48 h
72 h
1.60
1.50
-1.70
-0.07
<0.0001
ND
<0.0001
ND
Reference ID: 4324543
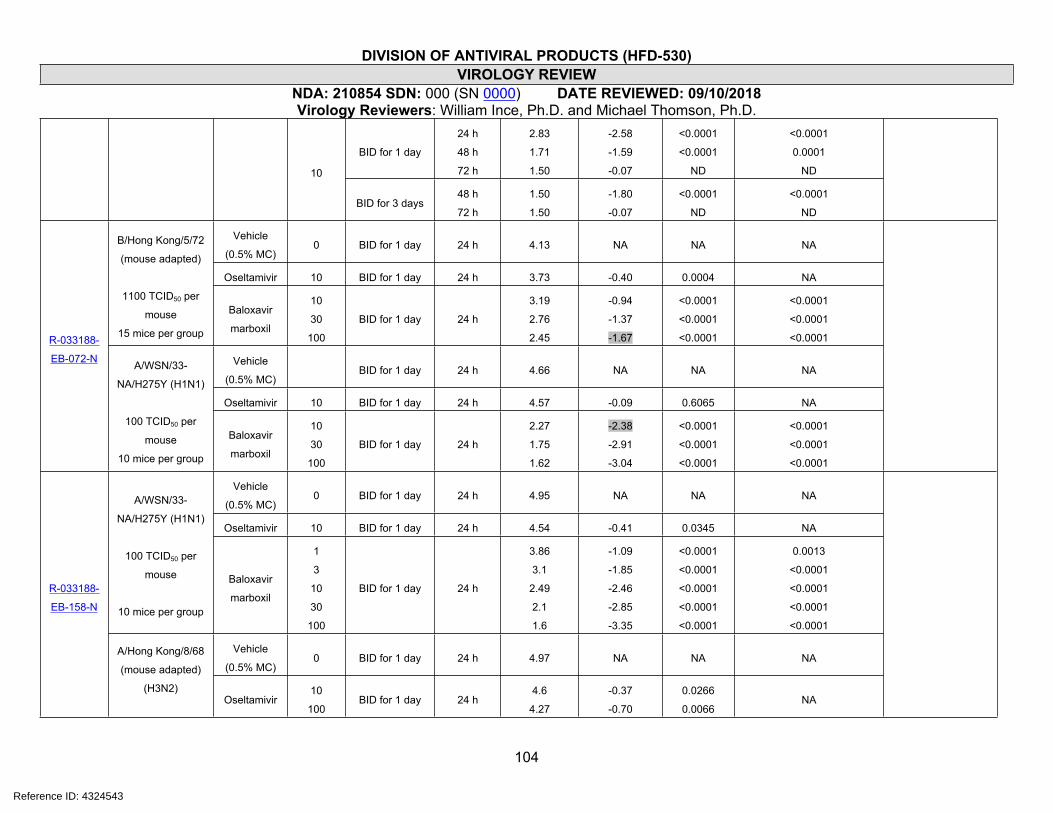
DIVISION OF ANTIVIRAL PRODUCTS (HFD-530)VIROLOGY REVIEW
NDA: 210854 SDN: 000 (SN 0000) DATE REVIEWED: 09/10/2018Virology Reviewers: William Ince, Ph.D. and Michael Thomson, Ph.D.
104
BID for 1 day
24 h
48 h
72 h
2.83
1.71
1.50
-2.58
-1.59
-0.07
<0.0001
<0.0001
ND
<0.0001
0.0001
ND10
BID for 3 days48 h
72 h
1.50
1.50
-1.80
-0.07
<0.0001
ND
<0.0001
ND
Vehicle
(0.5% MC)0 BID for 1 day 24 h 4.13 NA NA NA
Oseltamivir 10 BID for 1 day 24 h 3.73 -0.40 0.0004 NA
B/Hong Kong/5/72
(mouse adapted)
1100 TCID50 per
mouse
15 mice per group
Baloxavir
marboxil
10
30
100
BID for 1 day 24 h
3.19
2.76
2.45
-0.94
-1.37
-1.67
<0.0001
<0.0001
<0.0001
<0.0001
<0.0001
<0.0001
Vehicle
(0.5% MC)BID for 1 day 24 h 4.66 NA NA NA
Oseltamivir 10 BID for 1 day 24 h 4.57 -0.09 0.6065 NA
R-033188-
EB-072-N A/WSN/33-
NA/H275Y (H1N1)
100 TCID50 per
mouse
10 mice per group
Baloxavir
marboxil
10
30
100
BID for 1 day 24 h
2.27
1.75
1.62
-2.38
-2.91
-3.04
<0.0001
<0.0001
<0.0001
<0.0001
<0.0001
<0.0001
Vehicle
(0.5% MC)0 BID for 1 day 24 h 4.95 NA NA NA
Oseltamivir 10 BID for 1 day 24 h 4.54 -0.41 0.0345 NA
A/WSN/33-
NA/H275Y (H1N1)
100 TCID50 per
mouse
10 mice per group
Baloxavir
marboxil
1
3
10
30
100
BID for 1 day 24 h
3.86
3.1
2.49
2.1
1.6
-1.09
-1.85
-2.46
-2.85
-3.35
<0.0001
<0.0001
<0.0001
<0.0001
<0.0001
0.0013
<0.0001
<0.0001
<0.0001
<0.0001
Vehicle
(0.5% MC)0 BID for 1 day 24 h 4.97 NA NA NA
R-033188-
EB-158-N
A/Hong Kong/8/68
(mouse adapted)
(H3N2)Oseltamivir
10
100BID for 1 day 24 h
4.6
4.27
-0.37
-0.70
0.0266
0.0066NA
Reference ID: 4324543
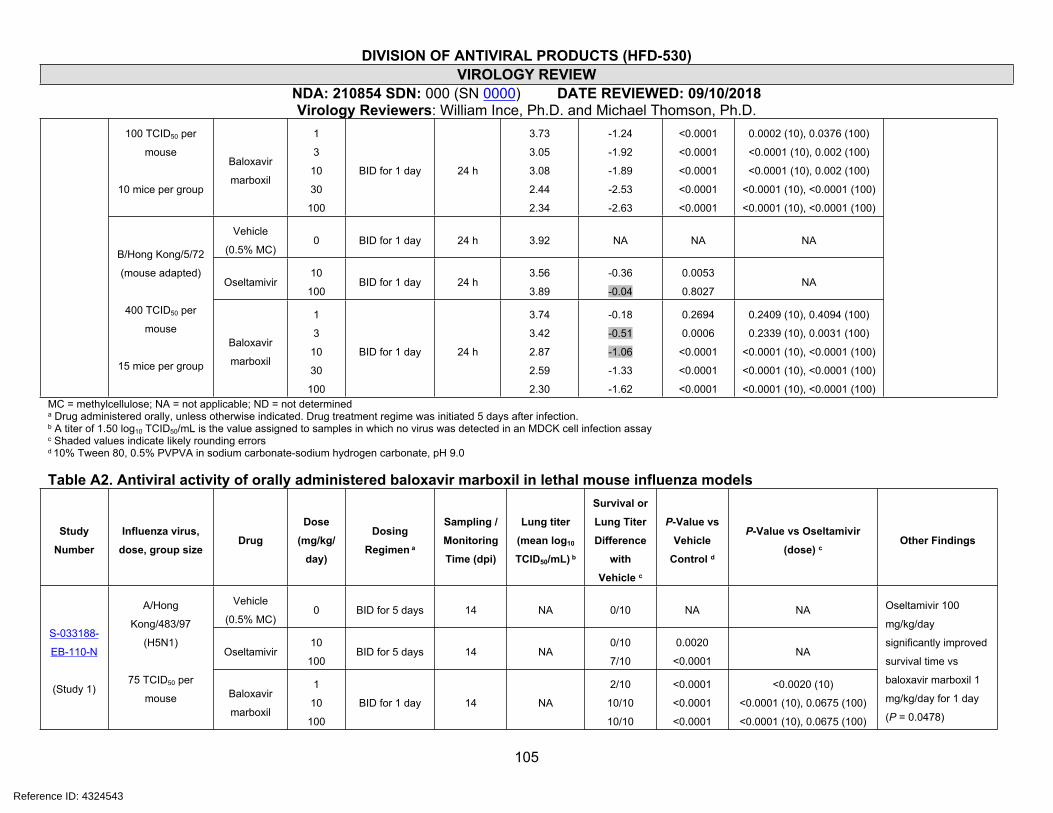
DIVISION OF ANTIVIRAL PRODUCTS (HFD-530)VIROLOGY REVIEW
NDA: 210854 SDN: 000 (SN 0000) DATE REVIEWED: 09/10/2018Virology Reviewers: William Ince, Ph.D. and Michael Thomson, Ph.D.
105
100 TCID50 per
mouse
10 mice per group
Baloxavir
marboxil
1
3
10
30
100
BID for 1 day 24 h
3.73
3.05
3.08
2.44
2.34
-1.24
-1.92
-1.89
-2.53
-2.63
<0.0001
<0.0001
<0.0001
<0.0001
<0.0001
0.0002 (10), 0.0376 (100)
<0.0001 (10), 0.002 (100)
<0.0001 (10), 0.002 (100)
<0.0001 (10), <0.0001 (100)
<0.0001 (10), <0.0001 (100)
Vehicle
(0.5% MC)0 BID for 1 day 24 h 3.92 NA NA NA
Oseltamivir10
100BID for 1 day 24 h
3.56
3.89
-0.36
-0.04
0.0053
0.8027NA
B/Hong Kong/5/72
(mouse adapted)
400 TCID50 per
mouse
15 mice per group
Baloxavir
marboxil
1
3
10
30
100
BID for 1 day 24 h
3.74
3.42
2.87
2.59
2.30
-0.18
-0.51
-1.06
-1.33
-1.62
0.2694
0.0006
<0.0001
<0.0001
<0.0001
0.2409 (10), 0.4094 (100)
0.2339 (10), 0.0031 (100)
<0.0001 (10), <0.0001 (100)
<0.0001 (10), <0.0001 (100)
<0.0001 (10), <0.0001 (100)MC = methylcellulose; NA = not applicable; ND = not determineda Drug administered orally, unless otherwise indicated. Drug treatment regime was initiated 5 days after infection.b A titer of 1.50 log10 TCID50/mL is the value assigned to samples in which no virus was detected in an MDCK cell infection assayc Shaded values indicate likely rounding errorsd 10% Tween 80, 0.5% PVPVA in sodium carbonate-sodium hydrogen carbonate, pH 9.0
Table A2. Antiviral activity of orally administered baloxavir marboxil in lethal mouse influenza models
Study
Number
Influenza virus,
dose, group sizeDrug
Dose
(mg/kg/
day)
Dosing
Regimen a
Sampling /
Monitoring
Time (dpi)
Lung titer
(mean log10
TCID50/mL) b
Survival or
Lung Titer
Difference
with
Vehicle c
P-Value vs
Vehicle
Control d
P-Value vs Oseltamivir
(dose) cOther Findings
Vehicle
(0.5% MC)0 BID for 5 days 14 NA 0/10 NA NA
Oseltamivir10
100BID for 5 days 14 NA
0/10
7/10
0.0020
<0.0001NA
S-033188-
EB-110-N
(Study 1)
A/Hong
Kong/483/97
(H5N1)
75 TCID50 per
mouse Baloxavir
marboxil
1
10
100
BID for 1 day 14 NA
2/10
10/10
10/10
<0.0001
<0.0001
<0.0001
<0.0020 (10)
<0.0001 (10), 0.0675 (100)
<0.0001 (10), 0.0675 (100)
Oseltamivir 100
mg/kg/day
significantly improved
survival time vs
baloxavir marboxil 1
mg/kg/day for 1 day
(P = 0.0478)
Reference ID: 4324543

DIVISION OF ANTIVIRAL PRODUCTS (HFD-530)VIROLOGY REVIEW
NDA: 210854 SDN: 000 (SN 0000) DATE REVIEWED: 09/10/2018Virology Reviewers: William Ince, Ph.D. and Michael Thomson, Ph.D.
106
10 mice per group 1
10
100
BID for 5 days 14 NA
6/10
10/10
9/9
<0.0001
<0.0001
<0.0001
<0.0001 (10), 0.7706 (100)
<0.0001 (10), 0.0675 (100)
<0.0001 (10), 0.0824 (100)
Vehicle
(0.5% MC)0
BID for 1 day
BID for 3 days
BID for 5 days
1
3
5
4.51
5.33
4.70
NA NA NA
10
BID for 1 day
BID for 3 days
BID for 5 days
1
3
5
3.00
4.83
5.18
-1.51
-0.50
0.48
0.0003
0.1086
0.0388
NA
Oseltamivir
100
BID for 1 day
BID for 3 days
BID for 5 days
1
3
5
1.93
4.14
3.80
-2.58
-1.19
-0.90
<0.0001
0.0026
0.0022
NA
1 BID for 1 day
1
3
5
2.48
3.83
4.57
-2.03
-1.50
-0.13
0.0003
0.0331
0.8450
0.1950 (10), 0.1706 (100)
0.1281 (10), 0.6188 (100)
0.3998 (10), 0.2983 (100)
10 BID for 1 day
1
3
5
1.50
2.25
1.70
-3.01
-3.08
-3.00
<0.0001
0.0004
<0.0001
0.0001 (10), 0.0636 (100)
0.0014 (10), 0.0083 (100)
<0.0001 (10), <0.0001 (100)
100 BID for 1 day
1
3
5
1.50
1.50
1.50
-3.01
-3.83
-3.20
<0.0001
<0.0001
<0.0001
0.0001 (10), 0.0636 (100)
<0.0001 (10), <0.0001 (100)
<0.0001 (10), <0.0001 (100)
1BID for 3 days
BID for 5 days
3
5
3.31
3.00
-2.02
-1.70
<0.0001
0.0025
0.0005 (10), 0.0157 (100)
0.0010 (10), 0.1059 (100)
10BID for 3 days
BID for 5 days
3
5
1.53
1.50
-3.80
-3.20
<0.0001
<0.0001
<0.0001 (10), <0.0001 (100)
<0.0001 (10), <0.0001 (100)
S-033188-
EB-110-N
(Study 2)
A/Hong
Kong/483/97
(H5N1)
75 TCID50 per
mouse
5 mice per groupBaloxavir
marboxil
100BID for 3 days
BID for 5 days
3
5
1.50
1.50
-3.83
-3.20
<0.0001
<0.0001
<0.0001 (10), <0.0001 (100)
<0.0001 (10), <0.0001 (100)
Overall P <0.0001 for
baloxavir marboxil 10
or 100 mg/kg/day for
1 or 5 days vs
oseltamivir 10 or 100
mg/kg/day for 5 days;
for 1 mg/kg/day, P =
0.0012 or <0.0001 for
1 or 5 days,
respectively vs
oseltamivir 10
mg/kg/day, and not
significant vs
oseltamivir 100
mg/kg/day
Vehicle
(0.5% MC)0 BID for 1 day 14 NA 0/10 NA NAS-033188-
EB-114-N
B/Hong Kong/5/72
(mouse adapted)
Oseltamivir 10 BID for 5 days 14 NA 10/10 <0.0001 NA
Oseltamivir 10
mg/kg/day
significantly improved
Reference ID: 4324543

DIVISION OF ANTIVIRAL PRODUCTS (HFD-530)VIROLOGY REVIEW
NDA: 210854 SDN: 000 (SN 0000) DATE REVIEWED: 09/10/2018Virology Reviewers: William Ince, Ph.D. and Michael Thomson, Ph.D.
107
3.3 x 10⁵ TCID50
per mouse
10 mice per group
Baloxavir
marboxil
1
10
100
BID for 1 day 14 NA
2/10
10/10
10/10
<0.0010
<0.0001
<0.0001
-
-
-
survival time vs
baloxavir marboxil 1
mg/kg/day (P =
0.0003)
Vehicle
(0.5% MC)0 BID for 1 day 14 NA 0/10 NA NA
Oseltamivir10
100BID for 5 days 14 NA
2/10
7/10
<0.0500
<0.0010NA
B/Hong Kong/5/72
(mouse adapted)
1.98 x 10⁶ TCID50
per mouse
10 mice per group
Baloxavir
marboxil
1
10
100
BID for 1 day 14 NA
0/10
10/10
10/10
0.0165
<0.0001
<0.0001
-
<0.0005 (10)
<0.0005 (10)
Oseltamivir 100
mg/kg/day
significantly improved
survival time vs
baloxavir marboxil 1
mg/kg/day (P =
0.0005)
Vehicle
(0.5% MC)0 BID for 1 day 21 NA 0/10 NA NA
Oseltamivir 10 BID for 5 days 21 NA 9/10 <0.0010 NA
A/Puerto Rico/8/34
(H1N1)
1.38 x 10³ TCID50
per mouse
10 mice per group
Baloxavir
marboxil
0.1
1
10
BID for 1 day 21 NA
3/10
10/10
9/9
<0.0500
<0.0010
<0.0010
-
0.3173 (10)
0.3428 (10)
Oseltamivir 10
mg/kg/day
significantly improved
survival time vs
baloxavir marboxil 0.1
mg/kg/day (P =
0.0162)
Vehicle
(0.5% MC)0 BID for 1 day 21 NA 0/10 NA NA
Oseltamivir10
100BID for 5 days 21 NA
2/10
8/10
<0.0010
<0.0010NA
S-033188-
EB-124-N A/Puerto Rico/8/34
(H1N1)
4.42 x 10⁴ TCID50
per mouse
10 mice per group
Baloxavir
marboxil
0.1
1
10
BID for 1 day 21 NA
0/10
10/10
10/10
0.0057
<0.0001
<0.0001
-
<0.0005 (10)
<0.0005 (10)
Oseltamivir 100
mg/kg/day
significantly improved
survival time vs
baloxavir marboxil 0.1
mg/kg/day (P <
0.0001)
Vehicle
(0.5% MC)0 BID for 5 days 28 NA 0/10 NA NA
Oseltamivir10
100BID for 5 days 28 NA
3/10
5/10
0.0117
0.0005NA
S-033188-
EB-226-N
(Study 1)
A/Anhui/1/2013
(H7N9)
4 x 10⁵ TCID50 per
mouse Baloxavir
marboxil
1
10BID for 1 day 28 NA
9/10
10/10
<0.0001
<0.0001
0.0044 (10), 0.0488 (100)
0.0012 (10), 0.0118 (100)
Reference ID: 4324543

DIVISION OF ANTIVIRAL PRODUCTS (HFD-530)VIROLOGY REVIEW
NDA: 210854 SDN: 000 (SN 0000) DATE REVIEWED: 09/10/2018Virology Reviewers: William Ince, Ph.D. and Michael Thomson, Ph.D.
108
100 10/10 <0.0001 0.0012 (10), 0.0118 (100)10 mice per group
1
10
100
BID for 5 days 28 NA
10/10
10/10
10/10
<0.0001
<0.0001
<0.0001
0.0012 (10), 0.0118 (100)
0.0012 (10), 0.0118 (100)
0.0012 (10), 0.0118 (100)
Vehicle
(0.5% MC)0
BID for 1 day
BID for 3 days
BID for 5 days
1
3
5
5.63
5.45
4.91
NA NA NA
10
BID for 1 day
BID for 3 days
BID for 5 days
1
3
5
5.35
5.40
4.60
-0.28
-0.05
-0.31
-
-
-
NA
Oseltamivir
100
BID for 1 day
BID for 3 days
BID for 5 days
1
3
5
5.10
5.35
5.10
-0.53
-0.10
0.19
-
-
-
NA
BID for 1 day
1
3
5
4.73
5.39
4.86
-0.89
-0.06
-0.05
0.0001
0.7883
0.8149
0.0065 (10), 0.1105 (100)
0.9535 (10), 0.8572 (100)
0.2368 (10), 0.2969 (100)1
BID for 3 days
BID for 5 days
3
5
4.21
4.03
-1.23
-0.88
<0.0001
0.0001
<0.0001 (10), <0.0001 (100)
0.0115 (10), <0.0001 (100)
BID for 1 day
1
3
5
1.63
4.73
4.74
-4.00
-0.71
-0.18
<0.0001
0.0016
0.4263
<0.0001 (10), <0.0001 (100)
0.0032 (10), 0.0085 (100)
0.5316 (10), 0.1148 (100)10
BID for 3 days
BID for 5 days
3
5
2.35
2.69
-3.10
-2.22
<0.0001
<0.0001
<0.0001 (10), <0.0001 (100)
<0.0001 (10), <0.0001 (100)
BID for 1 day
1
3
5
1.50
3.63
4.03
-4.13
-1.81
-0.88
<0.0001
<0.0001
0.0001
<0.0001 (10), <0.0001 (100)
<0.0001 (10), <0.0001 (100)
0.0115 (10), <0.0001 (100)
S-033188-
EB-226-N
(Study 2)
A/Anhui/1/2013
(H7N9)
4 x 10⁵ TCID50 per
mouse
5 mice per group
Baloxavir
marboxil
100
BID for 3 days
BID for 5 days
3
5
1.50
1.53
-3.95
-3.38
<0.0001
<0.0001
<0.0001 (10), <0.0001 (100)
<0.0001 (10), <0.0001 (100
Overall, baloxavir
marboxil 10 and 100
mg/kg/day for 1 day
and 1 mg/kg/day for 5
days significantly
reduced virus titers vs
vehicle or oseltamivir
10 and 100
mg/kg/day (P
<0.0001); for
baloxavir marboxil 1
mg/kg/day for 1 day
vs vehicle, oseltamivir
10 or 100 mg/kg/day,
P = 0.0098, 0.3405
and 0.1555,
respectively; for
oseltamivir 10 and
100 mg/kg/day vs
vehicle, P = 0.0433
and 0.1590,
respectively.
- No statistical analysis data (difference between groups too small, or no comparator data, or comparator drug performed better than baloxavir marboxila Drug administered immediately after virus infectionb A titer of 1.50 log10 TCID50/mL is the value assigned to samples in which no virus was detected in an MDCK cell infection assay
Reference ID: 4324543

DIVISION OF ANTIVIRAL PRODUCTS (HFD-530)VIROLOGY REVIEW
NDA: 210854 SDN: 000 (SN 0000) DATE REVIEWED: 09/10/2018Virology Reviewers: William Ince, Ph.D. and Michael Thomson, Ph.D.
109
c Shaded values indicate likely rounding errorsd For the mortality endpoint, statistical analyses were performed on survival time comparisons. P < 0.05 indicates significance
Table A3. Antiviral activity of baloxavir marboxil with delayed oral administration in lethal mouse influenza models
Study
Number
Influenza virus,
dose, group sizeDrug
Dose
(mg/kg/
day)
Dosing
Regimen
Sampling /
Monitoring
Time (dpi)
Lung titer
(mean log10
TCID50/mL) a
Survival or
Lung Titer
Difference
with
Vehicle
P-Value vs
Vehicle
Control b
P-Value vs Oseltamivir
(dose) b
Other Findings
Uninfected 0 28 NA 5/5 NA NA
Vehicle
(0.5% MC)0 28 NA 0/10 NA NA
Oseltamivir 10 28 NA 9/10 <0.0001 NA
Baloxavir
marboxil
3
30
BID for 5 days,
first dose 24
hours post
infection 28 NA10/10
10/10
<0.0001
<0.0001
-
-
Vehicle
(0.5% MC)0 28 NA 0/10 NA NA
Oseltamivir 10 28 NA 7/10 <0.0001 NA
Baloxavir
marboxil
3
30
BID for 5 days,
first dose 48
hours post
infection 28 NA10/10
10/10
<0.0001
<0.0001
-
-
Vehicle
(0.5% MC)0 28 NA 0/10 NA NA
Oseltamivir 10 28 NA 1/10 - NA
Baloxavir
marboxil
3
30
BID for 5 days,
first dose 72
hours post
infection 28 NA10/10
10/10
<0.0001
<0.0001
<0.0001 (10)
<0.0001 (10)
Vehicle
(0.5% MC)0 28 NA 0/10 NA NA
Oseltamivir 10 28 NA 1/10 - NA
S-033188-
EB-188-N
A/Puerto Rico/8/34
(H1N1)
1.38 x 10³ TCID50
per mouse
10 mice per group
Baloxavir
marboxil
3
30
BID for 5 days,
first dose 96
hours post
infection 28 NA5/10
7/10
<0.0100
<0.0001
<0.0500 (10)
<0.0100 (10)
Baloxavir marboxil 3
or 30 mg/kg/day
significantly
suppressed body
weight loss from virus
infection compared
with mice dosed with
vehicle for all dosing
initiation times
Reference ID: 4324543
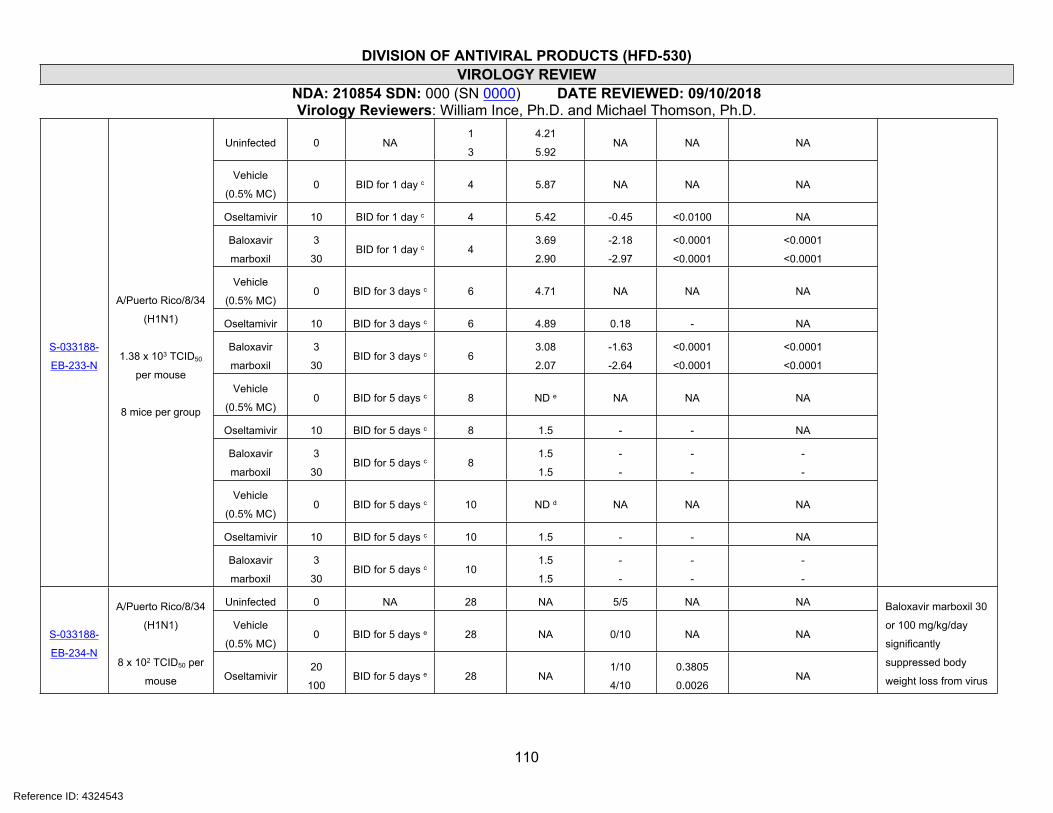
DIVISION OF ANTIVIRAL PRODUCTS (HFD-530)VIROLOGY REVIEW
NDA: 210854 SDN: 000 (SN 0000) DATE REVIEWED: 09/10/2018Virology Reviewers: William Ince, Ph.D. and Michael Thomson, Ph.D.
110
Uninfected 0 NA1
3
4.21
5.92NA NA NA
Vehicle
(0.5% MC)0 BID for 1 day c 4 5.87 NA NA NA
Oseltamivir 10 BID for 1 day c 4 5.42 -0.45 <0.0100 NA
Baloxavir
marboxil
3
30BID for 1 day c 4
3.69
2.90
-2.18
-2.97
<0.0001
<0.0001
<0.0001
<0.0001
Vehicle
(0.5% MC)0 BID for 3 days c 6 4.71 NA NA NA
Oseltamivir 10 BID for 3 days c 6 4.89 0.18 - NA
Baloxavir
marboxil
3
30BID for 3 days c 6
3.08
2.07
-1.63
-2.64
<0.0001
<0.0001
<0.0001
<0.0001
Vehicle
(0.5% MC)0 BID for 5 days c 8 ND e NA NA NA
Oseltamivir 10 BID for 5 days c 8 1.5 - - NA
Baloxavir
marboxil
3
30BID for 5 days c 8
1.5
1.5
-
-
-
-
-
-
Vehicle
(0.5% MC)0 BID for 5 days c 10 ND d NA NA NA
Oseltamivir 10 BID for 5 days c 10 1.5 - - NA
S-033188-
EB-233-N
A/Puerto Rico/8/34
(H1N1)
1.38 x 10³ TCID50
per mouse
8 mice per group
Baloxavir
marboxil
3
30BID for 5 days c 10
1.5
1.5
-
-
-
-
-
-
Uninfected 0 NA 28 NA 5/5 NA NA
Vehicle
(0.5% MC)0 BID for 5 days e 28 NA 0/10 NA NAS-033188-
EB-234-N
A/Puerto Rico/8/34
(H1N1)
8 x 10² TCID50 per
mouse Oseltamivir20
100BID for 5 days e 28 NA
1/10
4/10
0.3805
0.0026NA
Baloxavir marboxil 30
or 100 mg/kg/day
significantly
suppressed body
weight loss from virus
Reference ID: 4324543
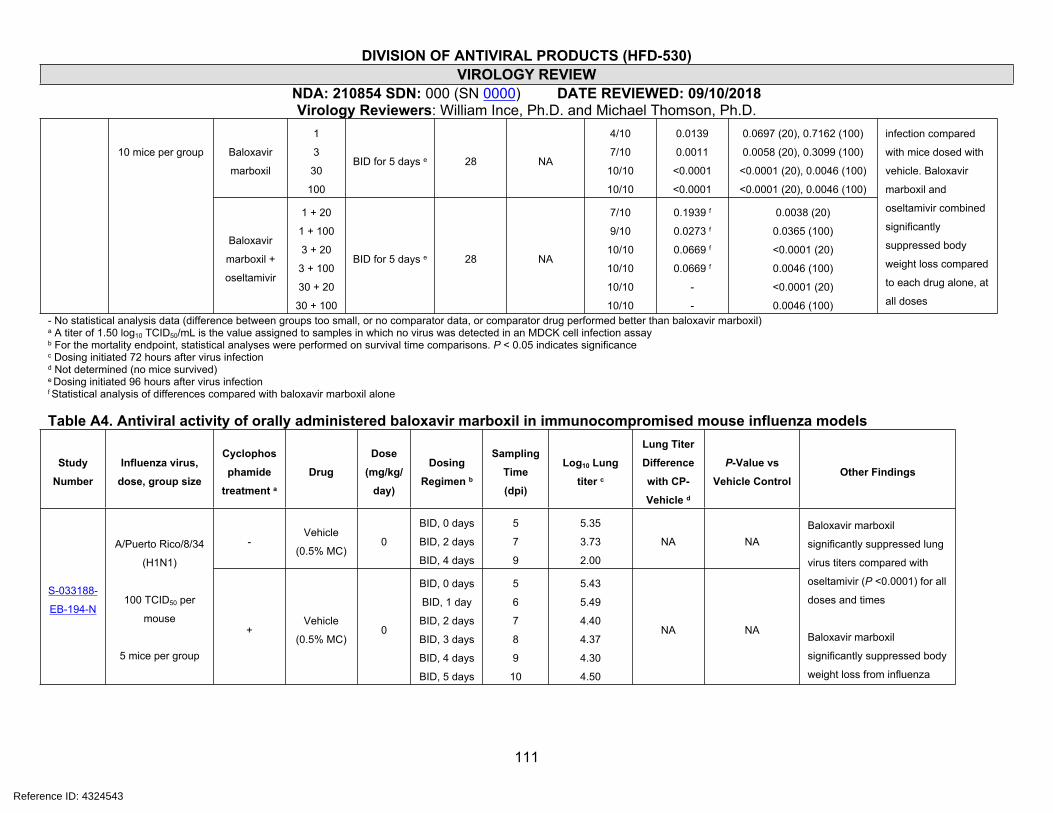
DIVISION OF ANTIVIRAL PRODUCTS (HFD-530)VIROLOGY REVIEW
NDA: 210854 SDN: 000 (SN 0000) DATE REVIEWED: 09/10/2018Virology Reviewers: William Ince, Ph.D. and Michael Thomson, Ph.D.
111
Baloxavir
marboxil
1
3
30
100
BID for 5 days e 28 NA
4/10
7/10
10/10
10/10
0.0139
0.0011
<0.0001
<0.0001
0.0697 (20), 0.7162 (100)
0.0058 (20), 0.3099 (100)
<0.0001 (20), 0.0046 (100)
<0.0001 (20), 0.0046 (100)
10 mice per group
Baloxavir
marboxil +
oseltamivir
1 + 20
1 + 100
3 + 20
3 + 100
30 + 20
30 + 100
BID for 5 days e 28 NA
7/10
9/10
10/10
10/10
10/10
10/10
0.1939 f
0.0273 f
0.0669 f
0.0669 f
-
-
0.0038 (20)
0.0365 (100)
<0.0001 (20)
0.0046 (100)
<0.0001 (20)
0.0046 (100)
infection compared
with mice dosed with
vehicle. Baloxavir
marboxil and
oseltamivir combined
significantly
suppressed body
weight loss compared
to each drug alone, at
all doses
- No statistical analysis data (difference between groups too small, or no comparator data, or comparator drug performed better than baloxavir marboxil)a A titer of 1.50 log10 TCID50/mL is the value assigned to samples in which no virus was detected in an MDCK cell infection assayb For the mortality endpoint, statistical analyses were performed on survival time comparisons. P < 0.05 indicates significancec Dosing initiated 72 hours after virus infectiond Not determined (no mice survived)e Dosing initiated 96 hours after virus infectionf Statistical analysis of differences compared with baloxavir marboxil alone
Table A4. Antiviral activity of orally administered baloxavir marboxil in immunocompromised mouse influenza models
Study
Number
Influenza virus,
dose, group size
Cyclophos
phamide
treatment aDrug
Dose
(mg/kg/
day)
Dosing
Regimen b
Sampling
Time
(dpi)
Log10 Lung
titer c
Lung Titer
Difference
with CP-
Vehicle d
P-Value vs
Vehicle ControlOther Findings
-Vehicle
(0.5% MC)0
BID, 0 days
BID, 2 days
BID, 4 days
5
7
9
5.35
3.73
2.00
NA NA
S-033188-
EB-194-N
A/Puerto Rico/8/34
(H1N1)
100 TCID50 per
mouse
5 mice per group
+Vehicle
(0.5% MC)0
BID, 0 days
BID, 1 day
BID, 2 days
BID, 3 days
BID, 4 days
BID, 5 days
5
6
7
8
9
10
5.43
5.49
4.40
4.37
4.30
4.50
NA NA
Baloxavir marboxil
significantly suppressed lung
virus titers compared with
oseltamivir (P <0.0001) for all
doses and times
Baloxavir marboxil
significantly suppressed body
weight loss from influenza
Reference ID: 4324543

DIVISION OF ANTIVIRAL PRODUCTS (HFD-530)VIROLOGY REVIEW
NDA: 210854 SDN: 000 (SN 0000) DATE REVIEWED: 09/10/2018Virology Reviewers: William Ince, Ph.D. and Michael Thomson, Ph.D.
112
10
BID, 1 day
BID, 2 days
BID, 3 days
BID, 4 days
BID, 5 days
6
7
8
9
10
4.59
4.42
4.73
4.50
3.90
-0.91
0.02
0.37
0.20
-0.60
0.0044
0.9383
0.0490
0.4554
0.2861+ Oseltamivir
100
BID, 1 day
BID, 2 days
BID, 3 days
BID, 4 days
BID, 5 days
6
7
8
9
10
4.91
4.67
4.37
3.45
2.33
-0.58
0.27
0.00
-0.85
-2.17
ND
3
BID, 1 day
BID, 2 days
BID, 3 days
BID, 4 days
BID, 5 days
6
7
8
9
10
3.17
2.93
2.13
1.73
1.57
-2.33
-1.47
-2.23
-2.57
-2.94
<0.0001
<0.0001
<0.0001
<0.0001
<0.0001
30
BID, 1 day
BID, 2 days
BID, 3 days
BID, 4 days
BID, 5 days
6
7
8
9
10
2.40
1.63
1.50
1.50
1.50
-3.09
-2.77
-2.87
-2.80
-3.00
<0.0001
<0.0001
<0.0001
<0.0001
<0.0001
+Baloxavir
marboxil
100
BID, 1 day
BID, 2 days
BID, 3 days
BID, 4 days
BID, 5 days
6
7
8
9
10
1.70
1.53
1.50
1.50
1.50
-3.79
-2.87
-2.87
-2.80
-3.00
<0.0001
<0.0001
<0.0001
<0.0001
<0.0001
virus infection compared with
vehicle or oseltamivir treated
mice at all doses
S-033188-
EB-252-N
(lung
homogen
ates from
S-033188-
A/Puerto Rico/8/34
(H1N1)
100 TCID50 per
mouse
5 mice per group
-Vehicle
(0.5% MC)0
BID, 0 days
BID, 2 days
BID, 4 days
5
7
9
8.79
8.44
7.24
NA NA
No statistical analysis of virus
titers differences between
dosing groups was performed
No amino acid substitutions
in PA were identified in any
sample compared with parent
Reference ID: 4324543
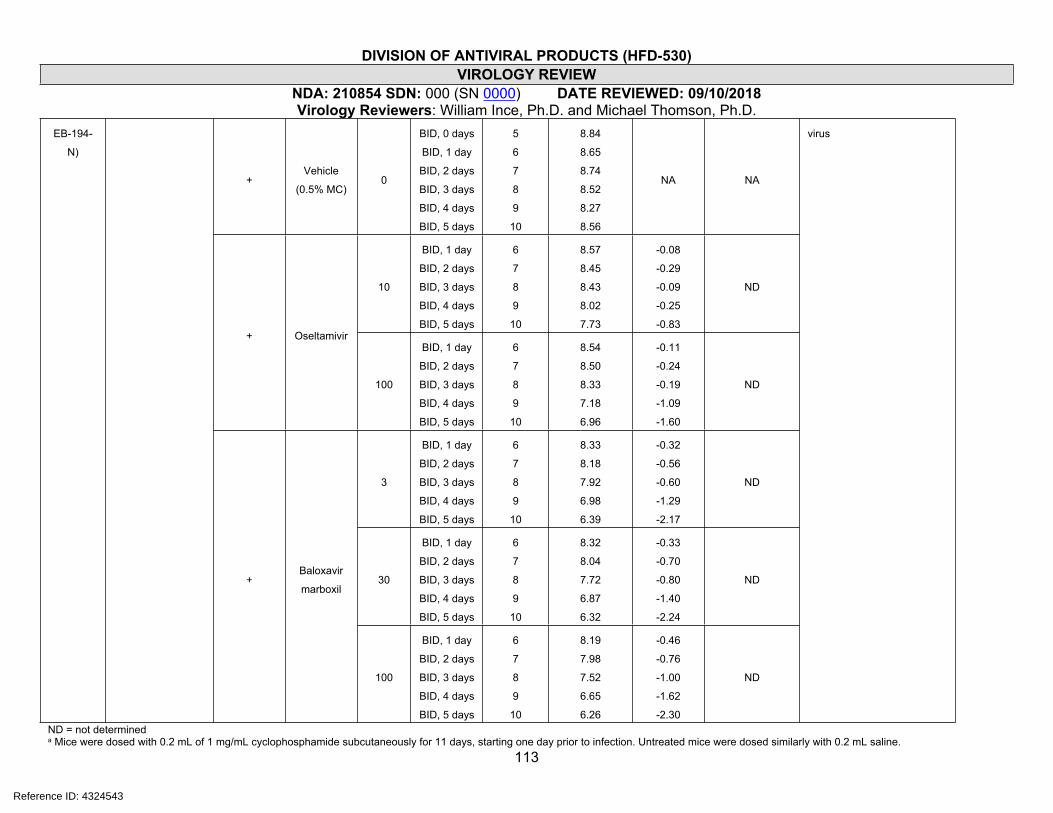
DIVISION OF ANTIVIRAL PRODUCTS (HFD-530)VIROLOGY REVIEW
NDA: 210854 SDN: 000 (SN 0000) DATE REVIEWED: 09/10/2018Virology Reviewers: William Ince, Ph.D. and Michael Thomson, Ph.D.
113
+Vehicle
(0.5% MC)0
BID, 0 days
BID, 1 day
BID, 2 days
BID, 3 days
BID, 4 days
BID, 5 days
5
6
7
8
9
10
8.84
8.65
8.74
8.52
8.27
8.56
NA NA
10
BID, 1 day
BID, 2 days
BID, 3 days
BID, 4 days
BID, 5 days
6
7
8
9
10
8.57
8.45
8.43
8.02
7.73
-0.08
-0.29
-0.09
-0.25
-0.83
ND
+ Oseltamivir
100
BID, 1 day
BID, 2 days
BID, 3 days
BID, 4 days
BID, 5 days
6
7
8
9
10
8.54
8.50
8.33
7.18
6.96
-0.11
-0.24
-0.19
-1.09
-1.60
ND
3
BID, 1 day
BID, 2 days
BID, 3 days
BID, 4 days
BID, 5 days
6
7
8
9
10
8.33
8.18
7.92
6.98
6.39
-0.32
-0.56
-0.60
-1.29
-2.17
ND
30
BID, 1 day
BID, 2 days
BID, 3 days
BID, 4 days
BID, 5 days
6
7
8
9
10
8.32
8.04
7.72
6.87
6.32
-0.33
-0.70
-0.80
-1.40
-2.24
ND
EB-194-
N)
+Baloxavir
marboxil
100
BID, 1 day
BID, 2 days
BID, 3 days
BID, 4 days
BID, 5 days
6
7
8
9
10
8.19
7.98
7.52
6.65
6.26
-0.46
-0.76
-1.00
-1.62
-2.30
ND
virus
ND = not determineda Mice were dosed with 0.2 mL of 1 mg/mL cyclophosphamide subcutaneously for 11 days, starting one day prior to infection. Untreated mice were dosed similarly with 0.2 mL saline.
Reference ID: 4324543
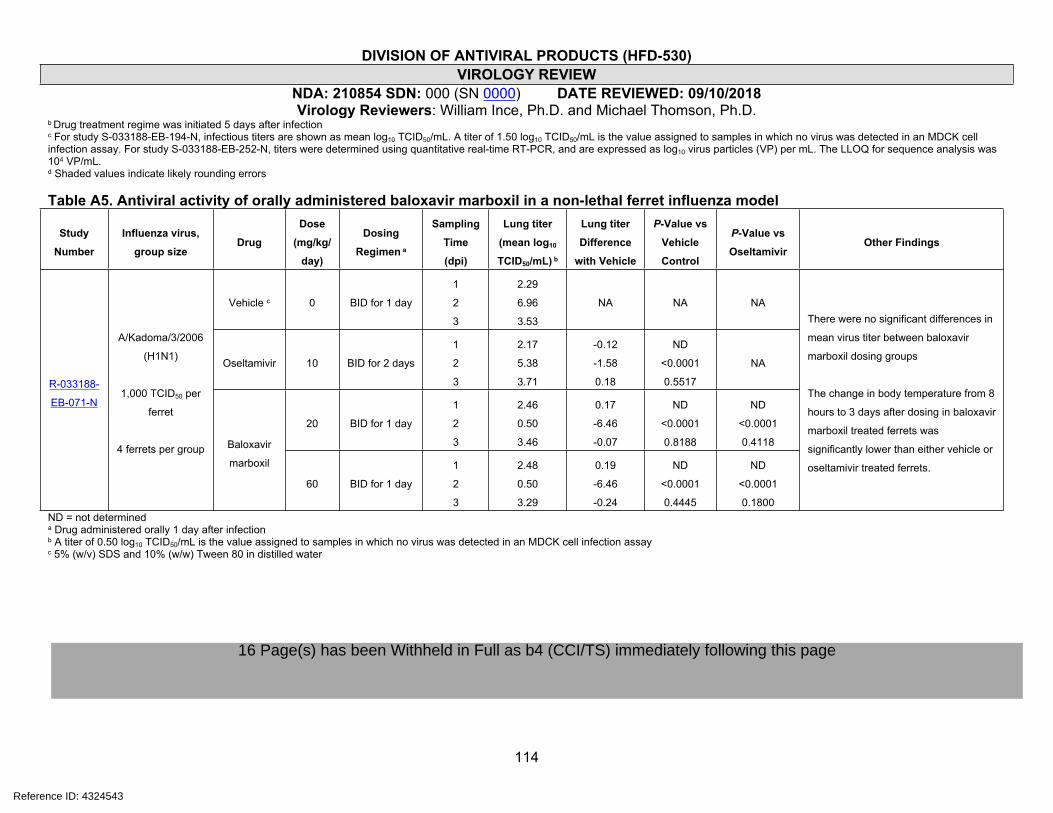
DIVISION OF ANTIVIRAL PRODUCTS (HFD-530)VIROLOGY REVIEW
NDA: 210854 SDN: 000 (SN 0000) DATE REVIEWED: 09/10/2018Virology Reviewers: William Ince, Ph.D. and Michael Thomson, Ph.D.
114
b Drug treatment regime was initiated 5 days after infectionc For study S-033188-EB-194-N, infectious titers are shown as mean log10 TCID50/mL. A titer of 1.50 log10 TCID50/mL is the value assigned to samples in which no virus was detected in an MDCK cell infection assay. For study S-033188-EB-252-N, titers were determined using quantitative real-time RT-PCR, and are expressed as log10 virus particles (VP) per mL. The LLOQ for sequence analysis was 104 VP/mL.d Shaded values indicate likely rounding errors
Table A5. Antiviral activity of orally administered baloxavir marboxil in a non-lethal ferret influenza model
Study
Number
Influenza virus,
group sizeDrug
Dose
(mg/kg/
day)
Dosing
Regimen a
Sampling
Time
(dpi)
Lung titer
(mean log10
TCID50/mL) b
Lung titer
Difference
with Vehicle
P-Value vs
Vehicle
Control
P-Value vs
OseltamivirOther Findings
Vehicle c 0 BID for 1 day
1
2
3
2.29
6.96
3.53
NA NA NA
Oseltamivir 10 BID for 2 days
1
2
3
2.17
5.38
3.71
-0.12
-1.58
0.18
ND
<0.0001
0.5517
NA
20 BID for 1 day
1
2
3
2.46
0.50
3.46
0.17
-6.46
-0.07
ND
<0.0001
0.8188
ND
<0.0001
0.4118
R-033188-
EB-071-N
A/Kadoma/3/2006
(H1N1)
1,000 TCID50 per
ferret
4 ferrets per group Baloxavir
marboxil
60 BID for 1 day
1
2
3
2.48
0.50
3.29
0.19
-6.46
-0.24
ND
<0.0001
0.4445
ND
<0.0001
0.1800
There were no significant differences in
mean virus titer between baloxavir
marboxil dosing groups
The change in body temperature from 8
hours to 3 days after dosing in baloxavir
marboxil treated ferrets was
significantly lower than either vehicle or
oseltamivir treated ferrets.
ND = not determineda Drug administered orally 1 day after infectionb A titer of 0.50 log10 TCID50/mL is the value assigned to samples in which no virus was detected in an MDCK cell infection assayc 5% (w/v) SDS and 10% (w/w) Tween 80 in distilled water
Reference ID: 4324543
16 Page(s) has been Withheld in Full as b4 (CCI/TS) immediately following this page
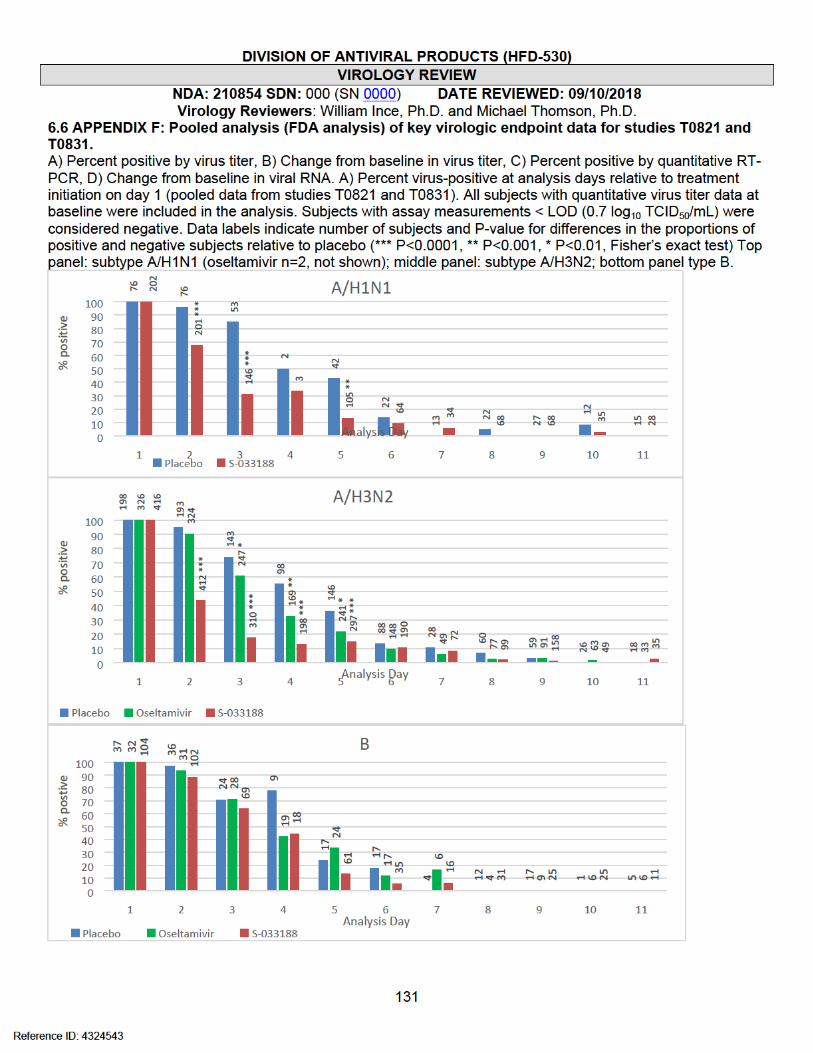
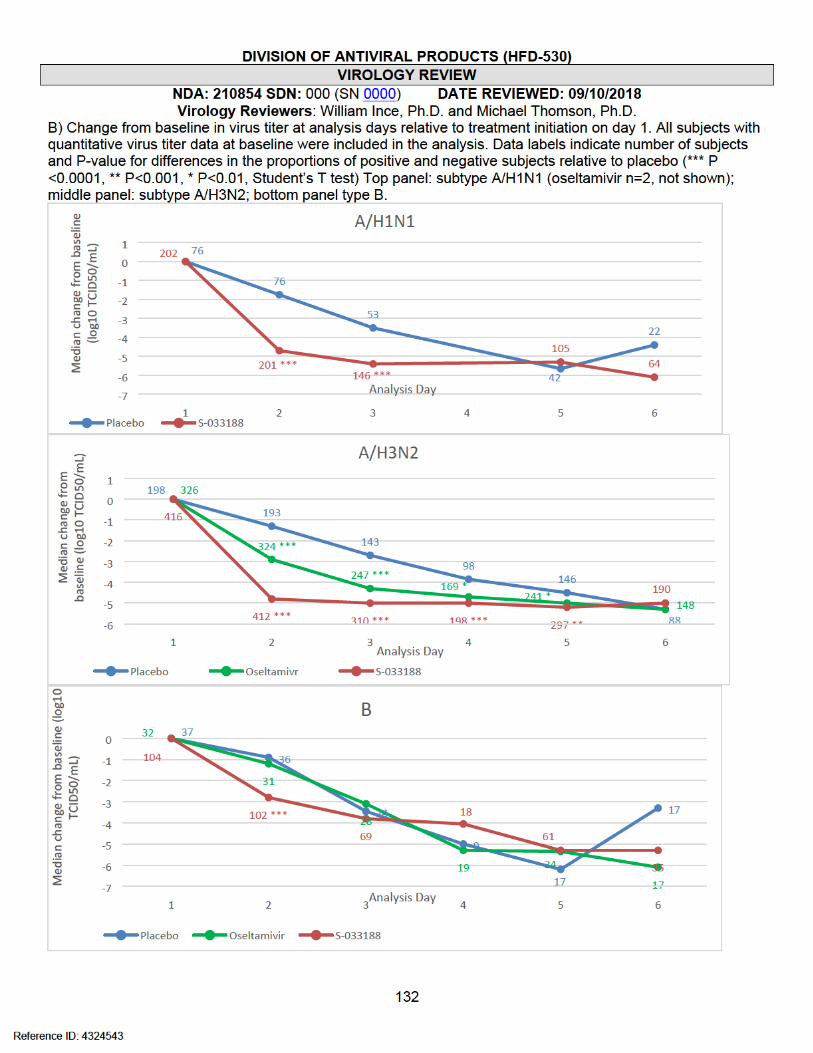


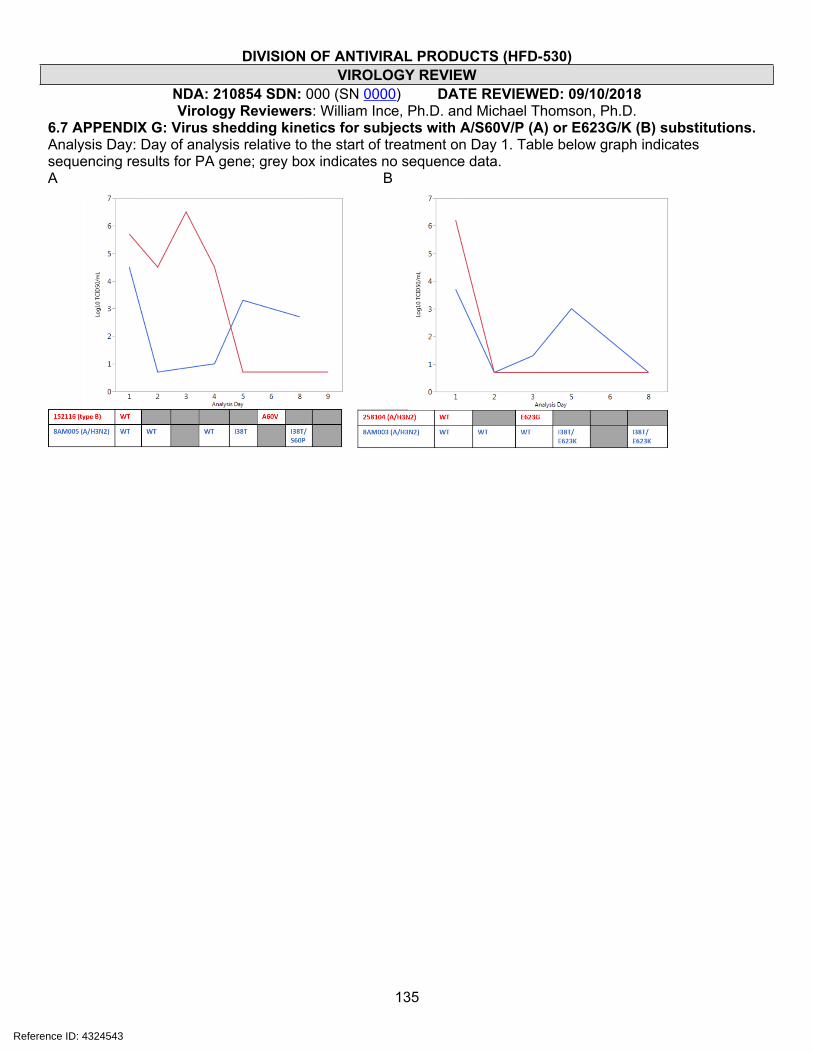
DIVISION OF ANTIVIRAL PRODUCTS (HFD-530)VIROLOGY REVIEW
NDA: 210854 SDN: 000 (SN 0000) DATE REVIEWED: 09/10/2018Virology Reviewers: William Ince, Ph.D. and Michael Thomson, Ph.D.
135
6.7 APPENDIX G: Virus shedding kinetics for subjects with A/S60V/P (A) or E623G/K (B) substitutions. Analysis Day: Day of analysis relative to the start of treatment on Day 1. Table below graph indicates sequencing results for PA gene; grey box indicates no sequence data. A B
Reference ID: 4324543

DIVISION OF ANTIVIRAL PRODUCTS (HFD-530)VIROLOGY REVIEW
NDA: 210854 SDN: 000 (SN 0000) DATE REVIEWED: 09/10/2018Virology Reviewers: William Ince, Ph.D. and Michael Thomson, Ph.D.
136
6.8 APPENDIX H: SDN 002 (SN 0001): Reformatted virology datasets for trials T0831 and T0821.
The sponsor submitted reformatted datasets based on the following comments issued by the Division:
Virology comment 1: We appreciate your inclusion of horizontal format genotypic resistance data in the NDA, as requested; however, we also expected that you would submit to the NDA the resistance analysis datasets in the vertical format submitted for review and concurrence on 2/12/2018, including the requested revisions sent 3/7/2018 (with follow-up sent 3/15/2018). Please let us know when you might be able to submit these datasets.
Sponsor response to comment 1: We are providing the resistance analysis datasets in vertical format for Study 1518T021 (define) and Study 1601T0831 (define) as requested. Additionally, we are providing and updated resistance analysis datasets in horizontal format for Study 1518T021 (define) and Study 1601T0831 (define) to address comment number two.
Virology comment 2: Please note the following inconsistencies we have identified in the horizontal datasets that you submitted. These should be corrected, if applicable, in the corresponding vertical datasets that should be submitted to the NDA:
SUBFL: States “when there is more than one substitution, ‘Y’”. We assume you mean if there are ‘one or more’ substitutions, then Y.
Sponsor response to comment 2: Yes, we confirm that if there are ‘one or more’ substitutions, then SUBFL is Y. We modified the define for both the horizontal and vertical datasets for both Studies 1518T021 and 1601T0831 to reflect this.
Virology comment 3: Substitutions that are listed as mixtures in the horizontal dataset are missing information (e.g. subject T0831-309103 positon 38 = “I/”). This didn’t seem to affect the vertical datasets submitted to the IND.
Sponsor response to comment 3: As per the response to question number one, we have provided an updated horizontal dataset for both Studies 1518T021 and 1601T0831, which includes the identified missing information.
Reference ID: 4324543
DIVISION OF ANTIVIRAL PRODUCTS (HFD-530)VIROLOGY REVIEW
NDA: 210854 SDN: 000 (SN 0000) DATE REVIEWED: 09/10/2018Virology Reviewers: William Ince, Ph.D. and Michael Thomson, Ph.D.
137
6.9 APPENDIX I: SDN 004 (SN 0003) Sponsor request for clarification regarding dataset formatting.
The sponsor requested clarification regarding the following Virology comments sent to the sponsor (May 3, 2018):
Virology comments:
1. Regarding your response to our April 27, 2018 Information Request: We appreciate your attempt to address our request for modified resistance analysis datasets; however, there are several ambiguities that remain. We believe the most expeditious solution at this point would be to submit to the NDA validated versions of resistance analysis datasets for T0821 and T0831 in the format submitted to IND 126653 on February 12, 2018 (SN 0088), with the following 3 columns added: a) ADY (Virus sample collection day); b) flag for amino acid positions in post-baseline sequences that are different from the baseline amino acid; c) flag for subjects who meet the criteria for reduced response/rebound.
2. Please indicate the location in the NDA submission of subset analyses (and associated datasets) of the key endpoints comparing subjects with and without baseline and/or treatment-emergent resistance (see FDA response to Question 5 and follow-up comments to Clinical Virology comment 2 in the pre-NDA minutes sent November 30, 2017).
Sponsor response: Per the email correspondence with the FDA Project Manager (Ms. Victoria Tyson) on May 7-8, 2018, Shionogi is officially submitting to the NDA the clarification questions regarding the FDA IR on the virology datasets, dated May 4, 2018.
1. Please could you let us know the ambiguities associated with Shionogi's response (submitted on May 3, 2018) to the original information request? If certain information was missing or cannot be located, Shionogi would be happy to help the reviewer locate the information he/she is looking for.
2. In the IR dated May 4, 2018, the FDA requested Shionogi to submit the validated datasets in the same format as the IND submission sent on February 12, 2018. We have the following associated follow up questions:
a. The columns requested i.e. ADY and flag for subjects who meet the criteria for reduced response/rebound were already present in the datasets submitted with the original NDA and the response datasets from May 3, 2018. Therefore, Shionogi would like to know since this is being re-requested in the new format, were there any issues with the way this data was presented in the NDA and the response?
b. If Shionogi submits the datasets in the same format as the IND, do we need to provide the datasets in the horizontal and vertical format? Also, do we need to address all the comments that the FDA had sent (dated March 7, 2018) when we resubmit these datasets? If so, how will these datasets be different from what was submitted in the NDA?
Shionogi would be available for an informal teleconference if a telephone discussion is more feasible.
A teleconference was not held. Virology responded with clarifying comments on 5/8/2018.
Reference ID: 4324543
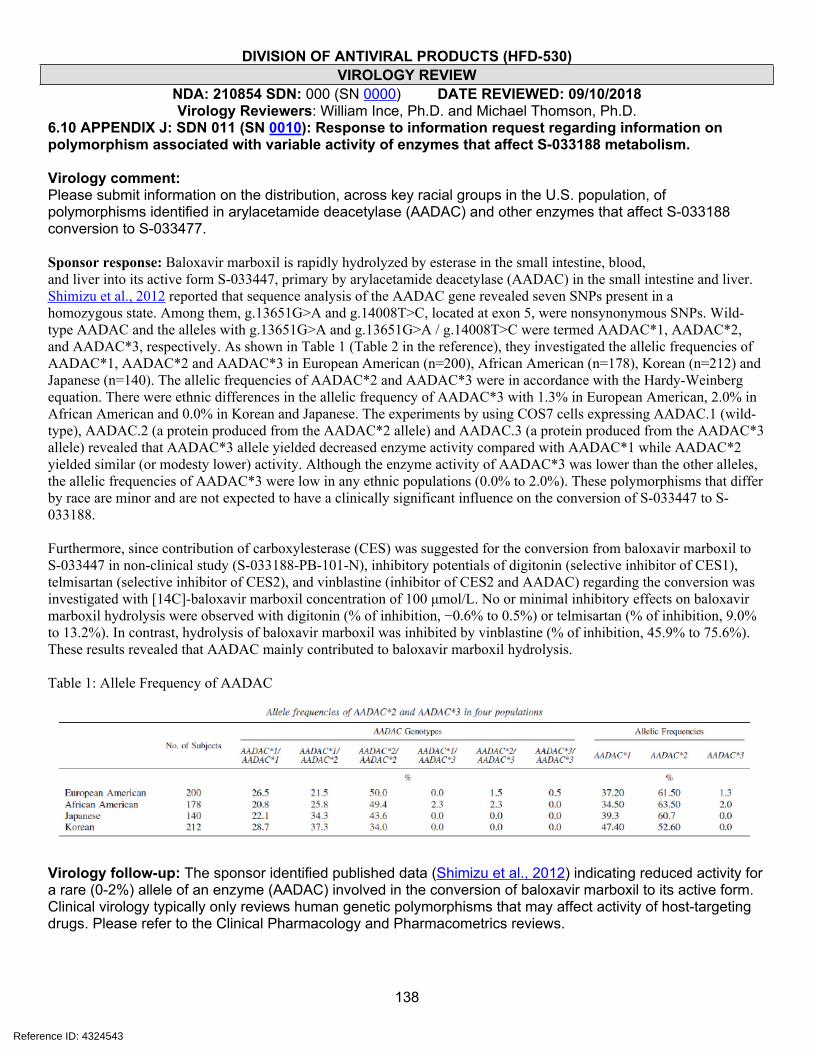
DIVISION OF ANTIVIRAL PRODUCTS (HFD-530)VIROLOGY REVIEW
NDA: 210854 SDN: 000 (SN 0000) DATE REVIEWED: 09/10/2018Virology Reviewers: William Ince, Ph.D. and Michael Thomson, Ph.D.
138
6.10 APPENDIX J: SDN 011 (SN 0010): Response to information request regarding information on polymorphism associated with variable activity of enzymes that affect S-033188 metabolism.
Virology comment: Please submit information on the distribution, across key racial groups in the U.S. population, of polymorphisms identified in arylacetamide deacetylase (AADAC) and other enzymes that affect S-033188 conversion to S-033477.
Sponsor response: Baloxavir marboxil is rapidly hydrolyzed by esterase in the small intestine, blood,and liver into its active form S-033447, primary by arylacetamide deacetylase (AADAC) in the small intestine and liver. Shimizu et al., 2012 reported that sequence analysis of the AADAC gene revealed seven SNPs present in ahomozygous state. Among them, g.13651G>A and g.14008T>C, located at exon 5, were nonsynonymous SNPs. Wild-type AADAC and the alleles with g.13651G>A and g.13651G>A / g.14008T>C were termed AADAC*1, AADAC*2, and AADAC*3, respectively. As shown in Table 1 (Table 2 in the reference), they investigated the allelic frequencies of AADAC*1, AADAC*2 and AADAC*3 in European American (n=200), African American (n=178), Korean (n=212) and Japanese (n=140). The allelic frequencies of AADAC*2 and AADAC*3 were in accordance with the Hardy-Weinberg equation. There were ethnic differences in the allelic frequency of AADAC*3 with 1.3% in European American, 2.0% in African American and 0.0% in Korean and Japanese. The experiments by using COS7 cells expressing AADAC.1 (wild-type), AADAC.2 (a protein produced from the AADAC*2 allele) and AADAC.3 (a protein produced from the AADAC*3 allele) revealed that AADAC*3 allele yielded decreased enzyme activity compared with AADAC*1 while AADAC*2 yielded similar (or modesty lower) activity. Although the enzyme activity of AADAC*3 was lower than the other alleles, the allelic frequencies of AADAC*3 were low in any ethnic populations (0.0% to 2.0%). These polymorphisms that differ by race are minor and are not expected to have a clinically significant influence on the conversion of S-033447 to S-033188.
Furthermore, since contribution of carboxylesterase (CES) was suggested for the conversion from baloxavir marboxil to S-033447 in non-clinical study (S-033188-PB-101-N), inhibitory potentials of digitonin (selective inhibitor of CES1), telmisartan (selective inhibitor of CES2), and vinblastine (inhibitor of CES2 and AADAC) regarding the conversion was investigated with [14C]-baloxavir marboxil concentration of 100 μmol/L. No or minimal inhibitory effects on baloxavir marboxil hydrolysis were observed with digitonin (% of inhibition, −0.6% to 0.5%) or telmisartan (% of inhibition, 9.0% to 13.2%). In contrast, hydrolysis of baloxavir marboxil was inhibited by vinblastine (% of inhibition, 45.9% to 75.6%). These results revealed that AADAC mainly contributed to baloxavir marboxil hydrolysis.
Table 1: Allele Frequency of AADAC
Virology follow-up: The sponsor identified published data (Shimizu et al., 2012) indicating reduced activity for a rare (0-2%) allele of an enzyme (AADAC) involved in the conversion of baloxavir marboxil to its active form. Clinical virology typically only reviews human genetic polymorphisms that may affect activity of host-targeting drugs. Please refer to the Clinical Pharmacology and Pharmacometrics reviews.
Reference ID: 4324543
DIVISION OF ANTIVIRAL PRODUCTS (HFD-530)VIROLOGY REVIEW
NDA: 210854 SDN: 000 (SN 0000) DATE REVIEWED: 09/10/2018Virology Reviewers: William Ince, Ph.D. and Michael Thomson, Ph.D.
139
6.11 APPENDIX K: Study report EB-286-N (5.3.1.1): Effect of S-033447 on Influenza Virus Titer Testing.
Background: The sponsor was asked to evaluate the impact that drug carryover from nasal swab specimens might have on the performance of the TCID50 assay used to measure virus shedding. These data were requested to determine if drug carryover was a significant factor in the observed decreases in virus shedding or proportions of subjects who were virus-positive at each time point (I126653.053 and I126653.071).
Purpose: The purpose of this study was to evaluate the impact of a range of S-033447 concentrations that may be present in clinical virologic samples on the performance of the virus titration assay (TCID50 assay) used to measure virus shedding.
Methods: Clinical samples were reconstructed by adding influenza virus (A/Victoria/361/2011 [H3N2]; S-033447 EC50 value, 1.87 nM [S-033188-EB-239-N]) to final titers (based on stock titer) of 40,000 or 400 TCID50/mL in transport medium. S-033447 was added to samples to final concentrations of 0, 0.1, 0.3, 1.0, 3.0, 10.0, 30.0, 100.0, and 300.0 ng/mL (0, 0.2, 0.6, 2.1, 6.2, 20.7, 62.2, 207.5, and 622.4 nM). Five independent samples were generated for each virus dilution at each S-0334447 concertation (test samples).
Each test sample replicate was titered in a TCID50 assay, as described in studies CF-155-N and CF-246-N. Briefly, TPCK-trypsin solution was added to each test sample. Ten-fold dilutions of test samples (1- to 107-fold), diluted in viral assay medium (containing TPCK-trypsin), were added to confluent MDCK-SIAT1 monolayers in 96 well plates (4 dilution series per test sample) followed by centrifuging at 1000 rpm (206 x G, JS-5.3 rotor) for 30 minutes (Mills et al., 1989; Seno et al., 1991) at room temperature. Infection media containing virus/S-033447 was removed and cells were washed once with viral assay medium and incubated for 3 days in a humidified incubator at 33˚C in viral assay medium. After the incubation period, virus-induced cytopathic effect (CPE) was evaluated under a microscope, and the viral titers were calculated as TCID50/mL using the Behrens-Karber method (Behrens and Karber, 1935, Wie sind Reihenwersuche für biologische Auswertungen am sweck-mässigten anzuordnen? [not indexed in Pubmed]; see Zlotkin et al., 1971 [cited therein]).
Results: In samples containing 10 ng/mL (21 nM) of S-033447, virus titer was significantly reduced, by 0.7 and 0.9 log10 TCID50 for the low and high titer samples, respectively, and virus titers began to trend lower in samples containing 3 ng/mL (6.2 nM) of S-033447 (Figure 1). Based on the titer of the no-drug test samples, which are almost precisely 2 log10 and 1 log10 higher than expected for the low and high dilutions, respectively, the concentrations of S-033447 that would be present at the endpoint of the 10 ng/mL sample would be approximately 0.0001 ng/mL (0.00021 nM) and 0.00001 ng/mL (0.00002 nM) for the low and high virus titer samples, respectively. These values are well below the EC50 value of the virus, but the actual concentration of drug may be higher, and it is possible that drug can bind to virus (it is >90% protein bound in serum). Interestingly, the low titer sample was impacted similarly to the high titer sample, even though S-033447 would be more dilute at the endpoint by a factor of 10 in the high titer sample. It should also be noted that infections for virus titering were carried out by “spinoculation” over a 30 minute period, after which time the inoculum containing drug is removed; this may limit cells exposure to drug. Nevertheless, the data indicate that there would be a significant impact on the ability to detect virus in low titer samples, where drug may not be subject to more than a 10-fold dilution to achieve an infectivity endpoint (e.g. titers <500 TCID50/mL).
Figure 1: Viral titers of test virus samples in the transport medium (Puritan) including various concentrations of S-033447 determined in MDCK-SIAT1 cells. * P < 0.05 compared to the baseline (0.0 ng/mL) by Welch’s t-test. Data represent the mean and standard deviation of five experiments. The virus titers below the lower limit of quantification (< 0.7 TCID50/mL) were set as 0.5 log10TCID50/mL for the calculation of statistics.
Reference ID: 4324543
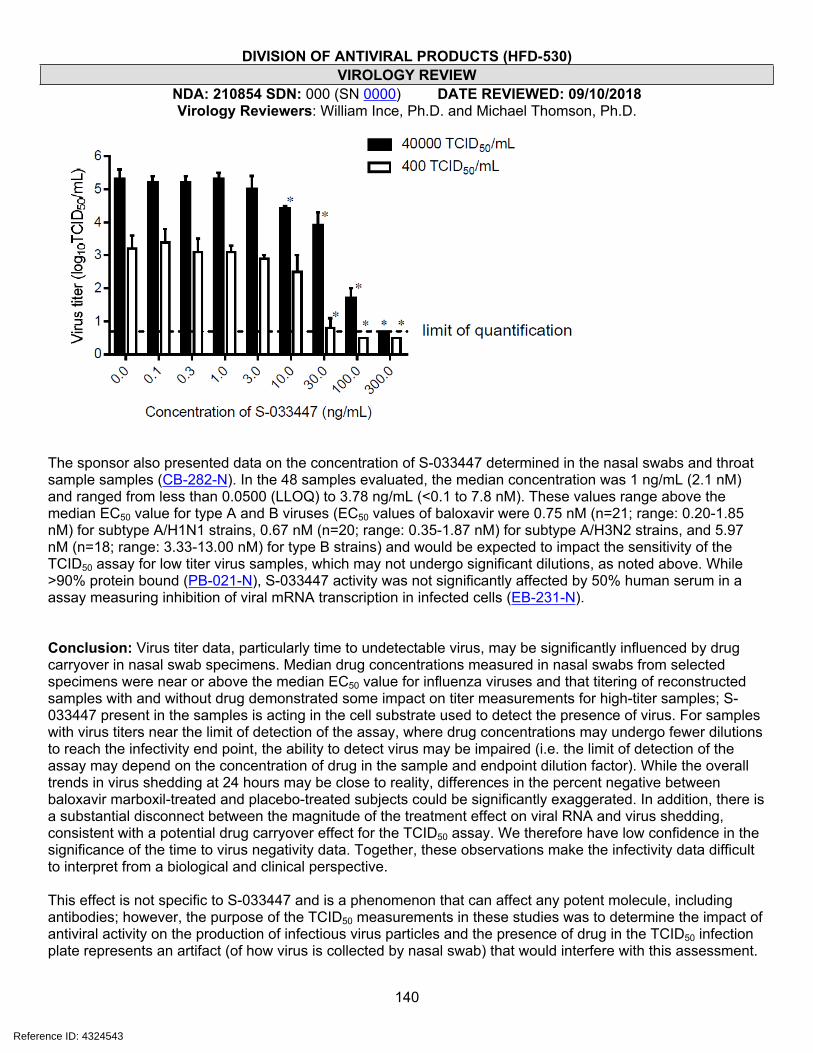
DIVISION OF ANTIVIRAL PRODUCTS (HFD-530)VIROLOGY REVIEW
NDA: 210854 SDN: 000 (SN 0000) DATE REVIEWED: 09/10/2018Virology Reviewers: William Ince, Ph.D. and Michael Thomson, Ph.D.
140
The sponsor also presented data on the concentration of S-033447 determined in the nasal swabs and throat sample samples (CB-282-N). In the 48 samples evaluated, the median concentration was 1 ng/mL (2.1 nM) and ranged from less than 0.0500 (LLOQ) to 3.78 ng/mL (<0.1 to 7.8 nM). These values range above the median EC50 value for type A and B viruses (EC50 values of baloxavir were 0.75 nM (n=21; range: 0.20-1.85 nM) for subtype A/H1N1 strains, 0.67 nM (n=20; range: 0.35-1.87 nM) for subtype A/H3N2 strains, and 5.97 nM (n=18; range: 3.33-13.00 nM) for type B strains) and would be expected to impact the sensitivity of the TCID50 assay for low titer virus samples, which may not undergo significant dilutions, as noted above. While >90% protein bound (PB-021-N), S-033447 activity was not significantly affected by 50% human serum in a assay measuring inhibition of viral mRNA transcription in infected cells (EB-231-N).
Conclusion: Virus titer data, particularly time to undetectable virus, may be significantly influenced by drug carryover in nasal swab specimens. Median drug concentrations measured in nasal swabs from selected specimens were near or above the median EC50 value for influenza viruses and that titering of reconstructed samples with and without drug demonstrated some impact on titer measurements for high-titer samples; S-033447 present in the samples is acting in the cell substrate used to detect the presence of virus. For samples with virus titers near the limit of detection of the assay, where drug concentrations may undergo fewer dilutions to reach the infectivity end point, the ability to detect virus may be impaired (i.e. the limit of detection of the assay may depend on the concentration of drug in the sample and endpoint dilution factor). While the overall trends in virus shedding at 24 hours may be close to reality, differences in the percent negative between baloxavir marboxil-treated and placebo-treated subjects could be significantly exaggerated. In addition, there is a substantial disconnect between the magnitude of the treatment effect on viral RNA and virus shedding, consistent with a potential drug carryover effect for the TCID50 assay. We therefore have low confidence in the significance of the time to virus negativity data. Together, these observations make the infectivity data difficult to interpret from a biological and clinical perspective.
This effect is not specific to S-033447 and is a phenomenon that can affect any potent molecule, including antibodies; however, the purpose of the TCID50 measurements in these studies was to determine the impact of antiviral activity on the production of infectious virus particles and the presence of drug in the TCID50 infection plate represents an artifact (of how virus is collected by nasal swab) that would interfere with this assessment.
Reference ID: 4324543

DIVISION OF ANTIVIRAL PRODUCTS (HFD-530)VIROLOGY REVIEW
NDA: 210854 SDN: 000 (SN 0000) DATE REVIEWED: 09/10/2018Virology Reviewers: William Ince, Ph.D. and Michael Thomson, Ph.D.
141
In addition, the infectivity of virus released through nasal secretions or aerosolized though cough and sneezing may not otherwise be impacted by the presence of S-033447 in the respiratory tract.
While there are limited practical means by which infectivity can be consistently and reliably measure in clinical trials in this scenario, one approach to determining the true impact on infectivity outcomes would be to randomly sample clinical specimens which were negative in the TCID50 assay to inoculate cells in a large volume so as to significantly dilute carryover drug.
Reference ID: 4324543

DIVISION OF ANTIVIRAL PRODUCTS (HFD-530)VIROLOGY REVIEW
NDA: 210854 SDN: 000 (SN 0000) DATE REVIEWED: 09/10/2018Virology Reviewers: William Ince, Ph.D. and Michael Thomson, Ph.D.
142
6.12 APPENDIX L: Substitutions identified as requiring further evaluation for their impact on susceptibility to baloxavir.Gene Type/
subtypeSubstitution Review Section
referencedRationale for further evaluation
A/H1N1 A37SA/H1N1 I38LA/H1N1 E199DA/H1N1 E199KA/H3N2 E199DA/H3N2 E199KB A37Q
PA
B I38V
4.2 (Tables 4.2.4/4.2.5) Substitutions identified at RAS amino acid positions in NCBI database sequences.
A/H3N2 V62IA/H3N2 K492R
PA
B M682L
4.1 (Table 4.1.6) Baseline substitutions associated with reduced virologic response defined as a significantly reduced Day 2 change from baseline in virus titer relative to the virus type/subtype subset distribution.
PB2 A/H3N2 R209K 4.3 (Figure 4.3.1) Treatment-emergent substitutions associated with virologic rebound.
A/H1N1 P267SA/H1N1 A476SA/H1N1 E677DA/H3N2 F35LA/H3N2 T162IA/H3N2 Y321HA/H3N2 V432IA/H3N2 M595IA/H3N2 A618SA/H3N2 G684RB G199RB K298RB T304A
PA
B V645A
4.1 (Table 4.1.3) PA polymorphisms associated with elevated (≥90 percentile) baseline EC50 values of virus isolated from clinical specimens within type/subtype subsets within trials.
a. Fold change relative to the median EC50 value reported for isolates within the virus type/subtype subset within the respective trial. See Table 4.1.1.
Reference ID: 4324543
--------------------------------------------------------------------------------------------This is a representation of an electronic record that was signedelectronically. Following this are manifestations of any and allelectronic signatures for this electronic record.--------------------------------------------------------------------------------------------/s/------------------------------------------------------------
WILLIAM L INCE09/21/2018
MICHAEL THOMSON09/21/2018
JULIAN J O REAR09/24/2018
Signature Page 1 of 1
Reference ID: 4324543