2.1 introduction - indian etd repository @ inflibnet: home
TRANSCRIPT

7
2.1 Introduction
In this chapter, pertinent information about the Kaveri River system and its
tributaries, the Palar, the Ponnaiyar and the Vellar River systems are given. These rivers
flow through the states of Karnataka, Kerala, Andhra Pradesh, Tamilnadu and
Pondicherry in Southern India. The climate and geology of these river basins are
described here. The methodology followed to analyze the water and calcrete samples
collected from these rivers is also described.
2.2 The River Kaveri:
The river Kaveri rises at Talakaveri on the Brahmagiri range in the Western
Ghats, Coorg district, Karnataka at an elevation of about 1, 341 m, flows for about 800
km before its outfall into the Bay of Bengal and drains a total of 81, 155 km2 area of
which 34, 273 km2 lies in Karnataka, 43, 856 km2 in Tamilnadu, 2, 866 km2 in Kerala and
160 km2 in the Pondicherry. The Kaveri river system consists of 21 principal tributaries
each with catchment area exceeding 250 km2 (Int. Hyd. Data Book, CWC, 2007). The
important tributaries joining the Kaveri are the Harangi, Hemavati, Lakshmana Tirtha,
Kabini, Suvarnavathi, Sihmsa, Arkavati, Bhavani, Noyil and Amaravathi. The Kaveri
basin is bounded by Tungabhadra sub-basin of Krishna on the northern side, Palar basin
on the Southern side, the Western Ghats on the Western boundary, the Nilgiris, an
offshoot of Western Ghats, extend eastwards to the Eastern Ghats and divide the basin
into two natural and political regions i.e. Mysore plateau in the North and the Tamilnadu
plateau in the South. The Eastern part of the basin is in the elevation range of 0 to 150 m
slopping gently up from the sea, in the state of Tamilnadu (Int. Hyd. Data Book, CWC,
2007).
In Mysore plateau Kaveri river forms two islands one near Srirangapatna and
other at Shivanasamudra. River Kaveri branches off into two parts: western side called as
Gangachukki and the eastern side Bharachukki, and each branch falls through height of
~100 m in a series of falls and rapids at Shivanasamudram (Radhakrishna &
Vaidhyanadhan, 1997). Here one hydropower project was built as early as 1902. The two
branches then unite and pass through a gorge known as Mekedatu (Goats leap) and
further downstream it forms the boundary between Karnataka and Tamilnadu States for a
distance of 64 km (Int. Hyd. Data Book, CWC, 2006). In its course through Karnataka,
the channel is interrupted by twelve Anicut or dam for the purpose of irrigation. From the
Anicut at Madadkatte, an artificial channel is diverted at a distance of 116 km, irrigating
an area of 10,000 acres (40 km²), and ultimately bringing its water supply to the town of
8
Mandya. The Krishna Raja Sagar Dam (KRSD) near to Mysore has been constructed for
the irrigation, hydropower and drinking water supply, with a capacity of 1387.5 million
cubic meters (MCM). The Torekadanahalli pump station sends 540 Mld (Million liters
per day) of water from Kaveri to Bangalore located 100 km towards North.
River Kaveri enters Tamilnadu through Dharmapuri district and at Hogainakal
Falls, it takes southerly direction then enters the Mettur reservoir (has a capacity of
2644.8 MCM), which was constructed in 1934. Between Hogainakal and Mettur Dam
three minor tributaries, Palar, Chennar and Thoppar enter into the Kaveri. After Mettur
Dam, river Sarvanga joins on the left bank, while Bhavani and Noyil merge with Kaveri
on its right bank. Thereafter it takes easterly course to enter the plains of Tamilnadu, river
Amaravathi joins on the right bank near Karur and from here the river widens with a
sandy bed. After traveling Trichinapally district for 14 km, the river splits into two parts,
the northern branch is called the Coleron and southern branch remains as Kaveri. After
flowing 16 km these two branches join and thus form the Srirangam island. On the Kaveri
branch a Grand Anicut is said to have been constructed by a Chola King in 1st Century
AD (Int. Hyd. Data Book, CWC, 2006). Below the Grand Anicut, the Kaveri branch splits
into two, Kaveri and Vennar. These two branches are divided and sub-divided into small
branches and form a network all over the delta before outfalls to Bay of Bengal.
2.3 Major Tributaries:
Hemavati:
It originates from the Western Ghats at an elevation of about 1,219 m
(Radhakrishna & Vaidhyanadhan, 1997) near Ballalarayana durga in the Chikmagalur
District, Karnataka, and flows through Chikamagalooru, Hassan and Mysore district
before joining the Kaveri at Krishna Raja Sagar. This is the longest tributary of Kaveri
(245 km) and is the fifth largest in catchment area of about 5410 km2 and lies wholly in
Karnataka. A large reservoir has been built on the river at Gorur in the Hassan district.
The direction of flow of this river is NW
SE in the upper reaches which is controlled by
the foliation in the underlying strata, then flow is across foliation and controlled by a fault
before discharging into KRSD. This river is named after the hill range Hemagiri (the hill
of gold) of Krishnarajpet schist belt.
Shimsha:
This river originates in the southern part of the Devarayanadurga hill at an altitude
of 914 m (Radhakrishna & Vaidhyanadhan, 1997), in the Tumkur district of Karnataka
and flows for about 215 km before joining the river Kaveri near the Shivanasamudra falls.
9
It has the largest Catchment area of 8469 km² among all tributaries of Kaveri and lying
wholly in Karnataka. Markonahalli Dam is built across this river in the Kunigal Taluk of
Tumkur district and it has a waterfall at Shimshapura in Malavalli Taluk. In the upper
reaches the direction of flow of this river is NW
SE.
Arkavathy:
This river originates at Nandidurg Hills of Kolar District at an elevation of about
1480 m (Radhakrishna & Vaidhyanadhan, 1997) and it joins the river Kaveri at
Kanakapura after flowing 161 km through Kolar District and Bangalore Rural district. It
covers drainage basin area of 4150 km2 and direction of flow in the upper reaches is
controlled by the foliation in the underlying strata. The river is used by the Bangalore
Water Supply and Sewerage Board to provide 135 million liters of drinking water per day
to the city of Bangalore. The water is taken from two reservoirs built on the river, the
Hesaraghatta which was built in 1894 and the Tippagondanahalli Reservoir which was
built in 1933.
Kabini:
From Pakramthalam hill at Kuttyadi-Mananthavady road, river Kabini originates
at an elevation of 2140 m (Radhakrishna & Vaidhyanadhan, 1997) and river Makkiyad
and Periya joins near Korome and Valad respectively. It rises from both Kerala and
Tamilnadu but flowing mostly in Karnataka. The river basin is spread over an area of
7040 km2 (Int. Hyd. Data Book, CWC, 2007). After Mananthavady town, river
Panamaram joins Kabini near Payyampally and after 2 km from the confluence, Kabini
forms an island spreading over 210 hectare called Kuruva island. Kalindi river originates
from Brahmagiri hills, joins Kabini between Kabini reservoir (bordering Kerala and
Karnataka for few kilometer) and Kuruva island. The Kabini dam is 696 m in height with
a capacity of 270 MCM.
Bhavani:
The Bhavani is the second largest river in Tamil Nadu and it flows 217 km before
it joins Kaveri. Its catchment area of 6,154 km² (Int. Hyd. Data Book, CWC, 2007) spread
over Tamil Nadu (87%, mainly in Coimbatore and Erode districts), Kerala (9%) and
Karnataka (4%). The headwaters of this river are on the eastern slopes of the Western
Ghats range, in Attappadi Reserve Forest, Palakkad district, Kerala and the Kunda hills in
the south west corner of the Nilgiri Hills. About 12 major rivulets join Bhavani draining
the southern Nilgiri slopes. The west and east Varagar are the largest tributaries coming
from the Nilgiri. At Mukkali, Bhavani takes an abrupt 120° turn towards the northeast and

10
flows 25 km through Attappady plateau and 7 km along the inter-state border. The river
Kunda drains an extensive part of the Nilgiri mountain and it joins the Bhavani on its left
flank at Athikadavu, Tamilnadu. The river Siruvani and Kodungarapallam flowing from
the south and southeast respectively join the Bhavani at Koodappatti near the Kerala-
Tamil Nadu border. Then Bhavani flows eastward along the southern base of Nilgiri,
enters the plain near Mettupalayam and the river Coonoor after traveling northwestly
from Coonoor joins Bhavani.
The Moyar River, a major tributary originating from upper Nilgiri and pass
through Mudumalai National Park, flows from the northwest and drains the valley
between the northern slopes of the Nilgiri and the southern slopes of the Bilgiri Hills joins
Bhavanisagar reservoir near Kottamangalam. The river Pyakara is a tributary to Moyar.
The Bhavanisagar reservoir near Sathyamangalam was constructed for irrigation and for
the drinking water supply. The Bhavani joins the Kaveri at the town of Bhavani and the
Sangameswarar Temple at this confluence is an important pilgrimage spot.
Along this river and its tributaries many textile, leather, sugar, paper and distilling
industries are located. Due to joining of industrial, municipal and agricultural waste into
this river, its water is polluted.
Noyil:
This river raises from the Vellingiri hills in the Western Ghats in Tamil Nadu. Its
total catchment area is spread over an area of 3500 km2 (Int. Hyd. Data Book, CWC,
2007) and it flows 173 km before joining into the Kaveri River at Noyil town. There are
numerous rivulets that join Noyil but most of these rivulets carry water only during the
rainy season. The river has 23 check dams and its valley is filled with alluvial kankar soil.
The river water is polluted because of the huge concentration of cloth dyeing industries
dumping their industrial wastes into the river.
Amaravati:
It originates from the Anjanda valley of Kerala, between the Aanaimalai Hills
and the Palni Hills at the bottom of Manjampatti Valley. The river Kallapuram joins at
the mouth of the Anjanda valley in Udumalaipettai. It flows northward through
Amaravathi Reservoir up to Dharapuram where it bends towards east and after
Rajapuram it flows in north east direction and joins Kaveri at Karur. Its catchment area
covers 8380 km2 (Int. Hyd. Data Book, CWC, 2007). Shanmuga, Naganji and
Kodavanur are the major tributaries to the river Amaravati.

11
2.4 The River Palar:
Palar river (348 km) originates from Talagavara village in Kolar District at an
elevation of about 900 m and flows through Karnataka (93 km), Andhra Pradesh (33 km)
and Tamilnadu (222 km), before it meets Bay of Bengal south of Kalpakam, Tamilnadu.
Cheyyar, Poonai and Malatar are the main tributaries to the river Palar. The shape of the
basin is rhombus and lies approximately between 12º 15
and 13º 38
north latitudes. The
drainage basin of Palar river covers an area of 17, 871 km2 (Int. Hyd. Data Book, CWC,
2007). The cities of Vaniyambadi, Ambur, Vellore, Arcot, Walajapet (Anaicut),
Kanchipuram, and Chingleput are located on banks of Palar River. It is an ephemeral
river.
2.5 The River Ponnaiyar:
River Ponnaiyar rises near the village of Hongashenhalli, in the Nandi Hill (Kolar
District, Karnataka) at an elevation of about 900 m. The Ponniyar basin covers an area of
16,019 km2 and lies between the E 77º 33 to E 79º 47 and N 11º 45' to 13º 30
(Int. Hyd.
Data Book, CWC, 2007). It flows south and then east for 396 km through Karnataka and
Tamil Nadu. This basin is bounded on the north-west and south by various ranges of the
Eastern Ghats like the Velikonda range, the Nagari hills, the Javadi hills, the Shevaroy
hills, the Chitteri hills and the Kalrayan hills and in the east by the Bay of Bengal. It flows
79 km in the Kolar and Bangalore districts of Karnataka, it enters Tamilnadu in the
Dharmapuri district and drains 317 km through the districts of Dharmapuri, Vellore,
Tiruvannamalai, Cuddalore and Villupuram before out falls to Bay of Bengal near
Cuddalore. The Krishnagiri dam, Satnur dam and Tirukoyilur anicut are three major man
made structure in the river course. The river Ponniyar branches into two near Villupuram,
the Gadilam in the south and the Ponnaiyar in the north.
2.6 The River Vellar:
The Vellar River rises at an elevation of 900 m near the village of Tumba in the
Chittori hills, of the Eastern Ghats in the Salem district of Tamilnadu. It flows generally
in an easterly direction for a total length of 210 km through the Salem and Cuddalore
districts in Tamilnadu and finally out falls into the Bay of Bengal near Porto Nova in
Cuddalore district. It drains a total catchment area of about 8,922 km2 (Int. Hyd. Data
Book, CWC, 2007). Which is lies entirely in Tamilnadu. The major tributaries of river
Vellar are the Gomukinadhi and Manimukthanadi from the north and Swetanadhi and
Chinnar are from the south.

12
2.7 Climate
The drainage basin of the Kaveri, Palar, Ponnaiyar and their tributaries,
experiences tropical monsoon climate with bimodal rainfall pattern. As these basins cover
a large area in the peninsular India, variability in climate is introduced by altitude,
mountain barriers, air mass movement and the distance from the coast. In a year three
distinct seasons, winter from January to February, summer from March to May and
monsoon from June to December (SW monsoon from June to September and NE
monsoon from October to December), prevail in this region. The annual mean
temperature of these basins is 26º C, however, in summer the maximum temperature
reaches up to 41º C (May) and during winter (January) it goes down to 13.5º C, except in
hill stations. Monthly average mean maximum and minimum temperature data of
homogenous region of interior peninsular for the period of 1901 to 2003, taken from
www.tropmet.res.in
has been plotted in the Figure 2.1. A.
Month
Jan
Feb Mar AprMay Ju
n Jul
AugustSep Oct
NovDec
Mo
nth
ly A
vg. m
ean
Tem
p (
C)
10
15
20
25
30
35
40
Maximun
Minimum
A)
Month
Jan
Feb
March
AprilMay
June
July
AugustSep
tOct
NovDec
Mo
nth
ly A
vg. R
ain
fall
(mm
)
0
50
100
150
200
South Interior KarnatakaTamilnadu
B)
Fig 2.1 A) Month wise variation of maximum and minimum temperature in interior Peninsula of south India, B) Monthly average rainfall plotted separately for the south interior Karnataka and Tamilnadu.
The south interior Karnataka meteorological subdivision which covers an area of
93171 km2 with 11 rain gauge stations consists of upper parts of the Kaveri, Palar and
Ponniyar drainage basin. Average rainfall data of the south interior Karnataka for the
period of 1995 to 2006 was collected from the www.tropmet.res.in. Month wise data
indicate that in the upper reaches of these drainage basin rain starts towards end of April
and continues up to starting of the November with two high spell one from SW and other
from NE monsoon (Fig. 2.1. B). Similarly the monthly rainfall data of these drainage
basins in Tamilnadu taken from the Tamilnadu meteorological subdivision covering an
area of 130068 km2 with 15 rain gauge station shows two distinct heavy showers, one
during the beginning of SW monsoon and another from NE monsoon (Fig 2.1. B). South

13
interior Karnataka receives ~ 58% and ~ 25 % rainfall of its total annual precipitation
from SW and NE monsoon respectively. In case of Tamilnadu NE monsoon provides
50% of total rainfall and 33% from SW monsoon.
JuneJuly
August
September
October
November
December
January
FebruaryMarch
April May
Tem
per
atu
re (
C)
15
20
25
30
35
40
Max. Temperature
Min. Temperature
NormalActualNormalActual
2005 2006
Month
A)
JuneJuly
August
September
October
November
December
January
FebruaryMarch
April May
Mo
nth
ly R
ain
fall
(mm
)
0
100
200
300
400
ActualNormal
2005 2006
Month
B)
Month
June
July
AugustSep
t Oct
Nov
Dec
Jan
Feb
Mar
Apr May
Hu
mid
ity
(%)
30
40
50
60
70
80
90
100At 8.30hrs At 17.30hrs
2005 2006
C)
Fig 2.2 Month wise variation between normal and actual A) Temperature, B) Rainfall and C) monthly average humidity at 8.30 hrs and 17.30 hrs in the Trichinapally district, Tamilnadu for the period of 2005
2006.
For the year of sample collection (June 2005 to May 2006) Tamilnadu received
50% more rainfall than its normal, mainly from NE monsoon. The monthly average data
of the humidity (at 8.30 hrs & 17.30 hrs), normal and actual rainfall, mean maximum and
minimum temperature of Trichinapally district of Tamilnadu for the period of June 2005
to May 2006, were collected from the district annual employment report, 2006
2007
(DRDA, report) and plotted month wise separately in the Fig 2. 2. During this year mean
maximum temperature was less than the normal temperature for the particular month and
mean minimum temperature was higher in the month of June, July, August, October and
November, and lower than the normal value in the remaining months. During NE
monsoon this district received total 858 mm rainfall whereas 366 mm was the normal
rainfall, and in the month of November itself rainfall of 376 mm (117 mm normal) was
measured in this year. Highest humidity at 8.30 hrs was observed during month of
December (87.6%) whereas, during November highest humidity (61.4%) was observed at
17.30 hrs.
2.8 The Geology of the Kaveri River Basin
The catchment areas of these rivers are known to be a mosaic of different
Precambrian terrains bounded by several N S and E W trending major shear zones.
These shear zones are supposed to have been reactivated during later periods resulting in
the formation of block mountains, dominantly made up of granulites (Valdiya, 1998).
Most of the rock types that are subjected to extensive physical and chemical weathering
in these drainage basins are Precambrian in age, which may have been uplifted during late
Mesozoic period. Gunnel, (1998b) suggested that due to break up of Madagascar, western

14
part of the Peninsular India experienced passive margin uplift resulting in formation of
Sahy dri range (Western Ghat) all along the west coast of peninsular India. Subsequently
high rainfall occurred along the west coast as well as the Sahy dri
range with onset of
monsoonal climatic regime (Gunnel, 1998c). Thus eastward flowing river systems,
including the three rivers being studied, were developed due to the uplift of the Sahy dri
range and easterly tilt of the Peninsular India (Vaidyanathan, 1964).
The Kaveri drainage system in the upper reaches flows through Archean granitoid
gneisses (amphibolite-facies) and intrusives, Closepet granite, Precambrian granulites
(ranging in composition from granite to gabbro) and supracrustal belts. The Dharwar
group of supracrustal rocks consists of predominantly theoliitic and minor komatiitic
volcanic rocks, felsic volcanic rocks, clastic and chemical sedimentary rocks. The
supracrustal rocks were subjected up to amphibole facies metamorphism and hence these
are referred to as schists.
Before KRSD, the Kaveri flows through basic granulites, ultramafic rocks, pelites
and carbonate bands, hypersthene bearing granulites (charnockites) and Peninsular
gneissic rocks, which are exposed around Kushalnagar (Gopalkrishnan et al., 1975).
Holenarsipur, Krishnarajpet and Nagmangala schist belts surrounded by tonalitic and
trondhjoemitic gneisses are exposed in the drainage basin of the river Hemavati.
Holenarsipur schist belt consist of rhyolite volcanic unit, kyanite
staurolite
granet
graphite schist, lenses of ultramafic and anorthosite, amygduler basalts, cross bedded
ripple marked quartzite and iron formation. Rocks exposed in Krishnarajpet schist belts
are fuchsite quartzite, kyanite staroulite granet mica schist, minor band of calc silicate
rocks, iron formation, ultramafic rocks. The Nagmangala schist belt consists of
ultramafic mafic lenses inter-layered with meta
pelites/quartzite (sillimanite + fuchsite
quartzite + blue kyanite), banded iron formation (quartzite + magnetite + grunerite),
carbonates lenses and peridotitic komatiite (Radhakrishna and Vaidyanathan, 1997).
Sargur schist belt, Peninsular gneisses and granulites are exposed in the catchment
area of Laskhmanthirtham and Kabini river. The Sargur schist belt consists of fuchsite
bearing quartzite, sillimanite kyanite graphite granet schist, para-gneisses interbedded
with basic rocks, bands of crystalline limestone, dolomite, calc-silicate assemblage,
garnet bearing amphibolites, hypersthene bearing quartz magnetite iron formation,
altered ultramafic rocks and enclaves of anorthosite. The river Lakshmanathirtha also
flows along ENE
WSW trending mafic dyke swarm near Hansur, which are mainly

15
made up of epidiorite, dolerite, quartz diorite and olivine dolerite (Radhakrishna and
Vaidyanathan, 1997).
River Kaveri cuts across the plexus of felsitic and porphyry ring dykes near
Sringaptinam, Karnataka. Before the confluence point of Kabini, Kaveri flows south of
Dodguni, southern tip of Chitradurga schist belt where bands of dolomitic limestone
associated with manganese chert, quartzite and phylites are present (Mukhopadhaya et al.,
1981). Nagamangala and Kunigal schist belt are exposed in the upper reaches of the
Shimsa river. Kunigal schist belt consists of garnet and sillimanite bearing quartzite,
manganiferrous calc
silicate rocks, cordierite
anthophyllite / sillimanite schist, quartz
magnetite banded rocks, amphibolite and ultramafic rocks. Lower reach of Shimsa and
Kaveri around Sivasamudram flows through mafic granulite, foliated charnockites and
granitoid gneisses (Mahabaleswar et al., 1995). Kaveri flows near to Channapatna,
Kabaldurga, Chamrajnagar and Kollegal areas, which are coming under the acute
granulite transition zone.
Kaveri river passes through the southern part of the Closepet granite complex,
which consists of Peninsular gneiss, strongly migmatised Peninsular gneiss, clino-
pyroxene bearing granite, porphyritic granite, equigranular grey and pink granite and
incipient charnockites (Jayananda et al., 1991). Pyroxene granulite dykes are present
around Billigirirangan and Kollegal hills and plugs of carbonatities covering ~ 0.036 km2
have been reported from Hogainakal area (Kumar et al., 1998).
The Bhavani, a major tributary to Kaveri passes through granulites of the Nilgiri
Range, which consists of garnetiferous enderbites and basic granulites (gabbroic to
anorthositic in composition). Two-pyroxene granulites and pyroxinites occur as extended
bodies, lenses and pods with increasing abundance towards north in the Nilgiri Range
(Raith et al., 1999). Anorthosite and Satyamangalam group of rocks consisting of fuchsite
quartzite, granitiferous quartzite, magnetite quartzite, kyanite quartzite and white
quartzite, mica gneiss, quartz
sillimanite schist, diopside granulite and amphibolite,
talc-chlorite schist, talc
actinolite schist and number of lenses, bands and small bodies
of layered ultra basic igneous rocks (dunite, peridotite, eclogite and granitiferous gabbro)
are exposed both in Bhavani and Moyar river valley (Subramanian and Selvan, 2001).

16
Fig 2. 3
Map showing the geology of the drainage basins of Kaveri, Ponnaiyar and Palar rivers, (after map of Geological Survey of India, 1994), their major tributaries and monsoon sample locations are numbered along the river course. Upper reaches of Kaveri river drain through the Archean granitoid gneisses of western Dharwar carton and Clospet granite. Middle and lower reaches passes through the granulitic terrain, sheared and migmatitic gneisses and recent alluvium. Both Palar and Ponnaiyar rivers originate from eastern Dharwar craton consisting of Late Archean granitoid gneisses and intrusives. Palar drains mainly through these granitoid gneisses and after Arcot it enters into the recent alluvium and Gondwana formations. Cheyyar (tributary to Palar) and lower reach of Palar drain through the granulites. Ponnaiyar traverses granitic gneisses, granulites and Recent alluvium formation before entering Bay of Bengal.

17
Bhavani river valley terrain in the mid-upper reaches is made up of quartzo
feldspathic gneiss (K-feldspar is less than plagioclase), hornblend
biotite gneiss, augen
gneiss, hornblend gneiss and granitic gneiss (Subramanian and Selvan, 2001).Bhavni
layered complex rocks which is consist of gabbro bodies in association with pyroxenite
and leucogabbro, anorthosite with chromite layer, pyroxenite, peridotite and eclogite.
Granitiferous quartzo
feldspathic gneiss is widely exposed around Gobichettipalayam
and Bhavani sagar area. A minor unit consisting of marbles, calc-silicates, garnet-
sillimanite-schists occur around Madukarai, NNE of Palghat (Gopalkrishnan et al., 1975).
The rocks in middle reaches of Kaveri river are predominantly granulitic gneisses,
which have been subjected to high grade polyphase deformation, shows banded
migmatitic structure and fold patterns, and are composed of granulite facies assemblage
of plagioclase, quartz, orthopyroxene, garnet and biotite (John et al., 2005). Chlorite
schists are exposed between south of Shevoroy hills to Kaveri river. Pedogenic calcretes
are found in the banks of Amaravati, Noyil and Bhavani tributaries (Durand et al., 2006).
Amaravati exclusively flows through the migmatised gneisses and the charnockites.
Oddanchatram anorthosite complex rocks are exposed in the upper reaches of river
Amaravati. Cretaceous sediments consisting of conglomeratic sandstone, fossiliferous
limestone and shale are exposed north of Trichinapally, where Kaveri starts forming delta
(Fig. 2.3). The tributary Marudaiyar originates from south of Permbalur, where granitic
gneisses are exposed and flows across a thin band of Upper Gondwana formation and a
thick sequence of Cretaceous sediments of Uttatur, Trichinapally, Ariyalur formation
before joining to the Coleroon river. The Tertiary formations consist of argillaceous and
ferruginous sandstone, clay and sands, exposed north of river Coleroon (Subramanian and
Selvan, 2001). The delta and mouth of the river consists of recent alluvium deposits.
2.9 The Geology of the Palar and Ponniyar River Basin:
The Palar and Ponnaiyar originate from the eastern Dharwar craton, and flow
through granitoid gneisses (Hornblende gneiss, Hornblende-Biotite gneiss, Migmatitic
gneiss) and granitoid intrusives and supracrustal rocks of tholeiitic and komatiitic affinity
in the upper reaches (Balakrishnan and Rajamani, 1987). Kolar schist belt rocks are
exposed both in Palar and Ponnaiyar river drainage basins. It consists of dolerite dykes,
granites, acid volcanics, polymict conglomerate, volcano-clastic sediments, champion
gneiss, banded ferruginous chert, magnetite quartzite inter bedded, schistose amphibolite,
meta-basalt, meta-gabbro, tholeiitic and komatiitic rocks. Granulites are present at the
middle reaches of Palar river, after Arcot the river passes through Recent alluvium and
18
lower Gondwana formation followed by granulites and coastal alluvium. Within the Palar
River basin Gondwana sediments occur as three distinct patches Sriperumbudur,
Kanchipuram and Maduranthakam areas. Maduranthakam formation (Talcher sediments
of glacial origin) made up of boulder bed, green shales and overlain by green shale with
sandstone parting and ovoid masses of limestone with fine grained texture (Subramanian
and Selvan, 2001). These rocks are exposed near Tachuchur, 100 km south-west of
Chennai, whereas other two formations are covered by thick soil and the geological
information is based on the limited outcrops and borehole data (Subramanian and Selvan,
2001). Palar joins the Bay of Bengal without forming any delta (Fig 2.3). Ponnaiyar river
also passes through Archean rocks of eastern Dharwar craton, granulites, and Recent
alluvium near to the east coast. Serpentinised dunite, corundum syenite, enclaves of
peridotite and magnesite veins, amphibolite and mafic quartzite are present in the
Ponniyar river catchment area around Thiruvadattanur (Subramanian and Selvan, 2001).
2.10 Sampling:
Two phases of field campaigns were carried out during November 2005 and May
2006 corresponding to monsoon and pre-monsoon periods respectively. Monsoon river
water samples were collected from Kaveri, Palar and Ponnaiyar rivers, whereas pre-
monsoon samples were collected from Kaveri river and from its tributaries Marudaiyar,
Aiyar, Amaravati, Nagnaji, Kodvanour, Noyil, Bhavani, Moyar, Pyakara, Saravanga,
Toppayar, Nagavari, Chinnar, Arkavati, Shimsa and Kapila
Kabini. During 2nd phase of
the sampling calcretes from the river bed and eight open and bore well water samples
were collected near to the river course. Details of the sample type, numbers and sampling
period are given in the Table 2.1. Besides this one moisture and three rain water samples
were collected at Pondicherry for the isotope and chemical analysis. All sample numbers,
location, latitude and longitude are given in the Appendix
I.
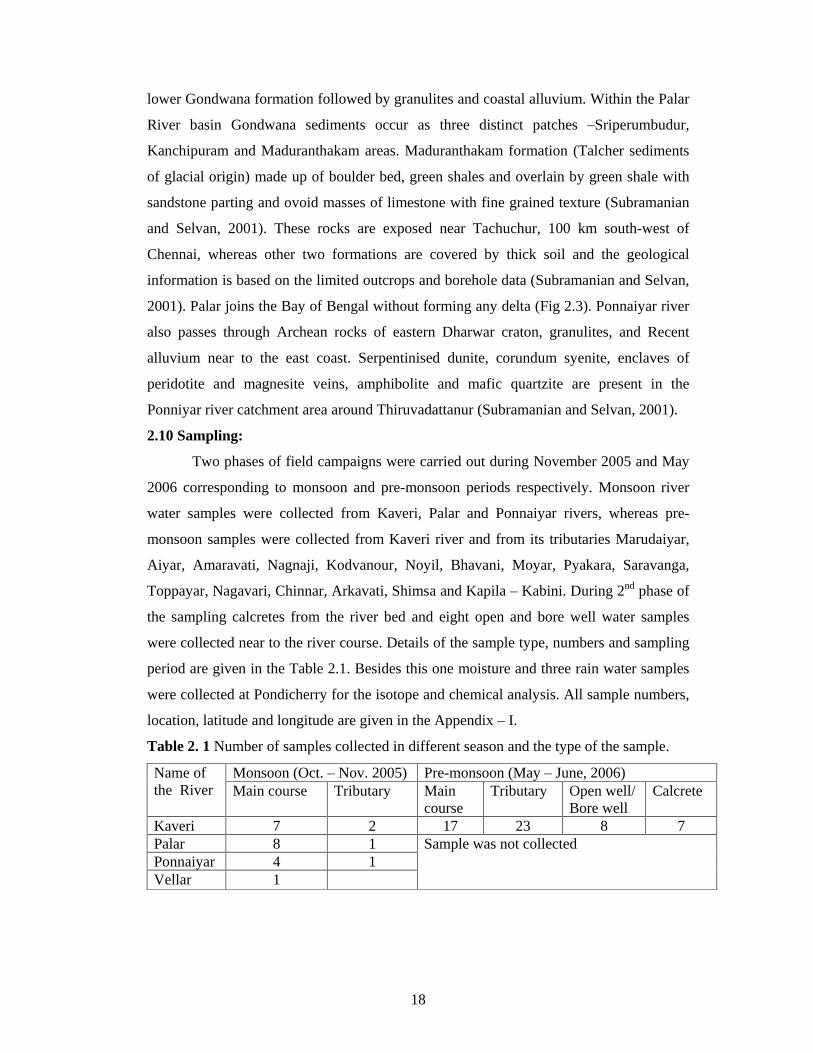
Table 2. 1 Number of samples collected in different season and the type of the sample.
Name of the River
Monsoon (Oct.
Nov. 2005) Pre-monsoon (May
June, 2006) Main course Tributary Main
course Tributary Open well/
Bore well Calcrete
Kaveri 7 2 17 23 8 7 Palar 8 1 Sample was not collected Ponnaiyar 4 1 Vellar 1
19
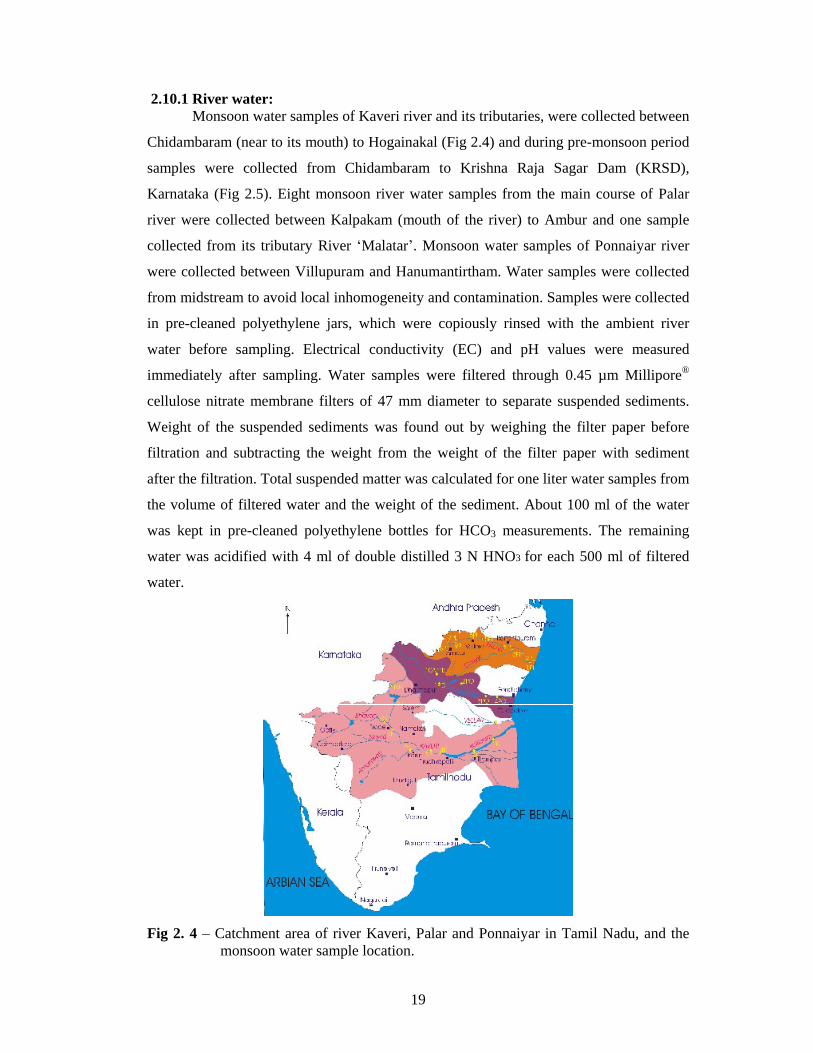
2.10.1 River water: Monsoon water samples of Kaveri river and its tributaries, were collected between
Chidambaram (near to its mouth) to Hogainakal (Fig 2.4) and during pre-monsoon period
samples were collected from Chidambaram to Krishna Raja Sagar Dam (KRSD),
Karnataka (Fig 2.5). Eight monsoon river water samples from the main course of Palar
river were collected between Kalpakam (mouth of the river) to Ambur and one sample
collected from its tributary River Malatar . Monsoon water samples of Ponnaiyar river
were collected between Villupuram and Hanumantirtham. Water samples were collected
from midstream to avoid local inhomogeneity and contamination. Samples were collected
in pre-cleaned polyethylene jars, which were copiously rinsed with the ambient river
water before sampling. Electrical conductivity (EC) and pH values were measured
immediately after sampling. Water samples were filtered through 0.45 µm Millipore®
cellulose nitrate membrane filters of 47 mm diameter to separate suspended sediments.
Weight of the suspended sediments was found out by weighing the filter paper before
filtration and subtracting the weight from the weight of the filter paper with sediment
after the filtration. Total suspended matter was calculated for one liter water samples from
the volume of filtered water and the weight of the sediment. About 100 ml of the water
was kept in pre-cleaned polyethylene bottles for HCO3 measurements. The remaining
water was acidified with 4 ml of double distilled 3 N HNO3 for each 500 ml of filtered
water.
Fig 2. 4
Catchment area of river Kaveri, Palar and Ponnaiyar in Tamil Nadu, and the monsoon water sample location.

20
For preparation of blanks, Milli-Q® grade water was passed through Millipore®
filter paper and one aliquot acidified with same ratio as for the sample and both the
aliquots stored to assess the blank contribution resulting from sample processing.
Fig 2.5 Kaveri drainage system and the pre-monsoon sample locations.
2.10.2 Calcrete, Rain water and moisture:
Calcretes were collected from the bed near to the river bank and stored in labeled
zip-packed polyethylene bags. Calcrete samples were cleaned thoroughly with Elix®
grade water, dried and powdered into -200 mesh size using agate mortar before using for
geochemical measurements.
Rainwater sample collected from terrace of the Department of Earth Sciences (11º
59 N 79º 53 E) building and all the three rainwater were collected during the evening
time between 7.00 to 9.00 pm. This building is 400 m away from the beach (coast of Bay
of Bengal). Rain water was collected manually using a large diameter PP funnel (30 cm)
fitted to a 10 liter PP jar and total assemble was kept one meter above the terrace ground.
On the top of the funnel plastic sieve was kept for avoiding unwanted fall. One moisture
sample was collected inside the department building using a PP tray and a jar. A PP jar
was filled with ice cube kept on the top of a tray and it was covered with a <1mm grid
21
net. Precipitated moisture was transferred to PP bottle at every half an hour interval. After
collection it was treated in the same way as the river water sample. During the sample
collection utmost care has been taken to avoid contamination.
2.11 Analytical Techniques
2.11.1 pH and Temperature:
The pH and temperature of the water samples were measured using a
microprocessor based pH meter (Systronics pH system, 361) with a precision of ±0.01
pH unit and ±0.2° C. Prior to pH measurement, the meter was calibrated using freshly
prepared buffer solutions of pH 4, 7 and 9.2, from the buffer capsules (Merck®).
Temperature was measured by dipping the probe into the water samples and the readings
attained steady values within 1 or 2 minutes.
2.11.2 Conductivity:
Electrical conductivity (EC) was measured using a microprocessor based EC
meter (Systronics Conductivity Meter 306), having EC range from 0.1 S/cm to 100
mS/cm. The instrument shows the conductivity of the solution under test along with its
temperature. The conductivity can be displayed at the existing temperature as it is, or can
be displayed corresponding to the standard temperature of 25º C, that is, with temperature
compensation. Prior to EC measurement the instrument was calibrated and set using
0.01m KCl standard solution prepared from GR grade KCl salt (Merck®).
2.11.3 Major Ions:
2.11.3.1 Bicarbonates:
Bicarbonate was determined following potentiometric titration method. Standards
of HCO3 were prepared for required concentration from chemical salt NaHCO3. 30 ml of
each standard and samples were titrated against 0.006N HCl and pH 4.5 is taken as the
end point of the reduction using Methyl orange as pH indicator. A graph was plotted for
standard concentrations against the volume of HCl consumed. The concentrations of the
samples were determined from the calibration curve plotted for standards.
In the laboratory, Cl-, SO4
2-, PO4
3- and H4SiO4 were measured following Mercury-
II thiocyanite method, turbimetric method, ascorbic acid method and molybdosilicate
method (APHA, 1985), respectively with aid of Systronics spectrophotometer (model no.
166, single beam grating, wavelength range of 340
990 nm). The analytical
uncertainties are better than 10%.

22
2.11.3.2 Chloride
Chloride ion concentration was measured by the mercury II thiocyanite method.
The method involves the reaction of chloride with mercury II thiocyanite to form
chloromercurate II complex ion, with the liberation of thiocyanite ions which then react
with Iron III to give the light red colour (Florence and Farrar, 1970; Singh, 1997).
Solution is prepared by adding of 2 ml iron nitrate (prepared by 15.1 gm Fe (NO3).9H2O
in 45 ml of 70% perchloric acid and diluted 100 ml with elix grade water), 2 ml mercury
thiocyanite saturated solution, 1 ml of elix and 20 ml of sample or standard. Standard
solution for different concentration was prepared from KCl (Merck®) salt. Absorbance of
the prepared solution was measured after five minutes at 460 nm. The concentrations of
the samples were determined from the calibration curve of standards.
2.11.3.3 Sulphate
Sulphate concentration was measured by turbimetric method (APHA, 1985). The
method is based on the principle that SO4 is precipitated in an acetic medium with barium
chloride (BaCl2), so as to form barium sulphate crystal of uniform size (Singh, 1997). 50
ml of standard (prepared from MnSO4 H2O) or samples were measured in a volumetric
flask and 10 ml of buffer solution (prepared by dissolving 30 gm of MgCl2 6H2O, 5 gm of
Sodium Acetate, 1 gm Potassium Nitrate and 0.111 gm of Sodium Sulphate and 20 ml of
acetic acid in 500 ml of distilled water and then the total volume was made-up to 1000ml)
was added and mixed with the help of magnetic stirrer. While stirring a spoonful of BaCl2
crystal was added. This mixture was stirred for 60 seconds at constant speed. After the
stirring period, solution was poured into absorbance cell of the photometer and
absorbance reading was taken at 420 nm after 5 minutes. Sulphate concentration of the
sample was determined by comparing the reading with calibration curve.
2.11.3.4 Phosphate
Phosphate was determined by the ascorbic acid method (APHA, 1985). Phosphate
standard solutions of different concentration were prepared from the potassium
dihydrogen phosphate (KH2PO4) (Singh, 1997). Standards and samples of 20 ml were
pipetted out into a 50 ml volumetric flask and 5 ml of molybdate antimony solution and 2
ml of ascorbic acid solution was added and mixed well. The mixture was diluted to 50 ml
and absorbence was measured at 640 nm using spectrophotometer. Molybdate solution
was prepared by dissolving 4.8 g of ammonium molybdate and 0.1 g of sodium antimony
titrate in 400 ml of 4 N sulphuric acid and making the total volume to 500 ml with the
same acid. Ascorbic acid was prepared by dissolving 2 g of ascorbic acid in 100 ml water.
23
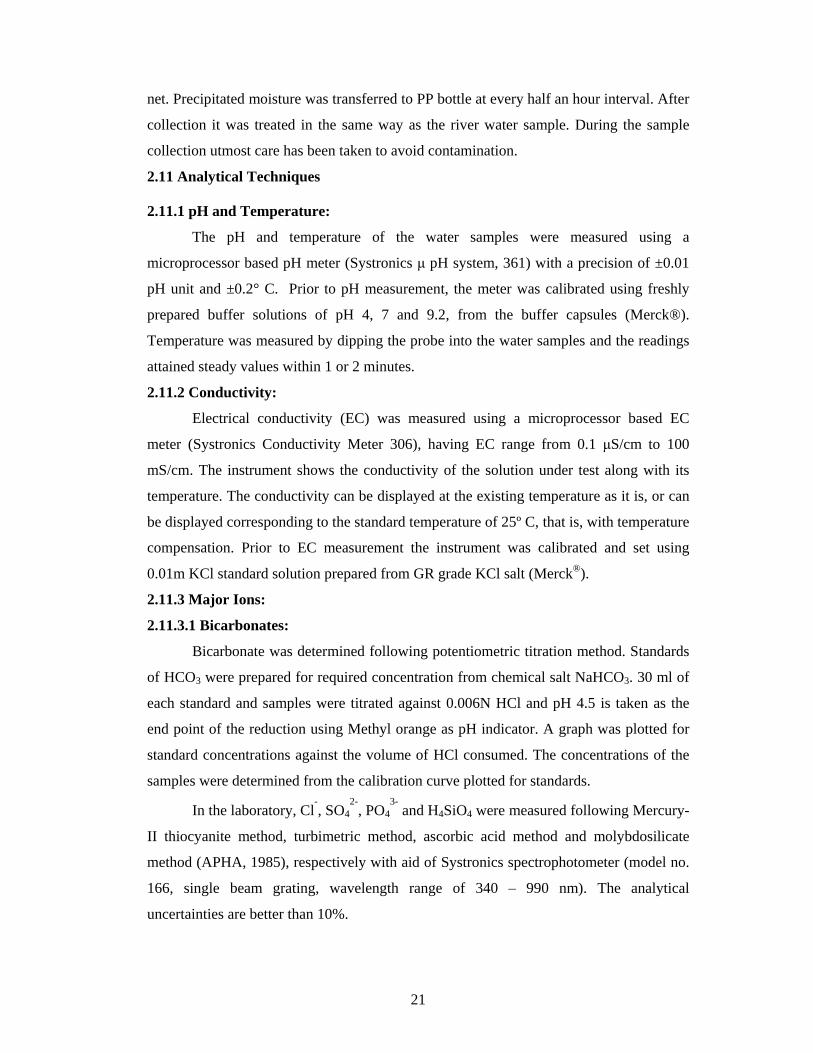
Absorbance measurements were taken after different time interval of the preparation of
solution such as immediate, after 15 min, 30 min and 40 min. The absorbance value
remains nearly same as seen from the calibration curve (Fig 2. 6). The concentrations of
the samples were determined from the graph plotted for standards.
Absorbance0.0 0.1 0.2 0.3 0.4 0.5 0.6
Co
nce
ntr
atio
n (
pp
m)
0
1
2
3
4
5
6
afetr mixafter 15 min after 30 min aftrer 40 min
Fig 2.6
Graph Plotted between absorbance and concentration for PO4 standard at different time interval to verify the difference among them.
Concentration (ppm)
0 10 20 30 40 50 60
Co
nce
ntr
atio
n (
pp
m)
0
10
20
30
40
50
60
Measured ValueCalculated Value
A
Concentration (wt%)45 50 55 60 65 70 75
Co
nce
ntr
atio
n (
wt%
)
45
50
55
60
65
70
75
Given ValueICP-AES Measured ValueSpect. phot. Measured Value
B
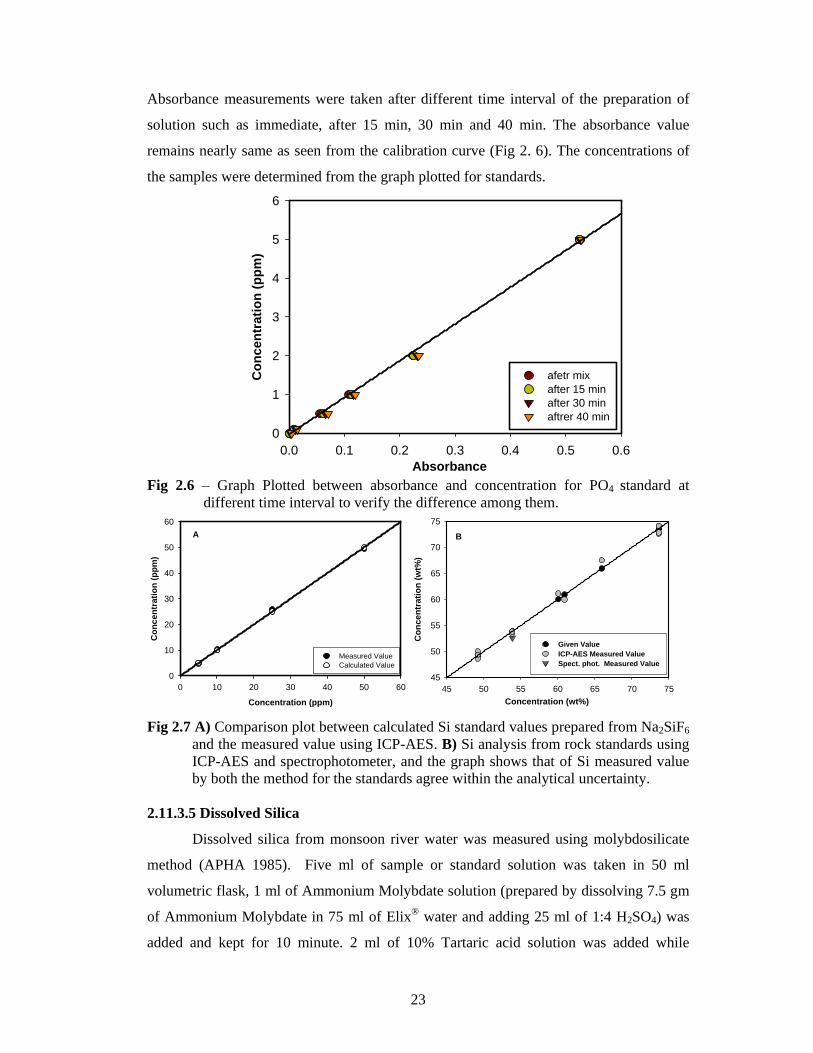
Fig 2.7 A) Comparison plot between calculated Si standard values prepared from Na2SiF6
and the measured value using ICP-AES. B) Si analysis from rock standards using ICP-AES and spectrophotometer, and the graph shows that of Si measured value by both the method for the standards agree within the analytical uncertainty.
2.11.3.5 Dissolved Silica
Dissolved silica from monsoon river water was measured using molybdosilicate
method (APHA 1985). Five ml of sample or standard solution was taken in 50 ml
volumetric flask, 1 ml of Ammonium Molybdate solution (prepared by dissolving 7.5 gm
of Ammonium Molybdate in 75 ml of Elix® water and adding 25 ml of 1:4 H2SO4) was
added and kept for 10 minute. 2 ml of 10% Tartaric acid solution was added while

24
swirling the flask. 0.5 ml of reducing reagent (prepared by dissolving 0.7 gm of Sodium
Sulphite in 10 ml of Elix® and then 0.15 gm of 1- amino 2-napthol 4-sulphonic acid was
added and stirred well, 9 gm of sodium bisulphate was dissolved in 90 ml of water and
this was added to first solution) was added then the volume made up to 50 ml by adding
Elix® water. The samples were stirred properly and kept for 30 minutes. The absorbance
was measured for standard as well as, samples at 650 nm using Spectrophotometer. The
concentrations of the samples were determined from the graph plotted for standards (Fig.
2.7). Silica measurement for pre-monsoon water sample was carried out by ICP-AES.
The laboratory standards for Si analysis were prepared by dissolving analytical grade
Na2SiF6.
2.11.3.6 Major cations:
Ca, Mg, Ba, Sr, Na, K and Rb were measured by ICP-AES (Jobin Yvon, Ultima
2) from acidified filtered water samples, by sequential scanning of emission lines at
suitable wavelengths. This ICP-AES has a monochromator of 1000 mm focal length
which is based on Czerny-Turner optical system, holographic double grating (Grating 1
4320 grooves/mm with PM1:106, Grating 2
2400 grooves/mm with PM2:446) and it
changes automatically from 1 to 2 above 400 nm wavelength. The laboratory standards
for Ca, Mg, Ba, Sr, Na, K and Rb were prepared by dissolving analytical grade CaCl2
(fused), MgCl2, BaCl2 2H2O, Sr (NO3)2, NaCl, KCl and RbCl respectively and for the
analysis, calibration curves were generated from these standards. Standards were
analyzed on the same calibration lines to check the accuracy of the measurements. Na, K
and Rb were analyzed in sheath gas flow mode. In ICP-AES the detection limit for above
elements are much lower than the minimum concentration observed in the water samples
and with a precision better than 5%.
2.11.4 Calcretes
About 10 mg powdered calcrete samples (7 nos) were taken in 3 ml savilex vial
and washed with Milli Q® grade water, subsequently subjected to ultrasound treatment for
15 minutes. After decanting the water, 1 ml 1 M acetic acid added into each vial and kept
for 12 hours. The silicate minerals which are present in the calcrete will not dissolve in
the 1 M acetic acid and remain in the residue. Residues were filtered out using Whatmen®
(No. 42) filter paper and clear solution dried completely in a Teflon beaker on the hot
plate. One ml of 2 M HCl added into each vial and stored for the determination of the
isotopic composition (IC) of Sr after following the cation exchange column
chromatography to concentrate Sr. 19KNT7 calcrete sample was spiked with previously

25
calibrated mixed Rb-Sr isotope tracer solution (Anand, 2007) to estimate Sr concentration
by isotopic dilution (ID) method.
For elemental analysis about 50 mg powdered calcrete sample were taken in
Teflon beaker and washed thoroughly like discussed above. After leaching for 12 hours,
solutions were filtered and finally made to 10 ml volume. All the elemental analysis was
carried out using ICP-AES after calibrating with the laboratory standards.
2.11.5 Sr Isotope Analysis
The isotopic composition (IC) and isotopic dilution (ID) of Sr was determined
precisely using multi collector Thermal Ionization Mass Spectrometer (TRITON of
Thermo-Finnigan). Sr was concentrated from all the samples (water and calcrete) using
cation exchange column chromatography techniques before loading on the filament.
Double distilled (using sub-boiling quartz still) Merck® GR grade acids (DD), Milli-Q®
grade ultra pure water (MQ), PFA labwares (Savillex, Teflon), Ependrof pippets (both
fixed and adjustable), disposable PP pippets tip were used in a clean laboratory to
measure Sr isotopic composition (IC) with low blank value.
Sample digestion/leaching, column calibration and Sr separation, sample loadings
were carried out using double distilled HCl/HNO3 and Milli Q grade water. For Sr
separation, 3 ml quartz columns and 2 ml Bio-Rad (PP) columns (clean up column) filled
with Bio-Rad AG50-WX8 (Cl-) cation-exchange resin (-200-400 mesh) were used and
both were calibrated for the elements Rb, Sr, Ca, Fe, Mg, Al, Na, K and REE. Known
amount of above elements was taken as solution in 1 ml of 2 N HCl and loaded onto the
cation exchange columns. The elution was carried out using calibrated 2 N HCl in steps
and the cuts were analysed using ICP
AES. Calibration graph for 3 ml quartz column is
given in the Fig 2. 8. Clean up column for Sr were used if the dried Sr fraction was bulky,
and Sr was collected in 7 ml 2 N HCl after eluting 8 ml 2 N HCl.
Table 2. 2
Volume of water used for the Sr isotope study, no of sample, replicates and number of blank and Isotopic Dilution run for the concentration measurement.
Water Samples ml used for Sr IC
No. of sample
Replicates No of Blank runs
Monsoon 100 24 6 1 Pre-monsoon, 19KNT7 & 20KNT8, 44KNBW7,
30 48 13 2 20
100 Rain 150 3 1 Moisture 40 1

26
About 20
100 ml (except rain water) acidified water samples (Table 3. 3) were
taken in PFA beakers and kept on the hot plate for complete drying. Sample volumes
were decided based on their Sr concentration, to yield at least 1µg Sr for the easy mass
spectrometry measurement. After adding 1 ml of 2 M HCl in each beaker clear solution
were loaded in the 3 ml quartz columns (HCl). All the beakers were rinsed with another 1
ml 2 M HCl and loaded into the column. After eluting 6 RBV (resin bed volume) 2 M
HCl, Sr was collected with 10 ml of 2 N HCl. Collected Sr aliquots were dried and
purified further (if necessary) by passing through 2 ml columns Bio-Rad (PP). Finally,
collected Sr was dried completely and kept for loading on the Re filament. After each
batch of sample processing resins were eluted with 2 M, 4 M HCl (5 RBV each) and 6 M
HCl (10 RBV) acid for cleaning the resin and after this regeneration step resins will be set
for the processing another batch of samples. The above procedure was employed for
isotope analysis on water (n= 103) and calcrete (n = 7) samples.
Volume
Co
nce
ntr
atio
n (
pp
m)
0
20
40
60
80
100
120
140
160Rb K Al Ca Ce Fe Mg Sr Yb
20 ml of 2 M HCl Elution 10 ml of 2 M HCl Sr Collection
Fig 2. 8
Graph shows the different elements concentration (ppm) that were separated using 3 ml quartz column filled with cation exchange resin.
2.12 Mass Spectrometry
Pre-concentrated Sr was loaded on purified and degassed rhenium (Re) filaments
as SrNO3 sandwiched between Ta activator. One micro liter Tantalum oxide (TaO)
activator was loaded on a pre-warmed (degassed) Re single filament and dried at 0.5 A
current. Pre-concentrated dried Sr was dissolved in 1 µl of 1N HNO3 and loaded on top of

27
TaO on the filament and dried at 0.5 A current. 1 µl of Tantalum oxide (TaO) activator
was again loaded on top of the sample making a sandwich of sample between layers of
TaO. After sample
TaO layers dried, the filament was heated by increasing the current
to 1.8 A for 1 minute and then heated to dull red colour for about 20 seconds and the
filament current reduced to zero rapidly. These filaments were transferred to the turret,
which was loaded into the TIMS for analysis. Instrumental mass fractionation during the
determination of Sr isotopic compositions in standards and samples was corrected by
internally normalizing the measured ratios by the ratios 86Sr/88Sr = 0.1194 for Sr using
exponential fractionation law.
Each Sr
IC analysis of standard or sample consisted of 220 ratio measurements
(20 blocks of 11 measurements each) in the static mode. During measurement, cup
rotation, base line calibration and auto focusing were performed at fixed intervals of four
blocks.
Table 2. 3 All the measured 87Sr/86Sr ratios of SRM 987 are given in the table with date and standard error. The average value of 87Sr/86Sr ratios and standard deviation is given.
Date 87Sr/86Sr Std. Err.
Date 87Sr/86Sr Std. Err.
16/12/2005
0.710235 0.000007
05/06/2007
0.710246 0.000005
21/12/2005
0.710240 0.000005
06/11/2007
0.710249 0.000004
12/01/2006
0.710244 0.000007
11/11/2007
0.710237 0.000004
15/01/2006
0.710246 0.000005
13/11/2007
0.710250 0.000005
16/01/2006
0.710239 0.000007
15/11/2007
0.710248 0.000004
20/01/2006
0.710240 0.000005
16/11/2007
0.710259 0.000004
21/01/2006
0.710248 0.000005
17/11/2007
0.710250 0.000003
05/05/2007
0.710243 0.000007
18/11/2007
0.710252 0.000005
06/05/2007
0.710254 0.000005
20/11/2007
0.710252 0.000002
17/05/2007
0.710239 0.000005
25/11/2007
0.710248 0.000002
20/05/2007
0.710247 0.000005
28/11/2007
0.710247 0.000003
30/05/2007
0.710243 0.000005
09/12/2007
0.710245 0.000003
30/05/2007
0.710245 0.000005
Average 0.710245 0.000005
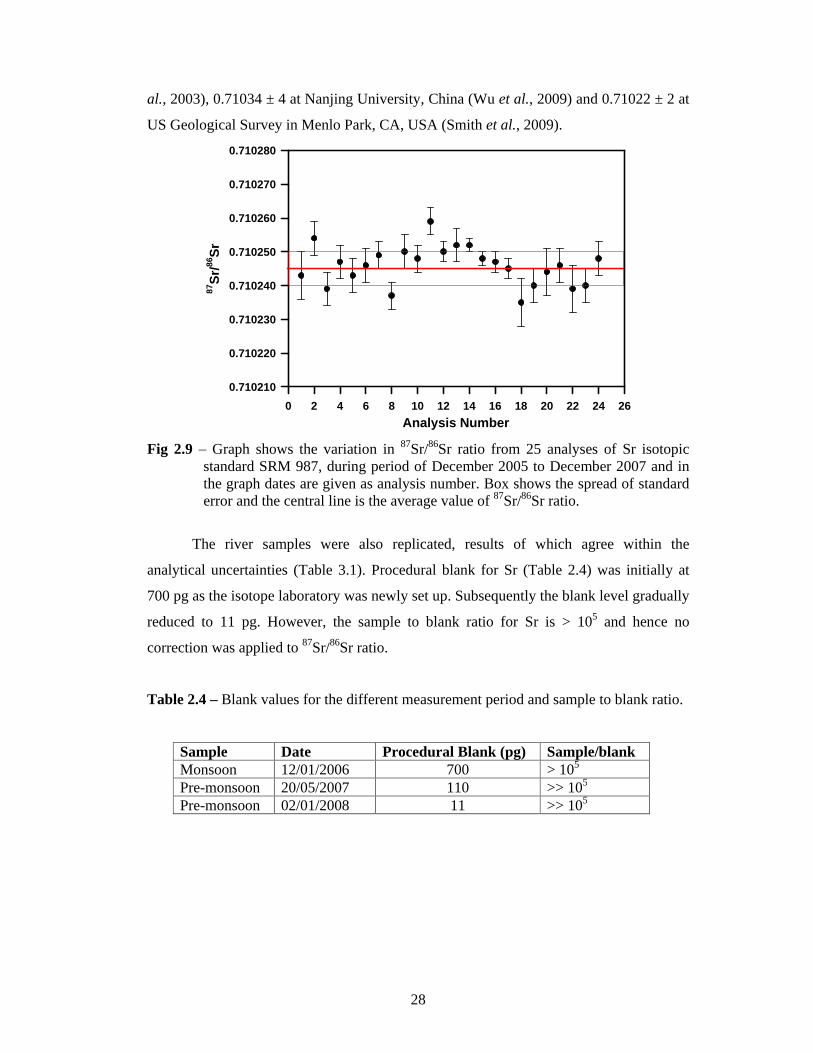
Sr isotope analysis of international standard SRM 987 was carried out repeatedly
during the course of analysis of samples to check the accuracy and precision of the
analysis. The mean value of 87Sr/86Sr ratio of 0.710245 with an external precision of
0.000005 (1 ) (Fig 2.9) was obtained from 25 number of standard measurements (Table
2. 3). The recommended 87Sr/86Sr ratio for SRM 987 is 0.710240. The reported mean
value of SRM 987 in other laboratories are 0.710184 ± 17 at NGRI, Hydrabad (Dalai et
28
al., 2003), 0.71034 ± 4 at Nanjing University, China (Wu et al., 2009) and 0.71022 ± 2 at
US Geological Survey in Menlo Park, CA, USA (Smith et al., 2009).
Analysis Number0 2 4 6 8 10 12 14 16 18 20 22 24 26
87S
r/86
Sr
0.710210
0.710220
0.710230
0.710240
0.710250
0.710260
0.710270
0.710280
Fig 2.9
Graph shows the variation in 87Sr/86Sr ratio from 25 analyses of Sr isotopic standard SRM 987, during period of December 2005 to December 2007 and in the graph dates are given as analysis number. Box shows the spread of standard error and the central line is the average value of 87Sr/86Sr ratio.
The river samples were also replicated, results of which agree within the
analytical uncertainties (Table 3.1). Procedural blank for Sr (Table 2.4) was initially at
700 pg as the isotope laboratory was newly set up. Subsequently the blank level gradually
reduced to 11 pg. However, the sample to blank ratio for Sr is > 105 and hence no
correction was applied to 87Sr/86Sr ratio.
Table 2.4
Blank values for the different measurement period and sample to blank ratio.
Sample Date Procedural Blank (pg) Sample/blank Monsoon 12/01/2006 700 > 105
Pre-monsoon 20/05/2007 110 >> 105
Pre-monsoon 02/01/2008 11 >> 105