21 august 2012 - rakesh jhunjhunwala · water treatment solutions, emulsion paints, and oilfield...
TRANSCRIPT
Institutional Equities
Initi
atin
g C
over
age
Reuters: VO.BO; Bloomberg: VO IN
Vinati Organics
Unique Story In Indian Specialty Chemical Space Vinati Organics (VOL) is present in niche specialty chemicals business with global leadership status, strong client base, high technology barriers, excellent management with a distinguished track record, making it a compelling growth story in Indian specialty chemicals industry. VOL is a global leader in isobutyl benzene (IBB) and acrylamido tertiary-butyl sulfonic (ATBS) with a market share of 65% and 45%, respectively, and a domestic leader in isobutylene (IB) with a 70% market share. After posting robust growth in the past, VOL is set to move into its next growth orbit. We believe the growth levers will come from: 1) Capacity expansion with launch of new products, and 2) Demand pick up for ATBS. We expect VOL’s margins to stay at an elevated level on account of: 1) Increased sales contribution from new products having a margin profile better than IBB and IB, 2) Continuous synergestic integration of new products keeping VOL a cost leader 3) Cost savings from co-generation plant, and 4) Low raw material prices on account of the decline in global crude oil prices. New product pipeline: VOL will launch new products in a phased manner in FY17 and FY18. The company has invested ~Rs1,500mn in capacity expansion. We expect VOL to add revenues of ~Rs425mn and ~Rs925mn from its new products in FY17 and FY18, respectively. We expect the contribution to total revenues from new products to improve from 12% in FY15 to 26% by FY18E. Sales from new products are expected to post a CAGR of 38% from Rs881mn in FY15 to Rs 2,302mn in FY18. Improved product mix to improve blended margins: ATBS and other products (mainly High Purity- Methyl Tertiary Butyl Ether) enjoy highest margins among 14 products of VOL followed by IB and IBB. Blended margins of VOL were at 26.0% in FY15 and 32.6% YTD. New products have a margin profile somewhere between the margin profiles of ATBS and IBB. Increased revenue contribution from these new products will keep margins at elevated level of 31%/31%/29% in FY16E/FY17E/FY18E, respectively. Incremental revenue growth from ATBS segment: ATBS has shown strong revenue CAGR of 18% over FY11-FY15. Growth in ATBS segment is mainly driven by growth in water treatment solutions, emulsion paints, and oilfield and mining chemicals. Post crude oil price decline since 2QFY15, demand for Enhanced Oil Recovery (EOR) – which makes up for 15%-20% of ATBS revenues, declined substantially and we do not believe it will recover in the short term. However, we expect the demand for ATBS from other segments to remain healthy and hence believe ATBS sales will post a CAGR of 17% over FY16E-FY18E. Valuation: VOL is expected to clock revenue/EBITDA/PATCAGR of 23%/18%/20%, respectively, over FY16E-FY18E. VOL stock currently trades at P/E of 17x FY17E and 14x FY18E earnings. We have valued the stock based on 18x FY18E earnings (average P/E for past two years is 19x) and assigned Buy rating to it with a target price of Rs547, up 32% from the current market price.
BUY
Sector: Specialty Chemicals
CMP: Rs415
Target Price: Rs547
Upside: 32%
Akhil Parekh [email protected] +91-22-3926 8093
Key Data
Current Shares O/S (mn) 51.6
Market Cap (Rsbn/US$mn) 21.4/322.4
52 Wk High /Low (Rs) 668/361
Daily Volume (3M NSE Avg.) 28,701
Shareholding (%) 3QFY16 2QFY16 1QFY16
Promoter 72.3 72.3 72.3
Public 27.7 27.7 27.7
Others - - -
One-Year Indexed Stock Performance
Price Performance (%)
1 M 6 M 1 Yr
Vinati Organics 1.1 (5.8) (32.9)
Nifty Index 2.1 (5.8) (12.6)
Source: Bloomberg, BSE
Y/E March (Rsmn) FY14 FY15 FY16E FY17E FY18E
Revenue 7,053 7,809 6,159 7,390 9,275
YoY (%) 26.7 10.7 (21.1) 20.0 25.5
EBITDA 1,621 2,009 1,908 2,263 2,665
% of sales 23.0 25.7 31.0 30.6 28.7
Adj. PAT 862 1,158 1,082 1,290 1,569
YoY (%) 25.4 34.4 (6.6) 19.3 21.5
Adj. EPS (Rs) 17.5 22.4 21.0 25.0 30.4
RoE (%) 31.3 31.1 22.6 22.4 22.6
RoCE (%) 26.7 31.8 27.0 28.1 29.0
P/E (x) 23.8 18.5 19.8 16.6 13.7
P/BV (x) 6.6 4.9 4.1 3.4 2.8
Source: Company, Nirmal Bang Institutional Equities Research
50
60
70
80
90
100
110
120
130
Apr-15 Jun-15 Aug-15 Oct-15 Dec-15 Feb-16
VINATI ORGANICS Nifty 50
12 April 2016
Institutional Equities
Vinati Organics 2
Investment rationale
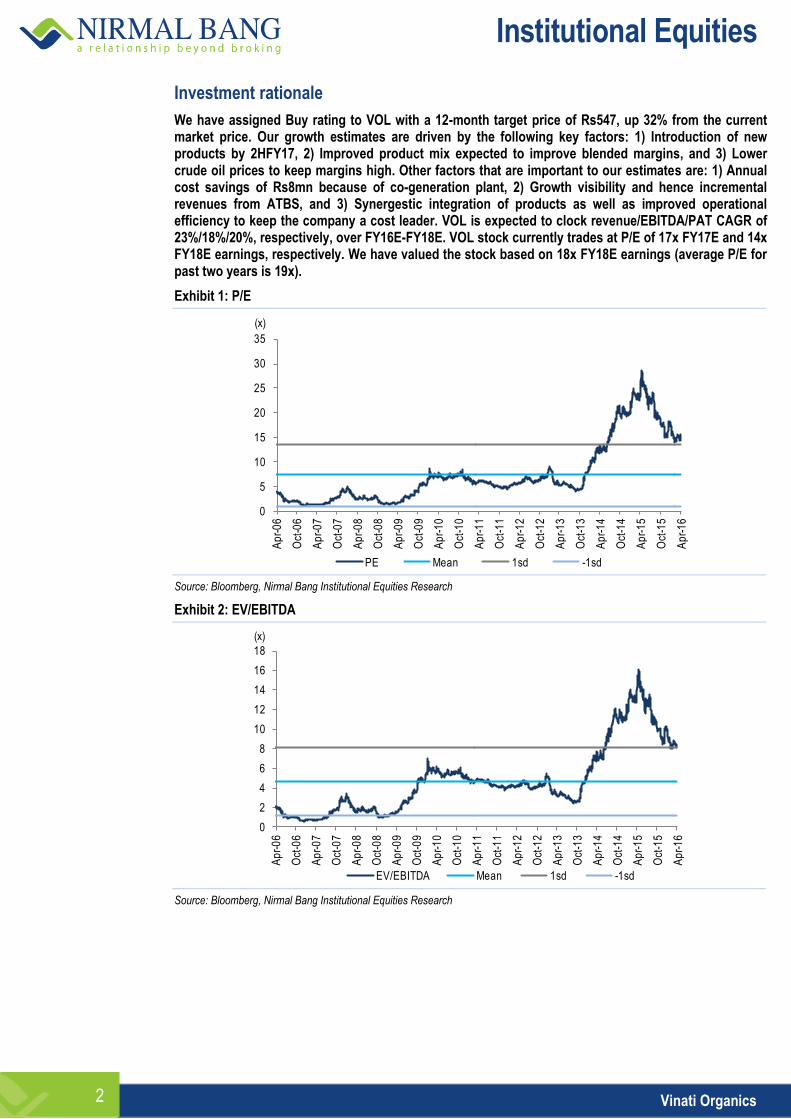
We have assigned Buy rating to VOL with a 12-month target price of Rs547, up 32% from the current market price. Our growth estimates are driven by the following key factors: 1) Introduction of new products by 2HFY17, 2) Improved product mix expected to improve blended margins, and 3) Lower crude oil prices to keep margins high. Other factors that are important to our estimates are: 1) Annual cost savings of Rs8mn because of co-generation plant, 2) Growth visibility and hence incremental revenues from ATBS, and 3) Synergestic integration of products as well as improved operational efficiency to keep the company a cost leader. VOL is expected to clock revenue/EBITDA/PAT CAGR of 23%/18%/20%, respectively, over FY16E-FY18E. VOL stock currently trades at P/E of 17x FY17E and 14x FY18E earnings, respectively. We have valued the stock based on 18x FY18E earnings (average P/E for past two years is 19x).
Exhibit 1: P/E
Source: Bloomberg, Nirmal Bang Institutional Equities Research
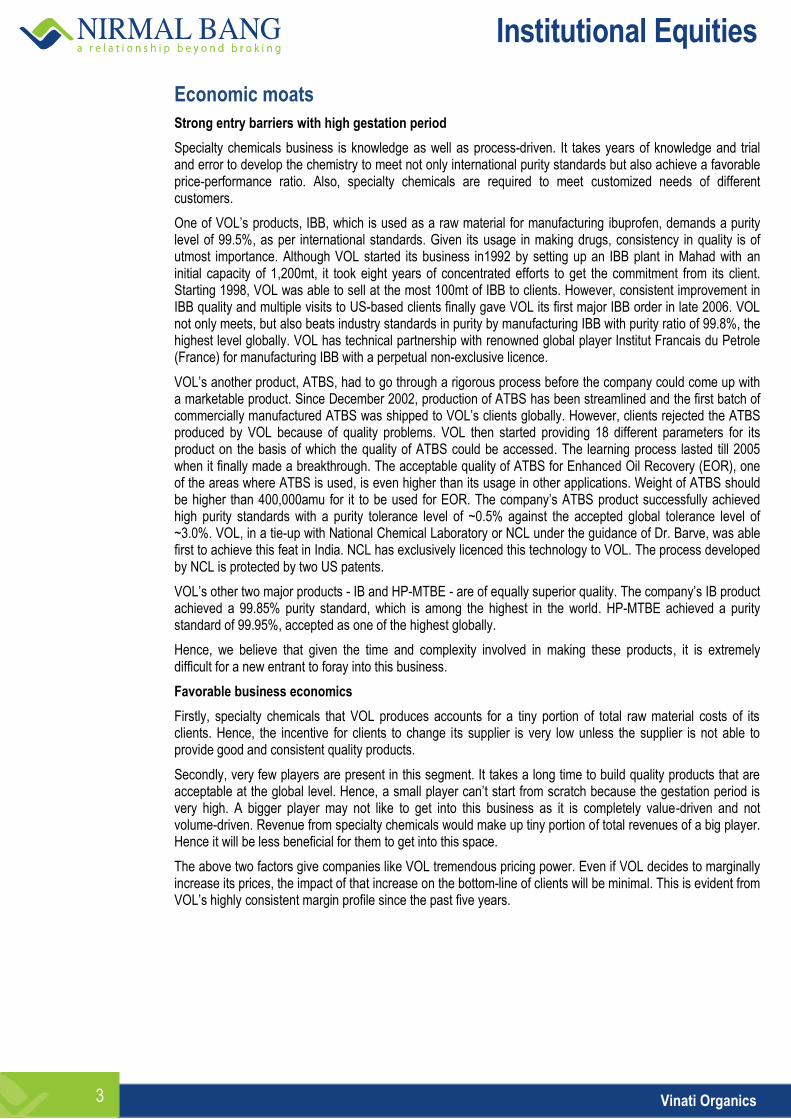
Exhibit 2: EV/EBITDA
Source: Bloomberg, Nirmal Bang Institutional Equities Research
0
5
10
15
20
25
30
35
Ap
r-0
6
Oct
-06
Ap
r-0
7
Oct
-07
Ap
r-0
8
Oct
-08
Ap
r-0
9
Oct
-09
Ap
r-1
0
Oct
-10
Ap
r-1
1
Oct
-11
Ap
r-1
2
Oct
-12
Ap
r-1
3
Oct
-13
Ap
r-1
4
Oct
-14
Ap
r-1
5
Oct
-15
Ap
r-1
6
PE Mean 1sd -1sd
(x)
0
2
4
6
8
10
12
14
16
18
Ap
r-0
6
Oct
-06
Ap
r-0
7
Oct
-07
Ap
r-0
8
Oct
-08
Ap
r-0
9
Oct
-09
Ap
r-1
0
Oct
-10
Ap
r-1
1
Oct
-11
Ap
r-1
2
Oct
-12
Ap
r-1
3
Oct
-13
Ap
r-1
4
Oct
-14
Ap
r-1
5
Oct
-15
Ap
r-1
6
EV/EBITDA Mean 1sd -1sd
(x)
Institutional Equities
Vinati Organics 3
Economic moats
Strong entry barriers with high gestation period
Specialty chemicals business is knowledge as well as process-driven. It takes years of knowledge and trial and error to develop the chemistry to meet not only international purity standards but also achieve a favorable price-performance ratio. Also, specialty chemicals are required to meet customized needs of different customers.
One of VOL’s products, IBB, which is used as a raw material for manufacturing ibuprofen, demands a purity level of 99.5%, as per international standards. Given its usage in making drugs, consistency in quality is of utmost importance. Although VOL started its business in1992 by setting up an IBB plant in Mahad with an initial capacity of 1,200mt, it took eight years of concentrated efforts to get the commitment from its client. Starting 1998, VOL was able to sell at the most 100mt of IBB to clients. However, consistent improvement in IBB quality and multiple visits to US-based clients finally gave VOL its first major IBB order in late 2006. VOL not only meets, but also beats industry standards in purity by manufacturing IBB with purity ratio of 99.8%, the highest level globally. VOL has technical partnership with renowned global player Institut Francais du Petrole (France) for manufacturing IBB with a perpetual non-exclusive licence.
VOL’s another product, ATBS, had to go through a rigorous process before the company could come up with a marketable product. Since December 2002, production of ATBS has been streamlined and the first batch of commercially manufactured ATBS was shipped to VOL’s clients globally. However, clients rejected the ATBS produced by VOL because of quality problems. VOL then started providing 18 different parameters for its product on the basis of which the quality of ATBS could be accessed. The learning process lasted till 2005 when it finally made a breakthrough. The acceptable quality of ATBS for Enhanced Oil Recovery (EOR), one of the areas where ATBS is used, is even higher than its usage in other applications. Weight of ATBS should be higher than 400,000amu for it to be used for EOR. The company’s ATBS product successfully achieved high purity standards with a purity tolerance level of ~0.5% against the accepted global tolerance level of ~3.0%. VOL, in a tie-up with National Chemical Laboratory or NCL under the guidance of Dr. Barve, was able first to achieve this feat in India. NCL has exclusively licenced this technology to VOL. The process developed by NCL is protected by two US patents.
VOL’s other two major products - IB and HP-MTBE - are of equally superior quality. The company’s IB product achieved a 99.85% purity standard, which is among the highest in the world. HP-MTBE achieved a purity standard of 99.95%, accepted as one of the highest globally.
Hence, we believe that given the time and complexity involved in making these products, it is extremely difficult for a new entrant to foray into this business.
Favorable business economics
Firstly, specialty chemicals that VOL produces accounts for a tiny portion of total raw material costs of its clients. Hence, the incentive for clients to change its supplier is very low unless the supplier is not able to provide good and consistent quality products.
Secondly, very few players are present in this segment. It takes a long time to build quality products that are acceptable at the global level. Hence, a small player can’t start from scratch because the gestation period is very high. A bigger player may not like to get into this business as it is completely value-driven and not volume-driven. Revenue from specialty chemicals would make up tiny portion of total revenues of a big player. Hence it will be less beneficial for them to get into this space.
The above two factors give companies like VOL tremendous pricing power. Even if VOL decides to marginally increase its prices, the impact of that increase on the bottom-line of clients will be minimal. This is evident from VOL’s highly consistent margin profile since the past five years.
Institutional Equities
Vinati Organics 4
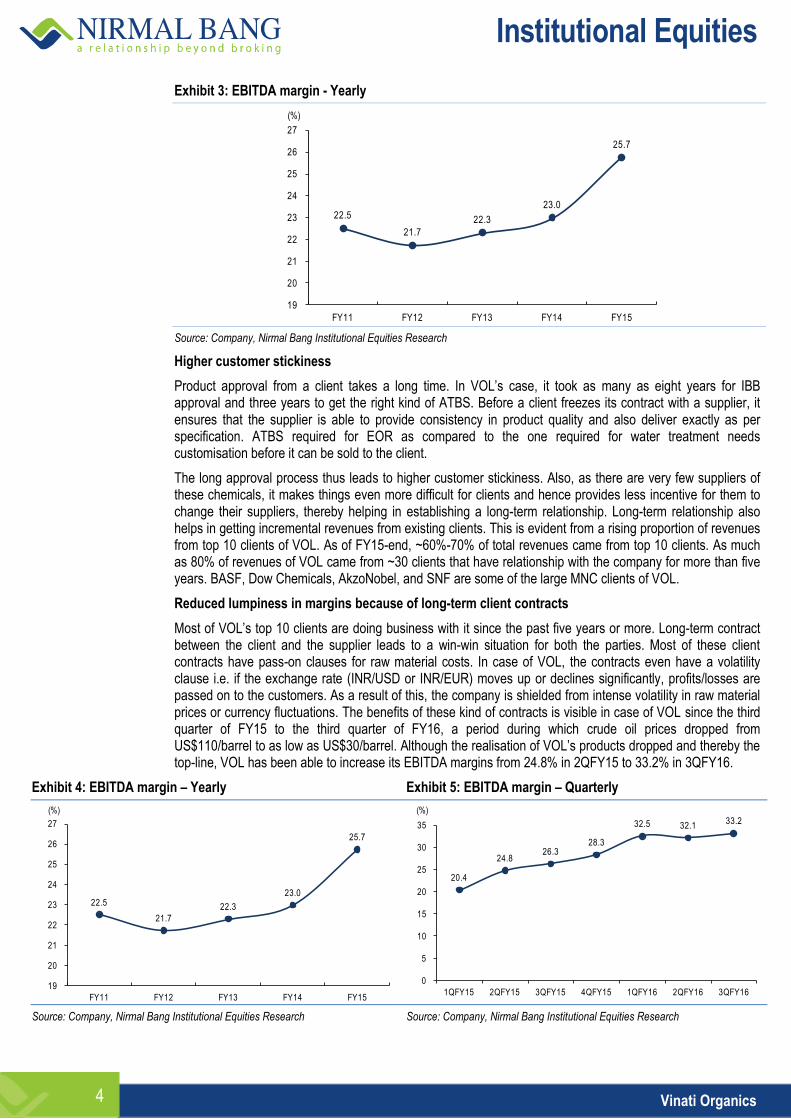
Exhibit 3: EBITDA margin - Yearly
Source: Company, Nirmal Bang Institutional Equities Research
Higher customer stickiness
Product approval from a client takes a long time. In VOL’s case, it took as many as eight years for IBB approval and three years to get the right kind of ATBS. Before a client freezes its contract with a supplier, it ensures that the supplier is able to provide consistency in product quality and also deliver exactly as per specification. ATBS required for EOR as compared to the one required for water treatment needs customisation before it can be sold to the client.
The long approval process thus leads to higher customer stickiness. Also, as there are very few suppliers of these chemicals, it makes things even more difficult for clients and hence provides less incentive for them to change their suppliers, thereby helping in establishing a long-term relationship. Long-term relationship also helps in getting incremental revenues from existing clients. This is evident from a rising proportion of revenues from top 10 clients of VOL. As of FY15-end, ~60%-70% of total revenues came from top 10 clients. As much as 80% of revenues of VOL came from ~30 clients that have relationship with the company for more than five years. BASF, Dow Chemicals, AkzoNobel, and SNF are some of the large MNC clients of VOL.
Reduced lumpiness in margins because of long-term client contracts
Most of VOL’s top 10 clients are doing business with it since the past five years or more. Long-term contract between the client and the supplier leads to a win-win situation for both the parties. Most of these client contracts have pass-on clauses for raw material costs. In case of VOL, the contracts even have a volatility clause i.e. if the exchange rate (INR/USD or INR/EUR) moves up or declines significantly, profits/losses are passed on to the customers. As a result of this, the company is shielded from intense volatility in raw material prices or currency fluctuations. The benefits of these kind of contracts is visible in case of VOL since the third quarter of FY15 to the third quarter of FY16, a period during which crude oil prices dropped from US$110/barrel to as low as US$30/barrel. Although the realisation of VOL’s products dropped and thereby the top-line, VOL has been able to increase its EBITDA margins from 24.8% in 2QFY15 to 33.2% in 3QFY16.
Exhibit 4: EBITDA margin – Yearly Exhibit 5: EBITDA margin – Quarterly
Source: Company, Nirmal Bang Institutional Equities Research Source: Company, Nirmal Bang Institutional Equities Research
22.5
21.7
22.3
23.0
25.7
19
20
21
22
23
24
25
26
27
FY11 FY12 FY13 FY14 FY15
(%)
22.5
21.7
22.3
23.0
25.7
19
20
21
22
23
24
25
26
27
FY11 FY12 FY13 FY14 FY15
(%)
20.4
24.826.3
28.3
32.5 32.133.2
0
5
10
15
20
25
30
35
1QFY15 2QFY15 3QFY15 4QFY15 1QFY16 2QFY16 3QFY16
(%)

Institutional Equities
Vinati Organics 5
Strong research & development (R&D) team is a must
Specialty chemicals business is a knowledge-driven business with strong focus on R&D. VOL has well-established world class R&D facilities, state-of-the-art technologies and quality assurance processes in place. VOL has a team of 27 members in its R&D team. VOL has spent Rs.5mn in R&D activities for FY15.
Abiding with environmental laws is a must to operate in this business. VOL has kept strong focus on green energy. Both the manufacturing units of VOL are zero effluent.
VOL has strived to reduce its carbon footprint by controlling emissions and recycling residual waste. The company has been investing in cutting-edge technologies to treat waste matter and enhance its operating efficiency.
Companies that want to establish their foothold in this niche business segment will have to invest heavily in green technology in order to be compliant with environmental laws, thereby creating huge barriers for a new entrant.
Institutional Equities
Vinati Organics 6
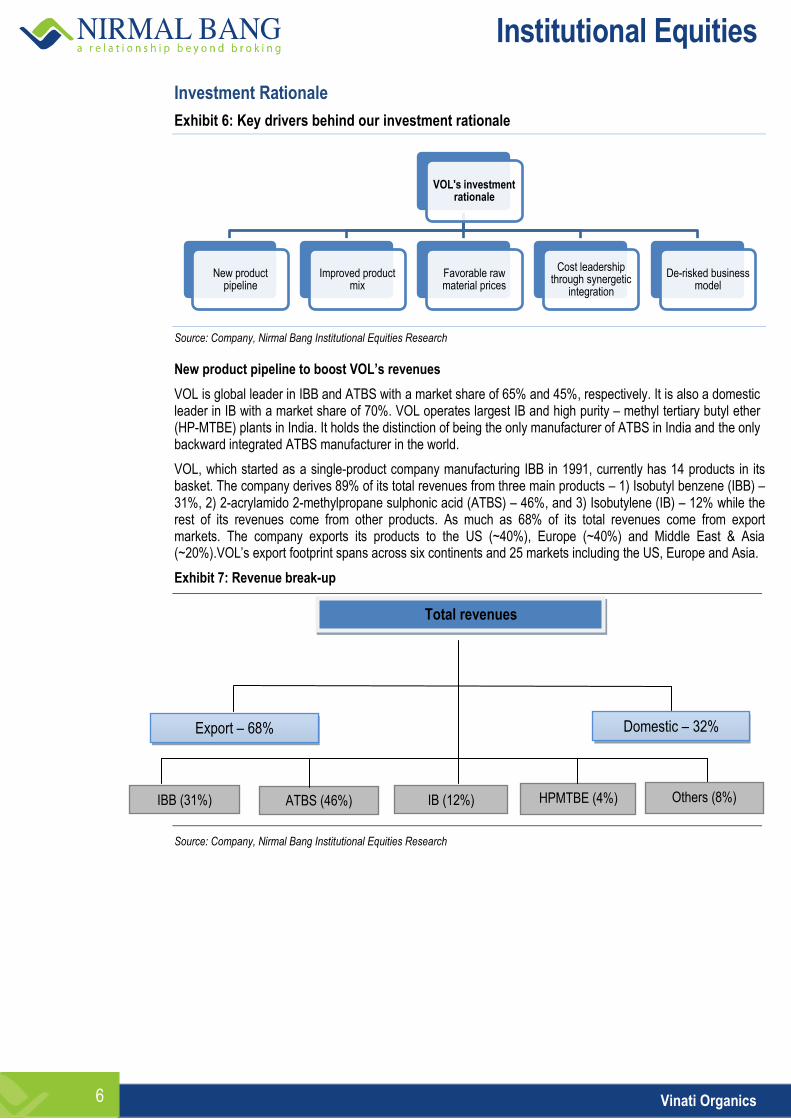
Investment Rationale
Exhibit 6: Key drivers behind our investment rationale
Source: Company, Nirmal Bang Institutional Equities Research
New product pipeline to boost VOL’s revenues
VOL is global leader in IBB and ATBS with a market share of 65% and 45%, respectively. It is also a domestic leader in IB with a market share of 70%. VOL operates largest IB and high purity – methyl tertiary butyl ether (HP-MTBE) plants in India. It holds the distinction of being the only manufacturer of ATBS in India and the only backward integrated ATBS manufacturer in the world.
VOL, which started as a single-product company manufacturing IBB in 1991, currently has 14 products in its basket. The company derives 89% of its total revenues from three main products – 1) Isobutyl benzene (IBB) – 31%, 2) 2-acrylamido 2-methylpropane sulphonic acid (ATBS) – 46%, and 3) Isobutylene (IB) – 12% while the rest of its revenues come from other products. As much as 68% of its total revenues come from export markets. The company exports its products to the US (~40%), Europe (~40%) and Middle East & Asia (~20%).VOL’s export footprint spans across six continents and 25 markets including the US, Europe and Asia.
Exhibit 7: Revenue break-up
Source: Company, Nirmal Bang Institutional Equities Research
VOL's investment rationale
New product pipeline
Improved product mix
Favorable raw material prices
Cost leadership through synergetic
integration
De-risked business model
Total revenues
HPMTBE (4%)
Domestic – 32%
IBB (31%)
Export – 68%
ATBS (46%) IB (12%) Others (8%)
Institutional Equities
Vinati Organics 7
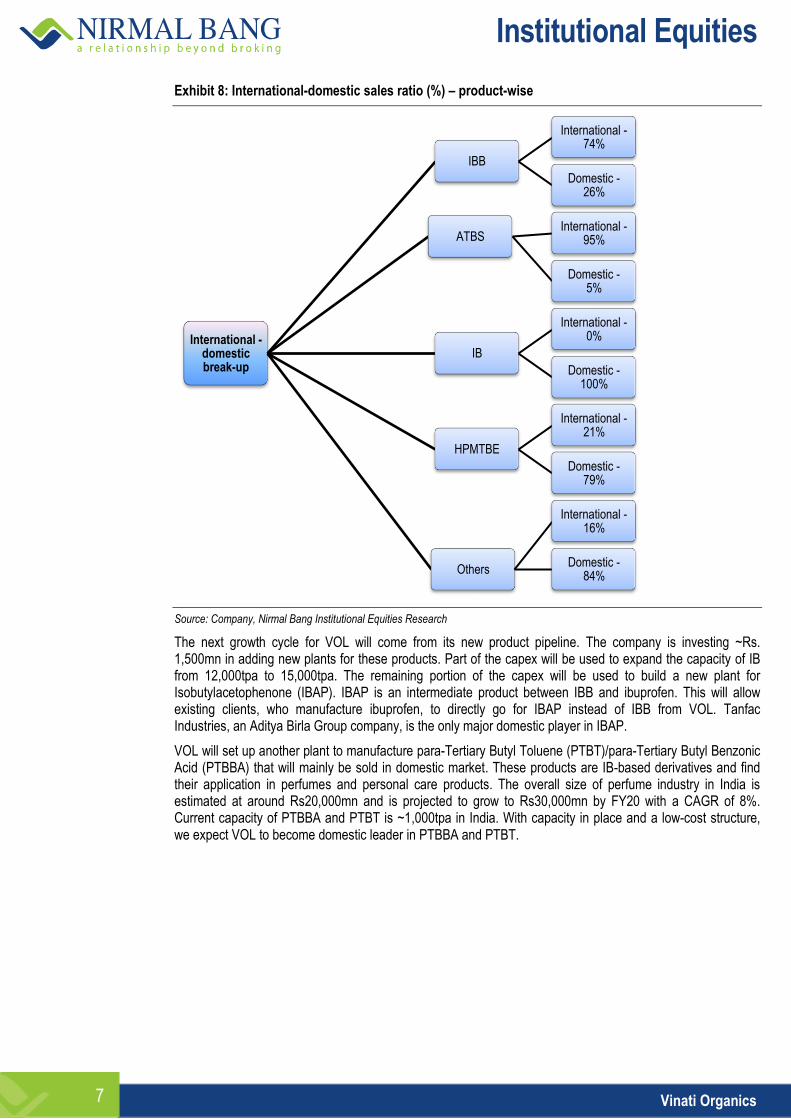
Exhibit 8: International-domestic sales ratio (%) – product-wise
Source: Company, Nirmal Bang Institutional Equities Research
The next growth cycle for VOL will come from its new product pipeline. The company is investing ~Rs. 1,500mn in adding new plants for these products. Part of the capex will be used to expand the capacity of IB from 12,000tpa to 15,000tpa. The remaining portion of the capex will be used to build a new plant for Isobutylacetophenone (IBAP). IBAP is an intermediate product between IBB and ibuprofen. This will allow existing clients, who manufacture ibuprofen, to directly go for IBAP instead of IBB from VOL. Tanfac Industries, an Aditya Birla Group company, is the only major domestic player in IBAP.
VOL will set up another plant to manufacture para-Tertiary Butyl Toluene (PTBT)/para-Tertiary Butyl Benzonic Acid (PTBBA) that will mainly be sold in domestic market. These products are IB-based derivatives and find their application in perfumes and personal care products. The overall size of perfume industry in India is estimated at around Rs20,000mn and is projected to grow to Rs30,000mn by FY20 with a CAGR of 8%. Current capacity of PTBBA and PTBT is ~1,000tpa in India. With capacity in place and a low-cost structure, we expect VOL to become domestic leader in PTBBA and PTBT.
International - domestic break-up
IBB
International - 74%
Domestic - 26%
ATBS International -
95%
Domestic - 5%
IB
International - 0%
Domestic - 100%
HPMTBE
International - 21%
Domestic - 79%
Others
International - 16%
Domestic - 84%
Institutional Equities
Vinati Organics 8
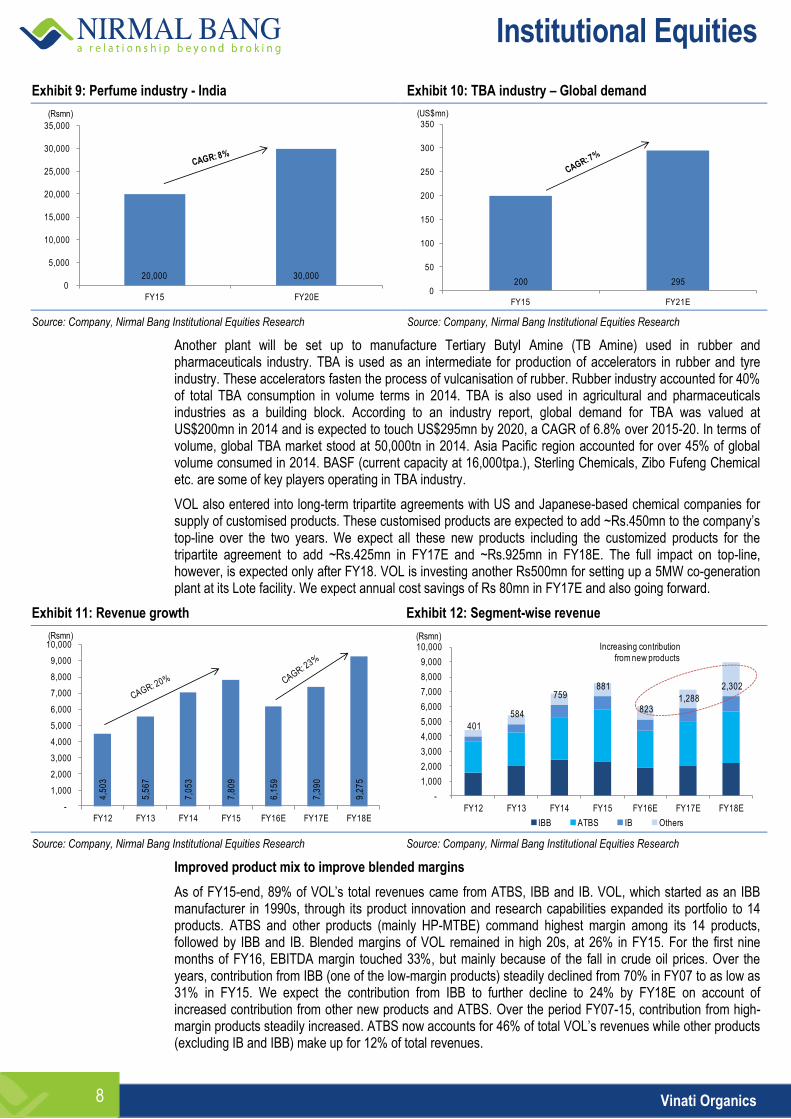
Exhibit 9: Perfume industry - India Exhibit 10: TBA industry – Global demand
Source: Company, Nirmal Bang Institutional Equities Research Source: Company, Nirmal Bang Institutional Equities Research
Another plant will be set up to manufacture Tertiary Butyl Amine (TB Amine) used in rubber and pharmaceuticals industry. TBA is used as an intermediate for production of accelerators in rubber and tyre industry. These accelerators fasten the process of vulcanisation of rubber. Rubber industry accounted for 40% of total TBA consumption in volume terms in 2014. TBA is also used in agricultural and pharmaceuticals industries as a building block. According to an industry report, global demand for TBA was valued at US$200mn in 2014 and is expected to touch US$295mn by 2020, a CAGR of 6.8% over 2015-20. In terms of volume, global TBA market stood at 50,000tn in 2014. Asia Pacific region accounted for over 45% of global volume consumed in 2014. BASF (current capacity at 16,000tpa.), Sterling Chemicals, Zibo Fufeng Chemical etc. are some of key players operating in TBA industry.
VOL also entered into long-term tripartite agreements with US and Japanese-based chemical companies for supply of customised products. These customised products are expected to add ~Rs.450mn to the company’s top-line over the two years. We expect all these new products including the customized products for the tripartite agreement to add ~Rs.425mn in FY17E and ~Rs.925mn in FY18E. The full impact on top-line, however, is expected only after FY18. VOL is investing another Rs500mn for setting up a 5MW co-generation plant at its Lote facility. We expect annual cost savings of Rs 80mn in FY17E and also going forward.
Exhibit 11: Revenue growth Exhibit 12: Segment-wise revenue
Source: Company, Nirmal Bang Institutional Equities Research Source: Company, Nirmal Bang Institutional Equities Research
Improved product mix to improve blended margins
As of FY15-end, 89% of VOL’s total revenues came from ATBS, IBB and IB. VOL, which started as an IBB manufacturer in 1990s, through its product innovation and research capabilities expanded its portfolio to 14 products. ATBS and other products (mainly HP-MTBE) command highest margin among its 14 products, followed by IBB and IB. Blended margins of VOL remained in high 20s, at 26% in FY15. For the first nine months of FY16, EBITDA margin touched 33%, but mainly because of the fall in crude oil prices. Over the years, contribution from IBB (one of the low-margin products) steadily declined from 70% in FY07 to as low as 31% in FY15. We expect the contribution from IBB to further decline to 24% by FY18E on account of increased contribution from other new products and ATBS. Over the period FY07-15, contribution from high-margin products steadily increased. ATBS now accounts for 46% of total VOL’s revenues while other products (excluding IB and IBB) make up for 12% of total revenues.
20,000 30,000 0
5,000
10,000
15,000
20,000
25,000
30,000
35,000
FY15 FY20E
(Rsmn)
200 2950
50
100
150
200
250
300
350
FY15 FY21E
(US$mn)
4,5
03
5,5
67
7,0
53
7,8
09
6,1
59
7,3
90
9,2
75
-
1,000
2,000
3,000
4,000
5,000
6,000
7,000
8,000
9,000
10,000
FY12 FY13 FY14 FY15 FY16E FY17E FY18E
(Rsmn)
401
584
759 881
823 1,288
2,302
-
1,000
2,000
3,000
4,000
5,000
6,000
7,000
8,000
9,000
10,000
FY12 FY13 FY14 FY15 FY16E FY17E FY18E
IBB ATBS IB Others
(Rsmn)Increasing contribution
from new products
Institutional Equities
Vinati Organics 9
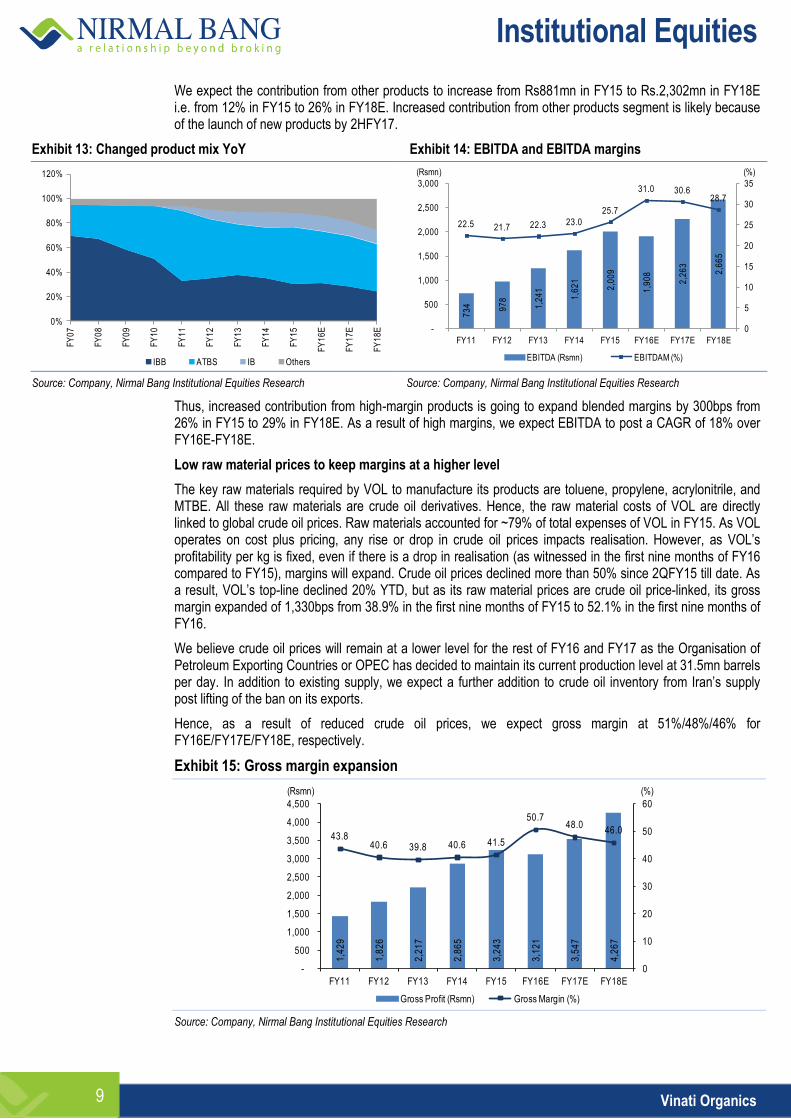
We expect the contribution from other products to increase from Rs881mn in FY15 to Rs.2,302mn in FY18E i.e. from 12% in FY15 to 26% in FY18E. Increased contribution from other products segment is likely because of the launch of new products by 2HFY17.
Exhibit 13: Changed product mix YoY Exhibit 14: EBITDA and EBITDA margins
Source: Company, Nirmal Bang Institutional Equities Research Source: Company, Nirmal Bang Institutional Equities Research
Thus, increased contribution from high-margin products is going to expand blended margins by 300bps from 26% in FY15 to 29% in FY18E. As a result of high margins, we expect EBITDA to post a CAGR of 18% over FY16E-FY18E.
Low raw material prices to keep margins at a higher level
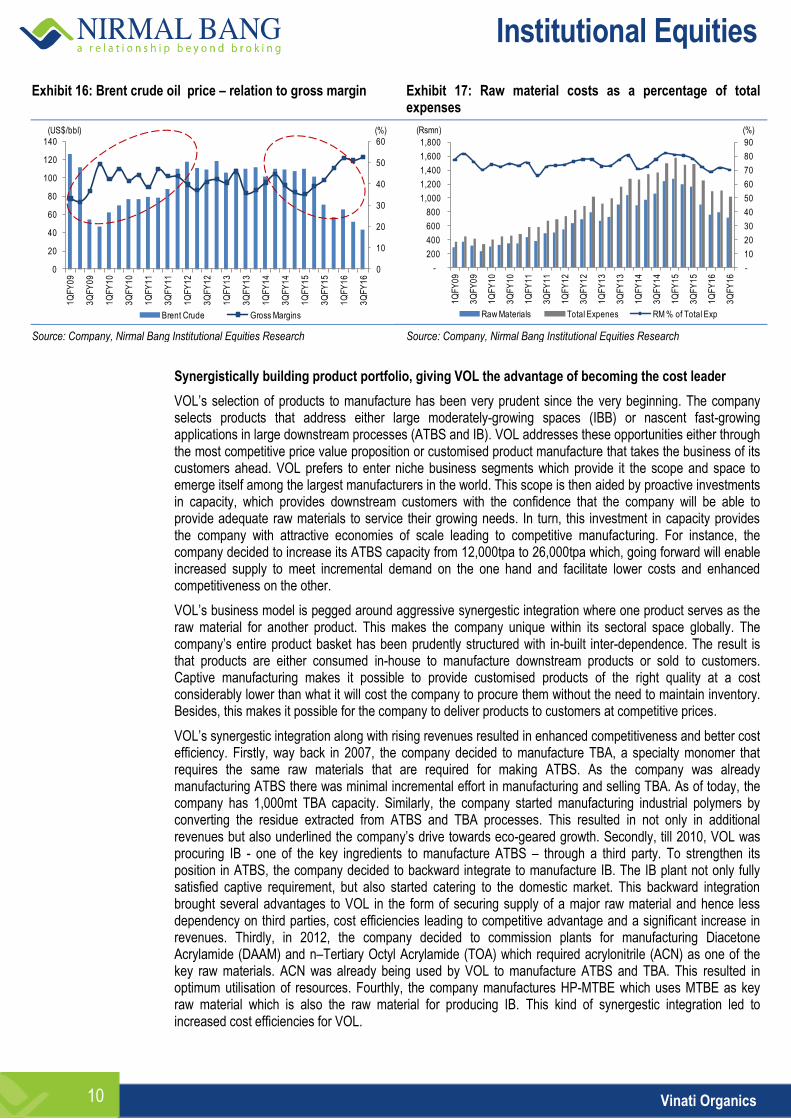
The key raw materials required by VOL to manufacture its products are toluene, propylene, acrylonitrile, and MTBE. All these raw materials are crude oil derivatives. Hence, the raw material costs of VOL are directly linked to global crude oil prices. Raw materials accounted for ~79% of total expenses of VOL in FY15. As VOL operates on cost plus pricing, any rise or drop in crude oil prices impacts realisation. However, as VOL’s profitability per kg is fixed, even if there is a drop in realisation (as witnessed in the first nine months of FY16 compared to FY15), margins will expand. Crude oil prices declined more than 50% since 2QFY15 till date. As a result, VOL’s top-line declined 20% YTD, but as its raw material prices are crude oil price-linked, its gross margin expanded of 1,330bps from 38.9% in the first nine months of FY15 to 52.1% in the first nine months of FY16.
We believe crude oil prices will remain at a lower level for the rest of FY16 and FY17 as the Organisation of Petroleum Exporting Countries or OPEC has decided to maintain its current production level at 31.5mn barrels per day. In addition to existing supply, we expect a further addition to crude oil inventory from Iran’s supply post lifting of the ban on its exports.
Hence, as a result of reduced crude oil prices, we expect gross margin at 51%/48%/46% for FY16E/FY17E/FY18E, respectively.
Exhibit 15: Gross margin expansion
Source: Company, Nirmal Bang Institutional Equities Research
0%
20%
40%
60%
80%
100%
120%
FY
07
FY
08
FY
09
FY
10
FY
11
FY
12
FY
13
FY
14
FY
15
FY
16
E
FY
17
E
FY
18
E
IBB ATBS IB Others
73
4
97
8
1,2
41
1,6
21
2,0
09
1,9
08
2,2
63
2,6
65
22.5 21.7 22.3 23.0
25.7
31.0 30.628.7
0
5
10
15
20
25
30
35
-
500
1,000
1,500
2,000
2,500
3,000
FY11 FY12 FY13 FY14 FY15 FY16E FY17E FY18E
EBITDA (Rsmn) EBITDAM (%)
(Rsmn) (%)
1,4
29
1,8
26
2,2
17
2,8
65
3,2
43
3,1
21
3,5
47
4,2
67
43.840.6 39.8 40.6 41.5
50.748.0
46.0
0
10
20
30
40
50
60
-
500
1,000
1,500
2,000
2,500
3,000
3,500
4,000
4,500
FY11 FY12 FY13 FY14 FY15 FY16E FY17E FY18E
Gross Profit (Rsmn) Gross Margin (%)
(%)(Rsmn)
Institutional Equities
Vinati Organics 10
Exhibit 16: Brent crude oil price – relation to gross margin Exhibit 17: Raw material costs as a percentage of total expenses
Source: Company, Nirmal Bang Institutional Equities Research Source: Company, Nirmal Bang Institutional Equities Research
Synergistically building product portfolio, giving VOL the advantage of becoming the cost leader
VOL’s selection of products to manufacture has been very prudent since the very beginning. The company selects products that address either large moderately-growing spaces (IBB) or nascent fast-growing applications in large downstream processes (ATBS and IB). VOL addresses these opportunities either through the most competitive price value proposition or customised product manufacture that takes the business of its customers ahead. VOL prefers to enter niche business segments which provide it the scope and space to emerge itself among the largest manufacturers in the world. This scope is then aided by proactive investments in capacity, which provides downstream customers with the confidence that the company will be able to provide adequate raw materials to service their growing needs. In turn, this investment in capacity provides the company with attractive economies of scale leading to competitive manufacturing. For instance, the company decided to increase its ATBS capacity from 12,000tpa to 26,000tpa which, going forward will enable increased supply to meet incremental demand on the one hand and facilitate lower costs and enhanced competitiveness on the other.
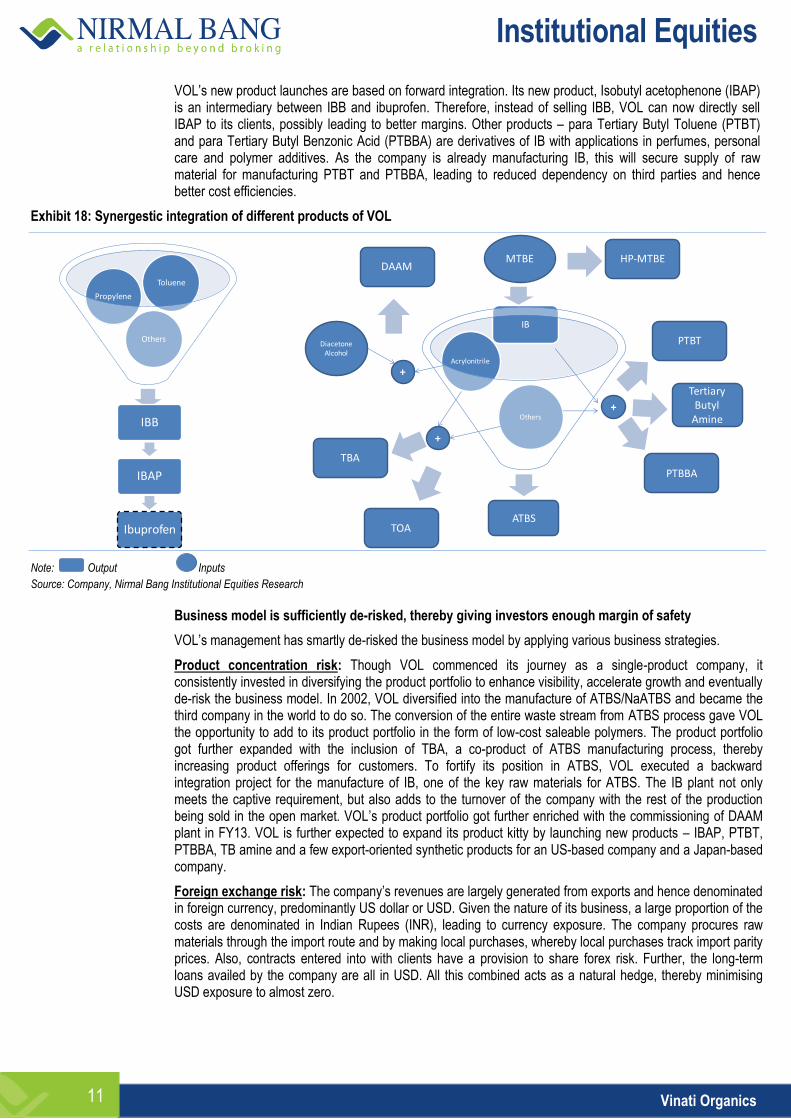
VOL’s business model is pegged around aggressive synergestic integration where one product serves as the raw material for another product. This makes the company unique within its sectoral space globally. The company’s entire product basket has been prudently structured with in-built inter-dependence. The result is that products are either consumed in-house to manufacture downstream products or sold to customers. Captive manufacturing makes it possible to provide customised products of the right quality at a cost considerably lower than what it will cost the company to procure them without the need to maintain inventory. Besides, this makes it possible for the company to deliver products to customers at competitive prices.
VOL’s synergestic integration along with rising revenues resulted in enhanced competitiveness and better cost efficiency. Firstly, way back in 2007, the company decided to manufacture TBA, a specialty monomer that requires the same raw materials that are required for making ATBS. As the company was already manufacturing ATBS there was minimal incremental effort in manufacturing and selling TBA. As of today, the company has 1,000mt TBA capacity. Similarly, the company started manufacturing industrial polymers by converting the residue extracted from ATBS and TBA processes. This resulted in not only in additional revenues but also underlined the company’s drive towards eco-geared growth. Secondly, till 2010, VOL was procuring IB - one of the key ingredients to manufacture ATBS – through a third party. To strengthen its position in ATBS, the company decided to backward integrate to manufacture IB. The IB plant not only fully satisfied captive requirement, but also started catering to the domestic market. This backward integration brought several advantages to VOL in the form of securing supply of a major raw material and hence less dependency on third parties, cost efficiencies leading to competitive advantage and a significant increase in revenues. Thirdly, in 2012, the company decided to commission plants for manufacturing Diacetone Acrylamide (DAAM) and n–Tertiary Octyl Acrylamide (TOA) which required acrylonitrile (ACN) as one of the key raw materials. ACN was already being used by VOL to manufacture ATBS and TBA. This resulted in optimum utilisation of resources. Fourthly, the company manufactures HP-MTBE which uses MTBE as key raw material which is also the raw material for producing IB. This kind of synergestic integration led to increased cost efficiencies for VOL.
0
10
20
30
40
50
60
0
20
40
60
80
100
120
140
1Q
FY
09
3Q
FY
09
1Q
FY
10
3Q
FY
10
1Q
FY
11
3Q
FY
11
1Q
FY
12
3Q
FY
12
1Q
FY
13
3Q
FY
13
1Q
FY
14
3Q
FY
14
1Q
FY
15
3Q
FY
15
1Q
FY
16
3Q
FY
16
Brent Crude Gross Margins
(%)(US$/bbl)
-
10
20
30
40
50
60
70
80
90
-
200
400
600
800
1,000
1,200
1,400
1,600
1,800
1Q
FY
09
3Q
FY
09
1Q
FY
10
3Q
FY
10
1Q
FY
11
3Q
FY
11
1Q
FY
12
3Q
FY
12
1Q
FY
13
3Q
FY
13
1Q
FY
14
3Q
FY
14
1Q
FY
15
3Q
FY
15
1Q
FY
16
3Q
FY
16
Raw Materials Total Expenes RM % of Total Exp
(%)(Rsmn)
Institutional Equities
Vinati Organics 11
VOL’s new product launches are based on forward integration. Its new product, Isobutyl acetophenone (IBAP) is an intermediary between IBB and ibuprofen. Therefore, instead of selling IBB, VOL can now directly sell IBAP to its clients, possibly leading to better margins. Other products – para Tertiary Butyl Toluene (PTBT) and para Tertiary Butyl Benzonic Acid (PTBBA) are derivatives of IB with applications in perfumes, personal care and polymer additives. As the company is already manufacturing IB, this will secure supply of raw material for manufacturing PTBT and PTBBA, leading to reduced dependency on third parties and hence better cost efficiencies.
Exhibit 18: Synergestic integration of different products of VOL
Note: Output Inputs
Source: Company, Nirmal Bang Institutional Equities Research
Business model is sufficiently de-risked, thereby giving investors enough margin of safety
VOL’s management has smartly de-risked the business model by applying various business strategies.
Product concentration risk: Though VOL commenced its journey as a single-product company, it consistently invested in diversifying the product portfolio to enhance visibility, accelerate growth and eventually de-risk the business model. In 2002, VOL diversified into the manufacture of ATBS/NaATBS and became the third company in the world to do so. The conversion of the entire waste stream from ATBS process gave VOL the opportunity to add to its product portfolio in the form of low-cost saleable polymers. The product portfolio got further expanded with the inclusion of TBA, a co-product of ATBS manufacturing process, thereby increasing product offerings for customers. To fortify its position in ATBS, VOL executed a backward integration project for the manufacture of IB, one of the key raw materials for ATBS. The IB plant not only meets the captive requirement, but also adds to the turnover of the company with the rest of the production being sold in the open market. VOL’s product portfolio got further enriched with the commissioning of DAAM plant in FY13. VOL is further expected to expand its product kitty by launching new products – IBAP, PTBT, PTBBA, TB amine and a few export-oriented synthetic products for an US-based company and a Japan-based company.
Foreign exchange risk: The company’s revenues are largely generated from exports and hence denominated in foreign currency, predominantly US dollar or USD. Given the nature of its business, a large proportion of the costs are denominated in Indian Rupees (INR), leading to currency exposure. The company procures raw materials through the import route and by making local purchases, whereby local purchases track import parity prices. Also, contracts entered into with clients have a provision to share forex risk. Further, the long-term loans availed by the company are all in USD. All this combined acts as a natural hedge, thereby minimising USD exposure to almost zero.
Others
Propylene
Toluene
IBB
IBAP
IbuprofenATBS
Others
Acrylonitrile
IB
MTBE
ATBS
HP-MTBE
PTBT
PTBBA
+
+
TBA
DAAM
Diacetone Alcohol
+
Tertiary Butyl
Amine
TOA
Institutional Equities
Vinati Organics 12
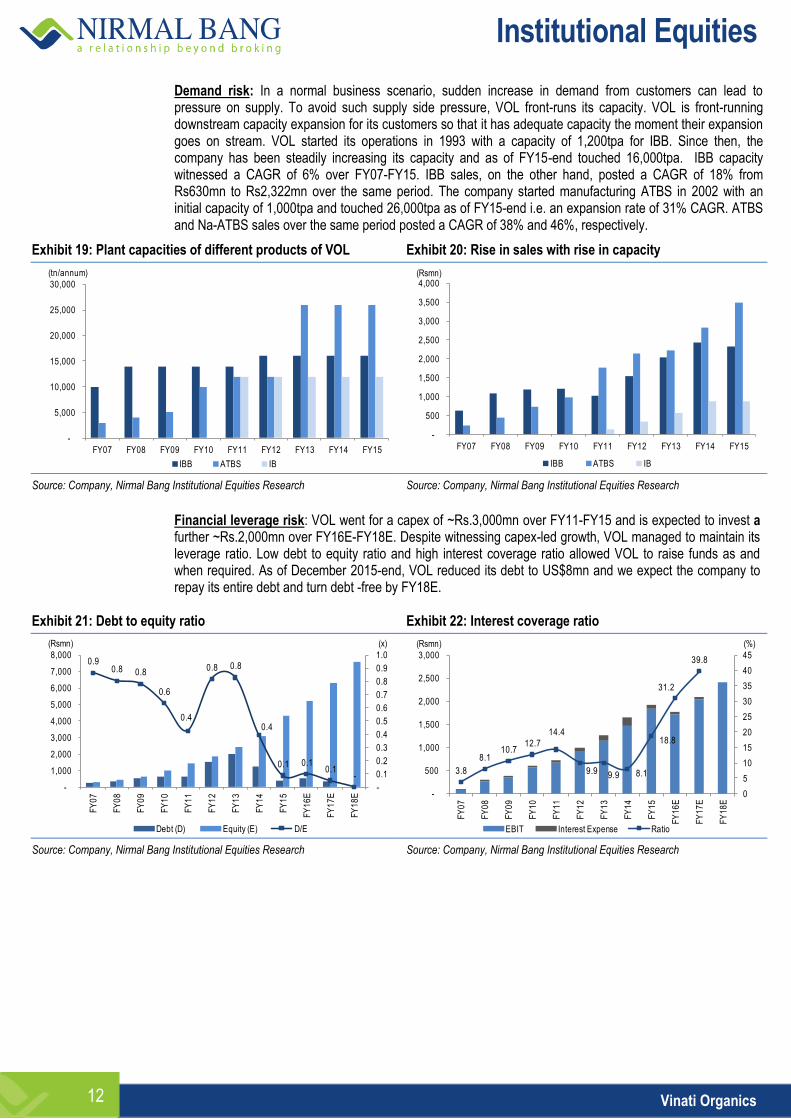
Demand risk: In a normal business scenario, sudden increase in demand from customers can lead to pressure on supply. To avoid such supply side pressure, VOL front-runs its capacity. VOL is front-running downstream capacity expansion for its customers so that it has adequate capacity the moment their expansion goes on stream. VOL started its operations in 1993 with a capacity of 1,200tpa for IBB. Since then, the company has been steadily increasing its capacity and as of FY15-end touched 16,000tpa. IBB capacity witnessed a CAGR of 6% over FY07-FY15. IBB sales, on the other hand, posted a CAGR of 18% from Rs630mn to Rs2,322mn over the same period. The company started manufacturing ATBS in 2002 with an initial capacity of 1,000tpa and touched 26,000tpa as of FY15-end i.e. an expansion rate of 31% CAGR. ATBS and Na-ATBS sales over the same period posted a CAGR of 38% and 46%, respectively.
Exhibit 19: Plant capacities of different products of VOL Exhibit 20: Rise in sales with rise in capacity
Source: Company, Nirmal Bang Institutional Equities Research Source: Company, Nirmal Bang Institutional Equities Research
Financial leverage risk: VOL went for a capex of ~Rs.3,000mn over FY11-FY15 and is expected to invest a further ~Rs.2,000mn over FY16E-FY18E. Despite witnessing capex-led growth, VOL managed to maintain its leverage ratio. Low debt to equity ratio and high interest coverage ratio allowed VOL to raise funds as and when required. As of December 2015-end, VOL reduced its debt to US$8mn and we expect the company to repay its entire debt and turn debt -free by FY18E.
Exhibit 21: Debt to equity ratio Exhibit 22: Interest coverage ratio
Source: Company, Nirmal Bang Institutional Equities Research Source: Company, Nirmal Bang Institutional Equities Research
-
5,000
10,000
15,000
20,000
25,000
30,000
FY07 FY08 FY09 FY10 FY11 FY12 FY13 FY14 FY15
IBB ATBS IB
(tn/annum)
-
500
1,000
1,500
2,000
2,500
3,000
3,500
4,000
FY07 FY08 FY09 FY10 FY11 FY12 FY13 FY14 FY15
IBB ATBS IB
(Rsmn)
0.9 0.8 0.8
0.6
0.4
0.8 0.8
0.4
0.1 0.1 0.1
-
-
0.1
0.2
0.3
0.4
0.5
0.6
0.7
0.8
0.9
1.0
-
1,000
2,000
3,000
4,000
5,000
6,000
7,000
8,000
FY
07
FY
08
FY
09
FY
10
FY
11
FY
12
FY
13
FY
14
FY
15
FY
16
E
FY
17
E
FY
18
E
Debt (D) Equity (E) D/E
(Rsmn) (x)
3.8
8.1 10.7
12.7
14.4
9.9 9.9 8.1
18.8
31.2
39.8
0
5
10
15
20
25
30
35
40
45
-
500
1,000
1,500
2,000
2,500
3,000
FY
07
FY
08
FY
09
FY
10
FY
11
FY
12
FY
13
FY
14
FY
15
FY
16
E
FY
17
E
FY
18
E
EBIT Interest Expense Ratio
(%)(Rsmn)

Institutional Equities
Vinati Organics 13
Global leadership status in ATBS and IBB, domestic leadership position in IB and HP-MTBE
VOL is the first company to commercially manufacture IBB with technological collaboration from Francais du Petrole (IFP) based in France and scale up to become the largest manufacturer of IBB in the world. With current capacity of 16,000tpa, VOL holds a 65% global market share in IBB. VOL supplies IBB directly to ibuprofen manufacturers globally. BASF is the world’s largest manufacturer of ibuprofen in the world while Biocause (China) and Shasun Chemicals (India) are among the major manufacturers of ibuprofen. BASF and Shasun Chemicals are among the few big a client of VOL. VOL started manufacturing ATBS, its biggest revenue contributing product, in 2002 and is the third company in the world to do so. From an initial capacity of 1,200tpa to 26,000tpa, VOL became the world’s largest manufacturer of ATBS with a 45% global market share in ATBS. It is also the only company in the world with a backward integrated ATBS plant.
VOL started manufacturing IB in 2010 and currently operates the largest IB plant having a capacity of 12,000tpa which it plans to increase to 15,000tpa by FY17E. VOL holds a 70% domestic market share in IB. The company also remains the largest domestic manufacturer of HP MTBE.
Exhibit 23: VOL’s global market share in ATBS and IBB
Source: Company, Nirmal Bang Institutional Equities Research
60 60 60 60 6065 65
15
2530 30
40 4045
0
10
20
30
40
50
60
70
FY09 FY10 FY11 FY12 FY13 FY14 FY15
IBB ATBS
(%)

Institutional Equities
Vinati Organics 14
Industry Analysis – Porter 5 forces
Exhibit 24: Porter 5 force analysis
Source: Company, Nirmal Bang Institutional Equities Research
Rivalry among existing players: Low to medium
VOL produces specialised chemical products that require state-of-art technology available only to a few in the world. It has global oligopoly in the two products that it manufactures (IBB and ATBS). Only other two players in ATBS segment are Lubrizol, US (14,000 tpa) and Toagosei, Japan (6000tpa). While Lubrizol uses ATBS for captive consumption, ATBS is not a key product for Toagosei. Similarly, only other major IBB producers are IOL Chemicals, India and SI group. While IOL Chemicals uses IBB for captive consumption, IBB is not a key product for SI group. Apart from this oligopolistic setup, company enters into long-term contracts with its clients to counter the risk of excessive competition from its rivals.
Buyer power: Low to Medium
An over dependence on a handful of customers could prove detrimental in the event of their attrition. The Company’s strong client list comprises of brand enhancing international and domestic companies. The Company’s product customisation capability in the specialty chemicals business has resulted in strong customer growth and satisfaction. Since there are handful of players who can makes these chemicals with consistent quality, buyer power is low to medium.
Threat from new entrant: Low
High gestation periods, strong technological barriers, long term customer contracts and strong R&D capabilities requirement make threat from new entrant very low.
Supplier power: Low
VOL has taken leadership role in ensuring supply of one of its major raw material through the setting up of the IB plant. The other major raw materials required are easily available, both locally and internationally. Further, VOL also enters into annual contract with its suppliers to protect itself from the vagaries of price and supply. As a result, supplier power is very low in case of VOL.
Threat from substitutes: Low
VOL makes specialised chemicals used for very specific purposes. There are no substitutes for these products.
Institutional Equities
Vinati Organics 15
Financial analysis
Revenue CAGR of 23% expected over FY16E-FY18E
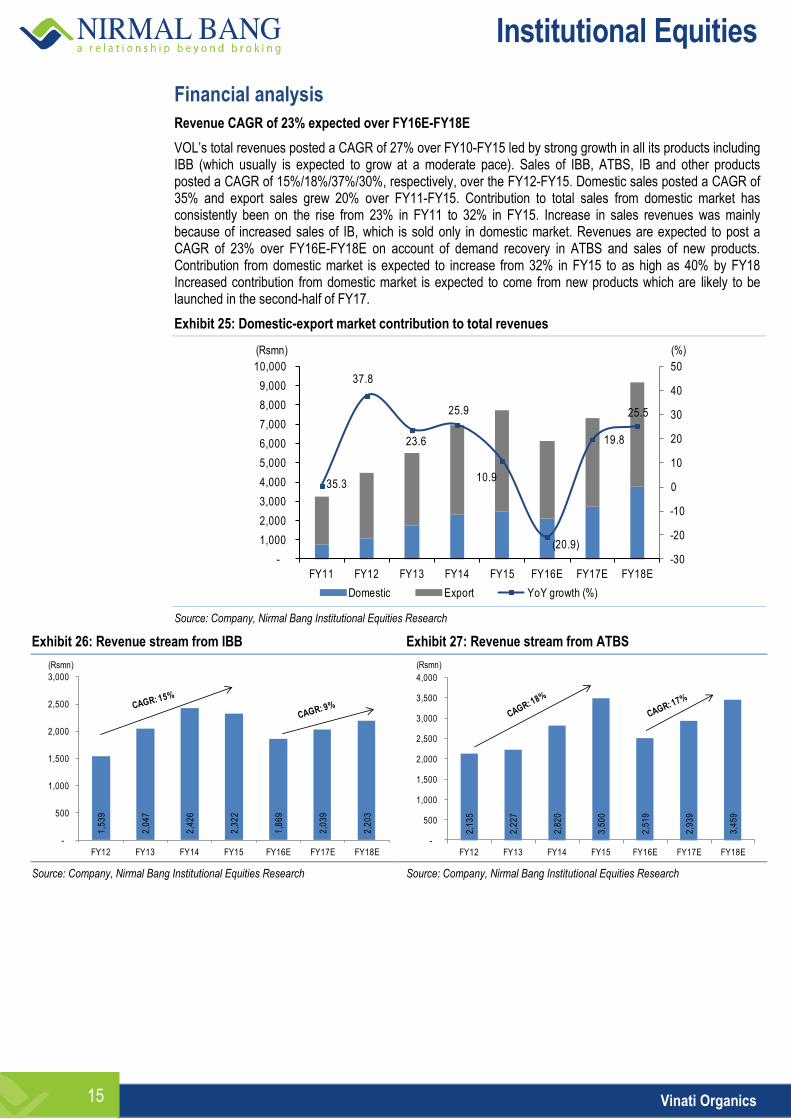
VOL’s total revenues posted a CAGR of 27% over FY10-FY15 led by strong growth in all its products including IBB (which usually is expected to grow at a moderate pace). Sales of IBB, ATBS, IB and other products posted a CAGR of 15%/18%/37%/30%, respectively, over the FY12-FY15. Domestic sales posted a CAGR of 35% and export sales grew 20% over FY11-FY15. Contribution to total sales from domestic market has consistently been on the rise from 23% in FY11 to 32% in FY15. Increase in sales revenues was mainly because of increased sales of IB, which is sold only in domestic market. Revenues are expected to post a CAGR of 23% over FY16E-FY18E on account of demand recovery in ATBS and sales of new products. Contribution from domestic market is expected to increase from 32% in FY15 to as high as 40% by FY18 Increased contribution from domestic market is expected to come from new products which are likely to be launched in the second-half of FY17.
Exhibit 25: Domestic-export market contribution to total revenues
Source: Company, Nirmal Bang Institutional Equities Research
Exhibit 26: Revenue stream from IBB Exhibit 27: Revenue stream from ATBS
Source: Company, Nirmal Bang Institutional Equities Research Source: Company, Nirmal Bang Institutional Equities Research
35.3
37.8
23.6
25.9
10.9
(20.9)
19.8
25.5
-30
-20
-10
0
10
20
30
40
50
-
1,000
2,000
3,000
4,000
5,000
6,000
7,000
8,000
9,000
10,000
FY11 FY12 FY13 FY14 FY15 FY16E FY17E FY18E
Domestic Export YoY growth (%)
(Rsmn) (%)
1,5
39
2,0
47
2,4
26
2,3
22
1,8
69
2,0
39
2,2
03
-
500
1,000
1,500
2,000
2,500
3,000
FY12 FY13 FY14 FY15 FY16E FY17E FY18E
(Rsmn)
2,1
35
2,2
27
2,8
20
3,5
00
2,5
19
2,9
39
3,4
59
-
500
1,000
1,500
2,000
2,500
3,000
3,500
4,000
FY12 FY13 FY14 FY15 FY16E FY17E FY18E
(Rsmn)
Institutional Equities
Vinati Organics 16
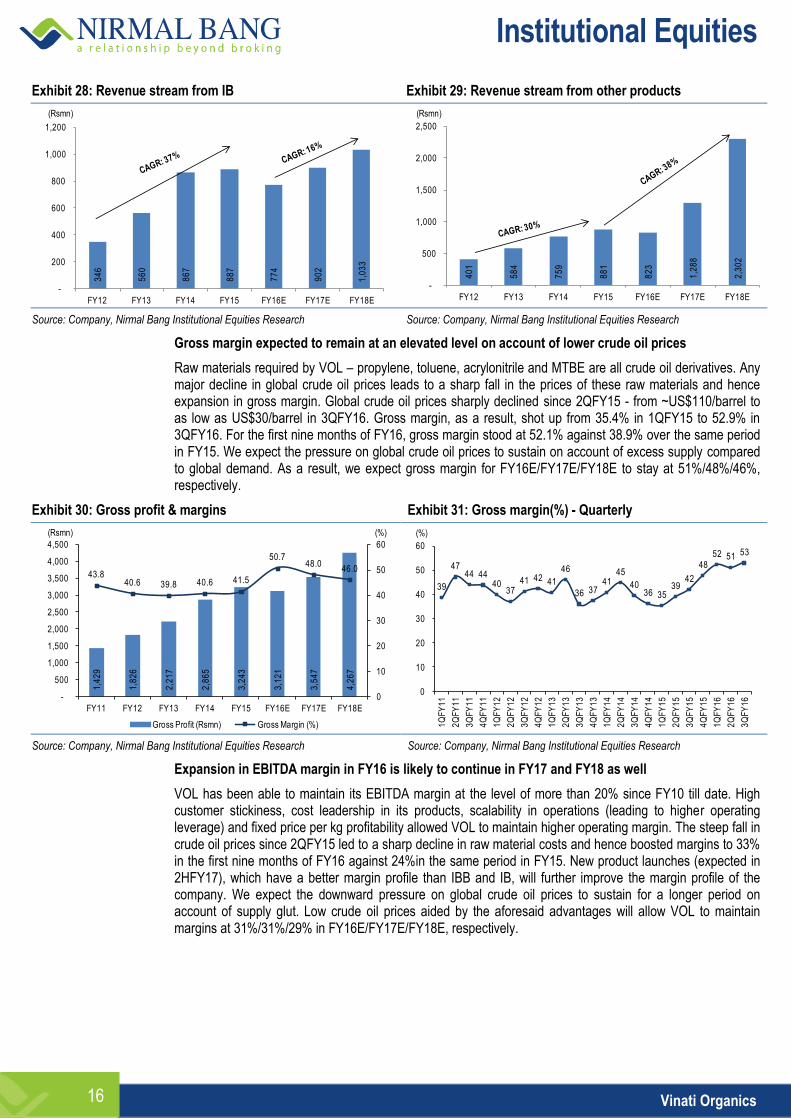
Exhibit 28: Revenue stream from IB Exhibit 29: Revenue stream from other products
Source: Company, Nirmal Bang Institutional Equities Research Source: Company, Nirmal Bang Institutional Equities Research
Gross margin expected to remain at an elevated level on account of lower crude oil prices
Raw materials required by VOL – propylene, toluene, acrylonitrile and MTBE are all crude oil derivatives. Any major decline in global crude oil prices leads to a sharp fall in the prices of these raw materials and hence expansion in gross margin. Global crude oil prices sharply declined since 2QFY15 - from ~US$110/barrel to as low as US$30/barrel in 3QFY16. Gross margin, as a result, shot up from 35.4% in 1QFY15 to 52.9% in 3QFY16. For the first nine months of FY16, gross margin stood at 52.1% against 38.9% over the same period in FY15. We expect the pressure on global crude oil prices to sustain on account of excess supply compared to global demand. As a result, we expect gross margin for FY16E/FY17E/FY18E to stay at 51%/48%/46%, respectively.
Exhibit 30: Gross profit & margins Exhibit 31: Gross margin(%) - Quarterly
Source: Company, Nirmal Bang Institutional Equities Research Source: Company, Nirmal Bang Institutional Equities Research
Expansion in EBITDA margin in FY16 is likely to continue in FY17 and FY18 as well
VOL has been able to maintain its EBITDA margin at the level of more than 20% since FY10 till date. High customer stickiness, cost leadership in its products, scalability in operations (leading to higher operating leverage) and fixed price per kg profitability allowed VOL to maintain higher operating margin. The steep fall in crude oil prices since 2QFY15 led to a sharp decline in raw material costs and hence boosted margins to 33% in the first nine months of FY16 against 24%in the same period in FY15. New product launches (expected in 2HFY17), which have a better margin profile than IBB and IB, will further improve the margin profile of the company. We expect the downward pressure on global crude oil prices to sustain for a longer period on account of supply glut. Low crude oil prices aided by the aforesaid advantages will allow VOL to maintain margins at 31%/31%/29% in FY16E/FY17E/FY18E, respectively.
34
6
56
0
86
7
88
7
77
4
90
2
1,0
33
-
200
400
600
800
1,000
1,200
FY12 FY13 FY14 FY15 FY16E FY17E FY18E
(Rsmn)
40
1
58
4
75
9
88
1
82
3
1,2
88
2,3
02
-
500
1,000
1,500
2,000
2,500
FY12 FY13 FY14 FY15 FY16E FY17E FY18E
(Rsmn)
1,4
29
1,8
26
2,2
17
2,8
65
3,2
43
3,1
21
3,5
47
4,2
67
43.840.6 39.8 40.6 41.5
50.748.0
46.0
0
10
20
30
40
50
60
-
500
1,000
1,500
2,000
2,500
3,000
3,500
4,000
4,500
FY11 FY12 FY13 FY14 FY15 FY16E FY17E FY18E
Gross Profit (Rsmn) Gross Margin (%)
(%)(Rsmn)
39
4744 44
4037
41 42 41
46
36 3741
45
4036 35
3942
4852 51 53
0
10
20
30
40
50
60
1Q
FY
11
2Q
FY
11
3Q
FY
11
4Q
FY
11
1Q
FY
12
2Q
FY
12
3Q
FY
12
4Q
FY
12
1Q
FY
13
2Q
FY
13
3Q
FY
13
4Q
FY
13
1Q
FY
14
2Q
FY
14
3Q
FY
14
4Q
FY
14
1Q
FY
15
2Q
FY
15
3Q
FY
15
4Q
FY
15
1Q
FY
16
2Q
FY
16
3Q
FY
16
(%)
Institutional Equities
Vinati Organics 17
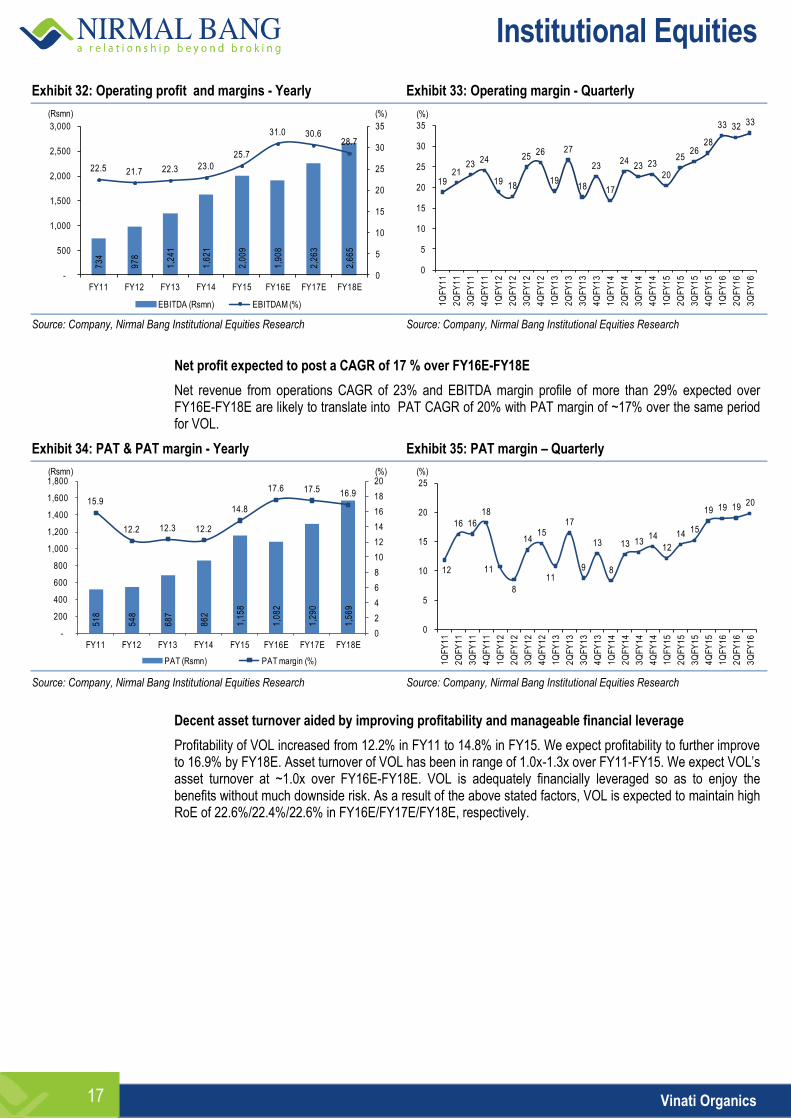
Exhibit 32: Operating profit and margins - Yearly Exhibit 33: Operating margin - Quarterly
Source: Company, Nirmal Bang Institutional Equities Research Source: Company, Nirmal Bang Institutional Equities Research
Net profit expected to post a CAGR of 17 % over FY16E-FY18E
Net revenue from operations CAGR of 23% and EBITDA margin profile of more than 29% expected over FY16E-FY18E are likely to translate into PAT CAGR of 20% with PAT margin of ~17% over the same period for VOL.
Exhibit 34: PAT & PAT margin - Yearly Exhibit 35: PAT margin – Quarterly
Source: Company, Nirmal Bang Institutional Equities Research Source: Company, Nirmal Bang Institutional Equities Research
Decent asset turnover aided by improving profitability and manageable financial leverage
Profitability of VOL increased from 12.2% in FY11 to 14.8% in FY15. We expect profitability to further improve to 16.9% by FY18E. Asset turnover of VOL has been in range of 1.0x-1.3x over FY11-FY15. We expect VOL’s asset turnover at ~1.0x over FY16E-FY18E. VOL is adequately financially leveraged so as to enjoy the benefits without much downside risk. As a result of the above stated factors, VOL is expected to maintain high RoE of 22.6%/22.4%/22.6% in FY16E/FY17E/FY18E, respectively.
73
4
97
8
1,2
41
1,6
21
2,0
09
1,9
08
2,2
63
2,6
65
22.5 21.7 22.3 23.0
25.7
31.0 30.628.7
0
5
10
15
20
25
30
35
-
500
1,000
1,500
2,000
2,500
3,000
FY11 FY12 FY13 FY14 FY15 FY16E FY17E FY18E
EBITDA (Rsmn) EBITDAM (%)
(%)(Rsmn)
1921
2324
1918
2526
19
27
18
23
17
2423 23
20
2526
28
33 32 33
0
5
10
15
20
25
30
35
1Q
FY
11
2Q
FY
11
3Q
FY
11
4Q
FY
11
1Q
FY
12
2Q
FY
12
3Q
FY
12
4Q
FY
12
1Q
FY
13
2Q
FY
13
3Q
FY
13
4Q
FY
13
1Q
FY
14
2Q
FY
14
3Q
FY
14
4Q
FY
14
1Q
FY
15
2Q
FY
15
3Q
FY
15
4Q
FY
15
1Q
FY
16
2Q
FY
16
3Q
FY
16
(%)
51
8
54
8
68
7
86
2
1,1
58
1,0
82
1,2
90
1,5
69
15.9
12.2 12.3 12.2
14.8
17.6 17.5 16.9
0
2
4
6
8
10
12
14
16
18
20
-
200
400
600
800
1,000
1,200
1,400
1,600
1,800
FY11 FY12 FY13 FY14 FY15 FY16E FY17E FY18E
PAT (Rsmn) PAT margin (%)
(%)(Rsmn)
12
16 16
18
11
8
14 15
11
17
9
13
8
13 13 14
12
14 15
19 19 19 20
0
5
10
15
20
25
1Q
FY
11
2Q
FY
11
3Q
FY
11
4Q
FY
11
1Q
FY
12
2Q
FY
12
3Q
FY
12
4Q
FY
12
1Q
FY
13
2Q
FY
13
3Q
FY
13
4Q
FY
13
1Q
FY
14
2Q
FY
14
3Q
FY
14
4Q
FY
14
1Q
FY
15
2Q
FY
15
3Q
FY
15
4Q
FY
15
1Q
FY
16
2Q
FY
16
3Q
FY
16
(%)
Institutional Equities
Vinati Organics 18
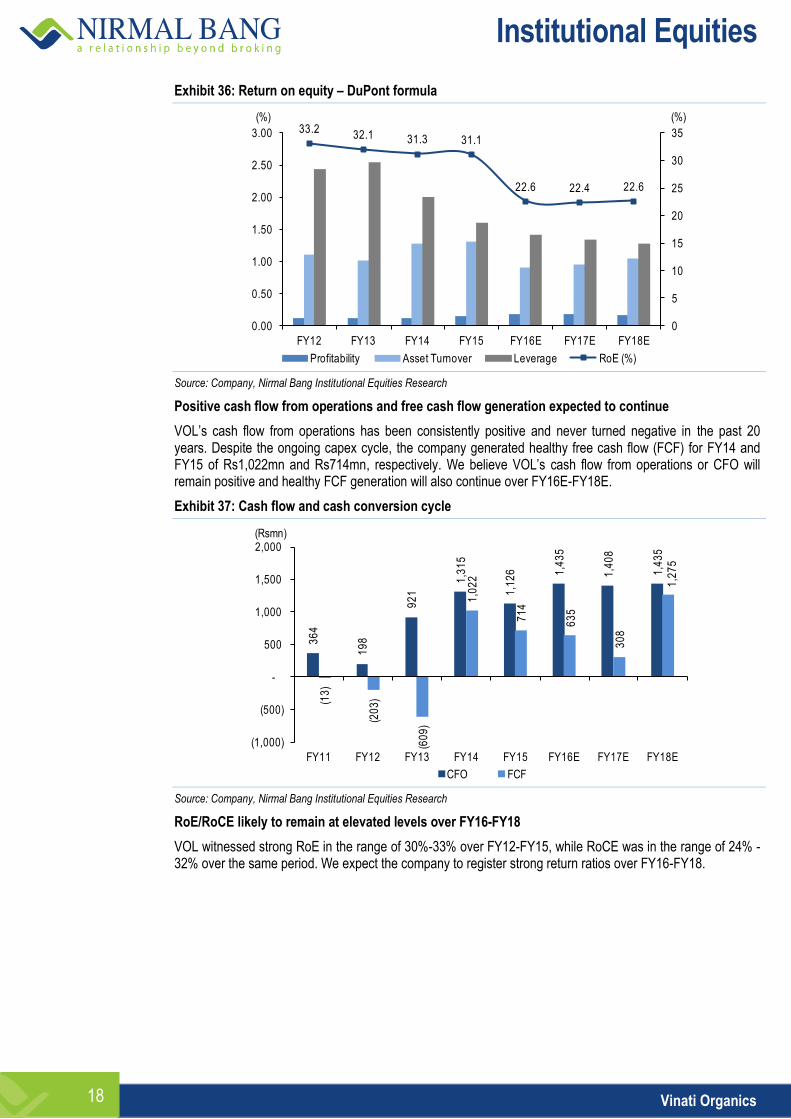
Exhibit 36: Return on equity – DuPont formula
Source: Company, Nirmal Bang Institutional Equities Research
Positive cash flow from operations and free cash flow generation expected to continue
VOL’s cash flow from operations has been consistently positive and never turned negative in the past 20 years. Despite the ongoing capex cycle, the company generated healthy free cash flow (FCF) for FY14 and FY15 of Rs1,022mn and Rs714mn, respectively. We believe VOL’s cash flow from operations or CFO will remain positive and healthy FCF generation will also continue over FY16E-FY18E.
Exhibit 37: Cash flow and cash conversion cycle
Source: Company, Nirmal Bang Institutional Equities Research
RoE/RoCE likely to remain at elevated levels over FY16-FY18
VOL witnessed strong RoE in the range of 30%-33% over FY12-FY15, while RoCE was in the range of 24% - 32% over the same period. We expect the company to register strong return ratios over FY16-FY18.
33.232.1 31.3 31.1
22.6 22.4 22.6
0
5
10
15
20
25
30
35
0.00
0.50
1.00
1.50
2.00
2.50
3.00
FY12 FY13 FY14 FY15 FY16E FY17E FY18E
Profitability Asset Turnover Leverage RoE (%)
(%)(%)
36
4
19
8
92
1
1,3
15
1,1
26
1,4
35
1,4
08
1,4
35
(13
)
(20
3)
(60
9)
1,0
22
71
4
63
5
30
8
1,2
75
(1,000)
(500)
-
500
1,000
1,500
2,000
FY11 FY12 FY13 FY14 FY15 FY16E FY17E FY18E
CFO FCF
(Rsmn)
Institutional Equities
Vinati Organics 19
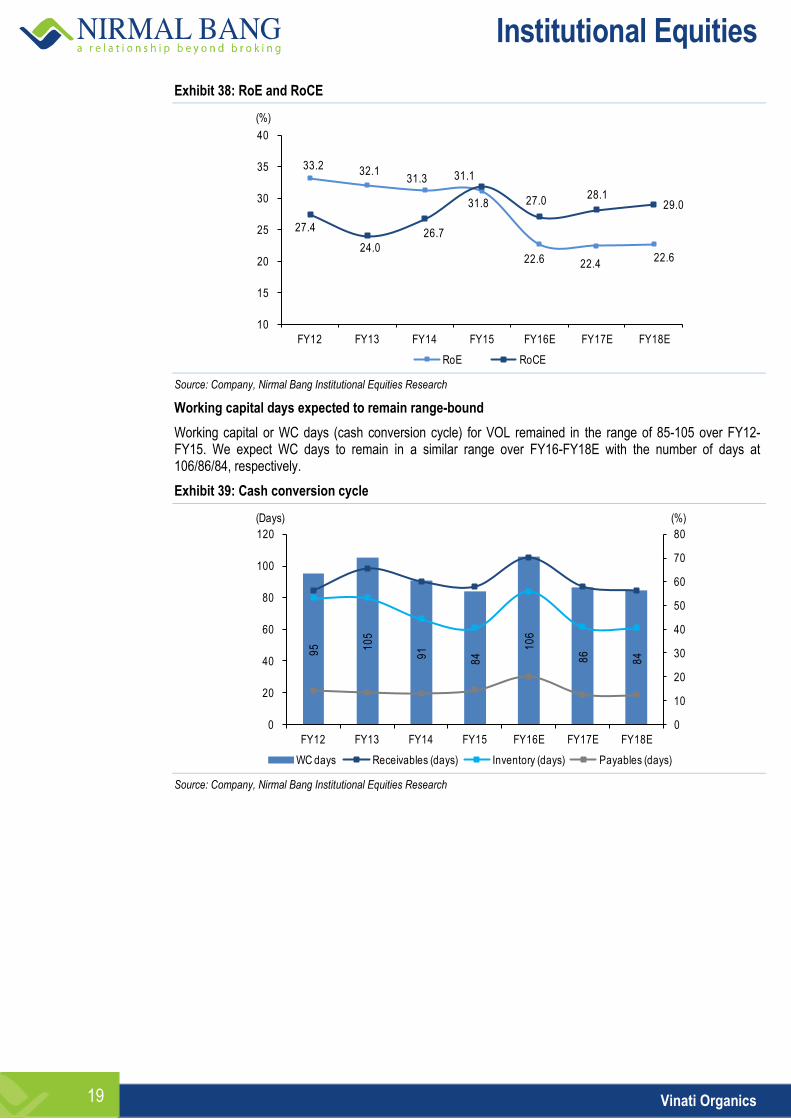
Exhibit 38: RoE and RoCE
Source: Company, Nirmal Bang Institutional Equities Research
Working capital days expected to remain range-bound
Working capital or WC days (cash conversion cycle) for VOL remained in the range of 85-105 over FY12-FY15. We expect WC days to remain in a similar range over FY16-FY18E with the number of days at 106/86/84, respectively.
Exhibit 39: Cash conversion cycle
Source: Company, Nirmal Bang Institutional Equities Research
33.2 32.131.3 31.1
22.6 22.422.6
27.4
24.0
26.7
31.8 27.028.1
29.0
10
15
20
25
30
35
40
FY12 FY13 FY14 FY15 FY16E FY17E FY18E
RoE RoCE
(%)
95 10
5
91
84
10
6
86
84
0
10
20
30
40
50
60
70
80
0
20
40
60
80
100
120
FY12 FY13 FY14 FY15 FY16E FY17E FY18E
WC days Receivables (days) Inventory (days) Payables (days)
(Days) (%)
Institutional Equities
Vinati Organics 20
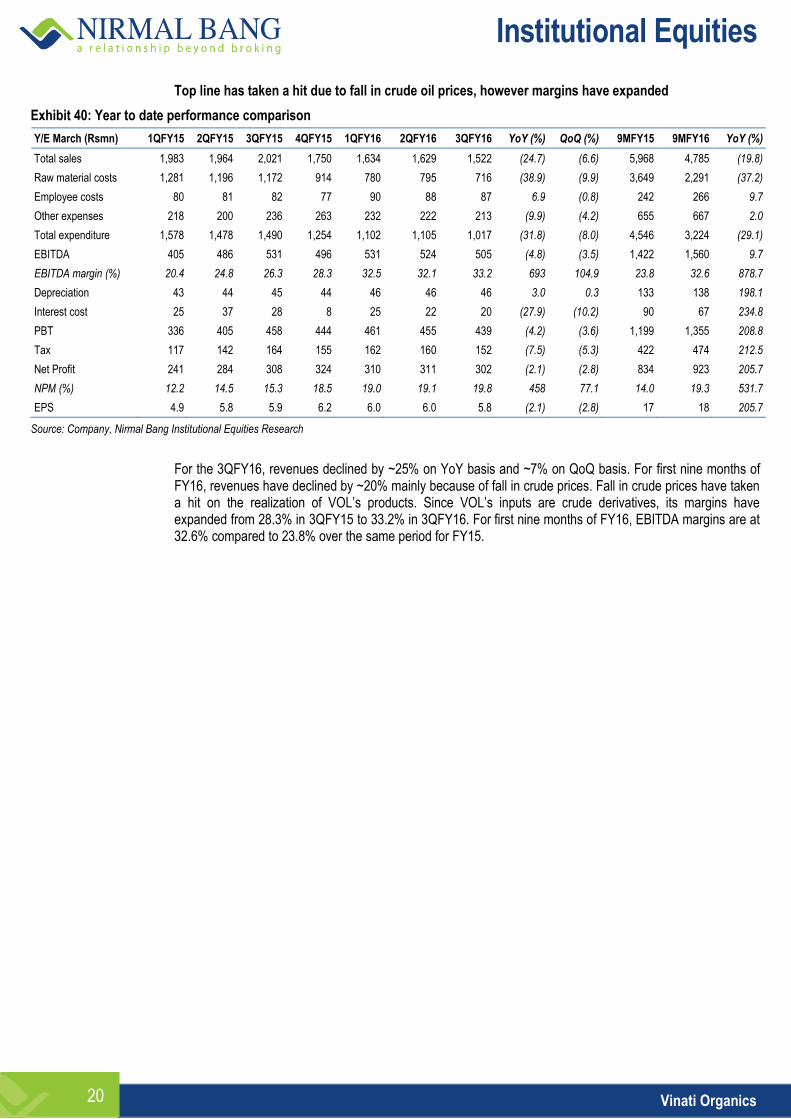
Top line has taken a hit due to fall in crude oil prices, however margins have expanded
Exhibit 40: Year to date performance comparison
Y/E March (Rsmn) 1QFY15 2QFY15 3QFY15 4QFY15 1QFY16 2QFY16 3QFY16 YoY (%) QoQ (%) 9MFY15 9MFY16 YoY (%)
Total sales 1,983 1,964 2,021 1,750 1,634 1,629 1,522 (24.7) (6.6) 5,968 4,785 (19.8)
Raw material costs 1,281 1,196 1,172 914 780 795 716 (38.9) (9.9) 3,649 2,291 (37.2)
Employee costs 80 81 82 77 90 88 87 6.9 (0.8) 242 266 9.7
Other expenses 218 200 236 263 232 222 213 (9.9) (4.2) 655 667 2.0
Total expenditure 1,578 1,478 1,490 1,254 1,102 1,105 1,017 (31.8) (8.0) 4,546 3,224 (29.1)
EBITDA 405 486 531 496 531 524 505 (4.8) (3.5) 1,422 1,560 9.7
EBITDA margin (%) 20.4 24.8 26.3 28.3 32.5 32.1 33.2 693 104.9 23.8 32.6 878.7
Depreciation 43 44 45 44 46 46 46 3.0 0.3 133 138 198.1
Interest cost 25 37 28 8 25 22 20 (27.9) (10.2) 90 67 234.8
PBT 336 405 458 444 461 455 439 (4.2) (3.6) 1,199 1,355 208.8
Tax 117 142 164 155 162 160 152 (7.5) (5.3) 422 474 212.5
Net Profit 241 284 308 324 310 311 302 (2.1) (2.8) 834 923 205.7
NPM (%) 12.2 14.5 15.3 18.5 19.0 19.1 19.8 458 77.1 14.0 19.3 531.7
EPS 4.9 5.8 5.9 6.2 6.0 6.0 5.8 (2.1) (2.8) 17 18 205.7
Source: Company, Nirmal Bang Institutional Equities Research
For the 3QFY16, revenues declined by ~25% on YoY basis and ~7% on QoQ basis. For first nine months of FY16, revenues have declined by ~20% mainly because of fall in crude prices. Fall in crude prices have taken a hit on the realization of VOL’s products. Since VOL’s inputs are crude derivatives, its margins have expanded from 28.3% in 3QFY15 to 33.2% in 3QFY16. For first nine months of FY16, EBITDA margins are at 32.6% compared to 23.8% over the same period for FY15.
Institutional Equities
Vinati Organics 21
Indian chemical industry
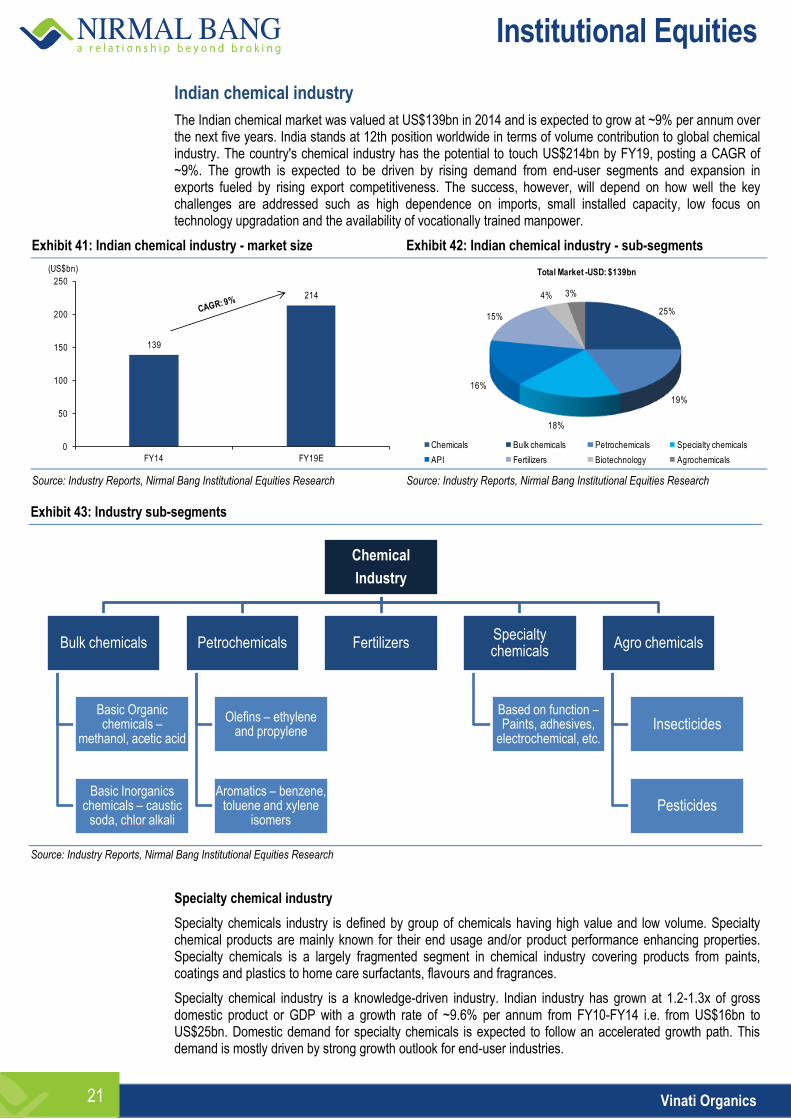
The Indian chemical market was valued at US$139bn in 2014 and is expected to grow at ~9% per annum over the next five years. India stands at 12th position worldwide in terms of volume contribution to global chemical industry. The country's chemical industry has the potential to touch US$214bn by FY19, posting a CAGR of ~9%. The growth is expected to be driven by rising demand from end-user segments and expansion in exports fueled by rising export competitiveness. The success, however, will depend on how well the key challenges are addressed such as high dependence on imports, small installed capacity, low focus on technology upgradation and the availability of vocationally trained manpower.
Exhibit 41: Indian chemical industry - market size Exhibit 42: Indian chemical industry - sub-segments
Source: Industry Reports, Nirmal Bang Institutional Equities Research Source: Industry Reports, Nirmal Bang Institutional Equities Research
Exhibit 43: Industry sub-segments
Source: Industry Reports, Nirmal Bang Institutional Equities Research
Specialty chemical industry
Specialty chemicals industry is defined by group of chemicals having high value and low volume. Specialty chemical products are mainly known for their end usage and/or product performance enhancing properties. Specialty chemicals is a largely fragmented segment in chemical industry covering products from paints, coatings and plastics to home care surfactants, flavours and fragrances.
Specialty chemical industry is a knowledge-driven industry. Indian industry has grown at 1.2-1.3x of gross domestic product or GDP with a growth rate of ~9.6% per annum from FY10-FY14 i.e. from US$16bn to US$25bn. Domestic demand for specialty chemicals is expected to follow an accelerated growth path. This demand is mostly driven by strong growth outlook for end-user industries.
139
214
0
50
100
150
200
250
FY14 FY19E
(US$bn)
25%
19%
18%
16%
15%
4% 3%
Chemicals Bulk chemicals Petrochemicals Specialty chemicals
API Fertilizers Biotechnology Agrochemicals
Total Market -USD: $139bn
Chemical
Industry
Bulk chemicals
Basic Organic chemicals –
methanol, acetic acid
Basic Inorganics chemicals – caustic
soda, chlor alkali
Petrochemicals
Olefins – ethylene and propylene
Aromatics – benzene, toluene and xylene
isomers
Fertilizers Specialty chemicals
Based on function – Paints, adhesives,
electrochemical, etc.
Agro chemicals
Insecticides
Pesticides

Institutional Equities
Vinati Organics 22
This, along with increased adoption of specialty chemicals and new usage, can propel the growth further. Indian specialty chemicals industry has a strong presence overseas. Indian specialty chemicals makers export their products to nearby Asia-Pacific countries as they lack competitive scale of production. Europe and the US remain big clients for Indian companies because of low cost of production and quality talent pool in R&D. Compliance with global regulations and India's manufacturing competitiveness has helped the export market to grow significantly.
The critical factors essential for success of most specialty chemical manufacturers include a clear understanding of customer needs and product/application development to meet the same at a favourable price/performance ratio. Innovation and sustainability initiatives are likely to be some of the major ways for companies to remain competitive. Companies with processes/products in place for eliminating or reducing hazardous waste will enjoy an upper hand over other companies.
Indian specialty chemicals industry is at inflection point
Indian specialty chemical companies have posted a CAGR of 10% over FY10-FY14 and are expected to grow at a faster rate of ~12% over FY14-FY19 mainly because of the following reasons:
Increased end-user demand: India’s GDP is expected to grow by 8% over the next five years. India’s middle class population is expected to increase from 46mn households in 2010 to 148mn households by 2030, with quadrupled consumption. Further, India's urban population is expected to increase by 275mn people by 2030. This will result in consumption-led double-digit growth in key end-user markets over the next decade and increased need for better products and services. Specialty chemicals industry’s growth typically follows the growth of key end-user markets. Currently, 32% of India’s total population lives in urban areas and is expected to touch 40% by 2030. Rising urbanisation leads to increased requirement of clean municipal water, and therefore a significant increase in municipalities’ usage of water treatment chemicals to treat water. Similarly, increased spending by government on infrastructure will lead to increased demand for construction chemicals and coatings.
Increase in per capita consumption: Compared to the developed world (US, Europe) or China, the current penetration of specialty chemicals in India's end-user markets is low. With increased focus on improving products, usage intensity of specialty chemicals in these end-user markets will rise in India over the next decade. For example, concrete admixtures improve the fluidity of concrete, provide a smoother, more even finish, and help avoid cracks. Consequently, concrete admixtures can help reduce maintenance and repair costs, and thereby the total cost of ownership of construction projects in India. India's current expenditure on admixtures is only US$1/m3 of concrete, compared to US$2/m3 in China and US$4.5/m3 in the US. This is primarily because of the lack of awareness of admixtures in Indian construction industry. With rising demand for high quality construction and increased awareness of concrete admixture benefits, the industry could double admixture consumption in India. Similarly, the usage of pesticides in India is 0.58 kg/ha compared to 2.0kg/ha in China. To meet India's food requirements - spurred by increasing population, rising income and limited availability of arable land - the yield per hectare needs to be increased considerably (e.g., crop productivity in India is at 2mt/ha compared to China’s 5mt/ ha).
Improved consumption standards: Consumption standards are policies implemented by the government to promote the safe use of products. These standards are necessary for improving society's standard of living and enhancing consumer safety. Most developed countries (e.g. US, Germany) have implemented stringent consumption standards across various end-user markets. As the economy develops, India needs to regulate products more stringently, and strengthen consumption standards, which in turn will promote increased usage of specialty chemicals. For instance, the US and Germany are very strict on usage of solvents in paints and limit the volatile organic compound (VOC) content. India still uses enamel paints with high VOC content. Mandating the usage of water-based paints (that contain 5%-15% petrochemicals) will help ensure health and safety of consumers, and encourage the consumption of high-cost, water-based paints (increasing the segment's value).
Market outlook
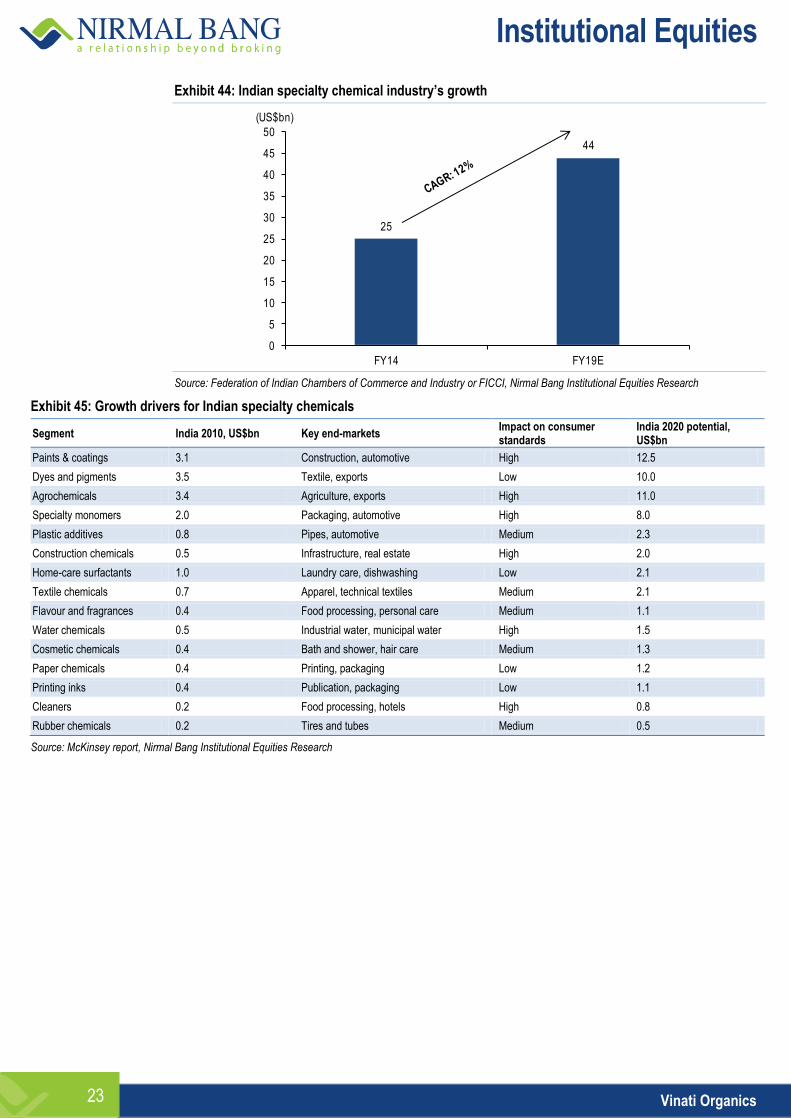
Indian specialty chemicals industry was valued at ~US$25bn as of FY14-end. Specialty chemicals industry has witnessed a high growth rate compared to other chemical segments. Indian specialty chemicals industry is expected to touch ~US$44bn by FY19E.
Institutional Equities
Vinati Organics 23
Exhibit 44: Indian specialty chemical industry’s growth
Source: Federation of Indian Chambers of Commerce and Industry or FICCI, Nirmal Bang Institutional Equities Research
Exhibit 45: Growth drivers for Indian specialty chemicals
Segment India 2010, US$bn Key end-markets Impact on consumer standards
India 2020 potential, US$bn
Paints & coatings 3.1 Construction, automotive High 12.5
Dyes and pigments 3.5 Textile, exports Low 10.0
Agrochemicals 3.4 Agriculture, exports High 11.0
Specialty monomers 2.0 Packaging, automotive High 8.0
Plastic additives 0.8 Pipes, automotive Medium 2.3
Construction chemicals 0.5 Infrastructure, real estate High 2.0
Home-care surfactants 1.0 Laundry care, dishwashing Low 2.1
Textile chemicals 0.7 Apparel, technical textiles Medium 2.1
Flavour and fragrances 0.4 Food processing, personal care Medium 1.1
Water chemicals 0.5 Industrial water, municipal water High 1.5
Cosmetic chemicals 0.4 Bath and shower, hair care Medium 1.3
Paper chemicals 0.4 Printing, packaging Low 1.2
Printing inks 0.4 Publication, packaging Low 1.1
Cleaners 0.2 Food processing, hotels High 0.8
Rubber chemicals 0.2 Tires and tubes Medium 0.5
Source: McKinsey report, Nirmal Bang Institutional Equities Research
25
44
0
5
10
15
20
25
30
35
40
45
50
FY14 FY19E
(US$bn)
Institutional Equities
Vinati Organics 24
Company background
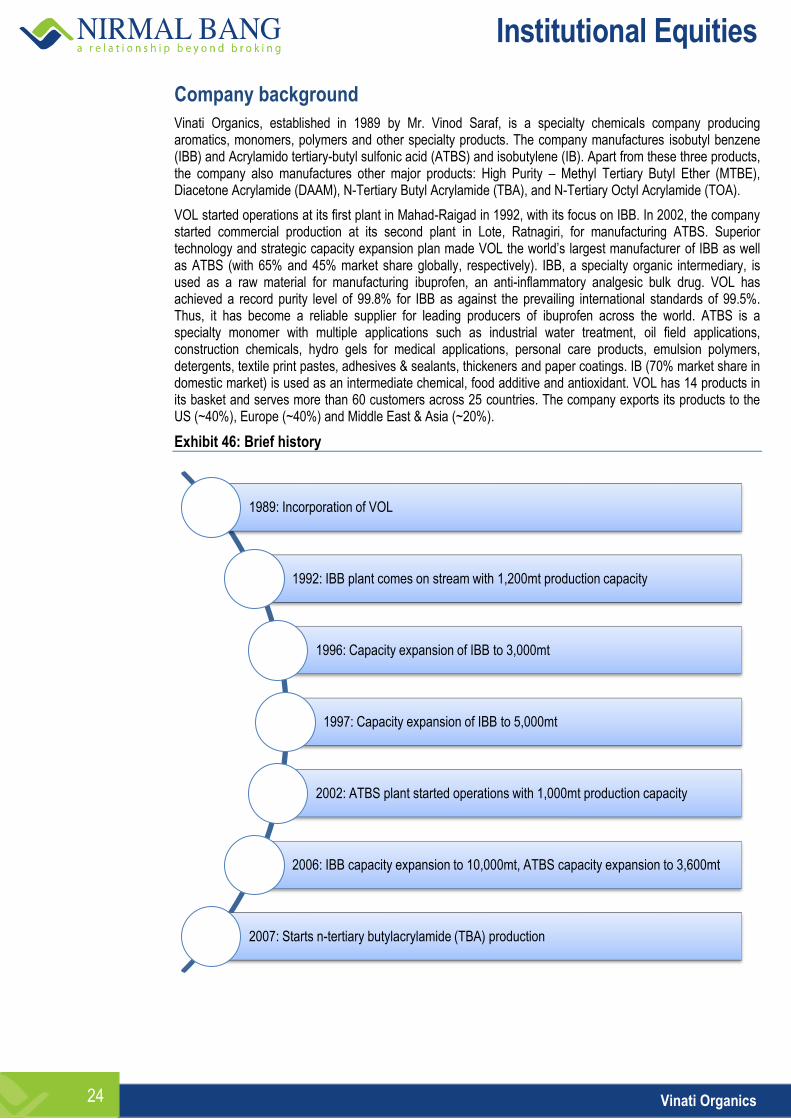
Vinati Organics, established in 1989 by Mr. Vinod Saraf, is a specialty chemicals company producing aromatics, monomers, polymers and other specialty products. The company manufactures isobutyl benzene (IBB) and Acrylamido tertiary-butyl sulfonic acid (ATBS) and isobutylene (IB). Apart from these three products, the company also manufactures other major products: High Purity – Methyl Tertiary Butyl Ether (MTBE), Diacetone Acrylamide (DAAM), N-Tertiary Butyl Acrylamide (TBA), and N-Tertiary Octyl Acrylamide (TOA).
VOL started operations at its first plant in Mahad-Raigad in 1992, with its focus on IBB. In 2002, the company started commercial production at its second plant in Lote, Ratnagiri, for manufacturing ATBS. Superior technology and strategic capacity expansion plan made VOL the world’s largest manufacturer of IBB as well as ATBS (with 65% and 45% market share globally, respectively). IBB, a specialty organic intermediary, is used as a raw material for manufacturing ibuprofen, an anti-inflammatory analgesic bulk drug. VOL has achieved a record purity level of 99.8% for IBB as against the prevailing international standards of 99.5%. Thus, it has become a reliable supplier for leading producers of ibuprofen across the world. ATBS is a specialty monomer with multiple applications such as industrial water treatment, oil field applications, construction chemicals, hydro gels for medical applications, personal care products, emulsion polymers, detergents, textile print pastes, adhesives & sealants, thickeners and paper coatings. IB (70% market share in domestic market) is used as an intermediate chemical, food additive and antioxidant. VOL has 14 products in its basket and serves more than 60 customers across 25 countries. The company exports its products to the US (~40%), Europe (~40%) and Middle East & Asia (~20%).
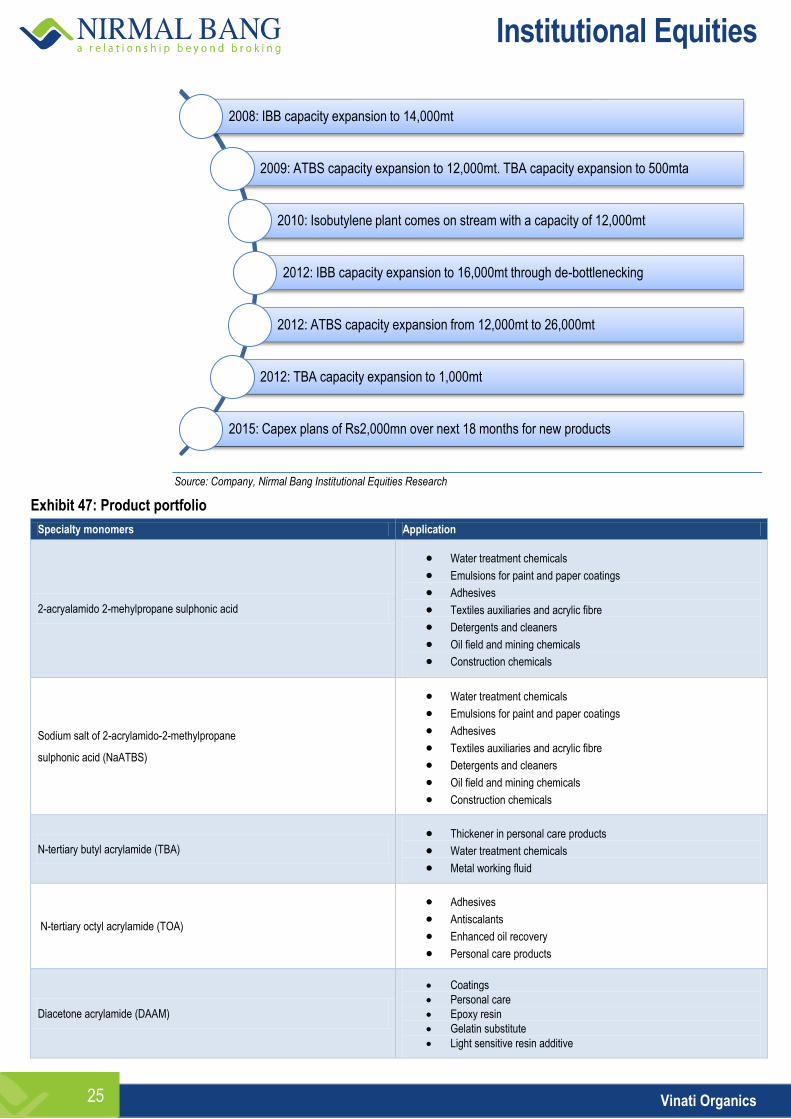
Exhibit 46: Brief history
1989: Incorporation of VOL
1992: IBB plant comes on stream with 1,200mt production capacity
1996: Capacity expansion of IBB to 3,000mt
1997: Capacity expansion of IBB to 5,000mt
2002: ATBS plant started operations with 1,000mt production capacity
2006: IBB capacity expansion to 10,000mt, ATBS capacity expansion to 3,600mt
2007: Starts n-tertiary butylacrylamide (TBA) production
Institutional Equities
Vinati Organics 25
Source: Company, Nirmal Bang Institutional Equities Research
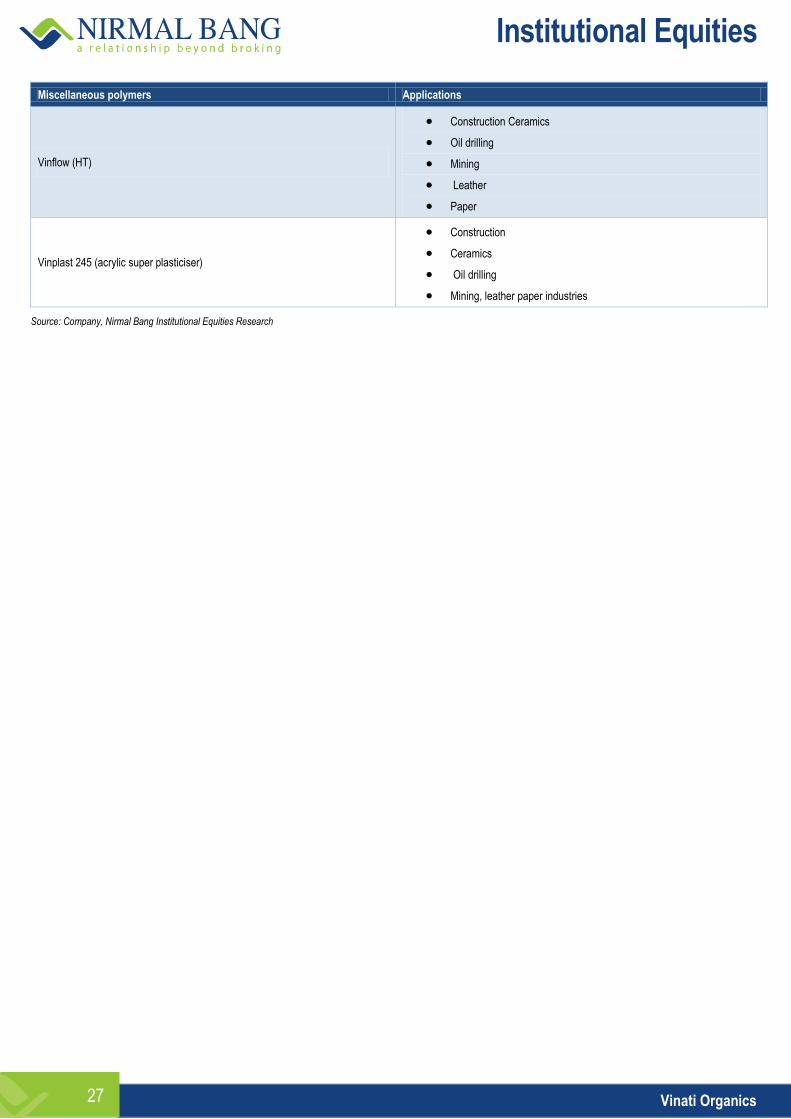
Exhibit 47: Product portfolio
Specialty monomers Application
2-acryalamido 2-mehylpropane sulphonic acid
Water treatment chemicals
Emulsions for paint and paper coatings
Adhesives
Textiles auxiliaries and acrylic fibre
Detergents and cleaners
Oil field and mining chemicals
Construction chemicals
Sodium salt of 2-acrylamido-2-methylpropane
sulphonic acid (NaATBS)
Water treatment chemicals
Emulsions for paint and paper coatings
Adhesives
Textiles auxiliaries and acrylic fibre
Detergents and cleaners
Oil field and mining chemicals
Construction chemicals
N-tertiary butyl acrylamide (TBA)
Thickener in personal care products
Water treatment chemicals
Metal working fluid
N-tertiary octyl acrylamide (TOA)
Adhesives
Antiscalants
Enhanced oil recovery
Personal care products
Diacetone acrylamide (DAAM)
Coatings
Personal care
Epoxy resin
Gelatin substitute
Light sensitive resin additive
2008: IBB capacity expansion to 14,000mt
2009: ATBS capacity expansion to 12,000mt. TBA capacity expansion to 500mta
2010: Isobutylene plant comes on stream with a capacity of 12,000mt
2012: IBB capacity expansion to 16,000mt through de-bottlenecking
2012: ATBS capacity expansion from 12,000mt to 26,000mt
2012: TBA capacity expansion to 1,000mt
2015: Capex plans of Rs2,000mn over next 18 months for new products

Institutional Equities
Vinati Organics 26
Specialty aromatics Applications
Iso butyl benzene (IBB)
Pharmaceuticals industry
Perfume industry
Specialty solvent
Normal butyl benzene (NBB) Specialty solvent
LCD-based applications
C 10 aromatic solvent
Paints and coatings
Inks
Cleaning solvents
Environmental friendly agrochemical and
pesticides formulations
Other products Applications
Isobutylene (IB)
Butyl rubber
Antioxidants
Fragrances and perfumes
Insecticides and pesticides
Personal care products
Monomers
Methanol
Pharmaceuticals industry
Paint and varnish industry
Perfume industry
Manufacture of formaldehyde
Chemical synthesis (sodium methoxide,
dimethyl ether and methyated derivatives)
High purity- methyl tertiary butyl ether (HP-MTBE)
Low-cost solvent in some organic synthesis
Extract solvent for pharmaceutical synthesis
Synthesis of grignard’s reagent
Hexene
Low boiling point solvent
Used as thinners
Hydrocarbon resins
Solvent extraction
Tyre retreading
Octane booster for gasoline
Manufacturing C-5 / C-6 aliphatic petroleum
Institutional Equities
Vinati Organics 27
Miscellaneous polymers Applications
Vinflow (HT)
Construction Ceramics
Oil drilling
Mining
Leather
Paper
Vinplast 245 (acrylic super plasticiser)
Construction
Ceramics
Oil drilling
Mining, leather paper industries
Source: Company, Nirmal Bang Institutional Equities Research
Institutional Equities
Vinati Organics 28
Key risks
Delay in new products launch
VOL is expected to start selling its new products by 2HFY17. Our top-line estimates for FY17 and FY18 are based on the underlying assumption that new products will start impacting revenues positively from FY17 and the full impact will be witnessed in FY18. Any delay in the launch of these products can negatively impact our estimates and hence can affect our target price negatively.
Margin risk because of volatility in crude oil prices
We have assumed global crude oil prices to remain at a subdued level and do not expect them to touch US$110/barrel in the near future. The main raw materials to manufacture IBB and ATBS are petroleum products and hence their prices are linked to crude oil prices. A sharp increase in crude oil prices could lead to pressure on margins. The company has hedged itself against such risk through contracts wherein product prices are benchmarked against input prices. The price variation, depending on products, can vary from monthly to quarterly basis. However, in case of spot sales, margins could be affected in case the company is not able to pass on the price rise in raw materials to its clients.
Downward pressure in demand for ATBS
ATBS has been one of the driving forces of VOL’s growth in the past few years. Enhanced Oil Recovery (EOR) is one of the major applications of ATBS and it has accounted for 20% of total ATBS revenues of VOL. However, the sharp decline in global crude oil prices led to negligible growth from EOR segment as a result of which VOL’s top-line in FY16 has been negatively impacted. However, other segments of ATBS such as personal care, water treatment and paints have witnessed strong demand. Our assumption in forecasting revenues from ATBS is that these segments will continue to grow despite the slowdown in oil and gas industry. Material slowdown in any of these segments will negatively impact our estimate and thereby the target price of VOL.
Product replacement risk
IBB is a mature product and remains one of the key ingredients in the manufacture of ibuprofen. We believe that the product replacement risk for IBB is negligible. ATBS is still in a growth phase and its usage in different applications has been on rise. For any growing chemical product, there is always a replacement risk. However, at this stage we do not foresee any new product that can easily replace ATBS.
Institutional Equities
Vinati Organics 29
Financials
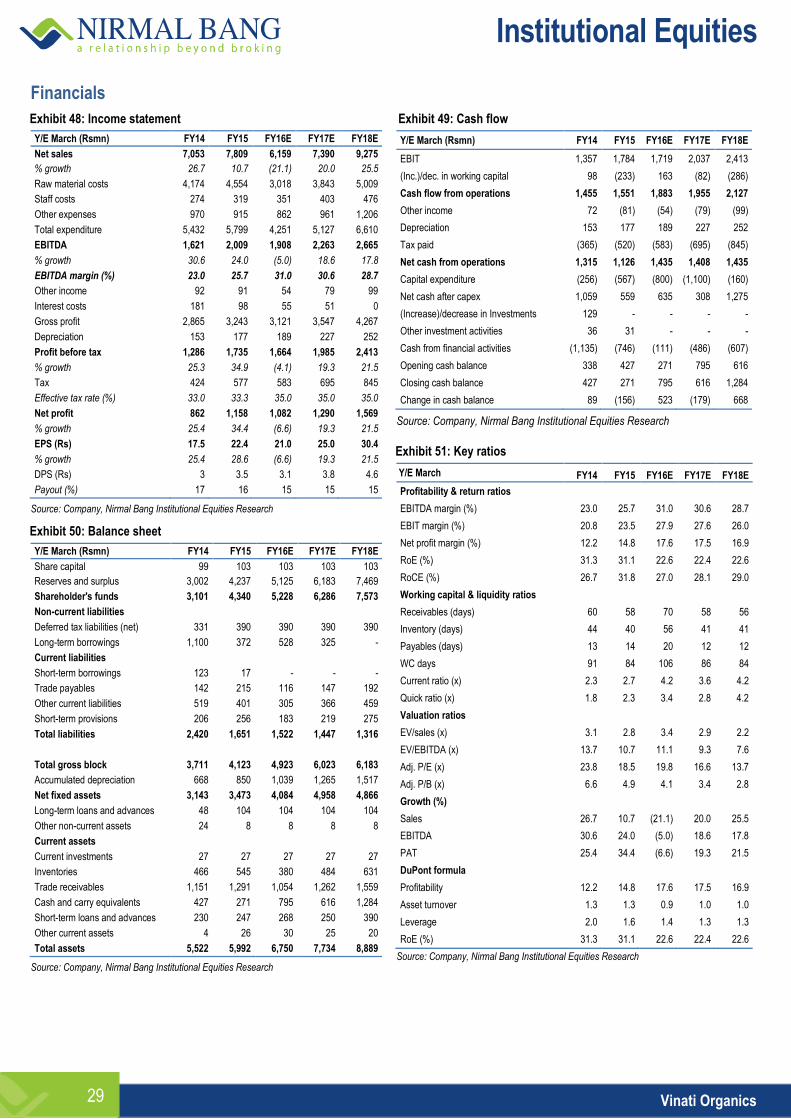
Exhibit 48: Income statement
Y/E March (Rsmn) FY14 FY15 FY16E FY17E FY18E
Net sales 7,053 7,809 6,159 7,390 9,275
% growth 26.7 10.7 (21.1) 20.0 25.5
Raw material costs 4,174 4,554 3,018 3,843 5,009
Staff costs 274 319 351 403 476
Other expenses 970 915 862 961 1,206
Total expenditure 5,432 5,799 4,251 5,127 6,610
EBITDA 1,621 2,009 1,908 2,263 2,665
% growth 30.6 24.0 (5.0) 18.6 17.8
EBITDA margin (%) 23.0 25.7 31.0 30.6 28.7
Other income 92 91 54 79 99
Interest costs 181 98 55 51 0
Gross profit 2,865 3,243 3,121 3,547 4,267
Depreciation 153 177 189 227 252
Profit before tax 1,286 1,735 1,664 1,985 2,413
% growth 25.3 34.9 (4.1) 19.3 21.5
Tax 424 577 583 695 845
Effective tax rate (%) 33.0 33.3 35.0 35.0 35.0
Net profit 862 1,158 1,082 1,290 1,569
% growth 25.4 34.4 (6.6) 19.3 21.5
EPS (Rs) 17.5 22.4 21.0 25.0 30.4
% growth 25.4 28.6 (6.6) 19.3 21.5
DPS (Rs) 3 3.5 3.1 3.8 4.6
Payout (%) 17 16 15 15 15
Source: Company, Nirmal Bang Institutional Equities Research
Exhibit 50: Balance sheet
Y/E March (Rsmn) FY14 FY15 FY16E FY17E FY18E
Share capital 99 103 103 103 103
Reserves and surplus 3,002 4,237 5,125 6,183 7,469
Shareholder's funds 3,101 4,340 5,228 6,286 7,573
Non-current liabilities
Deferred tax liabilities (net) 331 390 390 390 390
Long-term borrowings 1,100 372 528 325 -
Current liabilities
Short-term borrowings 123 17 - - -
Trade payables 142 215 116 147 192
Other current liabilities 519 401 305 366 459
Short-term provisions 206 256 183 219 275
Total liabilities 2,420 1,651 1,522 1,447 1,316
Total gross block 3,711 4,123 4,923 6,023 6,183
Accumulated depreciation 668 850 1,039 1,265 1,517
Net fixed assets 3,143 3,473 4,084 4,958 4,866
Long-term loans and advances 48 104 104 104 104
Other non-current assets 24 8 8 8 8
Current assets
Current investments 27 27 27 27 27
Inventories 466 545 380 484 631
Trade receivables 1,151 1,291 1,054 1,262 1,559
Cash and carry equivalents 427 271 795 616 1,284
Short-term loans and advances 230 247 268 250 390
Other current assets 4 26 30 25 20
Total assets 5,522 5,992 6,750 7,734 8,889
Source: Company, Nirmal Bang Institutional Equities Research
Exhibit 49: Cash flow
Y/E March (Rsmn) FY14 FY15 FY16E FY17E FY18E
EBIT 1,357 1,784 1,719 2,037 2,413
(Inc.)/dec. in working capital 98 (233) 163 (82) (286)
Cash flow from operations 1,455 1,551 1,883 1,955 2,127
Other income 72 (81) (54) (79) (99)
Depreciation 153 177 189 227 252
Tax paid (365) (520) (583) (695) (845)
Net cash from operations 1,315 1,126 1,435 1,408 1,435
Capital expenditure (256) (567) (800) (1,100) (160)
Net cash after capex 1,059 559 635 308 1,275
(Increase)/decrease in Investments 129 - - - -
Other investment activities 36 31 - - -
Cash from financial activities (1,135) (746) (111) (486) (607)
Opening cash balance 338 427 271 795 616
Closing cash balance 427 271 795 616 1,284
Change in cash balance 89 (156) 523 (179) 668
Source: Company, Nirmal Bang Institutional Equities Research
Exhibit 51: Key ratios
Y/E March FY14 FY15 FY16E FY17E FY18E FY14 FY15E
Profitability & return ratios
EBITDA margin (%) 23.0 25.7 31.0 30.6 28.7
EBIT margin (%) 20.8 23.5 27.9 27.6 26.0
Net profit margin (%) 12.2 14.8 17.6 17.5 16.9
RoE (%) 31.3 31.1 22.6 22.4 22.6
RoCE (%) 26.7 31.8 27.0 28.1 29.0
Working capital & liquidity ratios
Receivables (days) 60 58 70 58 56
Inventory (days) 44 40 56 41 41
Payables (days) 13 14 20 12 12
WC days 91 84 106 86 84
Current ratio (x) 2.3 2.7 4.2 3.6 4.2
Quick ratio (x) 1.8 2.3 3.4 2.8 4.2
Valuation ratios
EV/sales (x) 3.1 2.8 3.4 2.9 2.2
EV/EBITDA (x) 13.7 10.7 11.1 9.3 7.6
Adj. P/E (x) 23.8 18.5 19.8 16.6 13.7
Adj. P/B (x) 6.6 4.9 4.1 3.4 2.8
Growth (%)
Sales 26.7 10.7 (21.1) 20.0 25.5
EBITDA 30.6 24.0 (5.0) 18.6 17.8
PAT 25.4 34.4 (6.6) 19.3 21.5
DuPont formula
Profitability 12.2 14.8 17.6 17.5 16.9
Asset turnover 1.3 1.3 0.9 1.0 1.0
Leverage 2.0 1.6 1.4 1.3 1.3
RoE (%) 31.3 31.1 22.6 22.4 22.6
Source: Company, Nirmal Bang Institutional Equities Research
Institutional Equities
Vinati Organics 30
Disclaimer
Stock Ratings Absolute Returns
BUY > 15%
ACCUMULATE -5% to15%
SELL < -5%
This report is published by Nirmal Bang’s Institutional Equities Research desk. Nirmal Bang group has other business units with independent research teams separated by Chinese walls, and therefore may, at times, have different or contrary views on stocks and markets. Reports based on technical and derivative analysis may not match with reports based on a company's fundamental analysis. This report is for the personal information of the authorised recipient and is not for public distribution. This should not be reproduced or redistributed to any other person or in any form. This report is for the general information for the clients of Nirmal Bang Equities Pvt. Ltd., a division of Nirmal Bang, and should not be construed as an offer or solicitation of an offer to buy/sell any securities.
We have exercised due diligence in checking the correctness and authenticity of the information contained herein, so far as it relates to current and historical information, but do not guarantee its accuracy or completeness. The opinions expressed are our current opinions as of the date appearing in the material and may be subject to change from time to time without notice.
Nirmal Bang or any persons connected with it do not accept any liability arising from the use of this document or the information contained therein. The recipients of this material should rely on their own judgment and take their own professional advice before acting on this information. Nirmal Bang or any of its connected persons including its directors or subsidiaries or associates or employees or agents shall not be in any way responsible for any loss or damage that may arise to any person/s from any inadvertent error in the information contained, views and opinions expressed in this publication.
Nirmal Bang Equities Private Limited (hereinafter referred to as “NBEPL”) is a registered Member of National Stock Exchange of India Limited, Bombay Stock Exchange Limited. NBEPL has registered with SEBI as a Research Entity in terms of SEBI (Research Analyst) Regulations, 2014. (Registration No: INH000001436 -19.08.2015 to 18.08.2020).
NBEPL or its associates including its relatives/analyst do not hold any financial interest/beneficial ownership of more than 1% in the company covered by Analyst.
NBEPL or its associates/analyst has not received any compensation from the company covered by Analyst during the past twelve months. NBEPL /analyst has not served as an officer, director or employee of company covered by Analyst and has not been engaged in market-making activity of the company covered by Analyst.
The views expressed are based solely on information available publicly and believed to be true. Investors are advised to independently evaluate the market conditions/risks involved before making any investment decision.
Access all our reports on Bloomberg, Thomson Reuters and Factset.
Team Details:
Name Email Id Direct Line
Rahul Arora CEO [email protected] -
Girish Pai Head of Research [email protected] +91 22 3926 8017 / 18
Dealing
Ravi Jagtiani Dealing Desk [email protected] +91 22 3926 8230, +91 22 6636 8833
Pradeep Kasat Dealing Desk [email protected] +91 22 3926 8100/8101, +91 22 6636 8831
Michael Pillai Dealing Desk [email protected] +91 22 3926 8102/8103, +91 22 6636 8830
Umesh Bharadia Dealing Desk [email protected] +91-22-39268226
Nirmal Bang Equities Pvt. Ltd.
Correspondence Address
B-2, 301/302, Marathon Innova,
Nr. Peninsula Corporate Park,
Lower Parel (W), Mumbai-400013.
Board No. : 91 22 3926 8000/1; Fax. : 022 3926 8010