2.1. generalshodhganga.inflibnet.ac.in/bitstream/10603/10219/8/08_chapter 2.pdf · individuals who...
TRANSCRIPT

2. REVIEW OF LITERATURE
2.1. General
2.1.1. Diabetes: the disease
Diabetes is any disorder characterized by excessive urine excretion. The most common
form of diabetes is diabetes mellitus, a metabolic disorder in which there is an inability
to oxidize carbohydrate due to disturbances in insulin function. Diabetes mellitus is
characterized by elevated glucose in the plasma and episodic ketoacidosis. Additional
symptoms of diabetes mellitus include excessive thirst, glucosuria, polyuria, lipemia and
hunger. If left untreated the disease can lead to fatal ketoacidosis. Other forms of diabetes
include diabetes insipidus and brittle diabetes. Diabetes insipidus is the result of a
deficiency of antidiuretic hormone (ADH, also referred to as vasopressin or arginine
vasopressin, AVP). The major symptom of diabetes insipidus (excessive output of dilute
urine) results from an inability of the kidneys to resorb water. Brittle diabetes is a form
that is very difficult to control. It is characterized by unexplained oscillations between
hypoglycemia and acidosis.150
Criteria, which clinically establish an individual as suffering from diabetes mellitus,
include:
(i) having a fasting plasma glucose level in excess of 126mg/dL (7mmol/L).
Normal levels should be less than 100mg/dL (5.6mmol/L) or:
(ii) having plasma glucose levels in excess of 200mg/dL (11mmol/L) at two
times points during an oral glucose tolerance test, OGTT, one of which must be
within 2 hrs of ingestion of glucose.
Glucose tolerance curve for a normal person and non-insulin-dependent diabetes mellitus
(NIDDM, Type 2 diabetes) patient is shown in figure RL1.
The earlier a person is diagnosed with diabetes (principally type 2) the better chance the
person has of staving off the primary negative consequences which are renal failure,
blindness and limb amputations due to circulatory problems. The American Diabetes
Association is planning to recommend that physicians consider patients to be pre-diabetic
if their fasting blood glucose level is above 100mg/dL but less than 125mg/dL and whose

glucose levels are at least 140mg/dL but less than 200mg/dL following an oral glucose
tolerance test (OGTT).
Figure RL1: Glucose tolerance curve for a normal person and one with non-insulin-
dependent diabetes mellitus (NIDDM, Type 2 diabetes). The dotted lines indicate the
range of glucose concentration expected in a normal individual.
2.1.2. Types of Diabetes Mellitus
Diabetes mellitus is a heterogeneous clinical disorder with numerous causes. Two main
classifications of diabetes mellitus exist, idiopathic and secondary.
Idiopathic diabetes is divided into two main types; insulin dependent and non-insulin-
dependent. Insulin-dependent diabetes mellitus, IDDM (more commonly referred to as
type 1 diabetes) is defined by the development of ketoacidosis in the absence of insulin
therapy. Type 1 diabetes most often manifests in childhood (hence, also called juvenile
onset diabetes) and is the result of an autoimmune destruction of the β-cells of the
pancreas. Non-insulin-dependent diabetes mellitus, NIDDM (more commonly referred to
as type 2 diabetes) is characterized by persistent hyperglycemia but rarely leads to
ketoacidosis. Type 2 diabetes generally manifests after age 40 and therefore has the
obsolete name of adult onset-type diabetes. Type 2 diabetes can result from genetics
defects that cause both insulin resistance and insulin deficiency. There are two main
forms of type 2 diabetes:

(i) Late onset associated with obesity.
(ii) Late onset not associated with obesity.
There is a strong correlation between obesity and the onset of type 2 diabetes with its
associated insulin resistance. It should be pointed out that in the United States the
proportion of the population under 40 that can be clinically defined as obese now exceeds
25%. Many children are obese and are developing type 2 diabetes at an alarming
epidemic rate. The dramatic rise in obesity in the US has lead to an equally alarming
increase in the percentage of the population who suffer from the metabolic syndrome. The
metabolic syndrome is a clustering of atherosclerotic cardiovascular disease risk factors,
one of which involves insulin resistance characteristic in type 2 diabetes. It should be
pointed out that obesity alone does not always lead to insulin resistance as some
individuals who are obese do not experience insulin resistance and conversely, some
individuals who manifest insulin resistance are not obese. These latter observations point
to the added role of genetics in the acquisition of insulin resistance.150
Secondary or other specific types of diabetes mellitus are the result of many causes
including:
1. Maturity onset type diabetes of the young (MODY) was previously considered to be a
third form of type 2 diabetes. However, with the discovery of specific mutations leading
to MODY, it is now classified under secondary or other specific types of diabetes.
MODY is characterized by onset prior to age 25. All cases to date have shown impaired
β-cell function. Patients may also exhibit insulin resistance and late β-cell failure.
Evidence indicates that mutations in 10-12 different genes have been correlated with the
development of MODY. Mutations in the 8 genes described here are all clearly correlated
to MODY:
MODY1: the transcription factor identified as hepatic nuclear factor-4α (HNF-
4α; gene symbol = HNF4A). This gene is also called transcription factor-14
(TCF14). Expression of HNF-4α is associated with the growth and normal
functioning of the pancreas. Many genes are known to be regulated by HNF-4α
including those encoding HNF-1α, PPARα, insulin, glucose-6-phosphatase,
GLUT2, the liver pyruvate kinase isoform (L-PK) which is also expressed in the
pancreas, glyceraldehyde-3-phosphate dehydrogenase (G3PDH), aldolase B and
uncoupling protein 2, UCP2.
MODY2: pancreatic glucokinase

MODY3: the transcription factor HNF-1α (gene symbol = HNF1A). This gene
is also called hepatocyte transcription factor-1 (TCF1). HNF-1α is involved in a
regulatory loop with HNF-4α controlling many genes involved in liver function
such as the GLUT2 and L-PK genes.
MODY4: the homeodomain transcription factor insulin promoter factor-1 (IPF-
1). This gene is more commonly called PDX1 which is derived from pancreas
duodenum homeobox-1.
MODY5: the transcription factor HNF-1β. This gene is also called hepatocyte
transcription factor-2 (TCF2). HNF-1β is a critical regulator of a transcriptional
network that controls the specification, growth, and differentiation of the
embryonic pancreas. In humans, mutations in the HNF-1β gene (symbol =
HNF1B) are associated with pancreatic hypoplasia, defective kidney
development and genital malformations.
MODY6: the bHLH transcription factor NeuroD1. NeuroD1 was first identified
as a neural fate-inducing gene. The hamster β2 gene, shown to regulate insulin
transcription is identical to NeuroD1 so the gene is often called NeuroD/β2.
MODY6 is a rare form of MODY
MODY7: the Krupple-like factor 11 (KLF11) protein is a zinc-finger
transcription factor that is involved in activation of the insulin promoter. KLF11
is a TGF-β-inducible transcription factor.
MODY8: the carboxyl-ester lipase gene (CEL) which is involved in lipid
metabolism. Frameshift deletions in the variable number tandem repeats
(VNTR) of the CEL gene are associated with MODY8 which is characterized by
pancreatic exocrine and β-cell dysfunction. MODY8 is a rare form of MODY.
2. Pancreatic disease: Pancreatectomy leads to the clearest example of secondary
diabetes. Cystic fibrosis and pancreatitis can also lead to destruction of the pancreas.
3. Endocrine disease: Some tumors can produce counter-regulatory hormones that oppose
the action of insulin or inhibit insulin secretion. These counter-regulatory hormones are
glucagon, epinephrine, growth hormone and cortisol.
a) Glucagonomas are pancreatic cancers that secrete glucagon.
b) Pheochromocytomas secrete epinephrine.
c) Cushing syndrome results in excess cortisol secretion.
d) Acromegaly results in excess growth hormone production.
4. Drug-induced diabetes; treatment with glucocorticoids and diuretics can interfere with
insulin function.
5. Anti-insulin receptor autoantibodies (Type B insulin resistance).
6. Mutations in the insulin gene.
7. Mutations in insulin receptor gene which lead to the syndromes listed below. Two
clinical features are common in all syndromes that result from mutations in the insulin
receptor gene: acanthosis nigricans and hyperandrogenism (the latter being observed only
in females).
a) Donohue syndrome (also referred to as Leprachaunism)
b) Rabson-Mendenhall syndrome
c) Type A insulin resistance
8. Gestational diabetes; this syndrome sets in during pregnancy and usually resolves itself
following childbirth.
9. Many other genetic syndromes have either diabetes or impaired glucose tolerance
associated with them; lipoatrophic diabetes, Wolfram syndrome, Down syndrome,
Klinefelter syndrome (XXY males), Turner syndrome, myotonic dystrophy, muscular
dystrophy, Huntington disease, Friedreich ataxia, Prader-Willi syndrome, Werner
syndrome, Cockayne syndrome, and others such as those indicated above.
2.1.3. Insulin-Dependent Diabetes Mellitus (IDDM) Type 1
2.1.3.1. Etiology of Type 1 Diabetes
Type 1 diabetes has been shown to be the result of an autoimmune reaction to antigens of
the islet cells of the pancreas. There is a strong association between IDDM and other
endocrine autoimmunities (e.g. Addison disease). Additionally, there is an increased
prevalence of autoimmune disease in family members of IDDM patients.
Types of Autoantibodies
1. Islet cell cytoplasmic antibodies: The primary antibodies found in 90% of type 1
diabetics are against islet cell cytoplasmic proteins (termed ICCA, islet cell cytoplasmic
antibodies). In non-diabetics ICCA frequency is only 0.5%–4%. The presence of ICCA is
a highly accurate predictor of future development of IDDM. ICCA are not specific for the
β-cells and recognize antigens in other cell types in the islet. However, the autoimmune
attack appears to selectively destroy β-cells. Therefore, the antibodies may play a primary
role in the destruction of islet cells. It is an equally likely possibility that the production of

anti-islet antibodies occurs as a result of the destruction of β-cells. Whether a direct cause
or an effect of islet cell destruction, the titer of the ICCA tends to decline over time.
2. Islet cell surface antibodies: Autoantibodies directed against cell-surface antigens
(ICSA) have also been described in as many as 80% of type 1 diabetics. Similar to ICCA,
the titer of ICSA declines over time. Some patients with type 2 diabetes have been
identified that are ICSA positive.
3. Specific antigenic targets of islet cells: Antibodies to glutamic acid decarboxylase
(GAD) have been identified in over 80% of patients newly diagnosed with IDDM. Like
ICCA, anti-GAD antibodies decline over time in type 1 diabetics. The presence of anti-
GAD antibodies is a strong predictor of the future development of IDDM in high-risk
populations. Anti-insulin antibodies (IAA) have been identified in IDDM patients and in
relatives at risk to develop IDDM. These IAA are detectable even before the onset of
insulin therapy in type 1 diabetics. IAA are detectable in around 40% of young children
with IDDM.
2.1.3.2. Pathophysiology of Type 1 Diabetes
The autoimmune destruction of pancreatic β-cells leads to a deficiency of insulin
secretion. It is this loss of insulin secretion that leads to the metabolic derangements
associated with IDDM. In addition to the loss of insulin secretion, the function of
pancreatic α-cells is also abnormal. There is excessive secretion of glucagon in IDDM
patients. Normally, hyperglycemia leads to reduced glucagon secretion. However, in
patients with IDDM, glucagon secretion is not suppressed by hyperglycemia. The
resultant inappropriately elevated glucagon levels exacerbates the metabolic defects due
to insulin deficiency (see below). The most pronounced example of this metabolic
disruption is that patients with IDDM rapidly develop diabetic ketoacidosis in the absence
of insulin administration. If somatostatin is administered to suppress glucagon secretion,
there is a concomitant suppression in the rise of glucose and ketone bodies. Particularly
problematic for long term IDDM patients is an impaired ability to secrete glucagon in
response to hypoglycemia. This leads to potentially fatal hypoglycemia in response to
insulin treatment in these patients.
Although insulin deficiency is the primary defect in IDDM, in patients with poorly
controlled IDDM there is also a defect in the ability of target tissues to respond to the
administration of insulin. There are multiple biochemical mechanisms that account for
this impairment of tissues to respond to insulin. Deficiency in insulin leads to elevated

levels of free fatty acids in the plasma as a result of uncontrolled lipolysis in adipose
tissue. Free fatty acids suppress glucose metabolism in peripheral tissues such as skeletal
muscle. This impairs the action of insulin in these tissues, i.e. the promotion of glucose
utilization. Additionally, insulin deficiency decreases the expression of a number of genes
necessary for target tissues to respond normally to insulin such as glucokinase in liver and
the GLUT 4 class of glucose transporters in adipose tissue. The major metabolic
derangements which result from insulin deficiency in IDDM are impaired glucose, lipid
and protein metabolism.150
Glucose Metabolism: Uncontrolled IDDM leads to increased hepatic glucose output. First,
liver glycogen stores are mobilized then hepatic gluconeogenesis is used to produce
glucose. Insulin deficiency also impairs non-hepatic tissue utilization of glucose. In
particular in adipose tissue and skeletal muscle, insulin stimulates glucose uptake. This is
accomplished by insulin-mediated movement of glucose transporter proteins to the
plasma membrane of these tissues. Reduced glucose uptake by peripheral tissues in turn
leads to a reduced rate of glucose metabolism. In addition, the level of hepatic
glucokinase is regulated by insulin. Therefore, a reduced rate of glucose phosphorylation
in hepatocytes leads to increased delivery to the blood. Other enzymes involved in
anabolic metabolism of glucose are affected by insulin (primarily through covalent
modifications). The combination of increased hepatic glucose production and reduced
peripheral tissues metabolism leads to elevated plasma glucose levels. When the capacity
of the kidneys to absorb glucose is surpassed, glucosuria ensues. Glucose is an osmotic
diuretic and an increase in renal loss of glucose is accompanied by loss of water and
electrolytes, termed polyuria. The result of the loss of water (and overall volume) leads to
the activation of the thirst mechanism (polydipsia). The negative caloric balance which
results from the glucosuria and tissue catabolism leads to an increase in appetite and food
intake (polyphagia).
Lipid Metabolism: One major role of insulin is to stimulate the storage of food energy
following the consumption of a meal. This energy storage is in the form of glycogen in
hepatocytes and skeletal muscle. Additionally, insulin stimulates hepatocytes to
synthesize triglycerides and storage of triglycerides in adipose tissue. In opposition to
increased adipocyte storage of triglycerides is insulin-mediated inhibition of lipolysis. In
uncontrolled IDDM there is a rapid mobilization of triglycerides leading to increased
levels of plasma free fatty acids. The free fatty acids are taken up by numerous tissues
(however, not the brain) and metabolized to provide energy. Free fatty acids are also
taken up by the liver.
Normally, the levels of malonyl-CoA are high in the presence of insulin. These high
levels of malonyl-CoA inhibit carnitine palmitoyltransferase I, the enzyme required for
the transport of fatty acyl-CoA's into the mitochondria where they are subject to oxidation
for energy production. Thus, in the absence of insulin, malonyl-CoA levels fall and
transport of fatty acyl-CoA's into the mitochondria increases. Mitochondrial oxidation of
fatty acids generates acetyl-CoA which can be further oxidized in the TCA cycle.
However, in hepatocytes the majority of the acetyl-CoA is not oxidized by the TCA cycle
but is metabolized into the ketone bodies, acetoacetate and β-hydroxybutyrate. These
ketone bodies leave the liver and are used for energy production by the brain, heart and
skeletal muscle. In IDDM, the increased availability of free fatty acids and ketone bodies
exacerbates the reduced utilization of glucose furthering the ensuing hyperglycemia.
Production of ketone bodies, in excess of the organisms ability to utilize them leads to
ketoacidosis. In diabetics, this can be easily diagnosed by smelling the breath. A
spontaneous breakdown product of acetoacetate is acetone which is volatilized by the
lungs producing a distinctive odor.
Normally, plasma triglycerides are acted upon by lipoprotein lipase (LPL), an enzyme on
the surface of the endothelial cells lining the vessels. In particular, LPL activity allows
fatty acids to be taken from circulating triglycerides for storage in adipocytes. The
activity of LPL requires insulin and in its absence a hypertriglyceridemia results.150
Protein Metabolism: Insulin regulates the synthesis of many genes, either positively or
negatively that then affect overall metabolism. Insulin has a global effect on protein
metabolism, increasing the rate of protein synthesis and decreasing the rate of protein
degradation. Thus, insulin deficiency will lead to increased catabolism of protein. The
increased rate of proteolysis leads to elevated concentrations in plasma amino acids.
These amino acids serve as precursors for hepatic and renal gluconeogensis. In liver, the
increased gluconeogenesis further contributes to the hyperglycemia seen in IDDM.150
IDDM is accompanied by long-term microvascular, neurologic and macrovascular
complications. Although the daily management of IDDM is burdensome and the specter
of metabolic decomposition ever-present, long-term complications including retinopathy,

nephropathy, neuropathy and cardiovascular disease have caused the most morbidity and
mortality since the introduction of insulin therapy.151,152
2.1.3.3. Genetics of Type 1 Diabetes
The majority of genetic loci associated with the development of type 1 diabetes (T1D)
map to the human leukocyte antigen (HLA) class II proteins which are encoded for by
genes in the major histocompatibility complex (MHC) which is located on chromosome
6p21. The diagrams given below (Figure RL2)150
a simplified view of the MHC cluster
which spans 3.5 megabases of chromosome 6 and encompasses over 200 genes divided
into three subregions termed class I, class II and class III.
Figure RL2: Simplified view of the MHC cluster genes. The class I genes encode α peptide chains, which associate with β2 microglobulin to form the class I molecules. Class I molecules are
expressed on the surface of all nucleated cells where they are involved in the restriction of
cytotoxic T cell activity. The class II (HLA-D) loci are subdivided into at least one A and one B gene which encode the α and β peptide chains, respectively. The class II proteins combine to form
heterodimeric molecules that are expressed on antigen presenting cells, B cells, and activated T
cells. The HLA-DP, HLA-DQ, and HLA-DR molecules are involved in the activation of helper T
cells. There are nine B genes in the DR cluster identified as DRB1–DRB9. There are five distinct DR haplotypes in humans identified as DR1 (composed of the DRB1, DRB6, and DRB9 genes),
DR51 (composed of the DRB1, DRB6, DRB5, and DRB9 genes), DR52 (composed of the DRB1,
DRB2, DRB3, and DRB9 genes), DR8 (composed of the DRB1 and DRB9 genes), and DR53 (composed of the DRB1, DRB7, DRB8, DRB4, and DRB9 genes). The current MHC
nomenclature arranges the DR sequences into different allelic groups. DRB1 sequences are
arranged into 13 different allelic groups that through phylogenetic analyses cluster within the five
haplotypes outlined above. These allelic groups are denoted: *01 and *10 (the DR1 group), *08 (the DR8 group), *15 and *16 (the DR51 group), *03, *11, *12, *13, and *14 (the DR52 group),
and *04, *07, and *09 (the DR53 group). The second expressed DRB loci (DRB3, DRB4, and
DRB5) exhibit limited polymorphisms in the human genome. The class III genes encode a range of molecules with a variety of functions, including complement components, tumor necrosis
factor (TNF), and heat shock protein, Hsp70.
This is not to say that all genetic associations in T1D are due to mutations in HLA genes
as more than 40 additional T1D susceptibility loci have been identified that are not HLA

genes. The most frequently observed non-HLA genes associated with T1D are the insulin
(INS), protein tyrosine phosphatase, non-receptor type 22 (PTPN22), cytotoxic T-
lymphocyte-associated protein 4 (CTLA4), interleukin-2 receptor alpha (IL2RA), and
interferon-induced with helicase C domain 1 (IFIH1) genes. The INS gene is on
chromosome 11p15.5, the PTPN22 gene is on chromosome 1p13, the CTLA4 gene is on
chromosome 2q33, the IL2RA gene is on chromosome 10p15.1, and the IFIH1 gene is on
chromosome 2q24.
Polymorphisms in the INS gene account for approximately 10% of genetic susceptibilities
to T1D. All of the INS gene polymorphisms reside outside the coding region of the gene
indicating that susceptibility to T1D is related to modulation of expression of the INS
gene. The PTPN22 gene encodes a protein identified as lymphoid-specific phosphatase
(LYP) which is involved in the prevention of spontaneous T cell activation. One of the
polymorphisms in the PTPN22 gene that is associated with T1D susceptibility is also
associated with other autoimmune diseases such as systemic lupus erythematosus (SLE),
Graves disease, and rheumatoid arthritis (RA). The protein encoded by the CTLA4 gene
is also involved in regulating T cell activation and like polymorphisms in the PTPN22
gene, polymorphisms in CTLA4 are associated with other autoimmune disorders such as
Addison disease and Graves disease.
The highest risk population for the development of T1D are children born with the HLA
DR3/4–DQ8 serotype allele which accounts for almost 50% of all children who develop
antibodies against pancreatic islet cells and thus develop T1D by the age of 5. HLA DR
serotype alleles are molecules that recognize different DR gene products. The DR3
serotype recognizes the DRB1*03 gene products and the DR4 serotype recognizes the
DRB1*04 gene products. Children with the high risk HLA alleles DR3/4–DRQ or
DR4/DR4 and who have a family history of T1D have a nearly 1 in 5 chance of
developing islet cell autoantibodies resulting in T1D. These same children born into a
family with no history of T1D still have a 1 in 20 chance of developing T1D. It should be
pointed out that although there are these strong genetic associations to T1D over 85% of
all children who develop the disease do not have a family history associated with T1D.
The class II HLA molecules that are associated with increased risk of T1D have been
shown to bind peptides derived from the currently identified autoantigens described

above and present these peptides to CD4+ T cells which then activate CD8
+ cytotoxic T
cells resulting in killing of islet β cells.150
2.1.4. Non-Insulin-Dependent Diabetes Mellitus (NIDDM): Type 2
2.1.4.1. Etiology of Type 2 Diabetes
Type 2 diabetes is characterized by a lack of the need for insulin to prevent ketoacidosis.
Type 2 diabetes refers to the common form of idiopathic NIDDM. Type 2 diabetes is not
an autoimmune disorder; however, there is a strong genetic correlation to the
susceptibility to this form of diabetes. The susceptibility genes that predispose one to
NIDDM have not been identified in most patients. This is due in part to the heterogeneity
of the genes responsible for the susceptibility to type 2 diabetes. Obesity is a major risk
factor that predisposes one to type 2 diabetes. Genetic studies in mice and rats have
demonstrated a link between genes responsible for obesity and those that cause diabetes
mellitus.
2.1.4.2. Pathophysiology of Type 2 Diabetes
Extensive investigations of the pathophysiology of NIDDM have identified two defects in
endocrine functions: insulin resistance and insulin deficiency. Genetic factors contribute
importantly to the predisposition to develop NIDDM. Nevertheless, abundant evidence
suggests that environmental factors (e.g., nutrition, physical exercise etc.) may also
modulate the expression of the diabetic phenotype. Inasmuch NIDDM is a genetic
disease; the identity of the cause of the disease is encrypted in the sequence of nucleotides
in the patients’ DNA.153
Insulin resistance: Insulin is a pluripotent hormone that elicits multiple biological
responses. Among its important biological actions insulin accelerates glucose transport in
muscle and adipose tissue, regulates the activities of intracellular enzymes, and regulates
the transcription of selected genes. Insulin resistance is a pathological condition in which
there is a shift in the dose-response curve such that the magnitude of the biological
response to insulin is decreased.154
The impaired response to insulin either over the entire
range of insulin concentration or only at low concentrations of the hormone. Two types of
evidence support the conclusion that patients with NIDDM are resistant to the biological
actions of insulin. First, patients with NIDDM have diminished response to exogenously
administered insulin. The second line of evidence is based on the observations that

patients with NIDDM are resistant to the action of endogenously secreted insulin.
Hyperinsulinemia in the fasting state is one of the laboratory abnormalities observed
relatively early in the natural history of NIDDM. This is a disordered state in which
insulin inadequately stimulates glucose transport in skeletal muscle and fat and
inadequately suppresses hepatic glucose production. Glucose tolerance and then diabetes
develop as the compensatory hypersecretion of the insulin by β-cells declines. Knowledge
of the molecular control of insulin secretion is therefore important for understanding the
β-cell dysfunction of T2DM. Zhang et. al. provided compeling evidence that a
mitochondrial anion carrier called uncoupling protein 2 is a critical modulator of insulin
secretion and that an increase in thos rotein may cause β-cell dysfunction.155
Insulin deficiency: Pancreatic insulin secretion is subject to regulation by multiple factors.
Although the concentration of glucose in the plasma is the most important regulators of
insult secretion, other regulatory influences are important as well (e.g., amino acids,
circulating hormones, neurotransmitters, paracrine factors). Insulin deficiency is defined
as a pathological condition in which there is an inappropriate decrease in the rate at which
the β-cell secretes insulin. Most commonly, normal ranges for the concentration of insulin
in plasma are defined as a function of the concentration of glucose in plasma.
Nevertheless, because insulin secretion is dynamic process, the levels of insulin in plasma
are not constant, but vary from minute to minute throughout the day. Thus, subtle defects
in β-cell function may possibly manifest as abnormalities in the rate at which insulin
concentrations change as a function of time.156,157
As discussed, most patients are hyperinsulinemic early in the natural history of
NIDDM.158-163
However, plasma insulin levels usually decline later in the course of the
disease, around the time when a patient develops overt NIDDM.
Unlike patients with type 1 diabetes, those with type 2 diabetes have detectable levels of
circulating insulin. On the basis of oral glucose tolerance testing (OGTT) the essential
elements of type 2 diabetes can be divided into 4 distinct groups; those with normal
glucose tolerance, chemical diabetes (called impaired glucose tolerance), diabetes with
minimal fasting hyperglycemia (fasting plasma glucose <140 mg/dL), and diabetes
mellitus in association with overt fasting hyperglycemia (fasting plasma glucose >140
mg/dL). In patients with the highest levels of plasma insulin (impaired glucose tolerance
group) there was also elevated plasma glucose. This indicates that these individuals are

resistant to the action of insulin. In the progression from impaired glucose tolerance to
diabetes mellitus the level of insulin declines indicating that patients with type 2 diabetes
have decreased insulin secretion.
Additional studies have subsequently demonstrated that both insulin resistance and
insulin deficiency is common in the average type 2 diabetic patient. Many experts
conclude that insulin resistance is the primary cause of type 2 diabetes, however, others
contend that insulin deficiency is the primary cause because a moderate degree of insulin
resistance is not sufficient to cause type 2 diabetes. As indicated above, most patients
with the common form of type 2 diabetes have both defects.
The major clinical complications of type 2 diabetes are the result of persistent
hyperglycemia which leads to numerous pathophysiological consequences. As the
glucose level rises in the blood the blood becomes more viscous which makes circulation
of the blood in the small capillaries difficult. The reduced circulation results in
progressive vascular complications leading to diabetic retinopathy (referred to as diabetic
blindness), peripheral neuropathy (resulting in numbness in the extremities and tingling in
fingers and toes), poor wound healing, and erectile dysfunction. In addition to these major
clinical complications, the body reacts by increasing the level of glucose excretion by the
kidneys leading to frequent urination which is called polyuria. As the glucose is excreted
there is a concomitant loss of water to maintain normal osmolarity of the urine. The water
loss leads to excessive thirst called polydypsia.
Measurement of HbA1c Levels
The development of hypoglycemia inducing drugs is the major pharmacological focus of
type 2 diabetes therapies. Assessment of therapeutic efficacy in the treatment of the
hyperglycemia in type 2 diabetes is accomplished by routine measurement of the
circulating levels of glycosylated hemoglobin, designated as the level of HbA1c, often
designated as just A1C. HbA1 is the major form of adult hemoglobin in the blood and the
"c" refers to the glycosylated form of the protein. Since hemoglobin is present in red
blood cells and these cells have a limited life span of 120 days in the circulation,
measurement of HbA1c levels is a relatively accurate measure of the amount of glucose in
the blood and the length of time the level has been elevated. Typical values for HbA1c
measurement (using the previous standard Diabetes Control and Complications Trial,
DCCT units of %) are shown in the Table below. Beginning in 2011 a new international

standard (International Federation of Clinical Chemistry, IFCC units) for the
measurement of HbA1c levels will be utilized. This new standard equates the mmole of
HbA1c per mole of total measured hemoglobin, Hb (mmol/mol). The method for
calculating the relationship between these two measurement values is to use the following
formula:
IFCC-HbA1c (mmol/mol) = [DCCT-HbA1c (%) - 2.15] × 10.929.
To calculate the estimated average glucose (eAG) level in the blood using the
DCCT (%) values one would use the following formula:
eAG(mg/dl) = 28.7 × A1C − 46.7 (for glucose level in mM use: eAG(mM) =
1.59 × A1C − 2.59
With new IFCC standard the target range of HbA1c for healthy levels is 48–
59mmol/mol.
2.1.4.3. Genetics of Type 2 Diabetes
Development of type 2 diabetes is the result of multifactorial influences that include
lifestyle, environment and genetics. The disease arises when insulin resistance-induced
compensatory insulin secretion is exhausted. A high-caloric diet coupled with a sedentary
lifestyle are the major contributing factors in the development of the insulin resistance
and pancreatic β-cell dysfunction. However, a predisposing genetic background has long
been suspected in playing a contributing role in the development of type 2 diabetes. By
using whole-genome linkage analysis the entire genome of affected family members can
be scanned and the family members monitored over several generations. In addition, large
numbers of affected sibling-pairs can also be studied. Using these genome-wide linkage
methods the first major susceptibility locus for type 2 diabetes was located on
chromosome 2 in 1996. This locus was designated NIDDM1. The first gene identified in
the NIDDM1 locus with polymorphisms correlated to type 2 diabetes susceptibility was
calpain 10 (CAPN10).
CAPN10 is a calcium-activated neutral protease that is a member of the calpain-like
cysteine protease family. The CAPN10 gene is located on chromosome 2q37.3 and spans
31 kb composed of 15 exons encoding a 672 amino acid protein. Variation in the non-
coding region of the CAPN10 gene is associated with a threefold increased risk of type 2
diabetes in Mexican Americans. However, in European populations polymorphisms in
CAPN10 are less contributory to type 2 diabetes than other recently discovered genes.
Genetic variants in CAPN10 may alter insulin secretion or insulin action as well as the

production of glucose by the liver. Recent studies indicate that CAPN10 may have a
critical role in the survival of pancreatic β-cells.150
Another early genetic marker for type 2 diabetes was hepatocyte nuclear factor 4-α
(HNF4A). Note that HNF4A is also known to be associated with the development of
MODY1 (see above). The hepatocyte nuclear factor family of proteins was first identified
as an abundant class of transcription factors in the liver. In addition to the liver, HNF4A
is expressed in pancreatic β-cells, kidneys and intestines. As indicated above, mutations
in HNF4A can cause MODY1 which is characterized by a normal response to insulin but
an impaired insulin secretory response in the presence of glucose. The HNF4A gene maps
to a region of chromosome 20 that has been linked to type 2 diabetes. Specifically the
HNF4A gene is located at 20q12–q13.1 and is encoded in 12 exons. Single nucleotide
polymorphisms (SNPs) in the HNF4A gene have an impact on pancreatic β-cell function
leading to altered insulin secretion and result in the development of MODY1. The SNPs
in the HNF4A gene that are related to development of type 2 diabetes lie in a promoter
element called P2. The P2 promoter is used primarily in pancreatic β-cells, whereas, both
the P1 and P2 promoters are used in liver cells. The P2 promoter is a binding site for the
transcription factors HNF-1α (HNF1A), HNF-1β (HNF1B), and insulin promoter factor-1
(IPF1). As described above, alteration in the function of each of these latter three
transcription factors is associated with various forms of MODY.
Strong evidence has demonstrated a role for a member of the nuclear hormone receptor
superfamily of proteins in the etiology of type 2 diabetes. The thiazolidinedione (TZD)
class of drugs, used to increase the sensitivity of the body to insulin (see below), bind to
and alter the function of the peroxisome proliferator-activated receptor-γ, PPARγ. PPARγ
is also a transcription factor and, when activated, binds to another transcription factor
known as the retinoid X receptor, RXR. When these two proteins interact they bind to
specific PPAR response elements (termed PPREs) in target genes thereby regulating their
expression. PPARγ is a key regulator of adipocyte differentiation; it can induce the
differentiation of fibroblasts or other undifferentiated cells into mature fat cells. PPARγ is
also involved in the synthesis of biologically active compounds from vascular endothelial
cells and immune cells. Mutations in the gene for PPARγ (gene symbol = PPARG) have
been correlated with insulin resistance.

More recent genome-wide screens for polymorphisms (in particular single nucleotide
polymorphisms, SNPs) in type 2 diabetes have identified several new candidate genes.
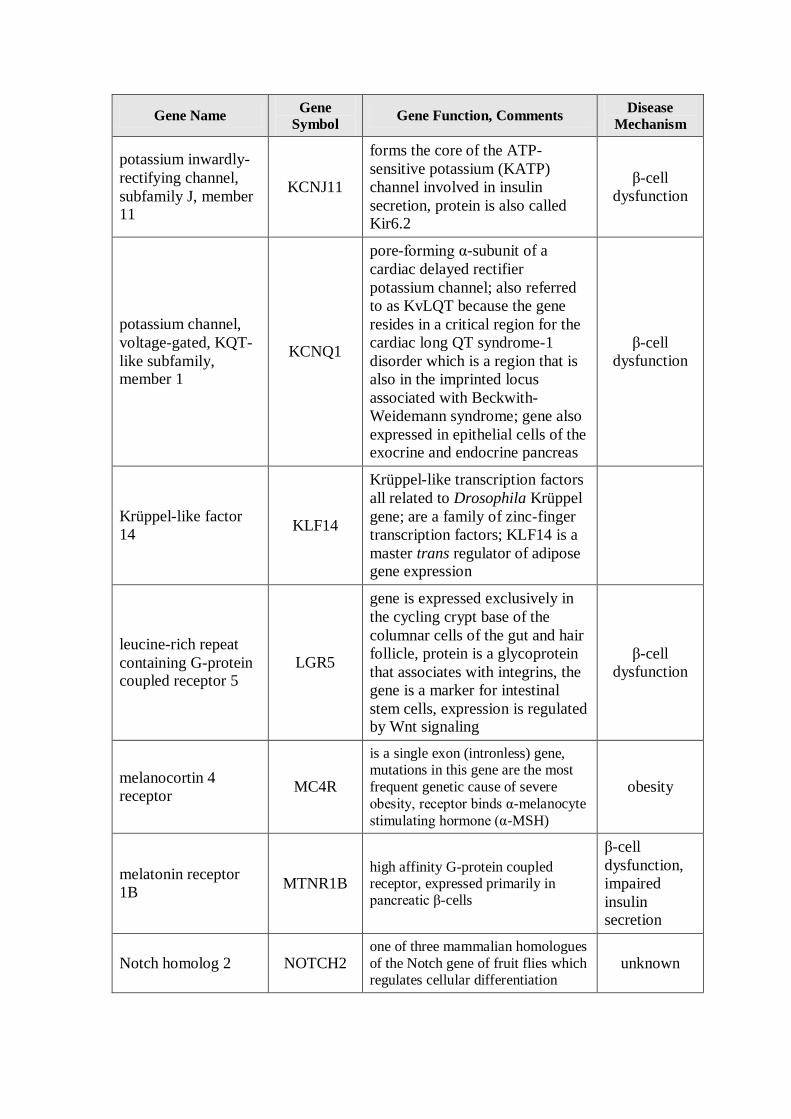
The Table below lists several genes that either, reside within chromosomal loci that are
highly correlated to the development of type 2 diabetes, or that have had polymorphisms
identified in the gene itself that correlate to development of type 2 diabetes. Included in
the Table are PPARG and CAPN10 described above as well as the gene potassium
inwardly-rectifying channel, subfamily J, member 11 (KCNJ11). The transcription factor
TCF7L2 (transcription factor 7-like 2, T-cell specific HMG-box) is one of four TCF
proteins involved in the signaling pathways initiated by the Wnt family of secreted
growth factors. Two SNPs identified in the TCF7L2 gene are the most highly correlated
polymorphisms with type 2 diabetes. Given that evidence is accumulating that Wnt and
insulin signaling pathways exhibit cross-talk at the level of both the gut and the pancreas,
it is likely that new targets in the treatment of type 2 diabetes will involve the
interrelationships between these two factors.
In addition to the genes described in the following table (Table RL1) and those described
for permanent neonatal diabetes mellitus (Table RL2); at least 25 additional genes have
been shown by genome wide association studies (GWAS) to be associated with type 2
diabetes and/or elevated fasting plasma glucose levels.150
Table RL1: Genes Associated with Type 2 Diabetes Susceptibility
Gene Name Gene
Symbol Gene Function, Comments
Disease
Mechanism
a disintegrin-like and
metalloproteinase
(ADAM) with
thrombospondin type
1 motif, 9
ADAMTS9
demonstrated to proteolytically
cleaved bovine versican (a large
extracellular matrix proteoglycan)
and aggrecan (large aggregated
proteoglycan)
unknown
Ca2+
/calmodulin-
dependent protein kinase 1-δ
CAMK1D
leads to activation of extracellular
signal-regulated protein kinase 1 (ERK1) activity
β-cell
dysfunction
calpain 10 CAPN10
calcium-activated neutral
protease, member of the calpain-like cysteine protease family
glucose
transport
cell division cycle
123 homolog CDC123
CDC123 is in the same
chromosomal region as the
CAMK1D gene
β-cell
dysfunction

Gene Name Gene
Symbol Gene Function, Comments
Disease
Mechanism
cyclin-dependent
kinase-5 regulatory
subunit associated protein 1-like 1
CDKAL1 inhibitor of cyclin-dependent
kinase 5 (CDK5)
β-cell
dysfunction,
impaired
insulin secretion
cyclin-dependent
kinase inhibitor 2A CDKN2A/B
the CDKN2A gene produces 2
major proteins: p16(INK4), which
is a cyclin-dependent kinase
inhibitor, and p14(ARF), which
binds the p53-stabilizing protein
MDM2, p14 is also called
CDKN2B
β-cell
dysfunction
fat mass- and obesity-
associated gene FTO
catalyzes the iron- and 2-
oxoglutarate-dependent
demethylation of 3-
methylthymine in single-stranded
DNA, with concomitant
production of succinate, formaldehyde, and CO2
obesity
hematopoietically
expressed homeobox HHEX
is a transcriptional repressor in
liver cells, may be involved in the
differentiation and/or
maintenance of the differentiated
state in hepatocytes, is a target of the Wnt ignalling pathway
β-cell
dysfunction,
impaired
insulin secretion
hepatocyte nuclear
factor-1β: hepatocyte
transcription factor-2
HNF1B
also called
TCF2
mutations in gene associated with
MODY5 unknown
insulin degrading
enzyme IDE
is an extracellular thiol
metalloprotease with preference
for insulin, also degrades
amyloid-β protein; the IDE gene
resides within the same
chromosomal locus as HHEX
β-cell
dysfunction
insulin-like growth
factor-2 mRNA binding protein 2
IGF2BP2 binds to the IGF2 mRNA β-cell
dysfunction
juxtaposed with
another zinc-finger
gene 1: TAK1(TGFβ-
activated kinase-1)-
interacting protein 27
JAZF1
also called TIP27
functions as a transcriptional
repressor, exhibits antiapoptotic activity
β-cell
dysfunction
Gene Name Gene
Symbol Gene Function, Comments
Disease
Mechanism
potassium inwardly-
rectifying channel,
subfamily J, member 11
KCNJ11
forms the core of the ATP-
sensitive potassium (KATP)
channel involved in insulin
secretion, protein is also called Kir6.2
β-cell
dysfunction
potassium channel,
voltage-gated, KQT-
like subfamily, member 1
KCNQ1
pore-forming α-subunit of a
cardiac delayed rectifier
potassium channel; also referred
to as KvLQT because the gene
resides in a critical region for the
cardiac long QT syndrome-1
disorder which is a region that is
also in the imprinted locus
associated with Beckwith-
Weidemann syndrome; gene also
expressed in epithelial cells of the exocrine and endocrine pancreas
β-cell
dysfunction
Krüppel-like factor
14 KLF14
Krüppel-like transcription factors
all related to Drosophila Krüppel
gene; are a family of zinc-finger
transcription factors; KLF14 is a
master trans regulator of adipose gene expression
leucine-rich repeat
containing G-protein coupled receptor 5
LGR5
gene is expressed exclusively in
the cycling crypt base of the
columnar cells of the gut and hair
follicle, protein is a glycoprotein
that associates with integrins, the
gene is a marker for intestinal
stem cells, expression is regulated by Wnt signaling
β-cell
dysfunction
melanocortin 4
receptor MC4R
is a single exon (intronless) gene, mutations in this gene are the most
frequent genetic cause of severe
obesity, receptor binds α-melanocyte
stimulating hormone (α-MSH)
obesity
melatonin receptor
1B MTNR1B
high affinity G-protein coupled receptor, expressed primarily in pancreatic β-cells
β-cell
dysfunction,
impaired
insulin secretion
Notch homolog 2 NOTCH2 one of three mammalian homologues
of the Notch gene of fruit flies which regulates cellular differentiation
unknown

Gene Name Gene
Symbol Gene Function, Comments
Disease
Mechanism
peroxisome
proliferator-activated
receptor-γ (PPARγ)
PPARG
transcriptional co-activator with retinoid X receptors (RXRs), master regulator of adipogenesis, activation
of adipocytes leads to increased fat
storage and secretion of insulin-
sensitizing adipocytokines such as adiponectin
insulin
sensitivity
solute carrier family
30 (zinc transporter), member 8
SCL30A8 permits cellular efflux of zinc β-cell
dysfunction
transcription factor 7-
like 2 (T-cell specific
HMG-box)
TCF7L2
one of four TCF transcription
factor proteins involved in the
ignalling pathways initiated by
the Wnt family of secreted growth
factors, polymorphisms in this
gene have the highest correlation
to type 2 diabetes
β-cell
dysfunction,
impaired
insulin secretion
thyroid adenoma-
associated gene THADA
protein contains an ARM repeat
(ARM = armadillo which is a fruit
fly gene involved in segment
polarity), the ARM repeat is
involved in protein-protein
interactions
unknown
tetraspanin 8 TSPAN8
tetraspanins are proteins that
contain 4 transmembrane
domains, this gene and LGR5 are
found in the same chromosomal region
β-cell
dysfunction
Wolfram syndrome
gene; also called
diabetes insipidus,
diabetes mellitus,
optic atrophy, and
deafness
(DIDMOAD)
WFS1
is an integral ER membrane
glycoprotein, associates with the
C-terminal domain of the ER-
localized Na+/K
+ATPase β-1
subunit (ATP1B1)
β-cell
dysfunction
2.1.5. Neonatal Diabetes
Neonatal diabetes refers to a circumstance in which hyperglycemia results from
dysfunction in insulin action within the first 6 months of life. This form of diabetes is not
typical type 1 diabetes (T1D, or juvenile onset diabetes) since T1D involves immune
destruction of the pancreatic β-cells and thus, requires several years to fully develop.

Neonatal diabetes can be transient or permanent. If an infant suffers from the transient
form they are at increased risk for developing full-blown later in life.
The advent of genetic studies to identify HLA haplotypes associated with the risk of
development of T1D as well as the description of several T1D-associated autoantibodies
provided the foundation for characterization of the clinical features of the disease in
newborns. Evidence is clear that the etiology of diabetes in the first year of life is
different from that of the autoimmune forms of T1D more classically diagnosed when
children are older. As indicated, the presentation of diabetes in infants prior to 6-months
of age can be transient or permanent. The permanent form of the disease is termed
Permanent Neonatal Diabetes Mellitus (PNDM). PNDM is a rare event occurring with a
frequency of approximately 2 cases per 100,000 births.
Definitive determination of PNDM requires early gene screening as soon as symptoms
manifest. This allows for a differential diagnosis to be made as to whether or not the
symptoms can be expected to be transient or permanent. Very low birth weight is highly
correlated to PNDM and is associated with fetal lack of insulin. The most prominent of
symptoms is the onset of hyperglycemia within the first 6 months after birth. Affected
infants do not secrete insulin in response to glucose or glucagon but will secrete insulin in
response to tolbutamide administration. Tolbutamide is a drug of the sulfonylurea class
used to treat type 2 diabetes. Many infants will exhibit similar neurologic abnormalities,
including developmental delay, muscle weakness, and epilepsy. In patients manifesting
with neurologic abnormalities there are often associated dysmorphic features, including
prominent metopic suture (persistence of the space between the frontal bones of the
skull), a downturned mouth, bilateral ptosis (drooping eyelid), and limb contractures.
Early on it was thought that the underlying defect resulting in neonatal diabetes was
pancreatic β-cell dysfunction or a defect in β-cell maturation. However, genetic evidence
now indicates that neonatal diabetes, in particular PNDM, is the result of single-gene
defects. This makes PNDM a monogenic disorder. The disorder can be inherited although
it is most often the result of a sporadic mutation in one of the parental gametes. Over the
past decade at least 12 genes have been identified as being associated with the
development of PNDM. The most commonly mutated genes are the potassium inwardly-
rectifying channel, subfamily J, member 11 (KCNJ11), ATP-binding cassette transporter,

subfamily C, member 8 (ABCC8), and insulin (INS) genes. The proteins of the KCNJ11
and ABCC8 genes form the ATP-sensitive potassium channel (KATP channel) that is
involved in insulin secretion. Mutations in the KCNJ11 gene are also associated with an
increased risk for the development of T2D as described in the Genetics of Type 2
Diabetes section above. The insulin gene is one of the non-HLA genes that are mutated in
T1D as indicated above in the Genetics of Type 1 Diabetes section.
Table RL2: Genes Associated with Permanent Neonatal Diabetes Mellitus
Gene Name Gene
Symbol Comments
ATP-binding cassette
transporter, subfamily
C, member 8
ABCC8
along with KCNJ11 encoded proteins ABCC8
forms the ATP-sensitive potassium (KATP)
channel involved in insulin secretion; gene is
also known as the sulfonylurea receptor: SUR;
mutations in the ABCC8 gene found in 13% of
PNDM cases
eukaryotic translation
initiation factor 2-α
kinase 3
EIF2AK3
also associated with skeletal dysplasia, mental
retardation, and hepatic failure; gene also known
as RNA-dependent protein kinase-like
endoplasmic reticulum kinase, PERK; this
particular form of PNDM is also known as
Wolcott-Rallinson syndrome (WRS)
forkhead box family
member P3 FOXP3
is a member of the fork-winged helix family of
transcription factors,; plays an important role in
development and function of CD4-
positive/CD25-positive regulatory T cells
(Tregs); Tregs are involved in active suppression
of inappropriate immune responses
pancreatic
glucokinase GCK same gene found associated with MODY2
Gli similar (GLIS
family) Krüppel-like
zinc finger
transcription 3
GLIS3
also associated with severe congenital
hypothyroidism, cholestasis, congenital
glaucoma, and polycystic kidneys
insulin INS mutations in the INS gene represent 16% of
PNDM cases

Gene Name Gene
Symbol Comments
potassium inwardly-
rectifying channel,
subfamily J, member
11
KCNJ11
forms the core of the ATP-sensitive potassium
(KATP) channel involved in insulin secretion,
protein is also called Kir6.2; mutations in this
gene found in 30%–50% of PNDM cases
pancreatic and
duodenal homeobox 1 PDX1
regulates transcription of the insulin gene; also is
a key regulator of the development of the
pancreas, most probably by determining
maturation and differentiation of common
pancreatic precursor cells in the developing gut
pancreas transcription
factor 1A PTF1A
gene is essential to normal pancreas formation;
mutations in gene also associated with cerebellar
hypoplasia/agenesis, and dysmorphism; similar
phenotypes to those resulting from PDX1
mutations
regulatory factor x-
box binding family
transcription factor
member 6
RFX6
involved in pancreatic islet cell differentiation;
also associated with intestinal atresia and gall
bladder hyoplasia
solute carrier family,
facilitated glucose
(GLUT) transporter
subfamily, member 2
SLC2A2 also associated with Fanconi-Bickel syndrome
(glycogen storage disease XI, GSD11)
solute carrier family,
folate/thiamine
transporters
subfamily, member 2
SLC19A2
mutations in gene result in thiamine-responsive
megaloblastic anemia syndrome (also known as
Rogers syndrome), defined by the occurrence of
megaloblastic anemia, diabetes mellitus, and
sensorineural deafness; thiamine treatment
results in varying degrees of positive response
2.1.6. Diabetes and the Metabolic Syndrome: MetS
Although the metabolic syndrome (also called syndrome X) is not exclusively associated
with type 2 diabetes and the associated insulin resistance, the increasing prevalence of
obesity and associated development of type 2 diabetes places insulin resistance as a major
contributor to the syndrome. The metabolic syndrome is defined as a clustering of
atherosclerotic cardiovascular disease risk factors that include visceral adiposity (obesity),
insulin resistance, low levels of HDLs and a systemic proinflammatory state. There are

key components to the metabolic syndrome which include in addition to insulin resistance
(the hallmark feature of the syndrome), hypertension, dyslipidemia, chronic
inflammation, impaired fibrinolysis, procoagulation and most telling central obesity.
2.1.7. Mitochondrial Dysfunction in Type 2 Diabetes and Obesity
Well established data demonstrate that mitochondrial dysfunction, particularly as it
relates to the processes of oxidative phosphorylation (oxphos), is contributory to the
development of encephalomyopathy, mitochondrial myopathy, and several age-related
disorders that include neurodegenerative diseases, the metabolic syndrome, and diabetes.
Indeed, with respect to diabetes, several mitochondrial diseases manifest with diabetic
complications such as mitochondrial myopathy, encephalopathy, lactic acidosis, and
stroke-like episodes (MELAS) and maternally inherited diabetes and deafness (MIDD).
Normal biogenesis of mitochondria is triggered in response to changes in the ATP/ADP
ratio and to activation of AMPK which in turn results in increased expression of PPARγ
co-activator 1α (PGC-1α) and nuclear respiratory factor-1 (NRF1). PGC-1α is a master
transcriptional co-activator of numerous genes involved in mitochondrial biogenesis.
NRF1 is a transcription factor that regulates the expression of mitochondrial transcription
factor A (TFAM, for transcription factor A, mitochondrial; also designated mtTFA)
which is a nuclear transcription factor essential for replication, maintenance, and
transcription of mitochondrial DNA. NRF1 also controls the expression of nuclear genes
required for mitochondrial respiration and heme biosynthesis. Evidence has shown that
both PGC-1α and NRF1 expression levels are lower in diabetic patients as well as in non-
diabetic subjects from families with type 2 diabetes. The expression of NRF1 is highest in
skeletal muscle which is also the tissue that accounts for the largest percentage of glucose
disposal in the body and, therefore, is the tissue that is most responsible for the
hyperglycemia resulting from impaired insulin signaling.
Mitochondrial dysfunction results in increased production of ROS which activates stress
responses leading to increased activity of MAPK and JNK. Both of these serine/threonine
kinases phosphorylate IRS1 and IRS2 resulting in decreased signaling downstream of the
insulin receptor. Inhibited IRS1 and IRS2 activity results in decreased activation of PI3K.
PI3K activation is involved in the translocation of GLUT4 to the plasma membrane

resulting in increased glucose uptake. Therefore, inhibition of PI3K results in reduced
glucose uptake in skeletal muscle and adipose tissue. Mitochondrial dysfunction results in
a reduction in the level of enzymes involved in β-oxidation leading to increases in
intramyocellular lipid content. Indeed, skeletal muscle metabolism of lipids has been
shown to be impaired in type 2 diabetics. An increased delivery of fatty acids to skeletal
muscle, as well as diminished mitochondrial oxidation, results in increased intracellular
content of fatty acid metabolites such as diacylglycerol (DAG), fatty acyl-CoAs, and
ceramides. These metabolites of fatty acids are all known to induce the activity of protein
kinase C isoforms (PKCβ and PKCδ) that phosphorylate IRS1 and IRS2 on serine
residues resulting in impaired insulin signaling downstream of the insulin receptor.
Because skeletal muscle consumes the largest amount of serum glucose, mitochondrial
dysfunction in this tissue will have the greatest impact on glucose disposal. However,
adipose tissue also plays an important role in glucose homeostasis and mitochondrial
dysfunction in this tissue has been shown to result in impaired glucose homeostasis
resulting in diabetes. For example, when animals are treated with inhibitors of
mitochondrial oxidation insulin-stimulated glucose uptake in adipose tissue is
significantly impaired. Adipose tissue secretes a number of proteins classified as
adipokines. Adiponectin is an adipokine that promotes insulin-sensitivity in insulin-
responsive tissues, such as skeletal muscle. When plasma levels of adiponectin are
measured in obese or type 2 diabetic subjects it is found to be significantly lower than in
age and sex matched control subjects that are of normal weight or that do not have
diabetes. In animal studies, the enhancement of adipocyte mitochondrial biogenesis
results in increased adiponectin release from adipose tissue. Conversely, expression of
adiponectin expression is decreased in adipocytes with mitochondrial dysfunction.
Given that impaired mitochondrial function is clearly associated with obesity and type 2
diabetes, it is not surprising that there is great interest in the use of pharmacology to
augment mitochondrial function in the treatment of these disorders. Of significance is the
fact that the thiazolidinedione (TZD) class of drugs used to treat the hyperglycemia of
type 2 diabetes (see the next section) activate PPARγ which in turn increases the level of
activity of PGC-1α. Although the TZDs were first marketed due to their ability to
improve insulin sensitivity, they have since been shown to increase mitochondrial
functions both in vitro and in vivo. Antioxidants have also been shown to enhance
mitochondrial function by reducing the production of ROS. Resveratrol (found in grape
skins and red wine) is a potent antioxidant whose activity is, in part, due to its ability to
activate the deacetylase SIRT1 (see below). Activated SIRT1 deacetylates PGC-1α
resulting in increased transcriptional activity and thus, enhanced mitochondrial
biogenesis.
2.1.8. Insulin and Diabetes Mellitus
Diabetes was known as early as the 1st century, A.D. as a disease characterized by
Arataeus as "a melting down of the flesh and limbs into urine", although the name
diabetes was not yet formally attached to this disease. More understanding of how this
disease functioned did not occur until the 19th century when it was found from autopsies
that diabetes is accompanied by damage to the pancreas. There was much debate about
the specific relationship between the pancreas and diabetes, especially between two
scientists from the University of Strasbourg, Oskar Minkowski and Joseph von Mering.
They disagreed about the function of pancreatic enzymes in the body, and to solve their
argument, they removed the pancreas from a dog and recorded their observations. They
found this dog to urinate incessantly, even when taken outside numerous times
throughout the day. After testing the sugar concentration in the animal's urine, they
concluded that he had become diabetic. (Research of this sort involving pancreas removal
was also conducted on cats, guinea-pigs, rabbits, and rats by a variety of researchers.)
Diabetic research continued into the early 1900's and at the turn of the century Eugene
Opie from Johns Hopkins University discoverd that diabetes is caused by something
contained within cells discovered by Hans Langerhans in 1869, now referred to as islets
of Langerhans. Frederick Banting, a graduate of the University of Toronto Medical
School, became interested in pancreas and diabetes research in 1920 and approached
Professor John Macleod, a well-known researcher in the field of carbohydrate
metabolism. Along with Charles Best, a fourth-year medical student at the time, and J.P.
Collip, a well-known biochemist, these four scientists discovered a substance that when
injected into a diabetic dog, abated the symptoms of diabetes. This discovery was
presented in 1922 in a paper that called this substance insulin. In 1923, Banting and
Macleod were awarded the Nobel Prize for their discovery of insulin. Banting shared his
award with Best, and Macleod shared his award with Collip to acknowledge the
invaluable contributions of these men (Bliss, 1982).164
The primary structure of insulin
was determined in 1953 by Frederick Sanger, and despite this being an accomplishment

in itself, this was also the first time that the complete amino acid sequence of a protein
was determined and proved that proteins have unique covalent structures.165
The primary
amino acid sequence of insulin is shown in figure RL3.166
The human insulin protein
consists of two chains, A and B, which are connected via disulfide bridges.
Figure RL3: The primary amino acid structure of human insulin. As is shown, insulin
consists of two peptide chains which are connected by disulfide bonds.
2.1.8.1. Insulin Secretion
The major function of insulin is to counter the concerted action of a number of
hyperglycemia-generating hormones and to maintain low blood glucose levels. Because
there are numerous hyperglycemic hormones, untreated disorders associated with insulin
generally lead to severe hyperglycemia and shortened life span.
In addition to its role in regulating glucose metabolism, insulin stimulates lipogenesis,
diminishes lipolysis, and increases amino acid transport into cells. Insulin also modulates
transcription, altering the cell content of numerous mRNAs. It stimulates growth, DNA
synthesis, and cell replication, effects that it holds in common with the insulin-like
growth factors (IGFs) and relaxin.
Insulin is synthesized as a preprohormone in the β-cells of the islets of Langerhans. Its
signal peptide is removed in the cisternae of the endoplasmic reticulum and it is packaged
into secretory vesicles in the Golgi, folded to its native structure, and locked in this
conformation by the formation of 2 disulfide bonds. Specific protease activity cleaves the

center third of the molecule, which dissociates as C peptide, leaving the amino terminal B
peptide disulfide bonded to the carboxy terminal A peptide.
Insulin secretion from β-cells is principally regulated by plasma glucose levels. Increased
uptake of glucose by pancreatic β-cells leads to a concomitant increase in metabolism.
The increase in metabolism leads to an elevation in the ATP/ADP ratio. This in turn leads
to the inhibition of an ATP-sensitive potassium channel (KATP channel). The net result is
a depolarization of the cell leading to Ca2+
influx and insulin secretion.
The KATP channel is a complex of 8 polypeptides comprising four copies of the protein
encoded by the ABCC8 (ATP-binding cassette, sub-family C, member 8) gene and four
copies of the protein encoded by the KCNJ11 (potassium inwardly-rectifying channel,
subfamily J, member 11) gene. The ABCC8 encoded protein is also known as the
sulfonylurea receptor (SUR). The KCNJ11 encoded protein forms the core of the KATP
channel and is called Kir6.2. As might be expected, the role of KATP channels in insulin
secretion presents a viable therapeutic target for treating hyperglycemia due to insulin
insufficiency as is typical in type 2 diabetes.
Chronic increases in numerous other hormones, such as growth hormone, placental
lactogen, estrogens, and progestins, up-regulate insulin secretion, probably by increasing
the preproinsulin mRNA and enzymes involved in processing the increased
preprohormone.
2.1.8.2. Insulin; Role in Regulation of Metabolism
Insulin, secreted by the β-cells of the pancreas, is directly infused via the portal vein to
the liver, where it exerts profound metabolic effects. These effects are the response of the
activation of the insulin receptor which belongs to the class of cell surface receptors that
exhibit intrinsic tyrosine kinase activity. The insulin receptor is a heterotetramer of 2
extracellular α-subunits disulfide bonded to 2 transmembrane β-subunits. With respect to
hepatic glucose homeostasis, the effects of insulin receptor activation are specific
phosphorylation events that lead to an increase in the storage of glucose with a
concomitant decrease in hepatic glucose release to the circulation (Figure RL4; only those
responses at the level of glycogen synthase and glycogen phosphorylase are
represented).150

Figure RL4: Actions of insulin-insulin receptor interactions at the level of insulin
receptor substrate-1 (IRS1) and activation of the kinase cascade leading to altered
activities of glycogen phosphorylase and glycogen synthase. PI3K =
phosphatidylinositol-3-kinase; PIP2 = phosphatidylinositol-4,5-bisphosphate; PIP3 =
phosphatidylinositol-3,4,5-bisphosphate; PDK1 = PIP3-dependent protein kinase; Tsc1
and Tsc2 = Tuberous sclerosis tumor suppressors 1 (hamartin) and 2 (tuberin); Rheb =
Ras homolog enriched in brain; mTOR = mammalian target of rapamycin. PKB/Akt =
protein kinase B/Akt2; GSK3 = glycogen synthase kinase-3; S6K = 70kDa ribosomal
protein S6 kinase, also called p70S6K. The insulin-mediated activation of mTOR also
leads to changes in protein synthesis (Figure RL6).
In most nonhepatic tissues, insulin increases glucose uptake by increasing the number of
plasma membrane glucose transporters: GLUTs. Glucose transporters are in a continuous
state of turnover. Increases in the plasma membrane content of GLUTs stem from an
increase in the rate of recruitment of the transporters into the plasma membrane, deriving
from a special pool of preformed transporters localized in the cytoplasm. GLUT1 is
present in most tissues, GLUT2 is found primarily in intestine, pancreatic β-cells, kidney
and liver, GLUT3 is found primarily in neurons but also found in the intestine, GLUT4 is
found in insulin-responsive tissues such as heart, adipose tissue and skeletal muscle and
GLUT5 is expressed in intestine, kidney, testes, skeletal muscle, adipose tissue and brain.

Figure RL5: Insulin-insulin receptor actions on glycogen homeostasis showing the role of protein targeting glycogen (PTG) in complexing many of the enzymes and substrates together.
PTG is a subunit of PP1. Also diagrammed is the response to insulin at the level of glucose
transport into cells via GLUT4 translocation to the plasma membrane. GS/GP kinase = glycogen synthase: gycogen phosphorylase kinase. PP1 = protein phosphatase-1 (Arrows
denote either direction of flow or positive effects, T lines represent inhibitory effects).
In liver glucose uptake is dramatically increased because of increased activity of the
enzymes glucokinase, phosphofructokinase-1 (PFK-1), and pyruvate kinase (PK), the key
regulatory enzymes of glycolysis. The latter effects are induced by insulin-dependent
activation of phosphodiesterase, with decreased PKA activity and diminished
phosphorylation of pyruvate kinase and phosphofructokinase-2, PFK-2.
Dephosphorylation of pyruvate kinase increases its' activity while dephosphorylation of
PFK-2 renders it active as a kinase. The kinase activity of PFK-2 converts fructose-6-
phosphate into fructose-2,6-bisphosphate (F2,6BP). F2,6BP is a potent allosteric activator
of the rate limiting enzyme of glycolysis, PFK-1, and an inhibitor of the gluconeogenic
enzyme, fructose-1,6-bisphosphatase. In addition, phosphatases specific for the
phosphorylated forms of the glycolytic enzymes increase in activity under the influence
of insulin. All these events lead to conversion of the glycolytic enzymes to their active

forms and consequently a significant increase in glycolysis. In addition, glucose-6-
phosphatase activity is down-regulated. The net effect is an increase in the content of
hepatocyte glucose and its phosphorylated derivatives, with diminished blood glucose
(Figure RL5).
In addition to the above described events, diminished cAMP and elevated protein
phosphatase activity combine to convert glycogen phosphorylase to its inactive form and
glycogen synthase to its active form, with the result that not only is glucose funneled to
glycolytic products, but glycogen content is increased as well.
All of the post-receptor responses initiated by insulin binding to its receptor are mediated
as a consequence of the activation of several signal transduction pathways. These include
receptor activation of phosphatidylinositol-3-kinase, PI3K. Activation of PI3K involves a
linkage to receptor activation of insulin receptor substrates (of which there are four: IRS1,
IRS2, IRS3 and IRS4). Activated PI3K phosphorylates membrane phospholipids, the
major product being phosphatidylinositol-3,4,5-trisphosphate, (PIP3). PIP3 in turn
activates the enzyme protein kinase B, PKB (also called Akt). There are three members of
the PKB/Akt family of serine/threonine kinases identified as Akt1, Akt2, and Akt3. It is
Akt2 that is important in insulin-mediated glucose homeostasis. Insulin-mediated
activation of AKt also results in inhibition of lipolysis and gluconeogenesis and activation
of protein synthesis and glycogen synthesis.
Additional enzymes activated by insulin receptor signaling are PIP3-dependent kinase,
(PDK), some isoforms of protein kinase C, PKC (principally PKC-λ) and small ribosomal
subunit protein 6 (p70) kinase, (p70S6K). The MAP kinase (MAPK) pathway is also
activated either through insulin receptor phosphorylation of SRC homology 2 containing
protein (Shc) which then interacts with growth factor receptor binding protein-2 (GRB2)
or via IRS1 activation (Figure RL6).
With respect to insulin responses, activation of PKB and PKC-λ lead to translocation of
GLUT4 molecules to the cell surface resulting in increased glucose uptake which is
significant in skeletal muscle. Activation of PKB also leads to the phosphorylation and
inhibition of glycogen synthase kinase-3 (GSK3), which is a major regulatory kinase of
glycogen homeostasis. In addition, PKB phosphorylates and inhibits the activity of a
transcription factor (FKHRL1), now called FoxO3a) that has pro-apoptotic activity. This
results in reduced apoptosis in response to insulin action.
The role of insulin in the stimulation of protein synthesis occurs at the level of
translational initiation and elongation and is exerted primarily via a cascade leading to the

activation of mammalian target of rapamycin, mTOR, a protein with homology to a
family of proteins first identified in yeast that bind to the immunosuppressant drug,
rapamycin. mTOR is a kinase whose catalytic domain shares significant homology with
lipid kinases of the PI3K family.
Figre RL6: Insulin-mediated cascade leading to enhanced translation (not intended to
be a complete description of all of the targets of insulin action that affect translation
rates). Also shown is the effect of an increase in the AMP to ATP ratio which activates
AMP-activated kinase (AMPK). STK11-LKB1-PJS = serine-threonine kinase 11,
Peutz-Jeghers syndrome gene. IRS1 = insulin receptor substrate-1; PI3K =
phosphatidylinositol-3-kinase; PIP2 = phosphatidylinositol-4,5-bisphosphate; PTEN =
phosphatase and tensin homolog deleted on chromosome 10; PDK1 = PIP3-dependent
protein kinase; Tsc1 and Tsc2 = Tuberous sclerosis tumor suppressors 1 (hamartin) and
2 (tuberin); Rheb = Ras homolog enriched in brain; mTOR = mammalian target of
rapamycin. PKB/Akt = protein kinase B; GSK3 = glycogen synthase kinase-3; 4EBP1
= eIF-4E binding protein; p70S6K = 70kDa ribosomal protein S6 kinase, also called
S6K.

Insulin action leads to an increase in the activity of PI3K which in turn phosphorylates
membrane phospholipids generating phosphatidylinositol-3,4,5-trisphophate (PIP3) from
phosphatidylinositol-4,5-bisphosphate (PIP2). PIP3 then activates the kinase PDK1 which
in turn phosphorylates and activates PKB/Akt. Activated PKB/Akt will phosphorylate
TSC2 (tuberin) of the TSC1/TSC2 complex on two residues (S939 and T1462) resulting
in altered activity of the complex. The TSC1/TSC2 complex functions as a GTPase-
activating protein (GAP) which increases GTP hydrolyzing activity of Rheb. The GAP
activity resides in the C-terminal portion of tuberin. The faster the GTPase action of Rheb
the faster will be the reduction in Rheb activation of mTOR. When TSC1/TSC2 is
phosphorylated by PKB it is less effective at stimulating the GTPase activity of Rheb and
therefore Rheb activation of mTOR will remain high as is the case in response to insulin
action. AMPK phosphorylates TSC2 at two sites (T1271 and S1387) that are distinct from
the sites that are the PKB/Akt targets for phosphorylation. Evidence indicates that the
AMPK-mediated phosphorylation of TSC2 promotes the GTPase activity of Rheb
resulting in inhibition of mTOR and thus a decrease in protein synthesis. Recent evidence
has shown that PKB/Akt actually phosphorylates tuberin at 4 sites (S939, S1130, S1132,
T1462) all of which result in inhibition of the Rheb-GAP activity of the TSC1/TSC2
complex (Figure RL6).
The ultimate activation of mTOR leads to phosphorylation and activation of p70S6K
which in turn leads to increased phosphorylation of eEF2 kinase. eEF2 kinase normally
phosphorylates eEF2 leading to a decrease in its’ role in translation elongation. When
phosphorylated by p70S6K, eEF2 kinase is less active at phosphorylating eEF2, thus
eEF2 is much more active in response to insulin action. In addition, insulin action leads to
a rapid dephosphorylation of eEF-2 via activation of protein phosphatase 2A (PP2A).
Taken together, reduced eEF2K-mediated phosphorylation and increased eEF-2
dephosphorylation lead to increased protein synthesis.
Both mTOR and p70S6K have been shown to phosphorylate the regulator of translation
initiation, eIF-4E binding protein, 4EBP1. Phosphorylation of 4EBP1 prevents it from
binding to eIF-4E. Binding of 4EBP1 to eIF-4E prevents eIF-4E from interaction with the
cap structure of mRNAs which is necessary for translational initiation. Thus, the
consequences of 4EBP1:eIF-4E interaction is a reduction in translation initiation. As a
consequence of the concerted actions of mTOR and p70S6K, insulin results in increased
protein synthesis.
PKB activation will also lead to phosphorylation and inhibition of glycogen synthase
kinase-3 (GSK3). One of the targets of GSK3, relative to translation, is eIF2B.
Phosphorylation of eIF2B prevents it from performing its GTPase activating (GAP)
function in association with eIF2 (see the Protein Synthesis page for more details) and as
a consequence results in reduced translational initiation. However, when GSK3 is
inhibited by PKB phosphorylation the GAP activity of eIF2B remains high and
consequently the rate of translational initiation by eIF2 remains high so protein synthesis
is favored.
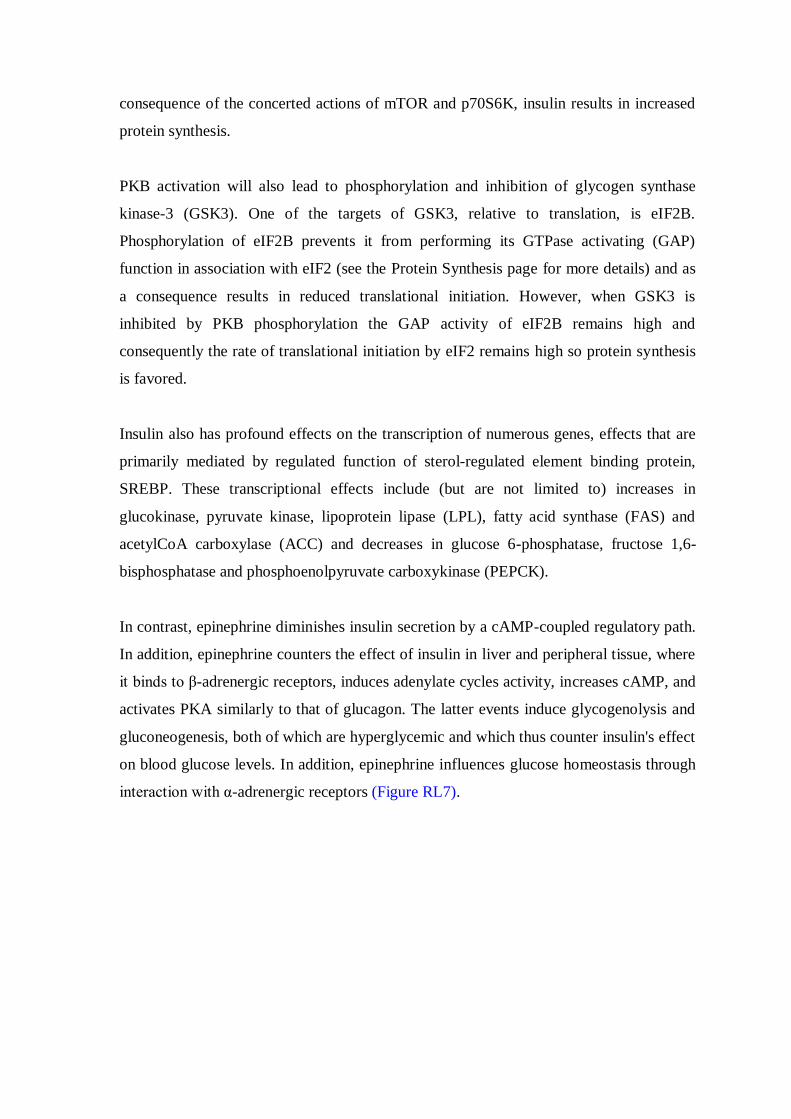
Insulin also has profound effects on the transcription of numerous genes, effects that are
primarily mediated by regulated function of sterol-regulated element binding protein,
SREBP. These transcriptional effects include (but are not limited to) increases in
glucokinase, pyruvate kinase, lipoprotein lipase (LPL), fatty acid synthase (FAS) and
acetylCoA carboxylase (ACC) and decreases in glucose 6-phosphatase, fructose 1,6-
bisphosphatase and phosphoenolpyruvate carboxykinase (PEPCK).
In contrast, epinephrine diminishes insulin secretion by a cAMP-coupled regulatory path.
In addition, epinephrine counters the effect of insulin in liver and peripheral tissue, where
it binds to β-adrenergic receptors, induces adenylate cycles activity, increases cAMP, and
activates PKA similarly to that of glucagon. The latter events induce glycogenolysis and
gluconeogenesis, both of which are hyperglycemic and which thus counter insulin's effect
on blood glucose levels. In addition, epinephrine influences glucose homeostasis through
interaction with α-adrenergic receptors (Figure RL7).
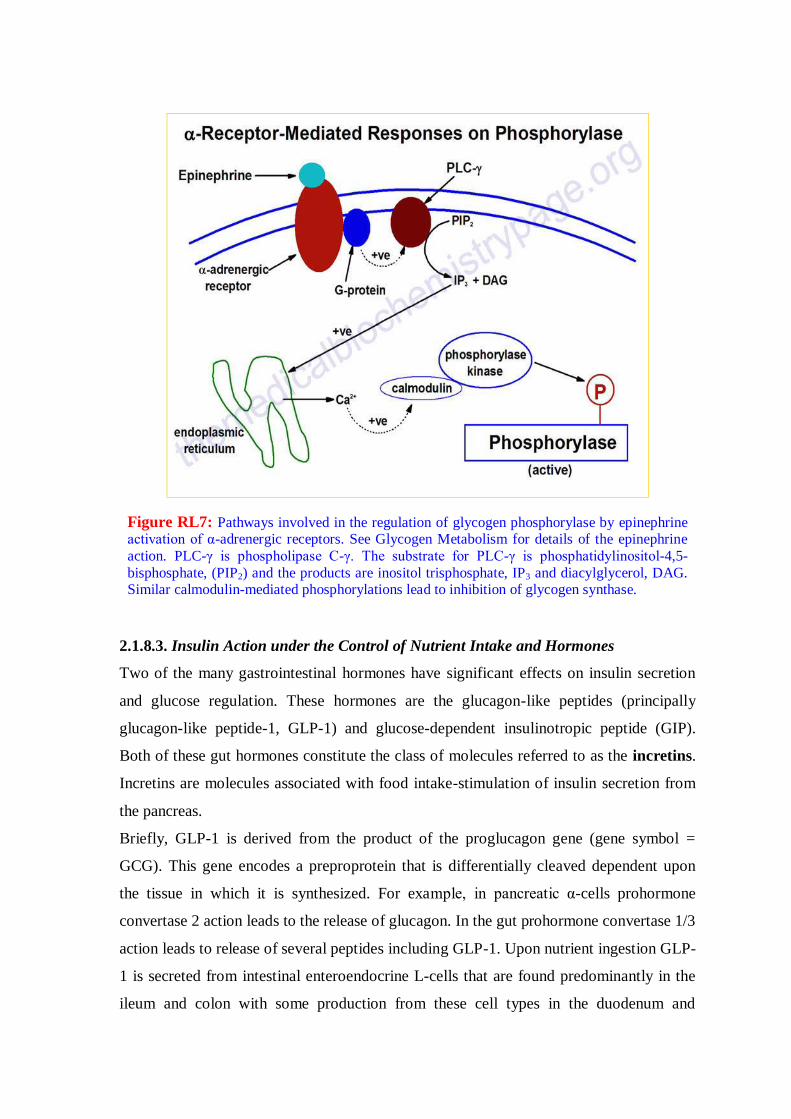
Figure RL7: Pathways involved in the regulation of glycogen phosphorylase by epinephrine activation of α-adrenergic receptors. See Glycogen Metabolism for details of the epinephrine
action. PLC-γ is phospholipase C-γ. The substrate for PLC-γ is phosphatidylinositol-4,5-
bisphosphate, (PIP2) and the products are inositol trisphosphate, IP3 and diacylglycerol, DAG. Similar calmodulin-mediated phosphorylations lead to inhibition of glycogen synthase.
2.1.8.3. Insulin Action under the Control of Nutrient Intake and Hormones
Two of the many gastrointestinal hormones have significant effects on insulin secretion
and glucose regulation. These hormones are the glucagon-like peptides (principally
glucagon-like peptide-1, GLP-1) and glucose-dependent insulinotropic peptide (GIP).
Both of these gut hormones constitute the class of molecules referred to as the incretins.
Incretins are molecules associated with food intake-stimulation of insulin secretion from
the pancreas.
Briefly, GLP-1 is derived from the product of the proglucagon gene (gene symbol =
GCG). This gene encodes a preproprotein that is differentially cleaved dependent upon
the tissue in which it is synthesized. For example, in pancreatic α-cells prohormone
convertase 2 action leads to the release of glucagon. In the gut prohormone convertase 1/3
action leads to release of several peptides including GLP-1. Upon nutrient ingestion GLP-
1 is secreted from intestinal enteroendocrine L-cells that are found predominantly in the
ileum and colon with some production from these cell types in the duodenum and

jejunum. Bioactive GLP-1 consists of 2 forms; GLP-1(7-37) and GLP-1(7-36)amide,
where the latter form constitutes the majority (80%) of the circulating hormone.
The primary physiological responses to GLP-1 are glucose-dependent insulin secretion,
inhibition of glucagon secretion and inhibition of gastric acid secretion and gastric
emptying. The latter effect will lead to increased satiety with reduced food intake along
with a reduced desire to ingest food. The action of GLP-1 at the level of insulin and
glucagon secretion results in significant reduction in circulating levels of glucose
following nutrient intake. This activity has obvious significance in the context of diabetes,
in particular the hyperglycemia associated with poorly controlled type 2 diabetes. The
glucose lowering activity of GLP-1 is highly transient as the half-life of this hormone in
the circulation is less than 2 minutes. Removal of bioactive GLP-1 is a consequence of N-
terminal proteolysis catalyzed by dipeptidylpeptidase IV (DPP IV or DPP4).
2.1.8.4. Wnt Signaling, GLP-1, and Insulin Secretion
Although much of the research that has led to a detailed understanding of the signal
transduction pathways initiated by Wnts was carried out in models of early development,
evidence has been accumulating demonstrating a significant role for the Wnts in the
control of metabolism. In particular Wnt action has been shown to be involved in
metabolic control via its actions in both the gut and pancreas. In addition, Wnt signaling
has been shown to interact with signaling pathways induced by insulin.
In the gut Wnt has been shown to be involved in regulated expression of the GCG gene.
In intestinal enteroendocrine L cells the expression of the GCG gene results in the
production of GLP-1. As indicated above, GLP-1 exerts its effects on the gut, the
pancreas and in the brain. In the gut its effects lead to a reduced rate of gastric acid
secretion and reduced gastric emptying. In the pancreas GLP-1 induced β-cell
proliferation and inhibition of β-cell apoptosis. In the brain GLP-1 actins result in
increased satiety leading to reduced desire for food intake.
The GCG gene promoter region contains an enhancer that harbors a canonical Wnt
response element that binds TCF factors, in particular the TCF7L2 protein. Genome wide
screens for polymorphisms associated with type 2 diabetes demonstrated that two single
nucleotide polymorphisms (SNPs) in the TCF7L2 gene were the most frequently
occurring SNPs associated with this disease. The significance of Wnt in the control of
GLP-1 production was demonstrated by the fact that reduction/loss of either β-catenin or

TCF7L2 function completely blocks insulin-stimulated expression of the intestinal GCG
gene. In addition, the effects of GLP-1 on the pancreas (i.e. proliferation and anti-
apoptosis) are affected via the actions of β-catenin and TCF7L2. In the pancreas insulin
inhibits expression from the GCG gene leading to reduced production of glucagon. This
action has physiological significance because glucagon is the major counter-regulatory
hormone to insulin action. The important role of TCF7L2 in pancreatic function can be
demonstrated in experiments that lead to reduction in the levels of TCF7L2. In these
types of experiments there is an increased rate of pancreatic β-cell apoptosis, reduced β-
cell proliferation, and reduced glucose-dependent insulin secretion.
The demonstration of cross-talk between the Wnt and insulin signaling pathways is
important as these observations may eventually lead to novel approaches to the treatment
of type 2 diabetes.
2.1.8.5. Mechanism of Insulin Resistance
Insulin resistance (IR) refers to the situation whereby insulin interaction with its receptor
fails to elicit downstream signaling events such as those depicted in the Figures above.
Metabolically and clinically the most detrimental effects of IR are due to disruption in
insulin-mediated control of glucose and lipid homeostasis in the primary insulin-
responsive tissues: liver, skeletal muscle, and adipose tissue. IR is a characteristic feature
found associated with most cases of type 2 diabetes. In addition, IR is the hallmark
feature of the metabolic syndrome (MetS). IR can occur for a number of reasons however,
the most prevalent cause is the hyperlipidemic and pro-inflammatory states associated
with obesity. How does an abnormal metabolism, as is associated with obesity, lead to the
development of IR? The answer to this question can be found in the effects of excess free
fatty acids (FFAs) on the insulin receptor-mediated signaling pathways in adipose tissue,
liver, and skeletal muscle as well as the pro-inflammatory status induced by the toxic
effects of excess FFAs principally in the liver and adipose tissues.
The precise mechanisms that underlie the promotion of a pro-inflammatory state in obese
individuals in not completely established. However, both adipose tissue and liver are
important mediators of systemic inflammation in obesity.

Figure RL8: Model for how excess free fatty acids (FFAs) lead to insulin resistance and
enhanced inflammatory responses in cells such as liver and adipose tissue. Only the major
pathways regulated by insulin relative to glucose and lipid homeostasis are shown. Black arrows represent positive actions and red T-lines represent inhibitory actions. JNK = Jun N-terminal
kinase. PKC = protein kinase C. IKKβ = inhibitor of nuclear factor kappa B kinase beta. ROS =
reactive oxygen species. PI3K = phosphatidylinositol-3 kinase. DAG = diacylglycerol. TAG =
triacylglycerols. LCA-CoA = long-chain acyl-CoAs. NFκB = nuclear factor kappa B. Akt is also known as protein kinase B (PKB).
One model proposes that the expansion of adipose tissue that occurs in obesity results in
large adipocytes that have metabolic capacities that exceed the local oxygen supply. The
resultant hypoxia leads to the activation of cellular stress response pathways causing cell
autonomous inflammation and the release of pro-inflammatory cytokines. As a part of the
chronic inflammation adipocytes secrete chemokines such as IL-8 and macrophage
chemotactic protein-1 (MCP-1) that attract pro-inflammatory macrophages into the
adipose tissue. These activated adipose tissue macrophages secrete cytokines that further
exacerbate the pro-inflammatory state. In the liver inflammatory processes are also
activated due to the excess accumulation of fatty acids and triglycerides which is the
consequence of activated stress response pathways. Within the liver, Kupffer cells
(resident liver macrophages) become activated by the generation of reactive oxygen
species (ROS) and induction of stress responses. These activated Kupffer cells release
locally acting cytokines that, like in adipose tissue, exacerbates the pro-inflammatory

environment. Within the vasculature, saturated FFAs can directly activate pro-
inflammatory pathways in endothelial cells and myeloid-derived cells resulting in the
induction and propagation of a systemic pro-inflammatory state.
Hepatic IR is induced by the excess accumulation of FFAs. Within the hepatocyte,
metabolites of the FFA re-esterification process, including long-chain acyl-CoAs and
diacylglycerol (DAG), accumulate. Excess FFAs also participate in the relocation of
several protein kinase C (PKC) isoforms, from the cytosol to the membrane compartment.
These PKC isoforms include PKC-β2, PKC-δ, and PKC-theta (PKC-θ). DAG is a potent
activator of these PKC isoforms and the membrane-associated PKCs will phosphorylate
the intracellular portion of the insulin receptor on serine residues which results in
impairment of insulin receptor interaction with downstream signaling proteins including
insulin receptor substrate 1 (IRS1) and IRS2. Loss of IRS1 and IRS2 interaction with the
receptor prevents interaction with phosphatidylinositol 3-kinase (PI3K) and its'
subsequent activation. In addition to serine phosphorylation of the insulin receptor,
various PKCs have been shown to phosphorylate IRS1 and IRS2 further impairing the
ability of these insulin receptor substrates to associate with the insulin receptor and
downstream effector proteins such as PI3K (Figure RL8).
The FFA-induced down-regulation of insulin signaling pathways results in activation of
several kinases involved in stress responses. These kinases include Jun N-terminal kinase
(JNK), inhibitor of nuclear factor kappa B kinase beta (IKKβ), and suppressors of
cytokine signaling-3 (SOCS-3). Like PKC, JNK activity is also regulated by FFAs and is
an important regulator of IR. The target of JNK action is the Ser307 of IRS-1 and this
phosphorylation plays an important role in the progression to hepatic IR. Activation of
IKKβ (which is required for the activation of nuclear factor kappa B, NFκB) may have
the most pronounced effect on inflammatory responses in the liver and adipose tissue.
NFκB is the most important transcription factor activating the expression of numerous
pro-inflammatory cytokine genes such as interleukin-1 (IL-1), IL-6, and tumor necrosis
factor-alpha (TNF-α) each of which have been shown to be involved in promoting IR.
NFκB-dependent inflammatory mediators produced in hepatocytes act to reduce insulin
sensitivity and to promote liver injury.
Analysis of the effects of FFAs on macrophages in cell culture demonstrated that they can
activate inflammatory signaling through the toll-like receptors (TLRs), specifically TLR4.
The TLRs are a family of cell surface receptors involved in key events triggered via the
innate immune system. The TLRs are pattern recognition receptors that recognize
structurally conserved molecules from microbial pathogens. TLR4 is responsive to
bacterially derived lipopolysacchardie (LPS) which is an endotoxin secreted by gram-
negative bacteria. LPS stimulation of TLR4 results in activation of both the JNK and
IKKβ signal transduction pathways leading to secretion of pro-inflammatory cytokines
such as IL-1β, IL-6, MCP-1, and tumor necrosis factor alpha (TNFα). These cell culture
experiments demonstrated that FFA addition to macrophages results in activation of
NFκB and that this activation was deficient in macrophages from TLR4 knock-out mice.
In the livers of TLR4 knock-out mice there is reduced inflammation even in the presence
of hepatic steatosis suggesting that Kupffer cell TLR4 is important in hepatic
inflammatory responses to excess FFA loading.
2.1.8.6. Insulin Action and Endothelial Functions
The metabolic functions of insulin are primarily reflective of its role in glucose and lipid
homeostasis in skeletal muscle, adipose tissue, and liver. However, insulin also exerts
important functions in other non-classical insulin target tissues such as the brain,
pancreas, and the vascular endothelium. The ability of insulin to exert vasodilator action
in the vascular endothelium as a result of increased nitric oxide (NO) production is an
important component of the ability of this hormone to enhance glucose uptake by skeletal
muscle. The insulin-mediated signaling pathway that triggers production of NO in
vascular endothelium involves the same signaling proteins (PI3K, PKD, and Akt/PKB)
that are components of metabolic regulatory pathways induced by insulin. Therefore, it is
understandable why the same disruptions to insulin signaling that lead to IR (see above)
caused by excess FFAs and hyperglycemia result in endothelial dysfunction.
The production of NO in endothelial cells is the result of the activation of endothelial
nitric oxide synthase (eNOS). The production and actions of NO and the various NOSs
involved are discussed in more detail in the Amino Acid Derivatives page. With respect
to insulin action, the activation of endothelial Akt/PKB leads to phosphorylation and
activation of eNOS and thus increased NO production. In addition to modulating vascular

tone by activating signaling events in the underlying vascular smooth muscle cells,
endothelial cell-derived NO reduces the production of pro-inflammatory cytokines,
reduces leukocyte and monocyte recruitment and adhesion to the endothelium, inhibits
the proliferation of vascular smooth muscle cells, inhibits apoptosis, and attenuates
platelet aggregation. Inactivation of endothelial cell NO production, as occurs due to IR,
results in endothelial dysfunction and promotes the development of atherosclerosis. As
described above for the liver and adipose tissue, elevated levels of circulating FFAs lead
to impaired insulin signaling via the PI3K-PDK-Akt/PKB pathway in vascular endothelial
cells.
Insulin exerts its mitogenic, growth promoting, and differentiation effects via a signaling
pathway that involves mitogen-activated protein kinase (MAPK) which is distinct from
the PI3K-PDK-Akt/PKB pathway that is involved in metabolic regulation by insulin. The
MAPK-induced pathway does not play a role in the production of NO by insulin. This
MAPK-induced pathway plays a significant role in the development of atherosclerosis in
the IR state. When insulin signaling via PI3K-PDK-Akt/PKB is impaired as described
above for the IR state, the MAPK signaling pathway in endothelial cells is enhanced. In
the endothelium MAPK activation by insulin results in increased expression of
endothelin-1 (ET-1), plasminogen activator inhibitor type-1 (PAI-1), and the adhesion
molecules intercellular adhesion molecule-1 (ICAM-1), vascular cell adhesion molecule-
1 (VCAM-1), and E-selectin. ET-1 is a potent vasoconstrictor and contributes to
endothelial cell dysfunction in the presence of IR. The increased expression of numerous
cell adhesion molecules accelerates the adherence to the endothelium of pro-
inflammatory leukocytes which in turn contributes to the development of atherosclerosis.
Therefore, the molecules beneficial to vascular endothelial health that are induced by
insulin (e.g. NO) are reduced in the IR state and those that are proatherogenic (e.g. ET-1,
PAI-1) are increased.167
2.1.9. Insulin Receptor
The insulin receptor (IR) belongs to the superfamily of transmembrane receptor tyrosine
kinases (TKs).168
In contrast to other family members that are monomeric in their
structure, IR and its homologue, insulin-like growth factor I receptor (IGF-1R), are
intrinsic disulfide-linked dimers of heterodimeric disulfide-linked proteins of the form
(αβ)2. The 135-kDa α subunit of IR is extracellular, whereas the 95-kDa β subunit

contains an extracellular portion, a single transmembrane sequence, and an intracellular
TK domain. the major structural features of the αβ dimer169
is depicted in figure RL8a.
Ligandspecific binding to the α subunits activates the TK, initiating a signal cascade that
results in numerous cellular responses. Our understanding of the mechanics of this signal
transduction process has been hampered by the unavailability of an atomic structure of
the whole IR protein. However, the quaternary structure of the isolated complex of
biologically active IR and insulin was recently solved by three-dimensional
reconstruction from low dose scanning transmission electron micrographs (STEM)170
(Figure RL9, b1-b3).
Figure RL9: Dimeric insulin receptor
structure. a, schematic of IR represented
in its (αβ)2 form. Residues at the start of
named domains and disulfides (italics) are numbered. TM, transmembrane; CT,
C-terminal; juxtamembrane domains not
labeled. b, three-dimensional reconstruction from EM. b1, structure at
full volume of 480-kDa dimer (side
view); b2, structure at 85% of full volume
to show domain subdivision (side view); b3, top view of b2; regions 1, 2, and 3
represent epitope locations for
monoclonal Fab fragments 18–44, 83–14, and 83–87,
37 respectively (see text and
Fig. 3e). b4, ectodomain of EM structure
(top view) fitted with atomic domains LC (green), Fn0 (blue), αFn1-αID (red),
βFn1-Fn2 (violet); backbone ribbon
representation. Second subunit is shown
in brown. Arrow indicates orientation of view of Fig. 2a. c, schematic of structural
conformation in b2. One monomer is
labeled (color) and the second monomer is white. In, insulin; A, activation loop
and opposite catalytic site;
X, C terminus of α subunit (white) and N terminus of β subunit (black); 1, 2, and 3, disulfides at
amino acids 524, 682–685, and between 647 and 872, respectively. Black bar represents 2-fold axis; solid and open arrows point to insulin Phe-B25 and Glu-6 of α subunit.
Atomic structures of subdomains of IR or of highly analogous proteins were fitted into
the complex (e.g. Figure RL9, b4), creating the only available atomic structural model of
IR. The model reveals structural details of the interaction of insulin with the receptor that
lead to the activation of the intracellular TK.171
Cecil C. Yip et. al in the light of recent

structural data on the unbound receptor, discussed the mechanics of a model of receptor
activation arising from insulin binding.172
2.1.9.1. The Mechanics of Transmembrane Signaling
A fundamental question on the mechanism of transmembrane activation of receptors by
extracellular ligand binding is how the binding action is transformed into key intracellular
biochemical reactions such as receptor autophosphorylation. Inactive monomeric TK
receptors, such as the epidermal growth factor receptor and platelet-derived growth factor
receptor, are dimerized and activated by ligand binding.173
Because IR is intrinsically
dimeric without insulin, the distance between the cytoplasmic TKs must be too large for
activation without ligand binding. In the three-dimensional reconstruction of the insulin
bound IR complex the two TK domains are juxtaposed, and an extended flexible
activation loop of one fitted atomic TK structure can just reach the catalytic loop of the
other TK.170
In a simple mechanical paradigm of activation171
the binding of insulin not
only overcomes an energy barrier to binding but holds the LCL domains together to
permit a lateral shift and approach of the two transmembrane domains to allow trans
autophosphorylation of the tyrosine residues in the activation loop171
(Figure RL10 a and
b). The model presupposed an “open” configuration of the free IR. Such a configuration
has been confirmed by the three-dimensional reconstruction from STEM micrographs of
insulin-free IR dimmers174
(Figure RL10d). Moreover, this structure, together with the
insulinbound three-dimensional structure, makes it possible to reconcilevirtually all
structural forms seen previously in electron microscopic examinations of the IR, except
for long parallel T-shaped structures occasionally observed.175,176
This includes Y, H, V,
and X shapes and parallel barlike images, observed by two-dimensional electron
microscopy of detergent-solubilized IR, its ectodomain, or vesicle-reconstituted insulin-
IR complex.175-178
Such configurations can be formed by the projection of the three-
dimensional reconstructions at various orientations (Figure RL10e). Moreover, the three-
dimensional reconstruction can also explain the images of parallel rods and crosses
(Figure RL10e, last column) produced by pairs of antibodies to Fn0, to the β-ID, and to
the CR domain.179

Figure RL10: IR signaling
mechanics and conformational
changes. (a) schematic closed IR
form, insulin-bound, permissive for
activation by transphosphorylation.
set 1 and set 2, amino acid
interactions with monomer 1 and
monomer 2, respectively; C, catalytic
site; A-loop, activation loop; 1 and 2,
αα disulfide bonds; cam, structural
feature (bulge) on CR. (b) schematic
open IR form, non-permissive for
transphosphorylation, cam blocks
approach of A-loop to C site. (c)
three-dimensional reconstruction of
insulin-bound IR. (d) three
dimensional reconstruction of insulin-
free IR. (e) projection images at
different orientations of structures in
(c) and (d) showing Y, H, V, X, and
parallel bar shapes like those seen in
prior work.23-26
Sixth column,
modeled structures based on figure
RL9 (b4) of Fab/IR images by
Tulloch et al.
2.1.9.2. Molecular Mechanisms for Insulin-Stimulated Glucose Transport
Whole-body glucose homeostasis is regulated by a balance of glucose supply (nutrients
ingested and hepatic glucose output) and glucose uptake by insulin sensitive (muscle,
adipose tissue) and insulin-insensitive (brain, splanchnic tissues, blood cells) tissues.180
Under insulin-stimulated conditions, skeletal muscle plays a predominant role in
maintaining glucose homeostasis; it accounts for at least 80% of glucose disposal.180
Furthermore, under physiological conditions, glucose transport into muscle cells is the
rate-limiting step for the regulation of glucose metabolism.181-184
Glucose is transported
into cells by a process of facilitated diffusion that is mediated by a family of structurally
related carrier proteins that are encoded by distinct genes. These glucose transporters
(Glut) are expressed in a tissue-dependent manner185,186
and constitute a different gene
family from the sodium linked glucose transporters.187
In skeletal muscle and adipose
cells, three facilitative diffusion glucose transporters are expressed: Glutl, Glut4, and
Glut5. Glut4 is the most abundant and has the highest turnover number (moles of glucose
transported/transporter per unit time). Glut5 is a high affinity fructose transporter188
and

plays a minimal role in glucose transport into these tissues. Thus, insulin-stimulated
glucose transport into muscle and adipose tissue occurs primarily via Glut4, with Glutl
playing a minor role. Insulin stimulation of glucose uptake involves a complex series of
cellular events that are illustrated in figure RL11. In the absence of insulin, Glut4
molecules reside primarily in intracellular vesicles. Insulin binding to its receptor elicits a
cascade of signalling events those results in the rapid translocation of glucose transporters
to the plasma membrane. Signaling events also potentially regulate docking, fusion, and
activation of Glut4 at the plasma membrane.
Glut4 transporters are continually recycling from the plasma membrane through
endosomes and insulin regulates the kinetics of Glut4 vesicle recycling to enhance
exocytosis.189
Insulin also has more chronic effects on Glut4 gene transcription.190
Dysregulation of one or more of these steps could result in whole-body insulin resistance.
A hallmark of insulin resistance in rodents and humans is the down-regulation of Glut4
gene expression in adipose tissue but not in skeletal muscle.191,192
Data from studies using
rodent models of obesity and diabetes indicate that in skeletal muscle a defect in Glut4
translocation, fusion, or activation, not expression, is responsible, at least in part, for
insulin resistance.191,192
Lesions in signaling events emanating from the insulin receptor
and (or) defects in Glut4 sorting and trafficking could explain defective Glut4
translocation, fusion, or activation.
Table RL3 gives an account of the tissue distribution and functions of different
structurally related carrier proteins for glucose transport.193
2.1.9.3. Insulin Signaling and Glucose Transport
Insulin binding to its receptor results in autophosphorylation of the receptor and the
subsequent phosphorylation of multiple signaling molecules. Insulin signaling cascades
result in diverse and critical effects on cell biology, including the regulation of
mitogenesis, gene expression, and metabolic pathways such as glucose transport,
antilipolysis, lipogenesis, glycogen synthesis, and amino acid transport (Figure
RL11).192,194,195
Although recent studies have led to significant insight into the complexity
of the insulin signaling network, little is yet known about how insulin signals metabolic
events in the cell.

Table RL3: Tissue distribution and function of the facilitative glucose transporter family
Isoform Tissue distribution Function
Glutl
Ubiquitous; high expression in
cultured cells, brain, endothelial
cells, human erythrocytes
Constitutive glucose transport
Glut2 Kidney and small intestinal epithelial
cells, liver, and pancreatic fl cells
Low-affinity transporter; glucose
release into blood stream; part of
glucose sensor in islets
Glut3 Neurons and placenta High-affinity transporter; unabated
transport into central nervous system
Glut4 Skeletal muscle, brown and white
adipose tissue and heart
Mediates insulin-regulated glucose
transport
Glut5
Small intestine, kidney, brain,
endothelial cells, sperm, adipocytes
and muscle
Fructose transporter
Glut6 Pseudogene
Glut7 Liver endoplasmic reticulum Part of the glucose-6-phosphate
complex involved in gluconeogenesis
Intracellular targets of the insulin receptor tyrosine kinase activity include IRS-1, IRS-2,
and Shc.194,195
Most studies indicate that IRS-1 is a critical upstream signaling molecule
in the cascade leading to Glut4 translocation. Transfection of rat adipocytes with epitope-
tagged Glut4 and a tyrosine kinase-deficient insulin receptor196
resulted in no
translocation of Glut4 in response to insulin.196,197
In cells transfected with IRS-1
antisense ribozyme, there was reduced sensitivity of insulinstimulated Glut4 translocation
with no change in maximal response.197
In contrast, when IRS-1 was overexpressed in
adipocytes transfected with epitope-tagged Glut4, Glut4 translocation was enhanced in
the absence of insulin and IRS-1 overexpression restored insulin sensitivity in cells
transfected with the IRS-1 antisense ribozyme.197
The role of IRS-1 in signaling
insulinstimulated glucose transport is further highlighted by studies using mice with
targeted disruption of the IRS-1 gene. These mice are growth-retarded with significant
reduction of insulin-stimulated glucose transport into isolated adipocytes.198
However, a

role for other proximal signaling molecules such as IRS-2 and Shc in Glut4 translocation
is probable because there is some effect of insulin on glucose transport and translocation
of Glut4 in the absence of IRS-1 in adipocytes from these knock-out mice.198
Figure RL11: Sequence of events involved in insulin stimulation of glucose transport in muscle and adipose cells: 1) In the absence of insulin, GLUT4 glucose transporters reside within the cell
in a distinct vesicle population. Other proteins that are associated with the GLUT4 vesicle include
synaptobrevin (VAMP), gp160/vp165, phosphatidylinositol-4 (PI4) Kinase, Rab4 and secretory component-associated membrane proteins (SCAMPS); 2) when insulin binds to its receptor in the
plasma membrane, it initiates a cascade of signals affecting transcription, translocation, and
possibly activation of the glucose transporter; 3) In adipocytes Rab4 dissociates from the vesicle and the vesicle translocates to the plasma membrane, where it docks and fuses and glucose
transport is activated; 4) GLUT4 vesicles are endocytosed and recycle through endosomes.

Ras-MAP Kinase Signaling Pathway
Some of insulin's pleiotropic effects on cell growth and metabolism appear to be mediated
by signalling pathways emanating from the low molecular GTPbinding protein, Ras. IRS-
1, IRS-2, and Shc, upon phosphorylation by insulin (or other growth factors), act as
docking molecules for other proteins via srchomology2 (SI-I2) domains, thereby forming
multiple signaling complexes (Figure RL12). Activated IRS-1 and Shc form complexes
with Grb2 and SOS proteins, leading to Ras activation, and insulin binding to its receptor
has been shown to increase cellular concentrations of GTP-bound, activated Ras.199,201
Ras activation results in the activation of a serinethreonine phosphorylation cascade that
minimally includes the proteins Raf-1, MEK, pp44, and pp42 mitogen activated protein
(MAP) kinases and pp90 s6 kinase. The Ras-MAP kinase cascade plays a pivotal role in
the regulation of gene expression via phosphorylation of transcription factors. However,
the role of the Ras-MAP kinase cascade in the regulation of insulin's metabolic effects
such as glucose transport remains controversial.
Figure RL12: Insulin signal transduction results in mitogenic and metabolic responses.
Upon activation, the insulin receptor associates with insulin receptor substrate (IRS)-I and
IRS-2, which bind to several proteins containing src homology 2 (SH2) domains, thus
activating the ras/MAP kinase cascade and the phosphoinositol-3 (PI3) kinase pathway.
These pathways lead to multiple actions including gene transcription, glucose transport,
and glucose, protein, and lipid metabolism.202

Studies using cultured cells to examine the role of Ras-MAP kinase pathways in the
stimulation of glucose transport have yielded conflicting results. Vanden Bergh et al.
compared the ability of insulin, epidermal growth factor, and thrombin to stimulate Ras-
MAP kinase signaling pathways in 3T3-L1 adipocytes and found that Ras activation
alone was not sufficient to account for insulin-stimulated glucose transport.203
Furthermore, enhanced signalling via Ras in Ratl Cells did not alter insulin-stimulated
glucose transport.200,204
Conversely, when 3T3-L1 adipocytes were transfected with
constitutively activated Ras, there was enhanced Glut4 translocation to the
plasmamembrane in the absence of insulin, and no further translocation was observed
with insulin treatment.205
A major caveat of this study was the observation that Ras
overexpression resulted in a 95% down-regulation of Glut4 expression. The confounding
effect of chronic exposure to activated Ras on gene expression was overcome by
transiently transfecting rat adipocytes with constitutively activated Ras, which resulted in
a significant increase in the translocation of co-transfected epitope-tagged Glut4 to the
cell surface in the absence of insulin and no further stimulation with insulin.206
Studies using microinjection techniques also provide conflicting data concerning the role
of Ras pathways in glucose transport. Manchester et al. reported that microinjection of
activated Ras into cardiac myocytes caused a significant increase in glucose transport.207
However, microinjection of constitutively active Ras208
or downstream effectors such as
activated Ras209
into 3T3-L1 adipocytes had no effect on the translocation of Glut4 as
assessed by the plasma membrane sheet assay. Furthermore, injection of neutralizing
antibodies to Ras caused a 50% reduction in insulin-stimulated glucose transport into
cardiac myocytes207
but had no effect in 3T3-L1 adipocytes.209
The latter finding is
supported by the fact that transient transfection of rat adipocytes with dominant negative
Ras did not alter translocation of epitopetagged Glut4.206
Reusch et al. used lovastatin
(which inhibits farnesylation of ras and thus inhibits appropriate targeting to the plasma
membrane) to neutralize Ras activity and found attenuation of insulin effects on
thymidine incorporation and glucose incorporation into glycogen but not glucose
transport.210
However, a major caveat of this study is that lovastatin's effects may not be
specific to Ras because it also inhibits the ratelimiting step of cholesterol biosynthesis,
geranylgeranylation of proteins, insulin stimulation of PI3- kinase activity, and cell
transformation by Raf.211-213

Glucose transport is a pivotal step in whole-body insulin action. Stimulation of glucose
transport in insulin-sensitive tissues involves the recruitment of Glut4 from an
intracellular vesicle pool to the plasma membrane. This process is regulated by a complex
network of signaling pathways. In adipocytes, Glut4 gene expression is reduced in
insulin-resistant subjects, including those with obesity and diabetes, whereas in skeletal
muscle Glut4 expression is minimally affected. In skeletal muscle, resistance to insulin
stimulation seems to result from defects in Glut4 vesicle trafficking.214,215
Houseknecht et
al. performed studies manipulating Glut4 expression or the expression of specific
signaling molecules in insulin-sensitive tissues in transgenic mice202
which indicated that
increasing the number of Glut4 transporters that are functionally inserted in the plasma
membrane enhances whole-body insulin action and alters body composition. Thus, they
concluded that developing methods to increase the expression of the Glut4 gene or to
increase the proportion of cellular Glut4 that are functionally inserted in the plasma
membrane are important strategies for developing new therapies to prevent or ameliorate
insulin resistance. Such strategies might involve enhancing translocation of the Glut4
vesicle to the plasma membrane, promoting its fusion once at the membrane, increasing
the exposure of the Glut4 transporter to the extracellular milieu, or facilitating its
activation.
2.1.10. Therapeutic Intervention for Hyperglycemia (Drugs belonging to different
chemical classes)
Many, if not all, of the vascular consequences of insulin resistance are due to the
persistent hyperglycemia seen in type2 diabetes. For this reason a major goal of
therapeutic intervention in type 2 diabetes is to reduce circulating glucose levels. There
are many pharmacologic strategies to accomplish these goals. Tables RL 4, 5 and 6
repersents the current pharmacological agents, combination therapies and clinical efficacy
of the phrarmacological therapies used for the treatment of T2D.66
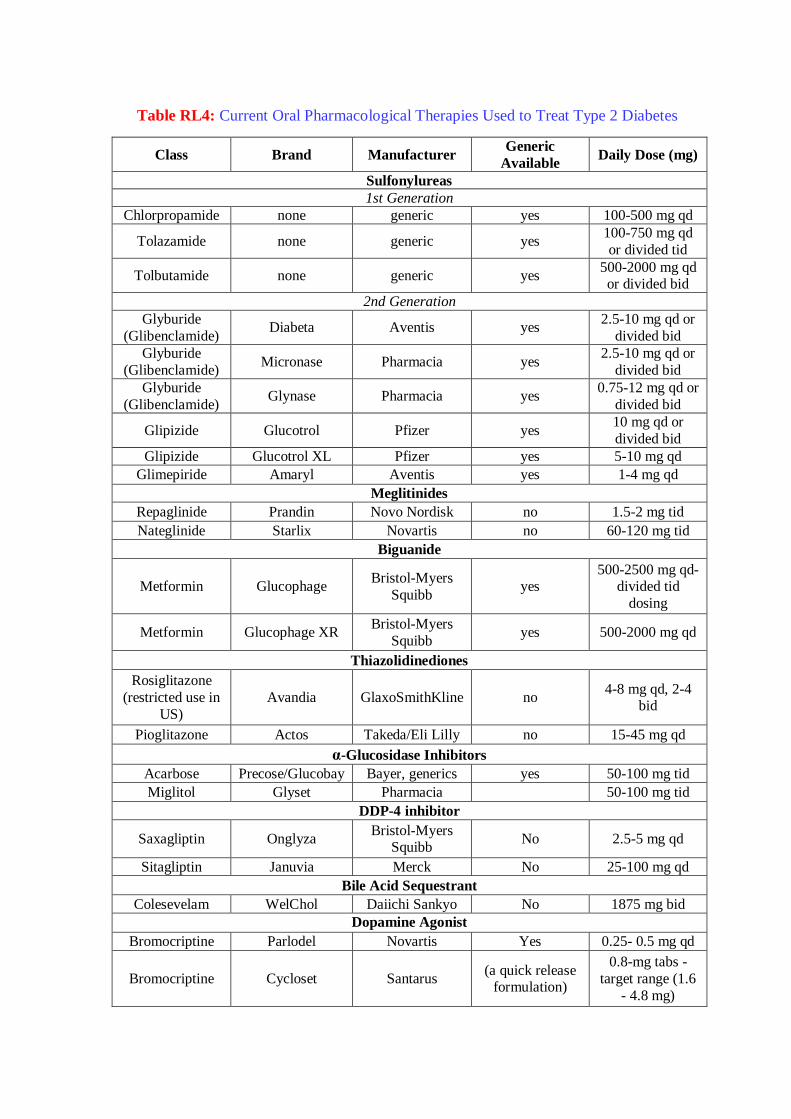
Table RL4: Current Oral Pharmacological Therapies Used to Treat Type 2 Diabetes
Class Brand Manufacturer Generic
Available Daily Dose (mg)
Sulfonylureas
1st Generation
Chlorpropamide none generic yes 100-500 mg qd
Tolazamide none generic yes 100-750 mg qd
or divided tid
Tolbutamide none generic yes 500-2000 mg qd or divided bid
2nd Generation
Glyburide
(Glibenclamide) Diabeta Aventis yes
2.5-10 mg qd or
divided bid
Glyburide
(Glibenclamide) Micronase Pharmacia yes
2.5-10 mg qd or
divided bid
Glyburide
(Glibenclamide) Glynase Pharmacia yes
0.75-12 mg qd or
divided bid
Glipizide Glucotrol Pfizer yes 10 mg qd or
divided bid
Glipizide Glucotrol XL Pfizer yes 5-10 mg qd
Glimepiride Amaryl Aventis yes 1-4 mg qd
Meglitinides
Repaglinide Prandin Novo Nordisk no 1.5-2 mg tid
Nateglinide Starlix Novartis no 60-120 mg tid
Biguanide
Metformin Glucophage Bristol-Myers
Squibb yes
500-2500 mg qd-divided tid
dosing
Metformin Glucophage XR Bristol-Myers
Squibb yes 500-2000 mg qd
Thiazolidinediones
Rosiglitazone
(restricted use in
US)
Avandia GlaxoSmithKline no 4-8 mg qd, 2-4
bid
Pioglitazone Actos Takeda/Eli Lilly no 15-45 mg qd
α-Glucosidase Inhibitors
Acarbose Precose/Glucobay Bayer, generics yes 50-100 mg tid
Miglitol Glyset Pharmacia 50-100 mg tid
DDP-4 inhibitor
Saxagliptin Onglyza Bristol-Myers
Squibb No 2.5-5 mg qd
Sitagliptin Januvia Merck No 25-100 mg qd
Bile Acid Sequestrant
Colesevelam WelChol Daiichi Sankyo No 1875 mg bid
Dopamine Agonist
Bromocriptine Parlodel Novartis Yes 0.25- 0.5 mg qd
Bromocriptine Cycloset Santarus (a quick release
formulation)
0.8-mg tabs -
target range (1.6
- 4.8 mg)

2.1.10.1. Sulfonylureas
Sulfonylureas, derived from sulfonic acid and urea, were initially developed in the 1950s
and have remained a cornerstone of therapy for type 2 diabetes.216
The combination of
their proven efficacy in most patients, low incidence of adverse events, and low cost has
contributed to their success and continued use. They are frequently classified as either 1st
generation or 2nd generation agents. First generation sulfonylureas (acetohexomide,
chlorpropamide, tolazamide, and tolbutamide) possess a lower binding affinity for the
ATP-sensitive potassium channel, their molecular target (vide infra), and thus require
higher doses to achieve efficacy, increasing the potential for adverse events. In addition,
the plasma half-life of 1st generation sulfonylureas is extended (e.g. 5-36 h) compared to
the 2nd generation agents. Chlorpropamide was once the most commonly used oral agent,
but now it is rarely prescribed. Unique complications associated with chlorpropamide are
hyponatremia (SIADH) and an alcohol flushing reaction (disulfiram-Antibuse reaction).
In addition, tolbutamide, acetohexamide and tolazamide generally require 2 or 3 doses per
day and are rarely used.
More recently, 2nd generation sulfonylureas including glyburide (glibenclamide;
glipizide and glimepiride (Figure RL13) were introduced, and are now widely used. The
2nd generation sulfonylureas are much more potent compounds (~ 100-fold), possess a
more rapid onset of action, and generally have shorter plasma half-lives and longer
duration of action compared to the 1st generation agents.
Figure RL13: Structures of Glyburide, Glipizide and Glimepiride

Mechanism of Action
Sulfonylureas are insulin secretogogues, since they control blood glucose levels by
directly stimulating first-phase insulin secretion in the pancreatic β-cells. Through the
concerted efforts of GLUT2 (the high Km glucose transporter),217
glucokinase (the
glucose sensor),218
and glucose metabolism, these cells are responsible for sensing and
secreting the appropriate amount of insulin in response to a glucose stimulus.219
Mitochondrial glucose metabolism leads to ATP generation and increases the intracellular
ratio of ATP/ADP, which results in the closure of the ATP-sensitive potassium channel
(KATP; a 140 kDa membrane protein) on the plasma membrane. Closure of this channel
depolarizes the membrane and triggers the opening of voltage-sensitive calcium channels,
leading to the rapid influx of calcium. Increased intracellular calcium causes an alteration
in the cytoskeleton, and stimulates translocation of insulin-containing secretory granules
to the plasma membrane and the exocytotic release of insulin.
The KATP channel is comprised of two subunits, both of which are required for the
channel to be functional. One subunit contains the cytoplasmic binding sites for both
sulfonylureas and ATP, and is designated as the sulfonylurea receptor type 1 (SUR1). The
other subunit is the potassium channel, which acts as the pore-forming subunit.220
Either
an increase in the ATP/ADP ratio or ligand binding (by sulfonylureas, meglitinides) to
SUR1 results in the closure of the KATP channel and insulin secretion. Studies
comparing sulfonylureas and non-sulfonylurea insulin secretogogues have identified
several distinct binding sites on the SUR1 that cause channel closure. Some sites exhibit
high affinity for glyburide and other sulfonylureas, while other sites exhibit high affinity
for the non-sulfonylurea secretogogues (vide infra).
Efficacy
The over clinical efficacy of sulfonylureas in patients with type 2 diabetes is related to the
pre-treatment levels of fasting plasma glucose and HbA1C. The higher the fasting glucose
level, the greater the effect will be. In patients with a pre-treatment glucose level of
approximately 200 mg/dl (11.1 mmol/l), sulfonylureas typically will reduce glucose by
60-70 mg/dl (3.3-3.9 mmol/l) and HbA1C by 1.5-2% (Table 3). The most responsive
patients are those who exhibit mild-to-moderate fasting hyperglycemia (<200-240 mg/dl;
<12.2-13.3 mmol/l), along with adequate residual β-cell function (evidenced by elevated
fasting C-peptide). When used at maximally effective doses, results from well-controlled
clinical trials have not indicated a superiority of one 2nd generation sulfonylurea over

another. Similarly, 2nd generation sulfonylureas exhibit similar clinical efficacy
compared to the 1st generation agents. The principal advantage of glimepiride and
Glucotrol XL compared to other agents is the once daily dosing regimen. Approximately
10-20% of patients will exhibit a poor initial response to sulfonylureas (primary failures).
While these patients are typically those who have severe fasting hyperglycemia (>280
mg/dl; >15.5 mmol/l) and reduced fasting C-peptide levels, these tests are not specific
enough to help decide on the usefulness of a sulfonylurea for an individual patient. In
addition, treatment with sulfonylureas results in the eventual loss of therapeutic
effectiveness (secondary failure) in the range of 3-10% per year.216
Side Effects
The major side effect from sulfonylurea treatment is hypoglycemia. This side effect is
really just an extension of the therapeutic objective. Mild hypoglycemic events occur in
approximately 2-4% of patients and severe hypoglycemic reactions that require
hospitalization occur at a frequency of 0.2-0.4 cases per 1000 patient-years of
treatment.221
In light of this, initiation of treatment with sulfonylureas should be at the
lowest recommended dose. An additional undesirable effect of sulfonylurea therapy (as is
also the case with insulin therapy) is weight gain. In the UKPDS, sulfonylurea treatment
caused a net weight gain of 3 kg, which occurred during the first 3-4 years of treatment
and then stabilized.222
In contrast, weight gain in response to insulin therapy increased
progressively for the duration of the study. As mentioned above, chlorpropamide is
associated with hyponatremia (SIADH) and an alcohol flushing reaction (disulfiram-
Antibuse reaction). All the agents can cause intrahepatic cholestasis. Rarely
maculopapular or urticarial rashes occur.
In renal failure, the dose of the sulfonylurea agent will require adjustment based on
glucose monitoring. The half-life of insulin is extended in renal failure and thus there is
an increased risk for hypoglycemia. This risk is typically manifest with fasting
hypoglycemia.
2.1.10.2. Meglitinides: Repaglinide and Nateglinide
The meglitinides are a novel class of non-sulfonylurea insulin secretogogues
characterized by a very rapid onset and abbreviated duration of action. Repaglinide
(Prandin), a benzoic acid derivative introduced in 1998, was the first member of the

meglitinide class (Figure RL14). Nateglinide (Starlix) is a derivative of the amino acid D-
phenylalanine and was introduced to the market in 2001 (Figure RL14). Unlike
sulfonylureas, repaglinide and nateglinide stimulate first-phase insulin release in a
glucose-sensitive manner, theoretically reducing the risk of hypoglycemic events. The
delivery of insulin as an early, transient burst at the initiation of a meal affords several
major physiological benefits.223,224
These include rapidly suppressing hepatic glucose
production and reducing the stimulus for additional insulin that would be required
subsequently to dispose of a larger glucose load. Thus, the rapid onset/short duration
stimulation of insulin release by meglitinides should enhance control of prandial
hyperglycemia, while reducing the risk for post-absorptive hypoglycemia and limiting
exposure to hyperinsulinemia.
Figure RL14: Chemical structures of Nateglinide and Repaglinide
Mechanism of Action
Similar to sulfonylureas, meglitinides are insulin secretogogues, since they control blood
glucose levels by directly stimulating first-phase insulin secretion in the pancreatic βcells.
Receptor-binding studies performed in βTC-3 cells identified a high-affinity repaglinide
(KD = 3.6 nmol/l) site having lower affinity for glyburide (14.4 nmol/l), and one high-
affinity glyburide (25 nmol/l) site having lower affinity for repaglinide (550 nmol/l).225
Repaglinide is approximately 5 times more potent than glyburide in stimulating insulin
secretion. Unlike glyburide (and other sulfonylureas), repaglinide does not stimulate
insulin secretion in vitro in the absence of glucose. Rather, it enhances glucose-stimulated
insulin secretion especially at 180 mg/dl (10 mmol/l) glucose. The mechanism of action
of nateglinide also involves the binding to and closure of the KATP channel resulting in
membrane depolarization, an influx of calcium, and insulin exocytosis.226
The kinetics of

interaction of nateglinide with the KATP channel are distinct compared to both
rapaglinide and sulfonylureas, and accounts for its rapid insulinotropic effects. The onset
of action of nateglinide is similar to that of glyburide but three-fold more rapid than that
of rapaglinide.223
When nateglinide is removed from the KATP channel, its effect is
reversed twice as quickly as glyburide and five times more quickly than rapaglinide.
Thus, nateglinide initiates a more rapid release of insulin that is shorter in duration
compared to rapaglinide,223
despite having an in vivo pharmacokinetic profile that is
similar.227,228
Efficacy
The efficacy of rapaglinide, when used as a monotherapy, is similar to sulfonylureas.229
Repaglinide treatment of patients with type 2 diabetes reduced fasting plasma glucose by
approximately 60 mg/dl and HbA1C by 1.7%.230
In a double-blind placebo-controlled
study, rapaglinide had similar effects on lowering HbA1C (0.5-2%) and fasting plasma
glucose (65-75 mg/dl; 3.6-4.2 mmol/l) compared to glyburide.231
Repaglinide is also
efficacious when used in combination with either metformin or troglitazone (a
thiazolidinedione withdrawn from the market). In patients treated with rapaglinide and
metformin, HbA1C was decreased from 8.3% to 6.9% and fasting plasma glucose by 40
mg/dl (2.2 mmol/l).232
Although lowered, the changes observed in subjects treated with
either repaglinide or metformin monotherapy were not significant for HbA1C (0.4 and
0.3% decrease, respectively), or fasting plasma glucose (9 mg/dl (0.5 mmol/l) increase
and 5.4 mg/dl (0.3 mmol/l) decrease, respectively). Significant increases in body weight
occurred in the both repaglinide and combined therapy groups (2.4 ± 0.5 and 3.0 ± 0.5
kg, respectively). The combination therapy of rapaglinide and troglitazone showed a
significant reduction in mean HbA1C values (1.7%) that was greater than with either type
of monotherapy.233
Repaglinide monotherapy resulted in a reduction of HbA1C values
that was significantly greater than troglitazone (0.8% vs. 0.4%). In addition, combination
therapy was more effective in reducing fasting plasma glucose (80 mg/dl) than either
repaglinide (43 mg/dl) or troglitazone (46 mg/dl) monotherapies. Repaglinide is also
efficacious when used in combination with other available thiazolidinediones,
rosiglitazone (Avandia) and pioglitazone (Actos).234
The efficacy of nateglinide when used as a monotherapy is similar to sulfonylureas and
repaglinide. However, several therapeutically attractive features distinguish nateglinide
from repaglinide and sulfonylureas. Nateglinide produces a more rapid post-prandial

increase in insulin secretion, and its duration of response is shorter than that of
glyburide.235,236
Thus, the risk of post-absorptive hypoglycemia should be lower than with
either sulfonylureas or rapaglinide, but this has not been demonstrated in studies to date.
The efficacy of nateglinide treatment has been evaluated alone and in combination with
metformin in patients with type 2 diabetes.237
In this randomized double-blind study,
patients with an HbA1C level between 6.8 and 11.0% during a 4-week placebo run-in
received 24 weeks treatment with 120 mg nateglinide before meals (n = 179), 500 mg
metformin three times a day (n = 178), combination therapy (n = 172), or placebo (n =
172). At the study conclusion, HbA1C and fasting plasma glucose were significantly
reduced from baseline with nateglinide [0.5% and 12.6 mg/dl (0.7 mmol/l), respectively]
and metformin [0.8% and 28.8 mg/dl (1.6 mmol/l), respectively], but was increased with
placebo [0.5% and 7.2 mg/dl (0.4 mmol/l), respectively]. Combination therapy was
additive [HbA1C, 1.4% and glucose, 43.2 mg/dl (2.4mmol/l)]. Although only preliminary
data are available, nateglinide also appears effective when used in combination with
thiazolidinediones.224,238
In a direct comparison of Repaglinide and Nateglinide, the known pharmacodynamic
differences in the drugs are evident on the clinical outcomes.238
The longer acting
Repaglinide has significant effects on fasting glucose levels while Nateglinide does not.
These clinical findings are important and can be incorporated into clinical decision
making. For example, if the main issue for the patient is postprandial hyperglycemia, and
fasting glucoses are near normal, an agent that has limited effect on the fasting glucose
would be beneficial.
Side Effects
In 1-year trials, the most common adverse events reported in repaglinide recipients (n =
1,228) were hypoglycemia (16%), upper respiratory tract infection (10%), rhinitis (7%),
bronchitis (6%) and headache (9%). The overall incidence of hypoglycemia was similar
to that recorded in patients receiving glibenclamide, glipizide or gliclazide (18%; n =
597); however, the incidence of serious hypoglycemia appears to be slightly higher in
sulphonylurea recipients. Weight gain does occur in patients treated with repaglinide, but
the magnitude is significantly less compared to treatment with glyburide. In patients
switched from sulfonylureas to repaglinide, no weight gain was observed; in drug-
negative patients, repaglinide-treatment increased body weight by approximately 3%
(6lb).231,239

The clinical trials of nateglinide carried out to date have found the drug to be safe and
well tolerated. Dosage regimens ranging from 60 to 240 mg have been evaluated. The
most common adverse effects are nausea, diarrhea, dizziness, and lightheadedness. The
incidence of mild hypoglycemia is lower with nateglinide than for rapaglinide and no
reports of severe hypoglycemia, consistent with the mechanism of action of nateglinide.
In the clinical studies carried out to date, there have been no reports of any increase body
weight gain.
Table RL5: Fixed Combination Therapies Treat Type 2 Diabetes
Drug 1 Drug 2 Brand Manufacturer Generic
Available
Available Doses
(mg Drug1/ mg
Drug 2
Glyburide Metformin Glucovance Bristol-Myers
Squibb yes
1.25/250;2.5/500;
5/500
Glipizide Metformin Metaglip Bristol-Myers
Squibb yes
2.5/250; 2.5/500;
5/500
Glimepiride Pioglitazone Duetact Takeda no 2/30; 4/30
Glimepiride Rosiglitazone Avandaryl Glaxo
SmithKline no
(restricted use in
US)
1/4; 2/4; 4/4
Sitagliptin Metformin Janumet Merck no 50/500; 50/1000
Saxagliptin Metformin Kombiglyze
XR
Bristol-Myers
Squibb no
5 mg /500;
5/1000; 2.5/1000
Pioglitazone Metformin ACTOS PlusMet
Takeda no 15/500; 15/850
Repaglinide Metformin PrandiMet Novo Nordisk no 1/500; 2/500
Rosiglitazone Metformin Avandamet Glaxo
SmithKline no
(restricted use in US)
1/500; 2/500;
4/500; 2/1000; 4/1000

Table RL6: Clinical Efficacy of Pharmacological Therapies to Treat Type 2 Diabetes When Used as Monotherapy or as Add On Treatment
Agent Class ↓ Fasting Plasma
Glucose ↓HbA 1C (%) Insulin Lipids Body
Weight Major Side Effects
(mg/dl) (mmol/l)
Sulfonylureas 60-70 3.3-3.9 0.8-2.0 Increase No effect Increase Hypoglycemia
Meglitinides 65-75 3.6-4.2 0.5-2.0 Increase No effect Increase Hypoglycemia
Biguanide
(Metformin) 50-70 2.8-3.9 1.5-2.0 Decrease ↓TG↓LDL ↑HDL Decrease GI disturbances; LA1
Thiazolidinediones Pioglitazone
Rosiglitazone 60-80 3.3-4.3 1.4 -2.6 Decrease
↓ TG, -LDL
↑ HDL;
-TG, ↓
LDL,↑HDL
Increase Fluid retention; decreased Hb, Congestive Heart
Failure, fractures
α-Glucosidase
inhibitors 25-30 1.9-2.2 0.7-1.0 No effect No effect No effect GI disturbances
DDP-4 inhibitor 12-28 0.6.-1.5 0.5-0.8 Increase No effect No effect Risk of Pancreatitis (not proven)
Bile Acid
Sequestrant 15 0.83 0.5 No effect
-TG, ↓ LDL,
-HDL No effect
Esophageal obstruction, bowel obstruction,
fecal impaction, dysphagia,pancreatitis,
nausea, constipation
Dopamine Agonist 0-18 0-1.0 0.1-0.6 No effect No effect No effect Nasal Stuffiness, Nausea, headache, constrictive pericarditis, neuroleptic malignant syndrome,
hypotension
GLP-1 agonist 9-28 0.5-1.5 0.7-.9 Increase No effect Decrease Nausea , constipation, Risk of pancratitis
(not proven)
Amylin Decrease Nausea
Note: caution must be taken in comparing the results presented above. Head to head comparisons of these agents are limited. The groups studied were often different, with
significantly different baseline HgA1c levels. There is a strong correlation between baseline HbA1c and the magnitude of effectiveness of these agents (i.e. ability to decrease
HbA1c). Significantly greater reductions in both fasting plasma glucose and HbA1c were observed in groups with higher baseline HbA1c. For those patients whose HbA1c was
<8.0%, the reduction from therapy was only 0.1-0.2%
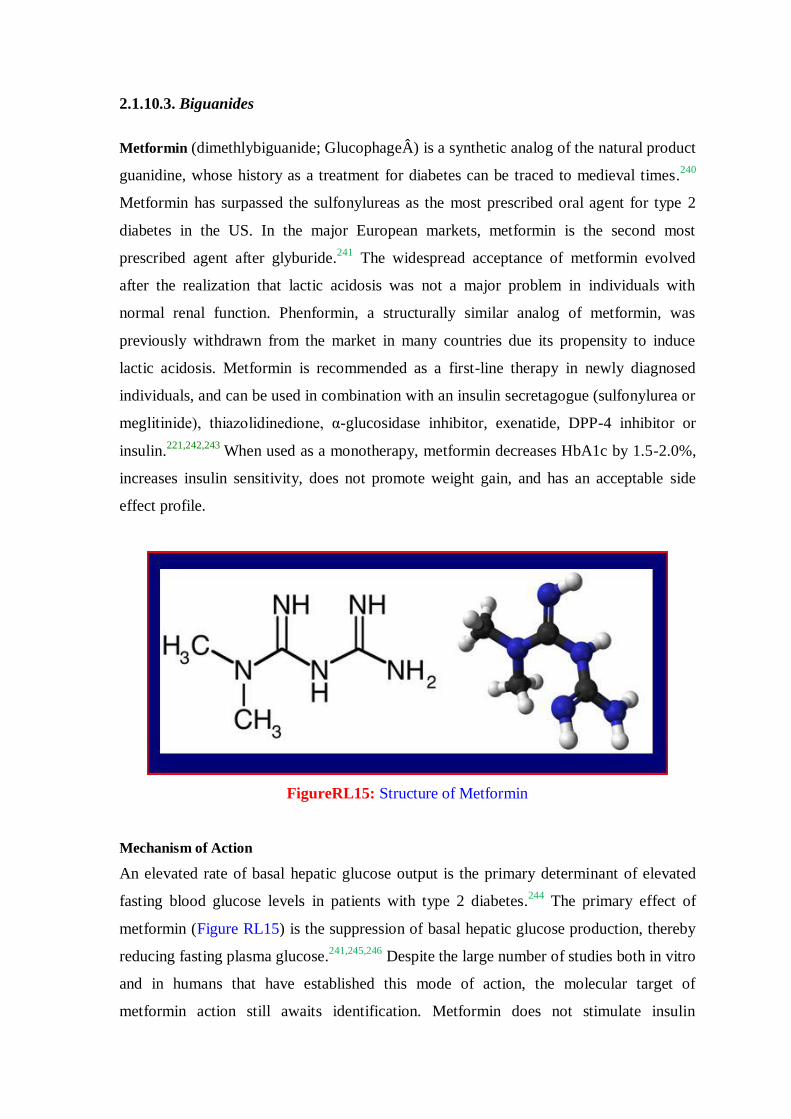
2.1.10.3. Biguanides
Metformin (dimethlybiguanide; GlucophageÂ) is a synthetic analog of the natural product
guanidine, whose history as a treatment for diabetes can be traced to medieval times.240
Metformin has surpassed the sulfonylureas as the most prescribed oral agent for type 2
diabetes in the US. In the major European markets, metformin is the second most
prescribed agent after glyburide.241
The widespread acceptance of metformin evolved
after the realization that lactic acidosis was not a major problem in individuals with
normal renal function. Phenformin, a structurally similar analog of metformin, was
previously withdrawn from the market in many countries due its propensity to induce
lactic acidosis. Metformin is recommended as a first-line therapy in newly diagnosed
individuals, and can be used in combination with an insulin secretagogue (sulfonylurea or
meglitinide), thiazolidinedione, α-glucosidase inhibitor, exenatide, DPP-4 inhibitor or
insulin.221,242,243
When used as a monotherapy, metformin decreases HbA1c by 1.5-2.0%,
increases insulin sensitivity, does not promote weight gain, and has an acceptable side
effect profile.
FigureRL15: Structure of Metformin
Mechanism of Action
An elevated rate of basal hepatic glucose output is the primary determinant of elevated
fasting blood glucose levels in patients with type 2 diabetes.244
The primary effect of
metformin (Figure RL15) is the suppression of basal hepatic glucose production, thereby
reducing fasting plasma glucose.241,245,246
Despite the large number of studies both in vitro
and in humans that have established this mode of action, the molecular target of
metformin action still awaits identification. Metformin does not stimulate insulin
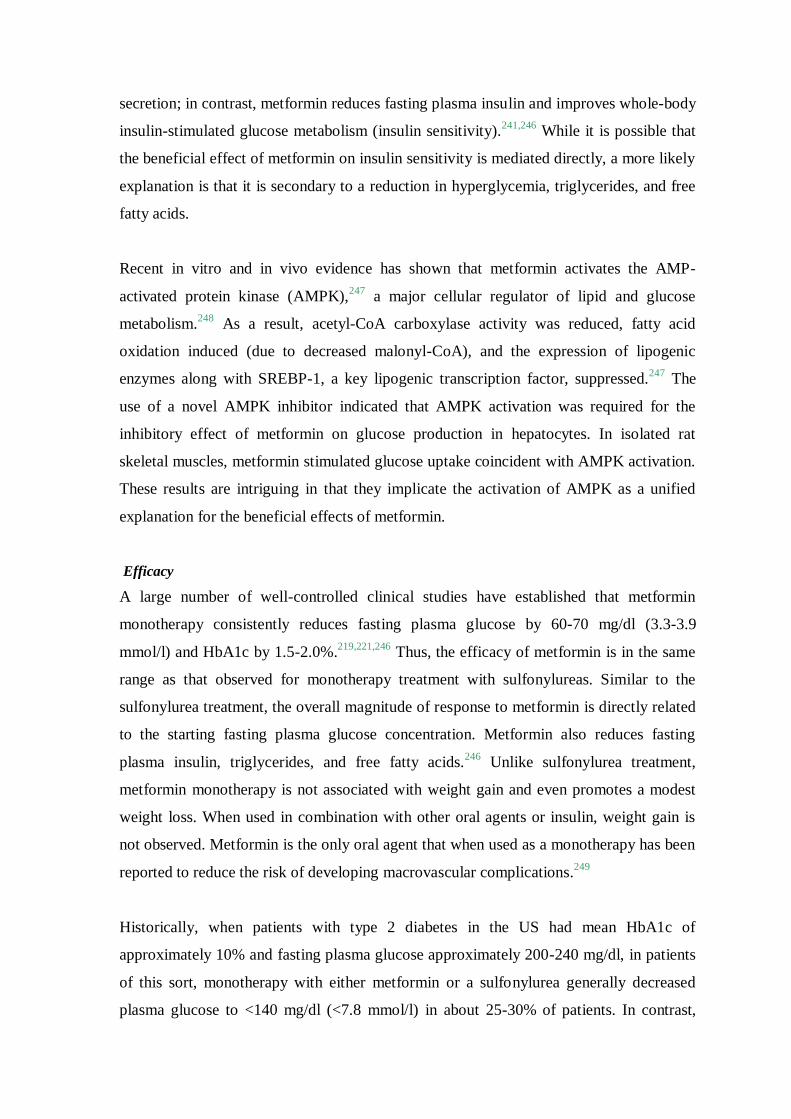
secretion; in contrast, metformin reduces fasting plasma insulin and improves whole-body
insulin-stimulated glucose metabolism (insulin sensitivity).241,246
While it is possible that
the beneficial effect of metformin on insulin sensitivity is mediated directly, a more likely
explanation is that it is secondary to a reduction in hyperglycemia, triglycerides, and free
fatty acids.
Recent in vitro and in vivo evidence has shown that metformin activates the AMP-
activated protein kinase (AMPK),247
a major cellular regulator of lipid and glucose
metabolism.248
As a result, acetyl-CoA carboxylase activity was reduced, fatty acid
oxidation induced (due to decreased malonyl-CoA), and the expression of lipogenic
enzymes along with SREBP-1, a key lipogenic transcription factor, suppressed.247
The
use of a novel AMPK inhibitor indicated that AMPK activation was required for the
inhibitory effect of metformin on glucose production in hepatocytes. In isolated rat
skeletal muscles, metformin stimulated glucose uptake coincident with AMPK activation.
These results are intriguing in that they implicate the activation of AMPK as a unified
explanation for the beneficial effects of metformin.
Efficacy
A large number of well-controlled clinical studies have established that metformin
monotherapy consistently reduces fasting plasma glucose by 60-70 mg/dl (3.3-3.9
mmol/l) and HbA1c by 1.5-2.0%.219,221,246
Thus, the efficacy of metformin is in the same
range as that observed for monotherapy treatment with sulfonylureas. Similar to the
sulfonylurea treatment, the overall magnitude of response to metformin is directly related
to the starting fasting plasma glucose concentration. Metformin also reduces fasting
plasma insulin, triglycerides, and free fatty acids.246
Unlike sulfonylurea treatment,
metformin monotherapy is not associated with weight gain and even promotes a modest
weight loss. When used in combination with other oral agents or insulin, weight gain is
not observed. Metformin is the only oral agent that when used as a monotherapy has been
reported to reduce the risk of developing macrovascular complications.249
Historically, when patients with type 2 diabetes in the US had mean HbA1c of
approximately 10% and fasting plasma glucose approximately 200-240 mg/dl, in patients
of this sort, monotherapy with either metformin or a sulfonylurea generally decreased
plasma glucose to <140 mg/dl (<7.8 mmol/l) in about 25-30% of patients. In contrast,
combined metformin and sulfonylurea therapy increased the percentage of patients who
achieve this level of control to approximately 60-70%.246
When added to a sulfonylurea,
the effects of both agents are additive, consistent with their different mechanisms of
action. Interestingly, in patients that no longer responded to sulfonylurea treatment
(secondary failures) and were removed from treatment, addition of metformin had
minimal effects.250
Thus, in these patients, sulfonylurea treatment was still eliciting an
effect, emphasizing the need to continue treatment with both agents.
While investigating the additive effect of metformin and sulfonylurea therapy, it was
found there was no change in glucose levels when the sulfonylurea was changed to
metformin. However, when the metformin was added, there was a dramatic decrease in
plasma glucose. In fact, this pattern is seen in virtually all studies comparing two oral
agents. This concept is illustrated in figure RL16. When a patient is on drug A and they
are changed to drug B, no improvement in glucose control will be seen. However, if drug
B is added to drug A, there is an improvement. This concept can often be extended by the
addition of drug C, drug D, etc.
Figure RL16: Efficacy when oral agents are used as add-on therapy. When a patient is on
drug A and they are changed to drug B, C, or D, often no improvement in glucose control
will be seen. However, if drug B is added to drug A, there is an improvement. This
concept can often be extended by the addition of drug C, drug D.

Benefits beyond Glucose Control
Cardiovascular Disease
In a retrospective study on the effect of metformin-containing antidiabetic regimens on
all-cause mortality in veterans with Type 2 Diabetes Mellitus, there was a decreased
hazard ratio for all cause mortality for patients taking metformin whether they were also
on other oral agents (0.77 p<0.01 )or on insulin (0.62 p<0.04).251
In the United
Kingdom Prospective Diabetes Study, 10 years after the study was completed, if the
subjects had been on treatment regimens that included metformin there was a reduction in
any diabetes-related end point (21%, P=0.01) myocardial infarction (33%, P=0.005) and
death from any cause (27%, P=0.002).252
In the REACH Registry (Reduction of
Atherothrombosis for Continued Health) 19,691 patients with diabetes and established
atherothrombosis were assessed for the effect of metformin use in circumstances when
the medication would historically be contraindicated. They found the mortality rates
were 6.3% (95% confidence interval [CI], 5.2%-7.4%) with metformin and 9.8% 8.4%-
11.2%) without metformin; the adjusted hazard ratio (HR) was 0.76 (0.65-0.89; P<0.001).
Association with lower mortality was consistent among subgroups, noticeably in patients
with a history of congestive heart failure (HR, 0.69; 95% CI, 0.54-0.90; P=.006), patients
older than 65 years (0.77; 0.62-0.95; P=0.02), and patients with an estimated creatinine
clearance of 30 to 60 mL/min/1.73 m2 (0.64; 95% CI, 0.48-0.86; P=.003) (to convert
creatinine clearance to mL/s/m2, multiply by 0.0167).
253
Side Effects and Contraindications
The most common side effects of metformin are gastrointestinal disturbances (abdominal
discomfort, diarrhea), which occur in approximately 20-30% of patients. These effects are
generally transient, and can be minimized or avoided by careful dose titration. The
incidence of lactic acidosis is rare and occurs with a frequency of 3 cases per 100,000
patient-years. It appears that Metformin probably not as unsafe as previously thought.
25% of users have relative contraindication and yet lactic acidosis remains rare.254
In
addition, the patients who do develop lactic acidosis usually have acute renal failure and
previously had normal renal function.255
However, metformin is contraindicated in patients with impaired renal function and liver
disease.

The risk of lactic acidosis can be minimized when the following are considered:
1. Withhold in conditions predisposing to renal insufficiency and/or hypoxia
• CV collapse
• Acute MI or acute CHF
• Severe infection
• Use of iodinated contrast material
• Major surgical procedures
2. Officially, Metformin should not be prescribed for patients with:
• Renal dysfunction [e.g. Scr >1.5 mg/dl (males), >1.4 mg/dl (females) or
abnormal CrCl)
• Liver dysfunction
• History of alcohol abuse/binge drinking
• Acute or chronic metabolic acidosis
With the introduction of the eGFR (estimated glomerular filtration rate) the question of a
cutoff value for using this test for discontinuing metormin has been raised. An eGFR of
36 ml/min per 1.73m 2 would be somewhat neutral to current use.
255 Use of a novel assay
for metformin levels has confirmed that metformin levels are not increased with eGFR
levels as low as 30 ml/min per 1.73m2.256
Vitamin B12 deficiency
Both short and long term use of metformin has been found to decrease vitamin B12
levels. (decreased 4.2-47%).257-262
Metformin is thought to induce malabsorption of
vitamin B12 and intrinsic factor in the ileum, an effect that can be reversed by increased
calcium intake.263-265
Anemia may be minimal to severe (RR author observations).
However, metformin associated vitamin B12 deficiency may present without anemia and
only as a peripheral neuropathy, possibly being misdiagnosed as diabetic neuropathy. It
has been speculated that exhaustion of vitamin B12 stores usually occurs after twelve to
fifteen years of absolute and as metformin has been available in the United States for
approximately fifteen years these clinical findings may now be coming to light.266

2.1.10.4. Thiazolidinediones: Pioglitazone and Rosiglitazone
Pioglitazone (Actos) and rosiglitazone (Avandia) are members of the thiazolidinedione
class of insulin sensitizing compounds originally discovered and characterized for their
glucose- and lipid-lowering activity.267,268
These compounds decrease insulin resistance
and enhance the biological response to endogenously produced insulin, as well as insulin
administered by injection.269-271
Until September 23, 2010, each drug was approved for
use in the US as monotherapy, which results in a significant reduction in fasting plasma
glucose by 60-80 mg/dl and in HbA1c by 1.4-2.6%.269
In addition, pioglitazone is
approved for use in combination with insulin, metformin, or a sulfonylurea, and
rosiglitazone is approved for use in combination with metformin or a sulfonylurea.
Troglitazone (Rezulin), another member of this chemical class, was withdrawn from US,
European, and Japanese markets in 2000 due to idiosyncratic hepatic reaction leading to
hepatic failure and death in some patients. Although there are some data from animal
studies suggesting that hepatic toxicity might be characteristic of the thiazolidinedione
class,272
current clinical evidence indicates that pioglitazone and rosiglitazone treatment
do not result in liver toxicity.270,273-275
As of September 2010, as a result of cardiovascular
concerns (see below) Rosiglitazone was removed from the European market and use in
the United States was restricted by the FDA. Use of rosiglitazone was restricted to
patients who could not use any other medication. In addition, the patient must be
informed about the potential cardiovascular risks.276
Figure RL17: Chemical structures of Rosiglitazone and Pioglitazone
Mechanism of Action
The primary effects of pioglitazone and rosiglitazone (Figure RL17) are the reduction of
insulin resistance and improvement of insulin sensitivity, resulting in a reduction of

fasting plasma glucose, insulin, and free fatty acids.269,277-280
Unlike other existing anti-
diabetic medications that possess a very rapid onset of activity, pioglitazone and
rosiglitazone exhibit a characteristic delay from 4-12 weeks in the onset of their
therapeutic benefits. This is likely related to their mode of action, which involves the
regulation of gene expression.250,281,282
Pioglitazone and rosiglitazone are selective
agonists for the peroxisome proliferator-activated receptor γ (PPARγ), a member of the
superfamily of nuclear hormone receptors that function as ligand-activated transcription
factors.283,284
The PPAR family, which also includes PPARα and PPARδ, functions as
receptors for fatty acids and their metabolites (e.g. eiconasoids) and, consequently, plays
a critical physiological role in the regulation of glucose, fatty acid, and cholesterol
metabolism. PPARα is the receptor for the fibrate class of lipid-lowering drugs, and
PPARδ is involved in the regulation of high-density lipoprotein metabolism.284,285
The structure-activity relationship between PPARγ agonists and their glucose lowering
activity in vivo has been established.286
In the absence of ligand, PPARs bind as
heterodimers with the 9-cis retinoic acid receptor (RXR) and a multi-component co-
repressor complex to a specific response element (PPRE) within the promoter region of
their target genes.284,287
Once PPAR is activated by ligand, the co-repressor complex
dissociates allowing the PPAR-RXR heterodimer to associate with a multi-component co-
activator complex resulting in an increased rate of gene transcription. The target genes of
PPARγ include those involved in the regulation of lipid and carbohydrate metabolism.288-290
It does not appear that rosiglitazone and pioglitazone improve insulin sensitivity and
glucose disposal by direct effects on either liver or muscle. PPARγ is expressed chiefly in
adipose tissue, and its expression in liver and skeletal muscle is low.291,292
Thus, it is more
likely that the primary effects of these drugs are on adipose tissue, followed by secondary
benefits on other target tissues of insulin.293
The ability of rosiglitazone and pioglitazone
to decrease circulating free fatty acids could lead to an improvement in insulin action in
the periphery.277,278,294,295
More recently, PPARγ agonists have been reported to increase
the expression and circulating level of adiponectin (Acrp30), an adipocyte-derived protein
with insulin sensitizing activity,296,297
in diabetic rodents293
and in patients with type 2
diabetes.298
Recognition of the importance of PPARγ in the overall regulation of
carbohydrate and lipid metabolism along with growing realization that the adipocyte is an
endocrine organ299,300
suggests that investigations in this area will intensify, and perhaps
uncover additional mechanisms by which rosiglitazone and pioglitazone improve insulin
sensitivity and glucose disposal.

Efficacy
Rosiglitazone
The clinical efficacy of rosiglitazone and pioglitazone therapy has been extensively
reviewed.269,270,274,301-305
Two 26-week, double blind, placebo-controlled clinical studies
have established that rosiglitazone monotherapy reduces fasting plasma glucose and
HbA1c in patients with type 2 diabetes.306,307
Treatment with rosiglitazone at 4 mg/day
reduced fasting plasma glucose by approximately 30-45 mg/dl and HbA1c by 0.8-1.0%,
compared with placebo. Treatment with rosiglitazone at 8 mg/day reduced fasting plasma
glucose by approximately 45-65 mg/dl and HbA1c by 1.1-1.5%, compared with placebo
(10;57;87). In patients with type 2 diabetes inadequately controlled with metformin,
rosiglitazone produced a significant reduction in HbA1c compared to metformin
treatment alone (94;95). In another study in which rosiglitazone was directly compared to
a maximum stable dose of glyburide (15 mg/day), rosiglitazone reduced fasting plasma
glucose by 25 mg/dl at 4 mg/day, and 40 mg/dl at 8 mg/day.301
The reduction in HbA 1c
was 0.7% for glyburide, 0.3% for rosiglitazone at 4 mg/day, and 0.5% for rosiglitazone at
8 mg/day.
Pioglitazone
Double blind, placebo-controlled studies with pioglitazone as monotherapy, have
established that this agent reduces fasting plasma glucose HbA1c in patients with type 2
diabetes.274,302,305,308
Patients treated with 15, 30, or 45 mg (once daily) pioglitazone had
significant mean decreases in HbA1c (range -1.00 to -1.60% difference from placebo) and
fasting plasma glucose (-39.1 to -65.3 mg/dl difference from placebo). The decreases in
fasting plasma glucose were observed as early as the second week of therapy; maximal
decreases occurred after 10-14 weeks and were maintained until the end of therapy (week
26). There was no evidence of drug-induced hepatotoxicity, or elevated alanine
aminotransferase activity.
The efficacy and tolerability of pioglitazone in combination with metformin has been
assessed in patients with type 2 diabetes mellitus.309
Patients receiving pioglitazone (30
mg) + metformin had statistically significant mean decreases in HbA1c (-0.83%) and
fasting plasma glucose levels (-37.7 mg/dl) compared with placebo + metformin.
Decreases in fasting plasma glucose levels occurred as early as the fourth week of
therapy, the first time point at which fasting plasma glucose was measured. The

pioglitazone + metformin group had significant mean percentage changes in levels of
triglycerides (-18.2%) and high-density lipoprotein cholesterol (+8.7%) compared with
placebo + metformin. Mean percentage increases were noted in low-density lipoprotein
cholesterol levels (7.7%, pioglitazone + metformin; 11.9%, placebo + metformin) and
total cholesterol (4.1%, pioglitazone + metformin; 1.1%, placebo + metformin), with no
significant differences between groups. In the extension study, patients treated with open-
label pioglitazone + metformin for 72 weeks had mean changes from baseline of -1.36%
in HbA1c and -63.0 mg/dl in fasting plasma glucose. In this study, there was no evidence
of drug-induced hepatotoxicity.
The efficacy and tolerability of pioglitazone in combination with a sulfonylurea has been
also assessed in patients with type 2 diabetes mellitus.310
Patients receiving pioglitazone
(30 mg) + metformin had statistically significant mean decreases in HbA1c (-0.83%) and
fasting plasma glucose levels (-37.7 mg/dl) compared with placebo + metformin.
Decreases in fasting plasma glucose levels occurred as early as the fourth week of
therapy, the first time point at which fasting plasma glucose was measured. The
pioglitazone + metformin group had significant mean percentage changes in levels of
triglycerides (-18.2%) and high-density lipoprotein cholesterol (+8.7%) compared with
placebo + metformin. Mean percentage increases were noted in low-density lipoprotein
cholesterol levels (7.7%, pioglitazone + metformin; 11.9%, placebo + metformin) and
total cholesterol (4.1%, pioglitazone + metformin; 1.1%, placebo + metformin), with no
significant differences between groups. In the extension study, patients treated with open-
label pioglitazone + metformin for 72 weeks had mean changes from baseline of -1.36%
in HbA1c and -63.0 mg/dl in fasting plasma glucose. In this study, there was no evidence
of drug-induced hepatotoxicity.
The efficacy and tolerability of pioglitazone in combination with a sulfonylurea has been
also assessed in patients with type 2 diabetes mellitus,279,311
and others.280
Twenty-three
diabetic patients treated with a stable dose of sulfonylurea were randomly assigned to
receive either placebo (n = 11) or pioglitazone (45 mg/day) (n = 12) for 16 weeks.311
Before and after 16 weeks of treatment, all subjects received a 75-g oral glucose tolerance
test (OGTT) and peripheral insulin sensitivity was measured with a two-step euglycemic
insulin clamp. After 16 weeks pioglitazone treatment significantly decreased fasting
plasma glucose, mean plasma glucose during OGTT, and HbA1c without changing
fasting or glucose-stimulated insulin/C-peptide concentrations. Fasting plasma free fatty
acid (FFA) and mean plasma FFA during OGTT also decreased significantly after

pioglitazone treatment. Pioglitazone treatment significantly decreased endogenous
glucose production, whereas insulin-stimulated total and non-oxidative glucose disposal
was significantly increased indicative of an improvement in hepatic and peripheral
(muscle) tissue sensitivity to insulin. Subsequent work has indicated that pioglitazone at
doses of 30 and 45 mg/day (but not at doses of 7.5 or 15 mg/day) improves β-cell
function along with whole-body insulin sensitivity.279
Side Effects
The major side effects of this class of drugs are edema, weight gain, decreased hematocrit
and hemoglobin, and elevated (but reversible) alanine aminotransferase activity. Unlike
troglitazone, idiosyncratic hepatic reaction does not appear to be a problem with
rosiglitazone or pioglitazone. The edema ranges from bothersome trace to anasarca. The
mechanism of the edema production is not known. Clinically, diuretics have minimal
effect on reducing the edema, though spironolactone may have more benefit than other
diuretics.312
While there are no published studies on this subject, it does appear that the
edema is dose dependent. Weight gain may be a modest 2-4 pounds to >20 pounds.313
Due to their mechanism of action, the risk of hypoglycemia with rosiglitazone or
pioglitazone monotherapy is low. Mild to moderate hypoglycemia has been reported
during combination therapy with sulfonylureas or insulin.314,315
Cardiovascular Disease
A general listing of the cardiovascular effects of thiazolidinediones is shown in Table
RL7. In a meta-analysis by Nissen and Wolski, 161 published literature and clinical trial
registries were searched for cardiovascular end points such as MI and death from
cardiovascular causes. Data were combined by means of a fixed-effect model. Forty-two
trials were selected. In the rosiglitazone group, as compared with the control group, the
odds ratio (OR) for MI was 1.43 (95% CI, 1.03-1.98; P=0.03), and the OR for death from
cardiovascular causes was 1.64 (95% CI, 0.98-2.74; P=0.06). The authors concluded that
rosiglitazone was associated with a significant increase in the risk of MI and with an
increased risk of death from cardiovascular causes that had borderline significance. There
were significant limitations to the study including lack of access to original data, which
would have enabled time-to-event analysis, no confirmation of events, many studies had
only zero or 1 report, and these trials were not designed to capture or adjudicate
events. With correction of some of these limitations, another Meta analysis failed to

show any statistical increased risk.316
Since that time there have been multiple meta
analyses looking at variations of the same data with variable results.
Table RL7: Effects of Thiazolidinediones (pioglitazone/rosiglitazone) on
Cardiovascular Risk Factors
Lipid profile
↑ LDL cholesterol particle size
↑ Lipoprotein a
↑ HDL cholesterol
↓/-- LDL/HDL ratio
↓/↑ Triglycerides
Coagulation and fibrinolysis ↓ Fibrinogen
↓ Platelet aggregation
Hemodynamic and vascular
parameters
↑ Intravascular volume
↓Blood pressure
↓ Intima-media thickness
↑ Endothelial function
↓ Urine albumin excretion
Inflammatory Markers
↓C-reactive protein
↓ Adiponectin
↓ Tumor necrosis factor-α
A meta analysis of cardiovascular events using patient-level data from randomized trials
comparing pioglitazone with a range of alternative regimens317
determined that death,
MI, or stroke occurred in 375 of 8,554 patients (4.4%) receiving pioglitazone and 450 of
7,896 patients (5.7%) receiving control therapy (HR, 0.82; 95% CI, 0.72-0.94; P = .005).
The authors concluded that treatment with pioglitazone was associated with a
significantly lower risk of death, MI, or stroke compared with any of the alternative
regimens. Serious heart failure was increased in patients on pioglitazone, although
without an associated increase in mortality (HR, 1.41; 95% CI, 1.14-1.76; P =0.002).
There have been two prospective, randomized studies specifically looking at
cardiovascular outcome and thiazolidinediones. The study looking at pioglitazone
(PROactive study) failed to show a significant benefit of treatment on the primary
composite end points (hazard ratio [HR], 0.90; 95% confidence interval [CI], 0.80-1.02; P
= 0.095).318
However, pioglitazone reduced risk for the main secondary end points,
including death from any cause, nonfatal MI, and stroke (HR, 0.84; 95% CI, 0.72-0.98; P
= 0.027). Addition of rosiglitazone to glucose-lowering therapy (RECORD Study) was
confirmed to increase the risk of heart failure, but the data remained inconclusive about
any possible effect on myocardial infarction. Rosiglitazone did not increase the risk of
overall cardiovascular morbidity or mortality compared with standard glucose-lowering
drugs.319
Fractures
In 2006, an increased risk of fractures was discovered in subjects receiving rosigliatzone
participating in the ADOPT Study (A Diabetes Outcome and Progression Trial).320
Since
then there have been multiple reports on the association of thizolidenediones and fractures
with a Meta-analysis of 10 randomized controlled trials (13,715 participants) and from 2
observational studies (31679 participants) showed a significant increased risk of fractures
in women (OR 2.23, 95%cl 1.65-3.01; p<.001), but not in men.321
There has been no
explanation for the sex difference, but one may speculate that the age of the men in these
studies is generally younger than one expects to see significant risk of
fractures. Several studies have shown that bone mineral density declines with use of
these medications.322,323
2.1.10.5. α-Glucosidase Inhibitors
Acarbose (Precose, Glucobay) and miglitol (Glycet) are members of the α-glucosidase
inhibitor class of oral anti-hyperglycemic compounds that function by blocking the
enzymatic degradation of complex carbohydrates in the small intestine.324,325
These
compounds lower post-prandial glucose and improve glycemic control without increasing
the risk for weight gain or hypoglycemia. Each drug is approved for use in the US as
monotherapy, which results in a significant reduction in fasting plasma glucose by 25-30
mg/dl, post-prandial glucose by 40-50 mg/dl, and HbA1c by 0.7-1.0%.324,325
In addition,
acarbose is approved for use in combination with insulin, metformin, or a sulfonylurea,
and miglitol is approved for use in combination with a sulfonylurea. The effects of these
compounds on glycemic control are additive when used in combination, presumably since
their mechanism of action is different. Neither drug is approved in the US for use in

combination with a meglitinide or thiazolidinedione. α-glucosidase inhibitors are suitable
approaches for patients that have mild to moderate hyperglycemia, or those patients prone
to hypoglycemia or at risk for lactic acidosis.
Figure RL18: Chemical structure of Acarbose
Mechanism of Action
α-Glucosidase inhibitors are competitive, reversible inhibitors of pancreatic α-amylase
and membrane-bound intestinal α-glucosidase hydrolase enzymes. Acarbose, the first α-
glucosidase inhibitor discovered, is a nitrogen-containing pseudotetrasaccharide (Figure
RL18), while miglitol is a synthetic analog of 1-deoxynojirimycin. The mechanism of
action of these inhibitors is similar but not identical. They bind competitively to the
oligosaccharide binding site of the α-glucosidase enzymes, thereby preventing enzymatic
hydrolysis. Acarbose binding affinity for the α-glucosidase enzymes is: glycoamylase >
sucrase > maltase > dextranase.324,326
Acarbose has little affinity for isomaltase and no
affinity for the β-glucosidase enzymes, such as lactase.324
Miglitol is a more potent
inhibitor of sucrase and maltase that acarbose, has no effect on α-amylase, but does
inhibit intestinal isomaltose.324

Efficacy
Clinical trials conducted to date have established that the antihyperglycemic effectiveness
of acarbose and miglitol is less than 50% than that of either sulfonylureas or metformin.
When used as monotherapy, acarbose primarily affects post-prandial glucose levels,
which is reduced by 40-50 mg/dl after meal.324,325,327-329
In most studies, α-glucosidase
inhibitors have no significant effects on either fasting insulin or whole body insulin
sensitivity in patients with type 2 diabetes. However, there is some evidence that acarbose
and voglibose, a structural analog of miglitol in clinical development in Japan, reduces
post-prandial hyperinsulinemia in glucose intolerant individuals.330,331
Some but not all
studies have reported small decreases in fasting or post-prandial triglycerides.324
Since the
mechanism of action of α-glucosidase inhibitors is different from other oral agents, their
effects on glycemic control are additive when used in combination. As summarized by
Lebovitz171
addition of acarbose to sulfonylurea therapy decreases HbA1c by 0.85%;
addition of acarbose to metformin therapy decreases HbA1c by 0.73%; and addition of
acarbose to insulin therapy decreases HbA1c by 0.54%. As for monotherapy, the
predominant improvement is on post-prandial hyperglycemia. Treatment with α-
glucosidase inhibitors appears to have a lower rate of secondary failures characteristic of
sulfonylurea and metformin therapy.

Side Effects
The major side effects of the α-glucosidase inhibitors are related to gastrointestinal
disturbances. These occur in approximately 25-30% of diabetic patients, and include
flatulence, diarrhea, bloating, and abdominal discomfort. These side effects can often be
minimized by careful dose titration, and sometimes diminish with time. Acarbose is
contraindicated in patients with inflammatory bowel disease, cirrhosis, or elevated plasma
creatinine (>177 μmol/l). This class of drugs is associated with dose-dependent
hepatotoxicity, and serum transaminase levels require monitoring for patients receiving
high doses (>200 mg three times daily). Transaminase elevations, which are often
asymptomatic, are reversible upon cessation of treatment. Hypoglycemia does not occur
in patients on α-glucosidase inhibitor monotherapy. If hypoglycemia occurs while a
patient is taking an α-glucosidase inhibitor simultaneously with a sulfonylurea, insulin or
a meglitinide, the recommended action is oral administration of pure glucose, dextrose or
milk.
2.1.10.6. INCRETINS
The Incretin Effect
The incretin effect, defined by a significantly greater insulin stimulatory effect evoked
after an oral glucose load than that evoked from an intravenous glucose infusion when
plasma glucose concentrations are matched, was first described in the 1960s.332
This
effect is shown below in figure RL19.
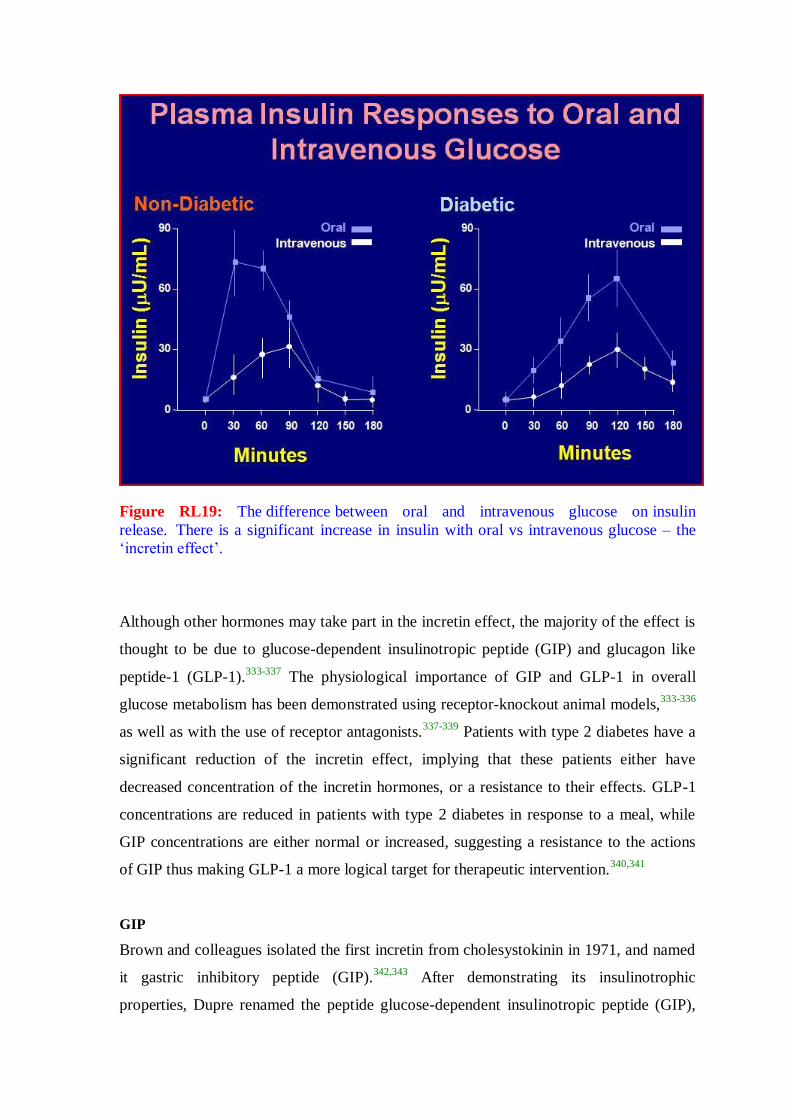
Figure RL19: The difference between oral and intravenous glucose on insulin
release. There is a significant increase in insulin with oral vs intravenous glucose – the
‘incretin effect’.
Although other hormones may take part in the incretin effect, the majority of the effect is
thought to be due to glucose-dependent insulinotropic peptide (GIP) and glucagon like
peptide-1 (GLP-1).333-337
The physiological importance of GIP and GLP-1 in overall
glucose metabolism has been demonstrated using receptor-knockout animal models,333-336
as well as with the use of receptor antagonists.337-339
Patients with type 2 diabetes have a
significant reduction of the incretin effect, implying that these patients either have
decreased concentration of the incretin hormones, or a resistance to their effects. GLP-1
concentrations are reduced in patients with type 2 diabetes in response to a meal, while
GIP concentrations are either normal or increased, suggesting a resistance to the actions
of GIP thus making GLP-1 a more logical target for therapeutic intervention.340,341
GIP
Brown and colleagues isolated the first incretin from cholesystokinin in 1971, and named
it gastric inhibitory peptide (GIP).342,343
After demonstrating its insulinotrophic
properties, Dupre renamed the peptide glucose-dependent insulinotropic peptide (GIP),

thus preserving the acronym.344
Within minutes after ingestion of food, GIP is secreted
from the K-cells located in the proximal region of the jejunum.341,345,346
GIP helps
maintain normal glucose homeostasis in rodent models, and has an insulinotropic effect in
response to hyperglycemia in both animals and humans.333,337,347
However, GIP does not
inhibit glucagon secretion, and in fact may stimulate it during euglycemic states, and has
no effect on gastric emptying.347-349
Furthermore GIP concentrations in patients with type
2 diabetes are either normal, or slightly increased in response to a meal.341,347
In patients
with type 2 diabetes, GIP infusion has not been able to reduce plasma glucose
concentrations, due to a lack of amplification of late phase insulin response to glucose,
compared to GLP-1.347
Thus, GIP has not been considered a suitable candidate for
therapeutic development for the treatment of type 2 diabetes.341
GLP-1
GLP-1 is cleaved from the proglucagon molecule by the gut specific prohormone
convertase enzymes 1 and 3 (Figure RL20).350-352
Two forms of GLP-1 are secreted,
GLP-1(7-37) and GLP-1(7-36)amide.353
The majority of circulating active GLP-1 appears
to be GLP-1(7-36)amide (Figure RL21).354,355
GLP-1 is stored in the L-cells of the ileum
and colon, and released at mealtime in response to neurohormonal signals and the
presence of food in the gut.356-359
GLP-1 exerts its effect on postprandial glucose
concentrations through several mechanisms, including enhancing insulin secretion and
suppressing postprandial glucagon secretion in a glucose-dependent manner.360,361
In
addition GLP-1 slows the rate of gastric emptying, which is often paradoxically
accelerated in patients with diabetes.360,362
GLP-1 also acts as a postprandial satiety signal
through neurohormonal networks that signal the brain to suppress appetite and food
intake.355,363-365
Furthermore, GLP-1 also has direct effects on the β-cells, as shown in
studies done in animal models and cell lines, promoting cell proliferation and neogenesis,
while preventing β-cell apoptosis.366
Additionally, GLP-1 can promote transformation of
noninsulin-producing pancreatic cells into cells capable of synthesizing and secreting
insulin.367-370

Figure RL20: messenger RNA transcript for proglucagon
GLP-1 reportedly has effects on the liver, skeletal muscle as well as the adipose tissue,
resulting in increased glycogen synthesis and peripheral insulin-stimulated glucose
uptake.371-373
However, this effect is considered controversial, as there have been
contradictory observations as well.374,375
GLP-1 receptors are also located in the heart,
and have been associated with cardiovascular response to stress.375-378
Unfortunately in
spite of all the potentially beneficial effects of GLP-1 on glucose homeostasis, the
therapeutic potential of naturally occurring GLP-1 is limited, due to its extremely short
half-life of less than 2 minutes largely due to the degradation by the enzyme dipeptidyl
peptidase IV (DPP-IV).356,379-381

Figure RL21: Active and inactive form of GLP-1(7-36)amide
Administration of exogenous GLP-1, as a continuous subcutaneous or intravenous
infusion, has been shown to increase insulin secretion, and normalize both fasting and
postprandial blood glucose concentrations. As shown in Figure below, an infusion of
GLP-1 in an uppressesic Type 2 paient will reduce the glucose level, increase insulin
levels and suppress glucagon production.
In one of the earliest studies with GLP-1, Gutniak et al. showed that a continuous
intravenous infusion of GLP-1 resulted in a reduction in the amount of insulin needed to
maintain isoglycemia in patients with either type 1 or type 2 diabetes.383
Few years later,
Zander et al., in a non-randomized parallel group study, showed that six weeks of
continuous subcutaneous infusion of GLP-1 not only reduced fasting and postprandial
plasma glucose concentrations, but also lowered glycosylated hemoglobin (A1C) by
1.3%, and induced up to a 2 kg reduction in body weight.360
Juntti-Berggren et. al. reported the first randomized trial with the addition of
subcutaneous infusion of GLP-1 to regular insulin therapy, and compared it with insulin
therapy alone in 12 patients with type 2 diabetes.384
After initial intensive insulin therapy
for 1 week, 8 patients were randomized to receive a subcutaneous infusion of GLP-1
along with injections of regular insulin with meals, and NPH insulin at bedtime, whereas

4 patients were randomized to regular insulin with meals and NPH insulin at bedtime. A
significant reduction in postprandial glucose concentration was observed after one week
of treatment in patients receiving subcutaneous infusion of GLP-1 added to insulin
therapy, compared to insulin therapy alone. Furthermore, an additive lipid-lowering effect
was also observed in the GLP-1 infused patients.384
Figure RL22: Glucose-Dependent Effects of GLP-1 on Insulin and Glucagon Levels in
Patients with Type 2 Diabetes 382
In 2001, Larsen et. al. reported a randomized trial with continuous intravenous infusion of
GLP-1 versus placebo infusion, in 40 hospitalized patients with type 2 diabetes, poorly
controlled with sulfonylurea treatment. Patients received an infusion of GLP-1 at 4 or
8 ng/kg/min for 16 or 24 hours, versus placebo, for 7 days. Patients infused with GLP-1
showed a significant, dose-dependent, reduction in mean 24-hour plasma glucose
concentrations compared with placebo. The fasting and nocturnal plasma glucose
concentration was higher in the 16-h GLP-1 infused patients compared to the 24-h GLP-1
infused patients (Figure RL22). GLP-1 infusion was also associated with a dose related
increase in nausea, headache, and vomiting.385

In another randomized study published in 2003, 16 elderly, insulin-negative patients with
diabetes were divided in two groups of 8 patients each, and given either a continuous
subcutaneous infusion of GLP-1 at an initial dose of 100 pmol/kg/h, titrated up to a
maximum dose of 120 pmol/kg/h for 12 weeks, compared to controls treated with
conventional therapy.386
Concomitant treatment with glucose lowering agents was
discontinued for 1 week prior to study treatment in the group of patients infused with
GLP-1, while the control group continued with their usual glucose lowering therapy
without any dose changes. GLP-1 infusion was well tolerated, without significant side
effects. Hypoglycemia occurred only once in the GLP-1 treatment group, while
hypoglycemic events were frequent in the control group (87 events). No significant
changes in A1C were observed, despite a discontinuation of oral hypoglycaemic
medications in the GLP-1 treated group. There was an enhanced glucose-induced insulin
secretion, as well an in insulin-mediated glucose disposal, in the GLP-1 infused group
compared to controls.386
In 2004, Zander et. al. reported a randomized cross-over trial that evaluated the additive
effect of continuous infusion of GLP-1 and a TZD, pioglitazone, in patients with type 2
diabetes.387
Eight patients with type 2 diabetes were given a saline infusion, continuous
infusion of GLP-1 (4.8 pmol/kg/min), pioglitazone treatment (30 mg), and a combination
treatment with GLP-1 infusion and pioglitazone, in a random order. During the studies
with either saline or GLP-1 only infusions, the patients discontinued their normal
medications for three weeks, with a 2-day washout period between the saline or GLP-1
infusions. During the studies with pioglitazone with or without GLP-1 infusion, all
patients received 30 mg of pioglitazone for 12 weeks and then were randomly assigned to
a 48-hour monotherapy period with either pioglitazone or a combination of GLP-1 with
pioglitazone. A significant drop in fasting plasma glucose (FPG) concentrations in the
GLP-1 only, pioglitazone only, and the combination of pioglitazone with GLP-1 group
were observed compared to saline infusion group. FPG was lower in combination therapy
compared to monotherapy with either agent. Mean insulin concentrations were
significantly higher with GLP-1 compared with pioglitazone. Glucagon concentrations
were reduced in both GLP-1 treated arms compared to saline and pioglitazone treatments,
and a sensation of appetite reduction was also noted in the GLP-1 treatment arms.387
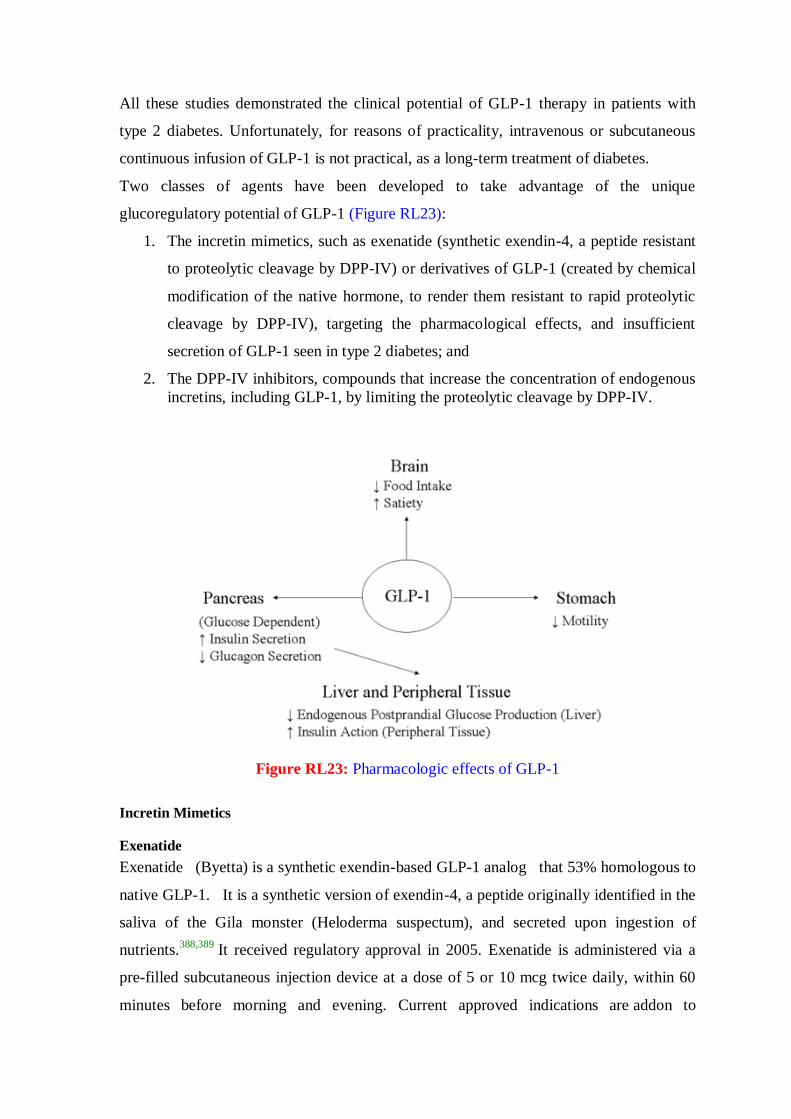
All these studies demonstrated the clinical potential of GLP-1 therapy in patients with
type 2 diabetes. Unfortunately, for reasons of practicality, intravenous or subcutaneous
continuous infusion of GLP-1 is not practical, as a long-term treatment of diabetes.
Two classes of agents have been developed to take advantage of the unique
glucoregulatory potential of GLP-1 (Figure RL23):
1. The incretin mimetics, such as exenatide (synthetic exendin-4, a peptide resistant
to proteolytic cleavage by DPP-IV) or derivatives of GLP-1 (created by chemical
modification of the native hormone, to render them resistant to rapid proteolytic
cleavage by DPP-IV), targeting the pharmacological effects, and insufficient
secretion of GLP-1 seen in type 2 diabetes; and
2. The DPP-IV inhibitors, compounds that increase the concentration of endogenous
incretins, including GLP-1, by limiting the proteolytic cleavage by DPP-IV.
Figure RL23: Pharmacologic effects of GLP-1
Incretin Mimetics
Exenatide
Exenatide (Byetta) is a synthetic exendin-based GLP-1 analog that 53% homologous to
native GLP-1. It is a synthetic version of exendin-4, a peptide originally identified in the
saliva of the Gila monster (Heloderma suspectum), and secreted upon ingestion of
nutrients.388,389
It received regulatory approval in 2005. Exenatide is administered via a
pre-filled subcutaneous injection device at a dose of 5 or 10 mcg twice daily, within 60
minutes before morning and evening. Current approved indications are addon to
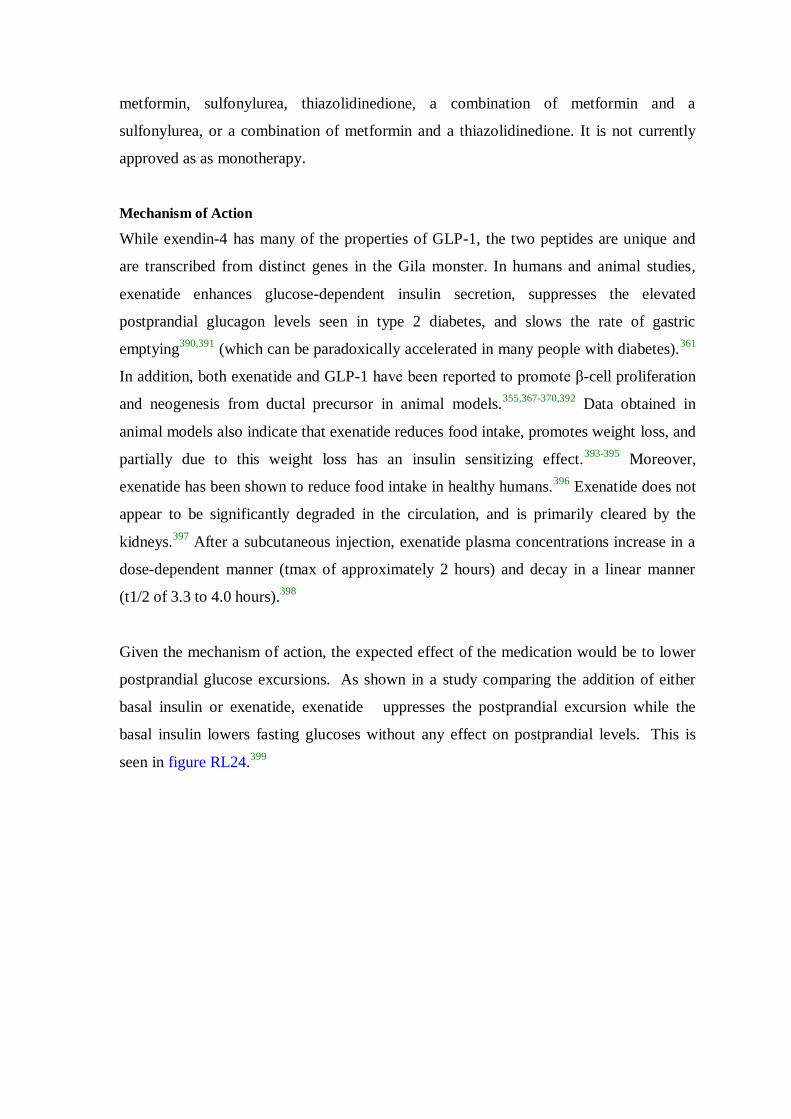
metformin, sulfonylurea, thiazolidinedione, a combination of metformin and a
sulfonylurea, or a combination of metformin and a thiazolidinedione. It is not currently
approved as as monotherapy.
Mechanism of Action
While exendin-4 has many of the properties of GLP-1, the two peptides are unique and
are transcribed from distinct genes in the Gila monster. In humans and animal studies,
exenatide enhances glucose-dependent insulin secretion, suppresses the elevated
postprandial glucagon levels seen in type 2 diabetes, and slows the rate of gastric
emptying390,391
(which can be paradoxically accelerated in many people with diabetes).361
In addition, both exenatide and GLP-1 have been reported to promote β-cell proliferation
and neogenesis from ductal precursor in animal models.355,367-370,392
Data obtained in
animal models also indicate that exenatide reduces food intake, promotes weight loss, and
partially due to this weight loss has an insulin sensitizing effect.393-395
Moreover,
exenatide has been shown to reduce food intake in healthy humans.396
Exenatide does not
appear to be significantly degraded in the circulation, and is primarily cleared by the
kidneys.397
After a subcutaneous injection, exenatide plasma concentrations increase in a
dose-dependent manner (tmax of approximately 2 hours) and decay in a linear manner
(t1/2 of 3.3 to 4.0 hours).398
Given the mechanism of action, the expected effect of the medication would be to lower
postprandial glucose excursions. As shown in a study comparing the addition of either
basal insulin or exenatide, exenatide uppresses the postprandial excursion while the
basal insulin lowers fasting glucoses without any effect on postprandial levels. This is
seen in figure RL24.399
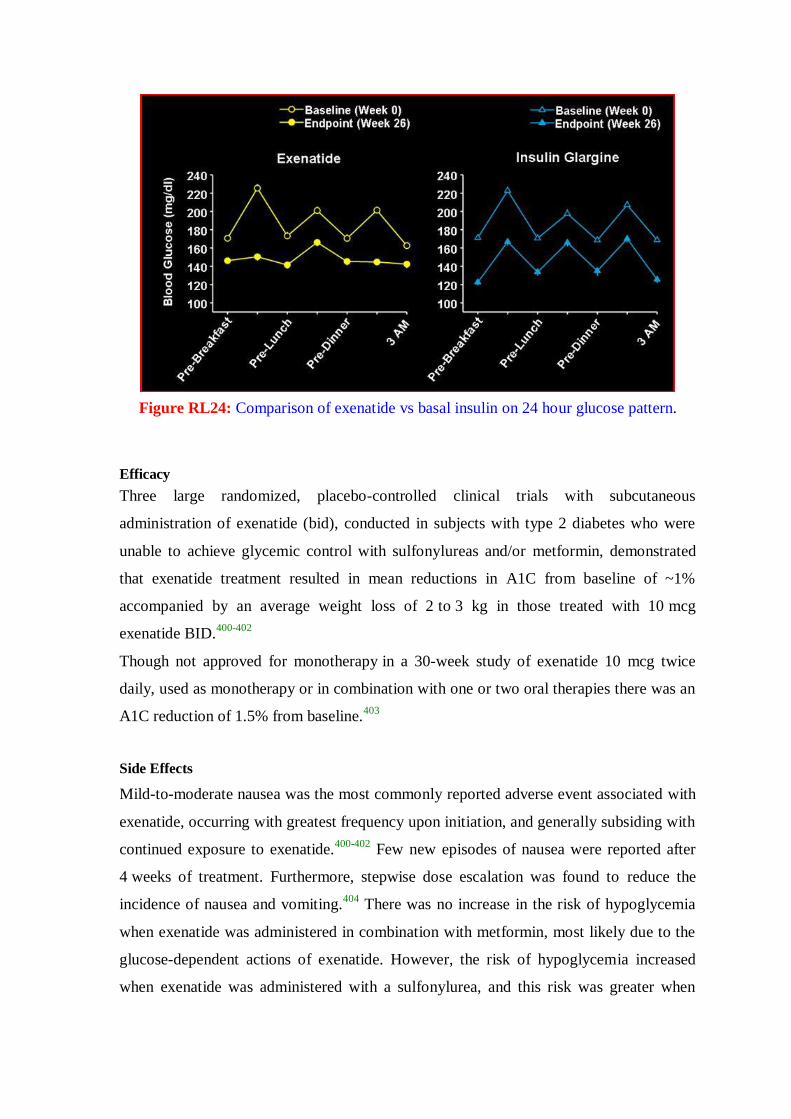
Figure RL24: Comparison of exenatide vs basal insulin on 24 hour glucose pattern.
Efficacy
Three large randomized, placebo-controlled clinical trials with subcutaneous
administration of exenatide (bid), conducted in subjects with type 2 diabetes who were
unable to achieve glycemic control with sulfonylureas and/or metformin, demonstrated
that exenatide treatment resulted in mean reductions in A1C from baseline of ~1%
accompanied by an average weight loss of 2 to 3 kg in those treated with 10 mcg
exenatide BID.400-402
Though not approved for monotherapy in a 30-week study of exenatide 10 mcg twice
daily, used as monotherapy or in combination with one or two oral therapies there was an
A1C reduction of 1.5% from baseline.403
Side Effects
Mild-to-moderate nausea was the most commonly reported adverse event associated with
exenatide, occurring with greatest frequency upon initiation, and generally subsiding with
continued exposure to exenatide.400-402
Few new episodes of nausea were reported after
4 weeks of treatment. Furthermore, stepwise dose escalation was found to reduce the
incidence of nausea and vomiting.404
There was no increase in the risk of hypoglycemia
when exenatide was administered in combination with metformin, most likely due to the
glucose-dependent actions of exenatide. However, the risk of hypoglycemia increased
when exenatide was administered with a sulfonylurea, and this risk was greater when

A1C was closer to normal, and the dose of sulfonylurea was not concomitantly reduced.
The FDA had required addition of two warnings based on post-release reports. In 2008,
the product lable was updated to reflect FDA concern over reports of possible association
of the drug with pancreatitis.405
In November 2009, based on 78 reports of altered renal
function, an alert on possible alteration in function was issued.406
Approximately 45% of patients in these studies developed anti-exenatide antibodies;
however, the presence of antibodies, and/or the magnitude of the antibody titer, were not
associated with an individual patients magnitude of glycemic improvement, nor was there
an association with incidence of adverse events.400-402
Liraglutide
Liraglutide is a once-daily GLP-1 receptor agonist with 97% amino acid sequence
homology to endogenous human GLP- 1 approved for clinical use by the FDA in January
2010. It is administered via a pre-filled subcutaneous injection device at a dose of 0.6 mg,
1.2 mg, or 1.8 mg, independently of meals. Current approved indications are as an adjunct
to diet and exercise.
Efficacy
Liraglutide at daily subcutaneous monotherapy doses of 1.2 and 1.8 mg as monotherapy
decreased HgA1c levels from baseline by 0.84% and 1.14%, respectively, over 52
weeks, achieving significantly greater reductions than sulfonylurea therapy (decrease of
of 0.51%).407
In data from four clinical trials of liraglutide in combination with one or two
oral therapies there were reductions of of HgA1c levels of 1.0% to 1.5% for
liraglutide 1.2 mg (versus placebo), and 1.0% to 1.5% for 1.8 mg (versus placebo).408-
411 In these clinical trials of 26 to 52 weeks, liraglutide 1.2 to 1.8 mg/day produced
weight reductions of 1.0 to 3.2 kg.
Side Effects
In monotherapy or combination therapy trials, the rate of hypoglycemia ranged from 3%
to 12%. There were no episodes requiring assistance from another person. When
combinedwith a sulfonylureas the incidence ranged from 5% to 27% with Six liraglutide-
treated patients requiring assistance.408,409,411
5% to 40% of liraglutide-treated patients complained of nausea but this generally
subsided within the first 4 weeks of use.407,410,411

Antibodies to liraglutide were found in 4% to 13% of subjects and did not appear to
have any significant effect on the HgA1c-lowering efficacy of liraglutide.408-411
2.1.10.7. Dipeptidyl Peptidase IV (DPP-IV) Inhibitors
As described above, DPP-IV inhibitors are compounds that increase the concentration of
endogenous incretins, including GLP-1, by limiting the proteolytic cleavage by DPP-IV.
As shown in Figure , above, GLP-1 is an insulinotropic hormone secreted by L-cells of
the small intestine that stimulates insulin secretion in a glucose-specific manner, inhibits
gastric emptying, suppresses glucagon secretion, and has central anorexic activity.381,412
Although it possesses multiple effective clinical activities, administration of GLP-1 is not
an ideal approach since it cannot be administered orally. Furthermore, endogenous (and
exogenously administered) GLP-1 has undesirable pharmacokinetics; after it is secreted,
it is rapidly cleaved and inactivated [plasma half-life < 1 min]413
by the enzyme
dipeptidyl peptidase IV (DPP-IV). Thus, inhibition of DPP-IV has been suggested as a
feasible alternative to elevate circulating GLP-1 levels, and circumvent the limitations of
GLP-1 administration.413-420
The initial, orally active DPP-IV inhibitor, NVP-DPP728, was identified and
characterized in vitro and in vivo.415,421-423
Inhibition of DPP-IV by NVP-DPP728 resulted in a significantly amplified early phase of
the insulin response to an oral glucose load in obese fa/fa rats, and restoration of glucose
excursions to normal.421
In contrast, DPP-IV inhibition produced only minor effects in
lean FA/FA rats. Inactivation of GLP-1 (7-36) amide was completely prevented by DPP-
IV inhibition suggesting that the effects of this compound on oral glucose tolerance were
mediated by increased circulating concentrations of GLP-1 (7-36) amide.
In DPP-IV(+) [but not in DPP-IV(-)] transgenic rats fed either standard chow or a high-fat
diet, NVP-DPP728 significantly suppressed glucose excursions after glucose challenge by
inhibiting the plasma DPP-IV activity, associated with the stimulation of early insulin
secretion.422
NVP-DPP728 also improved the glucose tolerance after an oral glucose
challenge by potentiating the early insulin response by inhibition of plasma DPP-IV
activity in aged DPP-IV(+) Wistar and F344 rats.423
In contrast, NVP-DPP728 did not
affect the glucose tolerance after an oral glucose challenge in aged DPP-IV(-)F344 rats.423
Taken together, these results indicate that treatment with NVP-DPP728 ameliorates
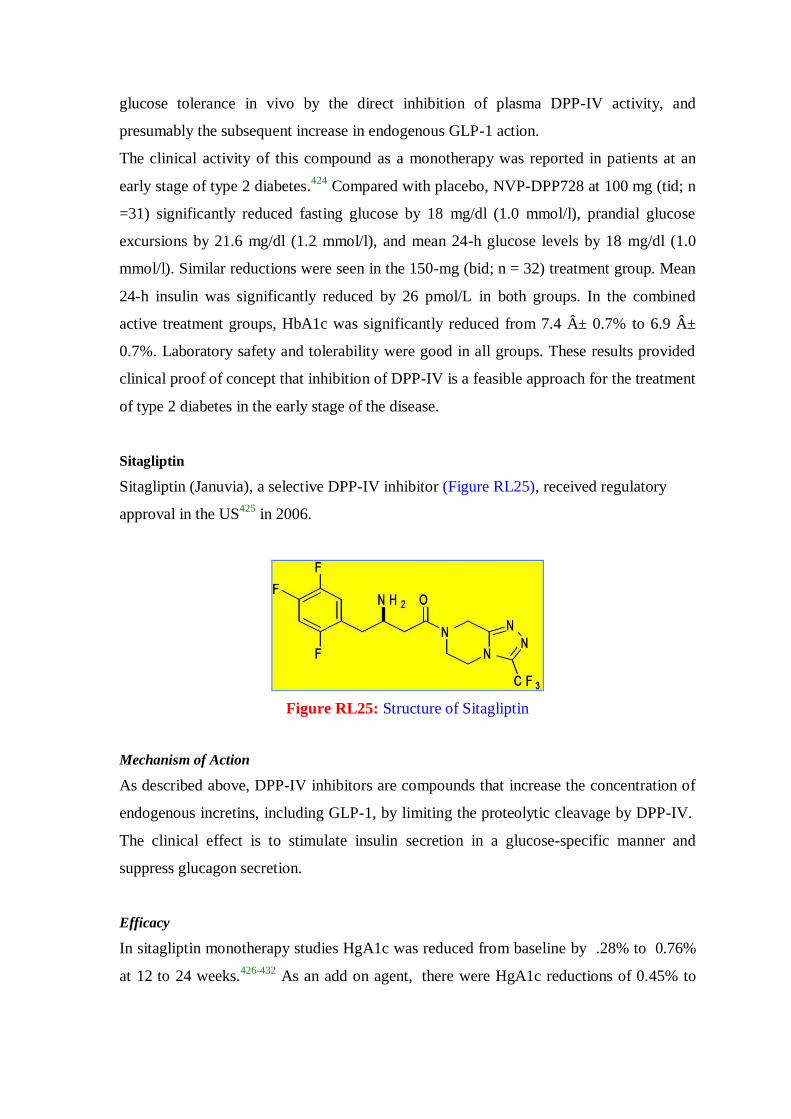
glucose tolerance in vivo by the direct inhibition of plasma DPP-IV activity, and
presumably the subsequent increase in endogenous GLP-1 action.
The clinical activity of this compound as a monotherapy was reported in patients at an
early stage of type 2 diabetes.424
Compared with placebo, NVP-DPP728 at 100 mg (tid; n
=31) significantly reduced fasting glucose by 18 mg/dl (1.0 mmol/l), prandial glucose
excursions by 21.6 mg/dl (1.2 mmol/l), and mean 24-h glucose levels by 18 mg/dl (1.0
mmol/l). Similar reductions were seen in the 150-mg (bid; n = 32) treatment group. Mean
24-h insulin was significantly reduced by 26 pmol/L in both groups. In the combined
active treatment groups, HbA1c was significantly reduced from 7.4 ± 0.7% to 6.9 ±
0.7%. Laboratory safety and tolerability were good in all groups. These results provided
clinical proof of concept that inhibition of DPP-IV is a feasible approach for the treatment
of type 2 diabetes in the early stage of the disease.
Sitagliptin
Sitagliptin (Januvia), a selective DPP-IV inhibitor (Figure RL25), received regulatory
approval in the US425
in 2006.
Figure RL25: Structure of Sitagliptin
Mechanism of Action
As described above, DPP-IV inhibitors are compounds that increase the concentration of
endogenous incretins, including GLP-1, by limiting the proteolytic cleavage by DPP-IV.
The clinical effect is to stimulate insulin secretion in a glucose-specific manner and
suppress glucagon secretion.
Efficacy
In sitagliptin monotherapy studies HgA1c was reduced from baseline by .28% to 0.76%
at 12 to 24 weeks.426-432
As an add on agent, there were HgA1c reductions of 0.45% to

1.0% at 24 to 30 weeks.429-436
In the studies discussed above, there were no significant
effects on weight reported.
Side Effects
As monotherapy, the incidence of hypoglycemic was reported between 0.5% to 2.2%,
with no severe episodes.430-432
When used in combination with a sulfonylurea,
hypoglycemia occurred in 12.2% of patients, but no severe events were reported.433
Gastrointestinal events rarely occur. Headaches (incidence of 1.8% to 5.7%),
nasopharyngitis (2.9% to 9.1%), and upper respiratory tract infection (0% to8.8%) have
been reported.
Saxagliptine
Saxagliptin (Ongyza), a selective DPP-IV inhibitor, received regulatory approval in the
US in 2009.
Figure RL26: Structure of Saxagliptine
Mechanism of Action
As described above, DPP-IV inhibitors are compounds that increase the concentration of
endogenous incretins, including GLP-1, by limiting the proteolytic cleavage by DPP-IV.
The clinical effect is to stimulate insulin secretion in a glucose-specific manner and
suppress glucagon secretion.
Efficacy
When added to a sulfonylurea, Saxagliptin at doses of 2.5 mg and 5 mg, decreased
HgA1c by 0.54% to 0.64%. The same doses decreased HgA1c by 0.66% to 0.94% when
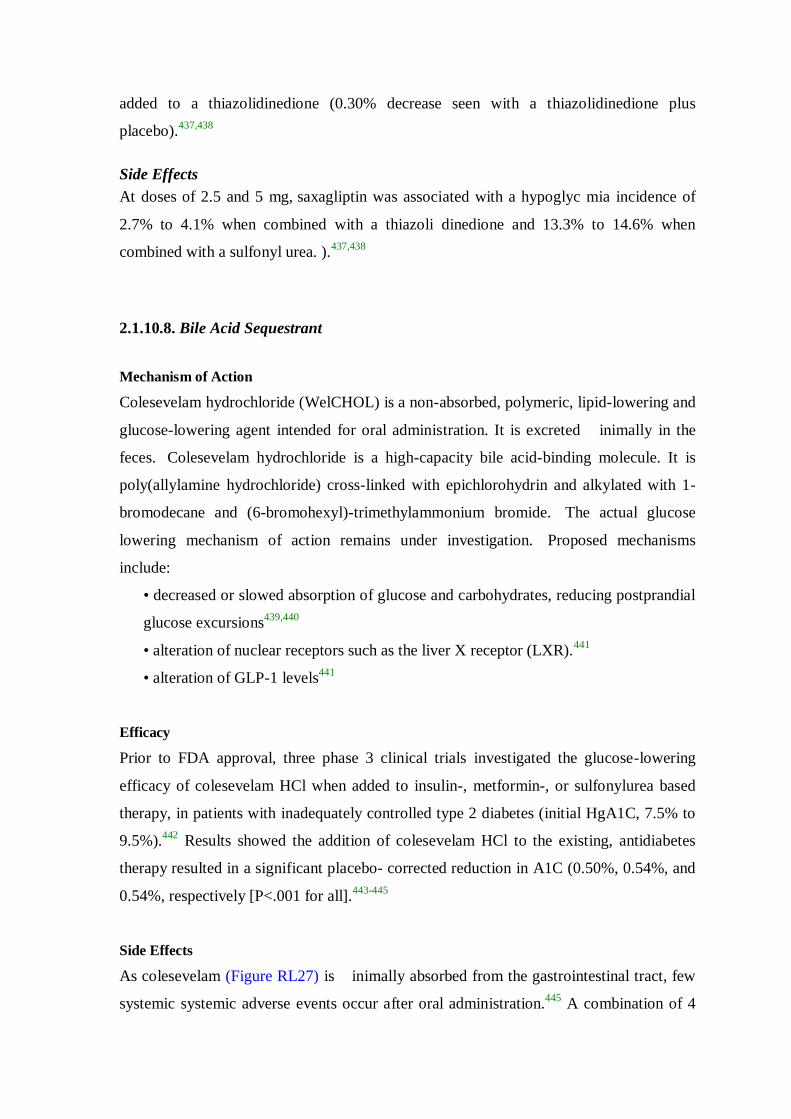
added to a thiazolidinedione (0.30% decrease seen with a thiazolidinedione plus
placebo).437,438
Side Effects
At doses of 2.5 and 5 mg, saxagliptin was associated with a hypoglyc mia incidence of
2.7% to 4.1% when combined with a thiazoli dinedione and 13.3% to 14.6% when
combined with a sulfonyl urea. ).437,438
2.1.10.8. Bile Acid Sequestrant
Mechanism of Action
Colesevelam hydrochloride (WelCHOL) is a non-absorbed, polymeric, lipid-lowering and
glucose-lowering agent intended for oral administration. It is excreted inimally in the
feces. Colesevelam hydrochloride is a high-capacity bile acid-binding molecule. It is
poly(allylamine hydrochloride) cross-linked with epichlorohydrin and alkylated with 1-
bromodecane and (6-bromohexyl)-trimethylammonium bromide. The actual glucose
lowering mechanism of action remains under investigation. Proposed mechanisms
include:
• decreased or slowed absorption of glucose and carbohydrates, reducing postprandial
glucose excursions439,440
• alteration of nuclear receptors such as the liver X receptor (LXR).441
• alteration of GLP-1 levels441
Efficacy
Prior to FDA approval, three phase 3 clinical trials investigated the glucose-lowering
efficacy of colesevelam HCl when added to insulin-, metformin-, or sulfonylurea based
therapy, in patients with inadequately controlled type 2 diabetes (initial HgA1C, 7.5% to
9.5%).442
Results showed the addition of colesevelam HCl to the existing, antidiabetes
therapy resulted in a significant placebo- corrected reduction in A1C (0.50%, 0.54%, and
0.54%, respectively [P<.001 for all].443-445
Side Effects
As colesevelam (Figure RL27) is inimally absorbed from the gastrointestinal tract, few
systemic systemic adverse events occur after oral administration.445
A combination of 4

studies with enrolment of 1129 subjects (567 patients receiving colesevelam; 562 patients
receiving placebo) showed 8.6% Colesevelam vs 2.0% placebo subjects complained of
constipation. There were no differences in nasopharyngitis, dyspepsia, hypoglycemia,
nausea, or hypertension.446
Figure RL27: Structure of Colesevelam
2.1.10.9. Dopamine Agonist
In 2009, bromocriptine mesylate a medication available for many decades, was approved
as an adjunct to diet and exercise to improve glycemic control in adults with type-2
diabetes mellitus. This drug specifically approved was a quick-release preparation
developed by Vero Science Inc, under the trade name Cycloset. Bromocriptine (Figure
RL28), is a centrally-acting dopamine D 2 receptor agonist that had been approved for the
treatment of hyperprolactinemia-associated dysfunctions, acromegaly and Parkinson
disease. The idea of using bromocriptine for the treatment of type-2 diabetes came while
studying the metabolism of migrating birds; that they develop seasonal insulin resistance
and dopamine plays a role in it.
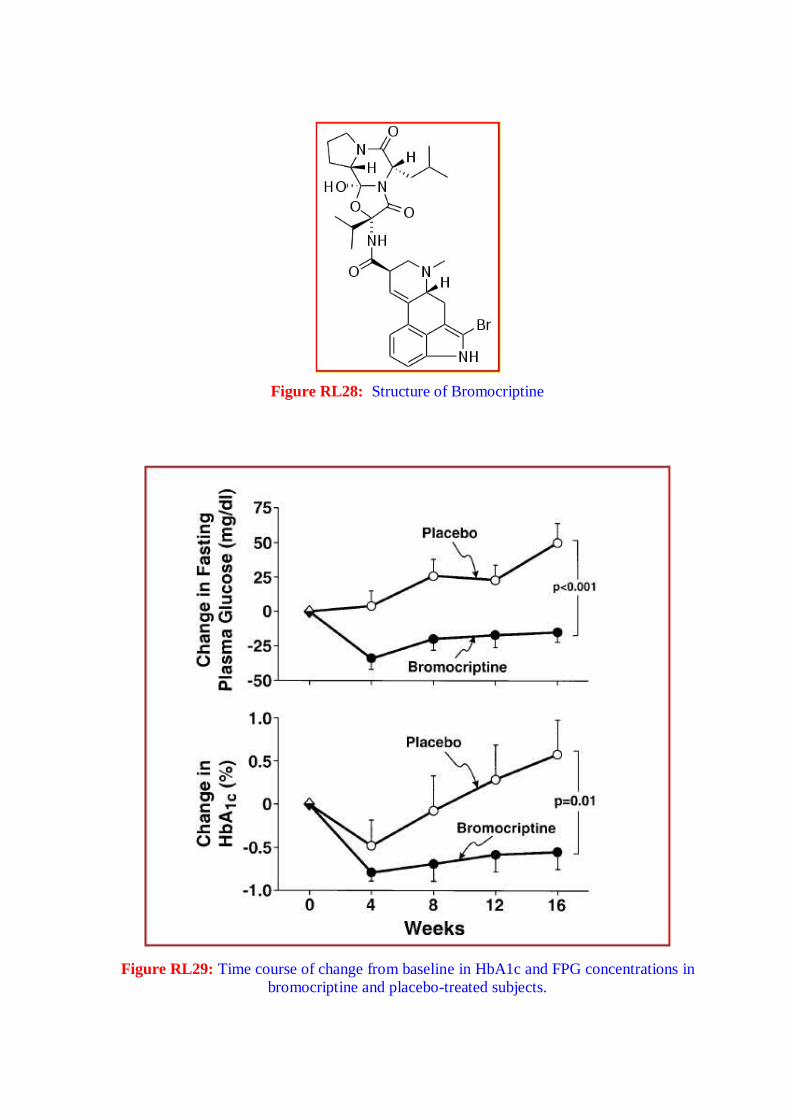
Figure RL28: Structure of Bromocriptine
Figure RL29: Time course of change from baseline in HbA1c and FPG concentrations in
bromocriptine and placebo-treated subjects.

Mechanism of Action
Based on insulin-glucose clamp studies, the beneficial effect of bromocriptine on glucose
homeostasis does not appear to be related to enhanced insulin-mediated glucose disposal
or a reduction in basal endogenous glucose production. Potential unexplored mechanisms
by which bromocriptine reduces the mean daylong plasma glucose levels include
enhanced suppression of endogenous glucose production and/or increased splanchnic
glucose uptake after glucose ingestion (Figure RL29).447
Efficacy
As shown in Figure below, an early short placebo control study demonstrated a modest
improvement in fasting glucose and HgA1c levels. In studies filed with the FDA but not
yet published, for the specific preparation, Cycloset, demonstrate minimal change in FBS
and HgA1c from baseline and modest improvement from placebo.
Side Effects
The most common adverse events associated with bromocriptine mesylate are nausea,
fatigue, dizziness, vomiting and headache. Clinical trial data reveal that bromocriptine
mesylate at doses up to 4.8 mg per day was not associated with a different rate of all-
cause adverse events compared with placebo. However, the drug is known to be
associated with Nasal Stuffiness, Nausea, headache, constrictive pericarditis, neuroleptic
malignant syndrome, and hypotension. The incidence of hypoglycemia was 6.9% among
bromocriptine mesylate-treated patients compared with 5.3% of patients receiving
placebo.
In the pooled CYCLOSET phase 3 clinical trials (CYCLOSET N = 2298; placebo N =
1266), adverse events leading to discontinuation occurred in 539 (24%) CYCLOSET-
treated patients and 118 (9%) placebo-treated patients. This between-group difference
was driven mostly by gastrointestinal adverse events, particularly nausea.448
The drug is contraindicated in patients with known hypersensitivity to bromocriptine or
ergot-related drugs. It is also contraindicated in patients with syncopal migraine.
Bromocriptine increases the likelihood of a hypotensive episode among patients with
syncopal migraine. It is also contraindicated in nursing women as it may inhibit lactation.
There are postmarketing reports of stroke in these patients although causality has not been
proven.

2.1.10.10. Amylin analog
Pramlintide
The hormone amylin (Figure RL30) is cosecreted with insulin by the pancreatic beta-cells
in response to nutrient stimuli.449,450
Patients with type 1 diabetes may develop an
absolute deficiency of both insulin and amylin,451
and those with type 2 DM have
impaired beta-cell secretion amylin in response to a meal.452
Amylin suppresses postprandial arginine-induced glucagon secretion453
and slowed
gastric emptying time.454
Pramlintide (Figure RL30) is a Soluble Analog of Human
Amylin allowing clinical application of this hormone.
Figure RL30: Structure of Human Amylin and Pramlintide
Mechanism of Action
Pramlintide, an injectable synthetic analog of amylin, slows gastric emptying, attenuates
postprandial glucagon secretion, enhances satiety, and reduces food intake.455-457
Efficacy
When added to preprandial insulin, pramlintide improves post-prandial glucose control
and promotes weight loss in patients with both type 1 and type 2 diabetes.458-464
As
shown in figure RL31, postprandial glucose excursions are significantly blunted with the
addition of pramlitide. Effects on HgA1c reduction are modest, with 52 week net
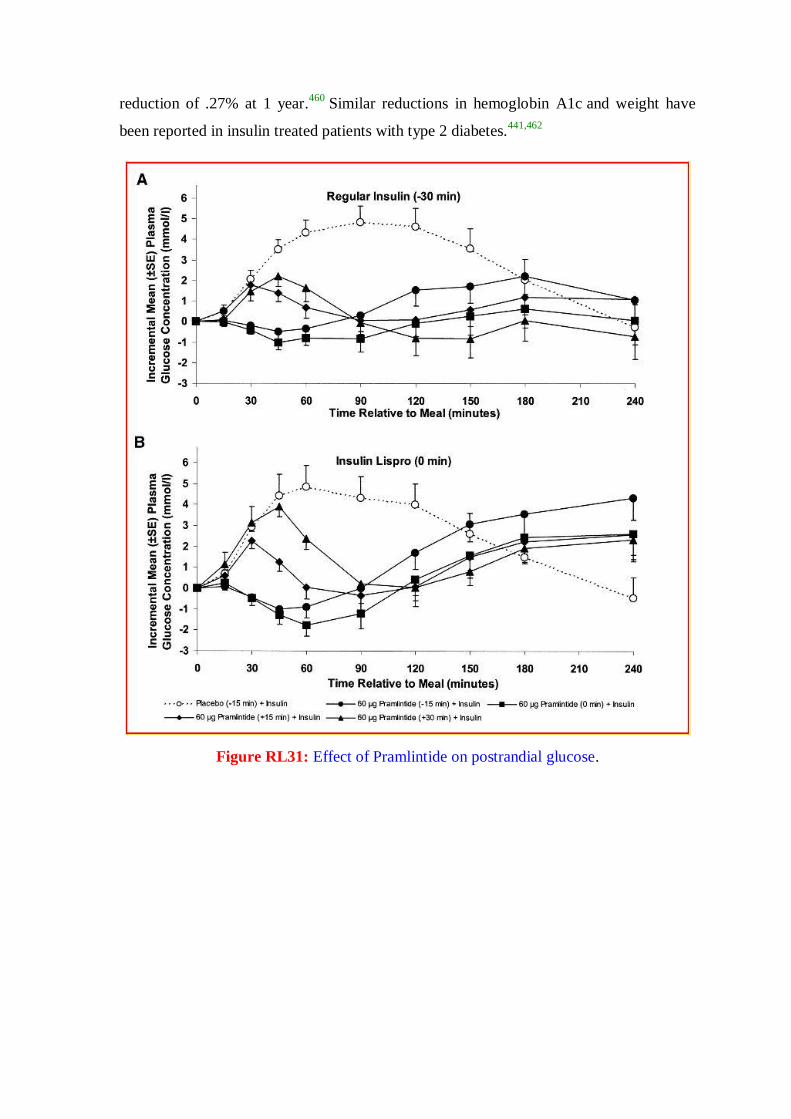
reduction of .27% at 1 year.460
Similar reductions in hemoglobin A1c and weight have
been reported in insulin treated patients with type 2 diabetes.441,462
Figure RL31: Effect of Pramlintide on postrandial glucose.

Figure RL32: Comparison of postprandial insulin and pramlintide on glucoses and weight.
Pramlitide has also been used as a premeal injection without concurrent premeal insulin
in Type 2 diabetes. In preliminary studies, when compared to patients receiving
preprandial insulin, these patients were able to achieve similar glucose control with less
hypoglycemia and without the weight gain seen with preprandial insulin (Figure
RL32).465
Side Effects
To date, there have not been any significant reports of toxicity to any major organs,
significant elevation in laboratory test, alteration in vital signs, electrocardiographic
parameters, or physical exams. Overall, nausea, vomiting, and anorexia were the most
frequently reported adverse drug events associated with pramlintide therapy. Rates of
nausea were generally16.5- 25% (pramlintide) vs 9.5- 16% (control group). In patients
with type 1 DM these symptoms were mild to moderate and transient (within the first 4-8
weeks). The findings were similar in patients with type 1 and those with type 2 DM.464,466
2.1.10.11. Emerging Approaches
The development pipeline for new oral therapeutic agents for type 2 diabetes is
encouraging and continues to expand. These intensive research and development efforts
are in response to the increasing prevalence of the disease and related co-morbidities,
realization by care givers that successful glycemic control will likely require combination
therapy, a growing understanding of the pathophysiology of the disease, and the
identification and validation of new pharmacological targets. These targets include
receptors and enzymes that: enhance glucose-stimulated insulin secretion, suppress
hepatic glucose production, increase skeletal muscle glucose transport and utilization,

increase insulin sensitivity and intracellular insulin signaling, and reduce circulating and
intracellular lipids.126,277,278
Due to their promise for future clinical success and because
they exhibit mechanisms of action distinct from current therapies, two such emerging
approaches are highlighted here.
Selective Cannabinoid-1 Receptor (CB-1) Antagonism
The appetite-stimulating actitivity of Cannabis sativa has long been known through
traditional recreational and medicinal use.467,468
The active molecule, delta-9-
tetrahydrocannabinol (THC), was initially purified in 1964,469
but the discoveries of
cannabinoid receptors and their endogenous ligands did not occur until more recently,
within the last 15 years.470
The endocannabinoid system is composed of two distinct G-
protein-coupled cannabinoid receptors (CB1 and CB2), two major endogenous ligands
(anandamide and 2-arachidonyl glycerol), and the enzymes responsible for ligand
synthesis (N-acylphosphatidylethanolamine-specific phospholipase D and diacylglycerol
lipase) and degradation (fatty acid amide hydrolase and monoacylglycerol lipase). CB1
receptors are widely distributed on central and peripheral neurons, and also present in
adipose tissue, liver, muscle, pancreas, heart, vasculature, and the gastrointestinal
tract.470,471
The distribution of CB2 receptors is more limited, where they are mainly
associated with the immune system and hematopoisesis.470,471
Ligand stimulation of the
receptors results in decreased adenylate cyclase activity and cAMP production, along
with a reduction in intracellular calcium.
The endocannabinoid system was identified as playing a significant role in the regulation
of food intake and energy metabolism. There is some evidence that the endocannabinoid
system is consituitively active in certain regions of the brain that are known to control
energy balance, suggesting that tonic activation favors energy intake, storage, and weight
gain.472
In rodents, activation of CB1 (but not CB2) receptors by endogenous ligands or
THC stimulates feeding,473-475
while CB1-deficient mice are protected against diet-
induced obesity.476,477
In human obesity, it has been reported that fatty acid amide
hydrolase, the enzyme that degrades anandamide, is reduced,478
and that a missense
mutation is associated with increased body mass index.479
Taken together, these data have
provided the scientific rationale for the idea that pharmacological antagonists of CB1
might offer a promising approach to treat obesity.

Rimonabant is a selective CB1 receptor antagonist for obesity and smoking cessation.480-
483 Animal studies have convincingly demonstrated that this compound exerts a beneficial
effect on reducing hunger, caloric intake, and body weight, and for increasing satiety.483
In humans, rimonabant was equally effective as judged by initial clinical studies,484-487
but due to concern over its depressive side effects, the drug was not approved for use in
the United States and after initial approval in Europe was removed from the market.
Nevertheless, this mechanism of action may be utilized in the future.
Despite the magnitude of the disease, the choice of oral antihyperglycemic drugs for type
2 diabetes was limited to sulfonylureas for over 40 years. The last 11 years have
witnessed the introduction of five new classes of oral antihyperglycemic therapies. Each
possesses a distinct mechanism of action, which enables their use independently and, in
some cases, as combination therapy. This is important since most patients with type 2
diabetes will require combination therapy to reach an acceptable level of glycemic
control.488
However, despite these advances; there is still plenty of room and necessity for
improvement.
The successful long-term management (and hopefully prevention) of type 2 diabetes and
its related co-morbidities undoubtedly requires an aggressive, comprehensive approach.
This includes intervention at the pre-diabetes stage (e.g. obesity, impaired glucose
tolerance) including both changes in lifestyle (i.e. dietary modification and exercise),
along with pharmacological intervention that might delay or even prevent the
development of the disease and /or its complications. However, once the disease is
established and beyond the control of lifestyle modifications, treatment must be initiated
and carefully monitored using existing drugs that address the current understanding of the
pathophysiology: impaired insulin secretion, increased hepatic glucose production, and
peripheral tissue insulin resistance. It is anticipated that emerging agents will also have a
beneficial impact on these processes, but with greater efficacy and safety due to a higher
degree of selectivity for their molecular targets. In addition, new information regarding
the biochemistry, cell biology, and pathophysiology of the disease process is rapidly
providing additional exciting opportunities for target identification, validation and
subsequent drug development.
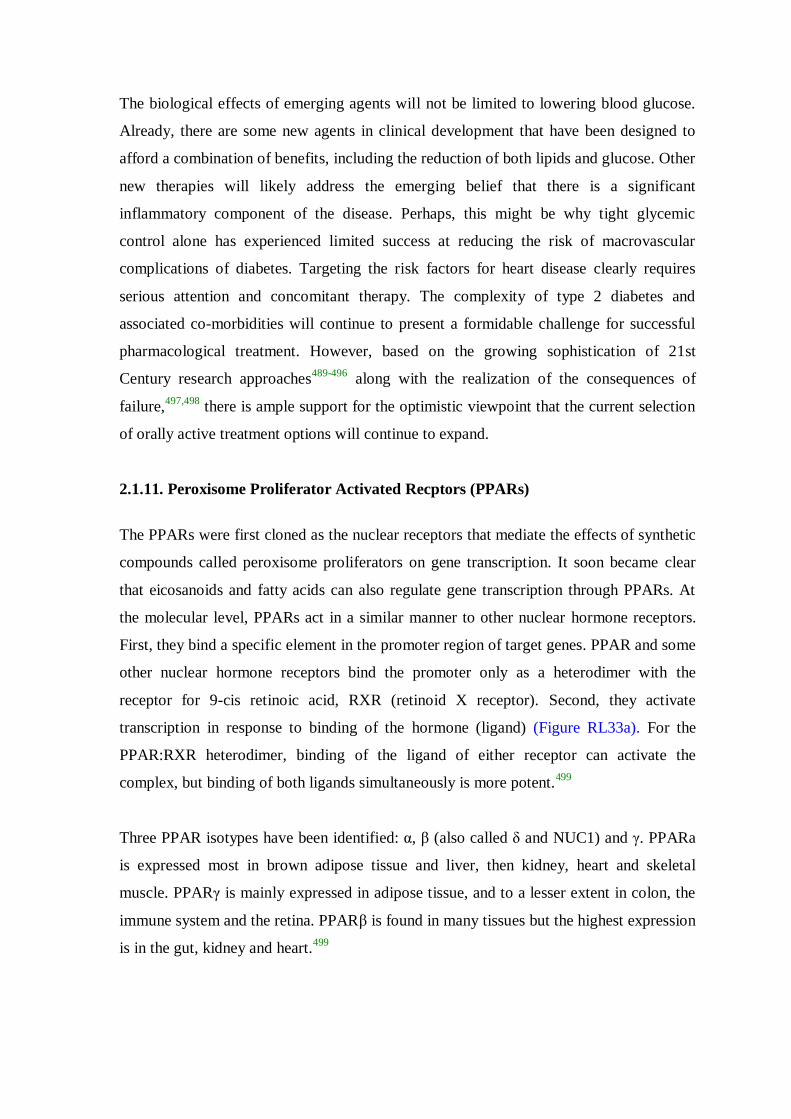
The biological effects of emerging agents will not be limited to lowering blood glucose.
Already, there are some new agents in clinical development that have been designed to
afford a combination of benefits, including the reduction of both lipids and glucose. Other
new therapies will likely address the emerging belief that there is a significant
inflammatory component of the disease. Perhaps, this might be why tight glycemic
control alone has experienced limited success at reducing the risk of macrovascular
complications of diabetes. Targeting the risk factors for heart disease clearly requires
serious attention and concomitant therapy. The complexity of type 2 diabetes and
associated co-morbidities will continue to present a formidable challenge for successful
pharmacological treatment. However, based on the growing sophistication of 21st
Century research approaches489-496
along with the realization of the consequences of
failure,497,498
there is ample support for the optimistic viewpoint that the current selection
of orally active treatment options will continue to expand.
2.1.11. Peroxisome Proliferator Activated Recptors (PPARs)
The PPARs were first cloned as the nuclear receptors that mediate the effects of synthetic
compounds called peroxisome proliferators on gene transcription. It soon became clear
that eicosanoids and fatty acids can also regulate gene transcription through PPARs. At
the molecular level, PPARs act in a similar manner to other nuclear hormone receptors.
First, they bind a specific element in the promoter region of target genes. PPAR and some
other nuclear hormone receptors bind the promoter only as a heterodimer with the
receptor for 9-cis retinoic acid, RXR (retinoid X receptor). Second, they activate
transcription in response to binding of the hormone (ligand) (Figure RL33a). For the
PPAR:RXR heterodimer, binding of the ligand of either receptor can activate the
complex, but binding of both ligands simultaneously is more potent.499
Three PPAR isotypes have been identified: α, β (also called δ and NUC1) and γ. PPARa
is expressed most in brown adipose tissue and liver, then kidney, heart and skeletal
muscle. PPARγ is mainly expressed in adipose tissue, and to a lesser extent in colon, the
immune system and the retina. PPARβ is found in many tissues but the highest expression
is in the gut, kidney and heart.499

Figure RL33a: PPAR at the basic level. Basic mechanism of action of nuclear hormone
receptors. Nuclear hormone receptors bind to a specific sequence in the promoter of target
genes (called hormone response elements), and activate transcription upon binding of
ligand. Several nuclear hormone receptors, including the retinoic acid receptor, the
vitamin D receptor and PPAR, can bind to DNA only as a heterodimer with the retinoid X
receptor, RXR, as shown.
Figure RL33b: Chemical structures of some PPARα and PPARγ ligands

PPARs are ligand-dependent transcription factors: activation of target gene transcription
depends on the binding of the ligand to the receptor. Some ligands are shared by the three
isotypes, such as polyunsaturated fatty acids and probably oxidized fatty acids. Several
compounds bind with high affinity to PPARα, including long-chain unsaturated fatty
acids such as linoleic acid, branched, conjugated and oxidized fatty acids such as phytanic
acid and conjugated linolenic acid, and eicosanoids such as 8S-HETE and leukotriene
(LT) B4499-502
(Figure RL33b). This last compound is particularly interesting, as a
membrane receptor for LTB4 has also been cloned. The functional relationship between
these two types of receptor is not clear. The prostaglandin 15-deoxy-D12,14
-prostaglandin
J2 is the most potent natural ligand of PPARγ, but the extent to which its in vivo effects
are mediated through PPARγ is not known.503
2.1.11.1. PPAR function at the cellular level
Much of the function of PPARs can be extrapolated from the identity of their target
genes, which so far all belong to pathways of lipid transport and metabolism. PPARα has
mostly been studied in the context of liver parenchymal cells, where it is highly
expressed. The target genes of PPARα are a relatively homogenous group of genes that
participate in aspects of lipid catabolism such as fatty acid uptake through membranes,
fatty acid binding in cells, fatty acid oxidation (in microsomes, peroxisomes and
mitochondria) and lipoprotein assembly and transport (Figure RL34). Whereas PPARα
operates in the catabolism of fatty acids in the liver, PPARγ influences the storage of fatty
acids in the adipose tissue (Figure RL34).With the C/EBP transcription factors, PPARγ is
part of the adipocyte differentiation programthat induces the maturation of pre-adipocytes
into fat cells.504
Most of the PPARγ target genes in adipose tissue are directly implicated
in lipogenic pathways, including lipoprotein lipase (LPL), adipocyte fatty acid binding
protein (A-FABP or aP2), acyl-CoA synthase and fatty acid transport protein (FATP).
2.1.11.2. PPARs in whole body physiology
The role of these transcription factors in whole body human physiology and metabolism
can best be illustrated by comparing two opposite nutritional states: early absorptive
period or fed state and late post-absorptive period or fasting state. In the fed state, which
in humans is up to 4 h after a large meal, carbohydrates and fat enter the circulation in the
form of glucose and chylomicrons, respectively (Figure RL35a). Most glucose is taken up

by the liver and, if glycogen stores are already filled, used for lipogenesis. The amount of
the transcription factor sterol response element binding protein 1 (SREBP1, also called
ADD1) rises in the fed state, which promotes the glycolytic conversion of glucose into
acetyl-CoA and subsequently the synthesis of fatty acids from acetyl-CoA8,9. Fatty acids
are converted to triglycerides and packaged into very low density lipoproteins (VLDL).
Figure RL34: Action of PPARα and PPARγ at the cellular level. PPARα stimulates
oxidation of fatty acids in various organelles, such as mitochondria, peroxisomes and
microsomes. It also stimulates uptake of fatty acids and synthesis of lipoproteins. PPARγ
stimulates lipolysis of circulating triglycerides and the subsequent uptake of fatty acids
into the adipose cell. It also stimulates binding and activation of fatty acids in the cytosol,
events that are required for synthesis of triglycerides. FA: fatty acid; HDL: high density
lipoprotein.
In adipose tissue, the amounts of SREBP and PPARγ are elevated, probably because of
regulation by insulin.505
PPARγ is a direct target gene of SREBP,506
which emphasizes
the cooperative and additive functions between these two types of receptor. In addition,
SREBP1 may be involved in producing an endogenous ligand (probably fatty acid) for
PPARγ. The overall effect is stimulation of the uptake of glucose and fatty acids, and
their subsequent conversion to triglycerides.

Triglyceride storage causes increased production of the hormone leptin in the adipose
tissue. Leptin is the protein product of the ob gene, whose deletion leads to severe obesity
in mice. Its expression is increased by long-term overfeeding as part of a feedback
mechanism to limit further food intake andweight gain. Consistent with the role of
PPARγ in promoting lipogenesis, production of leptin in adipose tissue is under negative
control by PPARγ. Paradoxically, expression of both PPARγ and leptin is reduced by
fasting and increased by feeding. In the latter case, PPARγ may attenuate the increase in
leptin expression to limit wasteful lipolysis and fatty acid oxidation, processes which are
stimulated by leptin.507
If the above scenario is correct, decreased PPARγ expression may
lead to increased leptin levels and, as a result, to lower food intake and weight gain.
Studies with PPARγ+/- mice indicate that this is the case.508
A different situation exists in
the late post-absorptive or fasting state (Figure RL35b). In the liver, fatty acids are
oxidized to acetyl-CoA and subsequently to ketone bodies, such as acetoacetate and β-
hydroxybutyrate. Both processes are strongly stimulated by PPARα, expression of which
is elevated upon fasting.507
Fatty acids are ligands for PPARs, so it is possible that the
large amounts of fatty acids liberated from the adipose tissue can stimulate their own
metabolism by activating PPARα. Experiments with PPARα null mice show that PPARα
is important in the hepatic response to fasting. When fasting, these mice suffer from a
defect in fatty acid oxidation and ketogenesis, resulting in elevated plasma free fatty
acids, hypoketonaemia, hypothermia and hypoglycaemia.509,510
The hypoglycaemia
emphasizes the important interplay between fatty acid and glucose metabolism in energy
homeostasis.
In adipose tissue, expression of SREBP and PPARγ is low under fasting conditions.
Under a strong adrenergic stimulus, triglycerides are hydrolysed to fatty acids and
glycerol, but some of the released fatty acids are re-esterified to triglycerides, in a
reaction that requires synthesis of glycerol from gluconeogenic precursors. The rate-
limiting step for glyceroneogenesis is catalysed by phosphoenolpyruvate carboxykinase,
whose transcription is positively controlled by PPARγ. Thus, even under highly catabolic
conditions such as fasting, lipogenesis continues and is dependent upon PPARγ.
2.1.11.3. Therapeutic potential of PPAR ligands
In developed societies, metabolic disorders such as hyperlipidaemia, atherosclerosis,
diabetes and obesity rarely occur in isolation, but are usually part of a complex phenotype
of metabolic abnormalities called syndrome X. Synthetic agonists for both PPARα
(fibrates) and PPARγ (thiazolidinediones; TZDs) are useful in the treatment of the
diseases that are part of this syndrome.
Figure RL35: Overview of the roles of PPARa and PPARg during feeding and fasting. (a) PPARg is mainly active in the fed state when it stimulates accumulation of fat in the adipose tissue. (b) PPARa is mainly active in the fasting state when it stimulates oxidation of fatty acids in
the liver. The particular metabolic steps that are regulated by PPARa and PPARg are shown in
orange and red, respectively. The roles of the transcription factors C/EBP, cmyc, HNF4 and
SREBP, which are transcriptional regulators of metabolism, have been illustrated. The expression of the indicated proteins is increased (O) or decreased (P). AA, amino acids; CHYL,
chylomicrons; FA, fatty acids; TG, triglycerides.

Synthetic PPARγ ligands are used for their potent antidiabetic effects. In the United
States, three TZDs, troglitazone (Rezulin), rosiglitazone (Avandia) and pioglitazone
(Actos), are approved for use in type II diabetic patients. They bind PPARg with
moderate (troglitazone) to high (rosiglitazone) affinity, so it is believed that their
hypoglycaemic effect is exerted by activating PPARγ. However, a direct connection
between PPARγ and glucose homeostasis has not been easy to establish because skeletal
muscle, which accounts for the TZD-mediated increase in glucose disposal, expresses
only trace amounts of PPARγ. To explain this paradox, a mechanism has been proposed
by which TZDs divert fatty acids away from skeletal muscle by increasing their uptake in
adipose tissue, and so reduce the deleterious effects of fatty acids on muscle insulin
action. In this model, the hypoglycaemic effect of TZDs is secondary to their
hypolipidaemic effect. However, mice that lack adipose tissue can still benefit from the
action of TZDs, indicating that adipose tissue is dispensable for mediating the
hypoglycaemic effects of TZDs. It is also possible that the effect of TZDs on glucose
homeostasis might be via an alternative mechanism not involving PPARγ, as is the case
for the inhibitory effect of troglitazone on cholesterol synthesis.511
New ligands specific for PPARγ will be useful in refining these observations and working
out themechanisms of glucose homeostasis. Fibrates are potent hypolipidaemic drugs. In
the past few years they have been used increasingly to treat cardiovascular disease.
Fibrates, which include gemfibrozil, bezafibrate and fenofibrate, bind PPARα with high
affinity and it is believed that most of their effects on disease progression are mediated by
PPARα. Fibrates lower plasma triglyceride levels markedly and increase high density
lipoprotein (HDL) levels. The former effect occurs by stimulating hepatic fatty acid
oxidation and reducing apoCIII expression, whereas the latter effect is due to induction of
apolipoprotein-AI and apolipoprotein-AII expression, both mediated by PPARα.
Fibrates may also have a hypoglycaemic and thus anti-diabetic effect, as a consequence of
their hypolipidaemic action. Accordingly, it is interesting to compare PPARα agonists
and PPARγ agonists. Though they act through different receptor isotypes, both groups of
compound have potent hypolipidaemic properties which may be at the basis of their
hypoglycaemic effect. Future studies will have to establish whether fibrates or other
PPARα agonists may be applicable in the treatment of type II diabetes. The heterodimer
between PPAR and RXR can also be activated by ligand binding to RXR. Synthetic
ligands specific for RXR have been tested as an alternative treatment for diabetes.
2.1.12. Functional and Structural insight of PPARγ
PPARγ binds to DNA as a heterodimer with the retinoid X receptors (RXRs), receptors
for the vitamin A metabolite 9-cis-retinoic acid (9cRA).512,513
The three RXR subtypes (α,
β, γ) bind to DNA and activate transcription in response to 9cRA as homodimers.
However, the RXRs also serve as common heterodimeric partners for ~15 of the class 1
nuclear receptors, including the retinoic acid, thyroid hormone, and vitamin D
receptors.514
Thus, RXRs are essential components of multiple endocrine signaling
pathways. Some of the RXR heterodimers, including those formed between the PPARs
and RXRs, are “permissive” in that they can be activated by 9cRA. RXRs also form
permissive heterodimers with LXR and FXR, nuclear receptors for oxysterols and bile
acids, respectively. The dualmodulation of these permissive heterodimers by either
cognate ligand provides an additional level of regulation of these hormone signaling
pathways.514
The effects of hormones on PPARγ, RXR, and other nuclear receptors are mediated
through the ligand-binding domain (LBD), a conserved region of ~250 amino acids in the
C-terminal half of the receptor.515
In addition to its role in hormone binding, the LBD also
contains dimerization and transactivation functions, including the transcriptional
activation function 2 (AF-2). Upon hormone binding, the LBD undergoes a
conformational change, most notably in the AF-2 domain. These conformational changes
result in the displacement of corepressor proteins, such as NCoR and SMRT, that inhibit
transcription and the recruitment of coactivator proteins, such as p160 and DRIP/TRAP,
family members that are involved in transcriptional activation.516
The structure of the PPARγ/RXRα heterodimer complex contains six components: the
two receptor LBDs, their two respective ligands, and two SRC-1 peptides (Figure
RL36).517
The complex is butterfly shaped, with both LBDs adopting the conserved
“helical sandwich” fold for other ligand-bound nuclear receptors (front view in Figure
RL36). PPARγ contains 13α helices and 4 short β strands, and the gross structure

resembles the PPARγ homodimer. RXRα is composed of 11 a helices and 2 short b
strands, but the ligand-bound structure shows large conformational changes in H3, H10
and the AF-2 helix compared with the apo-RXR structure.518
The PPARγ and RXRα ligands occupy their respective ligand-binding cavities, which lie
in the lower half of the LBDs. Both PPARγ and RXRα are in the active configuration,
such that the AF-2 helix is folded against the main body of their respective LBDs. The
AF-2 helix, together with H3 and H4, form a hydrophobic groove into which the
coactivator peptide binds. Two SRC-1 peptides are present in each heterodimer complex
where residues 630–639 of the peptide are ordered in the RXRα complex and residues
628–643 are ordered in thePPARγ complex. The overall structure of the coactivator-
binding site and the docking modes of the SRC-1 peptide are similar to those observed in
the other nuclear receptor coactivator structures (Figure RL36).519,520
In each receptor, the
coactivator-binding site is a groove formed by H3, H39, and H4 at the top and by the AF-
2 helix at the bottom. The floor and the sides of this groove are composed of hydrophobic
residues. The SRC-1 peptide contains a two-turn amphipathic α helix, which is positioned
over the hydrophobic groove between the charge clamp, formed by the lysine and the
glutamate residues, as seen in the PPARγ homodimer structure with SRC-1.519
Figure RL36: Overall Structure of the PPARg/RXRa Heterodimer Complex
The front and top views of the PPARγ/RXRα heterodimer complex are presented in solid
rendering (a helices in cylinders, and b strands in arrows). RXR is colored in yellow,
PPARg in blue, and the two SRC-1 peptides in purple. The two compounds (9cRA and
GI262570) are shown in space-filling representation with carbon, oxygen, and nitrogen
atoms depicted in green, red, and blue, respectively.
Binding of Rosiglitazone and GI262570 to PPARγ
The PPARγ ligand-binding site is much larger (~1440Å) and more convoluted than is the
corresponding pocket of RXR. Rosiglitazone occupies only 25% of the available pocket.
Interestingly, the conformation of rosiglitazone bound to the PPARγ/RXR heterodimer
shows significant differences compared with the previously determined rosiglitazone-
PPARγ homodimer structure.519
In the heterodimer, rosiglitazone binds into the large
PPARγ pocket in a U-shaped conformation, with the TZD headgroup oriented toward the
AF-2 helix (Figure RL37). Hydrogen bonds are made between the TZD headgroup and
H449, Y473, H323, and S289. However, the hydrogen bond that was seen between the
TZD and Q286 in the homodimer structure is absent. The pyridyl tail is directed into a
lipophilic pocket adjacent to the β sheet. In the heterodimer, the rosiglitazone side chain
adopts a different gauche conformation than it does in the homodimer. In the heterodimer
structure, the N-methyl group is directed into a lipophilic pocket between H6 and H7,
where it contacts C285, M364, and L353. The pyridyl nitrogen makes a hydrogen bond
within the ligand pocket that was not observed in the homodimer. These differences
suggest that heterodimerization has a direct effect on the bound conformation of
rosiglitazone.
GI262570 is a tyrosine-based molecule that binds to the PPARγ/RXRα heterodimer with
a Ki 51 nM.521
This binding affinity is ~50-fold higher thanthat of rosiglitazone. The X-
ray structure of GI262570 in the PPARγ/RXRα heterodimer shows that GI262570 also
binds to PPARγ in a U-shaped conformation, occupying ~40% of the pocket (Figure
RL37b). The carboxyl group of GI262570 makes hydrogen bonds with the same four
residues (S289, H323, H449, and Y473) that interacted with the TZD headgroup of
rosiglitazone. GI262570 contains a 5-methyl-2-phenyloxazole tail that adopts a gauche
conformation, with its methyl group directed into the H6/H7 pocket (Figure RL37c). The
oxazole nitrogen makes a hydrogen bond with the bound water molecule. As a result, the
phenyloxazole tail of GI262570 is inserted ~2.3 Å deeper than is the tail of rosiglitazone
into the hydrophobic ligand-binding pocket, while maintaining critical interactions with
the H6/H7 pocket and the bound water molecule (Figure RL37).517
At the other end of
GI262570, the benzophenone group attached to the tyrosine nitrogen reaches ~7 Å into a
large lipophilic pocket formed by H3, H7, and H10. These hydrophobic interactions,
provided by the benzophenone group of GI262570, are not available to rosiglitazone or

other TZDs. Thus, the additional hydrophobic interactions of GI262570 with both ends of
the ligand-binding pocket reveal the structural basis for its increased PPARγ binding
affinity compared with rosiglitazone.517
There are several marked differences between the RXRα and PPARγ subunits of the
heterodimer with respect to ligand binding. Unlike the enclosed 9cRA-binding pocket in
RXR, the PPARγ pocket has a solvent-accessible channel between H3 and the β strands.
Rosiglitazone and GI262570 can access the PPARγ pocket via this open channel without
the protein undergoing a significant conformational change. Furthermore, rosiglitazone
and GI262570 interact directly with the PPARg AF-2 helix, whereas the RXR AF-2 helix
is held in place by 9cRA exclusively through hydrophobic interactions. Thus, ligand
binding and activation of PPARγ occur through a mechanism that is distinct from that for
RXR. However, the intramolecular interactions between the AF-2 helix and the body of
the PPARγ LBD are similar to those seen in the 9cRA/RXR complex. Hydrophobic
residues V446, V450, L453, and I456 from H10, together with residues F282, Q286,
V290, and V293 from H3 and V322 from H5, form a large hydrophobic pocket for
binding of the AF-2 helix. The hydrophobic residues of the AF-2 helix (L468, L469,
I472, and Y473) face directly toward this hydrophobic pocket and make extensive
interactions with these surrounding residues. The carbonyls of residues 471, 472, and 474
from the PPARg AF-2 helix are also capped by K319, a conserved positively charged
residue from the end of H4. The importance of these capping interactions is underscored
by the conservation of these interactions across many nuclear receptors and by the fact
that a mutation in the corresponding conserved charged residue in RAR (K264A)
abrogates the activity of the receptor.522
These observations demonstrate that although
PPARγ ligands directly with the AF-2 helix, and RXRa ligands do not, these two
receptors employ a conserved set of intramolecular interactions to stabilize the active AF-
2 conformation.517
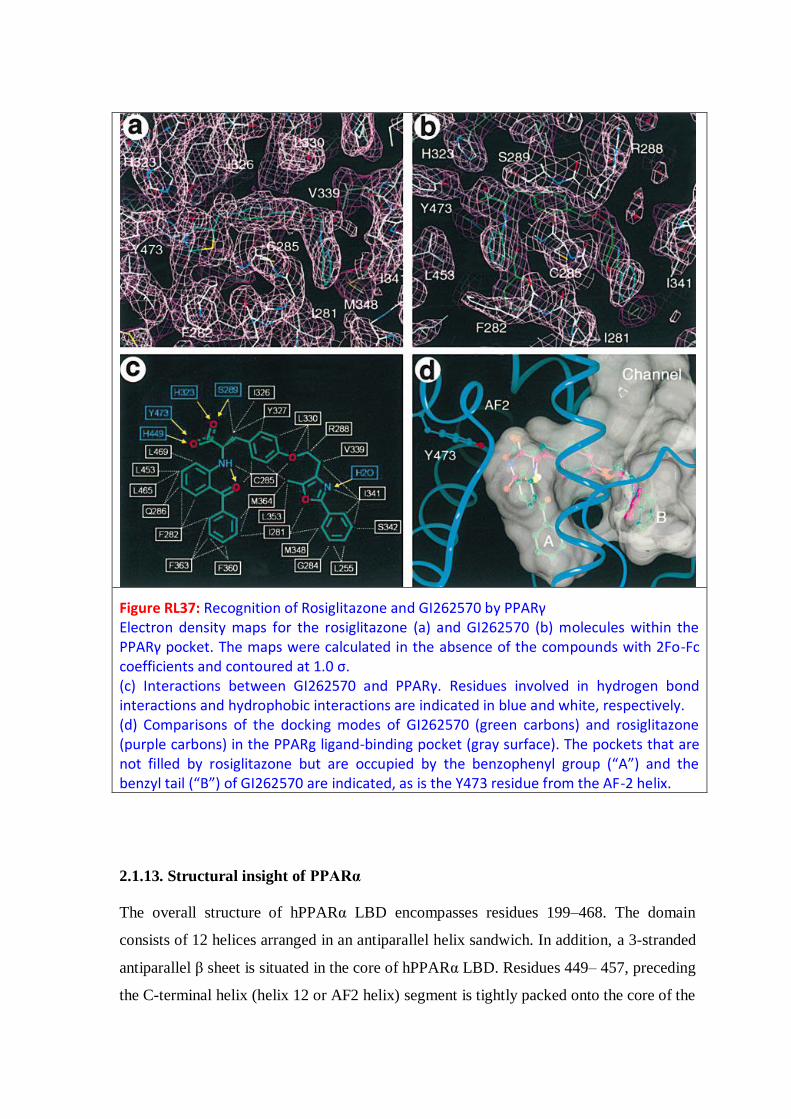
Figure RL37: Recognition of Rosiglitazone and GI262570 by PPARγ Electron density maps for the rosiglitazone (a) and GI262570 (b) molecules within the PPARγ pocket. The maps were calculated in the absence of the compounds with 2Fo-Fc coefficients and contoured at 1.0 σ. (c) Interactions between GI262570 and PPARγ. Residues involved in hydrogen bond interactions and hydrophobic interactions are indicated in blue and white, respectively. (d) Comparisons of the docking modes of GI262570 (green carbons) and rosiglitazone (purple carbons) in the PPARg ligand-binding pocket (gray surface). The pockets that are not filled by rosiglitazone but are occupied by the benzophenyl group (“A”) and the benzyl tail (“B”) of GI262570 are indicated, as is the Y473 residue from the AF-2 helix.
2.1.13. Structural insight of PPARα
The overall structure of hPPARα LBD encompasses residues 199–468. The domain
consists of 12 helices arranged in an antiparallel helix sandwich. In addition, a 3-stranded
antiparallel β sheet is situated in the core of hPPARα LBD. Residues 449– 457, preceding
the C-terminal helix (helix 12 or AF2 helix) segment is tightly packed onto the core of the

domain in PPARα. The ligand binding site in hPPARα is located in the central core of the
LBD, flanked by helices 3, 5, 7, 11, and 12. It is situated in a large T-shaped cavity. The
central cavity spans the domain between the AF2 helix and the 3-stranded antiparallel β
sheet. At the level of the β sheet, the cavity splits upward and downward along an axis
roughly parallel to helix 3. These extensions are referred to as the upper and lower distal
cavities (Figure RL38).523
An apparent entrance to the ligand binding site is found
between helix 3 and the 3-stranded antiparallel β sheet. The region of residue 254 to 264
constituting a loop is highly flexible and partly covers the entrance to the ligand binding
site. The entrance is further restricted by Tyr334, which forms a hydrogen bond with
Glu282. Due to these steric hindrances, a great deal of flexibility is probably required in
order for large ligands such as AZ 242 to enter the ligand binding site.523
Figure RL 38: A stereo view of a superposition of hPPARγ LBD (red) and hPPARδ
LBD (yellow) on hPPARα LBD (blue). Only the Cα trace is shown. Ligands from the
three respective structures are shown in green. The central cavity is marked with a “C”,
and the upper distal and lower distal cavities are marked with an “U” and “L”,
respectively.
2.1.14. Comparison of structures of LBDs and binding modes to ligands among the
three PPAR subtypes
The structure of hPPARα LBD is very similar to both hPPARγ LBD and hPPARδ LBD
(Figure 38523
and 3975
). The domain consists of 12 helices arranged in an antiparallel
helix sandwich. In addition, a 3-stranded antiparallel β sheet is situated in the core of
hPPARα LBD. The largest deviation between the three different crystal structures is
found in a region comprising residues 231–265, referred to as the omega loop. This
region displays the highest B factors in hPPARα LBD and differs among the various
reported crystal structures of hPPARγ LBD.519,524
Residues 449–457, preceding the C-
terminal helix (helix 12 or AF2 helix), constitute a second region exhibiting a large
degree of conformational variation between the three subtypes. This segment is more
tightly packed onto the core of the domain in PPARα compared with the other two PPAR
subtypes.
The LBD is situated in a large T-shaped cavity similar in size to that of hPPARγ LBD519
and hPPARδ LDB,525
with a volume of about 1300Å. An apparent entrance to the ligand
binding site is found in hPPARα between helix 3 and the 3-stranded antiparallel β sheet in
a region similar to the proposed entrance in hPPARγ LBD and hPPARδ LBD. The
equivalent residues to Tyr334 in hPPARα LBD are Glu341 in hPPARγ LBD, which
appears to be flexible,519
and Asn307 in hPPARδ LBD. Most known PPAR agonists share
features such as a hydrophilic head group, a central hydrophobic part, and a flexible
linker to the tail. The binding mode of these compounds are highly similar, with the head
group interacting with the AF2 helix, the central ring systems forming hydrophobic
interactions (Figure RL40),523
and the tail extending toward the lower or upper distal
cavity. PPAR agonism is caused by a conserved hydrogen bonding pattern involving the
AF2 helix. This hydrogen bonding network is also present in hPPARδ LBD525
and is
therefore conserved in the entire PPAR family. The overall similarity in the binding mode
for hPPARα LBD and hPPARγ LBD also extends to the coordination of water molecules.

Figure RL 39: The x-ray crystal structures of PPARα (pink worm), PPARγ (yellow worm), and PPARδ (cyan worm). Each PPAR is complexed to a high-affinity ligand (not shown). PPARα and
PPARγ are complexed to LXXLL peptides (purple worms). For each PPAR, the solvent-
accessible ligand binding pocket is displayed as an off-white surface.
Figure RL40: σA-weighted Fo-Fc electron density omit map calculated around AZ 242.
Residues forming hydrophobic contacts with AZ 242 are represented in green, and the
residue forming the hydrogen bonds with the propionic head group are represented in
blue.
Figure RL 41: Agonist binding mode
2.1.15. Insight of structure, activity and side effects of PPAR agonists (Synthetic
ligands)
Many synthetic PPAR ligands have been reported in the literature since the discovery of
PPARs. Data from a number of crystallographic studies exploring these compounds
reveal a fairly clear view of the agonist binding mode in the LBD. Nearly all the
compounds conformed to a three-module structure, with a binder group involved in a
series of hydrogen bonds in front of the AF-2, a linker mainly arranged around central
helix 3 and an effector end occupying the large cavity of the binding site (Figure RL
41).526
2.1.15.1. PPARα Agonists
♦ Fibrates
PPARα is the predominant target for fibrates, a class of drugs well-established in the
therapy of dyslipidemia and hypertriglyceridemia. The hypolipidemic fibrate drugs are
currently used in clinical practice for treatment of dyslipidemia (in particular, low HDL
cholesterol and elevated triglyceride levels) and for reducing cardiovascular risk.527
In
1962, Thorp and Waring showed that clofibrate (1) (Figure I11), the ethyl ester of α-
parachlorophenoxyisobutyric acid, among a series of α-aryloxyisobutyric acid
derivatives, was most effective at decreasing the concentration of cholesterol and other
lipids in rat plasma and liver.528
In 1965, 1 became the first PPARα agonist (EC50= 55
μM) to be used in clinical therapy in the treatment of dyslipidemia. However, it was
withdrawn from the market because of severe adverse effects, as it was shown to increase
mortality among treated patients. In an attempt to improve the pharmacological profile of
clofibrate, some analogues were synthesized and biologically evaluated. These
compounds were referred to as “second generation fibrates” and include fenofibrate (2),
bezafibrate (3) (Figure I11), ciprofibrate (17), and the dimethylphenoxypentanoic acid
derivative gemfibrozil (18) (Figure RL42). These compounds increased the synthesis of
lipoprotein lipase, thereby increasing clearance of triglycerides; however, they showed
only modest selectivity over the other PPAR subtypes. Furthermore, the structures of
these compounds were relatively small compared to the wide pocket they occupied,
fostering the development of a newer generation of fibrate analogues. Attempts to
identify more potent compounds led to the synthesis of a series of ureidofibrates that were
active at lower doses in rodent models of hyperlipidemia. The first reported examples of

selective PPARα agonists were ureido-based fibric acids 19 (GW9578) and 20
(GW7647)529
with their respective EC50 values for human PPARα being 6 and 50 nM,
respectively. α,α-Dimethylcarboxylic acids 19 and 20 showed 20-fold and 200-fold
selectivity, respectively, compared to PPARγ and PPARβ/δ and possessed potent lipid-
lowering activities in a cholesterol/cholic acid fed rat assay compared to fenofibrate.
Researchers at Lilly also reported their phenoxyphenylpropanoic acid 21 (LY518674) to
be a potent PPARα agonist with 200-fold binding selectivity compared to PPARγ and
PPARβ/δ receptors.530
In order to develop PPARα agonists more potent and selective than
the fibrate class, Sierra et al.531
modified their selective PPARβ/δ agonist (GW501516)
(structure not disclosed) to incorporate the 2-aryl-2-methylpropionic acid group of
fibrates, which led to compound 22 (GW590735), shown to be a potent and selective
PPARα agonist with EC50 = 4 nM on PPARα and at least 500-fold selectivity versus
others subtypes. This compound offered the potential for significantly improving
therapeutic benefits compared to the fibrates in dyslipidemia and hypertriglyceridemia.
Meyer et al. reported another PPARα agonist, 23 (K111),532
which differed from the
classical fibrate class by the long chain alkyl moiety, α-dichlorododecanoic acid.
OOH
O
Cl
Cl
Ciprofibrate (17)
O O
O
Gemfibrozil (18)
F
F
NH N
OS
OH
O
GW9578 (19)
NH N
OS COOH
GW7647 (20)
O COOH
NH
NN
O
LY518674 (21)
NH
O COOH
S
N
F3C
O
GW590735 (22)
Cl (CH2)9
COOH
ClCl
K111 (23)
F3C
O N
O
O COOH
CP-900691 (24)
O COOH
O
O
OH
Cl
DE027 (25)
Figure RL42: Fibrate class of PPARα agonists (synthetic ligands)

Compound 23 was an insulin sensitizer with PPARα selectivity compared to PPARγ and
PPARβ/δ. This compound led to significantly decreased body weight and improved
hyperinsulinemia, insulin sensitivity, hypertriglyceridemia, and HDL cholesterol levels,
without adipogenesis or significant effects upon fasting glucose, 24 h urine glucose
excretion, systolic and diastolic blood pressure, plasma fibrinogen, total cholesterol, and
chemistry and hematology profiles. These benefits were similar to the health-improving
effects of caloric restriction, providing preliminary evidence that 23 has excellent
potential as a calorie-restricting mimetic agent. The results also showed that it is a potent
antidiabetic and hypolipidemic drug in nonhuman primates. More recently, 24 (CP-
900691), with a phenylpiperidine carbamate moiety, has been reported to be a highly
selective PPARα agonist in T2DM monkeys, with favorable effects upon dyslipidemia as
well as upon glycemic control, body weight, and inflammation.533
Indeed, treatment of
diabetic monkeys with 24 has been shown to increase HDL cholesterol and apoA1,
reduce plasma triglycerides and apoB, improve the lipoprotein index, decrease body
weight and CRP, and increase adiponectin. Li et al. reported hybrid compounds obtained
by a combination of the classical fibrate “headgroup”, a linker with the appropriate
length, and a chalcone534
known for over a century to have advantageous biological
activities, including antioxidant, anti-inflammatory, anticancer, and antiinfective
properties. Compound 25 (DE027) was described as being the most prominent, with
EC50 = 60 nM. This compound was identified using a virtual screening approach based
on the crystal structure of PPARα. Compound 25 has provided a promising novel family
of chalcones with a potential hypolipidemic effect.
NH N
N
Cl
COOH
WY14643 (26)
NH
O
MeO
COOH
F3C
KCL (27)
NH
S
NH
O O
(29)
OH
MeO
OMe (30)
O
MeO
OMe
P
OH
OH
(31)
O
O O
O COOH
Cl
F3C
(28)
Figure RL43: Non-Fibrate class of PPARα agonists (synthetic ligands)
♦ Non-Fibrates
Using a cell-based transactivation assay, 26 (WY14643), a non-fibrate selective PPARα
agonist with a thioether moiety and a pyrimidine linker part, was identified as being a
micromolar activator of murine PPARα (Figure RL43). The Kyorin group reported a
highly potent human PPARα-selective agonist, 27 (KCL). This compound is a non-fibrate
phenylpropanoic acid derivative that is a potent human PPARα agonist in vitro,
possessing selectivity for PPARα compared to the other subtypes.535
Human PPARα
selectivity of 14 is mainly due to a specific interaction between the hydrophobic tail part
of 27 (the 4-trifluoromethyl group) and the key amino acid Ile272 located on the helix 3
region of human PPARα LBD. Compound 27 (Figure RL43) activates human and rat
PPARα with EC50 of 0.06 and 5.2 μM, respectively. Thus, the transactivation activity of
KCL for PPARα is approximately 100-fold less potent in rats than in humans. NNC 61-
4655,536
a phenylpropargyl derivative, is a nonselective but PPARα-preferring potent
PPAR agonist with excellent pharmacokinetic properties; it has been shown to have more
efficacious in vivo effects in male db/db mice than PPARγ selective agonists such as
rosiglitazone and pioglitazone. Kuwabara et al. reported a highly potent PPARα agonist,
NS-220,537
a dioxanecarboxylic acid derivative that presents PPARα agonist activity 1000
times more potent than fibrates, suggesting that the dioxanecarboxylic acid moiety is
responsible for its high potency and selectivity for the PPARα subtype. This compound
led to amelioration of metabolic disorders in type 2 diabetic mice. A series of 2,3-
dihydrobenzofuran-2-carboxylic acids have been described that led to development of a
novel class of PPARα agonists,538
represented by compound 28 (Figure RL43), which
displays the best selectivity among PPARα selective agonists reported to date. Indeed, in
animal models, it displays very high potency (EC50 < 10 nM) and subtype selectivity
(>1000-fold), as well as highly potent and effective hypolipidemic activity. It is believed
that the inherent selectivity of this class of compounds is primarily due to conformational
constraints rendered by the structurally unique 2,3-dihydrobenzofurane ring. In male
Syrian hamsters, 24 h drug exposure to 28 and fenofibrate administered in a series was
measured following the final dose of each compound. It was found that 28 required only
about 1/500 of the exposure to fenofibrate to achieve comparable lipid-lowering efficacy,
suggesting that the in vivo efficacy of these two compounds is closely correlated with
their potency as PPARα agonists in vitro. Researchers at Lilly also reported a tetrazole
ring binder, LY-171883, a leukotriene D4 antagonist that induces peroxisome
proliferation in rodent liver.539
Like many peroxisome-proliferating agents, it causes

transient lipid accumulation along with other changes in hepatic lipid metabolism. Study
of the effect of LY-171883 on lipid metabolism revealed that it increased triglycerides in
liver, associated with a 3-fold increase in fatty acid synthetase. Some sulfamide-derived
analogues of OEA with potent selective binding affinity for PPARα have been reported
and have led to an N-octadecyl-N′- propylsulfamide (29). This compound has been shown
to induce satiety, reduce food intake in rats, reduce body weight, and act as a lipid-
lowering agent.540
On the basis of the structure of another famous natural compound,
resveratrol, which showed a beneficial effect at lowering the risk of cardiovascular
diseases in animal models, pterostilbene (30) and its phosphate derivative (31)541
(Figure
RL43) have been reported, with the trans conformation being more active than cis
analogues. Compound 31 is the most active compound in this series, with decreased
cholesterol levels in animal models and higher potency than ciprofibrate.
Moreover, reports of interest in the research of developing PPARα antagonists can also be
found in the literature.
OS
NH
O
O
Ciglitazone (32)
OS
NH
O
O
OH
Troglitazone (33)
SNH
O
O
O
Englitazone (34)
SNH
O
O
ON
O
(35)
SNH
O
O
ON
DRF-2189 (36)
SNH
O
O
ONO
SS
(38)
SNH
O
O
ON
O
S
BM13.1258 (39)
SNH
O
O
ON
O
S
S
BM15.2054(40)
SNH
O
O
ON
O
N
BRL-48482 (37)
Figure RL44: Glitazone class of PPARγ agonists (synthetic ligands)
2.1.15.2. PPARγ Agonists
♦ Glitazones
Following the discovery of PPARγ, the first class of synthetic ligands to specifically bind
it consisted of thiazolidine-2,4-diones (TZDs) or glitazones. TZDs, introduced on the

market in the past 10 years, constitute the first class of insulin sensitizers. Their
antidiabetic action occurs through improvement in hyperglycemia and hyperinsulinemia
and lowering of insulin resistance. Since the pioneering discovery by scientists at the
Takeda Pharmaceuticals Company of ciglitazone (32),542
which effectively reduces
insulin resistance by potentiating insulin action in genetically diabetic and/or obese
animals, several new TZDs have been developed. Troglitazone (33)543
was derived from
32 by replacing the lipophilic tail (methylcyclohexyl methyl ether moiety) with a vitamin
E residue. Pioglitazone (4)544
and rosiglitazone (5)545
(Figure I12) were developed by
modifications based on the metabolites of 32. These compounds possess a pyridyl tail
group. Some modifications were made with physical cyclization of the linker; indeed,
rigidification of the ethoxy in a chromane structure led to englitazone (34).546
This had
the effect, however, of increasing the complexity of the compound because of the
introduction of a chiral center, probably dooming an otherwise interesting possibility. It is
noteworthy, however, that 34, which lack a large effector module, were shown to have
less potency than 4 and 5. Three of these TZDs have been marketed: 33, withdrawn from
clinical use in 1997 because of its severe hepatotoxicity; 4 and 5, currently used as third-
intention drugs in treatment of type 2 diabetes. The hepatotoxicity of 33 did not seem to
apply to the other glitazones.547
SAR studies of this family have shown the effectiveness
of the methylene moiety as a linker between benzene and the TZD ring. Moreover, the 4-
oxylbenzyl group appears to be essential for enabling the compound to exert favorable
hypoglycemic and hypolipidemic activities. However, replacement of the thiazolidine-
2,4-dione ring by an oxazolidine-2,4-dione ring or a 1-oxa-2,4-diazolidine-3,5-dione ring
led to a decrease in activity, while other heterocycles, such as rhodamine, hydantoin,
thiohydantoin, and 2-thioxo-5-thiazolidinedione, resulted in complete loss of activity.
Nevertheless, because of their ability to induce gene expression in adipocytes and to
enhance adipocyte differentiation, TZDs induced weight gain in often already obese
patients as a mechanism-related class effect. In addition, other undesirable side effects548
such as fluid retention, hemodilution, potent cardiac hypertrophy, liver toxicity, and an
increased risk of cardiovascular-related death reported in preclinical and clinical studies
emphasize the need for safer insulin sensitizers to treat metabolic syndrome and
associated complications. Thus, there has been considerable interest in designing novel
PPARγ-modulating drugs that retain efficacious insulin-sensitizing properties while
minimizing potential adverse side effects, leading to conventional chemistry-led
pharmacomodulation studies to improve the glitazones. Indeed, in order to synthesize

novel TZDs with better safety and efficacy, a second generation of glitazones has been
developed, focusing most intensively on the tail part. The two glitazones that are still
marketed share a common trait: their effector module is fairly small compared to the large
pocket in which it is bound. In fact, the binder part is common to the entire class and the
linker has also been well conserved, having been modified only in the most recent
glitazones.
Indeed, it was the tail group that bestowed upon each of the glitazones their originality in
chemical terms but also their specific biological activity. This module is the most
probable candidate for explaining differences in affinity and potency between very
similar glitazones, thus entitling it to the status of effector module of the compound.
While maintaining a TZD moiety as the binder group, several attempts were made to
modify the linker module as well as the effector. The effector module of 28, the N-
methyl-2-pyridyl moiety, was first modified with different heterocycles. Replacement by
a 4-oxazolyl moiety led to 35,549
which exhibited potent hypoglycemic and hypolipidemic
activities and displayed the same biological profile as 32. Compound 36 (DRF-2189), an
indole-based tail group, was also reported to be analogous to 5. Pharmacological studies
showed equal potency for 36 and 5. The plane shape of indole appears to be important for
its activity. As a potential backup for 5, 37 (BRL-48482) was developed in the same
family, differing from its predecessors by its slightly larger effector module, a bicyclic
benzoxazole. More drastic modifications in the effector module were also carried out: for
example, its replacement by a dithiolane,550
leading to compound 38. An in silico docking
study of this compound was carried out to elucidate its satisfactory activity; it showed a
supplementary hydrogen bond with Ser-432 at its effector amide carboxyl, reinforcing
hydrophobic contacts formed by the dithiolane cycle. When compared with biological
data available for the compounds, docking results led to the hypothesis that the position
of the effector in the pocket, either above the plane of the linker (in the upper arm of the
Y-shaped pocket) or below it (in the lower arm), was a key to the affinity and probably
functional activity of the ligands. Compound 38 was developed as a derivative of potent
antioxidant vitamin α-lipoic acid and has been shown to be a potent PPARγ agonist, with
improved insulin sensitivity and reduced triglyceride levels in Zucker rats. These new
compounds may prove to be efficacious in the treatment not only of type 2 diabetes but
also of atherosclerosis and prevention of vascular restenosis and inflammatory skin
diseases. Rivoglitazone presents a benzimidazolyl tail.551
It was reported to be
approximately 3 times more active than 5 in a cell-based PPARγ transfection assay but

had little effect on PPARα and PPARδ activity in luciferase reporter assays. In vivo, it
was found to be more potent than 5, which can be explained not only by enhanced in vitro
activity but also by a longer half-life. Daiichi Sankyo reported that a phase 3 clinical trial
was discontinued in May 2009, but the drug was being reused in phase 2 to treat
xerophthalmia. 39 (BM13.1258) and 40 (BM15.2054) possess a benzothiophene ring as a
linker. They are potent PPARγ activators in transient assays in vitro. Considerable
evidence indicates that the therapeutic effects of TZD are mediated via activation of
PPARγ, resulting in insulin sensitization and improved glucose metabolism. The results
of that study did not challenge this hypothesis but suggested that 39 and 40 may, in
addition, affect muscle glucose metabolism via other biochemical pathways.552
That
conclusion was supported by the absence of a correlation between chronic oral effects of
39 and 40 on glycogenic and glycolytic fluxes and by acute insulin-dependent catabolic
stimulation of glucose metabolism in vitro. Maintenance of the 4-oxazolyl moiety as the
effector module and modification of the 4-ethoxybenzyl linker with a phenone moiety led
to darglitazone, which showed better oral potency than 4 or 5. However, that compound
caused dramatic effects upon white and brown adipose tissue and unexpected
morbidity/mortality in rats and monkeys.553
Efatutazone, with a similar scaffold as that of
Rivoglitazone where the methoxy group of present in the lipophilic tail of Rivoglitazone
has been replaced by a 3,5-dimethyl 4-amino phenoxy group; very potently activates
PPARγ- mediated transcription, more than 40-fold that of 5, and demonstrated high
selectivity for PPARγ within the PPAR family. To date, several reports have shown
preclinical antitumor activity for PPARγ agonists in certain models, including
carcinogenesis and xenograft models. However, pilot clinical trials in cancer patients
using PPARγ agonists have been inconclusive. The antitumor activity of efatutazone has
been investigated and was demonstrated in vitro and in vivo.554
A series of antidiabetic unsaturated TZDs have also been reported in order to develop
agonists without a stereogenic center at C-5 of TZD and have led to compounds 41 and
42 (Figure RL45).555
Surprisingly, these compounds show little or no in vitro activity
toward PPARγ but more effective euglycemic and in vivo triglyceride-lowering activities
than 33. These observations raise the possibility that some TZDs mediate their
antidiabetic activity via mechanisms other than PPARγ, although activation of PPAR by
metabolites of these drugs cannot be ruled out. Furthermore, these unsaturated
compounds have a better pharmacological profile than their saturated analogues. More
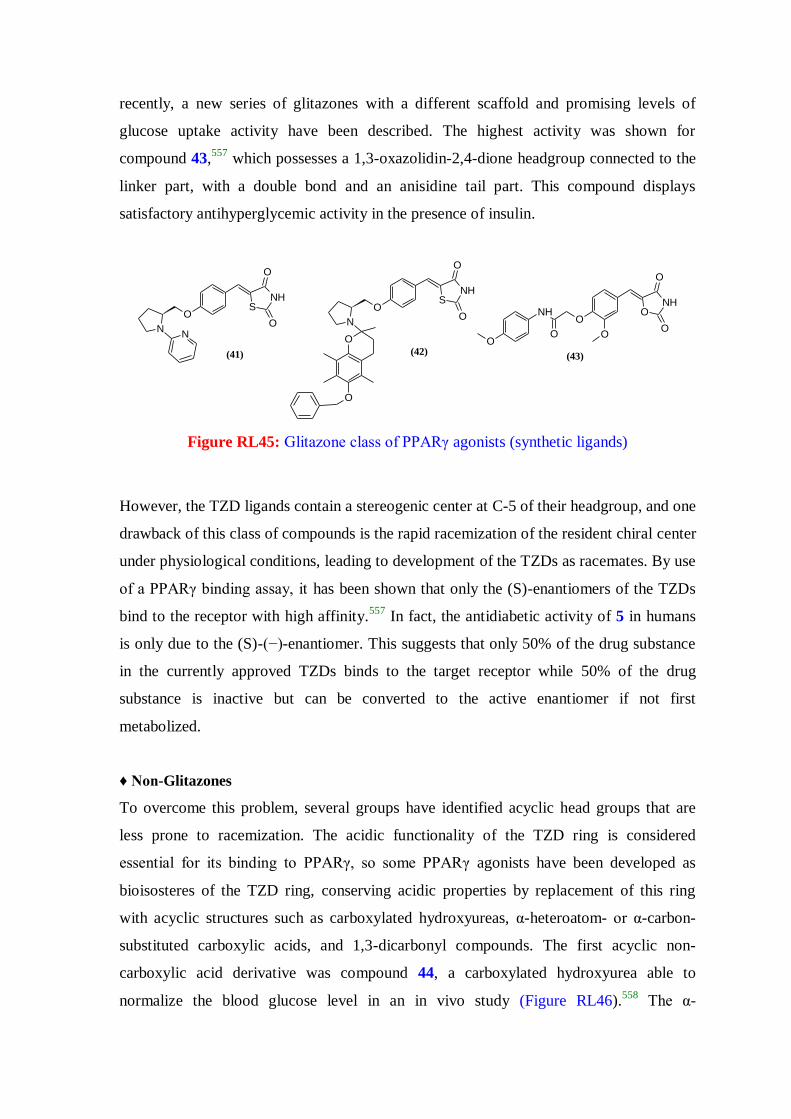
recently, a new series of glitazones with a different scaffold and promising levels of
glucose uptake activity have been described. The highest activity was shown for
compound 43,557
which possesses a 1,3-oxazolidin-2,4-dione headgroup connected to the
linker part, with a double bond and an anisidine tail part. This compound displays
satisfactory antihyperglycemic activity in the presence of insulin.
(41)
NN
SNH
O
O
O N
SNH
O
O
O
O
O
(42)
ONH
O
O
OO
NH
OO
(43)
Figure RL45: Glitazone class of PPARγ agonists (synthetic ligands)
However, the TZD ligands contain a stereogenic center at C-5 of their headgroup, and one
drawback of this class of compounds is the rapid racemization of the resident chiral center
under physiological conditions, leading to development of the TZDs as racemates. By use
of a PPARγ binding assay, it has been shown that only the (S)-enantiomers of the TZDs
bind to the receptor with high affinity.557
In fact, the antidiabetic activity of 5 in humans
is only due to the (S)-(−)-enantiomer. This suggests that only 50% of the drug substance
in the currently approved TZDs binds to the target receptor while 50% of the drug
substance is inactive but can be converted to the active enantiomer if not first
metabolized.
♦ Non-Glitazones
To overcome this problem, several groups have identified acyclic head groups that are
less prone to racemization. The acidic functionality of the TZD ring is considered
essential for its binding to PPARγ, so some PPARγ agonists have been developed as
bioisosteres of the TZD ring, conserving acidic properties by replacement of this ring
with acyclic structures such as carboxylated hydroxyureas, α-heteroatom- or α-carbon-
substituted carboxylic acids, and 1,3-dicarbonyl compounds. The first acyclic non-
carboxylic acid derivative was compound 44, a carboxylated hydroxyurea able to
normalize the blood glucose level in an in vivo study (Figure RL46).558
The α-

heteroatom-substituted-β-phenylpropionic acid series was based on replacement of the
TZD moiety of insulin sensitizer 37 by α-heteroatom-substituted-β-phenylpropionic acids
and maintenance of the 4-oxazolyl effector module. These compounds, typified by α-
ethoxy acid 45 (SB- 213068), have been shown to be potent PPARγ agonists. In contrast
to the TZDs, α-benzyloxy acids do not undergo racemization in vivo. Within this series,
the (S)-enantiomers were shown to have higher binding affinity for PPARγ and were
more potent than their (R) counterparts in adipocyte differentiation assays.559
Compound
45 is one of the most potent antihyperglycemic agents yet reported. It was assumed that
the role of acidic TZD was played by carboxylic acid in these compounds and that an
appropriate substituent at the α-position could alter the chemical environment around the
carboxylic acid in such a way that the entire group would mimic the TZD ring. Some
benzofuran non-TZD derivatives have also been described,560
based on incorporation of
oxygen into a benzofurane ring, as described above for englitazone but without creating a
stereocenter. These modifications led to compounds 46 and 47 which possess α-alkoxy
and α-thioether carboxylic acid groups, respectively. For both compounds, the effect of
stereochemistry at the α-position of the carboxylic acid group was examined, and it was
shown that the activity resided entirely within the (S)-enantiomers. These two compounds
were shown to stimulate glucose uptake at low nanomolar concentrations in adipocyte
cell lines. Some acetic acid derivatives bearing a benzoxazinone core have been
synthesized57
and have led to compounds 48 and 49. Substitution on the amide of the
benzoxazinone ring by lipophilic aliphatic chains enhanced receptor activation while
generally maintaining bioavailability and resistance to oxidative metabolism. It should be
noted that these compounds have an (R) absolute configuration, and show potent efficacy
in vivo in a db/db mouse model of type 2 diabetes. An aminomethyl cinnamate (AMC)
series of PPARγ agonists is represented by compound 50 (Figure RL46), which possesses
a large linear effector module, a biphenyl-4- oxazolyl moiety. The α-heteroatom of the
linker was moved to the ortho position of the aromatic ring, eliminating the epimerizable
stereocenter and producing highly selective PPARγ compounds.562
With this large linear
effector moiety, further investigation led to the discovery of tetrahydroisoquinolines
(THQs) represented by compound 51, a non-TZD.563

COOH
XON
OX= O, (46)
X= S, (47)
N
O
NH2
O
O
O
O
N
O
(44)
COOH
ON
O
N
(45)
(48)
O
COOH
O
N O
(49)
O
COOH
O
N O
O
COOH
ON
O
NH
O
O
(50)
COOH
ON
O
N
O
O
(51)
O
O
N
COOH
(52)
O
O
N
O COOH
(53)
O COOH
NN
O
(54)
COOH
NH
O
(55)
(56)
O O
HOOCCOOH
O O
(57)
OCOOH
O
O
HOOC
O
Figure RL46: Non-glitazone class of PPARγ agonists (synthetic ligands)
This compound exhibits potent PPARγ affinity for the isolated receptor and in cellular
assays while showing good selectivity against PPARα. Compound 51 has an excellent in
vivo profile in db/db and ZDF models of type 2 diabetes and also possesses desirable
pharmacokinetic properties. Lin et al. recently reported new fibrate derivatives564
52 and
53 with potent selective PPARγ agonist activities. These compounds were synthesized
based on structural modification of a previously described indole fibrate derivative dual
PPARα/γ agonist in which indole was replaced by a tetrahydroquinoline core. X-ray
cocrystal analyses revealed that selective PPARγ agonist activity is conferred by the tail
part building block 4-phenylbenzophenone. Cell-based reporter assays of two
enantiomeric fibrate-like derivatives showed that (R)-enantiomer 54 is a full agonist of
PPARγ whereas the (S)-enantiomer is a less potent partial agonist.565
Analysis of the
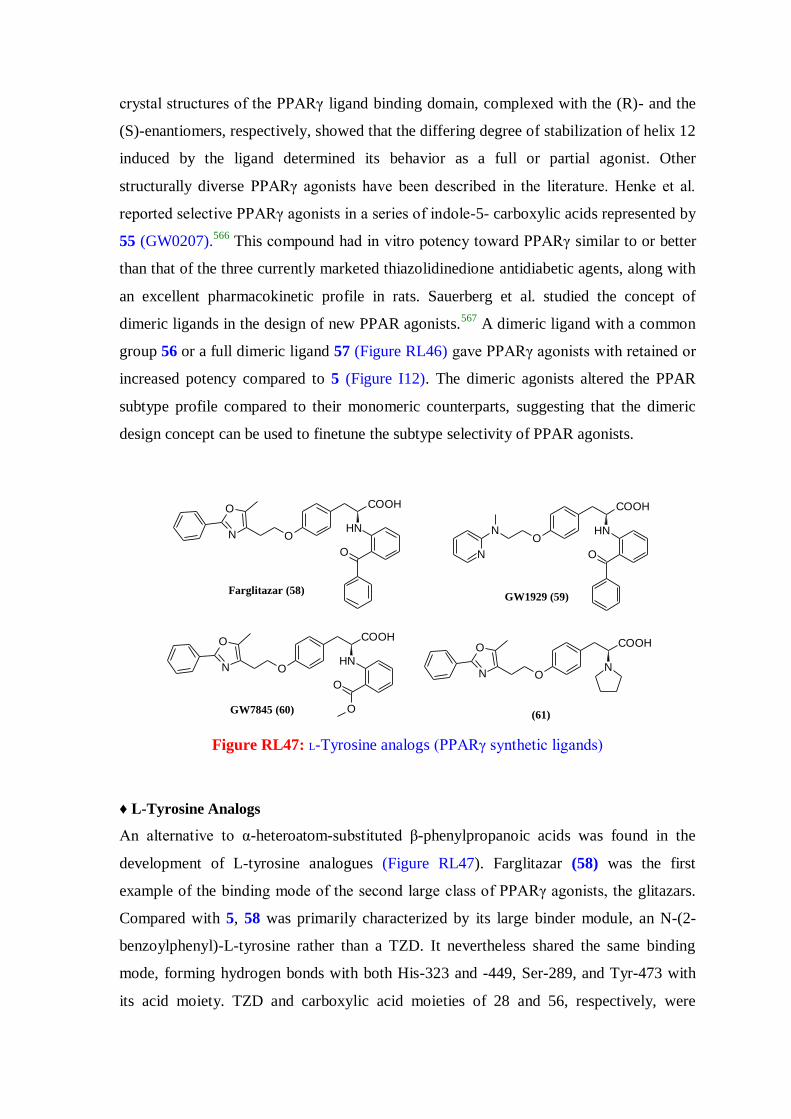
crystal structures of the PPARγ ligand binding domain, complexed with the (R)- and the
(S)-enantiomers, respectively, showed that the differing degree of stabilization of helix 12
induced by the ligand determined its behavior as a full or partial agonist. Other
structurally diverse PPARγ agonists have been described in the literature. Henke et al.
reported selective PPARγ agonists in a series of indole-5- carboxylic acids represented by
55 (GW0207).566
This compound had in vitro potency toward PPARγ similar to or better
than that of the three currently marketed thiazolidinedione antidiabetic agents, along with
an excellent pharmacokinetic profile in rats. Sauerberg et al. studied the concept of
dimeric ligands in the design of new PPAR agonists.567
A dimeric ligand with a common
group 56 or a full dimeric ligand 57 (Figure RL46) gave PPARγ agonists with retained or
increased potency compared to 5 (Figure I12). The dimeric agonists altered the PPAR
subtype profile compared to their monomeric counterparts, suggesting that the dimeric
design concept can be used to finetune the subtype selectivity of PPAR agonists.
COOH
O
NHO
N
N
GW1929 (59)
COOH
O
NHON
O
Farglitazar (58)
COOH
O
O
NHON
O
GW7845 (60)(61)
COOH
NON
O
Figure RL47: L-Tyrosine analogs (PPARγ synthetic ligands)
♦ L-Tyrosine Analogs
An alternative to α-heteroatom-substituted β-phenylpropanoic acids was found in the
development of L-tyrosine analogues (Figure RL47). Farglitazar (58) was the first
example of the binding mode of the second large class of PPARγ agonists, the glitazars.
Compared with 5, 58 was primarily characterized by its large binder module, an N-(2-
benzoylphenyl)-L-tyrosine rather than a TZD. It nevertheless shared the same binding
mode, forming hydrogen bonds with both His-323 and -449, Ser-289, and Tyr-473 with
its acid moiety. TZD and carboxylic acid moieties of 28 and 56, respectively, were

imperative for AF-2 helix interaction. Although these compounds have an asymmetric
center, the (S)-enantiomers have been shown to possess greater binding affinity and
functional activity at PPARγ than the corresponding (R)-enantiomers and are
conveniently synthesized from naturally occurring L-tyrosine.568
Unlike the TZDs, these
tyrosine-based compounds do not undergo racemization in vivo. The X-ray crystal
structure of 58 bound to PPARγ showed that the benzophenone group was inserted into a
lipophilic pocket while the tyrosine nitrogen and the benzophenone carbonyl formed an
intramolecular hydrogen bond. This intramolecular hydrogen bond reduces the basicity
and polarity of the tyrosine amino group. Compound 58 leads to potent reduction in
glucose activity, reduction of triglycerides, and a rise in HDL cholesterol in diabetic
patients. The positive lipid effects of 58 may be due to residual PPARα activity in the
compound. However, it failed to pass phase 3 of clinical trials because of the emergence
of adverse effects such as peripheral edema. Other tyrosine-based PPARγ agonists have
been developed, exemplified by 59 (GW1929) and 60 (GW7845).569
This series also
contains some of the most potent PPARγ agonists reported to date, with a number of
analogues having subnanomolar activity toward human PPARγ. In addition, these
compounds showed >1000-fold selectivity for PPARγ over the PPARα and PPARβ/δ
subtypes in cell-based transactivation assays. Compound 59 (Figure RL47) demonstrated
antihyperglycemic activity equipotent to that of troglitazone at >100-fold lower plasma
concentrations in ZDF rats,570
which paralleled their differences in PPARγ binding and
activation. Still other Ltyrosine analogues were developed, with alternative Nsubsituents
that added a small lipophilic substituent while mimicking some of the effects of the
intramolecular hydrogen bond present in the benzophenone analogue, leading to pyrrole
derivative 61 (Figure RL47).571
This compound incorporates a pyrrole as a low molecular
weight N-substituent, and its low basicity may be the key to its potent PPARγ activity.
Unfortunately, as for the TZD class and despite excellent potency, several compounds
from the L-tyrosine analogue class present unwanted therapeutic profiles marked by fluid
retention, weight gain, and potential cardiac hypertrophy.
(62)
COOMe
ON
O
COOMe
COOMe
OCOOMeN
SO
O (63)
Figure RL48: 1,3-Dicarbonyl analogs (PPARγ synthetic ligands)
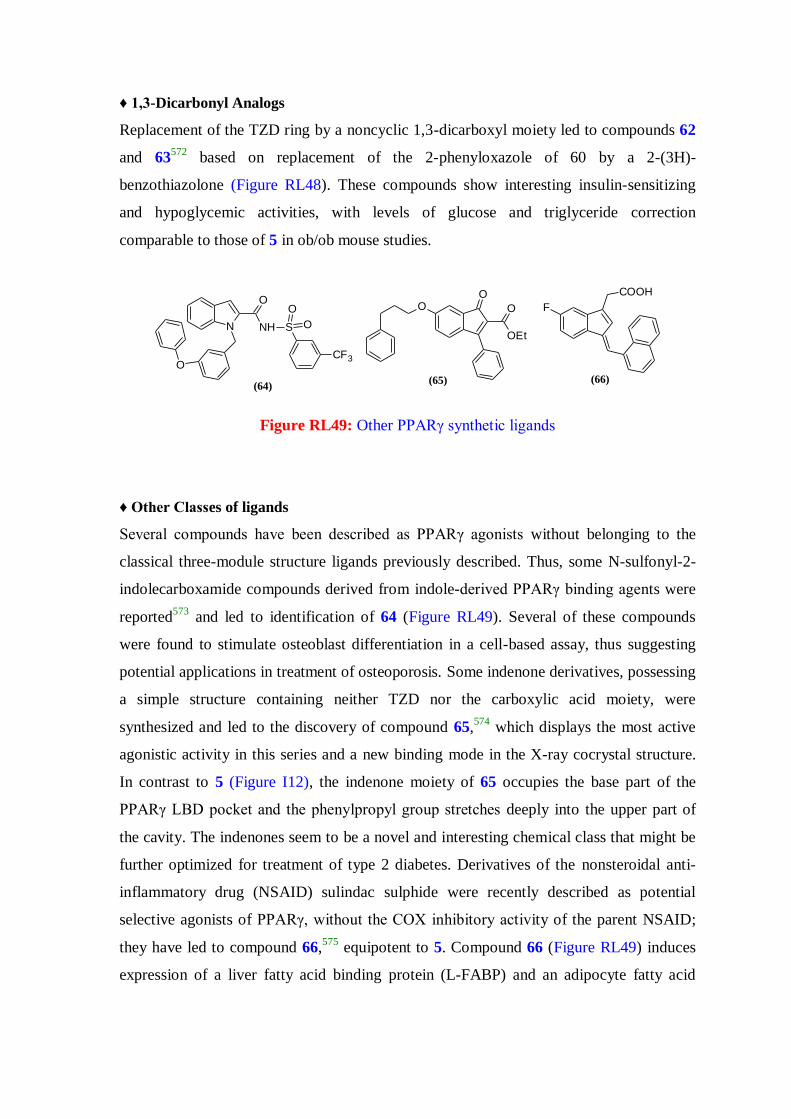
♦ 1,3-Dicarbonyl Analogs
Replacement of the TZD ring by a noncyclic 1,3-dicarboxyl moiety led to compounds 62
and 63572
based on replacement of the 2-phenyloxazole of 60 by a 2-(3H)-
benzothiazolone (Figure RL48). These compounds show interesting insulin-sensitizing
and hypoglycemic activities, with levels of glucose and triglyceride correction
comparable to those of 5 in ob/ob mouse studies.
(64)
N
O
NH
O
S
CF3
O
O
(65)
OEt
OOO
(66)
F
COOH
Figure RL49: Other PPARγ synthetic ligands
♦ Other Classes of ligands
Several compounds have been described as PPARγ agonists without belonging to the
classical three-module structure ligands previously described. Thus, some N-sulfonyl-2-
indolecarboxamide compounds derived from indole-derived PPARγ binding agents were
reported573
and led to identification of 64 (Figure RL49). Several of these compounds
were found to stimulate osteoblast differentiation in a cell-based assay, thus suggesting
potential applications in treatment of osteoporosis. Some indenone derivatives, possessing
a simple structure containing neither TZD nor the carboxylic acid moiety, were
synthesized and led to the discovery of compound 65,574
which displays the most active
agonistic activity in this series and a new binding mode in the X-ray cocrystal structure.
In contrast to 5 (Figure I12), the indenone moiety of 65 occupies the base part of the
PPARγ LBD pocket and the phenylpropyl group stretches deeply into the upper part of
the cavity. The indenones seem to be a novel and interesting chemical class that might be
further optimized for treatment of type 2 diabetes. Derivatives of the nonsteroidal anti-
inflammatory drug (NSAID) sulindac sulphide were recently described as potential
selective agonists of PPARγ, without the COX inhibitory activity of the parent NSAID;
they have led to compound 66,575
equipotent to 5. Compound 66 (Figure RL49) induces
expression of a liver fatty acid binding protein (L-FABP) and an adipocyte fatty acid

binding protein (aP2), two established PPARγ target genes. Taken together, these
compounds represent potential leads in the development of novel PPARγ agonists.
While the clinical benefits of PPARγ agonists in treating metabolic disorders have been
clearly demonstrated, the current generation of glitazone drugs has been associated with
undesirable side effects. Thus, there has been significant interest in the design of novel
PPARγ-modulating drugs. A moderate reduction in PPARγ activity has been shown to
prevent insulin resistance and obesity induced by a high-fat (HF) diet. Therefore,
appropriate functional modulating of PPARγ activity could be a logical approach to
protection against obesity and related diseases such as type 2 diabetes. For this reason,
efforts are being made to identify partial agonists. Genetic and pharmacologic studies
suggested that moderate activation of PPARγ can lead to better therapeutic outcome than
activation of the receptor with a high-affinity, potent full agonist.576
Partials agonists are
defined as weak activators of PPARγ that elicit the same activation pattern and show
linked dose−response curves but with lower maximal activity compared to full agonists.
They might induce alternative receptor conformation and thus recruit different
coactivators, resulting in distinct transcriptional effects compared to classical
glitazones.577
PPARγ antagonists appear to have effects similar to those of PPARγ agonists in rodents,
that is, generation of small adipocytes and attenuated secretion of adipokines that
interfere with insulin signaling. Consequently, not only PPARγ agonists but also PPARγ
antagonists could be of potential clinical use, as such compounds would increase insulin
sensitivity while preventing adipogenesis and obesity; thus, in contrast to TZD, they
would not induce weight gain.578
A moderate reduction in PPARγ activation with a
PPARγ antagonist was shown to decrease triglyceride (TG) content in white adipose
tissue, skeletal muscle, and liver. These inhibitors were shown to ameliorate high-fat-diet-
induced obesity and insulin resistance.
2.1.15.3. Dual PPAR Agonists
The development of a single compound displaying multitarget capacities would provide
enhancement of efficacy and/or improvement in safety compared to the present one-
drug−one-target methods. Potent agonists with mixed receptor selectivity toward PPARα
and PPARγ, also called dual PPARα/γ agonists, were thought to have significant potential

as novel antidiabetic agents.579
In recent years, dual PPARδ/γ, PPARα/δ, and pan-PPAR
α/δ/γ agonists have also emerged.
2.1.15.3.1. Dual PPARα/γ Agonists
Given the importance of controlling both glucose and lipid levels in type 2 diabetes, the
concept of identifying ligands that bind to and activate both PPARα and PPARγ
represents a logical continuation in the field of PPAR research. PPARγ agonists are
associated with improved insulin sensitivity and glucose tolerance but at the cost of
increased weight gain and other side effects, including liver dysfunction and bone loss.
The fibrates have shown specific efficacy in reducing angiographic progression of
coronary heart disease in type 2 diabetes mellitus, and this effect is most likely related to
correction of atherogenic dyslipidemia. In addition to their beneficial effects upon lipid
metabolism, there were reports in the literature that fibrates reduced body weight gain in
rodents without affecting food intake,580
leading to the hope that activation of PPARα
would mitigate the weight gain induced by PPARγ activation seen in humans. The
hypothesis that PPARα/γ dual agonism could provide additive and possibly synergistic
pharmacology has resulted in an intensive effort by the pharmaceutical industry to
develop and evaluate these agents. Dual activation of PPARα and PPARγ could, in
theory, also limit the occurrence of side effects associated with TZD therapy. Thus,
combined PPARα/γ activation has emerged as an interesting concept and spawned the
development of various coagonists.579
A number of PPARα/γ dual agonists have been
reported in this class of compounds and have shown robust insulin-sensitizing and
hypolipidemic activities in clinical trials.
SNH
O
O
ON
O
O DRF 2519 (67)
NH
O
O
O ON
O
JTT-501 (70)
SNH
O
O
OO
O
(68)
ONH
O
O
OO
(69)
Figure RL50: TZD analogs (dual PPARα/γ synthetic ligands)
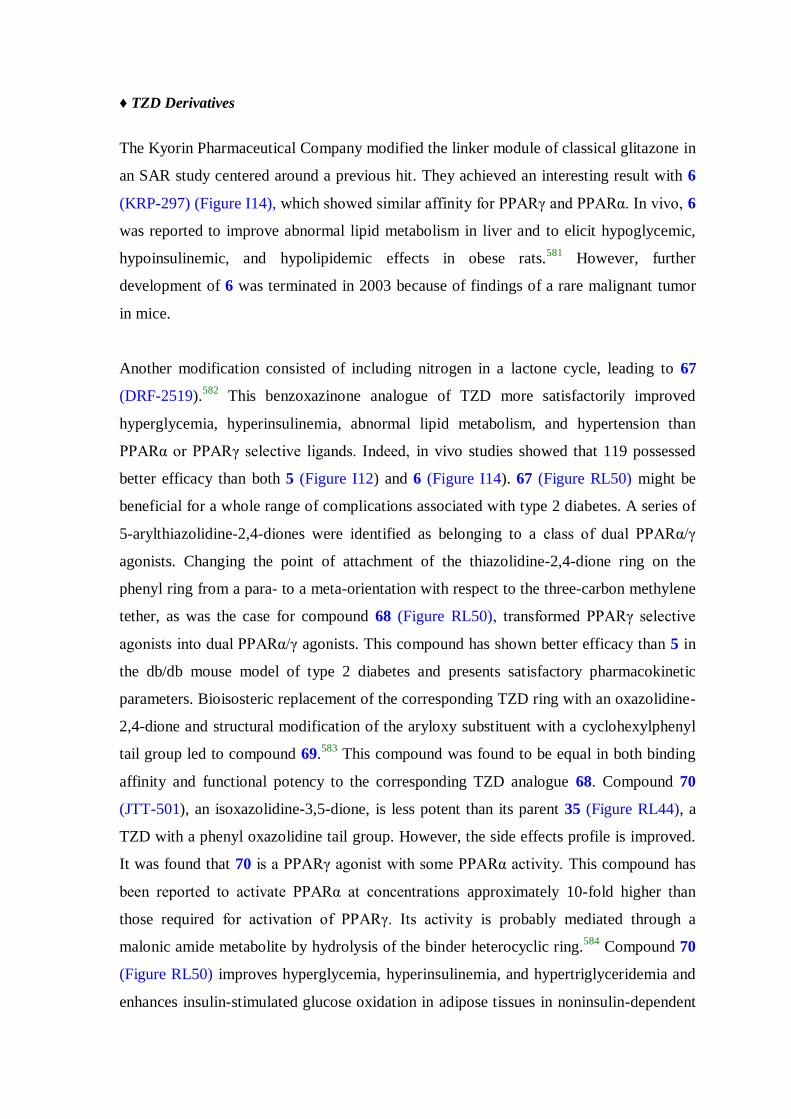
♦ TZD Derivatives
The Kyorin Pharmaceutical Company modified the linker module of classical glitazone in
an SAR study centered around a previous hit. They achieved an interesting result with 6
(KRP-297) (Figure I14), which showed similar affinity for PPARγ and PPARα. In vivo, 6
was reported to improve abnormal lipid metabolism in liver and to elicit hypoglycemic,
hypoinsulinemic, and hypolipidemic effects in obese rats.581
However, further
development of 6 was terminated in 2003 because of findings of a rare malignant tumor
in mice.
Another modification consisted of including nitrogen in a lactone cycle, leading to 67
(DRF-2519).582
This benzoxazinone analogue of TZD more satisfactorily improved
hyperglycemia, hyperinsulinemia, abnormal lipid metabolism, and hypertension than
PPARα or PPARγ selective ligands. Indeed, in vivo studies showed that 119 possessed
better efficacy than both 5 (Figure I12) and 6 (Figure I14). 67 (Figure RL50) might be
beneficial for a whole range of complications associated with type 2 diabetes. A series of
5-arylthiazolidine-2,4-diones were identified as belonging to a class of dual PPARα/γ
agonists. Changing the point of attachment of the thiazolidine-2,4-dione ring on the
phenyl ring from a para- to a meta-orientation with respect to the three-carbon methylene
tether, as was the case for compound 68 (Figure RL50), transformed PPARγ selective
agonists into dual PPARα/γ agonists. This compound has shown better efficacy than 5 in
the db/db mouse model of type 2 diabetes and presents satisfactory pharmacokinetic
parameters. Bioisosteric replacement of the corresponding TZD ring with an oxazolidine-
2,4-dione and structural modification of the aryloxy substituent with a cyclohexylphenyl
tail group led to compound 69.583
This compound was found to be equal in both binding
affinity and functional potency to the corresponding TZD analogue 68. Compound 70
(JTT-501), an isoxazolidine-3,5-dione, is less potent than its parent 35 (Figure RL44), a
TZD with a phenyl oxazolidine tail group. However, the side effects profile is improved.
It was found that 70 is a PPARγ agonist with some PPARα activity. This compound has
been reported to activate PPARα at concentrations approximately 10-fold higher than
those required for activation of PPARγ. Its activity is probably mediated through a
malonic amide metabolite by hydrolysis of the binder heterocyclic ring.584
Compound 70
(Figure RL50) improves hyperglycemia, hyperinsulinemia, and hypertriglyceridemia and
enhances insulin-stimulated glucose oxidation in adipose tissues in noninsulin-dependent

diabetes mellitus models. In particular, the triglyceride-lowering activity of 70 is a unique
characteristic compared to thiazolidinedione counterparts. 579
♦ α-Alkoxy/aryloxy-β-phenylpropionic Acid Derivatives
The first alkoxypropionic acid to display dual PPARα/γ agonist activities was described
in 2001 and called tesaglitazar (7) (Figure I14), developed by AstraZeneca. The crystal
structures of PPARα and PPARγ in complex with 7 revealed a conserved hydrogen
bonding network involving a Tyr in the AF2 helix that had to be formed in order to
stabilize LBD in the active conformation throughout the entire PPAR family. Compound
7 monotherapy was reported to improve markers of glycemic control and atherogenic
dyslipidemia at doses of 0.5 and 1 mg daily in subjects with manifestations of insulin
resistance or type 2 diabetes.585
A phase 3 program was conducted to examine the effects
of 7 when given to patients with type 2 diabetes. However, in 2006, its development was
discontinued in phase 3 of clinical trials after the emergence of several adverse effects,
elevated serum creatinine and associated decreases in the glomerular filtration rate.586
Scientists at Dr. Reddy’s Research Foundation also came out with a series of α-ethoxy-β-
phenylpropionic acid derivatives exemplified by ragaglitazar (8) (Figure I14), which
contains a phenoxazine group as the lipophilic tail portion of the molecule.587
Compound
8, by virtue of its dual PPARα- and PPARγ-activating property, acted on both the liver
and adipose tissue and thereby shows greater improvement not only of hyperglycemia and
hyperinsulinemia but also of abnormal lipid metabolism than marketed PPARα- or
PPARγ-selective agonists. Despite demonstrating advantages in preclinical models, 8 was
suspended from clinical studies because of development of bladder tumors in rodents.588
To further understand the SAR generated in this series of 124 derivatives, additional
tricyclic analogues were designed and synthesized and led to carbazole 9 (Figure I14),589
which has a better dual PPARα/PPARγ activity profile than 8.

COOH
O
OO
FCN
Cl
Ca2+,3H2O
2E3030 (73)
O
O O
COOH
O
Naveglitazar (71)
COOH
O
O
O
LSN862 (72)
NO
COOH
O
Cl
PAR-5359 (74)
O
COOH
ON
O
S
Aleglitazar (75)
Figure RL51: α-alkoxy β-phenylpropionic acid derivatives (dual PPARα/γ synthetic ligands)
Naveglitazar (71) (Figure RL51) was a γ-dominant PPAR α/γ dual agonist somewhat like
farglitazar. This compound showed significant reduction in mean fasting serum glucose
levels and triglyceride levels. It was selected for clinical evaluation in the treatment of
type 2 diabetes. Cardiac effects in rats treated with 71 were similar to those reported for
other PPARγ agonists and α/γ dual agonists. Furthermore, treatment of rats with 71 was
associated with an increased incidence of sarcomas in males and urothelial tumors in
females, thus leading to discontinuation of this compound in clinical studies.590
Modification of the linker of 71, by replacing the oxygen directly bound to the central
aryl ring with an alkyne moiety, provided compound 72 (LSN862). The alkyne linker did
not affect the PPARα/γ selectivity profile and was still flexible enough to be adapted to
both receptors. This compound was reported to be a high-affinity PPARγ partial agonist
with relatively weaker but still significant PPARα agonist activity.591
Compound 73
(E3030), a calcium salt of α-isopropyloxy-β-phenylpropionic acid, was reported to be a
potent dual activator of PPARα and PPARγ in animal models. Experimental results
suggested that this compound had potential for use in treatment of various types of
metabolic dysfunction in type 2 diabetes, including dyslipidemia, hyperglycemia,
hyperinsulinemia, and impaired glucose disposal.592
The Dong-A Pharmaceutical
Company characterized the pharmacological profile of 74 (PAR-5359), reported to be a
well-balanced coagonist of PPARα and PPARγ and which demonstrated excellent
antihyperglycemic and hypolipidemic activities. However, the pharmaceutical group
decided not to enter into clinical development of 74 because of failure to guarantee a
sufficient safety margin based on long-term toxicological studies.593
Compound 12
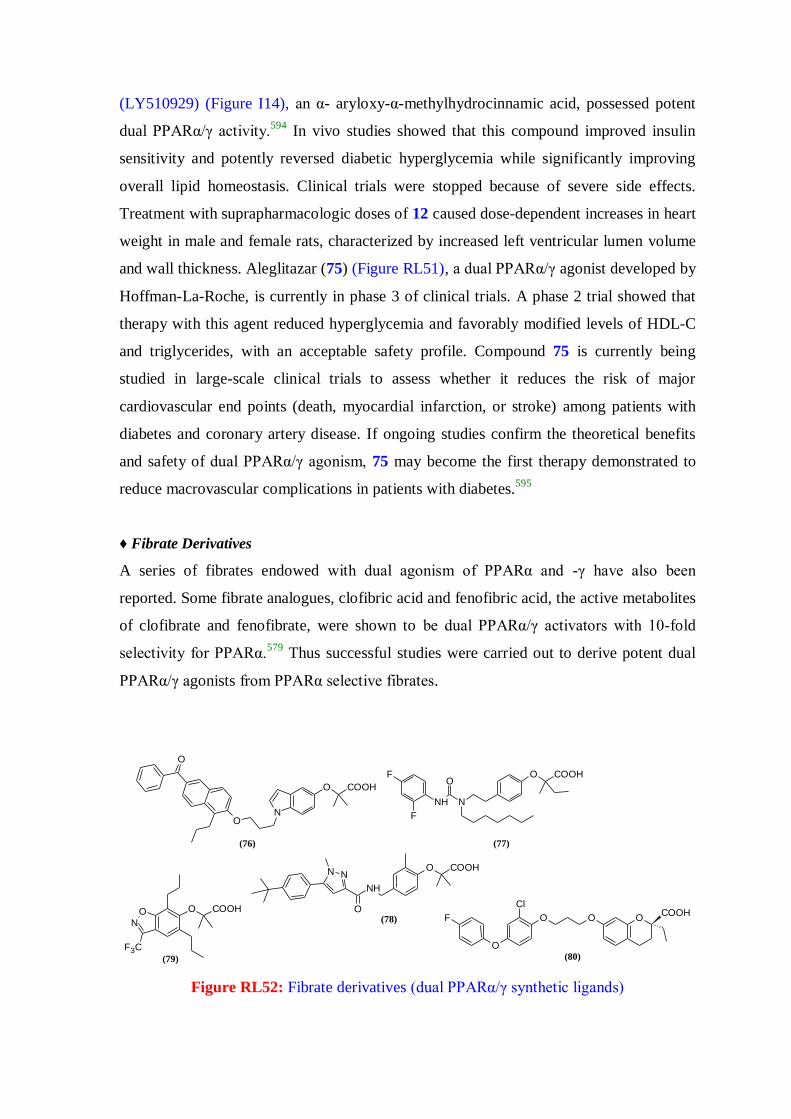
(LY510929) (Figure I14), an α- aryloxy-α-methylhydrocinnamic acid, possessed potent
dual PPARα/γ activity.594
In vivo studies showed that this compound improved insulin
sensitivity and potently reversed diabetic hyperglycemia while significantly improving
overall lipid homeostasis. Clinical trials were stopped because of severe side effects.
Treatment with suprapharmacologic doses of 12 caused dose-dependent increases in heart
weight in male and female rats, characterized by increased left ventricular lumen volume
and wall thickness. Aleglitazar (75) (Figure RL51), a dual PPARα/γ agonist developed by
Hoffman-La-Roche, is currently in phase 3 of clinical trials. A phase 2 trial showed that
therapy with this agent reduced hyperglycemia and favorably modified levels of HDL-C
and triglycerides, with an acceptable safety profile. Compound 75 is currently being
studied in large-scale clinical trials to assess whether it reduces the risk of major
cardiovascular end points (death, myocardial infarction, or stroke) among patients with
diabetes and coronary artery disease. If ongoing studies confirm the theoretical benefits
and safety of dual PPARα/γ agonism, 75 may become the first therapy demonstrated to
reduce macrovascular complications in patients with diabetes.595
♦ Fibrate Derivatives
A series of fibrates endowed with dual agonism of PPARα and -γ have also been
reported. Some fibrate analogues, clofibric acid and fenofibric acid, the active metabolites
of clofibrate and fenofibrate, were shown to be dual PPARα/γ activators with 10-fold
selectivity for PPARα.579
Thus successful studies were carried out to derive potent dual
PPARα/γ agonists from PPARα selective fibrates.
N
O COOH
O
O
(76)
O COOH
NNH
O
F
F
(77)
O COOH
NH
NN
O(78)
O COOHON
F3C
(79)
OCOOH
OO
Cl
O
F
(80)
Figure RL52: Fibrate derivatives (dual PPARα/γ synthetic ligands)
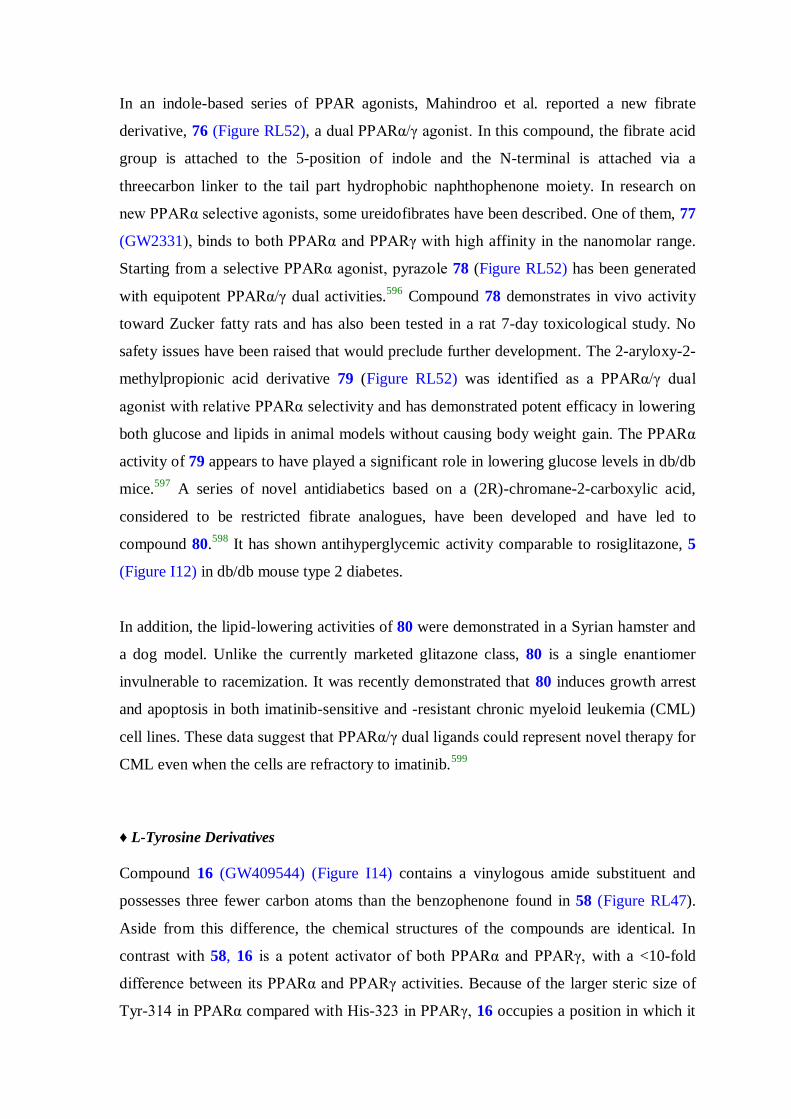
In an indole-based series of PPAR agonists, Mahindroo et al. reported a new fibrate
derivative, 76 (Figure RL52), a dual PPARα/γ agonist. In this compound, the fibrate acid
group is attached to the 5-position of indole and the N-terminal is attached via a
threecarbon linker to the tail part hydrophobic naphthophenone moiety. In research on
new PPARα selective agonists, some ureidofibrates have been described. One of them, 77
(GW2331), binds to both PPARα and PPARγ with high affinity in the nanomolar range.
Starting from a selective PPARα agonist, pyrazole 78 (Figure RL52) has been generated
with equipotent PPARα/γ dual activities.596
Compound 78 demonstrates in vivo activity
toward Zucker fatty rats and has also been tested in a rat 7-day toxicological study. No
safety issues have been raised that would preclude further development. The 2-aryloxy-2-
methylpropionic acid derivative 79 (Figure RL52) was identified as a PPARα/γ dual
agonist with relative PPARα selectivity and has demonstrated potent efficacy in lowering
both glucose and lipids in animal models without causing body weight gain. The PPARα
activity of 79 appears to have played a significant role in lowering glucose levels in db/db
mice.597
A series of novel antidiabetics based on a (2R)-chromane-2-carboxylic acid,
considered to be restricted fibrate analogues, have been developed and have led to
compound 80.598
It has shown antihyperglycemic activity comparable to rosiglitazone, 5
(Figure I12) in db/db mouse type 2 diabetes.
In addition, the lipid-lowering activities of 80 were demonstrated in a Syrian hamster and
a dog model. Unlike the currently marketed glitazone class, 80 is a single enantiomer
invulnerable to racemization. It was recently demonstrated that 80 induces growth arrest
and apoptosis in both imatinib-sensitive and -resistant chronic myeloid leukemia (CML)
cell lines. These data suggest that PPARα/γ dual ligands could represent novel therapy for
CML even when the cells are refractory to imatinib.599
♦ L-Tyrosine Derivatives
Compound 16 (GW409544) (Figure I14) contains a vinylogous amide substituent and
possesses three fewer carbon atoms than the benzophenone found in 58 (Figure RL47).
Aside from this difference, the chemical structures of the compounds are identical. In
contrast with 58, 16 is a potent activator of both PPARα and PPARγ, with a <10-fold
difference between its PPARα and PPARγ activities. Because of the larger steric size of
Tyr-314 in PPARα compared with His-323 in PPARγ, 16 occupies a position in which it

binds deeper into the PPARα ligand binding pocket than 58 in the PPARγ pocket (Figure
RL53). Thus, the potent dual PPARα/γ agonist activity of 16, in which three carbon atoms
are removed from farglitazar, is the result of re-engineering of the ligand to accommodate
the larger size of the Tyr-314 residue in PPARα (Figure RL53).75
16 is also a potent
PPARγ ligand. The different type interactions of 16 with PPARγ protein is shown in
figure RL54. Replacement of phenyl in the benzophenone of 58 with a furan ring led to
81 (C333H) (Figure RL55), reported to be a more potent agonist of PPARα than 2 (Figure
I11); indeed, it was found to have a PPARγ activation effect similar to that of 5. It not
only controls glucose and lipid metabolism but also promotes preadipocyte differentiation
and improves insulin resistance. Further studies should be carried out to develop 138 as a
novel therapy for metabolic disease.600
A series of compounds containing the piperazine
ring, represented by 82 (P633H), have been designed on the basis of previously described
compounds 58 (farglitazar) and 16 (GW409544). Preliminary studies in mice showed that
82 (Figure RL55) is well-tolerated in mice, with favorable pharmacokinetics and
excellent oral bioavailability. Thus, 82 displays satisfactory druglike characteristics.601
Although 82 was reported to be a high-potency PPARα/γ dual agonist with good
functional activity in vitro, it produces opposing antidiabetic effects, promoting hepatic
gluconeogenesis while increasing blood glucose levels in diabetic mice.579
ON
O COOH
NH
O
OC333H (81)
ON
O COOH
N
N
S
F
O
OP633H (82)
Figure RL55: Tyrosine analogs (dual PPARα/γ synthetic ligands)

Figure RL53: X-ray crystal structure of the PPARα LBD. (A) The PPARα protein is
displayed as a red worm with the AF2 helix in red and K292 in dark blue. The LxxLL
peptide is displayed as a purple worm. The agonist ligand GW409544 is displayed in
space-filling representation colored by atom type. The solventaccessible ligand binding
pocket is shown as a white dot surface. Helices 2, 2’, 3, 9, and 10 are indicated. The
amino acids Phe-273, Lys-292, Tyr-314, Glu-462, and Tyr-464 are displayed in light
blue. (B) A 2Fo -Fc omit map showing the electron density (1σ) of the ligand and the
surrounding residues. (C) Key hydrogen bonding (yellow line) and hydrophobic (white
broken line) interactions between GW409544 and the PPARα protein and a bound water
molecule.
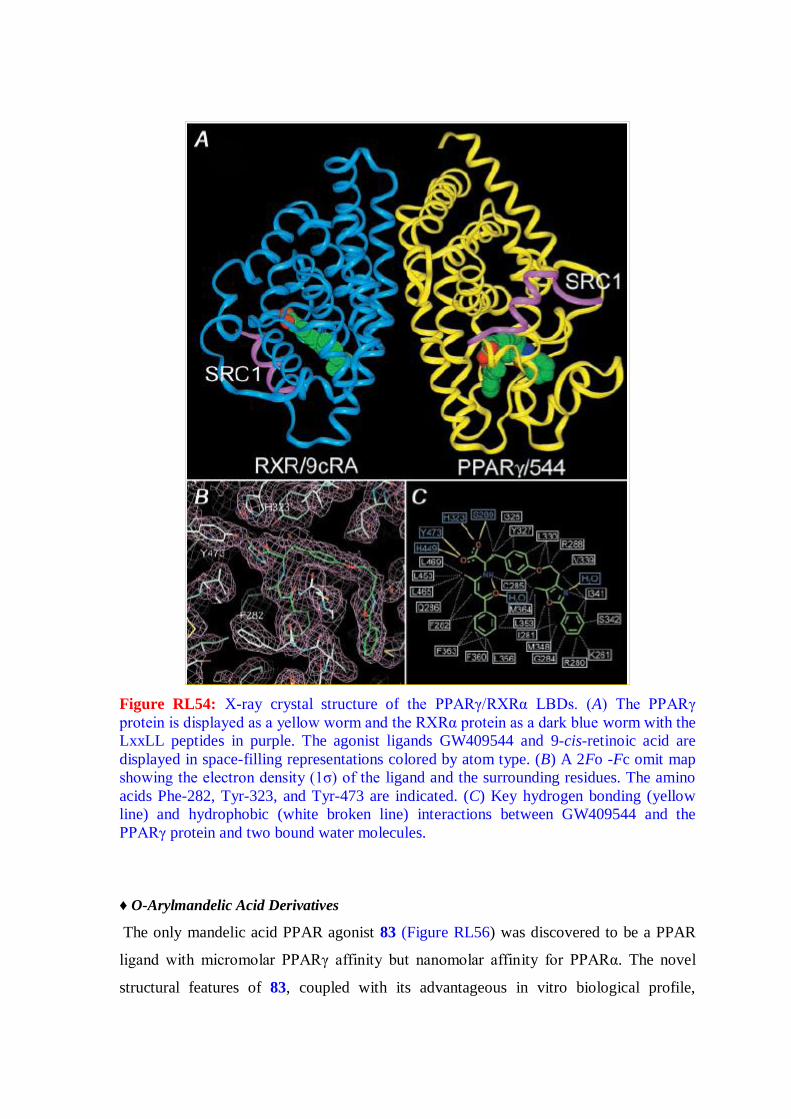
Figure RL54: X-ray crystal structure of the PPARγ/RXRα LBDs. (A) The PPARγ
protein is displayed as a yellow worm and the RXRα protein as a dark blue worm with the
LxxLL peptides in purple. The agonist ligands GW409544 and 9-cis-retinoic acid are
displayed in space-filling representations colored by atom type. (B) A 2Fo -Fc omit map
showing the electron density (1σ) of the ligand and the surrounding residues. The amino
acids Phe-282, Tyr-323, and Tyr-473 are indicated. (C) Key hydrogen bonding (yellow
line) and hydrophobic (white broken line) interactions between GW409544 and the
PPARγ protein and two bound water molecules.
♦ O-Arylmandelic Acid Derivatives
The only mandelic acid PPAR agonist 83 (Figure RL56) was discovered to be a PPAR
ligand with micromolar PPARγ affinity but nanomolar affinity for PPARα. The novel
structural features of 83, coupled with its advantageous in vitro biological profile,
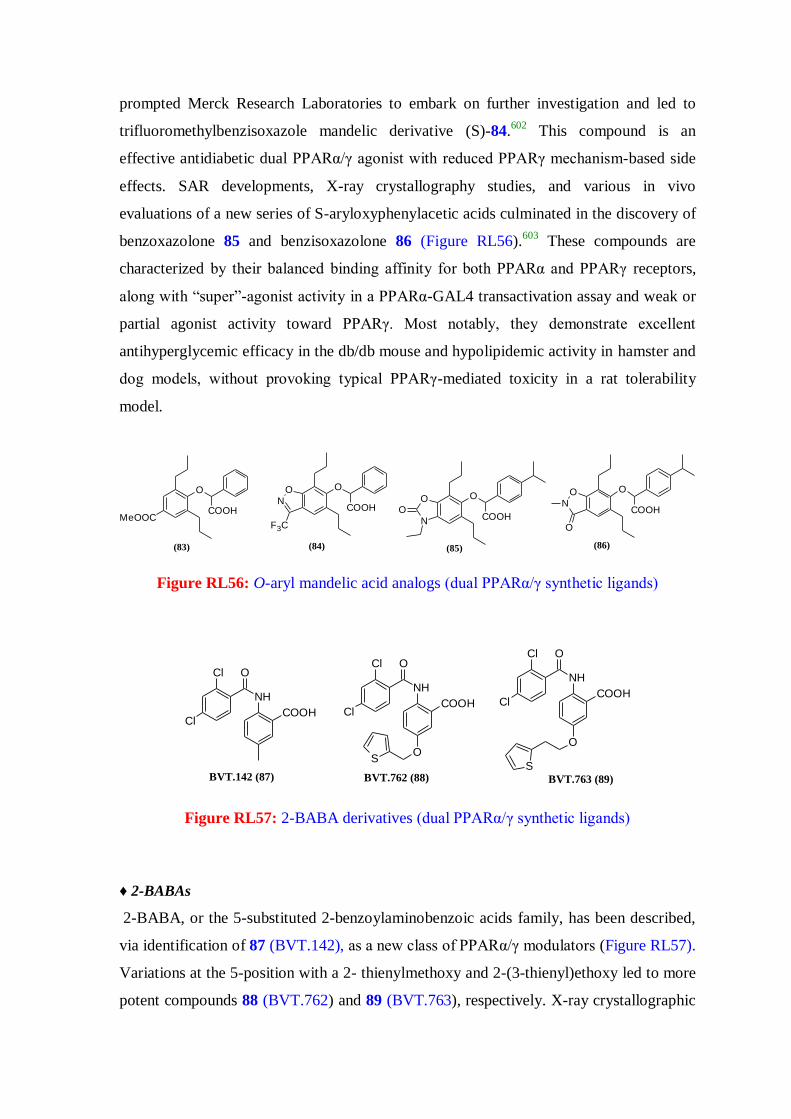
prompted Merck Research Laboratories to embark on further investigation and led to
trifluoromethylbenzisoxazole mandelic derivative (S)-84.602
This compound is an
effective antidiabetic dual PPARα/γ agonist with reduced PPARγ mechanism-based side
effects. SAR developments, X-ray crystallography studies, and various in vivo
evaluations of a new series of S-aryloxyphenylacetic acids culminated in the discovery of
benzoxazolone 85 and benzisoxazolone 86 (Figure RL56).603
These compounds are
characterized by their balanced binding affinity for both PPARα and PPARγ receptors,
along with “super”-agonist activity in a PPARα-GAL4 transactivation assay and weak or
partial agonist activity toward PPARγ. Most notably, they demonstrate excellent
antihyperglycemic efficacy in the db/db mouse and hypolipidemic activity in hamster and
dog models, without provoking typical PPARγ-mediated toxicity in a rat tolerability
model.
O
MeOOCCOOH
(83)
O
COOH
ON
F3C
(84)
O
COOH
O
NO
(85)
O
COOH
ON
O
(86)
Figure RL56: O-aryl mandelic acid analogs (dual PPARα/γ synthetic ligands)
COOH
NH
OCl
Cl
BVT.142 (87)
O
COOH
NH
OCl
Cl
S
BVT.762 (88)
O
COOH
NH
OCl
Cl
SBVT.763 (89)
Figure RL57: 2-BABA derivatives (dual PPARα/γ synthetic ligands)
♦ 2-BABAs
2-BABA, or the 5-substituted 2-benzoylaminobenzoic acids family, has been described,
via identification of 87 (BVT.142), as a new class of PPARα/γ modulators (Figure RL57).
Variations at the 5-position with a 2- thienylmethoxy and 2-(3-thienyl)ethoxy led to more
potent compounds 88 (BVT.762) and 89 (BVT.763), respectively. X-ray crystallographic
data showed that these compounds utilize a novel binding epitope not involving classical
agonist characteristic interactions of thiazolidinediones. Compound 88 (Figure RL57)
occupies a region in proximity to helix 3, and its carboxylic acid group interacts with the
backbone nitrogen of Ser-342. 2-BABA derivatives act by binding at the entrance of the
ligand pocket and activate the receptor without direct interaction with helix 12.604
♦ Other Synthetic PPARα/γ Agonist Ligands
Another study of pure pharmacochemistry was rewarded by the discovery of
muraglitazar (13) (Figure I14), with a large binder module similar to that of 58 (Figure
RL47). Contrary to the preceding compounds, 13 does not bear a chiral center in its
binder module, therefore considerably simplifying its synthesis. In early clinical studies,
13 demonstrated a significant glucose-lowering reduction in triglycerides and an increase
in HDL-C in patients with type 2 diabetes.605
The drug completed phase 3 clinical trials.
However, in 2006, its further development was discontinued. Meta-analysis of phase 2
and phase 3 clinical trials revealed that it was associated with a greater incidence of
myocardial infarction, stroke, and transient ischemic attacks.606
SARs of the
oxybenzylglycine series were developed by examining the effects of a conformational
restriction at the carbamate N-acid moiety, leading to the triazole acid analogue 90
(Figure RL58).607
This compound exhibited very potent dual PPARα and PPARγ agonist
activity in vitro and also showed excellent antidiabetic and antidyslipidemic activity in a
diabetic db/db mouse model. Imiglitazar (91) was a novel oxyiminoalkanoic acid
derivative with potent PPARα/γ activities.608
In various rodent models of insulin
resistance and type 2 diabetes mellitus, 91 showed favorable pharmacokinetic properties,
with good absorption and duration, and exhibited marked glucose- and lipid-lowering
activities without causing significant body weight gain. Unfortunately, 91 was placed on
clinical hold because of findings of abnormalities in liver enzymes in a small number of
patients during the course of phase 3 studies. Cevoglitazar (92), developed by Novartis, is
a very potent pharmacological agent that improves insulin sensitivity, glucose tolerance,
and plasma lipid and inflammatory markers in animal models predictive of type 2
diabetes and metabolic syndrome in humans. More remarkably, 92 shows a desirable
antiobesity effect in both genetically obese and diabetic ob/ob mice and obese insulin-
resistant cynomolgus monkeys.

OON
O
O
COOMeZ
Z = double bond (93)
Z = single bond (94)
ON
O N
S
COOH
F3C
CG301269 (95)
S
ON
O
F3C
N
COOHOO
Cevoglitazar (92)
O
ON
O N
COOHImiglitazar (91)
ON
O NN
N
COOH
Imiglitazar (90)
Figure RL58: Other dual PPARα/γ agonists (synthetic ligands)
These preclinical results demonstrated that 92 (Figure RL58) holds promise in the
treatment of diabetes and obesity-related disorders because of its unique beneficial effect
on energy balance, in addition to improving glycemic and metabolic control.609
A series
of benzopyran derivatives were synthesized, and their insulinsensitizing activities were
evaluated in 3T3-L1 cells. Compounds 93 and 94 (Figure RL58) exhibit more potent
insulin-sensitizing activity than 5 (Figure I12). When comparing these compounds, the
single-bond and double-bond derivative did not show much difference in activity.
Compound 94 shows PPARα/γ dual agonist activity and exerts potent and efficacious
hypoglycemic, hypolipidemic, and insulin-sensitizing effects in ob/ob mice. It not only
lowers lipids in peripheral circulation but also reduces triglyceride deposits in skeletal
muscle.610
Various substitutions on the phenyl ring of the 2-(5-methyl-2-aryloxazol-4-
yl)ethanol block were designed but led to compounds less potent than 94. Recently, a
novel PPARα/γ dual agonist, 95 (CG301269), has been reported to enhance fatty acid
oxidation in vitro and ameliorate insulin resistance and hyperlipidemia in vivo.611
In
db/db mice, 95 (Figure RL58) reduced inflammatory responses and fatty liver without
body weight gain. These data suggest that 95 might be a potential lead compound against
obesity and related metabolic disorders.

S
ClCOOH
OON
L-165461 (96)
S
COOH
OON
F3C
Cl
L-783483 (97)
S
COOH
OO
Cl
L-796449 (98)
F3C
N
O
F3C CF3
O COOH
(99)
Figure RL59: Dual PPARγ/δ agonists (synthetic ligands)
2.1.15.3.2. Dual PPARγ/δ Agonists
In recent years, an interest in PPARγ/δ coagonists has developed. Both PPARδ and
PPARγ improve insulin sensitivity and glucose tolerance. Furthermore, activation of
PPARδ is beneficial in terms of plasma lipoprotein levels and reduced adiposity.
Combined activation is believed to correct metabolic disorders associated with T2DM
with greater efficacy than single PPAR activation. The beneficial effects on lipid
homeostasis and the ability to stimulate reverse cholesterol transport are expected to
significantly impede progression of atherosclerosis, which could contribute to lowering of
the mortality rates of type 2 diabetic patients. Furthermore, the propensity of PPARδ
activation for improving insulin sensitivity and increasing fatty acid oxidation suggests
that a dual PPARγ/δ agonist could attenuate the undesired weight gain occurring with
selective PPARγ agonists. However, reports of PPARγ/δ dual agonists are limited. Berger
et al. first reported a series of phenylacetic acid derivatives such as 96 (L-165461), 97 (L-
783483), and 98 (L-796449), which showed potent activity toward PPARγ and PPARδ,
and were able to normalize glucose and triglyceride levels (Figure RL59). Liu et al.
developed general solid-phase synthesis of lipophilic carboxylic acids that led to
identification of a potent PPARγ/δ dual agonist fibrate derivative, 99.612
This compound
showed good plasma exposure in rats and demonstrated antihyperglycemic and
antihyperlipidemic efficacy in diabetic fatty Zucker rats. However, no data regarding
other key end points such as effects on body weight or inflammation markers were
reported. Currently, some pharmaceutical organisations are involved in research for
developing PPARγ/δ dual agents.

COOH
O
NH
O
F3C
F
(101)
O COOH
N
Cl F
NH
O
Cl
Cl
GW2433 (100)
Figure RL60: Dual PPARα/δ agonists (synthetic ligands)
2.1.15.3.3. Dual PPARα/δ Agonists
The observation that both PPARα and PPARδ agonists increased HDL-C levels in human
and animal models prompted development of new molecules targeting both PPAR
isotypes, with the hope of potentiating individual effects on HDL-C induction. Only a few
dual PPARα/δ agonists have been reported and are still at the discovery stage, such as the
fibrate analogue 100 (GW2433) (Figure RL60).613
Some optically active α-
ethylphenylpropionic acid derivatives have also been reported, represented by 101, based
on structural modifications of the potent PPARα selective agonist 27 (Figure RL43). This
new PPARα/δ dual agonist shows potent human nanomolar effects on PPARα and
PPARδ compared to PPARγ. In this compound, the three-atom unit linker -CH2-NH-CO-
of 27 was modified to a -CO-NH-CH2- linker that appeared to increase both PPARα and
PPARδ transactivation activities. Furthermore, the activity of this compound resides
almost exclusively in the (S)-enantiomer.614
Dual PPARα/δ agonists of other chemical
scaffolds have also been reported.
2.1.15.4. Pan-Agonists
Along with the dual agonists, PPAR pan-agonists that would combine the agonistic
activities of PPARγ, PPARα, and PPARβ/δ in a single ligand are also being explored and
may prove to be the ultimate combination of PPAR activities for treatment of type 2
diabetes and its further complications. PPAR pan-agonists would regroup then beneficial
effects of the three PPARs by normalizing insulin resistance, plasma lipids, and adiposity.
They are believed to be more effective than dual PPAR agonists.615
Some PPAR
panagonistic compounds with potential antihyperglycemic, lipidmodulating, and insulin-
sensitizing activities have been recently reported and have elicited much interest due to
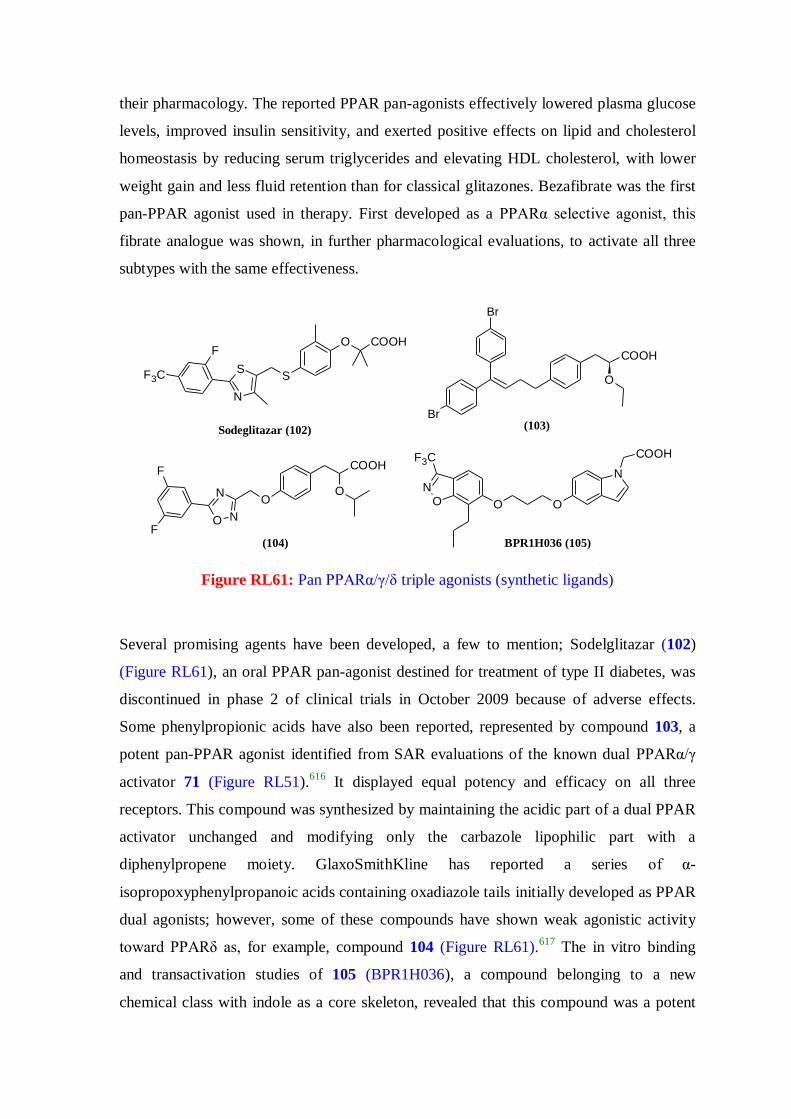
their pharmacology. The reported PPAR pan-agonists effectively lowered plasma glucose
levels, improved insulin sensitivity, and exerted positive effects on lipid and cholesterol
homeostasis by reducing serum triglycerides and elevating HDL cholesterol, with lower
weight gain and less fluid retention than for classical glitazones. Bezafibrate was the first
pan-PPAR agonist used in therapy. First developed as a PPARα selective agonist, this
fibrate analogue was shown, in further pharmacological evaluations, to activate all three
subtypes with the same effectiveness.
N
COOH
OOON
F3C
BPR1H036 (105)
COOH
OO
N
N
O
F
F(104)
Br
Br
COOH
O
(103)
O COOH
SS
N
F
F3C
Sodeglitazar (102)
Figure RL61: Pan PPARα/γ/δ triple agonists (synthetic ligands)
Several promising agents have been developed, a few to mention; Sodelglitazar (102)
(Figure RL61), an oral PPAR pan-agonist destined for treatment of type II diabetes, was
discontinued in phase 2 of clinical trials in October 2009 because of adverse effects.
Some phenylpropionic acids have also been reported, represented by compound 103, a
potent pan-PPAR agonist identified from SAR evaluations of the known dual PPARα/γ
activator 71 (Figure RL51).616
It displayed equal potency and efficacy on all three
receptors. This compound was synthesized by maintaining the acidic part of a dual PPAR
activator unchanged and modifying only the carbazole lipophilic part with a
diphenylpropene moiety. GlaxoSmithKline has reported a series of α-
isopropoxyphenylpropanoic acids containing oxadiazole tails initially developed as PPAR
dual agonists; however, some of these compounds have shown weak agonistic activity
toward PPARδ as, for example, compound 104 (Figure RL61).617
The in vitro binding
and transactivation studies of 105 (BPR1H036), a compound belonging to a new
chemical class with indole as a core skeleton, revealed that this compound was a potent
PPAR pan-agonist.618
In vitro biochemical studies of glucose uptake, adipocyte
differentiation, and insulin-sensitizing activity have shown that 166 is an excellent
candidate for further studies as an antidiabetic agent. The compound has demonstrated
highly efficacious glucose-lowering activity in in vivo studies in KKAy mice and an
excellent pharmacokinetic profile. The same authors further explored new hydrophobic
building blocks such as the 6-benzoyl-1-propylnaphthalen- 2-yl tail part of the indole-
based PPAR agonists.619
Several other efforts are in progress for developing successful
pan agonists.
New pharmacological compounds having the ability to simultaneously target more than
one receptor, with the exception of the PPAR subtypes, have also been described. Dual
functional agents as PPARγ agonists and 11β-HSD1 inhibitors,620
dual functional agents
as PPAR agonists and cannabinoids,621
dual functional agent as a PPAR agonist and COX
inhibitor622
etc are some interesting areas where research for developing successful agents
is going on.
2.1.16. Partial Agonists to keep away/reduce adverse effects
Especially in the case of PPARγ, companies are develoing partial agonists with the goal
of retaining the beneficial effects of this class of agents, while diminishing their adverse
effects. Companies that are developing such agents include Metabolex, Roche, Evolva
and Astellas.
The lead candidate, metaglidasen (Figure RL62), of Metabolex has a different chemical
structure and mechanism of action than the insulin sensitizers currently in the market.
Unlike pioglitazone and rosiglitazone, metaglidasen is a non-TZD. Whereas drugs from
the TZD class are full agonists of the PPARγ and selectively modifies gene expression
needed for insulin sensitization without activating the genes responsible for weight gain
and edema. On June 10, 2006, Metabolex announced that it had initiated a Phase II/III
clinical trial of metaglidasen in patients with T2D. In a previous Phase II clinical trial,
metaglidasen was well tolerated and lowered blood glucose and triglycerides. Unlike
PPAR full agonists, metaglidasen did not caue weight gain or edema.147

At the Keystone Symposia Scientific Conference in Hayward, CA in January 2006,
Metabolex announced the results of a preclinical study of metaglidasen, which indicated
that it is a partial agonist of PPARγ. As with other partial agonists of nuclear receptors, it
recruits coactivators as an agonist rosiglitazone. This may explain different manner than
the full PPARγ the observed different pattern of gene expression seen with metaglidasen
as opposed to rosiglitazone. Specifically, metaglidasen appears to be less active in
activating pathways that result in adipocyte differentiation and enlargement. In animal
models, metaglidasen improved glycemic control in an equivalent manner to
rosiglitazone, but with less weight gain and less cardiac hypertrophy. Preclinical studies
also indicate that metaglidasen treatment preserves the function of insulin-producing
pancreatic beta cells. Because beta-cell function is often lost over time in type 2 diabetics,
resulting in the need for insulin treatment, this is a potential advantage of metaglidasen if
this finding is confirmed in human clinical trials.
In vitro studies by researchers from Astellas and Roche also indicate that their PPARγ
partial agonists (FK614 and PA-082, respectively) activate pathways that ameliorate
insulin resistance without stimulating fat accumulation in adipocytes.623,624
OO
OH
Cl
F
F
F
(4-chlorophenyl)[3-(trifluoromethyl)phenoxy]acetic acid
Figure RL62: Chemical structure of Metaglidasen
Intriguingly, in vitro and animal studies indicate that two angiotensin II receptor blockers
(ARBs) approved for the treatment of hypertension, telmisartan (Abbott/Boehringer
Ingelheim’s Micardis) and irbesartan (Sanofi-Aventis/BMS Avapro) are also partial
agonists of PPARγ.625
This is not a class effect of all ARBs (and is independent of
angiotensin II blocking activity), and telmisartan in particular appears to function as a
PPARγ partial agonist at pharmacologically relevant concentrations. Both of these agents
have established safety profiles. Because the metabolic syndrome includes hypertension
as well as insulin resistance, these findings with telmisartan and irbesartan suggest the
potential of developing safe and effective drugs that treat both aspects of the syndrome.
Studies with partial agonists of PPARγ suggest that a focus on partial PPAR agonists may
be a way of developing agents that have the desired efficacy of PPAR agonists without at
least some of their potential adverse effects. However, development of PPAR agonists
remains a challenging endeavor.
Benzimidazole, Indole, Acridone- heterocycles of great pharmacological importance
It is well documented in the literature that benzimidazole, indole and acridone scaffolds
are important structural core in medicinal chemistry because their derivatives exhibit
illustrious biological and pharmacological activities. The synthesis of benzimidazole
derivatives has gained importance during recent years because of their broad spectrum of
activities as antiviral,626
antitumor,627
antioxidant,628
anticoagulant,629
antihypertensive630
and antiparasitic agents.631
Indole nucleus is another heterocyclic pharmacophoric component of immense medicinal
significance. Suitably substituted or fused indole ring containing compounds demonstrate
antiproliferative activity in many types of human cancer cells,632
agonism to cannabinoid
receptors,633
antitumor activity,634
free radical scavenging activity,635,636
anti-
inflammatory activity.636
Similarly acridone nucleus is also indispensible in drug discovery research. The
compounds containing acridone structural unit may act potentially as antiherpesvirus
agents,637
antitumor agents,638
NS3 helicase inhibitor (that inhibits hepatitis C virus
replication),639
antimalarial agents.640
The antihypoglycemic activity of the 1,3-dicarbonyl compounds has been previously
investigated thoroughly and reported.641
The heterocyclyl linked benzylidine based
molecules are also reported to be active and show euglycemic activity.542
The
benzylidene 1,3-diesters are also reported to show antihypoglycemic activity.641

2.2. Computational
2.2.1. Molecular Modeling Techniques
In recent years, as computational modeling of binding and biological activity has matured
into a well accepted field of drug discovery, there has been a concomitant increase in the
application of computational modeling to Absorption, Distribution, Metabolism,
Excretion and Toxicity (ADMET) properties.
2.2.1.1. Computational Methodology
The currently available molecular modeling techniques can be broadly classified into four
major heads: a) Quantum mechanical methods, b) Correlation methods, c) Docking
methods and d) Mapping methods.
Analysis based on all these techniques start with the identification of the bioactive
conformation of the molecule concerned. The bioactive conformation may be obtained
from X-ray crystal structure analysis. If such information is not available, global
minimum conformation is considered as the bioactive conformation. Global minimum
structure of any given drug molecule can be obtained by carrying out a series of
molecular modeling exercises. The general procedure for these exercises involves
estimation of energy using either quantum chemical or molecular mechanical methods
(details given below), followed by performing energy minimization. Thus a possible
conformation of a drug molecule with reasonably reliable chemical representation of the
structure can be obtained. This conformation may be local minimum on the potential
energy surface of the drug molecule. To obtain the global minimum we have to perform
conformational search by manual or automated methods. Energy estimation using
quantum chemical methods, molecular mechanics methods, energy minimization,
conformational analysis are presented below.
Energy Minimization
Molecular structures generated in the computer have to be optimized to find the
individual energy minimum state. This is normally carried out with molecular mechanics
or quantum mechanical methods. In the course of minimization procedure, the molecular
structure is relaxed. The internal strain in the structures due to small deviation in the bond
lengths and angles are rectified. Before starting the geometry optimization, van der Waals
contacts should be removed. Several advantages like speed, sufficient accuracy and the
broad applicability on the small molecules as well as on large systems have established
the force field geometry optimization as the most important standard method. The
common energy minimization procedures used by molecular mechanics include steepest
descent minimizer, conjugate gradient method and Newton-Raphson method.642
Hence the choice of minimizer depends upon the size of the system and the current state
of the optimization. The convergence criterion in non-gradient methods like the steepest
descent is the increments in the energy or the coordinates while for the gradient systems
atomic gradients are used like root mean square gradient of the forces on each atom of the
molecule.
Conformational Analysis
Each molecule containing freely rotatable bonds exists at each moment in many different
conformations. The transformation from one conformer to the other is related to the
change in torsion angles. The changes in molecular conformations can be regarded as
movements on a multi-dimensional surface that describes the relationship between the
potential energy and the geometry of a molecule. Each point on the potential energy
surface represents the potential energy of a single conformation. Stable conformations of
a molecule correspond to local minima on this surface. The relative population of a
conformation depends on its statistical weight which is influenced by potential energy and
entropy. Therefore global minimum having the lowest potential energy is not necessarily
the structure with the highest statistical weight. The biological activity of a drug molecule
is supposed to depend on a single unique conformation on the potential energy surface
which is called as the bioactive conformation that can bind to the active site of the
molecule. It is widely accepted that the bioactive conformation is not necessarily the
lowest-energy conformation. Thus identification of various conformations is an important
task in medicinal chemistry. Various automated methods of conformational analysis are
known which include, the systematic search procedures, Monte Carlo methods, random
search methods, genetic algorithms, expert systems, molecular dynamics etc.643
The systematic search is the most natural of all the different conformational analysis
methods. It is performed by varying systematically each of the torsion angles of a molecule to
generate all possible conformations. The step size for torsion angle change is normally 30°.
The first step in the data reduction is a van der Waals screening or "bump check". The
screening procedure excludes all the conformations where a van der Waals volume overlap of

atoms, which are not directly bound to each other, is detected. The validity of the
conformation is detected by the sum of the van der Waals radii of non-bonded atoms. The
next step is the calculation of the potential energy of the conformers. It is in general
calculated by neglecting the electrostatic interactions. After the calculation of the
conformational energies, another possibility to reduce the number of conformations is the use
of energy window. It is based on the fact that the conformations containing much more
energy than those close to the minimum are neglected. This method is of advantage to
relatively rigid molecules. Monte Carlo methods or random search procedures follow a
different route and are of statistical nature. Molecular dynamics is another method of carrying
out systematic conformational search for a flexible molecule.
2.2.1.1.1. Quantum Mechanical Methods
Quantum mechanics is a fundamental physical theory which extends and corrects
Newtonian mechanics, especially at the atomic and subatomic levels. It gives a set of laws
that describe the behavior of small particles such as electrons and nuclei of atoms and
molecules. It is the underlying framework of many fields of physics and chemistry,
including condensed matter physics, quantum chemistry, and particle physics. The term
quantum (Latin, “how much”) refers to the discrete units that the theory assigns to certain
physical quantities, such as the energy of an atom at rest. Quantum chemistry is a branch
of theoretical chemistry. It is the application of quantum mechanics to problems in
chemistry. The description of the electronic behavior of atoms and molecules pertains to
their reactivity is an application of quantum chemistry. Quantum chemistry lies on the
border between chemistry and physics, and significant contributions have been made by
scientists from both branches of science. Organic chemists use quantum chemistry to
estimate the relative stabilities of molecules, to calculate properties of reaction
intermediates, to investigate the mechanisms of chemical reactions, to predict the
aromaticity of compounds and to analyze the NMR spectra. It is also applied by analytical
chemists for using the spectroscopic methods extensively and by inorganic chemists to
study the properties of determines the natural atomic orbitals, natural hybrid orbitals,
natural bond orbitals, natural localized molecular orbitals and uses them to perform
natural population analysis (NPA) and other tasks pertaining to localized analysis of wave
function properties. This program can be used extensively to study various kinds of
second order interactions present in the molecules hence is a tool to understand the
different electronic interactions in the molecules under investigation.644,645

2.2.1.1.2. Quantitative Structure Activity Relationship (QSAR)
It is almost 40 years since QSAR is in practice in the fields of agrochemistry,
pharmaceutical chemistry, toxicology and other facets of chemistry. It constitutes an
important ligand based technique as a drug design approach. This method employs the
construction of QSAR models to design new molecules. More than a century ago
indications came from various groups that physiological action of a substance is
dependent on its chemical composition. QSARs attempt to relate physical and chemical
properties of molecules to their biological activities. This can be achieved by using easily
calculable descriptors (for example, molecular weight, number of rotatable bonds, Log P).
Further developments over the years and contributions of Hammett and Taft laid the
mechanistic basis for the development of QSAR paradigm by Hansch and Fujita. Initially
2D QSAR or the Hansch approach took different kinds of descriptors, which did not
involve any 3D properties. It was known that the structural changes that affect biological
properties are electronic, steric and hydrophobic in nature. These properties were
described by Hammett as the electronic constants, Verloop Sterimol parameters and
hydrophobic constants. These type of descriptors are simple to calculate and allow for a
relatively fast analysis but often fail to take into account the 3D nature of chemical
structures (which obviously play a part in ligand-receptor binding, and hence activity).
The development in the field of molecular modeling and X-ray crystallography spawned
3D QSAR methodologies that were based on molecular shape approaches developed
independently by Simon et. al. and Hopfinger, distance geometry method by 'Crippen'. 3D
QSAR uses probe-based sampling within a molecular lattice to determine three-
dimensional properties of molecules (particularly steric and electrostatic features) and can
then correlate these 3D descriptors with biological activity. These are routinely used in
CADD. Then evolved the most successful module CoMFA (Comparative Molecular Field
Analysis) developed by Crammer in 1988646
Similar approach was adopted in developing
modules like CoMSIA (Comparative Molecular Similarity Index Analysis),647
SOMFA
(Self Organizing Molecular Field Analysis) and COMMA (Comparative Molecular
Moment Analysis). The broad history of the QSAR is described in table 1.4. Utilization
and predictivity of CoMFA itself has improved sufficiently in accordance to the
objectives to be achieved by it.648
Despite the formal differences between the various
methodologies, any QSAR method must include some identifiers of chemical structures,
reliably measured biological activities and molecular descriptors. In 3D QSAR, structural
descriptors are of immense importance in every QSAR model. Superimposition of the

molecules is necessary to construct good models. The main problems encountered are
related to improper superposition of molecules, greater flexibility of the molecules,
uncertainties about the bioactive conformation and about different binding modes of
ligands. The major assumptions in 3D QSAR include, the effect is produced by modeled
compound and not it's metabolites, the proposed conformation is the bioactive one, the
binding site is the same for all modeled compounds, the biological activity is largely
explained by enthalpic processes, entropic terms are similar for all the compounds, the
system is considered to be at equilibrium, and kinetics aspects are usually not considered,
pharmacokinetics parameters like solvent effects, diffusion, transport are not included.
While considering the template, conformation from the crystal can be extracted or
conformation at the binding site can be taken. Otherwise conformational search can be
performed using anyone of the options like grid search, systematic search, random search
or distance, geometry (NMR-NOE). Alignment of Molecules is carried out using RMS
atoms alignment, moments alignment or field alignment. The relationship between the
biological activity and the structural parameters is obtained by linear or multiple linear
regression analysis.
CoMFA (Comparative Molecular Field Analysis)
The CoMFA methodology is a 3D QSAR technique which allows one to design and
predict activities of molecules. The database of molecules with known properties is
suitably aligned in 3D space according to various methodologies. After consistently
aligning the molecules within a molecular lattice, a probe atom (typically carbon) samples
the steric and electrostatic interactions between the probe atom and the rest of the
molecule. Charges are then calculated for each molecule at a level of theory deemed
appropriate. These values are stored in a large spreadsheet within SYBYL, from where
they are accessed during the partial least squares (PLS) routines. One then attempts to
correlate these field energy terms with a property of interest by the use of PLS with cross-
validation, giving a measure of the predictive power of the model. Electrostatic maps are
generated indicating red contours around regions where high electron density (negative
charge) is expected to increase activity, and blue contours represent areas where low
electron density (partial positive charge) is expected to increase activity. Steric maps
indicate areas where steric bulk is predicted to increase (green) or decrease (yellow)
activity.646,648

CoMSIA (Comparative Molecular Similarity Index Analysis)
A technique similar to CoMFA called CoMSIA is also in use. Due to the problems
associated with Lennard-Jones potential used in CoMFA methods, Klebe et al. have
developed a similarity indices-based method named as CoMSIA. It uses Gaussian-type
functions to, model the probe interactions which allows for much smoother sampling of
the fields around the molecules, as well as incorporating new field information such as
hydrophobic and hydrogen bonding fields instead of the traditional CoMFA potentials.
The clear advantage of CoMSIA lies in the functions used to describe the molecules as
well as the resulting contour maps. It also avoids the cutoff values used in CoMFA to
prevent the potential functions from assuming unacceptably large values.647
Apex-3D
Apex-3D is used to build 3D QSAR models which can be used for activity classification
and prediction. The importance of Apex-3D methodology lies in the automated
identification of pharmacophores. These biophores can be used for constructing 3D
QSAR models when good quantitative data is available, and for database searching.
Combination of a 3D pharmacophore with a quantitative regression equation is unique to
the Apex-3D approach.649,650
4D QSAR
4D QSAR analysis developed by Vedani et al. incorporates the conformational,
alignment, and pharmacophore degrees of freedom in the development of 3D QSAR
models. It is used to create and screen against 3D-pharmacophore QSAR models and can
be used in receptor-independent or receptor-dependent modes. 4D QSAR can be used as a
CoMFA pre-processor to provide conformations and alignments in combination with
CoMFA to combine the field descriptors of CoMFA with the grid cell occupancy
descriptors (GCOD) of 4D QSAR to build a "best" model, or in addition to CoMFA
because it treats multiple alignments, conformations and embedded pharmacophores
which are CoMFA limitations.651
5D QSAR
4D QSAR concept has been extended by an additional degree of freedom, the fifth
dimension, allowing for a multiple representation of the topology of the quasi- atomistic
receptor surrogate. While this entity may be generated using up to six different induced-
fit protocols, it has been demonstrated that the simulated evolution converges to a single
model and that 5D QSAR, due to the fact that model selection may vary throughout the
entire simulation, yields less biased results than 4D QSAR where only a single induced-fit
model can be evaluated at a time (software Quasar).652
6D QSAR
The program Quasar generates a family of quasi-atomistic receptor surrogates that are
optimized by means of a genetic algorithm. The hypothetical receptor site is
characterized, the surface of which mimics the 3D shape of the binding site. It maps
properties of interest, such as hydrophobicity, electrostatic potential, and hydrogen-
bonding propensity. The fourth dimension (4D QSAR) takes in account an ensemble of
conformations, orientations, and protonation states, of each ligand molecule thereby
reducing the bias in identifying the bioactive conformation and orientation. Quasar
evaluates the manifestation and magnitude of the induced fit of ligands to the target
protein, up to six different induced-fit protocols (5D QSAR). The most recent extension
of the Quasar concept to six dimensions (6D QSAR) allows for the simultaneous
consideration of different solvation models.653
This can be achieved explicitly by
mapping parts of the surface area with solvent properties (position and size are optimized
by the genetic algorithm) or implicitly. In Quasar, the binding energy is calculated as:
Ebinding = Eligand-receptor - Edesolvation, ligand - TΔS - Eintemal strain - Einduced fit
2.2.1.1.3. Molecular Docking
There are several possible conformations in which the ligand may bind to active site
called as binding modes. Molecular docking involves a computational process of
searching for a conformation of the ligand that is able to fit both geometrically and
energetically into the binding site of a protein. Docking calculations are required to
predict the binding mode of new hypothetical compounds. Docking procedure consists of
three interrelated components, i.e. identification of binding site, a search algorithm to
effectively sample the search space (the set of possible ligand positions and
conformations on the protein surface) and scoring function. In most docking algorithms,
the binding site be predefined, so that the search space is limited to a comparatively small
region of protein. The search algorithm effectively samples the search space of the ligand-
protein complex. The scoring function used by the docking algorithm gives a ranking to

the set of final solutions generated by the search. Different energy calculations are needed
to identify the best candidate. The stable structures of a small molecule correspond to
minima on the multidimensional energy surface. Different forces that are involved in
binding are considered - electrostatic origin, electrodynamic origin, steric forces and
solvent related forces. The free energy of a particular conformation is equal to the
solvated free energy at the minimum with the small entropy correction. All energy
calculations are based on the assumption that the small molecule adopts a binding mode
of lowest free energy within the binding site. The free energy of binding is the change in
free energy that occurs on binding.
ΔGbinding = Gcomplex - (Gprotein + Gligand)
Where Gcomplex is the energy of the complexed protein and ligand, Gprotein is the free
energy of noninteracting separated protein and Gligand is the free energy of noninteracting
separated ligand. The common search algorithms used for the conformational search, that
provide a balance between the computational expense and the conformational search
include, molecular dynamics, Monte Carlo methods, genetic algorithms, fragment-based
methods, point complementary methods, distance geometry methods, tabu searches,
systematic searches.654
Scoring functions are used to estimate the binding affinity of a molecule or an individual
molecular fragment in a given position inside the receptor pocket. Three main classes of
scoring functions are known which includes force field based methods, empirical scoring
functions and knowledge based scoring functions.
The force field scoring function uses nonbonded energies of existing, well established
molecular mechanics force fields for estimating binding affinity. The AMBER and
CHARMM nonbonded terms are used as scoring functions in several docking programs.
The van der Waals term of force fields is mainly responsible for penalising docking
solutions with respect to overlap between receptor and ligand atoms. It is often omitted
when only the binding of experimentally determined complex structure is analysed. A
new contribution to the list of force field based scoring methods is OWFEG (One
Window Free Energy Grid) by Charifson and Pearlman.
In case of empirical scoring functions the binding free energy of the noncovalent
receptor-ligand complex can be factorised into some of localised, chemically intuitive
interactions. Such decompositions are useful to gain insight into binding phenomenon
even without analysing 3D structures of receptor-ligand complexes. Empirical scoring
functions usually contain individual terms for hydrogen bonds, ionic interactions,
hydrophobic interactions and binding entropy, as in the case of SCORE employed in
DOCK4 and Bohm scoring functions used in FlexX. Empirical scoring functions regard
only explicit interactions. Less frequent interactions are usually neglected.
Knowledge based scoring functions overcome this drawback and try to capture the
knowledge about protein-ligand binding that is implicitly stored in the protein data bank
by means of statistical analysis of structural data, for example PMF and DrugScore
functions, Wallqvist scoring function, the Verkhivker scoring function.653,655-658
Various molecular docking softwares are available of which widely used ones are
FlexX,659
Flexidock,660
DOCK,661
AUTODOCK,662
etc.
FlexX
FlexX is fragment-based method. It handles the flexibility of the ligand by decomposing
the ligand into fragments and performs the incremental construction procedure directly
inside the protein active site. It allows conformational flexibility of the ligand while
keeping the protein rigid.
MCDOCK
MCDOCK is a non conventional Monte Carlo simulation technique in which Monte
Carlo simulation method is used to search the global minimum. The scoring function used
is based upon molecular mechanics as used in CHARMM and AMBER programs. It
allows full flexibility of ligands by explicitly sampling all the rotatable bonds of the
ligand and the ligand conformational energy is assessed by the atomic interactions of the
ligands. A number of techniques have been integrated to optimize its docking
efficiency.656,663
FlexE
It addresses the problem of protein structure variations during docking calculations. It can
dock flexible ligands into an ensemble of protein structures which represent the
flexibility, point mutations or alternate models of a protein. It is based on the united

protein description generated from the superimposed structures of the ensemble. For
varying parts of the protein discrete alternative conformations are explicitly taken into
account which can be combinatorially joined to create new valid protein structures. FlexE
is based on FlexX.664
DREAM++
DREAM++ (Docking and Reaction programs using Efficient search Methods) is a set of
programs to design combinatorial libraries that uses techniques of a hybrid algorithm
between backtrack and incremental construction algorithms and inheritance of
conformations through reactions. The correlation between the binding affinity and the
number of conformations can be examined to find the best way to screen virtually
generated molecules.665
2.2.1.1.4 Pharmacophore Mapping
The pharmacophore is an important and unifying concept in rational drug design which
embodies the notion that molecules are active at a particular receptor because they
possess a number of key features that interact favorably with this receptor and which
possess geometric complementarity to it. It is the spatial arrangement of key chemical
features that are recognized by a receptor and are thus responsible for ligand-receptor
binding. Pharmacophore models are typically used when some active compounds have
been identified but the three dimensional (3D) structure of the target protein or receptor in
unknown. It is possible to derive pharmacophores in several ways, by analogy to a natural
substrate, by inference from a series of dissimilar biologically active molecules (active
analog approach) or by direct analysis of the structure of known ligand, and target
protein. The active compounds are superimposed to determine their common features to
provide a pharmacophore map that explains ligand-receptor binding. Given a set of active
molecules, the mapping of a pharmacophore involves two steps: (i) analyzing the
molecules to identify pharmacophore features, that is to identify atoms that interact with a
receptor and (ii) align the active conformations of the molecules to find the best overlay
of the corresponding features. The main difficulty in pharmacophore mapping is in
handling conformational flexibility. The major differences between the programs lie in
the algorithms used for the alignment and in the way in which conformational flexibility
is handled.666

Besides ligand-based approach, pharmacophores can also be generated manually.
Common structural features are identified from a set of experimentally known active
compounds. Conformational analysis is carried out to generate different conformations of
the molecules and interfeature distances are inferred to develop the final models.
The receptor mapping technique is also currently in practice to develop pharmacophores.
The pharmacophore models can be derived using the receptor active site. The important
residues required for binding the pharmacophores are identified, which are employed for
generating the pharmacophores. The structure of protein can be used to generate
interaction sites or grids to characterize favorable positions for ligands. Four types of
interactions sites, which are hydrogen-bond donors, hydrogen-bond acceptors, aliphatic
and aromatic groups, are characterized. Aliphatic and aromatic side chains are important
as they also pack closely to form hydrophobic core or proteins. Molecular dynamics
simulation for generating diverse protein conformations have been proposed to introduce
protein flexibility in the pharmacophore development.
After a pharmacophore map has been derived there are two ways to identify molecules
which share its features and thus elicit the desired response. (a) First is the de novo drug
design which seeks to link the disjoint parts of the pharmacophore together with
fragments in order to generate hypothetical structures that are chemically novel. (b) The
second is the 3D database searching, where large databases comprising 3D structures are
searched for those that match to a pharmacophoric pattern. One advantage of this method
is that it allows the ready identification of existing molecules which are either easily
available or have a known synthesis.667
The two distinct approaches being used for 3D
database searches include shape based methods in which a protein structure is used to
formulate the database query, to search for compounds whose structure complements the
receptor's steric characteristics and pharmacophore based methods which search for
compounds whose structure satisfies a certain pharmacophoric pattern. Generally
pharmacophores are taken from the literature and are used as 3D search queries or are
taken from protein crystal structure.668
To propose the 3D requirements for a molecule to exhibit a particular bioactivity,
bioactive conformation and a superposition rule for every active compound needs to be
supplied. For this pharmacophore mapping, generation and optimization of the molecules,
the location of ligand points and site points (projections from ligand atoms to atoms in the
macromolecule) is carried out. Typical ligand and site points are hydrogen bond donors,
hydrogen bond acceptors, and hydrophobic regions such as centers of mass of aromatic
rings. A pharmacophore map identifies both the bioactive conformation of each active
molecule and how to superimpose, compare in 3D, the various active compounds. The
map identifies what types of points match in what conformations of the compounds.
A complication for pharmacophore mapping is that different ligands might approach a
polar site point from different directions, the result is that in a pharmacophore map, the
positions of the ligand atoms may not overlap even though their projections to the
macromolecule do, in the case of hydrogen bonding interactions. Hence to match these
features in the ligands superimposition of only the ligand based points is done. For the
pharmacophore mapping of potent small molecules, it is preferred that the proposed
bioactive conformation be a low energy one. It is assumed that the interacting atoms of
the biomolecule can move slightly and with little energy cost to make optimal interaction
with a ligand. Thus a larger tolerance is accepted between overlapping points if the
resulting pharmacophore map includes significantly lower energy ligand structures.666
Experience suggests that it is computationally expensive to search conformational space
of a molecule. Especially if a molecule is flexible, even 100 structures may not be
enough. Using molecular graphics to compare many conformations of several molecules
can take much human time. Moreover these comparisons can be biased by the order in
which one studies them. The pharmacophore mapping softwares therefore sought an
objective and fast method that would compare all low energy conformations of all
molecules simultaneously. Of the various methods employed to superimpose two defined
3D structures when the knowledge of the corresponding atoms is unknown, the most
attractive solution is a method given by Brint and Willett based on clique detection
technique. DISCO softwares became popular for performing pharmacophore mapping.
Distance Comparison method (DISCO)
The various steps involved in DISCO are conformational analysis, calculation of the
location of the ligand and site points, to find potential pharmacophore maps and graphics
analysis of the results. In the process of conformational search, 3D structures can be
generated using any building program like CONCORD, from crystal structures or from
conformational searching and energy minimization with any molecular or quantum
mechanical technique. Comparisons of all the duplicate conformations are excluded while
comparing all the conformations. If each corresponding interatomic distance between

these atoms in the two conformations is less than a threshold (0.4Å), then the higher
energy conformation is rejected. DISCO calculates the location of site points to be
considered for the pharmacophore. These points can be the location of ligand atoms, or
other atom-based points, like centers of rings or a halogen atom are points of potential
hydrophobic groups. The other point is the location of the hydrogen bond acceptors or
donors. The default locations of site hydrogen bond donor and acceptor points are based
on literature compilations of observed intermolecular crystallographic contacts in proteins
and between the small molecules. Hydrogen bond donors and acceptors such as OH and
NH2 groups can rotate to change the locations of the hydrogen atom.
During the process of performing pharmacophore mapping in DISCO, its set up iterates
the tolerance used to set inter-point distances the same. The starting and the final values
and an iteration increment are given. Alternatively, the user may input the tolerance for
each type of inter-point distance. The user may direct DISCO algorithm to consider all
the potential points and to stop when a pharmacophore map with a certain total number of
points is found. Alternatively they may specify the types of fewer features an inhibitor
maps to, the poorer its fit to them and lower its predicted affinity.669,670
2.2.1.2 Virtual screening
Virtual screening also called as in silico screening is a new branch of medicinal chemistry
that represents a fast and cost effective tool computationally screening compound
databases in search for novel drug leads. Various changes have occurred in the ways of
drug discovery, the major ones taking place in the field of high throughput synthesis and
screening techniques. The basic goal of virtual screening is the reduction of the huge
chemical space of synthesized molecules and to screen them against a specific target
protein. Thus the field of virtual screening has become an important component of drug
discovery programs. Substantial efforts in this area have been put in by large
pharmaceutical companies. However, the area of virtual screening is highly diverse and is
evolving rapidly. Various reports describing the development of new methods are coming
up. Many chemists and biologists perceive this field as an `algorithmic jungle` that lacks
well defined standards.656
Types of virtual libraries
Two types of virtual libraries can be generated. One is produced by computational design.
The basic idea behind this is of course not to synthesize all compounds (as in
combinatorial library design, for example) but to select only preferred molecules. Other
libraries focus on compounds that already exist from commercial sources or company
inventories. It is possible to extract millions of compounds from these sources and create
virtual library. These libraries are useful in the absence of knowledge about the specific
drug targets for virtual screening. More focused libraries are important sometimes to save
resources as it may be more prudent not to run the entire HTS file against the target
protein instead of focused library with higher chances of containing hits may be
scrutinized.671
Applications
Virtual screening can be applied to target-based subset selection from the data bases.
Statistical approaches like binary QSAR or recursive partitioning can be applied to
process HTS results and develop predictive models for biological activity. The developed
models are employed to select candidate molecules from databases. Similarly, hits from
HTS are used in fingerprint searches or compound classification analysis to identify set of
similar molecules. Based on these results, a few compounds are selected for additional
testing. Many assumptions are made in virtual screening and a positive outcome can not
be guaranteed every time. However, the overall process is extremely cost effective and
fast. Virtual screening has the ability to produce leads that otherwise may not have been
identified. In silico mining of compounds no longer requires an expensive infrastructure.
Clustering of low-cost computers make it possible to process, analyze, and search a large
amount of data that is otherwise difficult to handle. With the merging of bioinformatics
and cheminformatics, virtual screening is expected to become increasingly better
established. Improvements in current techniques and the development of new methods
will continue at a fast pace, keeping the areas stimulating and interesting.656,671