2098 ieee transactions on smart grid, vol. 6,...
TRANSCRIPT
2098 IEEE TRANSACTIONS ON SMART GRID, VOL. 6, NO. 4, JULY 2015
Sensitivity Analysis of Voltage Sag Based FaultLocation With Distributed Generation
Po-Chen Chen, Student Member, IEEE, Vuk Malbasa, Member, IEEE,Yimai Dong, Member, IEEE, and Mladen Kezunovic, Fellow, IEEE
Abstract—The presence of distributed generation (DG) in dis-tribution networks may seriously affect accuracy of the voltagesag based fault location method. An approach toward quantify-ing the adverse effect of DG on the fault location calculationis described. A series of realistic scenarios is used to illus-trate how DG impacts synchrophasor measurements duringdisturbances. Alternative Transients Program-ElectromagneticTransients Program models are used to obtain steady-state solu-tions in the time domain, while Sobol’s approach to sensitivityanalysis is used to quantify the effect of DG and imperfectionsof measuring instruments on fault location. Various test casesreveal that DG may adversely affect the voltage characteristicand therefore the accuracy of voltage sag based fault location.
Index Terms—Distributed power generation, EMTP, faultlocation, power distribution faults, power system measurements,power system protection, power system simulation, searchmethods, sensitivity analysis, smart grids.
I. INTRODUCTION
IN DISTRIBUTION networks, outage management, andservice restoration are closely related to the operator’s abil-
ity to reliably identify fault location [1], [2]. The challengesof accurate fault location in distribution networks stem fromthe large number of components, changes in loading conditionsover time, the unbalanced nature of the system, heterogeneouslines, and the presence of laterals and load taps.
Fault location approaches may be classified into thefollowing sub-categories according to which under-lying feature of the fault measurements is exploited:1) superimposed components methods [3], [4]; 2) intelligentsystem methods [5], [6]; 3) impedance based methods [7]–[9];4) traveling wave methods [10]–[12]; and 5) voltage sag basedmethods [13]–[15]. A more detailed comparison of differentfault location methods may be found in [7] and [15]–[17]. Itwas also shown that the abundance of data collected from fieldmeasurements may be leveraged for precise fault location [2].The distinctive feature of voltage sag based fault location isthe capability of identifying an unambiguous fault location,
Manuscript received May 12, 2014; revised September 22, 2014and December 11, 2014; accepted December 24, 2014. Date of pub-lication January 20, 2015; date of current version June 18, 2015.Paper no. TSG-00405-2014.
P.-C. Chen and M. Kezunovic are with Texas A&M University, CollegeStation, TX 77843-3128 USA (e-mail: [email protected]).
V. Malbasa is with the University of Novi Sad, Novi Sad 21000, Serbia.Y. Dong is with Electrocon, Inc., Ann Arbor, MI 48103 USA.Color versions of one or more of the figures in this paper are available
online at http://ieeexplore.ieee.org.Digital Object Identifier 10.1109/TSG.2014.2387153
whereas impedance based methods may not be able todifferentiate the exact feeder/lateral.
The future distribution system is predicted to heavily relyon distributed generation (DG) for uninterrupted load support,and therefore a strategy-based around disconnecting DG wouldeither make the system unreliable or inefficient. Because ofthese considerations, fault location techniques in the pres-ence of DG [18]–[20] have been investigated. Brahma [18]used synchronized voltage and current measurements at theinterconnection points of DG units to identify the faultedarea and a precise fault location. Brahma and Girgis [19]developed a terminology to identify the faulted area usinga superposition-based approach and precalculated short circuitresults. Johnsonbaugh [20] demonstrated a detailed formulationof the variation of the apparent impedance method involvingDG. Comprehensive literature reviews regarding fault locationtechniques in the presence of DG are available in [18]–[20].The effects of DG on voltage sags, and therefore applicationsrelying on this property have been recognized in [21] and [22].The level of DG penetration in a network may also influence thevoltage characteristics. Other studies in fault location underhigh DG penetration fail to distinctly, statistically quantifythe effects of DG as well as to distinguish the impact ofDG penetration from external factors such as measurementimperfections [23], fault resistance, and loading estimate.
This paper describes how to quantitatively assess the impactof DG and external measurement errors on the performanceof voltage sag based fault location. This paper not onlystatistically analyzes the quantifiable impact of each factorinfluencing fault location, but also considers their total effectsin combination with other factors as well. The authors havebeen unable to locate any systematic studies regarding thisimportant topic in the literature.
The rest of this paper is organized as follows. Section IIintroduces the background of the problem and methodology.Section III indicates formulation and implementation of thestudied voltage sag based fault location method. Section IVdescribes the formulation of sensitivity analysis. Section Vdemonstrates the validation results of the studied voltage sagbased fault location algorithm. Section VI shows the resultsand related analysis. Section VII contains the conclusion.
II. BACKGROUND
While keeping in mind how DG may aggravate fault loca-tion techniques, it seems imperative to quantify the effect of
1949-3053 c© 2015 IEEE. Personal use is permitted, but republication/redistribution requires IEEE permission.See http://www.ieee.org/publications_standards/publications/rights/index.html for more information.
CHEN et al.: SENSITIVITY ANALYSIS OF VOLTAGE SAG BASED FAULT LOCATION WITH DG 2099
TABLE IDEVELOPMENT ENVIRONMENT: “X” INDICATES USE
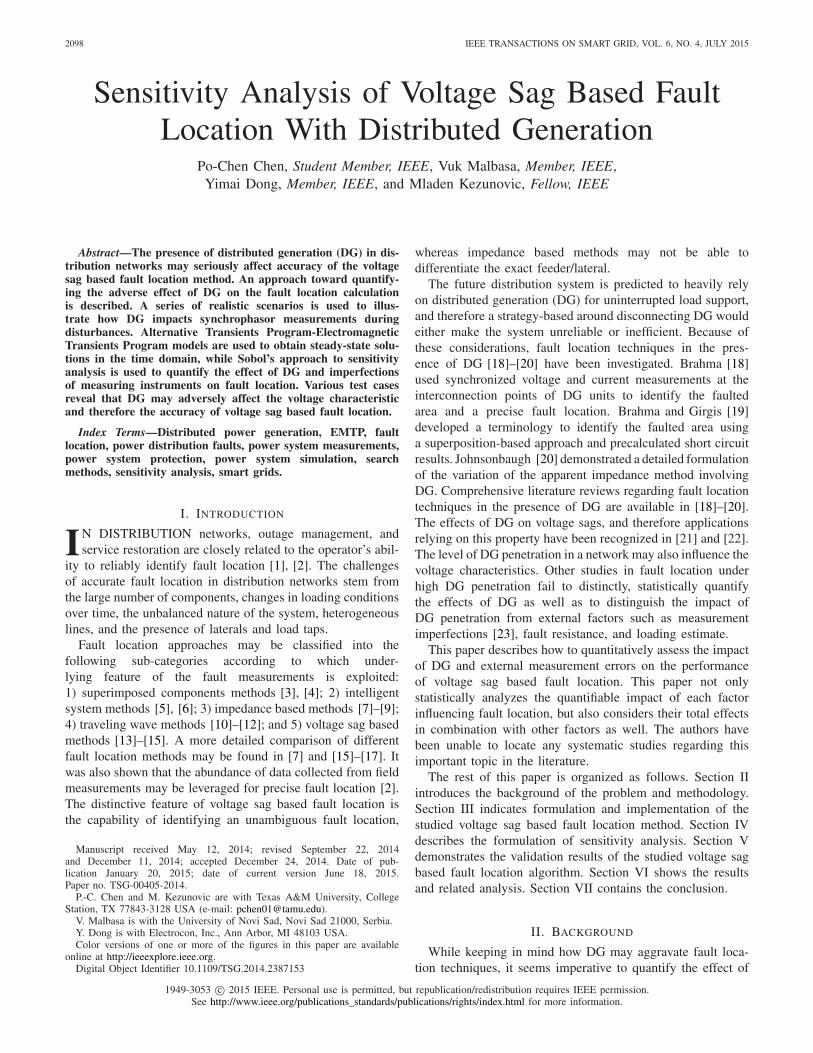
Fig. 1. Scope of study: fault location testing and evaluation function blocks.
errors of external factors on voltage sag based fault location indistribution systems. While using voltage sag based methods,voltage sag matching may become erratic in the presence ofDG, where voltage sag matching at multiple locations maybecome similar (Section VI-B).
A. Study Design
In order to quantify the effect of so many different factorsinfluencing fault location, it was necessary to interface multi-ple software tools and verify the study design and data flow.Software tools used in each step of the implementationare shown in Table I, where SimLab is a software toolsuitable for global sensitivity and uncertainty analysis [24].The studied voltage sag based fault location algorithm wasimplemented in C++, and interfaced with the alternative tran-sient program (ATP) [25] software for fault simulation. InFig. 1, the main steps of this study are illustrated includingthe validation at the top and experiments at the bottom.
In Step (1), the custom voltage sag based fault location soft-ware is validated by simulating faults on every receiving nodeof line components (Section V). In Step (2), a large number offault scenarios are generated to form a knowledge base, ensur-ing reliable results from sensitivity analysis (Section IV). Thenthese scenarios are simulated in Step (3) (Section III) and thenanalyzed in Step (4) (Section VI).
B. Network Under Study
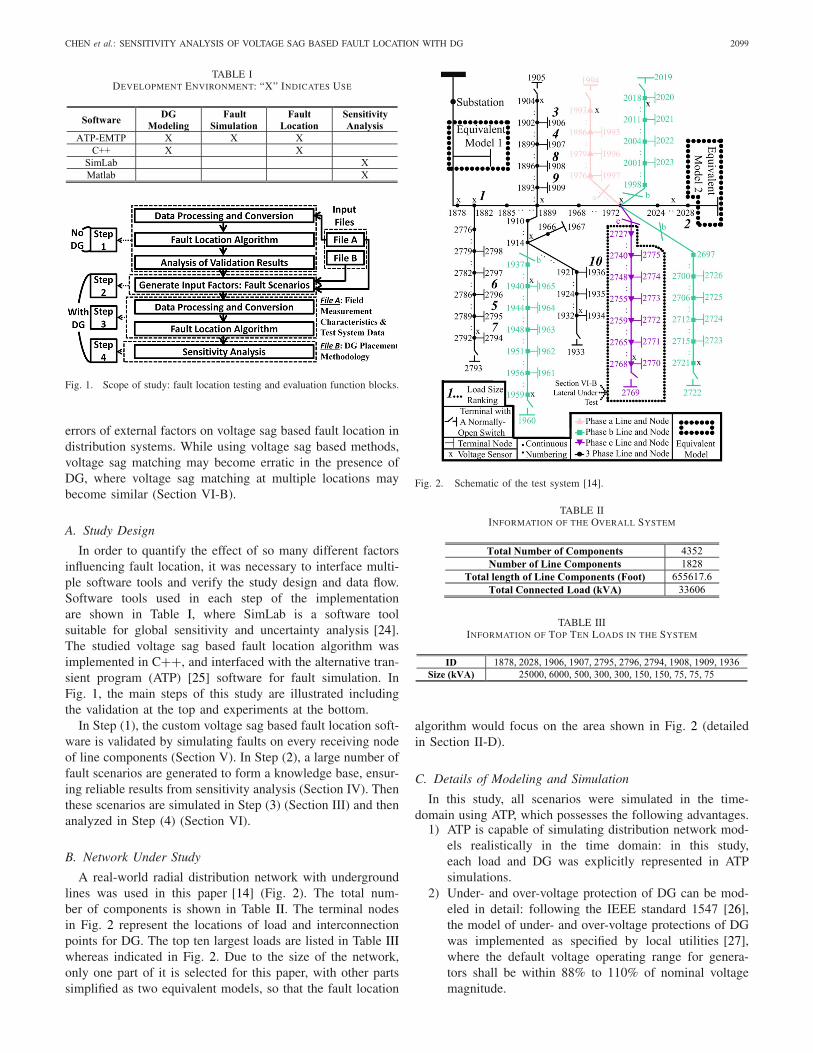
A real-world radial distribution network with undergroundlines was used in this paper [14] (Fig. 2). The total num-ber of components is shown in Table II. The terminal nodesin Fig. 2 represent the locations of load and interconnectionpoints for DG. The top ten largest loads are listed in Table IIIwhereas indicated in Fig. 2. Due to the size of the network,only one part of it is selected for this paper, with other partssimplified as two equivalent models, so that the fault location
Fig. 2. Schematic of the test system [14].
TABLE IIINFORMATION OF THE OVERALL SYSTEM
TABLE IIIINFORMATION OF TOP TEN LOADS IN THE SYSTEM
algorithm would focus on the area shown in Fig. 2 (detailedin Section II-D).
C. Details of Modeling and Simulation
In this study, all scenarios were simulated in the time-domain using ATP, which possesses the following advantages.
1) ATP is capable of simulating distribution network mod-els realistically in the time domain: in this study,each load and DG was explicitly represented in ATPsimulations.
2) Under- and over-voltage protection of DG can be mod-eled in detail: following the IEEE standard 1547 [26],the model of under- and over-voltage protections of DGwas implemented as specified by local utilities [27],where the default voltage operating range for genera-tors shall be within 88% to 110% of nominal voltagemagnitude.

2100 IEEE TRANSACTIONS ON SMART GRID, VOL. 6, NO. 4, JULY 2015
The loads were represented as constant impedance due tothe following two reasons.
1) The constant impedance representation may suffice forthe need of [28].
2) A detailed load modeling will prolong the overall sim-ulation time [29].
The DGs were modeled as power flow control models asillustrated in [30], with unity power factor representing theinverter-based type of DG. Based on the results of the pre-liminary tests, the inverter output power follows the referencepower commands with considerable accuracy as demonstratedin [30]. It is recognized that the voltage sag and short circuitlevel may vary due to different interfaces between the DGand grid [31], [32], and that the different load types may alsoaffect the voltage magnitude at post-fault steady states in thepresence of DG [29].
All the cases were simulated using a desktop having sixprocessors which are Intel(R) Xeon(R) CPU W3670 operatingat 3.20 GHz and installed memory (RAM) 12 GB. In ATP, allcases were simulated with time step of 80 μs. The averagerunning time for one scenario is 1.04 h.
D. Assumptions
1) Meter Placement: The optimization technique for meterplacement is beyond the scope of this paper, and a generalizedprocedure is described in [15]. However, having more sensorsmay enhance the accuracy of fault location (Section VI-B).The meters (Fig. 2) are assumed to be available at 15 locations,including the intersections of subsections and the ends offeeder, where intelligent electronic devices (IEDs) are likelyto be installed. The nodes with meters are: 1878, 1882, 1889,1904, 1914, 1931, 1939, 1959, 1972, 1993, 2017, 2026, 2721,2767, and 2791.
2) DG Connection and Deployment: DG was assumed tobe connected at the load terminal, and each load was inter-connected with a DG unit and the DG power was set toexactly the desired penetration for that scenario, as a ratioof the load power. For instance, if the DG penetration fora scenario was 10%, then the DG power was 10% of the loadpower at each load. The influence of probabilistic deploymentof DG [33]–[35] is beyond the scope of this paper.
3) Computational Complexity and Hardware Limitations:Due to the large potential number of components in modernnetworks and the intensive computer modeling and simula-tion necessary for such study, the time necessary to performfault location calculation is constrained by: 1) utilizing lim-ited simulation and modeling hardware; 2) considering a largenumber of fault scenarios necessary for sensitivity analysis;and 3) simulating all types of faults at every node. Assumingthe fault type is known to be single-line-ground fault, run-ning one case with the original network takes 8 h on ourcomputer (hardware specifications in Section II-C). Therefore,the simplified network is used and the fault type is assumedto be known. In this case, the running time is signifi-cantly reduced from 8 to 1 h. The preliminary test resultsreveal that the described methodology is available for theoriginal network and capable of differentiating fault types
including single-line-ground, double-line-ground, double-line,triple-line-ground, and triple-line faults at each node.
In practice, the run time can be shortened by: 1) reducing thenumber of candidate fault nodes (Section III-A) based on out-age mapping via utilizing big data [36] such as customer calls,asset management condition-based status [37], and automaticmeter reading [38]; 2) utilizing better computational hardware;3) separating the fault location calculation in various areas intodifferent experiments running in parallel at the same time; and4) applying data mining techniques to decrease computationalcomplexity [39], [40].
III. METHODOLOGY
A. Voltage Sag Based Fault Location Under Study
As described in [13], the fault location procedure consistsof the following four key steps.
1) Voltage sag data (V recorded) is recorded at the meterlocations and sent to the local distribution energy man-agement center.
2) Simulated voltage sag data (Vcalculated) is computed,assuming in turn that the fault is located at each nodeand fault resistance is estimated based on the voltagematch.
3) The node with the best match between V recorded andVcalculated is the declared fault node.
4) Binary search (halving) [41] is used on the linesconnected to the detected fault node to pinpoint thefault on the lines (this process will be detailed inSection III-B).
In Step 2, for cases when the fault location is close to theroot node, the voltages at the physically and topologically dis-tant meters may become similar [42], increasing the difficultyof identifying the correct fault location in Step 3. In this case,the current phase information obtained at the root can be usedto differentiate the exact feeder.
To summarize the method, the findings in [13] are appliedso that
Error = ε2amplitude(V) + ε2
phase(I) (1)
and
flag = 1
Error + �(2)
where εamplitude(V) is the difference between the amplitude ofVrecorded and Vcalculated, εphase(I) is the difference between thephase of calculated and recorded current at the root node, �
is a small number to prevent the division by zero, and flag isused to identify the fault node. Since voltage phase informa-tion is not always available, the difference between the phaseof Vrecorded and Vcalculated in (1) is not taken into consideration.While obtaining the flag during the fault location process, thefault resistance may also be obtained as proposed in [13]. Themethod uses the current phasor at the root node while assum-ing the fault at node M. More details may be found in [13].
In Step 3 after the comparison, node M with the largestflag value is declared the fault node. Then the algorithm willapproach the maximum value of flag on all the lines connectedto node M. Step 4 will be detailed in Section III-B.
CHEN et al.: SENSITIVITY ANALYSIS OF VOLTAGE SAG BASED FAULT LOCATION WITH DG 2101
Fig. 3. Implementation details of the studied fault location algorithm.
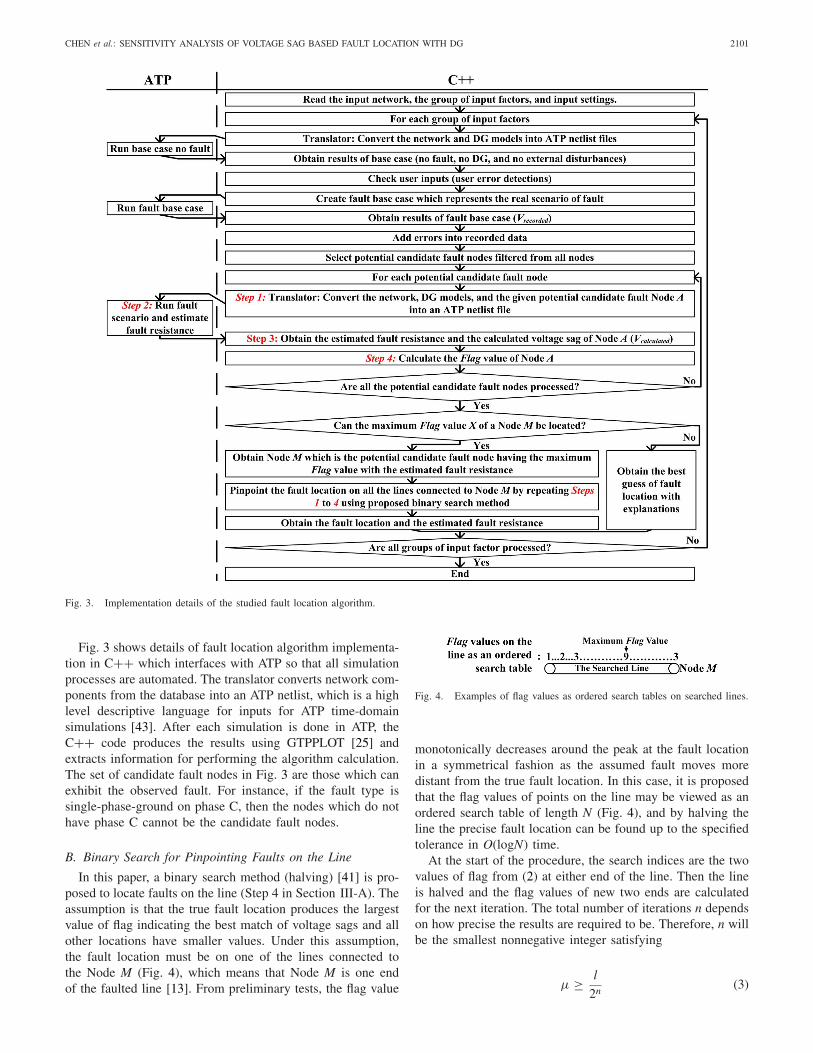
Fig. 3 shows details of fault location algorithm implementa-tion in C++ which interfaces with ATP so that all simulationprocesses are automated. The translator converts network com-ponents from the database into an ATP netlist, which is a highlevel descriptive language for inputs for ATP time-domainsimulations [43]. After each simulation is done in ATP, theC++ code produces the results using GTPPLOT [25] andextracts information for performing the algorithm calculation.The set of candidate fault nodes in Fig. 3 are those which canexhibit the observed fault. For instance, if the fault type issingle-phase-ground on phase C, then the nodes which do nothave phase C cannot be the candidate fault nodes.
B. Binary Search for Pinpointing Faults on the Line
In this paper, a binary search method (halving) [41] is pro-posed to locate faults on the line (Step 4 in Section III-A). Theassumption is that the true fault location produces the largestvalue of flag indicating the best match of voltage sags and allother locations have smaller values. Under this assumption,the fault location must be on one of the lines connected tothe Node M (Fig. 4), which means that Node M is one endof the faulted line [13]. From preliminary tests, the flag value
Fig. 4. Examples of flag values as ordered search tables on searched lines.
monotonically decreases around the peak at the fault locationin a symmetrical fashion as the assumed fault moves moredistant from the true fault location. In this case, it is proposedthat the flag values of points on the line may be viewed as anordered search table of length N (Fig. 4), and by halving theline the precise fault location can be found up to the specifiedtolerance in O(logN) time.
At the start of the procedure, the search indices are the twovalues of flag from (2) at either end of the line. Then the lineis halved and the flag values of new two ends are calculatedfor the next iteration. The total number of iterations n dependson how precise the results are required to be. Therefore, n willbe the smallest nonnegative integer satisfying
μ ≥ l
2n(3)

2102 IEEE TRANSACTIONS ON SMART GRID, VOL. 6, NO. 4, JULY 2015
where μ is the user-given distance tolerance for pinpointingthe fault on the line and l is the length of the searched line. Theproposed binary search method is tested and proved to havebetter efficiency than the brute force search method [41].
IV. SOBOL’S SENSITIVITY ANALYSIS
Global variance-based sensitivity analysis, such as themethod of Sobol, is a statistical tool which can ascertain howuncertainty in the inputs of an algorithm is reflected in theuncertainty of the output. Limitations in the generality of thisapproach lie in the necessity for: 1) input factors to be speci-fied by garden variety distributions which are easily sampledfrom (such as normal and uniform); 2) input factors to bebijectively mappable to the inside of an n-dimensional L − 1sphere (or hypercube), in the sense that infinite values of inputsare not applicable; and 3) output is numerical and a measureof variance in the output can be made.
Sobol’s approach to experiment design is efficient both inexploring problem space and in reducing the number of exper-iments which need to be performed [44], where an experimentis defined as performing one fault location scenario per iter-ation of the loop in Fig. 3. In the context of fault locationalgorithms for power systems, performing sensitivity analy-sis represents an examination of error made when locatingfaults under a set of typical operating conditions. Therefore,it may be useful for several reasons [45] to: 1) test robustnessof an algorithm’s accuracy in light of uncertainty in inputs;2) understand the relationships between input and output ofalgorithms; and 3) identify how uncertainty in output can bereduced by suppression of uncertainty in algorithm input.
For simplicity of notation, let it be assumed that the sen-sitivity of a model f (x), is the distance to fault, or relativeerror, and the task is to quantify the impact of each factor inthis function. Let it also be assumed that the model has uncer-tainty in input factors, x ∈ [0, 1]d, where each of the d inputfactors from R is mapped into the interior of a d-dimensionalhypercube, without loss of generality since the input factorspace may be bijectively mapped to such a hypercube, andincurring the condition that the inputs x are independently andidentically distributed [45].
The goal of variance-based sensitivity analysis is to dis-tribute responsibility for uncertainty in the output f (x) amongthe model inputs x. The importance, or sensitivity index, ofan input factor xi, where x = [x1, x2, . . . , xi, . . . , xd], isthen directly related to the variance in output which can beattributed to it. In order to perform variance-based sensitivityanalysis in more detail, it is necessary to perform the faultlocation procedure on a large number of input factor valuecombinations, sampled from the joint distribution of inputfactors, and then perform a decomposition of the exhibitedvariance. The decomposition of variance σ 2f (x) is such that
σ 2f (x) =d∑
i=1
σ 2i +
d∑
i=1
∑
j<i
σ 2ij + · · · + σ 2
1···d. (4)
Here if the main effect of a factor xi is denoted on the outputf (x) as σ 2
i = σ 2xi(E[f (x)|xi]) then the compound effects of
TABLE IVINPUT FACTORS IN THIS STUDY
two factors xi and xj can be described as
σ 2ij = σ 2xixj
(E
[f (x)|xj, xi
]) − σ 2i − σ 2
j . (5)
The presented sensitivity analysis requires the coordina-tion of software use as shown in Table I. The sensitivityanalysis implemented in SimLab was used to design andevaluate the experiments and to quantify the factors impact-ing fault location accuracy. Based on the input factors fromTable IV, sampling is first done in SimLab to create a setof specified input factors (Step 2 in Fig. 1), and then fedto fault location for fault scenario generation. The estimatedfault location result is then compared with the actual locationof fault to calculate the output error, f (x). More elabora-tions on input factors and sampling will be demonstratedin Sections IV-A and IV-B, respectively. More details regard-ing how sensitivity analysis may be applied to fault locationmethods may be found in [14] and [46].
A. Input Factor
The input factors for the sensitivity analysis in this paperare shown in Table IV. The loading error represents an errorbetween the estimated and real loading conditions. The rangesof input factor in Table IV are determined based on the resultsof preliminary tests. The design of measurement errors andloading errors is based on the results suggested in [23]. Notethe errors chosen for different meters are different.
B. Sobol Index
The un-normalized Sobol indexes are reported. The firstorder of Sobol index represents one factor’s singular contri-bution to the variance of output by itself. The total order ofSobol index represents the total contribution to the varianceof output by one factor (first order effect plus all higher-ordereffects due to interactions). For instance, assume there are twoinput factors x1 and x2. Suppose x1has a low first order index,and the interaction effect index of both x1 and x2 is high. Thisindicates the output variance is highly dictated by both fac-tors’ interaction, even if x1 is less important. Therefore, thetotal effect index examines the impacts of input factors’ inter-actions to the output variance. The combined effects of morethan two input factors’ interactions may be found in [47].

CHEN et al.: SENSITIVITY ANALYSIS OF VOLTAGE SAG BASED FAULT LOCATION WITH DG 2103
Fig. 5. Validation results.
C. Sampling and Number of Experiment
The Sobol’s sequences are within the category of quasi-random sequences which are used to produce samples of multi-ple parameters uniformly over the multidimensional parameterspace [48]. The Sobol’s sequences require a sample size(number of experiments) Nexp where
Nexp = 2Ninput (6)
where Ninput is the number of input factors. Since there areseven input factors, there should be 128 experiments. In orderto obtain more accurate results, the number of experiments isdoubled to be 256 in this paper.
V. VALIDATION OF STUDIED FAULT LOCATION METHOD
Prior to the sensitivity analysis of DG impact, the stud-ied voltage sag based fault location method was validated toensure the correctness. For validation purposes, it was assumedthat there were no measurement errors and loading estima-tion errors. The fault resistance was assumed to be 3 �.The single-phase-to-ground fault was simulated using nonerrormeasurement data on every receiving node of a line.
With no external disturbances, the applied voltage sag basedfault location algorithm produces very accurate output asshown in Fig. 5, where positive error indicates downstreamof the true fault location. In 83% of cases, the error distanceis smaller than 400 ft. In 13% of cases, the error distance isbetween 400 and 1000 ft. In 4% of cases, the error distanceis greater than 1000 ft, with the maximal error of 1212 ft. Incases where the output error is not zero, the program alwaysdetects nodes on the same lateral as the estimated location offault. In most cases, the detected nodes are downstream of thetrue fault location (error in most cases are positive).
VI. RESULTS AND RELATED ANALYSIS
In this section, two matters will be discussed: 1) the resultsof sensitivity analysis; and 2) detailed case studies of a faulton one lateral. The assumed 15 m locations are mentioned inSection II-D. The results of single-phase-ground fault type arepresented in this section.
TABLE VRESULTS OF SENSITIVITY ANALYSIS:
SOBOL FIRST ORDER INDEXES
TABLE VIRESULTS OF SENSITIVITY ANALYSIS:
SOBOL TOTAL ORDER INDEXES
A. Sensitivity Analysis of DG Impact
To illustrate the impact of DG, the fault locations are des-ignated at three lines which are near, mid-way, and far awayfrom the root node (representing distances from the source),as follows:
1) Near: The feeder segment between Nodes 1879and 1880;
2) Middle: The feeder segment between Nodes 1911and 1912;
3) Far: The feeder segment between Nodes 2762 and 2763.Note that the near line is closest to the largest load node. In
order to obtain global variance-based sensitivity indices, it isnecessary to simulate a large number of fault scenarios. If thesearch space is to be efficiently explored, the conditions needto be carefully designed. In this paper, there are 256 cases(Section IV-C) conducted at each line, and the total numberof cases is 768.
Tables V and VI summarize the results of sensitivity anal-ysis, where they represent the first and total order indexesof input factors (Section IV-A), respectively. The concludingremarks can be drawn from Tables V and VI.
1) Fault resistance always has the largest sensitivity indexamong all factors and is the factor with the largesteffect on the results. The reason for this is that the faultresistance is linked directly to the peak amplitude offault current, which will cause the variation of voltagecharacteristic at nodes.
2) Loading error always has the second largest sensitivityindex among all factors. This shows that the accu-racy of fault location is very sensitive to the loadingerror estimation. It is also worth noting that results of

2104 IEEE TRANSACTIONS ON SMART GRID, VOL. 6, NO. 4, JULY 2015
TABLE VIIPERCENTAGE OF SIMULATED CASES IN DIFFERENT
RANGES OF ERROR DISTANCE ON THREE LINES
TABLE VIIISCENARIOS FOR SPECIAL CASE STUDIES
preliminary tests have shown that when the loading erroris large (more than ±9%), the fault location algorithmcould not locate the fault anywhere in the network.
3) The sensitivity index of DG penetration level reveals thatwhile this effect is not the most important, it should betaken into account when ascertaining accuracy of faultlocation.
4) All the factors have higher sensitivity indexwhen the fault is near the root node. This demonstratesthat the match of voltage sag could become difficultwhen the fault is near the root node.
5) All the factors, except fault resistance, have the smallestsensitivity index on the middle line as shown in Table V.The reason for this is the presence of DG, which causesthe system to become a multisource system. Althoughit is not shown in Fig. 2, by comparing the three lineswhere the faults are designated, it is shown the line inthe middle does not have relatively large size DG com-pared to the line at the far side (see Section VI-B). Thisimplies that the sensitivity indexes may be larger withsignificant DG closer to the fault location, where thoseDG protections are not tripped.
Table VII shows the percentage of cases in different rangesof distance error. The largest percentage always falls into thecategory of cases whose distance error is greater than 2000 feetregardless of the distance between the fault and the source,when there are external disturbances present.
B. Special Case Studies
A more detailed example will be used to demonstrate theimpact of DG on fault location. It is assumed that there are noexternal disturbances. The whole network is simulated but thespecific focus is the lateral with the end Node 2769 (Fig. 2).The fault is set between Nodes 2766 and 2767 at one end offeeder, which is 36 316.2 feet from the source.
Four scenarios in Table VIII are designed to reveal spe-cial cases of two different DG types and two different groupsof meter numbers under various DG penetration levels. Theinduction type of DG is modeled as a power flow controlmodel as illustrated in [30] with power factor of 0.9. The
TABLE IXRESULTS OF SCENARIOS
Fig. 6. (a) Flag values vary on the lateral under different DG penetration lev-els in scenario 2. (b) Flag values at the meters on the lateral under 1% and 5%DG penetration levels in scenarios 2 and 4.
15 m have been mentioned in Section II-B where the onlymeter on the lateral is at Node 2767. The 21 m include theaforementioned 15 m with 6 more meters placed along thelateral at Nodes 2751, 2755, 2757, 2759, 2761, 2763, and2765 making 7 m in total on the lateral.
Table IX shows the distance between the real and estimatedfault locations in all scenarios. Fig. 6(a) shows how the flagvalues vary on the lateral in scenario 2. Fig. 6(b) shows theflag values at those meters on the lateral under 1% and 5% DGpenetrations in scenarios 2 and 4. Note that the flag values forother DG penetration levels were not presented in Fig. 6 sincethe trend of flag values remains the same. Also note that thedetected fault locations in all scenarios are on the same lateralas the real fault locations.
Table IX demonstrates the summary of special case studies,and the following remarks can be observed.
1) While there is no DG in the system, the number ofmeters affects the results. More meters results in betteraccuracy.
2) In the presence of DG, the error remains the same. Theestimated fault location is moving toward Node 2762from Node 2767 regardless of DG penetration levels,DG types, or number of meters.
Fig. 6(a) and (b) further illustrates the observations fromTable IX. In Fig. 6(a), it is clear that the maximum flag valueunder 0% DG penetration (no DG) is at Node 2767, but it isnot clear where the maximum flag value is under other DGpenetration levels. In Fig. 6(b), though the flag values at thenodes vary with DG penetration levels and DG types, the flagvalue always monotonically decreases around the peak at thefault location (Section III-B) in the same fashion and thereforethe algorithm always detects the same fault location. ThoseDGs whose protections are not open contribute to fault current,
CHEN et al.: SENSITIVITY ANALYSIS OF VOLTAGE SAG BASED FAULT LOCATION WITH DG 2105
and therefore influence the voltage sag at the nodes close tothe fault (which creates very similar flag values). These leadthe algorithm toward wrong estimates in the presence of DG.
VII. CONCLUSION
The described approach is computationally efficient underrealistic DG deployment scenarios. It represents well a com-plex distribution grid, and it retains the ability to identifyindividual and compound factors severely affecting reliabil-ity of fault location calculation. The results clearly show thatstatistical analysis is necessary to reveal the true profile oferror in fault location.
Several contributions are made in this paper.1) A systematic study framework to analyze the impact of
DG on the voltage sag based fault location is proposed.The specific issues relating to data flow and softwarecomponents at the scale necessary to statistically mea-sure the differences is reflected upon. A binary searchapproach to pinpoint the fault on the feeder within theuser-specified accuracy tolerance is outlined.
2) Results of sensitivity analysis demonstrate the impactof measurement imperfection on the algorithm and itwas concluded that the presence of DG, which makesthe system become multisource, is consequential. Faultresistance is the largest sensitivity index among all fac-tors, and it has the largest effect on the results. Loadingerror is the second largest sensitivity index among allfactors.
3) The cases where the voltage sag based fault location mayfail are also taken into consideration. In the special casestudied, DG penetration levels, DG types, and numberof meters show little (if any) impact on the output errors.Those DGs whose protections are not open contribute tofault current resulting in similar flag values around thefault nodes, and lead to wrong estimates in the presenceof DG.
In addition, without the presence of DG, the input factor“distance between fault location and the root node” is definedto obtain the errors as a function of distance from the sin-gle source. Yet, in the presence of DG, the system becomesmultisource, so this input factor no longer provides effectiveinformation.
ACKNOWLEDGMENT
The authors would like to thank Dr. J. Stoupis,Dr. M. Mousavi, Dr. N. Kang, and Dr. X. Feng from theABB Group for their valuable advice. They also would liketo thank the prior work of Dr. S. Lotfifard, who worked onthe initial study of the voltage sag based fault location for hisPh.D. dissertation at Texas A&M University. This paper wasprepared as an account of the work sponsored by an agencyof the U.S. Government. Neither the U.S. Government norany agency thereof, nor any of their employees, makes anywarranty, express, or implied, or assume any legal liabilityor responsibility for the accuracy, completeness, or usefulnessof any information, apparatus, product, or process disclosed,or represents that its use would not infringe privately owned
rights. Reference herein to any specific commercial product,process, or service by trade name, trademark, manufacturer, orotherwise does not necessarily constitute or imply its endorse-ment, recommendation, or favoring by the U.S. Governmentor any agency thereof. The views and opinions of authorsexpressed herein do not necessarily state or reflect those ofthe U.S. Government or any agency thereof.
REFERENCES
[1] M. Kezunovic et al., “Fault location,” in Wiley Encyclopedia of Electricaland Electronics Terminology, vol. 7. Hoboken, NJ, USA: Wiley, 1999,pp. 276–285.
[2] M. Kezunovic, “Smart fault location for smart grids,” IEEE Trans. SmartGrid, vol. 2, no. 1, pp. 11–22, Mar. 2011.
[3] R. K. Aggarwal, Y. Aslan, and A. T. Johns, “New concept in fault loca-tion for overhead distribution systems using superimposed components,”IEE Proc. Gener. Transmiss. Distrib., vol. 144, no. 3, pp. 309–316,May 1997.
[4] R. K. Aggarwal, Y. Aslan, and A. T. Johns, “An interactive approach tofault location on overhead distribution lines with load taps,” in Proc. 6thInt. Conf. Develop. Power Syst. Protect., Nottingham, U.K., Mar. 1997,pp. 184–187.
[5] J. J. Mora, G. Carrillo, and L. Perez, “Fault location in powerdistribution systems using ANFIS nets and current patterns,” inProc. IEEE/PES Transmiss. Distrib. Conf. Expo. Lat. Amer., Caracas,Venezuela, Aug. 2006, pp. 1–7.
[6] J. Mora-Florez, V. Barrera-Nuez, and G. Carrillo-Caicedo, “Fault loca-tion in power distribution systems using a learning algorithm formultivariable data analysis,” IEEE Trans. Power Del., vol. 22, no. 3,pp. 1715–1721, Jul. 2007.
[7] J. Mora-Florez, J. Meléndez, and G. Carrillo-Caicedo, “Comparison ofimpedance based fault location methods for power distribution systems,”Elect. Power Syst. Res., vol. 78, pp. 657–666, Apr. 2008.
[8] A. A. Girgis, C. M. Fallon, and D. L. Lubkeman, “A fault locationtechnique for rural distribution feeders,” IEEE Trans. Ind. Appl., vol. 29,no. 6, pp. 1170–1175, Nov./Dec. 1993.
[9] M. S. Choi et al., “A direct three-phase circuit analysis-based faultlocation for line-to-line fault,” IEEE Trans. Power Del., vol. 22, no. 4,pp. 2541–2547, Oct. 2007.
[10] A. Borghetti et al., “Continuous-wavelet transform for fault locationin distribution power networks: Definition of mother wavelets inferredfrom fault originated transients,” IEEE Trans. Power Syst., vol. 23, no. 2,pp. 380–388, May 2008.
[11] Z. Q. Bo et al., “Accurate fault location technique for distributionsystem using fault-generated high-frequency transient voltage signals,”IEEE Proc. Gener. Transmiss. Distrib., vol. 146, no. 1, pp. 73–79,Jan. 1999.
[12] F. H. Magnago and A. Abur, “Fault location using wavelets,”IEEE Trans. Power Del., vol. 13, no. 4, pp. 1475–1480, Oct. 1998.
[13] S. Lotfifard, M. Kezunovic, and M. J. Mousavi, “Voltage sag data uti-lization for distribution fault location,” IEEE Trans. Power Del., vol. 26,no. 2, pp. 1239–1246, Apr. 2011.
[14] P.-C. Chen, V. Malbasa, and M. Kezunovic, “Sensitivity analysis ofvoltage sag based fault location algorithm,” in Proc. 18th Power Syst.Comput. Conf. (PSCC), Wroclaw, Poland, 2014.
[15] S. Lotfifard, M. Kezunovic, and M. J. Mousavi, “A systematic approachfor ranking distribution systems fault location algorithms and eliminatingfalse estimates,” IEEE Trans. Power Del., vol. 28, no. 1, pp. 285–293,Jan. 2013.
[16] R. H. Diaz and T. M. Lopez, “Fault location techniques for electricaldistribution networks: A literature survey,” in Proc. Eur. Power EnergySyst., Benalmádena, Spain, Jun. 2005, pp. 311–318.
[17] IEEE Guide for Determining Fault Location on AC Transmission andDistribution Lines, IEEE Standard C37.114-2004, Jun. 2005.
[18] S. M. Brahma, “Fault location in power distribution system with pene-tration of distributed generation,” IEEE Trans. Power Del., vol. 26, no. 3,pp. 1545–1553, Jul. 2011.
[19] S. M. Brahma and A. A. Girgis, “Development of adaptive protectionscheme for distribution systems with high penetration of distributedgeneration,” IEEE Trans. Power Del., vol. 19, no. 1, pp. 56–63,Jan. 2004.

2106 IEEE TRANSACTIONS ON SMART GRID, VOL. 6, NO. 4, JULY 2015
[20] D. Johnsonbaugh, Fault Location for Distribution Systems WithDistributed Generation Using Modified Three Phase Fault LocationMethods. Clemson, SC, USA: Clemson Univ., 2004.
[21] J. Miret et al., “Control scheme for photovoltaic three-phase invert-ers to minimize peak currents during unbalanced grid-voltage sags,”IEEE Trans. Power Electron., vol. 27, no. 10, pp. 4262–4271, Oct. 2012.
[22] M. H. J. Bollen, Understanding Power Quality Problems: Voltage Sagsand Interruptions. Piscataway, NJ, USA: IEEE Press, 2000.
[23] P.-C. Chen, M. Yimai Dong, V. Malbasa, and M. Kezunovic,“Uncertainty of measurement error in intelligent electronic devices,”in Proc. IEEE/PES Gen. Meeting, National Harbor, MD, USA, 2014,pp. 1–5.
[24] SimLab 2.2 Reference Manual, Inst. Protect. Security Citizen (IPSC),Joint Res. Centre (JRC), Eur. Commission, Ispra, Italy, 2004.
[25] Alternative Transients Program. (2010). ATP-EMTP. [Online].Available: http://www.emtp.org/
[26] IEEE Standard for Interconnecting Distributed Resources With ElectricPower System, IEEE Standard 1547.2-2008, Apr. 2009.
[27] Handbook of General Requirements for Electrical Service to DispersedGeneration Customers, Specification EO-2115 Revision 8, ConsolidatedEdison Company New York, Inc., New York, NY, USA, Mar. 2006.
[28] J. A. Martinez and J. Martin-Arnedo, “Advanced load models for voltagesag studies in distribution networks,” in Proc. IEEE/PES Gen. Meeting,vol. 1. Denver, CO, USA, Jun. 2004, pp. 614–619.
[29] A. Herrera-Orozco, S. Perez-Londobo, and J. Mora-Florez, “Loadmodeling for fault location in distribution systems with distributedgeneration,” in Proc. 6th IEEE/PES Transmiss. Distrib. Latin Amer.Conf. Expo. (T&D-LA), Montevideo, Uruguay, Sep. 2012, pp. 1–8.
[30] S. Chakraborty, B. Kroposki, and W. Kramer, “Advanced power elec-tronic interfaces for distributed energy systems. Part 2: Modeling,development, and experimental evaluation of advanced control functionsfor single-phase utility-connected inverter,” Nat. Renew. Energy Lab.,Washington, DC, USA, Tech. Rep. NREL/TP-550-44313, Nov. 2008.
[31] S. Boljevic and M. F. Martin-Arnedo, “The contribution to distributionnetwork short-circuit current level from the connection of distributedgeneration,” in Proc. IEEE/PES Gen. Meeting, vol. 1. Denver, CO, USA,Jun. 2004, pp. 614–619.
[32] E. V. Mgaya and Z. Muller, “The impact of connecting distributed gen-eration to the distribution system,” Acta Polytech., vol. 47, nos. 4–5,pp. 96–101, 2007.
[33] P.-C. Chen et al., “Analysis of voltage profile problems due to the pene-tration of distributed generation in low-voltage secondary distributionnetworks,” IEEE Trans. Power Del., vol. 27, no. 4, pp. 2020–2028,Oct. 2012.
[34] W. El-Khattam, Y. G. Hegazy, and M. M. A. Salama, “Investigating dis-tributed generation systems performance using Monte Carlo simulation,”IEEE Trans. Power Syst., vol. 21, no. 2, pp. 524–532, May 2006.
[35] P.-C. Chen and M. Kezunovic, “Analysis of the impact of distributedgeneration placement on voltage profile in distribution systems,” in Proc.IEEE/PES Gen. Meeting, Vancouver, BC, Canada, Jul. 2013, pp. 1–5.
[36] P.-C. Chen, T. Dokic, and M. Kezunovic, “The use of big data foroutage management in distribution systems,” in Proc. Int. Conf. Elect.Distrib. (CIRED) Workshop, Rome, Italy, 2014, Art. ID 0406.
[37] P. Dehghanian, M. Fotuhi-Firuzabad, S. Bagheri-Shouraki, andA. A. R. Kazemi, “Critical component identification in reliability cen-tered asset management of distribution power systems via fuzzy AHP,”IEEE Syst. J., vol. 6, no. 4, pp. 593–602, Dec. 2012.
[38] H. Tram, “Technical and operation considerations in using smart meter-ing for outage management,” in Proc. IEEE/PES Trans. Distrib. Conf.Expo. (T&D), Chicago, IL, USA, 2008, pp. 1–3.
[39] Y. Dong, C. Zheng, and M. Kezunovic, “Enhancing accuracy whilereducing computation complexity for voltage sag based distributionfault location,” IEEE Trans. Power Del., vol. 28, no. 2, pp. 1202–1212,Apr. 2013.
[40] C. Zheng, V. Malbasa, and M. Kezunovic, “Regression tree for stabil-ity margin prediction using synchrophasor measurements,” IEEE Trans.Power Syst., vol. 28, no. 2, pp. 1978–1987, May 2013.
[41] M. T. Goodrich et al., Data Structures and Algorithms in C++, 2nd ed.Hoboken, NJ, USA: Wiley, 2011.
[42] P.-C. Chen, V. Malbasa, and M. Kezunovic, “Locating sub-cycle faultsin distribution network applying half-cycle DFT method,” in Proc.IEEE/PES Transmiss. Distrib. Conf. Expo., Chicago, IL, USA, 2014,pp. 1–5.
[43] F. de León et al., “Development of data translators for interfac-ing power-flow programs with EMTP-type programs: Challenges andlessons learned,” IEEE Trans. Power Del., vol. 28, no. 2, pp. 1192–1201,Apr. 2013.
[44] I. M. Sobol’, “On the distribution of points in a cube and the approxi-mate evaluation of integrals,” Zh. Vychisl. Mat. Mat. Fiz., vol. 7, no. 4,pp. 784–802, 1967.
[45] R. Zivanovic and H. Ooi, “A systematic approach for testing transmis-sion line fault-locating techniques,” in Proc. Elect. Conf. Elect. EnergySoc. Australia (EESA), Melbourne VIC, Australia, Aug. 2007, pp. 1–6.
[46] P.-C. Chen et al., “Sensitivity of voltage sag based fault location in dis-tribution network to sub-cycle faults,” in Proc. 46th North Amer. PowerSymp. (NAPS), Pullman, WA, USA, 2014, pp. 1–6.
[47] A. Saltelli et al., Global Sensitivity Analysis: The Primer. Hoboken, NJ,USA: Wiley, 2008.
[48] S. Burhenne, D. Jacob, and G. P. Henz, “Sampling based on Sobol’sequences for Monte Carlo techniques applied to building simulations,”in Proc. Int. Conf. Build. Simulat., Sydney, NSW, Australia, Nov. 2011,pp. 1816–1823.
Po-Chen Chen (S’12) received the B.Sc. andM.Sc. degrees in electrical engineering from thePolytechnic Institute of New York University,Brooklyn, NY, USA, in 2010 and 2012, respec-tively. He is currently pursuing the Ph.D. degree inelectrical engineering from Texas A&M University,College Station, TX, USA.
His current research interests include distributedgeneration, power system analysis, power systemprotection and control, voltage quality and stabil-ity studies, and big data application for distributionsystem.
Vuk Malbasa (M’12) received the B.S. degree ininformatics from the Faculty of Sciences, Universityof Novi Sad, Novi Sad, Serbia, and the Ph.D.degree in computer science from Temple University,Philadelphia, PA, USA, in 2006 and 2012,respectively.
He is currently an Assistant Professor with theFaculty of Technical Sciences, University of NoviSad. His current research interests include regular-ized spatial models, intelligent sensor applications,graphical models, and cognitive communications innetworking.
Yimai Dong (S’07–M’13) received the B.S. andM.S. degrees from North China Electric PowerUniversity, Beijing, China, and the Ph.D. degreefrom Texas A&M University, College Station, TX,USA, in 2005, 2007, and 2013, respectively, all inelectrical engineering.
She is currently a Development and ApplicationsEngineer with Electricon International Inc., AnnArbor, MI, USA. Her current research interestsinclude distribution fault location, distribution out-age management, detailed modeling of relays and
protective devices, and simulation and analysis of protection system.Dr. Dong is a Member of the Council on Large Electric Systems (CIGRE).
Mladen Kezunovic (S’77–M’80–SM’85–F’99)received the Dipl. Ing., degree from the Universityof Sarajevo, Sarajevo, Bosnia, and the M.S., andPh.D. degrees from the University of Kansas,Lawrence, KS, USA, in 1974, 1977, and 1980,respectively, all in electrical engineering.
He is currently the Eugene E. Webb Professor,the Director of the Smart Grid Center, and theSite Director of the National Science FoundationIndustry and University Cooperative ResearchProgram Power Systems Engineering Research
Center, Tempe, AZ, USA. His current research interests include protectiverelaying, automated power system disturbance analysis, computationalintelligence and data analytics, and smart grids. He has published over450 papers, given over 100 seminars, invited lectures and short courses,and consulted for over 50 companies worldwide. He is the Principal ofXpertPower Associates, College Station, TX, USA.
Prof. Kezunovic is a CIGRE Fellow and a Registered ProfessionalEngineer in Texas.