206410 sales forecasting at arrow electronics
TRANSCRIPT

Sales Forecasting at Arrow Electronics using
Multiple Linear Regression
Session: 206410
Jesper Johansen
Blue Stone International, LLC

Services Include:
Long Range Planning
M&A
Stochastic Analysis
Profitability Analysis
Treasury/Capital Modeling
Tax Modeling
Impairment Testing
Services Include:Key Performance Indicators/Chart of
Accounts Analysis
Driver Analysis
Process Improvement
Initiative Assessments
Project & Process Roadmap
Introduction to Blue Stone International
Advisory & Industry
Strategy Management
Planning & Analytics
Financial Consolidation & Reporting
Services Include:Consolidations
Financial Close
External (XBRL) Reporting
Account Reconciliations
Enterprise Migrations
Services Include: Operational Budgeting
Rolling Forecasts
Workforce
(Headcount Planning)
Capital Planning
Project Planning
Profitability & Analytics
Cash Flow Forecasting

Agenda
•Sales Forecasting at Arrow Electronics
• Initial Sales Forecasting Model
•Time Series Analysis
•Simple Linear Regression
•Seasonality in Data
•Current Arrow Model
•Multiple Linear Regression
•Macro and Micro Economic Factors

Sales Forecasting

Sales Forecasting

Time Series Analysis
• Forecasting one series without the effect of outside influences (i.e., no explanatory variables)
• Examines historical data to detect level, trend, and seasonality
• Predict future values using one of eight methods
• Method selection based on “goodness-of-fit”
• Generated output includes charts, reports
• Forecasted values are in the form of assumptions with normal distributions
x
ε2
x
x

Forecasting Using Time Series Analysis
Eight Time Series Models for forecasting:
Single Moving Average
Single Exponential Smoothing
Double Moving Average
Double Exponential Smoothing
Seasonal Additive
Seasonal Multiplicative
Holt-Winters Additive
Holt-Winters Multiplicative
ARIMA (Autoregressive Integrated Moving Average)

Forecasting Using Time Series Analysis

Forecasting Using Regression Analysis
Adjusted R-Squared = 19.5%

Understanding the Data
• Quarter end Spikes (Seasonality)
• Number of Business Days (Ship Days) per Month. Noise due to “Calendar”
• Identify Internal and External Factors Impacting Sales
• Test and Calibrate Model

Normalizing Data – Raw Sales

Normalizing Data – Sales per Ship Day
Number of Ship Days in a Month 18-25

Normalizing Data – Adjust for Seasonality

Normalizing Data – Adjust for Seasonality

Seasonality in Sales per Ship Day

Normalizing Data – Adjust for Seasonality
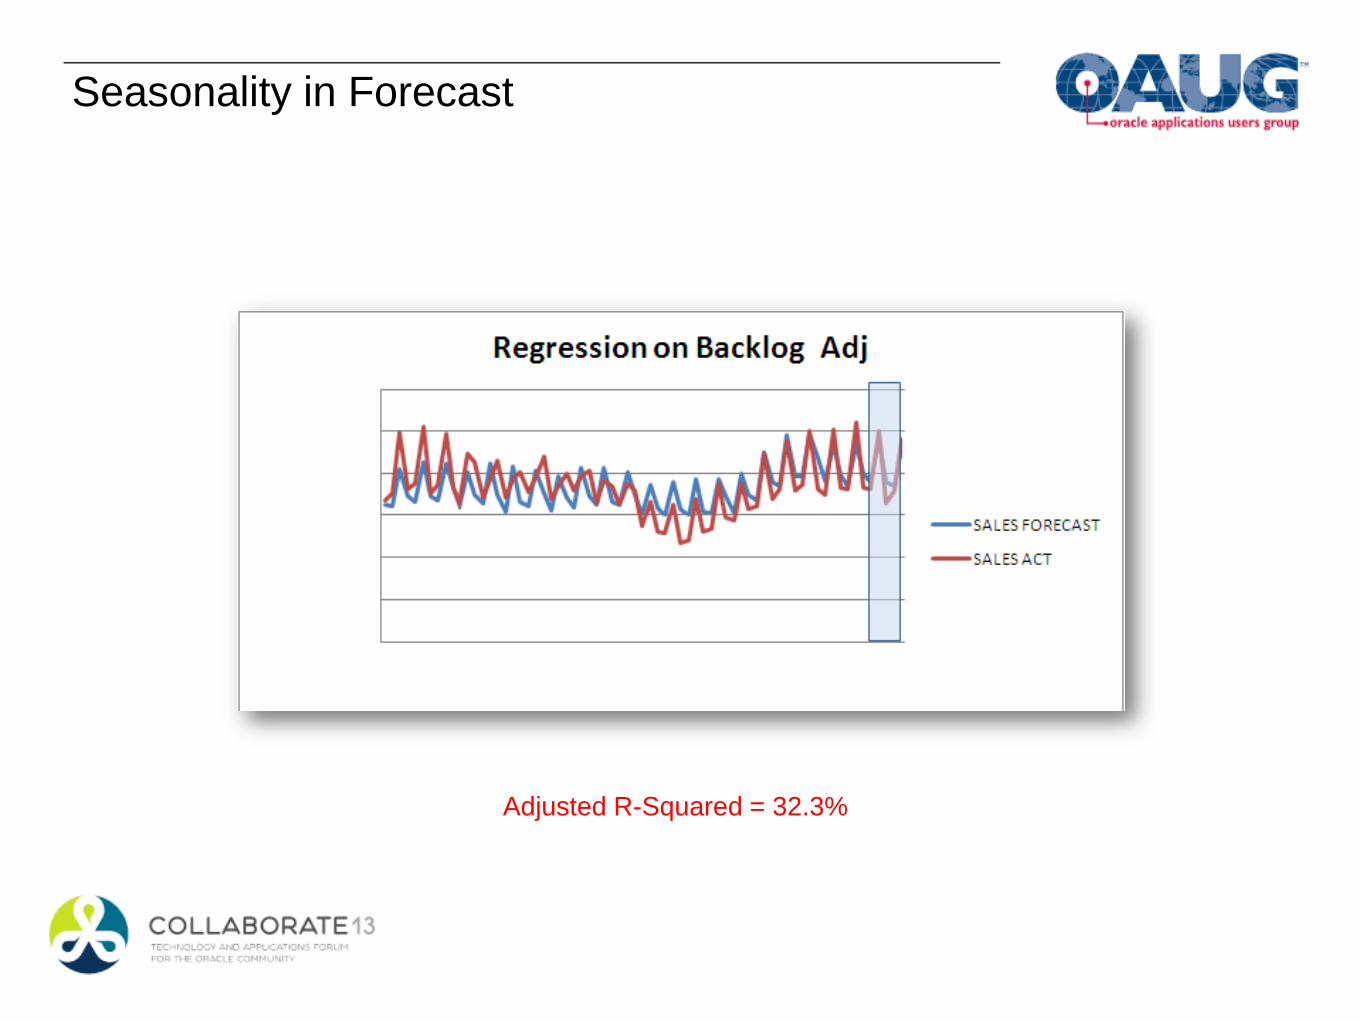
Seasonality in Forecast
Adjusted R-Squared = 32.3%

Forecasting Using Regression Analysis
Adjusted R-Squared = 19.5%

Multiple Linear Regression
• Using past data to define a relationship between variables
• Dependent variable values are driven by independent variable values
• Predictor creates equation relating the variables
• Forecasts independent variable using time series methods
• Forecasts dependent variable using the generated equation and the
forecasted independent variable values

Multiple Linear Regression
y = b0 + b1x1 + b2x2 + b3x3 +…+ ε
Dependent
Variable
Independent
VariablesIntercept

Multiple Linear Regression Model
Internal Data
• Inventory
• Book to Bill
• Bookings
• Billings
• Backlog
• Ship Days
External Data
• PMI
• GDP
• Consumer Confidence
• Unemployment
• 10 Year T-Note
• Semiconductor Sales

Normalizing Data – Adjust for Seasonality

Normalizing Data – Adjust for Seasonality

Normalizing Data – Adjust for Seasonality

Normalizing Data – Adjust for Seasonality

Normalizing Data – Adjust for Seasonality

Normalizing Data – Adjust for Seasonality

Normalizing Data – Adjust for Seasonality

Normalizing Data – Adjust for Seasonality

Normalizing Data – Adjust for Seasonality

Normalizing Data – Adjust for Seasonality

Multiple Linear Regression Model

Multiple Linear Regression Model Current Version
Sales per Ship Day = Constant
+ b1 x PMI
- b2 x Unemployment
+ b3 x Billings per Ship Day
+ b4 x Backlog
Adjusted R-Squared = 94.66%

Multiple Linear Regression Model
Monthly Forecast = Forecasted Sales per Ship
Day
x Ship Days in Forecasted Month
x Seasonal Adjustment Factor

Multiple Linear Regression Model
Adjusted R-Squared = 94.66%

Test: Forecasting The Past
Variances Based on a 3 Month Forecast Each Month
-10%
-8%
-6%
-4%
-2%
0%
2%
4%
6%
8%
10%
January February March April May June July August September October
Forecast Variance

Model Stability
Sales per Ship Day = 5,484,922 + 68,969 x PMI - 369,550 x Unemployment
+ .4627 x Billings per Ship Day + .0031 x Backlog
Adjusted R-Squared = 94.66%

Quarter 1 Forecast

Q&A

THANK YOU
Jesper Johansen
(303) 325-1946