2021 three-month sales - nestlé
TRANSCRIPT

2021 Three-month salesInvestor Call
Disclaimer
This presentation contains forward looking statements which reflect Management’s current views and
estimates. The forward looking statements involve certain risks and uncertainties that could cause
actual results to differ materially from those contained in the forward looking statements. Potential
risks and uncertainties include such factors as general economic conditions, foreign exchange
fluctuations, competitive product and pricing pressures and regulatory developments.
April 22, 2021 Nestlé three-month sales 20212

A
pr
il
2
2021 Three-month salesMark Schneider, CEO
Key messages
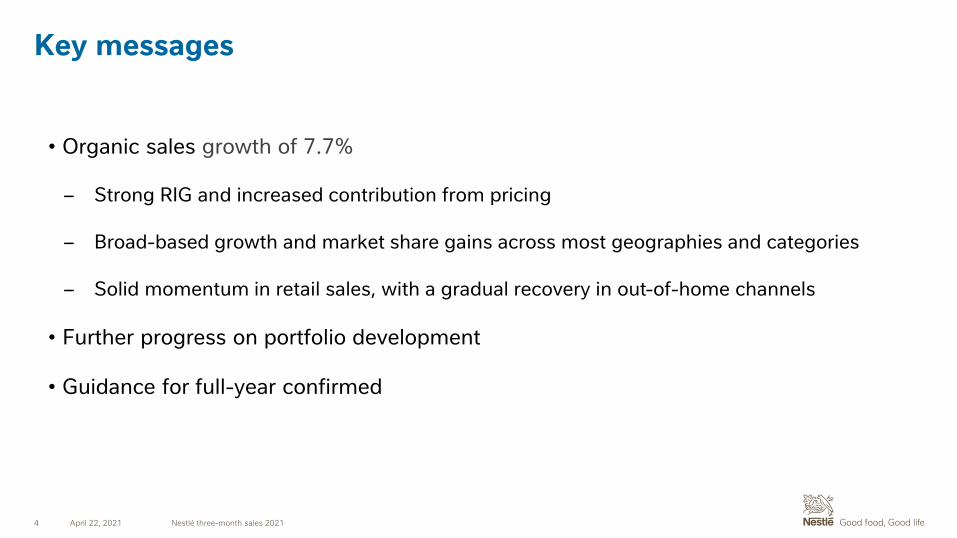
• Organic sales growth of 7.7%
– Strong RIG and increased contribution from pricing
– Broad-based growth and market share gains across most geographies and categories
– Solid momentum in retail sales, with a gradual recovery in out-of-home channels
• Further progress on portfolio development
• Guidance for full-year confirmed
April 22, 2021 Nestlé three-month sales 20214

Our business as a force for good: COVID-19 vaccination support
5
Partnering with COVAX, the IFRC and local
authorities around the world to support the broad
and equitable delivery of COVID-19 vaccines
April 22, 2021 Nestlé three-month sales 2021

Three-month sales 2021François-Xavier Roger, CFO

3M 2020 salesCHF bn
RIG Net M&A 3M 2021 salesCHF bn
+6.4%
-30
21.1
Pricing
20.8
Foreign exchange
Reported sales growth +1.3%
OG 7.7%
-5.3 %
-1.0%
+1.2%
Three-month sales growth
April 22, 2021 Nestlé three-month sales 20217

Broad-based growth
April 22, 2021 Nestlé three-month sales 20218
Each geography includes Zones, Nespresso, Nestlé Health Science
Sales (in CHF)
RIG
Pricing
OG
AMS
9.3 bn
6.4%
2.1%
8.5%
EMENA
6.4 bn
4.6%
0.7%
5.3%
AOA
5.4 bn
8.6%
0.3%
8.9%

Strong growth across developed and emerging markets
April 22, 2021 Nestlé three-month sales 20219
Sales (in CHF)
% of group sales
RIG
Pricing
OG
Developed Emerging
12.3 bn58%
8.8 bn42%
4.8% 8.7%
0.2% 2.7%
5.0% 11.4%

Strong momentum in retail, easier comps in out-of-home
10
Out-of-home*
* Includes Nestlé Professional, foodservice activities of Nespresso, Starbucks products and water, travel retail and Blue Bottle
Organic sales growth
Retail
3M-2021
-11.6%
FY-2020
-30.4%
FY-2020
7.0%
FY-2019
3.4% 4.0%
FY-2019
April 22, 2021 Nestlé three-month sales 2021
3M-2021
9.2%

Zone AMS
April 22, 2021 Nestlé three-month sales 202111
• Strong organic growth based on robust RIG and solid pricing, with broad-based market share gains
• North America posted mid single-digit growth, led by food, coffee and creamers as well as Purina PetCare
• Latin America reached double-digit growth, with broad-based contributions across geographies and most product categories
Sales CHF 8.2 bn
Real internal growth +4.8%
Pricing +2.4%
Organic growth +7.2%

Zone EMENA
April 22, 2021 Nestlé three-month sales 202112
• Strong RIG-based organic growth, with continued market share gains
• Most markets saw increased growth supported by e-commerce momentum and product innovation
• Largest growth contributors were coffee, Purina PetCare, and culinary products
Sales CHF 5.2 bn
Real internal growth +3.8%
Pricing +0.6%
Organic growth +4.4%

Zone AOA
April 22, 2021 Nestlé three-month sales 202113
• China posted double-digit organic growth, helped by out-of-home channel recovery and timing of Chinese New Year
• Outside of China, the Zone grew at a mid single-digit rate
• Largest contributors to growth were culinary, dairy and coffee
Sales CHF 5.1 bn
Real internal growth +8.8%
Pricing +0.3%
Organic growth +9.1%

Nespresso
April 22, 2021 Nestlé three-month sales 202114
• Double-digit organic growth, driven by strong momentum in e-commerce and Vertuo
• The Americas, EMENA and AOA all posted double-digit growth
• North America was the largest contributor to growth, with continued market share gains
Sales CHF 1.6 bn
Real internal growth +16.3%
Pricing +0.8%
Organic growth +17.1%

Nestlé Health Science
April 22, 2021 Nestlé three-month sales 202115
• Strong organic growth supported by continued momentum in e-commerce and demand for vitamins, minerals and supplements
• Consumer care reported double-digit growth, with particular strength in Garden of Life, Vital Proteins and Persona
• Medical nutrition saw mid single-digit growth
Sales CHF 0.9 bn
Real internal growth +9.4%
Pricing +0.1%
Organic growth +9.5%

Organic sales growth by category
April 22, 2021 Nestlé three-month sales 202116
8.7%
PetCare
7.7%
Total group
9.9%
Powdered and Liquid Beverages
-0.5%
Nutrition and Health Science
10.3%
Confectionery
10.2%
Prepared dishesand cooking aids
-5.6%
Water
15.7%
Milk productsand Ice cream

Q&A
A
pr
il
2

Supporting slides
A
pr
il
2

5.7
6.9
8.6
6.8
9.2
Quarterly organic sales growth by channel
19
Q1-2020 Q2-2020 Q3-2020
Q1-2020 Q2-2020 Q3-2020
Out-of-home*Retail
* Includes Nestlé Professional, foodservice activities of Nespresso, Starbucks products and water, travel retail and Blue Bottle
OG %
Q4-2020
Q4-2020
Q1-2021
Q1-2021
-11.2
-54.7
-26.4 -27.0
-11.6
April 22, 2021 Nestlé three-month sales 2021

3M-2021 Operating segments – topline summary
April 22, 2021 Nestlé three-month sales 202120
3M-2021 sales
Sales RIG Pricing OG Net M&A F/X
Reportedsales
growth
(CHF m) % % % % % %
Zone AMS 8 244 4.8 2.4 7.2 0.3 -8.6 -1.2
Zone EMENA 5 203 3.8 0.6 4.4 -3.7 -2.8 -2.1
Zone AOA 5 094 8.8 0.3 9.1 -3.4 -3.4 2.3
Nespresso 1 571 16.3 0.8 17.1 -0.1 -1.4 15.6
Nestlé Health Science 930 9.4 0.1 9.5 17.3 -5.2 21.6
Others 47 -11.1 0.3 -10.8 0.0 -2.3 -13.2
Total Group 21 089 6.4 1.2 7.7 -1.0 -5.3 1.3

3M-2021 Products – topline summary
April 22, 2021 Nestlé three-month sales 202121
3M-2021 sales
Sales RIG Pricing OG
(CHF m) % % %
Powdered and liquid beverages 5 771 9.3 0.6 9.9
Water 1 389 -8.1 2.5 -5.6
Milk products and Ice cream 2 598 11.6 4.1 15.7
Nutrition and Health Science 2 995 -1.1 0.7 -0.5
Prepared dishes and cooking aids 3 016 9.9 0.3 10.2
Confectionery 1 700 9.1 1.2 10.3
Petcare 3 620 7.7 1.0 8.7
Total group 21 089 6.4 1.2 7.7

3M-2021 historical eight quarters
April 22, 2021 Nestlé three-month sales 202122
Period RIG%
Pricing%
OG%
Q2-2019 3.0 0.9 3.9
Q3-2019 3.9 -0.2 3.7
Q4-2019 2.5 0.5 3.0
Q1-2020 4.7 -0.4 4.3
Q2-2020 0.5 0.8 1.3
Q3-2020 4.8 0.1 4.9
Q4-2020 3.0 0.9 3.9
Q1-2021 6.4 1.2 7.7

3M-2021 currency overview
April 22, 2021 Nestlé three-month sales 202123
Weighted average rate
3M-2020 3M-2021 Variation in %
US Dollar 1 USD 0.967 0.906 -6.4
Euro 1 EUR 1.067 1.091 2.3
Chinese Yuan Renminbi 100 CNY 13.893 13.922 0.2
Brazilian Real 100 BRL 21.52 16.55 -23.1
Philippine Peso 100 PHP 1.903 1.873 -1.6
UK Pound Sterling 1 GBP 1.233 1.249 1.3
Mexican Peso 100 MXN 4.857 4.447 -8.4
Canadian Dollar 1 CAD 0.717 0.715 -0.3
Japanese Yen 100 JPY 0.889 0.854 -3.9
Australian Dollar 1 AUD 0.632 0.7 10.7
Russian Ruble 100 RUB 1.438 1.218 -15.3

Abbreviations
April 22, 2021 Nestlé three-month sales 202124
• OG
• RIG
• AMS
• EMENA
• AOA
Organic growth
Real internal growth
Americas
Europe, Middle East, and North Africa
Asia, Oceania, and sub-Saharan Africa