2021 professional services maturity™ benchmark
TRANSCRIPT
February 2021
www.spiresearch.com
Service Performance Insight, LLC
2021 Professional Services Maturity™ Benchmark
Service Performance Insight, LLC
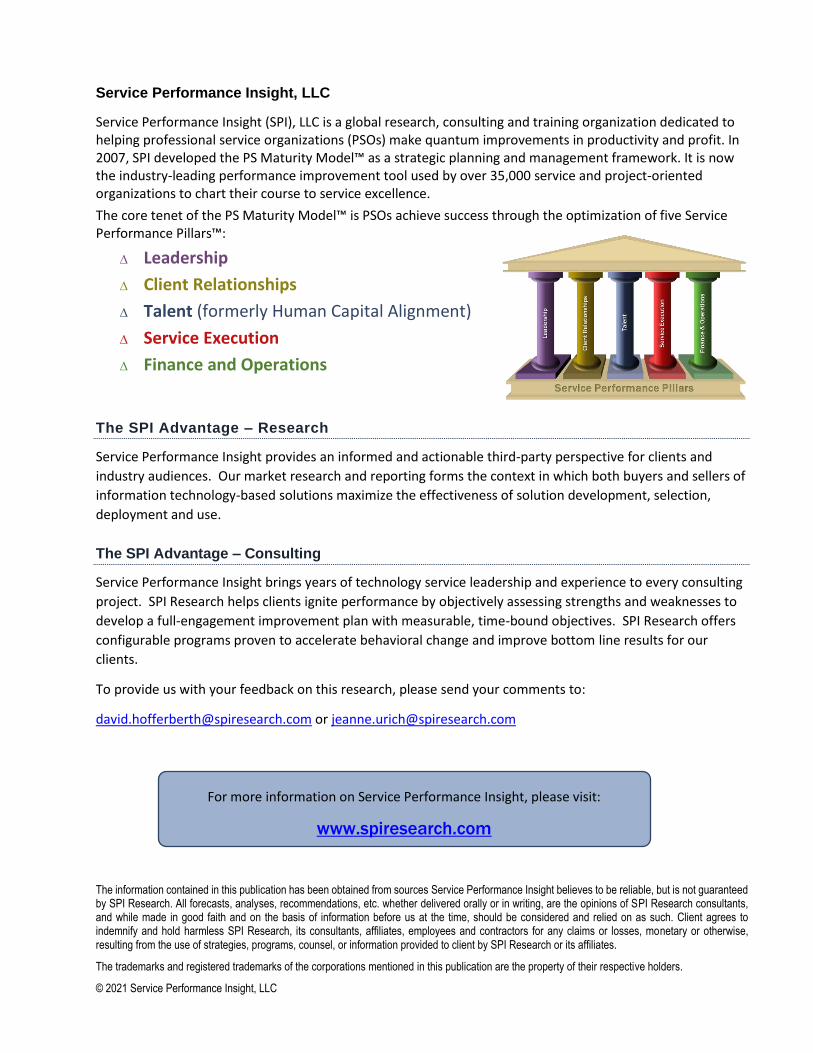
Service Performance Insight (SPI), LLC is a global research, consulting and training organization dedicated to helping professional service organizations (PSOs) make quantum improvements in productivity and profit. In 2007, SPI developed the PS Maturity Model™ as a strategic planning and management framework. It is now the industry-leading performance improvement tool used by over 35,000 service and project-oriented organizations to chart their course to service excellence.
The core tenet of the PS Maturity Model™ is PSOs achieve success through the optimization of five Service Performance Pillars™:
∆ Leadership
∆ Client Relationships
∆ Talent (formerly Human Capital Alignment)
∆ Service Execution
∆ Finance and Operations
The SPI Advantage – Research
Service Performance Insight provides an informed and actionable third-party perspective for clients and
industry audiences. Our market research and reporting forms the context in which both buyers and sellers of
information technology-based solutions maximize the effectiveness of solution development, selection,
deployment and use.
The SPI Advantage – Consulting
Service Performance Insight brings years of technology service leadership and experience to every consulting
project. SPI Research helps clients ignite performance by objectively assessing strengths and weaknesses to
develop a full-engagement improvement plan with measurable, time-bound objectives. SPI Research offers
configurable programs proven to accelerate behavioral change and improve bottom line results for our
clients.
To provide us with your feedback on this research, please send your comments to:
[email protected] or [email protected]
The information contained in this publication has been obtained from sources Service Performance Insight believes to be reliable, but is not guaranteed by SPI Research. All forecasts, analyses, recommendations, etc. whether delivered orally or in writing, are the opinions of SPI Research consultants, and while made in good faith and on the basis of information before us at the time, should be considered and relied on as such. Client agrees to indemnify and hold harmless SPI Research, its consultants, affiliates, employees and contractors for any claims or losses, monetary or otherwise, resulting from the use of strategies, programs, counsel, or information provided to client by SPI Research or its affiliates.
The trademarks and registered trademarks of the corporations mentioned in this publication are the property of their respective holders.
© 2021 Service Performance Insight, LLC
For more information on Service Performance Insight, please visit:
www.spiresearch.com

© 2021 Service Performance Insight, LLC www.timelog.dk i
Table of Contents
Business maturity is key to improve your profit margins .................................................................... i
TimeLog: Professional Services Automation software for optimising your contract to cash workflow ............................................................................................................................................. ii
1. Forward ....................................................................................................................................... 1
2020 – A Year Like No Other ............................................................................................................... 1
Revenue Growth by Geography .......................................................................................................... 3
Revenue Growth by Industry Segment ............................................................................................... 5
A Return to the “New Normal” in 2021 .............................................................................................. 7
2. The Professional Services Maturity™ Model ......................................................................... 9
Service Performance Pillars™ ............................................................................................................ 10
Professional Services Maturity™ Model Benchmark Levels ............................................................. 11
Building the Professional Services Maturity™ Model ....................................................................... 13
Why Maturity Matters ...................................................................................................................... 15
Pillar Importance and Organizational Maturity ................................................................................ 16
3. Survey Demographics ............................................................................................................ 19
The North American Professional Services Market .......................................................................... 20
PS Maturity™ Benchmark Vertical Market Demographics ............................................................... 22
4. High-Performance PSOs ........................................................................................................ 34
Pillar Performance ............................................................................................................................. 34
High-Performance Conclusions ......................................................................................................... 40
5. Professional Services Business Applications ..................................................................... 42
Primary Professional Services Business Applications ........................................................................ 43
Quote to Cash.................................................................................................................................... 44
PS Solution Adoption......................................................................................................................... 45
Solution Satisfaction .......................................................................................................................... 50
6. Leadership Pillar ..................................................................................................................... 63
The Leadership Index ........................................................................................................................ 65
Leadership Issues .............................................................................................................................. 67
Steps Taken to Improve Profitability ................................................................................................. 72
7. Client Relationships Pillar ..................................................................................................... 75
The PS Sales Maturity Model™ ......................................................................................................... 77
© 2021 Service Performance Insight, LLC www.timelog.dk ii
Survey Results ................................................................................................................................... 82
8. Talent Pillar .............................................................................................................................. 98
Survey Results ................................................................................................................................. 100
9. Service Execution Pillar ........................................................................................................119
Service Execution Best Practices ..................................................................................................... 120
Operations ....................................................................................................................................... 120
Project Management Office ............................................................................................................ 121
Service Engineering ......................................................................................................................... 121
Strategic Resource Management for PSOs ..................................................................................... 121
Survey Results ................................................................................................................................. 124
10. Finance and Operations Pillar. ............................................................................................139
Survey Results ................................................................................................................................. 141
Income Statements ......................................................................................................................... 155
11. 2021 Professional Services Maturity™ Model Results ...................................................161
Maturity Levels ................................................................................................................................ 161
The Financial Benefits of Moving Up Levels .................................................................................... 166
Model Conclusions .......................................................................................................................... 168
12. Conclusions and Recommendations .................................................................................169
13. Appendices ............................................................................................................................172
Appendix A: Acronyms Used in This Report ................................................................................... 172
Appendix B: Financial Terminology ................................................................................................ 173
Appendix C: Professional Services Maturity™ Benchmark Survey Tool ......................................... 179
Appendix D: Related SPI Research ................................................................................................. 183
About Service Performance Insight ................................................................................................. 185
Figures
Figure 1: Annual PS Revenue Growth vs. Headcount Growth ..................................................................... 2
Figure 2: Annual Revenue Growth by Geographic Region ........................................................................... 3
Figure 3: Annual Profit by Geographic Region ............................................................................................. 4
Figure 4: Annual New Logo Client Percent of Revenue by Geographic Region ........................................... 4
Figure 5: Annual Attrition by Geographic Region ........................................................................................ 5

© 2021 Service Performance Insight, LLC www.timelog.dk iii
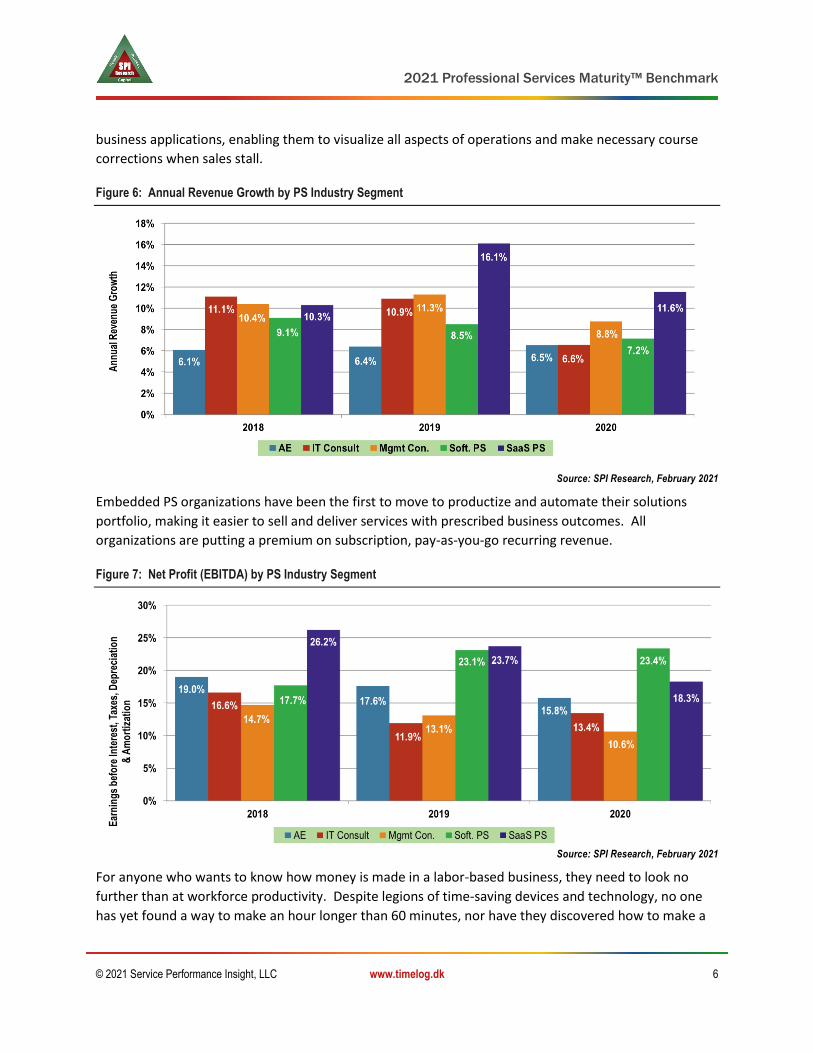
Figure 6: Annual Revenue Growth by PS Industry Segment ........................................................................ 6
Figure 7: Net Profit (EBITDA) by PS Industry Segment ................................................................................. 6
Figure 8: Annual Growth, Profit and Utilization ........................................................................................... 7
Figure 9: Service Performance Pillars™ ...................................................................................................... 10
Figure 10: Services Maturity™ Model Levels ............................................................................................. 12
Figure 11: Service Performance Pillar Maturity™ ...................................................................................... 13
Figure 12: Professional Services Maturity™ Progression ........................................................................... 15
Figure 13: PS Performance Pillars – Core KPIs ........................................................................................... 17
Figure 14: Benchmark Participant Vertical Market Distribution................................................................ 23
Figure 15: Regional Demographics ............................................................................................................ 25
Figure 16: Independent vs. Embedded Survey Orgs Surveyed (2007 – 2020) ........................................... 28
Figure 17: Organization Size ....................................................................................................................... 30
Figure 18: Headquarters Location – Region ............................................................................................... 30
Figure 19: Total Company Revenue ........................................................................................................... 31
Figure 20: Total Professional Services Revenue ......................................................................................... 31
Figure 21: Year-over-Year Change in PS Revenue ...................................................................................... 32
Figure 22: Year-over-Year Change in PS Headcount .................................................................................. 32
Figure 23: Percentage of Employees Billable ............................................................................................. 33
Figure 24: Percentage of PS Rev. Delivered by 3rd-parties ....................................................................... 33
Figure 25: Core Professional Services Business Applications..................................................................... 43
Figure 26: Primary Quote-to-Cash business processes span multiple departments ................................. 44
Figure 27: Quote-to-cash process .............................................................................................................. 45
Figure 28: Commercial Solution Adoption ................................................................................................. 47
Figure 29: Corporate Financial Management (CFM) Solution Used .......................................................... 52
Figure 30: Client Relationship Management (CRM) Solution Used ........................................................... 53
Figure 31: Professional Services Automation (PSA) Solution Used ........................................................... 55
Figure 32: Human Capital Management (HCM) Solution Used ................................................................. 58
Figure 33: Business Intelligence (BI) Solution Used ................................................................................... 60
Figure 34: Success depends on inter-departmental cooperation .............................................................. 62
© 2021 Service Performance Insight, LLC www.timelog.dk iv
Figure 35: Annual fully loaded cost per consultant ................................................................................. 115
Figure 36: Professional Services Headquarters Functions ....................................................................... 120
Figure 37: Project Margin Five-year Trend .............................................................................................. 133
Figure 38: Project Margin Comparison by Type ....................................................................................... 133
Figure 39: Revenue per Billable Consultant Five-year Trend ................................................................... 145
Figure 40: Professional Services Maturity Model™ Levels....................................................................... 161
Figure 41: Increase performance by focusing on low-performing KPIs ................................................... 164
Figure 42: Key Performance Indicators (KPIs) are Correlated ................................................................. 168
Tables
Table 1: Five-year PS Key Performance Metrics .......................................................................................... 2
Table 2: Maturity Matters! .......................................................................................................................... 9
Table 3: Performance Pillars Mapped Against Service .............................................................................. 14
Table 4: Service Pillar Importance by Organizational Maturity Level ........................................................ 16
Table 5: Vertical PS Markets — the North American Industry Classification System ................................ 20
Table 6: 2018 NAICS Services Rollup (Number of Firms) ........................................................................... 21
Table 7: 2018 NAICS Services Rollup (Employees and Revenue) ............................................................... 22
Table 8: Number of Participating Firms by Vertical Market (2007 through 2020) .................................... 24
Table 9: Survey Participant Demographics by Organization Type and Geographic Region ....................... 24
Table 10: Survey Participant Demographics by Organization Size ............................................................. 25
Table 11: Survey Participant Demographics by Vertical Market ............................................................... 26
Table 12: Survey Participant Demographics by Vertical Market ............................................................... 26
Table 13: Type of Work Sold by Organization Type and Geographic Region ............................................ 27
Table 14: Type of Work Sold by Organization Size .................................................................................... 28
Table 15: High-Performance PSOs Comparison – Demographics .............................................................. 34
Table 16: High-Performance PSOs Comparison – Leadership ................................................................... 35
Table 17: High-Performance PSOs Comparison – Client Relationships ..................................................... 36
Table 18: High-Performance PSOs Comparison – Talent ........................................................................... 37
Table 19: High-Performance PSOs Comparison – Service Execution ......................................................... 38
Table 20: High-Performance PSOs Comparison – Finance & Operations .................................................. 39

© 2021 Service Performance Insight, LLC www.timelog.dk v
Table 21: High-Performance Comparison – Business Applications ........................................................... 40
Table 22: Commercial Solution Adoption .................................................................................................. 45
Table 23: Business Application Use by Organization Type and Geographic Region .................................. 48
Table 24: Business Application Use by Organization Size .......................................................................... 48
Table 25: Business Application Use by Vertical Service Market ................................................................ 49
Table 26: Business Application Use by Vertical Service Market Continued............................................... 50
Table 27: Solution Satisfaction ................................................................................................................... 51
Table 28: Impact – Client Relationship Management (CRM) Use .............................................................. 54
Table 29: Impact – Commercial CRM Integration ...................................................................................... 54
Table 30: Impact – Professional Services Automation (PSA) Use .............................................................. 56
Table 31: Impact – Commercial PSA Integration ....................................................................................... 57
Table 32: Impact – Human Capital Management (HCM) Use .................................................................... 58
Table 33: Impact – Commercial HCM Integration ...................................................................................... 59
Table 34: Impact – Business Intelligence (BI) Use ...................................................................................... 60
Table 35: Impact – Commercial BI Integration .......................................................................................... 61
Table 36: Solution Integration with Core Financials .................................................................................. 61
Table 37: The Leadership Maturity Model ................................................................................................. 64
Table 38: Impact Based on Leadership Maturity Scores ............................................................................ 66
Table 39: Impact – Well understood vision, mission and strategy ............................................................ 68
Table 40: Impact – Confidence in PS Leadership ....................................................................................... 68
Table 41: Impact – Ease of getting things done ......................................................................................... 69
Table 42: Impact – Goals and measurements in alignment ...................................................................... 69
Table 43: Impact – Employees have confidence in the PSO's future ......................................................... 70
Table 44: Impact – Effectively communicates with employees ................................................................. 70
Table 46: Impact – Innovation focused ...................................................................................................... 71
Table 45: Impact – Embraces change - nimble and flexible ....................................................................... 71
Table 47: Steps Taken to Improve Profitability by Organization Type and Geographic Region ................ 72
Table 48: Steps Taken to Improve Profitability by Organization Size ........................................................ 73
Table 49: Steps Taken to Improve Profitability by Vertical Market ........................................................... 73

© 2021 Service Performance Insight, LLC www.timelog.dk vi
Table 50: Steps Taken to Improve Profitability by Vertical Market ........................................................... 74
Table 51: PS Sales and Marketing Maturity Model™ ................................................................................. 75
Table 52: Client Relationships Pillar 5-year trend ...................................................................................... 76
Table 53: PS Sales Maturity Model™.......................................................................................................... 77
Table 54. Impact – Service Development Effectiveness ............................................................................ 79
Table 55: Impact – Service Marketing Effectiveness ................................................................................. 79
Table 56: PS Marketing Maturity™ Levels.................................................................................................. 81
Table 57: Impact – Service Sales Effectiveness .......................................................................................... 82
Table 58: Client Relationships KPIs by Organization Type and Geographic Region ................................... 83
Table 59: Client Relationships KPIs by Organization Size ........................................................................... 84
Table 60: Client Relationships KPIs by Vertical Market ............................................................................. 84
Table 61: Client Relationships KPIs by Vertical Market ............................................................................. 85
Table 62: Type of Work Sold by Organization Type and Geographic Region ............................................ 85
Table 63: Type of Work Sold by Organization Size .................................................................................... 86
Table 64: Type of Work Sold by Vertical Market ....................................................................................... 87
Table 65: Type of Work Sold by Vertical Market ....................................................................................... 87
Table 66: Impact – Percentage of Revenue from New Clients .................................................................. 88
Table 67: Impact – Primary target buyer for services ................................................................................ 89
Table 68: Impact – Bid-to-win ratio (per 10 bids) ...................................................................................... 89
Table 69: Impact – Size of deal pipeline ..................................................................................................... 90
Table 70: Year-over-year change – Deal Pipeline ...................................................................................... 91
Table 71: Impact – Sales cycle (days: qualified lead to contract sign.) ...................................................... 91
Table 72: Year-over-year change – Length of sales cycle (days) ................................................................ 92
Table 73: Impact – Service Discounting ..................................................................................................... 92
Table 74: Year-over-year change – Service Discount ................................................................................. 93
Table 75: Impact – Percentage of "referenceable" clients ........................................................................ 94
Table 76: Year-over-year change – Client references ................................................................................ 94
Table 77: Fee Structure by Organization Type and Geographic Region .................................................... 95
Table 78: Fee Structure by Organization Size ............................................................................................ 96
© 2021 Service Performance Insight, LLC www.timelog.dk vii
Table 79: Fee Structure by Service Market Vertical ................................................................................... 96
Table 80: Fee Structure by Service Market Vertical ................................................................................... 97
Table 81: Talent Maturity Model ............................................................................................................... 99
Table 82: Talent Performance Indicators tied to Maturity levels ............................................................ 100
Table 83: Talent Pillar 5-year trend .......................................................................................................... 101
Table 84: Talent KPIs by Organization Type and Geographic Region ...................................................... 101
Table 85: Talent KPIs by Organization Size .............................................................................................. 102
Table 86: Talent KPIs by Vertical Market ................................................................................................. 103
Table 87: Talent KPIs by Vertical Market ................................................................................................. 103
Table 88: Workforce Age and Gender by Organization Type and Geographic Region ............................ 104
Table 89: Workforce Age and Gender by Organization Size .................................................................... 104
Table 90: Workforce Age and Gender by Vertical Market ....................................................................... 105
Table 91: Workforce Age and Gender by Vertical Market ....................................................................... 105
Table 92: Why employees leave .............................................................................................................. 106
Table 93: Impact – Voluntary Attrition .................................................................................................... 107
Table 94: Year-over-year change – Voluntary Attrition ........................................................................... 107
Table 95: Year-over-year change – Involuntary Attrition ........................................................................ 108
Table 96: Impact – Recommend company to friends and family ............................................................ 109
Table 97: Year-over-year change – Recommend company to friends/family ......................................... 109
Table 98: Year-over-year change – Time to recruit and hire for standard positions (days) .................... 110
Table 99: Year-over-year change – Time for a new hire to become productive (days)........................... 111
Table 100: Impact – Guaranteed annual training days / employee ........................................................ 112
Table 101: Impact – Well-understood career path for all employees ..................................................... 112
Table 102: Impact – Employee Billable Utilization ................................................................................... 113
Table 103: Year-over-year change – Employee Billable Utilization ......................................................... 114
Table 104: Five Year Comparison – Work Hours ...................................................................................... 115
Table 105: Hours Worked by Organization Type and Geographic Region ............................................... 116
Table 106: Hours Worked by Vertical Market ......................................................................................... 117
Table 107: Hours Worked by Vertical Market ......................................................................................... 117

© 2021 Service Performance Insight, LLC www.timelog.dk viii
Table 108: Service Execution Performance Pillar Mapped Against Service Maturity .............................. 119
Table 109: The Resource Management Maturity Model ......................................................................... 122
Table 110: Impact – Resource Management Strategy ............................................................................. 124
Table 111: Service Execution Pillar 5-year trend ..................................................................................... 125
Table 112: Service Execution KPIs by Organization Type and Geographic Region .................................. 125
Table 113: Service Execution KPIs by Organization Size .......................................................................... 126
Table 114: Service Execution KPIs by Vertical Market ............................................................................. 127
Table 115: Service Execution KPIs by Vertical Market ............................................................................. 128
Table 116: Impact – Project staffing time ................................................................................................ 129
Table 117: Impact – Revenue per project ................................................................................................ 129
Table 118: Impact – Project staff size ...................................................................................................... 130
Table 119: Impact – Project duration ...................................................................................................... 130
Table 120: Impact – Ontime project delivery .......................................................................................... 131
Table 121: Impact – Project overrun........................................................................................................ 132
Table 122: Impact – Standardized delivery methodology use ................................................................. 132
Table 123: Impact – Project margin for time and materials projects ...................................................... 134
Table 124: Impact – Project margin for fixed price projects .................................................................... 134
Table 125: Impact – Project margin — subs, offshore ............................................................................. 135
Table 126: Impact – Effectiveness of the resource management processes ........................................... 135
Table 127: Impact – Effectiveness of estimating processes and reviews ................................................ 136
Table 128: Impact – Effectiveness of change control processes ............................................................. 136
Table 129: Impact – Effectiveness of project quality processes .............................................................. 137
Table 130: Impact – Effectiveness of knowledge management processes ............................................. 138
Table 131: Finance & Operations Performance Pillar Maturity ............................................................... 139
Table 132: Finance & Operations Pillar 5-year trend ............................................................................... 140
Table 133: Finance & Operations KPIs by Organization Type and Geographic Region ........................... 141
Table 134: Finance & Operations KPIs by Organization Size ................................................................... 142
Table 135: Finance & Operations KPIs by Vertical Market ...................................................................... 143
Table 136: Finance & Operations KPIs by Vertical Market ...................................................................... 143

© 2021 Service Performance Insight, LLC www.timelog.dk ix
Table 137: Steps Taken to Improve Profitability Comparison: 2019-2020 ............................................. 144
Table 138: Impact – Revenue per Billable Consultant ............................................................................. 145
Table 139: Year-over-year change – Revenue / Billable Consultant ........................................................ 146
Table 140: Impact – Annual Revenue per Employee ............................................................................... 146
Table 141: Year-over-year change – Annual Revenue / Employee .......................................................... 147
Table 142: Impact – Quarterly Revenue in Backlog ................................................................................. 147
Table 143: Year-over-year change – Qtr. Revenue Target in Backlog ..................................................... 148
Table 144: Year-over-year change – % of annual revenue target achieved ............................................ 149
Table 145: Impact – Percentage of annual revenue target achieved ...................................................... 149
Table 146: Impact – Percentage of annual margin target achieved ........................................................ 150
Table 147: Year-over-year change – Percentage of annual target margin achieved ............................... 150
Table 148: Impact – Revenue Leakage ..................................................................................................... 151
Table 149: Year-over-year change – Revenue Leakage ........................................................................... 151
Table 150: Impact – Invoices Redone due to Errors or Client Rejections ................................................ 152
Table 151: Impact – Days Sales Outstanding (DSO) ................................................................................. 152
Table 152: Impact – Quarterly non-billable expense per employee ....................................................... 153
Table 153: Impact – Information Visibility ............................................................................................... 154
Table 154: Income Statement Comparison ............................................................................................. 155
Table 155: Income Statement by Organization Type and Embedded Service Type ................................ 156
Table 156: Income Statement by Organization Size ................................................................................ 157
Table 157: Income Statement by PS Market Vertical .............................................................................. 159
Table 158: Income Statement by PS Market Vertical .............................................................................. 160
Table 159: Minimum Normalized Performance Pillar Scores .................................................................. 163
Table 160: Average Service Maturity by PSO Size (People) ..................................................................... 164
Table 161: Average Service Maturity by PSO Type .................................................................................. 165
Table 162: Average Service Maturity by Vertical Market ........................................................................ 166
Table 163: Key Performance Indicators (KPIs) by Maturity Levels .......................................................... 166
Table 164: Lexicon of Acronyms and Abbreviations ................................................................................ 172
Table 165: Standard Key Performance Indicator (KPI) Definitions .......................................................... 173

© 2021 Service Performance Insight, LLC www.timelog.dk i
Business maturity is key to improve your profit margins
If you are like most people in your position, you always look for ways to increase revenue and improve the profitability of your business. But how are you stacking up against your industry’s key business metrics and where should you focus this year?
Digital transformation and virtual operations should be on every leader’s agenda
2020 has been a tough year in many ways. But also, a year where it has become crystal clear that digital transformation, mature processes and the ability to react fast is no longer nice to have, but need to have, if you are to operate your business successfully.
And what do we need in times of uncertainty and rapid change? We need reliable data and information we can trust. That is why TimeLog is proud to be part of the Professional Services Maturity Benchmark again this year.
With this benchmark, you get an overview of performance for the entire Professional Services Automation (PSA) business, you can see in detail how you measure up against your competitors and also where and how you can evolve and secure your business for many years to come.
Mature companies make it better through the changes
The benchmark clearly shows that the consultancies and services organisations that displayed the most optimised business processes mustered a result (EBITDA) of 22.8% in 2020, the companies on the back row only managed a result of -3.2%.
And again we see, that companies that evolve their business processes and work smarter can boast of significantly higher billable utilisation, higher revenue growth, more projects delivered on time and budget, more quotes won and less time spent on administration.
In fact, these companies display higher performance in every significant KPI.
Start your maturity journey now
The performance results are no surprise to us in the Professional Services Automation (PSA) business. We are witnessing this maturity journey time and again when our customers grow.
Not just in size or revenue. But also, in professionalism and maturity.
Seeing the transition when customers learn the actual value of their time and expertise; when they begin to tune their business accordingly, boosting project margins, saying yes to the right clients customers and no to the wrong ones… That is why we love what we do here at TimeLog.
It is my hope that providing you with this report can be a first step for your business towards climbing the maturity ladder and increasing your profit margins.
Per Henrik Nielsen
CEO, TimeLog A/S

© 2021 Service Performance Insight, LLC www.timelog.dk ii
TimeLog: Professional Services Automation software for optimising your contract to
cash workflow
TimeLog's cloud-based PSA software is built for consultancies and professional services businesses that
need an easy to use integrated standard solution for managing, optimising and automating the entire
contract to cash workflow.
TimeLog comprises time and expense tracking, project management, automated invoicing, resource
management and project accounting. The solution integrates with the most popular business solutions
including financial systems, ERPs, salary solutions, expense management tools and more.
Our solution provides you with invaluable insights into your business and lets you:
• Improve the accuracy of quotes based on reliable data
• Achieve global overview of key business metrics in real time
• Gain overview of resource workload
• Improve contribution margins
• Optimise profit
• Reduce time spent on administration
• Analyse business processes
• Invoice and track project finances in multiple currencies
• Manage multiple legal business entities in one solution
• Mix main contract, add-on deals and recurring service contracts in a single project
• Manage compensation structures
• Manage employee utilisation and margins
• Exploit strategic advantages and refine strategy based on analysis
• Financially control complex customer contracts
• … and much more.

© 2021 Service Performance Insight, LLC www.timelog.dk iii
How TimeLog will help you during your maturity journey
TimeLog’s solution is built to grow as your business evolves – all without expensive technical
implementation.
Our system offers multiple tiers, packaging and add-ons making TimeLog ideal for large enterprise
clients as well as small and medium sized businesses.
More than software
However, all the fancy tools in the world are worthless, if you do not exploit their potential. That is why
TimeLog is committed to help you every step of the way.
Here are a few of the tools we use to support you throughout your journey:
• Onboarding & implementation services tailored to your needs (no mandatory onboarding fee,
though)
• Unlimited free support for all users through chat, e-mail and phone
• User training through webinars, custom on-site training and seminars
• Facilitated networking and knowledge sharing groups among our clients
• Annual conferences (so far in Denmark and Sweden)
• Interactive guides
• Online help center, blog, e-books, white papers and e-mail newsletters with hands on tips &
inspiration
About TimeLog
TimeLog is a Nordic SaaS company with +850 customers and +22,000 active users in more than 18
countries around the world. The company was founded in 2001 by Founder & Executive Business
Developer, Søren Lund.
Today, we are +50 passionate TimeLoggers working out of offices in Copenhagen, Stockholm & Kuala
Lumpur.
Want to know if you can optimise your contract to cash workflow?
Want to know if you can optimise your contract to cash workflow?
2021 Professional Services Maturity™ Benchmark
© 2021 Service Performance Insight, LLC www.timelog.dk 1
1. Forward
Service Performance Insight, LLC (SPI Research) is proud to introduce the fourteenth-annual
Professional Services Maturity™ Benchmark. Since its inception we have researched, benchmarked,
and built a maturity model to:
∆ Help professional services (PS) executives better understand how their organization compares
to others that are both similar in size and scope of work, as well as to the broader professional
services market; and,
∆ Provide an objective, fact-based performance improvement framework that helps pinpoint
strengths and weaknesses and the advancements that will provide the greatest impact.
In 2007, SPI Research developed the PS Maturity Model™ as a strategic planning and management
framework. It is now the industry-leading performance improvement tool used by over 35,000 service
and project-oriented organizations to chart their course to service excellence.
The PS Maturity™ model helps executives compare and analyze their own performance so they can build
consensus around the actions to take, and where to start, while quantifying the benefits of change.
Analyzing the benchmark data by vertical market, geographic region and organization size gives PS
executives an accurate comparison to their peers and the market at large. Over 6,000 firms have
completed SPI’s benchmarking surveys over the past fourteen years.
A near record number of respondents (561) completed this year’s benchmark survey. With growth in
the number of participants, data accuracy improves and enables us to expand coverage into more sub-
verticals and geographies. This wealth of data means the depth, breadth and accuracy of the
benchmark continues to expand.
2020 – A Year Like No Other
2020 was a year like no other in history with the Corona Virus pandemic ravaging society and the
economy. Surprisingly, Professional Service organizations weathered the storm with relative ease. Yes,
annual revenue and headcount growth were down from 2019, but taken as a whole, the PS sector
reported relatively strong year over year revenue growth of 8.7% combined with 5.5% average
headcount growth. Comparatively few firms were forced to lay-off their valuable PS employees. In fact,
many firms used the chaos of 2020 to expand their workforces, with 18% (101 firms) reporting robust
headcount growth greater than 15%. At the other extreme, 21.9% (123 firms) resorted to lay-offs.
18.8% (106 firms) reported negative revenue growth while 28.1% (158 firms) reported healthy revenue
growth of more than 15%. Unfortunately the K-shaped recovery which is widening the gap between the
have and have nots in society is also at play in the Professional Services sector with the best-positioned
firms (focused on the hottest growth areas of the cloud and analytics) garnering near record levels of
growth and profit while the bottom 20% saw revenues and profits plummet.

2021 Professional Services Maturity™ Benchmark
© 2021 Service Performance Insight, LLC www.timelog.dk 2
As shown in Table 1,
several key metrics
improved in 2020;
overall attrition eased
to 11.6%, the lowest
attrition in five years,
while the percentage of
on-site service delivery
declined to 40.8%. This
means 59.2% of PS
revenue was delivered
remotely but the switch
to virtual service
delivery was far less
dramatic than we had
anticipated. In most
cases, PSOs were able to move to virtual operations almost overnight. The move to virtual operations
has generally been extremely positive with higher levels of productivity and much lower operating costs.
Firms have been able to reinvest their planned expenditures on employee meals, travel and meetings
into remote technology support and virtual training. In some cases, firms are providing employee
stipends for childcare and home offices.
Figure 1: Annual PS Revenue Growth vs. Headcount Growth
Source: SPI Research, February 2021
The downside of virtual operations has been experienced most acutely by employees with children at
home who need attention and home-schooling. Much has been written about the negative impact,
particularly on women with young children, who are bearing the brunt of home-schooling and childcare
while still holding down full-time, demanding jobs. Now, with the promise of a vaccine in 2021 we
Table 1: Five-year PS Key Performance Metrics
Key Performance Indicator (KPI) 2016 2017 2018 2019 2020
Annual PS revenue growth 9.0% 8.0% 9.7% 10.6% 8.7%
Annual PS headcount growth 6.5% 9.2% 7.7% 9.0% 5.5%
Percentage of billable personnel 74.6% 75.4% 72.8% 73.3% 73.7%
Onsite delivery 54.0% 57.6% 53.0% 47.5% 40.8%
Employee attrition 13.6% 12.2% 13.9% 13.2% 11.6%
Annual revenue per consultant (k) $205 $195 $206 $207 $203
Annual revenue per employee (k) $163 $159 $166 $170 $165
Profit (EBITDA %) 14.2% 16.8% 18.5% 15.2% 15.8%
Source: SPI Research, February 2021

2021 Professional Services Maturity™ Benchmark
© 2021 Service Performance Insight, LLC www.timelog.dk 3
anticipate the professional services sector will move to a hybrid business model – continuing to take
advantage of the many benefits of remote work while using offices and gatherings to facilitate
teamwork, training, mentoring and networking.
Revenue Growth by Geography
Despite months of global stay-at-home orders, the Professional Services sector none the less reported
year over year revenue growth. The American economy was buoyed by federal stimulus payments,
keeping individuals and hard-hit industry segments, like travel and leisure, from collapse. Even more
surprising, according to the Bureau of Labor and Statistics, US productivity in the third quarter of 2020
rose 4.6 percent, following a 10.6 percent increase in the second quarter, which is the largest six-month
improvement since 1965.
Figure 2: Annual Revenue Growth by Geographic Region
Source: SPI Research, February 2021
The technology sector was one of the least impacted with continued healthy revenues and profits. In
2020 we saw a great acceleration in the use of technology and digitization to support virtual work and
access from anywhere. According to an October 2020 study by McKinsey, companies have accelerated
digital transformation by 3 to 4 years. The move to automate and streamline will continue in 2021 as
businesses continue to transform to digital operations. A terrible year for the economy still produced
positive returns in many stock markets. The recession has hurt small businesses much more than large
ones. Figure 2 shows although revenue growth slowed in all regions, the slowdown was least impactful
in the Americas and the most dramatic in the Asia Pacific region.
In the Professional Service sector, revenue growth and profit are intertwined. In PS organizations, a
delicate balance between sales and service delivery must be continually optimized to ensure firms are
able to maximize resource billable utilization, driving revenue growth and profit.
Surprisingly, as shown in Figure 3, Americas headquartered firms reported year over year net profit
improvement as their income statements were buoyed by significantly lower travel and recruiting costs
2021 Professional Services Maturity™ Benchmark
© 2021 Service Performance Insight, LLC www.timelog.dk 4
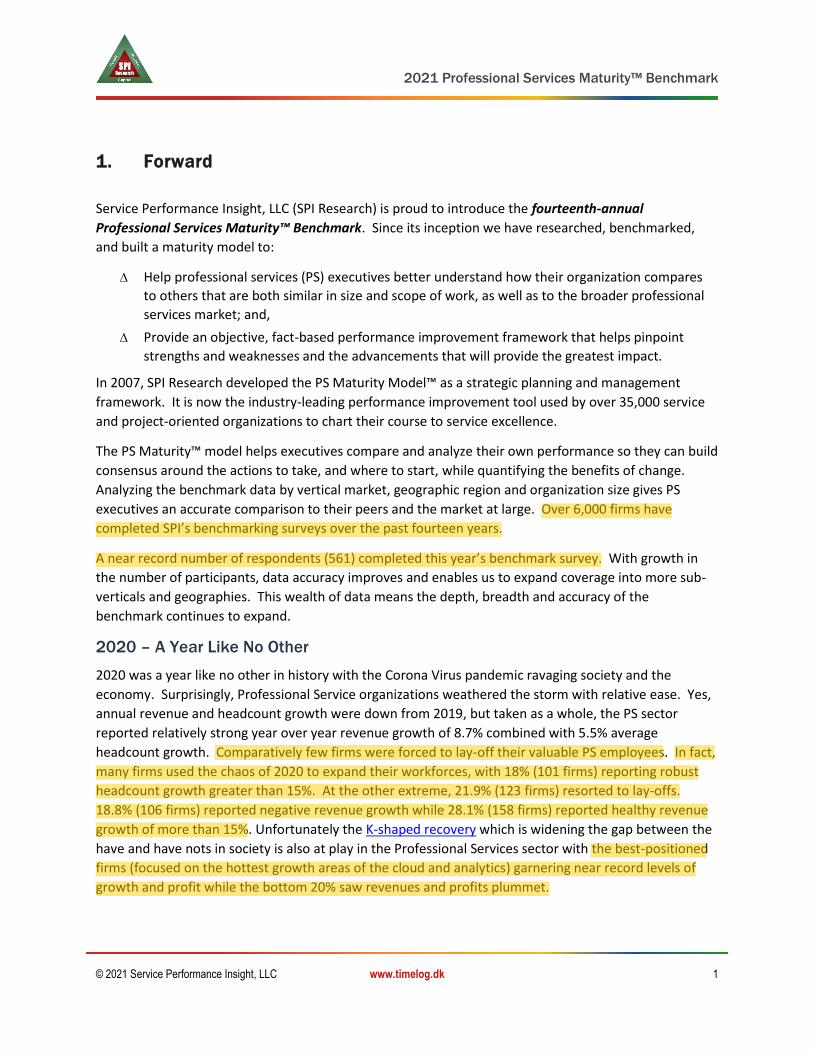
due to the pandemic. In fact, both Americas and Asia Pacific headquartered firms reported profit
improvements while European-headquartered firms experienced slight profit erosion.
Figure 3: Annual Profit by Geographic Region
Source: SPI Research, February 2021
A key measure of market expansion is the percent of overall revenue derived from new logo clients.
This metric indicates firms are expanding beyond their installed base by adding net new client projects.
As this benchmark is dominated by technology firms, market expansion is particularly prevalent for
cloud-based software and service organizations. According to Flexera’s report-state-of-the-cloud-
2020.pdf (flexera.com) a majority of organizations have accelerated their move to the cloud based on
the impact of Covid-19 in forcing businesses to move to virtual operations.
Figure 4: Annual New Logo Client Percent of Revenue by Geographic Region
Source: SPI Research, February 2021
2021 Professional Services Maturity™ Benchmark
© 2021 Service Performance Insight, LLC www.timelog.dk 5
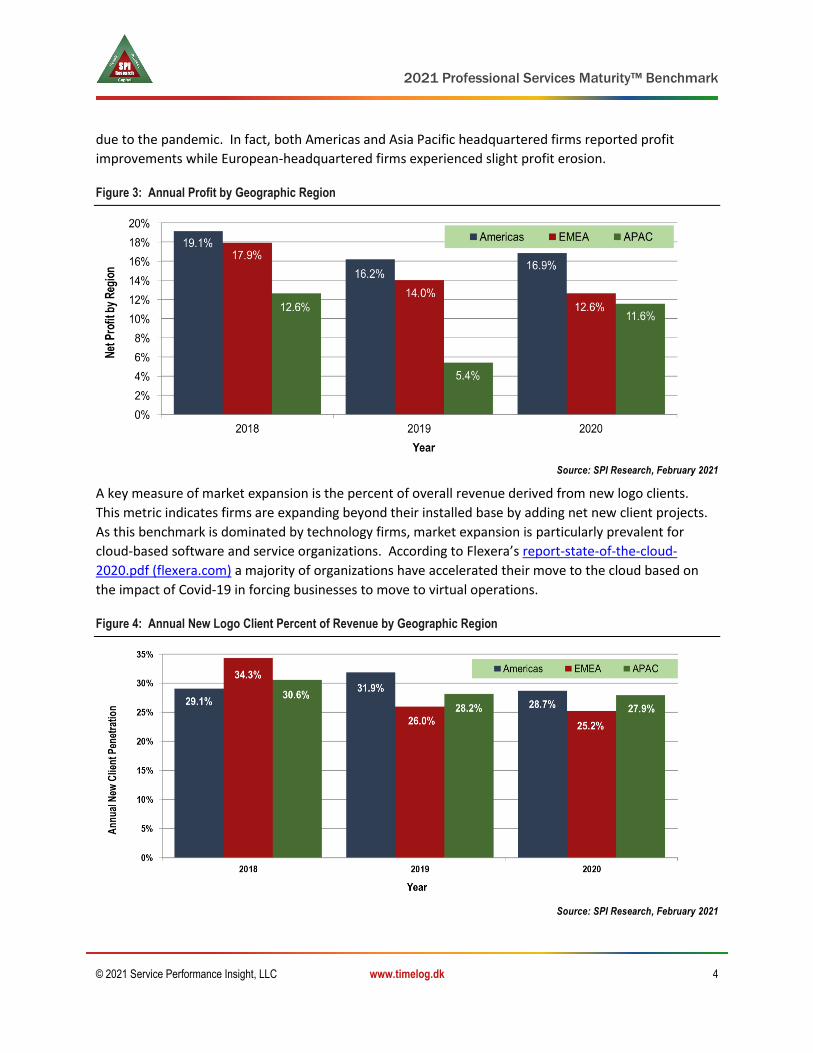
Another key contributor to net profit improvement has been a slow-down in attrition. Through the first
half of the year, the PS sector experienced the lowest attrition of a lifetime at 5.5% according to SPI’s
2020 PS Talent benchmark. Attrition accelerated in the 2nd half of the year and now stands at 11.6%.
Analysts are predicting high attrition in 2021 as employees become disenfranchised with their work and
gain confidence in an end to the pandemic. The pandemic has upended expectations of what work can
be done outside of an office. As companies move to hybrid operations in 2021, the notion that
employees must live and report daily to an office will be off the table. Particularly for the constrained
skilled talent supply which fuels the PS sector, the ability to hire the best available employee, regardless
of location, will accelerate. 2020 proved to clients and employers alike that both project quality and
resource productivity are enhanced by virtual service delivery.
By geography, attrition declined in the Americas and EMEA but increased in Asia Pacific. Long prized as
an outsourcing location, Indian IT firms have been the most challenged to staunch their skilled talent
exodus, particularly with travel and immigration restrictions limiting overseas talent mobility. High rates
of attrition are directly responsible for lackluster revenue growth in Asia Pacific.
Figure 5: Annual Attrition by Geographic Region
Source: SPI Research, February 2021
Revenue Growth by Industry Segment
The highest growth segments in 2020 were embedded PS within SaaS companies and Management
Consultancies. As shown in Figure 6, growth slowed in all segments in 2020 but the slowdown was most
acute for independent IT consultancies and embedded PS within SaaS companies as they experienced
project delays and cancellations. On the flip side, these companies will be the first to recover as long as
they are focused on driving productivity improvements and virtual operation for their clients.
Despite slower revenue growth, profit improved for embedded PS within enterprise software companies
as these firms focused on profit improvement initiatives with an emphasis on enhancing their integrated
business application backbone. By far, embedded PS organizations make the best use of integrated
2021 Professional Services Maturity™ Benchmark
© 2021 Service Performance Insight, LLC www.timelog.dk 6
business applications, enabling them to visualize all aspects of operations and make necessary course
corrections when sales stall.
Figure 6: Annual Revenue Growth by PS Industry Segment
Source: SPI Research, February 2021
Embedded PS organizations have been the first to move to productize and automate their solutions
portfolio, making it easier to sell and deliver services with prescribed business outcomes. All
organizations are putting a premium on subscription, pay-as-you-go recurring revenue.
Figure 7: Net Profit (EBITDA) by PS Industry Segment
Source: SPI Research, February 2021
For anyone who wants to know how money is made in a labor-based business, they need to look no
further than at workforce productivity. Despite legions of time-saving devices and technology, no one
has yet found a way to make an hour longer than 60 minutes, nor have they discovered how to make a

2021 Professional Services Maturity™ Benchmark
© 2021 Service Performance Insight, LLC www.timelog.dk 7
day last more than 24 hours. But what the PS industry is finally discovering is the secret is to work
smarter not harder. This means PSOs are reducing the time and annoyance of administrative tasks like
entering time and business expenses or writing and continually updating project status reports. No
more endless resource scheduling meetings. No more entering and reentering reams of data into an
endless series of disconnected spreadsheets. Instead of getting on an airplane at the crack of dawn on a
Monday morning, and returning tired and exhausted on a Friday night, consultants can now work
virtually from the comfort of home. Just look at the extraordinary acquisition of Slack by Salesforce for
$28 billion to understand the premium companies are placing on virtual workforce communication and
collaboration to accelerate digital transformation.
Figure 8: Annual Growth, Profit and Utilization
Source: SPI Research, February 2021
A Return to the “New Normal” in 2021
With the promise of a vaccine, the global economy is poised for a recovery in 2021. Some aspects of the
Professional Services sector will however remain forever changed due to the pandemic. The pace of
digital transformation will continue to accelerate, with the move to cloud computing becoming
mandatory for even the most technology adverse industries. This means an abundance of work for PS
organizations who stay at the forefront of technology. The importance of “mobile” with anywhere,
anytime access to systems and employees will be mandatory. We have already seen a tech exodus from
expensive urban centers like Silicon Valley fueled by the ability to work remotely from anywhere. This
trend will slow down with a return to work “hybrid” model.
SPI Research sees a new millennial workforce, nursed on technology and instant global communication,
take charge. Knowledge workers around the world are increasingly becoming more consultant-like with
heightened expectations for measurable work effort and output. Younger employees are far less loyal
and more likely to frequently change employers than the baby boomers they are replacing. Life-work
balance, diversity and giving back are important considerations which are making an impact of the

2021 Professional Services Maturity™ Benchmark
© 2021 Service Performance Insight, LLC www.timelog.dk 8
Professional Services sector however the industry remains solidly a young man’s game with 61% male
employees and 53.6% of the workforce under 40 years of age.
Businesses and business models are being upended by a move to usage-based consumption,
subscription billing and managed services with almost 20% of sector revenue coming from these
recurring revenue models. Millennial and line of business buyers demand ease, access and instant
gratification. Yet the age-old professional services business model based on applying specialized
knowledge and skills to solve complex problems persists and thrives. The world of professional services
is becoming more attractive, no longer focused on basic “infrastructure and plumbing” supplied by
armies of technical developers. Employees are now able to focus on more meaningful business process
improvements and truly impactful transformation and change management.
The professional services market continues to grow. No let-up in demand is seen and clients seem
content to engage specialized service providers in traditional ways – focused on project outcomes but
still based on traditional time and materials pricing although subscription-based and managed service
contracts are gaining momentum. PS organizations must rise to the challenge by packaging and
productizing their services, making them easier to sell and buy. Defined outcomes with clear ROI are
becoming the norm, transferring more accountability to service providers. The trick is being able to
move quickly to multi-element contracts and usage-based pricing without losing your shirt.
Technology ecosystems are emerging as preferred platforms as buyers seek to minimize complexity and
amplify application integration. Winners are coalescing around Amazon, Google, Microsoft or the
Salesforce platform so they can ride the waves these goliaths have created all while assuring new
customers of their ability to plug and play nicely with partner applications within the same ecosystem.
Service providers have coalesced by ecosystem too while working hard to establish meaningful
differentiation.
Today, discussions of “brand” and “culture” come up in most professional services conversations
because establishing the firm as a fantastic place to work is the most important element in attracting
and retaining a high caliber workforce. The key to success is having the best talent available to capture
and deliver new opportunities. Top performers understand they must create a compelling vision of the
future and quickly hire and support employees to bring that vision into reality. Now is not the time for
PSOs to rest on old skills, competencies and systems, more than ever before they need to be bold and
disciplined to seize new solutions and technologies before they become mainstream.
The pace and magnitude of technology change at times seem insurmountable but somehow millions of
consultants find a way to stay abreast of this mounting complexity to make sense of it all for their
clients. New technologies continue to transform the professional services market, and nowhere is this
more evident than in the security, mobile, artificial intelligence and collaboration (SMAC) space. These
solutions, many of which are embedded in core business suites such as Enterprise Resource Planning
(ERP) or Corporate Financial Management (CFM); Client Relationship Management (CRM); Professional
Services Automation (PSA); and Human Capital Management (HCM); are becoming increasingly critical
to the success and growth in professional services. Professional Services is an employee driven market
and providing the best tools that provide the best insight underlies all performance improvements.

2021 Professional Services Maturity™ Benchmark
© 2021 Service Performance Insight, LLC www.timelog.dk 9
2. The Professional Services Maturity™ Model
SPI Research has spent almost two decades benchmarking varying levels of operational control or
process “maturity” to determine the characteristics and appropriate behaviors for Professional Services
Organizations based on their organizational lifecycle stage. The fundamental questions SPI Research
was seeking to answer when the PS Maturity™ Benchmark was first conceived remain our primary focus:
What are the most important focus areas for professional services organizations (PSOs) as their
businesses mature?
What is the optimum level of maturity or control at each phase of an organization’s lifecycle?
Can diagnostic tools be built for assessing and determining the health of key business
processes?
Are there key business characteristics and behaviors that spell the difference between success
and failure?
The original concept behind SPI Research’s PS Maturity Model™ was to investigate whether
increasing levels of
standardization in operating
processes and management
controls improve customer
satisfaction and financial
performance. The 2021 PS
Maturity™ Benchmark
demonstrates that increasing
levels of business process
maturity do indeed result in
significant performance
improvements (Table 2).
In fact, SPI Research found that
high levels of performance
have far more to do with
leadership focus,
organizational alignment, effective business processes and disciplined execution than "time in
grade." Relatively young and fast-growing organizations can and do demonstrate surprisingly high
levels of maturity and performance excellence if their charters are clear.
Further improvements accrue when their goals and measurements are aligned with their mission, and
they make the investments they need in talent and systems to provide visibility and appropriate levels of
business control. Of course, it certainly helps if they are also well-positioned within a fast-growing
market.
Table 2: Maturity Matters!
Key Performance Measurement Maturity Level 1-2
Maturity Level 3
Maturity Level 4-5
Percentage of respondents 54.7% 25.0% 20.3%
Year-over-year change in PS revenue 7.8% 6.4% 14.2%
Deal pipeline / qtr. bookings forecast 153% 181% 211%
Employee billable utilization 58.0% 76.4% 83.8%
Projects delivered on-time 59.3% 85.2% 92.0%
Annual revenue / billable consultant (k) $88 $213 $275
Annual revenue / employee (k) $74 $166 $238
PS EBITDA -3.2% 16.1% 22.8%
Source: SPI Research, February 2021
2021 Professional Services Maturity™ Benchmark
© 2021 Service Performance Insight, LLC www.timelog.dk 10
The core tenet of the PS Maturity Model™ is service and project-oriented organizations achieve success
through the optimization of five Service Performance Pillars™:
1. Leadership – Vision, Strategy and Culture
2. Client Relationships
3. Talent (formerly Human Capital Alignment)
4. Service Execution
5. Finance and Operations
Within each of the Service Performance Pillars™, SPI Research developed guidelines and key
performance maturity measurements. These guidelines cut across the five service dimensions (pillars)
to illustrate examples of business process maturity. This study measures the correlation between
process maturity, key performance measurements and service performance excellence.
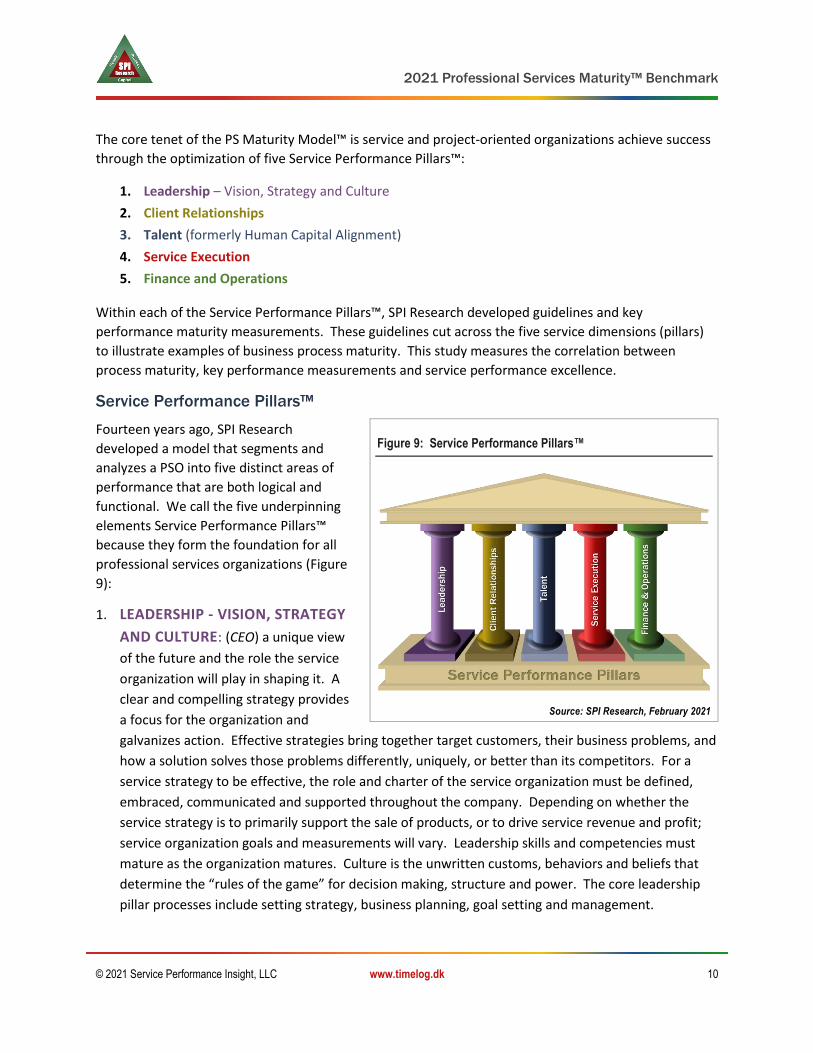
Service Performance Pillars™
Fourteen years ago, SPI Research
developed a model that segments and
analyzes a PSO into five distinct areas of
performance that are both logical and
functional. We call the five underpinning
elements Service Performance Pillars™
because they form the foundation for all
professional services organizations (Figure
9):
1. LEADERSHIP - VISION, STRATEGY
AND CULTURE: (CEO) a unique view
of the future and the role the service
organization will play in shaping it. A
clear and compelling strategy provides
a focus for the organization and
galvanizes action. Effective strategies bring together target customers, their business problems, and
how a solution solves those problems differently, uniquely, or better than its competitors. For a
service strategy to be effective, the role and charter of the service organization must be defined,
embraced, communicated and supported throughout the company. Depending on whether the
service strategy is to primarily support the sale of products, or to drive service revenue and profit;
service organization goals and measurements will vary. Leadership skills and competencies must
mature as the organization matures. Culture is the unwritten customs, behaviors and beliefs that
determine the “rules of the game” for decision making, structure and power. The core leadership
pillar processes include setting strategy, business planning, goal setting and management.
Figure 9: Service Performance Pillars™
Source: SPI Research, February 2021
2021 Professional Services Maturity™ Benchmark
© 2021 Service Performance Insight, LLC www.timelog.dk 11
2. CLIENT RELATIONSHIPS: (Marketing and Sales) the ability to communicate effectively with
employees, partners and customers to generate and close business and win deals. Effective client
management involves developing a clear and compelling go-to-market strategy which defines target
buyers, their requirements and how our solution solves those challenges in a differentiated way.
This pillar encompasses all aspects of marketing, lead generation, quoting and selling solutions as
well as contract management and partnering. The core business processes performed in the client
relationships pillar include marketing, selling and the entire quote to cash business process.
3. TALENT (FORMERLY HUMAN CAPITAL ALIGNMENT): (Human Resources) the ability to attract,
hire, retain and motivate a high-quality consulting staff. With changing workforce demographics,
talent management has increased in importance. High-caliber employees represent the essence,
brand and reputation of the firm. PSOs are starting to adopt hybrid on and off-shore staffing models
which put increased pressure on customer-facing staff to develop client relationships and more
carefully define client requirements. Demands for career planning, skill development and flexible
work options have intensified. The core talent management processes include recruiting, hiring, on-
boarding, training, compensation, performance and career management.
4. SERVICE EXECUTION: (Engagement/Delivery) the methodologies, processes and tools to
effectively schedule, deploy and measure the quality of the service delivery process. Service
execution involves several factors: from resource management, to delivering projects in a
predictable and acceptable time frame, to reducing cost while improving project quality and
harvesting knowledge. Processes include resource management, capacity planning, project planning
and quality control, knowledge management and methodology and tool development.
5. FINANCE AND OPERATIONS: (CFO) the ability to manage services profit and loss — to generate
revenue and profit while developing repeatable operating processes. The finance and operations
pillar focus on revenue, margin and cost and the financial, contractual and IT operating processes
and controls required to run a profitable and predictable business.
Professional Services Maturity™ Model Benchmark Levels
The model is built on the same foundation as the Capability Maturity Model (CMM), which has been
adopted for software development; but is specifically targeted toward billable PSOs, that either
exclusively sell and deliver professional services or complement the sale of products with services.
Figure 10 depicts maturity level progression and outlines primary characteristics for each maturity level:
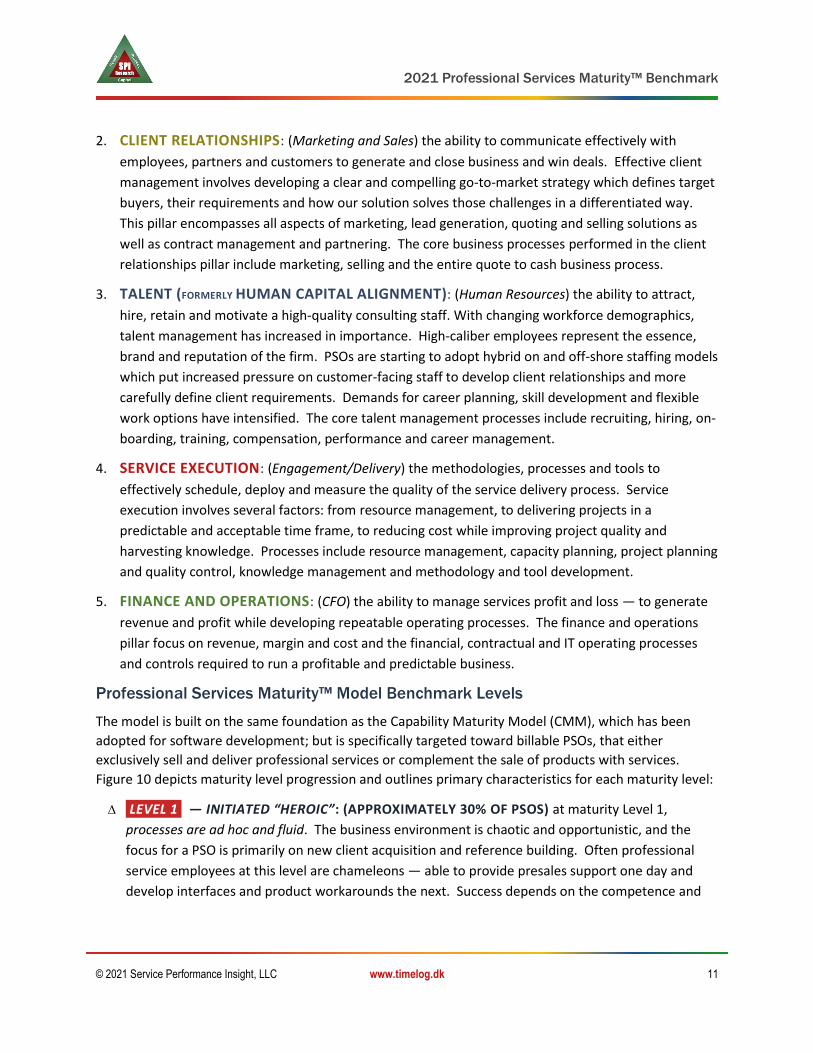
∆ LEVEL 1 — INITIATED “HEROIC”: (APPROXIMATELY 30% OF PSOS) at maturity Level 1,
processes are ad hoc and fluid. The business environment is chaotic and opportunistic, and the
focus for a PSO is primarily on new client acquisition and reference building. Often professional
service employees at this level are chameleons — able to provide presales support one day and
develop interfaces and product workarounds the next. Success depends on the competence and

2021 Professional Services Maturity™ Benchmark
© 2021 Service Performance Insight, LLC www.timelog.dk 12
heroics of people in the
organization, and not on
the use of proven
processes, methods or
tools. Practices and
procedures are informal,
and quality is based on
individual experience and
aptitude. Level 1
organizations are often
characterized as “informal”
and “heroic”.
∆ LEVEL 2 — PILOTED “FUNCTIONAL EXCELLENCE”: (APPROXIMATELY 25% OF PSOS) at
maturity level 2, processes have started to become repeatable. Best practices may be
demonstrated in discrete functional areas or geographies, but they are not yet documented and
codified for the entire organization. Basic processes have been established for the five Professional
Services Performance Pillars, but they are not yet universally embraced. Operational excellence
and best practices may be discerned within functions but not across functions. By Level 2
individual Functional Excellence should have emerged in key areas.
∆ LEVEL 3 — DEPLOYED “PROJECT EXCELLENCE”: (APPROXIMATELY 25% OF PSOS) at maturity
level 3, the PSO has created a set of standard processes and operating principles for all major
service performance pillars but renegades and “hold-outs” may still exist. Management has
established and started to enforce financial and quality objectives on a global basis. Processes have
been established to focus on effective execution and there is spotlight on alignment between and
across functions. By level 3 project delivery methodologies and quality measurements are in place
and enforced across the organization. Level 3 organizations should exhibit “Project Excellence”
with a consistent, repeatable project delivery methodology.
∆ LEVEL 4 — INSTITUTIONALIZED “PORTFOLIO EXCELLENCE”: (APPROXIMATELY 15% OF PSOS)
at maturity level 4, management uses precise measurements, metrics and controls, to effectively
manage the PSO. Each service performance pillar contains a detailed set of operating principles,
tools and measurements. Organizations at this level set quantitative and qualitative goals for
customer acquisition, retention and penetration, in addition to a complete set of financial and
quality operating controls and measurements. Processes are aligned to achieve leverage. The
portfolio is balanced with a focus on project selection and execution. Level 4 organizations should
exhibit “Portfolio Excellence”.
Figure 10: Services Maturity™ Model Levels
Source: SPI Research, February 2021
2021 Professional Services Maturity™ Benchmark
© 2021 Service Performance Insight, LLC www.timelog.dk 13
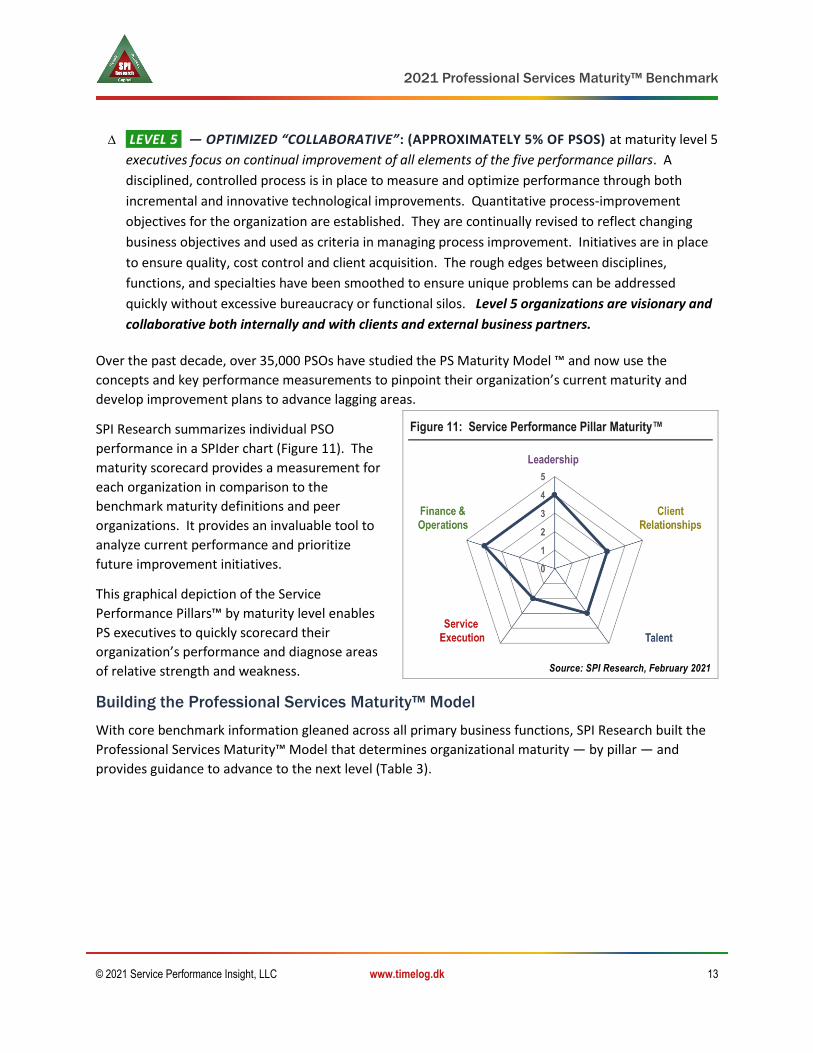
∆ LEVEL 5 — OPTIMIZED “COLLABORATIVE”: (APPROXIMATELY 5% OF PSOS) at maturity level 5
executives focus on continual improvement of all elements of the five performance pillars. A
disciplined, controlled process is in place to measure and optimize performance through both
incremental and innovative technological improvements. Quantitative process-improvement
objectives for the organization are established. They are continually revised to reflect changing
business objectives and used as criteria in managing process improvement. Initiatives are in place
to ensure quality, cost control and client acquisition. The rough edges between disciplines,
functions, and specialties have been smoothed to ensure unique problems can be addressed
quickly without excessive bureaucracy or functional silos. Level 5 organizations are visionary and
collaborative both internally and with clients and external business partners.
Over the past decade, over 35,000 PSOs have studied the PS Maturity Model ™ and now use the
concepts and key performance measurements to pinpoint their organization’s current maturity and
develop improvement plans to advance lagging areas.
SPI Research summarizes individual PSO
performance in a SPIder chart (Figure 11). The
maturity scorecard provides a measurement for
each organization in comparison to the
benchmark maturity definitions and peer
organizations. It provides an invaluable tool to
analyze current performance and prioritize
future improvement initiatives.
This graphical depiction of the Service
Performance Pillars™ by maturity level enables
PS executives to quickly scorecard their
organization’s performance and diagnose areas
of relative strength and weakness.
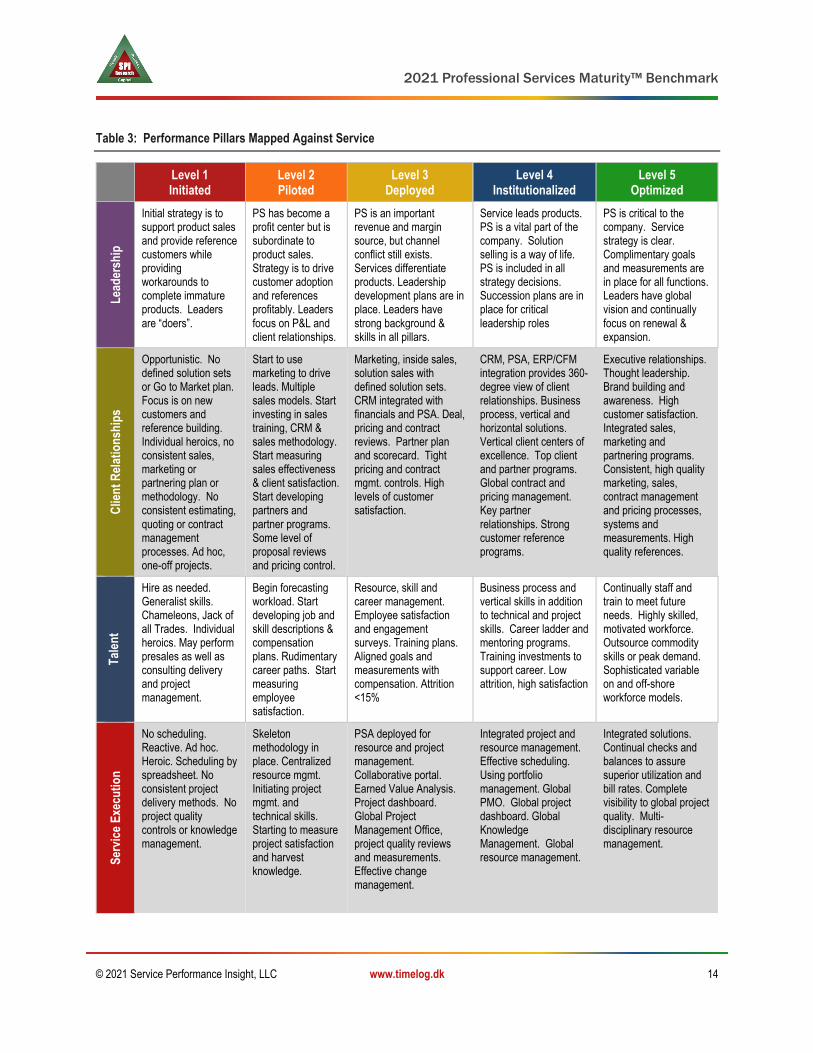
Building the Professional Services Maturity™ Model
With core benchmark information gleaned across all primary business functions, SPI Research built the
Professional Services Maturity™ Model that determines organizational maturity — by pillar — and
provides guidance to advance to the next level (Table 3).
Figure 11: Service Performance Pillar Maturity™
Source: SPI Research, February 2021
2021 Professional Services Maturity™ Benchmark
© 2021 Service Performance Insight, LLC www.timelog.dk 14
Table 3: Performance Pillars Mapped Against Service
Level 1 Initiated
Level 2 Piloted
Level 3 Deployed
Level 4 Institutionalized
Level 5 Optimized
Lea
der
ship
Initial strategy is to support product sales and provide reference customers while providing workarounds to complete immature products. Leaders are “doers”.
PS has become a profit center but is subordinate to product sales. Strategy is to drive customer adoption and references profitably. Leaders focus on P&L and client relationships.
PS is an important revenue and margin source, but channel conflict still exists. Services differentiate products. Leadership development plans are in place. Leaders have strong background & skills in all pillars.
Service leads products. PS is a vital part of the company. Solution selling is a way of life. PS is included in all strategy decisions. Succession plans are in place for critical leadership roles
PS is critical to the company. Service strategy is clear. Complimentary goals and measurements are in place for all functions. Leaders have global vision and continually focus on renewal & expansion.
Clie
nt
Rel
atio
nsh
ips
Opportunistic. No defined solution sets or Go to Market plan. Focus is on new customers and reference building. Individual heroics, no consistent sales, marketing or partnering plan or methodology. No consistent estimating, quoting or contract management processes. Ad hoc, one-off projects.
Start to use marketing to drive leads. Multiple sales models. Start investing in sales training, CRM & sales methodology. Start measuring sales effectiveness & client satisfaction. Start developing partners and partner programs. Some level of proposal reviews and pricing control.
Marketing, inside sales, solution sales with defined solution sets. CRM integrated with financials and PSA. Deal, pricing and contract reviews. Partner plan and scorecard. Tight pricing and contract mgmt. controls. High levels of customer satisfaction.
CRM, PSA, ERP/CFM integration provides 360-degree view of client relationships. Business process, vertical and horizontal solutions. Vertical client centers of excellence. Top client and partner programs. Global contract and pricing management. Key partner relationships. Strong customer reference programs.
Executive relationships. Thought leadership. Brand building and awareness. High customer satisfaction. Integrated sales, marketing and partnering programs. Consistent, high quality marketing, sales, contract management and pricing processes, systems and measurements. High quality references.
Tal
ent
Hire as needed. Generalist skills. Chameleons, Jack of all Trades. Individual heroics. May perform presales as well as consulting delivery and project management.
Begin forecasting workload. Start developing job and skill descriptions & compensation plans. Rudimentary career paths. Start measuring employee satisfaction.
Resource, skill and career management. Employee satisfaction and engagement surveys. Training plans. Aligned goals and measurements with compensation. Attrition <15%
Business process and vertical skills in addition to technical and project skills. Career ladder and mentoring programs. Training investments to support career. Low attrition, high satisfaction
Continually staff and train to meet future needs. Highly skilled, motivated workforce. Outsource commodity skills or peak demand. Sophisticated variable on and off-shore workforce models.
Ser
vice
Exe
cuti
on
No scheduling. Reactive. Ad hoc. Heroic. Scheduling by spreadsheet. No consistent project delivery methods. No project quality controls or knowledge management.
Skeleton methodology in place. Centralized resource mgmt. Initiating project mgmt. and technical skills. Starting to measure project satisfaction and harvest knowledge.
PSA deployed for resource and project management. Collaborative portal. Earned Value Analysis. Project dashboard. Global Project Management Office, project quality reviews and measurements. Effective change management.
Integrated project and resource management. Effective scheduling. Using portfolio management. Global PMO. Global project dashboard. Global Knowledge Management. Global resource management.
Integrated solutions. Continual checks and balances to assure superior utilization and bill rates. Complete visibility to global project quality. Multi-disciplinary resource management.

2021 Professional Services Maturity™ Benchmark
© 2021 Service Performance Insight, LLC www.timelog.dk 15
Level 1 Initiated
Level 2 Piloted
Level 3 Deployed
Level 4 Institutionalized
Level 5 Optimized
Fin
ance
an
d O
per
atio
ns
The PSO has been created but is not yet profitable. Rudimentary time & expense capture. Limited financial visibility and control. Unpredictable financial performance. Rudimentary contract and risk management.
5 to 15% margin. PS becoming a profit center but still immature finance and operating processes. Investment in CFM and PSA to provide financial visibility. May not have real-time visibility or BI. Standard Library of Contracts and Statements of Work.
15 to 25% margin. PS operates as a tightly managed P&L. Standard methods for planning, resource mgmt., time & expense mgmt., cost control & billing. In depth knowledge of all costs at the employee, sub-contractor & project level. Processes in place for contract management, legal and pricing decisions.
PS generates > 20% of overall company revenue & contributes > 30% margin.
Well-developed finance and operations processes and controls. Systems have been implemented for CRM, PSA, CFM and BI. IT integration and real-time visibility. Systems have been implemented for contract management, legal and pricing decisions.
> 30% margin. Continuous improvement and enhancement.
High profit. Integrated systems.
Global with disciplined process controls and optimization. Completely integrated financial, CRM, resource management, contracts and pricing systems, processes and controls.
Source: SPI Research, February 2021
Why Maturity Matters
SPI Research believes wide support for the PS Maturity™ model is due to its holistic approach to
measuring performance. Maturity is determined through alignment and focus both within and across
functions. For example, although financial measurements are of primary importance, they are equally
weighted and correlated with leadership and sales and quality measurements to ensure organizations
improve across all dimensions, not just in terms of financial performance. However, if the organization
Figure 12: Professional Services Maturity™ Progression
Source: SPI Research, February 2021

2021 Professional Services Maturity™ Benchmark
© 2021 Service Performance Insight, LLC www.timelog.dk 16
is profit-motivated (which most are), increasing maturity levels do show up in significant bottom-line
profit. Figure 12 highlights major key performance measurements by maturity level and should alone be
an important reason why PS executives should look deeper into using it to increase profits.
Pillar Importance and Organizational Maturity
The results and insights gained in the past fourteen years have confirmed SPI Research’s original
hypothesis that service organizations must develop a balanced and holistic approach to improving all
aspects of their business as they mature. SPI Research has discovered that the emphasis on individual
service pillar performance shifts as organizations mature. Excellence in only one specific service
performance pillar does not create overall organizational success – rather it is the appropriate balance
and alignment within and across performance pillars, which leads to sustainable success.
Table 4 depicts the relative service performance pillar importance by organizational maturity level.
Many professional services organizations are established without an initial focus toward optimizing
performance. PSOs begin with the goal of establishing a client and reference base. They may be
operated as a cost center or as an adjunct to the product function to establish alpha and beta customers
and to provide early
product feedback. Initially
they often perform
presales, training, quality
assurance and service
delivery tasks. They hope
to deliver services that are
both profitable to them as
well as valued by their
clients, but in reality, they
take the position that “just
about any deal is a good
deal.”
Table 4: Service Pillar Importance by Organizational Maturity Level
Pillar Initiated Piloted Deploy. Inst. Opt.
Leadership ◔ ◑ ◑ ● ● Client Relationships ● ◕ ◕ ◕ ● Human Capital Align. ◔ ◑ ◕ ● ● Service Execution ◔ ◑ ◕ ● ● Finance and Operations ◔ ◔ ◕ ● ●
Source: SPI Research, February 2021

2021 Professional Services Maturity™ Benchmark
© 2021 Service Performance Insight, LLC www.timelog.dk 17
The emphasis at Level 1 maturity is on building client references and recruiting highly skilled generalist
consultants who are experienced enough and flexible enough to perform heroic feats to ensure early
customer success.
By Level 2, although primary focus is still to create reference customers, more emphasis is placed on
human capital alignment for recruiting and ramping skilled employees, partners and contractors.
Service execution focus is on developing repeatable project delivery methods and quality processes. At
these early stages, many embedded professional services organizations have a strong product-driven
focus, and the role of the service organization is subordinate to products. Conflicts between service
profit, client success and driving product revenue are often characteristic of Level 2 embedded service
organizations.
By Level 3 the organization must move toward a more
balanced focus on all elements of the business by
investing in systems, operating processes, and
repeatable methods to sustain growth and ensure
quality. Level 3 maturity should be the aspirational
target of all PS organizations because it is at level 3
that an on-going, profitable and sustainable business
has emerged. At level 3 the charter of the PS
organization is clear. If the organization is an
embedded PS organization within a product company,
PS has a seat at the executive table and is seen as
adding value that transcends product implementation,
integration and customization. Increasingly,
embedded PS has become a critical component of
ensuring customer adoption and may play a leading
role in driving product management direction and
strategy. Independent Level 3 PSOs are financially and
operationally strong with a clear focus on targets
markets and sustainable, repeatable business processes and quality controls. They have built a
compelling, differentiated portfolio which is brought to life by specialized, knowledgeable consultants.
At level 3, heroics and firefighting are no longer the standard way of doing business as disciplined
management systems, controls and integrated systems ensure predictability and repeatability.
At Level 4 the organization has implemented structured business processes and utilizes integrated
information systems to assure there is “one view of the business”. Level 4 organizations are seen as
true industry leaders in their target markets. They have developed a unique and differentiated culture
which attracts industry-leading consultants and clients. More than average firms, Level 4 organizations
are extremely transparent. They typically have strong management controls and visibility into all facets
of the business by providing dynamic, real-time access to empowered team members. Level 4
Figure 13: PS Performance Pillars – Core KPIs
Source: SPI Research, February 2021

2021 Professional Services Maturity™ Benchmark
© 2021 Service Performance Insight, LLC www.timelog.dk 18
organizations continually expand their horizons and boundaries – whether it is through geographic,
vertical market or technology platform expansion.
Finally, at Level 5 the organization is running very efficiently, and the focus is on continual improvement
and innovation. Level 5 firms are the Best-of-the-Best. They are excellent in all functional areas but
have transcended functional excellence with a collaborative, knowledge and intellectual property centric
focus. Very few firms achieve sustained Level 5 performance.
2021 Professional Services Maturity™ Benchmark
© 2021 Service Performance Insight, LLC www.timelog.dk 19
3. Survey Demographics
Professional Services is one of the fastest growing segments of the global economy due in large part to
the fact that companies in all other vertical industries are increasingly outsourcing and out-tasking their
non-core business functions, processes and technology to specialized service providers.
Today, the global professional services industry is made up of over 25 million firms with combined
annual revenues of more than $8 trillion. It is also highly fragmented as the top 500 largest firms (each
with more than 5,000 employees) account for less than 5 percent of that revenue. This finding has
positive implications for the growth potential of professional services firms: there is room in the market
for innovative and effective newcomers that can effectively harness skilled talent to provide specialized
insights, knowledge and client outcomes.
Firms in the professional service industry provide accounting, advertising and marketing, architectural,
management consulting, engineering, IT, legal, and research services. These companies provide the
knowledge and skills of their employees, typically on a project basis, where an individual or team is
responsible for the delivery of high value services to the client.
Each year SPI Research has expanded vertical market coverage to include additional specialized service
segments to depict the nuances and metrics which pertain to these sub-verticals. SPI’s coverage this
year includes: Value-Added Resellers (VARs); Managed Service providers and “other” which includes
healthcare; and research and development organizations. This year the benchmark also provides more
in-depth analysis of the accounting, architecture, engineering and marketing and advertising segments.
The legal industry is the only major professional services market which is not covered in this report as
the requirements, processes and systems used by the legal industry tend to be very specialized.
Unlike other industries, Professional Services is almost 100% a knowledge and people-based industry.
The developed regions of North America, Europe and Asia-Pacific are rich in this resource. Growth in
this segment depends on concentrated efforts to attract and deploy skilled talent in the most proven
efficient and profitable ways to sharpen the business performance of professional services firms.
For this benchmark, SPI Research surveyed 561 billable Professional Services Organizations (PSOs) from
October through December 2020. The following sections outline the key markets which comprise the
global professional services industry and breakdown the 2020 survey demographics in several key areas
(market, organization size, and geographic region) to help PS firms compare their individual results to
the benchmark.

2021 Professional Services Maturity™ Benchmark
© 2021 Service Performance Insight, LLC www.timelog.dk 20
The North American Professional Services Market
SPI Research uses the North American Industry Classification System (NAICS) to analyze the U.S. services
market. The primary Professional Services designation is NAICS 54xx which defines PS sub-verticals as
“Those in this subsector engage in business processes where human capital is the major input. These
establishments provide the knowledge and skills of their employees, often on an assignment basis,
where an individual or team is responsible for the delivery of high value services to the client. The
individual industries of this subsector are defined based on the particular expertise, training and
credentials of the services provider (Table 5)”.
Per the most recent US Census, combined professional, scientific, and technical services (NAICS 54xx)
revenues reached $2.9 trillion. In addition, substantial professional service revenue is generated by
software (NAICS 5112); Data Services (NAICS 518) and Employment Services (NAICS 5613). Including
these segments, the US professional service industry generated approximately $4.1 trillion in revenue in
2018 and employed 22.2 million US-based workers.
Table 5: Vertical PS Markets — the North American Industry Classification System
Code Market Description
5112 Software Software publishing, both public and private software companies. Total revenue is reported. PS typically represents ~ 20% of revenues.
518 Data Services Data processing, hosting and related services
5411 Legal This industry is comprised of legal practitioners known as lawyers or attorneys (i.e., counselors-at-law) primarily engaged in the practice of law. Firms in this industry may provide a range of expertise or specialize in specific areas of law, such as criminal law, corporate law, family and estate planning, patent law, real estate law, or tax law.
5412 Accounting/ Tax Prep/ Bookkeeping / Payroll
This industry comprises establishments primarily engaged in providing services, such as auditing and accounting, designing accounting systems, preparing financial statements, developing budgets, preparing tax returns, processing payrolls, bookkeeping, and billing. Accountants are certified to ensure they have and maintain competency in their field.
5413 Architectural, Engineering and Related Services
This industry comprises establishments primarily engaged in planning and designing residential, institutional, leisure, commercial, and industrial buildings and structures by applying knowledge of design, construction procedures, zoning regulations, building codes, and building materials.
5414 Specialized Design Services
This industry group comprises establishments providing specialized design services (except architectural, engineering, and computer systems design).
5415 Computer Systems Design Services Related Services
(IT Consulting) – This industry comprises establishments primarily engaged in providing expertise in the field of information technologies through one or more of the following activities: (1) writing, modifying, testing, and supporting software to meet the needs of a particular customer; (2) planning and designing computer systems that integrate computer hardware, software, and communication technologies; (3) on-site management and operation of clients' computer systems and/or data processing facilities; and (4) other professional and technical computer-related advice and services.
5416 Management Science and Technical Consulting Services
(Management Consulting) – This industry comprises establishments primarily engaged in providing advice and assistance to businesses and other organizations on management issues, such as strategy and organizational planning; financial planning and budgeting; marketing objectives and policies; human resource policies, practices, and planning; production scheduling; and control planning.
5417 Scientific Research and Develop. Services
This industry group comprises establishments engaged in conducting original investigation on a systematic basis to gain new knowledge (research) and/or the application of research findings or other scientific knowledge for the creation of new or significantly improved products or processes

2021 Professional Services Maturity™ Benchmark
© 2021 Service Performance Insight, LLC www.timelog.dk 21
Code Market Description
(experimental development). The industries within this industry group are defined on the basis of the domain of research; that is, on the scientific expertise of the establishment.
5418 Advertising and Related Services
(Marketing and Communications) – This industry comprises establishments primarily engaged in creating advertising or public relations campaigns and placing advertising in periodicals, newspapers, radio and television, or other media. These firms are organized to provide a full range of services (i.e., through in-house capabilities or subcontracting), including advice, creative services, account management, production of advertising material, media planning, and buying (i.e., placing advertising).
5419 Other Professional, Scientific, Technical Services
(Other PS) – This industry group comprises establishments engaged in professional, scientific, and technical services not listed above.
5613 Employment Services
Staffing, temporary employment, placement and employment search services.
Source: US Census and SPI Research, February 2021
Tables 6 and 7 provide a rollup of 2017 US Census data for these NAICS codes. There are 178,072 firms
in these market segments; only 76,445 (42.9%) employ more than 20 people the remaining 57% employ
less than 20 people. In other words, the industry is dominated by very small firms particularly in
accounting; legal; management consulting and staffing.
Table 6: 2018 NAICS Services Rollup (Number of Firms)
NAICS Market Firms Firms with over 20 employees
Employees in firms with over
20 emp.
% of total emp. in firms with over 20
emp.
5412 Accounting 16,880 3,253 451,605 48.5%
5418 Advertising/Marketing/PR 8,040 5,196 1,050,920 81.1%
5413 Architecture/Engineering 33,342 13,727 2,259,335 70.6%
5415 IT Consulting 14,696 14,044 2,813,675 82.4%
5411 Legal 27,626 9,326 1,050,035 52.3%
5191 Managed Services/Hosting 3,438 1,899 783,405 90.5%
5416 Management Consulting 32,054 14,466 2,515,955 61.4%
4234 PS within HW & Networking 4,108 2,379 838,355 91.4%
5112 PS within Software company 3,048 2,204 992,600 93.1%
5417 Research & Development 7,480 2,693 752,785 85.4%
5613 Staffing 22,720 5,674 2,609,315 91.9%
Other PS 4,640 1,584 219,495 31.1%
Total / Average 178,072 76,445 16,337,480
Source: US Census and SPI Research, February 2021

2021 Professional Services Maturity™ Benchmark
© 2021 Service Performance Insight, LLC www.timelog.dk 22
Table 7: 2018 NAICS Services Rollup (Employees and Revenue)
NAICS Market Employees Revenue (mm) Rev/Emp Rev/Consult
5412 Accounting 931,964 $150,974 $161,995 $267,515
5418 Advertising/Marketing/PR 1,296,126 $224,111 $172,908 $250,592
5413 Architecture/Engineering 3,198,556 $609,802 $190,649 $263,351
5415 IT Consulting 3,415,991 $763,861 $223,613 $300,211
5411 Legal 2,006,503 $266,641 $132,888 $147,654
5191 Managed Services/Hosting 865,414 $194,080 $224,263 $371,560
5416 Management Consulting 4,095,715 $683,053 $166,773 $224,379
4234 PS within HW & Networking 916,913 $407,691 $444,634 $702,765
5112 PS within Software company 1,066,639 $298,919 $280,244 $384,198
5417 Research & Development 881,203 $177,775 $201,741 $330,497
5613 Staffing 2,839,441 $309,472 $108,990 $163,485
Other PS 706,861 $97,194 $137,500 $219,846
Total / Average 22,221,326 $4,183,571 $188,268
Source: US Census and SPI Research, February 2021
PS Maturity™ Benchmark Vertical Market Demographics
The 2021 PS Maturity™ benchmark remains the most comprehensive global study of the professional
services industry as it is based on 561 participating organizations representing over 300,000 consultants
(Figure 14). The percentage of completed surveys representing the top 14 vertical market segments is as
follows:
▲ IT Consulting. Systems Integrators and developers – 25.4%, representing 143 firms and ~ 90,000
consultants.
▲ Management Consulting. Management consultancies – 15.0%, representing 84 firms and ~
23,000 consultants.
▲ SaaS PS. Service divisions within software-as-a-service providers – 11.4%, representing 64 firms
and ~ 22,000 consultants.
▲ Software PS. Service divisions within software companies – 9.8%, representing 55 firms and ~
27,000 consultants.
▲ Architects and Engineers. Architects and engineers – 6.3%, representing 35 firms and ~ 14,000
consultants.
▲ Marketing, Advertising and PR. Advertising, marketing, communication firms – 5.5%,
representing 31 firms and ~ 4,000 consultants.

2021 Professional Services Maturity™ Benchmark
© 2021 Service Performance Insight, LLC www.timelog.dk 23
▲ Value-Added Resellers. resell hardware, software and provide technology services, training and
support – 3.0%, representing 17 firms and ~ 9,000 consultants.
▲ Accountancies: Accounting firms – 2.5%, representing 14 firms and ~ 13,000 consultants.
▲ Managed Services. Provide hosting and managed and outsourced services – 2.3%, representing
13 firms and ~ 22,000 consultants.
▲ Staffing: Staffing organizations – 1.8%, representing 10 firms and ~ 12,000 consultants.
▲ Research & Development. R&D organizations – 1.3%, representing 7 firms and ~ 7,000 Staffing.
Staffing organizations – 1.8%, representing 10 firms and ~ 12,000 consultants.
▲ Healthcare/Medical/Pharma/Biotech. 1.3%, representing 8 firms and ~ 2,000 consultants.
▲ Hardware (and Networking) PS. Service divisions within hardware and networking
manufacturers – 1.1%, representing 6 firms and ~ 11,000 consultants.
▲ Government Contracting. Firms providing professional services to Government agencies –
1.1%, representing 6 firms and ~ 9,000 consultants.
▲ Other PS. Other markets including, legal, manufacturing, construction, public sector, etc. –
12.2%, representing 68 firms and ~ 41,000 consultants.
Figure 14: Benchmark Participant Vertical Market Distribution
Source: SPI Research, February 2021

2021 Professional Services Maturity™ Benchmark
© 2021 Service Performance Insight, LLC www.timelog.dk 24
Table 8 shows participant demographics for the past fourteen years. Historically, IT consultancies have
been the largest participating market, closely followed by PS within software firms. The popularity of
this benchmark continues to grow, averaging more than 500 participating firms for each of the past five
years, making this the most comprehensive global Professional Services benchmark.
Table 8: Number of Participating Firms by Vertical Market (2007 through 2020)
Market Type 2007 2008 2009 2010 2011 2012 2013 2014 2015 2016 2017 2018 2019 2020 Total
IT Consulting PSO 13 24 50 67 61 69 115 86 190 133 103 155 143 143 1,352
PS within Soft. ESO 34 66 89 57 56 45 45 47 89 57 45 78 73 55 836
Mgmt. Consult. PSO 2 12 22 22 31 34 24 27 68 46 45 75 68 84 560
Other PS PSO 2 13 30 22 13 31 21 24 13 46 49 62 62 82 470
Arch./Engr. PSO 0 0 4 6 7 8 6 10 50 35 153 100 44 35 458
PS within SaaS ESO 0 0 18 19 26 23 16 13 43 41 29 70 55 64 417
Advertising PSO 0 0 0 6 10 11 6 4 12 9 8 20 6 31 123
PS within HW/Net ESO 1 3 12 9 10 9 4 4 16 6 6 12 14 6 112
Accounting PSO 0 0 0 6 2 4 1 5 13 9 8 19 14 14 95
VAR ESO 0 0 0 0 0 0 0 0 14 14 4 14 21 17 84
Managed Services ESO 0 0 0 0 0 0 0 0 17 8 4 9 3 13 54
Res. & Dev. PSO 0 0 0 0 0 0 0 0 15 7 0 4 7 7 40
Staffing PSO 0 0 0 0 0 0 0 0 9 5 2 4 3 10 33
Total 52 118 225 214 216 234 238 220 549 416 456 622 513 561 4,634
Source: SPI Research, February 2021
Table 9 shows 390 surveys came from independent firms while 171 came from ESOs (Embedded Service
Organizations within product companies). North American headquartered firms dominated the study
with 445 surveys while 84 came from EMEA-headquartered firms and 32 came from Asia Pacific
(predominantly Australia and New Zealand). The average size organization this year is 548 employees.
Table 9: Survey Participant Demographics by Organization Type and Geographic Region
Key Performance Indicator 2019 2020 ESO PSO Amer. EMEA APac
Surveys 513 561 171 390 445 84 32
Size of PS organization (employees) 530 548 555 545 516 718 554
Annual company revenue (mm) $203.2 $175.7 $279.1 $130.5 $175.1 $201.9 $122.5
Total PS revenue (mm) $83.8 $81.4 $88.3 $78.4 $74.7 $138.5 $26.0
YoY change in PS revenue 10.6% 8.7% 10.6% 7.9% 9.4% 7.6% 3.3%
YoY change in PS headcount 9.0% 5.5% 6.3% 5.1% 6.2% 2.9% 1.3%
% of employees billable 73.3% 73.7% 71.7% 74.6% 73.7% 72.1% 78.0%
% of PS rev. delivered by 3rd-parties 10.6% 11.5% 10.9% 11.8% 11.1% 14.1% 11.1%
Source: SPI Research, February 2021

2021 Professional Services Maturity™ Benchmark
© 2021 Service Performance Insight, LLC www.timelog.dk 25
Figure 15: Regional Demographics
Source: SPI Research, February 2021
By organization size, the largest organizations grew the fastest and added the most PS headcount (Table
10). The largest relied the most heavily on subcontractors to generate incremental revenue. In the
high-growth professional services world, mergers and acquisitions are increasingly seen as one of the
fastest ways to augment growth and to expand into hot new service and technology segments.
Increasingly, the largest firms are augmenting their capabilities in SMAC (Security, Mobile, Analytics and
the Cloud) while also investing in more strategic and industry-focused practices.
Table 10: Survey Participant Demographics by Organization Size
Key Performance Indicator (KPI) Under 10 10 - 30 31 – 100 101 - 300 301 - 700 Over 700
Surveys 62 108 170 111 48 62
Size of PS organization (employees) 5 20 65 200 500 3,996
Annual company revenue (mm) $6.5 $12.7 $48.7 $140.4 $384.8 $931.1
Total professional services revenue (mm) $3.0 $5.6 $17.9 $38.3 $116.0 $519.8
Year-over-year change in PS revenue 6.4% 7.6% 9.1% 10.3% 5.8% 11.6%
Year-over-year change in PS headcount 2.1% 3.0% 6.3% 7.8% 5.6% 6.7%
% of employees billable or chargeable 73.5% 75.0% 76.3% 74.2% 67.1% 68.6%
% of PS revenue delivered by 3rd-parties 9.1% 11.2% 11.2% 11.6% 12.9% 14.7%
Source: SPI Research, February 2021
Tables 11 and 12 further analyze the survey demographics by vertical market, highlighting the markets
surveyed. According to this year’s survey, SaaS PS (embedded PS organizations within cloud companies)
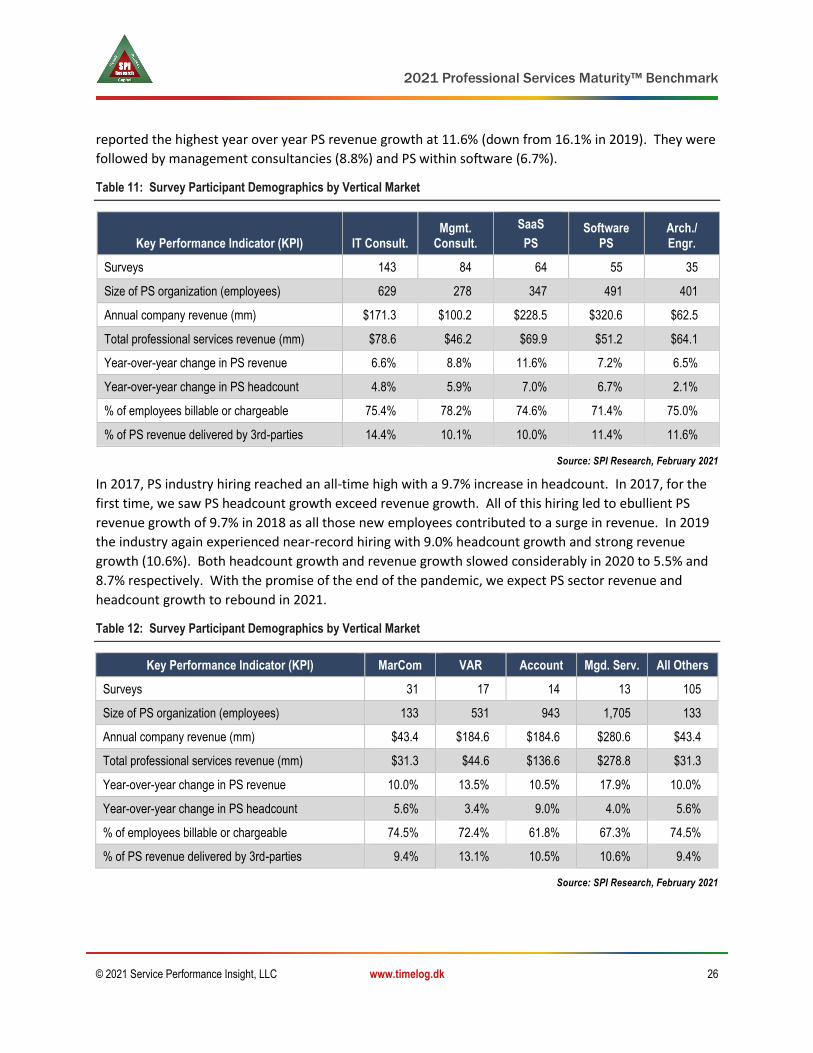
2021 Professional Services Maturity™ Benchmark
© 2021 Service Performance Insight, LLC www.timelog.dk 26
reported the highest year over year PS revenue growth at 11.6% (down from 16.1% in 2019). They were
followed by management consultancies (8.8%) and PS within software (6.7%).
Table 11: Survey Participant Demographics by Vertical Market
Key Performance Indicator (KPI) IT Consult. Mgmt.
Consult.
SaaS
PS Software
PS Arch./ Engr.
Surveys 143 84 64 55 35
Size of PS organization (employees) 629 278 347 491 401
Annual company revenue (mm) $171.3 $100.2 $228.5 $320.6 $62.5
Total professional services revenue (mm) $78.6 $46.2 $69.9 $51.2 $64.1
Year-over-year change in PS revenue 6.6% 8.8% 11.6% 7.2% 6.5%
Year-over-year change in PS headcount 4.8% 5.9% 7.0% 6.7% 2.1%
% of employees billable or chargeable 75.4% 78.2% 74.6% 71.4% 75.0%
% of PS revenue delivered by 3rd-parties 14.4% 10.1% 10.0% 11.4% 11.6%
Source: SPI Research, February 2021
In 2017, PS industry hiring reached an all-time high with a 9.7% increase in headcount. In 2017, for the
first time, we saw PS headcount growth exceed revenue growth. All of this hiring led to ebullient PS
revenue growth of 9.7% in 2018 as all those new employees contributed to a surge in revenue. In 2019
the industry again experienced near-record hiring with 9.0% headcount growth and strong revenue
growth (10.6%). Both headcount growth and revenue growth slowed considerably in 2020 to 5.5% and
8.7% respectively. With the promise of the end of the pandemic, we expect PS sector revenue and
headcount growth to rebound in 2021.
Table 12: Survey Participant Demographics by Vertical Market
Key Performance Indicator (KPI) MarCom VAR Account Mgd. Serv. All Others
Surveys 31 17 14 13 105
Size of PS organization (employees) 133 531 943 1,705 133
Annual company revenue (mm) $43.4 $184.6 $184.6 $280.6 $43.4
Total professional services revenue (mm) $31.3 $44.6 $136.6 $278.8 $31.3
Year-over-year change in PS revenue 10.0% 13.5% 10.5% 17.9% 10.0%
Year-over-year change in PS headcount 5.6% 3.4% 9.0% 4.0% 5.6%
% of employees billable or chargeable 74.5% 72.4% 61.8% 67.3% 74.5%
% of PS revenue delivered by 3rd-parties 9.4% 13.1% 10.5% 10.6% 9.4%
Source: SPI Research, February 2021

2021 Professional Services Maturity™ Benchmark
© 2021 Service Performance Insight, LLC www.timelog.dk 27
Type of Work Sold
SPI Research analyzes the type of work sold, (Table 13). Technology and IT consulting represents almost
40% of the work sold by ESOs. ESOs are no longer just selling implementation, integration and
customization on either a time and materials or fixed priced basis; now those services, just like software,
are being sold “as a service”. ESO subscription revenue surged to 15.7%. This business model shift
heightens the need for PSA or project-based accounting solutions. Providers must not only track labor
and utilization costs but also ensure those costs are within committed subscription cost levels.
Additionally, systems must now support complex multi-element contracts and billing. The percentage of
managed service, recurring revenue, also continues to rise and now stands at 9.2%. The percentage of
staff augmentation or “access to expertise” type of services has also risen to 6.3% as many firms now
offer fractional “ownership” of solution architects 1, 2 or 5 days a week.
Table 13: Type of Work Sold by Organization Type and Geographic Region
Key Performance Indicator (KPI) 2019 2020 ESO PSO Amer. EMEA APac
Business / management consulting 23.8% 27.8% 19.6% 31.4% 28.2% 25.8% 26.6%
Technology or IT consulting 39.4% 34.6% 39.9% 32.3% 33.4% 42.5% 33.6%
Subscription services 8.3% 9.6% 15.7% 6.9% 10.0% 7.4% 8.6%
Managed services 9.0% 9.2% 7.3% 10.1% 9.6% 7.8% 7.6%
Staff augmentation 5.5% 6.3% 5.1% 6.9% 6.3% 6.6% 5.8%
Hardware, software or equipment 4.5% 3.5% 4.7% 2.9% 3.2% 4.4% 4.9%
Other 9.6% 9.0% 7.8% 9.5% 9.3% 5.5% 12.8%
Total 100.0% 100.0% 100.0% 100.0% 100.0% 100.0% 100.0%
Source: SPI Research, February 2021
In Europe the percentage of technology consulting was significantly higher than business or
management consulting. As the North American technology services market matures, service providers
are shifting their focus to add business process optimization. Expect the same shifts to occur in EMEA
and Asia Pacific as the business matures giving way to a higher percentage of strategic multi-
dimensional consultancies who offer strategic, market positioning and brand-building services in
addition to technology and business process optimization expertise.
The breakdown of services sold becomes even more interesting as organizations are parsed by size.
Smaller firms tend to sell more business or management consulting than the larger firms as the vast
majority of management consultancies are quite small. Technology consulting lends itself to economies
of scale whereas expert strategic or operational management consulting relies on specific domain
knowledge and expertise which is not easily amplified across large project teams. As organizations
grow, subscription and managed services make up a larger proportion of revenue.

2021 Professional Services Maturity™ Benchmark
© 2021 Service Performance Insight, LLC www.timelog.dk 28
Table 14: Type of Work Sold by Organization Size
Key Performance Indicator (KPI) Under 10 10 - 30 31 – 100 101 - 300 301 - 700 Over 700
Business / management consulting 52.0% 33.5% 28.0% 19.3% 14.8% 16.7%
Technology or IT consulting 21.3% 33.6% 34.5% 41.8% 34.4% 37.6%
Subscription services 5.8% 8.1% 10.8% 6.8% 10.6% 17.6%
Managed services 5.7% 5.9% 9.3% 11.6% 14.0% 10.6%
Staff augmentation 4.3% 4.6% 5.4% 8.2% 14.2% 4.6%
Hardware, software or equipment 2.5% 3.2% 3.7% 4.1% 2.1% 4.4%
Other 8.3% 11.1% 8.2% 8.2% 9.9% 8.6%
Total 100.0% 100.0% 100.0% 100.0% 100.0% 100.0%
Source: SPI Research, February 2021
PSO Type
Many of the concepts and uses of professional services described in this report also exist within product-
driven organizations. Thus, SPI Research uses the term “embedded service organization” (ESO) to
describe the rapidly expanding market for service organizations within product companies. Within
professional services, the fastest growing segment is software and IT services.
There are more than 25,000 software, hardware, IT and Managed Services companies in the United
States; more than 99 percent are small and medium-sized firms (i.e., under 500 employees). This total
includes software publishers, suppliers of custom computer programming services, computer systems
design firms, and Managed Services providers. This segment of the PS industry draws on a highly
educated and skilled US-based workforce of over 5.4 million people. Figure 16 shows over two-thirds of
this year’s benchmark participants are independent firms.
Figure 16: Independent vs. Embedded Survey Orgs Surveyed (2007 – 2020)
Source: SPI Research, February 2021

2021 Professional Services Maturity™ Benchmark
© 2021 Service Performance Insight, LLC www.timelog.dk 29
SPI Research analyzes billable PSOs in several ways with a focus on two macro segments – independents
and embedded PS organizations:
Independent Professional Services Organizations (PSOs): Independent PSOs sell, deliver, and invoice for professional services to external clients. Clients hire systems integrators, IT consultancies (SIs); Value-Added Resellers (VARs) and Managed Service providers (MSPs)to implement or integrate technology based on their strategic competence or specialized industry or product knowledge. Clients hire management consultancies to provide strategic insight, guidance, facilitation and coaching. Independent PSOs typically provide expertise, knowledge, skills and business practices that are more specialized than those found within internal organizations. In this study a majority of the independent PSOs were IT consultancies, Systems Integrators (SIs) or VARs, with the remainder representing Management Consultancies (MCs), Accountants, Marketing and Advertising firms and Architects and Engineers. Healthcare services including staffing; management consulting; technology and business process consulting represents one of the fastest growing sectors as the healthcare industry is forced to automate and improve patient reporting. The participating PSOs represented a broad spectrum from some of the largest independent service providers in the world to extremely small, independent regional and specialty service providers. The vast majority of responding independent PSO’s are privately held.
Embedded Services Organizations (ESOs): ESOs operate much like PSOs; however, they are part of a
product-driven organization. The majority of ESO participants focus exclusively on their company’s own
technology but many of the largest ESOs like IBM and HP services provide global IT consulting, managed
services and outsourcing not associated with their company’s products. For the small to mid-size ESOs,
their primary charter is to successfully implement their company’s products. Increasingly the charter of
embedded PS has expanded to include client adoption with a focus on reducing time to value. While
they are focused on professional service revenue and profit, they are often asked to perform non-
billable presales, proof of concept and customer satisfaction services at little to no charge. They enable
external clients but must also support internal sales, support and engineering constituencies. At
maturity levels 1 and 2, their primary focus is on project delivery and building a reference base. For
ESOs, lead generation, marketing and sales are primarily provided by the product sales organization
however as they mature, many are starting to develop their own “sales selling service” organizations. In
this survey a majority of the ESOs were part of independent software and cloud vendors (ISVs). The
embedded PS organizations in this study provide PS for some of the largest and best-known cloud
vendors. Overtime the charter for embedded cloud PS has shifted from a cost center to a profit center.
Cloud PS organizations are now measured on implementation, packaged subscription services, adoption,
expansion, churn and recurring revenue. Almost all legacy on-premise software providers are moving to
the cloud. SPI Research shows both on-premise and SaaS results. SPI Research uses this segmentation
because independent consultancies must fund sales, marketing and back-office operations for finance,
operations, facilities, IT and recruiting in a way that embedded organizations generally do not.
Independents incur a higher cost of operation than captive (embedded) organizations do. However, the
following chapters will demonstrate independent PSOs generally outperform their embedded
counterparts because their sole focus is on delivering high-quality services at a profit. Independents
generally are focused on client delight and service revenue and profit growth, versus embedded where
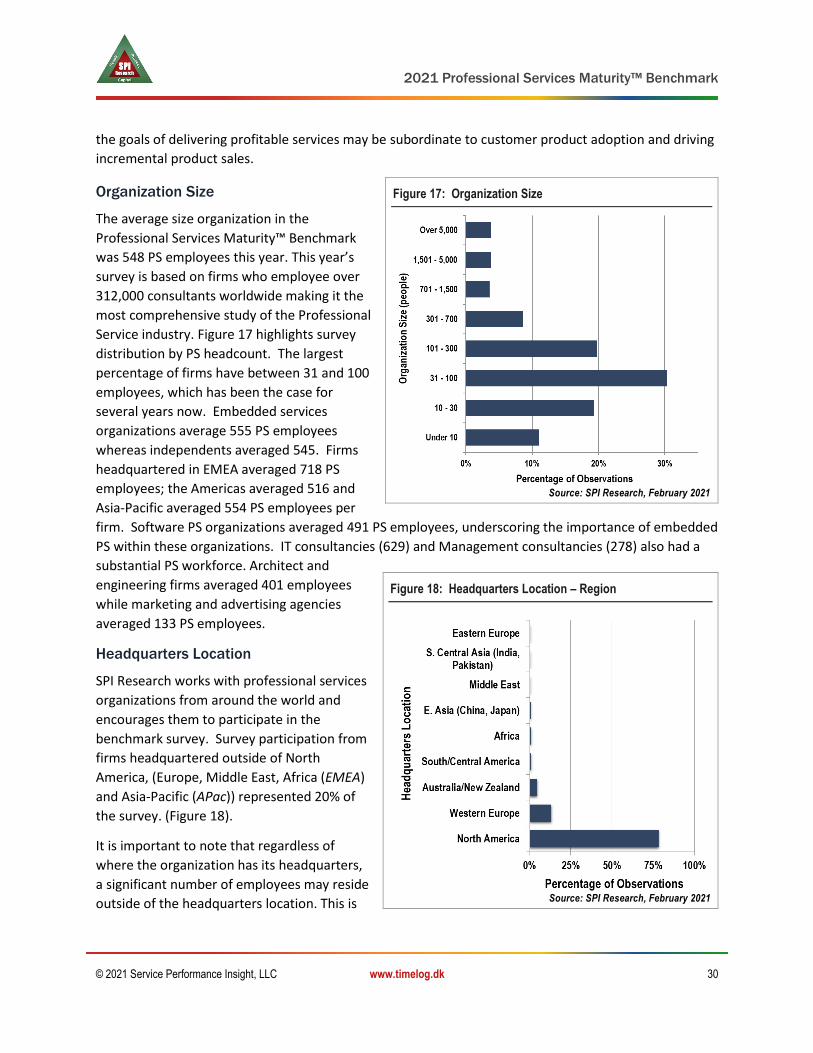
2021 Professional Services Maturity™ Benchmark
© 2021 Service Performance Insight, LLC www.timelog.dk 30
the goals of delivering profitable services may be subordinate to customer product adoption and driving
incremental product sales.
Organization Size
The average size organization in the
Professional Services Maturity™ Benchmark
was 548 PS employees this year. This year’s
survey is based on firms who employee over
312,000 consultants worldwide making it the
most comprehensive study of the Professional
Service industry. Figure 17 highlights survey
distribution by PS headcount. The largest
percentage of firms have between 31 and 100
employees, which has been the case for
several years now. Embedded services
organizations average 555 PS employees
whereas independents averaged 545. Firms
headquartered in EMEA averaged 718 PS
employees; the Americas averaged 516 and
Asia-Pacific averaged 554 PS employees per
firm. Software PS organizations averaged 491 PS employees, underscoring the importance of embedded
PS within these organizations. IT consultancies (629) and Management consultancies (278) also had a
substantial PS workforce. Architect and
engineering firms averaged 401 employees
while marketing and advertising agencies
averaged 133 PS employees.
Headquarters Location
SPI Research works with professional services
organizations from around the world and
encourages them to participate in the
benchmark survey. Survey participation from
firms headquartered outside of North
America, (Europe, Middle East, Africa (EMEA)
and Asia-Pacific (APac)) represented 20% of
the survey. (Figure 18).
It is important to note that regardless of
where the organization has its headquarters,
a significant number of employees may reside
outside of the headquarters location. This is
Figure 17: Organization Size
Source: SPI Research, February 2021
Figure 18: Headquarters Location – Region
Source: SPI Research, February 2021
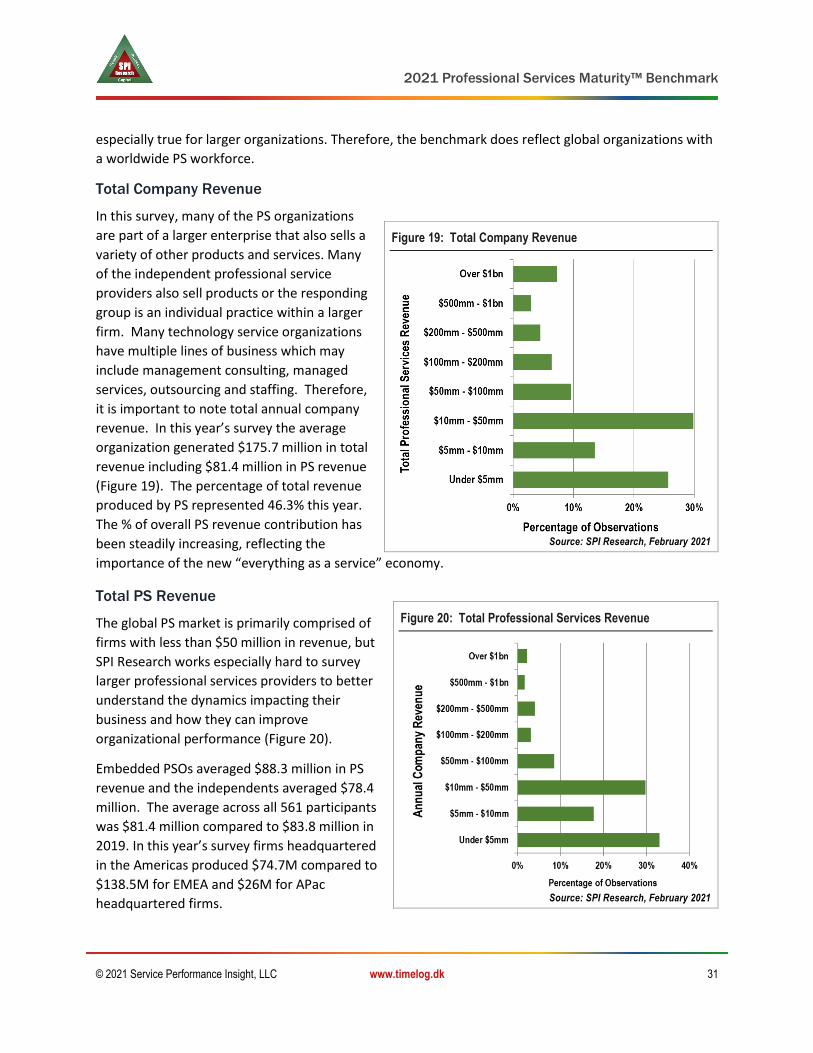
2021 Professional Services Maturity™ Benchmark
© 2021 Service Performance Insight, LLC www.timelog.dk 31
especially true for larger organizations. Therefore, the benchmark does reflect global organizations with
a worldwide PS workforce.
Total Company Revenue
In this survey, many of the PS organizations
are part of a larger enterprise that also sells a
variety of other products and services. Many
of the independent professional service
providers also sell products or the responding
group is an individual practice within a larger
firm. Many technology service organizations
have multiple lines of business which may
include management consulting, managed
services, outsourcing and staffing. Therefore,
it is important to note total annual company
revenue. In this year’s survey the average
organization generated $175.7 million in total
revenue including $81.4 million in PS revenue
(Figure 19). The percentage of total revenue
produced by PS represented 46.3% this year.
The % of overall PS revenue contribution has
been steadily increasing, reflecting the
importance of the new “everything as a service” economy.
Total PS Revenue
The global PS market is primarily comprised of
firms with less than $50 million in revenue, but
SPI Research works especially hard to survey
larger professional services providers to better
understand the dynamics impacting their
business and how they can improve
organizational performance (Figure 20).
Embedded PSOs averaged $88.3 million in PS
revenue and the independents averaged $78.4
million. The average across all 561 participants
was $81.4 million compared to $83.8 million in
2019. In this year’s survey firms headquartered
in the Americas produced $74.7M compared to
$138.5M for EMEA and $26M for APac
headquartered firms.
Figure 19: Total Company Revenue
Source: SPI Research, February 2021
Figure 20: Total Professional Services Revenue
Source: SPI Research, February 2021
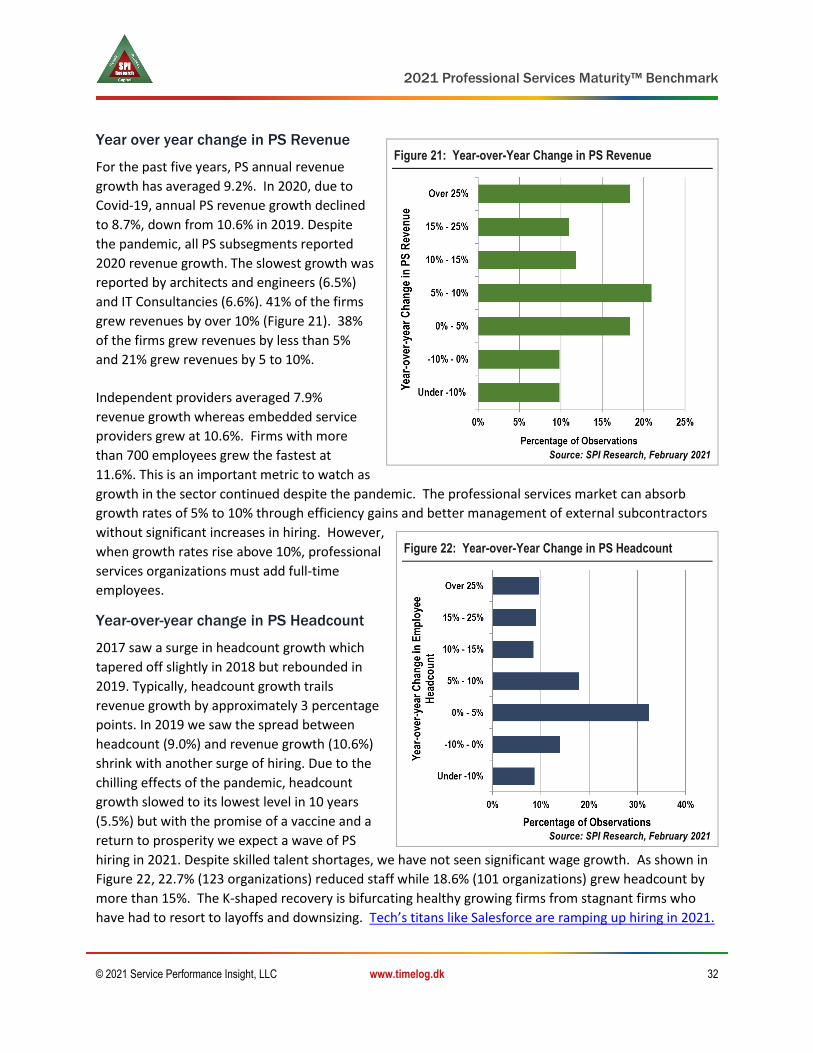
2021 Professional Services Maturity™ Benchmark
© 2021 Service Performance Insight, LLC www.timelog.dk 32
Year over year change in PS Revenue
For the past five years, PS annual revenue
growth has averaged 9.2%. In 2020, due to
Covid-19, annual PS revenue growth declined
to 8.7%, down from 10.6% in 2019. Despite
the pandemic, all PS subsegments reported
2020 revenue growth. The slowest growth was
reported by architects and engineers (6.5%)
and IT Consultancies (6.6%). 41% of the firms
grew revenues by over 10% (Figure 21). 38%
of the firms grew revenues by less than 5%
and 21% grew revenues by 5 to 10%.
Independent providers averaged 7.9%
revenue growth whereas embedded service
providers grew at 10.6%. Firms with more
than 700 employees grew the fastest at
11.6%. This is an important metric to watch as
growth in the sector continued despite the pandemic. The professional services market can absorb
growth rates of 5% to 10% through efficiency gains and better management of external subcontractors
without significant increases in hiring. However,
when growth rates rise above 10%, professional
services organizations must add full-time
employees.
Year-over-year change in PS Headcount
2017 saw a surge in headcount growth which
tapered off slightly in 2018 but rebounded in
2019. Typically, headcount growth trails
revenue growth by approximately 3 percentage
points. In 2019 we saw the spread between
headcount (9.0%) and revenue growth (10.6%)
shrink with another surge of hiring. Due to the
chilling effects of the pandemic, headcount
growth slowed to its lowest level in 10 years
(5.5%) but with the promise of a vaccine and a
return to prosperity we expect a wave of PS
hiring in 2021. Despite skilled talent shortages, we have not seen significant wage growth. As shown in
Figure 22, 22.7% (123 organizations) reduced staff while 18.6% (101 organizations) grew headcount by
more than 15%. The K-shaped recovery is bifurcating healthy growing firms from stagnant firms who
have had to resort to layoffs and downsizing. Tech’s titans like Salesforce are ramping up hiring in 2021.
Figure 21: Year-over-Year Change in PS Revenue
Source: SPI Research, February 2021
Figure 22: Year-over-Year Change in PS Headcount
Source: SPI Research, February 2021

2021 Professional Services Maturity™ Benchmark
© 2021 Service Performance Insight, LLC www.timelog.dk 33
Percentage of Employees Billable or Chargeable
SPI Research found the percentage of billable employees grew from 72.8% in 2018 to 73.3% in 2019 and
73.7% in 2020 (Figure 23). PSOs have worked
hard to eliminate non-revenue producing
positions but the span of management control
has remained fairly constant at 1:10.
Independents reported 74.6% billable
employees compared to 71.7% for ESOs. The
EMEA region reported 72.1% of their
employees billable; APAC 78% and Americas
73.7%. Organizations with 30 to 100 employees
reported the highest billable percentage
(76.3%). By vertical, Management
Consultancies reported the highest billable
percentage (78.2%).
Excessive non-billable headcount creates a top-
heavy organization or is a symptom of poor
sales and marketing effectiveness and/or poor
systems. But as in all things PS, there is a
delicate balance that must be maintained. Non-billable headcount and time is a necessary component
of leadership and developing infrastructure, systems and tools which support growth, consistency and
quality.
Percentage of PS Revenue Delivered by
Third Parties
Figure 24 shows the distribution of survey
responses in terms of the amount of revenue
generated by third-party resources. The average
percent of PS revenue generated by
subcontractors was 11.5%. ESOs used a third-
party workforce to generate 10.9% of revenue,
whereas independents reported 11.8%. APac and
the Americas used a third-party workforce for to
generate 11.1% of revenue; EMEA averaged
14.1%. By vertical, IT Consultancies used the most
outside subcontractors, generating 14.4% of
revenues. Subcontractor use grows
proportionately with organization size.
Figure 23: Percentage of Employees Billable
Source: SPI Research, February 2021
Figure 24: Percentage of PS Rev. Delivered by 3rd-parties
Source: SPI Research, February 2021
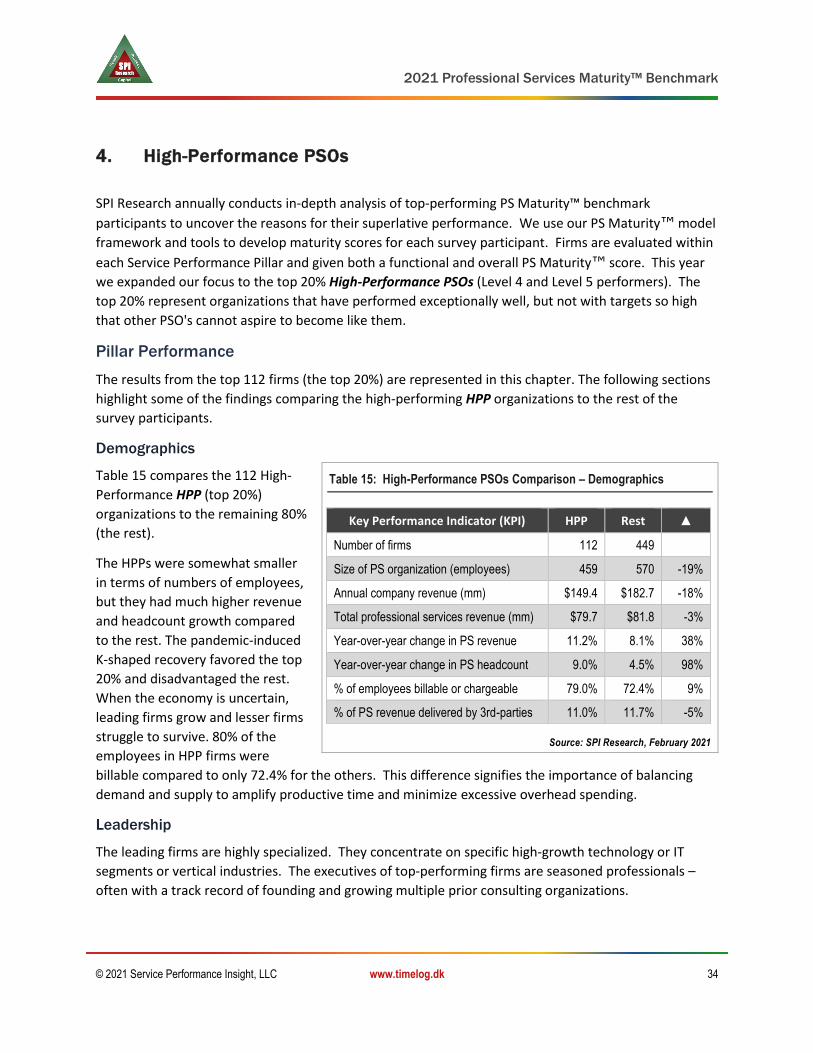
2021 Professional Services Maturity™ Benchmark
© 2021 Service Performance Insight, LLC www.timelog.dk 34
4. High-Performance PSOs
SPI Research annually conducts in-depth analysis of top-performing PS Maturity™ benchmark
participants to uncover the reasons for their superlative performance. We use our PS Maturity™ model
framework and tools to develop maturity scores for each survey participant. Firms are evaluated within
each Service Performance Pillar and given both a functional and overall PS Maturity™ score. This year
we expanded our focus to the top 20% High-Performance PSOs (Level 4 and Level 5 performers). The
top 20% represent organizations that have performed exceptionally well, but not with targets so high
that other PSO's cannot aspire to become like them.
Pillar Performance
The results from the top 112 firms (the top 20%) are represented in this chapter. The following sections
highlight some of the findings comparing the high-performing HPP organizations to the rest of the
survey participants.
Demographics
Table 15 compares the 112 High-
Performance HPP (top 20%)
organizations to the remaining 80%
(the rest).
The HPPs were somewhat smaller
in terms of numbers of employees,
but they had much higher revenue
and headcount growth compared
to the rest. The pandemic-induced
K-shaped recovery favored the top
20% and disadvantaged the rest.
When the economy is uncertain,
leading firms grow and lesser firms
struggle to survive. 80% of the
employees in HPP firms were
billable compared to only 72.4% for the others. This difference signifies the importance of balancing
demand and supply to amplify productive time and minimize excessive overhead spending.
Leadership
The leading firms are highly specialized. They concentrate on specific high-growth technology or IT
segments or vertical industries. The executives of top-performing firms are seasoned professionals –
often with a track record of founding and growing multiple prior consulting organizations.
Table 15: High-Performance PSOs Comparison – Demographics
Key Performance Indicator (KPI) HPP Rest ▲
Number of firms 112 449
Size of PS organization (employees) 459 570 -19%
Annual company revenue (mm) $149.4 $182.7 -18%
Total professional services revenue (mm) $79.7 $81.8 -3%
Year-over-year change in PS revenue 11.2% 8.1% 38%
Year-over-year change in PS headcount 9.0% 4.5% 98%
% of employees billable or chargeable 79.0% 72.4% 9%
% of PS revenue delivered by 3rd-parties 11.0% 11.7% -5%
Source: SPI Research, February 2021

2021 Professional Services Maturity™ Benchmark
© 2021 Service Performance Insight, LLC www.timelog.dk 35
Leaders at the best firms foster a work environment that is fair and well-managed with ample rewards
and career progression. Because employees understand and share in the success of these organizations,
the atmosphere is one of collaboration, trust and loyalty.
Leadership is one of the most important factors driving success in the professional services market. A
top concern surrounding a virtual work environment is that new hires and young workers will not have
enough in-person exposure to leaders and managers. Leadership by walking around, modeling best
practices and values, is a concept that helps ingrain cultural norms and expectations throughout an
organization. Studies show that leadership challenges have been exacerbated by the forced virtual
pandemic work environment. The concern is a more distributed and remote workforce will not have as
much in-person contact with leaders to be groomed for future roles.
Table 16 compares the
leadership metrics of the
highest performing
organizations with the
remainder of the survey. The
highest differential score is in
the ability to get things done
and confidence in the PSOs
future. Top performers have
made investments in
collaboration tools and
integrated systems to
streamline business processes,
allowing them to move to a
virtual work environment
without a hiccup.
Some leadership principles remain constant: leaders take on challenges that others are not able to
handle, and they invest in the future with a focus on innovation. Leaders are clear and decisive in
defining their vision of the future and their firm’s place in the universe. Strategic clarity is further
cemented by abundant communication which manifests in confidence in leadership and trust. Leading
PSOs cultivate egalitarian, non-hierarchical, flat organizations in which all employees are vested in the
success of the firm as well as their own well-being. Their focus on innovation means they strive to
continually stay ahead of the pack, investing in new technologies and ideas long before they become
mainstream. Their clarity of purpose provides a powerful foundation for their unique cultures which
support and accelerate market differentiation, in turn leading to strong employee confidence in the
future and customer loyalty.
Table 16: High-Performance PSOs Comparison – Leadership
Key Performance Indicator (KPI) HPP Rest ▲
Well understood vision, mission and strategy 4.30 3.89 11%
Confidence in PS leadership 4.46 4.13 8%
Ease of getting things done 4.26 3.76 13%
Goals and measurement alignment 4.15 3.74 11%
Employees have confidence in PSO's future 4.46 3.94 13%
Effectively communicates w/employees 4.25 3.96 7%
Embraces change - nimble and flexible 4.30 3.87 11%
Innovation focused 4.16 3.74 11%
Source: SPI Research, February 2021
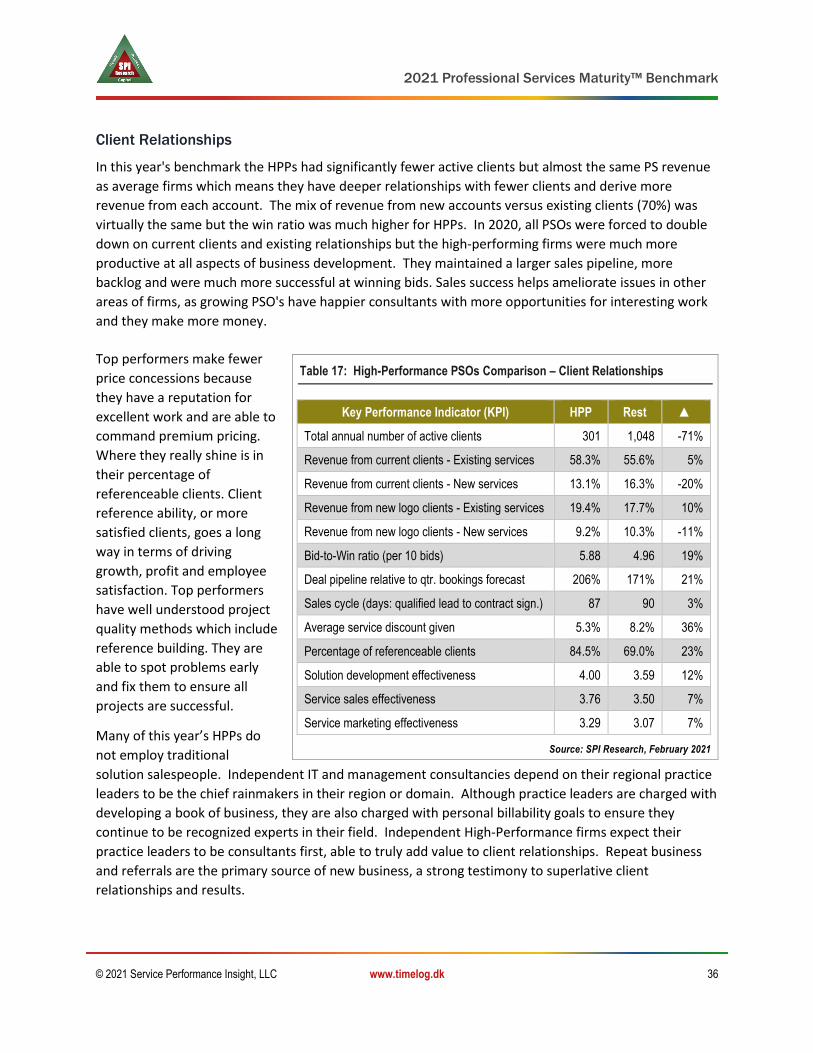
2021 Professional Services Maturity™ Benchmark
© 2021 Service Performance Insight, LLC www.timelog.dk 36
Client Relationships
In this year's benchmark the HPPs had significantly fewer active clients but almost the same PS revenue
as average firms which means they have deeper relationships with fewer clients and derive more
revenue from each account. The mix of revenue from new accounts versus existing clients (70%) was
virtually the same but the win ratio was much higher for HPPs. In 2020, all PSOs were forced to double
down on current clients and existing relationships but the high-performing firms were much more
productive at all aspects of business development. They maintained a larger sales pipeline, more
backlog and were much more successful at winning bids. Sales success helps ameliorate issues in other
areas of firms, as growing PSO's have happier consultants with more opportunities for interesting work
and they make more money.
Top performers make fewer
price concessions because
they have a reputation for
excellent work and are able to
command premium pricing.
Where they really shine is in
their percentage of
referenceable clients. Client
reference ability, or more
satisfied clients, goes a long
way in terms of driving
growth, profit and employee
satisfaction. Top performers
have well understood project
quality methods which include
reference building. They are
able to spot problems early
and fix them to ensure all
projects are successful.
Many of this year’s HPPs do
not employ traditional
solution salespeople. Independent IT and management consultancies depend on their regional practice
leaders to be the chief rainmakers in their region or domain. Although practice leaders are charged with
developing a book of business, they are also charged with personal billability goals to ensure they
continue to be recognized experts in their field. Independent High-Performance firms expect their
practice leaders to be consultants first, able to truly add value to client relationships. Repeat business
and referrals are the primary source of new business, a strong testimony to superlative client
relationships and results.
Table 17: High-Performance PSOs Comparison – Client Relationships
Key Performance Indicator (KPI) HPP Rest ▲
Total annual number of active clients 301 1,048 -71%
Revenue from current clients - Existing services 58.3% 55.6% 5%
Revenue from current clients - New services 13.1% 16.3% -20%
Revenue from new logo clients - Existing services 19.4% 17.7% 10%
Revenue from new logo clients - New services 9.2% 10.3% -11%
Bid-to-Win ratio (per 10 bids) 5.88 4.96 19%
Deal pipeline relative to qtr. bookings forecast 206% 171% 21%
Sales cycle (days: qualified lead to contract sign.) 87 90 3%
Average service discount given 5.3% 8.2% 36%
Percentage of referenceable clients 84.5% 69.0% 23%
Solution development effectiveness 4.00 3.59 12%
Service sales effectiveness 3.76 3.50 7%
Service marketing effectiveness 3.29 3.07 7%
Source: SPI Research, February 2021

2021 Professional Services Maturity™ Benchmark
© 2021 Service Performance Insight, LLC www.timelog.dk 37
Talent (formerly Human Capital Alignment)
Talent is a primary focus and hot topic for all service firms. In an increasingly competitive talent market,
HPPs have become laser-focused on their employment brand. Organizations are embracing technology
to help reimagine the workplace with knowledge-sharing, team building, transparency and collaboration
at the core of their continuous learning cultures.
High-performing firms place a premium on high quality recruiting and on-boarding programs resulting in
faster recruiting and ramping times combined with better retention and higher billable utilization. They
hire “A” players and they invest a lot in them and expect a lot from them.
Just finding talent is not enough. This year’s High-Performance firms focused on ramping and employee
training to develop a qualified workforce. Some create rotational assignments to give their employees
greater exposure to other technologies and clients. Employees who are continually learning and
expanding their knowledge base tend to stay with their employer. When the work is not challenging or
interesting, morale suffers, and attrition rises. Several of the smaller firms are 100% virtual – in other
words, they don’t invest in expensive facilities but keep morale high with communication and
collaboration.
Table 18 compares Talent
Pillar KPIs between the High-
Performance PSOs and the
others. Employee attrition,
both voluntary and
involuntary, was down this
year but HPPs do a much
better job of engaging and
retaining their employees.
The pandemic limited the
propensity for employees to
seek greener pastures as
workers were happy to have
employment stability while
the world around them was
filled with uncertainty.
HPPs showed lower attrition
meaning their firm's ability to
train, motivate, incent and
keep happy employees was much better. A higher percentage of employees would recommend their
firm as a great place to work.
Because HPPs grow faster than average firms, they are able to recruit new employees faster, and they
have better onboarding programs, so their new hires become productive in less time, shortening their
Table 18: High-Performance PSOs Comparison – Talent
Key Performance Indicator (KPI) HPP Rest ▲
Percentage of workforce that is male 59.0% 61.8% -5%
Employee annual attrition - voluntary 5.5% 7.4% 26%
Employee annual attrition - involuntary 4.3% 4.8% 12%
Recommend company to friends/family (1 to 5) 4.71 4.33 9%
Days to recruit and hire for standard positions 59.6 63.7 6%
Days for a new hire to become productive 48.0 61.5 22%
Guaranteed annual training days / employee 10.14 9.67 5%
Well-understood career path (1 to 5 scale) 3.52 3.24 9%
Employee billable utilization 79.4% 68.7% 15%
Annual fully loaded cost per consultant (k) $137 $120 -14%
Onsite delivery 36.0% 42.7% -16%
Source: SPI Research, February 2021

2021 Professional Services Maturity™ Benchmark
© 2021 Service Performance Insight, LLC www.timelog.dk 38
ramping time and becoming billable faster. Two of the more significant differences between HPPs and
the rest are that high-performance firms had much higher billable utilization. Their employees bill an
additional 200 hours per year per consultant which translates to a whopping $60K more in revenue!
And while they had higher fully loaded employee costs, the HPP firms made up for it in terms of higher
billable utilization. They also did a much better job of supporting a virtual work environment, which
reduced nonproductive time, and also improved billable utilization.
Service Execution
Table 19 compares service execution metrics between the High-Performance organizations and the
remainder. High quality service execution is what really sets top performing PSOs apart. They tend to
be highly disciplined in all facets of service execution. The table points out leaders tackle larger, more
mission critical projects. Their projects require more staff for longer periods of time. Given the scale
and complexity of their projects, remarkably, they are able to deliver most of them on-time and on-
budget. They deliver projects
with quality and integrity and
are far more likely to use a
standardized delivery
methodology which results in
more projects delivered on-
time, fewer project overruns
and fewer project
cancellations. Because the
best firms deploy the best
consultants and effectively use
PSA to exceed client
expectations, every facet of
service execution is more
profitable.
The table shows improvement
in virtually every Service
Execution metric. HPP firms
were able to staff projects
faster. They also delivered
much larger projects in terms of revenue, people and project duration. Larger projects entail more risk
so top performers invest in project management and drive clarity, quality and properly set expectations
throughout the life of the project. They also do a much better job of documenting progress and results.
Top firms deliver more projects on-time and minimize project overruns. These are two critical KPI's that
have a direct impact on client satisfaction. On-time, on-budget project delivery also impacts employee
satisfaction, as it is no fun to work on projects that are over-budget and delivered late. Many of the HPP
firms use structured, standardized, delivery methods and they invest in project management offices to
drive quality and build a foundation of project excellence. They provide visibility to all aspects of project
Table 19: High-Performance PSOs Comparison – Service Execution
Key Performance Indicator (KPI) HPP Rest ▲
Average project staffing time (days) 8.31 10.24 19%
Number of projects delivered per year 410 411 0%
Average revenue per project (k) $228 $129 77%
Average project staff (people) 4.32 4.02 7%
Average project duration (months) 5.89 5.43 8%
Projects delivered on-time 88.7% 76.6% 16%
Average project overrun 5.8% 9.2% 38%
Use a standardized delivery methodology 69.4% 64.7% 7%
Project margin for time & materials projects 38.7% 34.1% 13%
Project margin for fixed price projects 40.0% 33.8% 18%
Average project margin — subs, offshore 32.3% 28.1% 15%
Onsite delivery 36.0% 42.7% -16%
Source: SPI Research, February 2021
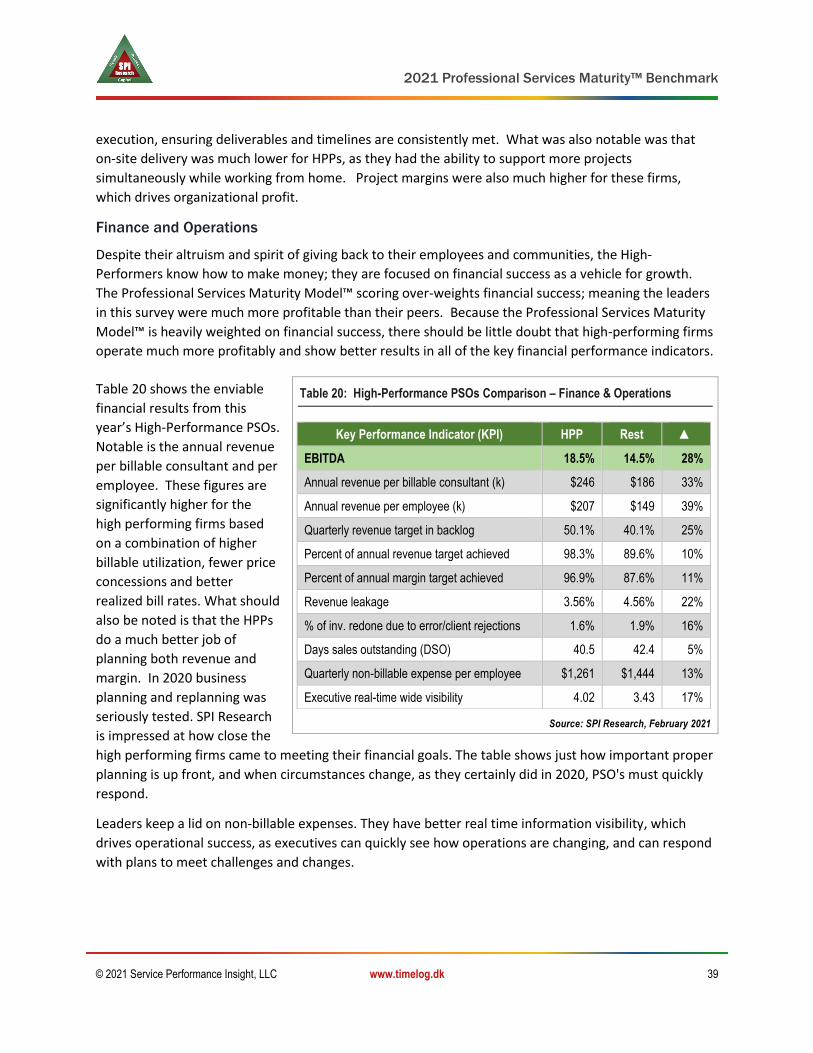
2021 Professional Services Maturity™ Benchmark
© 2021 Service Performance Insight, LLC www.timelog.dk 39
execution, ensuring deliverables and timelines are consistently met. What was also notable was that
on-site delivery was much lower for HPPs, as they had the ability to support more projects
simultaneously while working from home. Project margins were also much higher for these firms,
which drives organizational profit.
Finance and Operations
Despite their altruism and spirit of giving back to their employees and communities, the High-
Performers know how to make money; they are focused on financial success as a vehicle for growth.
The Professional Services Maturity Model™ scoring over-weights financial success; meaning the leaders
in this survey were much more profitable than their peers. Because the Professional Services Maturity
Model™ is heavily weighted on financial success, there should be little doubt that high-performing firms
operate much more profitably and show better results in all of the key financial performance indicators.
Table 20 shows the enviable
financial results from this
year’s High-Performance PSOs.
Notable is the annual revenue
per billable consultant and per
employee. These figures are
significantly higher for the
high performing firms based
on a combination of higher
billable utilization, fewer price
concessions and better
realized bill rates. What should
also be noted is that the HPPs
do a much better job of
planning both revenue and
margin. In 2020 business
planning and replanning was
seriously tested. SPI Research
is impressed at how close the
high performing firms came to meeting their financial goals. The table shows just how important proper
planning is up front, and when circumstances change, as they certainly did in 2020, PSO's must quickly
respond.
Leaders keep a lid on non-billable expenses. They have better real time information visibility, which
drives operational success, as executives can quickly see how operations are changing, and can respond
with plans to meet challenges and changes.
Table 20: High-Performance PSOs Comparison – Finance & Operations
Key Performance Indicator (KPI) HPP Rest ▲
EBITDA 18.5% 14.5% 28%
Annual revenue per billable consultant (k) $246 $186 33%
Annual revenue per employee (k) $207 $149 39%
Quarterly revenue target in backlog 50.1% 40.1% 25%
Percent of annual revenue target achieved 98.3% 89.6% 10%
Percent of annual margin target achieved 96.9% 87.6% 11%
Revenue leakage 3.56% 4.56% 22%
% of inv. redone due to error/client rejections 1.6% 1.9% 16%
Days sales outstanding (DSO) 40.5 42.4 5%
Quarterly non-billable expense per employee $1,261 $1,444 13%
Executive real-time wide visibility 4.02 3.43 17%
Source: SPI Research, February 2021

2021 Professional Services Maturity™ Benchmark
© 2021 Service Performance Insight, LLC www.timelog.dk 40
The High-Performance PSOs Use and Integrate PS Applications
Table 21 depicts the level of commercial business application use and integration for top performing
organizations versus the rest. In all dominant business applications categories, top performers invest
more in business applications and do a better job of integrating them. Because they use these
applications to run the business, they are much more satisfied with their application infrastructure. As
noted in the prior section, high performance PSO's have better information visibility. Table 21 highlights
the use of business solutions to run the business better.
In professional services, PSA is
the core solution to drive
operational results. 85% of
the top performing firms use
PSA, and nearly two-thirds
have it integrated with the
core financial management
solution, which gives
executives real-time visibility
to all aspects of business
development and service
execution along with costs.
Also important is the fact that
nearly half of the firms
surveyed integrated PSA with
the core CRM solution. This
integration is important
because the two groups that
directly interact with clients,
sales and delivery, must have
consistent information to
better plan, sell, staff and
deliver professional services.
SPI Research underscores the
importance of information integration. Visibility throughout the PSO helps tie strategy to execution with
everyone operating with the same information to achieve the same organizational goals.
High-Performance Conclusions
This year SPI Research focused on the top 20%, High-Performance PSOs. Success is in sight for all
organizations if they have a clear growth strategy and are able to translate that strategy into action. The
comparisons in this chapter highlight how leading firms perform, and demonstrates the numbers are not
out of reach for average firms. It takes dedication, insight and hard work to surmount challenges and
inertia. Change and improvement first require a realization that things are not right. Not all firms know
Table 21: High-Performance Comparison – Business Applications
Solution HPP Rest Delta
Corporate financial management solution (CFM) 95.5% 94.2% 1%
Satisfaction with financial solution 3.97 3.71 7%
Commercial CRM solution 85.6% 82.8% 3%
Satisfaction with CRM solution 4.02 3.98 1%
CRM is integrated with CFM 37.2% 40.9% -9%
Commercial PSA 85.5% 77.9% 10%
Satisfaction with PSA solution 4.03 3.85 5%
PSA is integrated with CFM 62.4% 50.0% 25%
Level of CRM and PSA Integration 46.0% 38.8% 18%
Commercial HCM solution 76.6% 67.8% 13%
Satisfaction with HCM solution 3.79 3.39 12%
HCM is integrated with CFM 30.7% 31.3% -2%
Use a commercial BI solution 55.2% 52.9% 4%
Satisfaction with BI solution 3.85 3.67 5%
BI is integrated 43.1% 37.7% 14%
Source: SPI Research, February 2021

2021 Professional Services Maturity™ Benchmark
© 2021 Service Performance Insight, LLC www.timelog.dk 41
which metrics to track so they can’t visualize success nor gauge the value of improvement. 2020 was a
wake up call for businesses around the world, top performers were able to meet the challenges head
on. They planned, replanned and dove in to take care of their employees and their clients. In turn, their
employees stayed committed and persevered despite drastic changes in their work routines. Their
clients supported them with more work and additional opportunities. This benchmark gives you and
your firm insight into the metrics it takes to drive success, use it wisely to focus on building a great
organization! Success is its own best reward!

2021 Professional Services Maturity™ Benchmark
© 2021 Service Performance Insight, LLC www.timelog.dk 42
5. Professional Services Business Applications
In a business climate driven by technology, disruption and skilled talent shortages, professional services
organizations must themselves become technology enabled. In the past, PS technology use was
confined to operations and service execution, it now has become mandatory, extending virtual
workspaces, enhancing collaboration and knowledge sharing, providing the basis for effective recruiting,
hiring and employee engagement and furnishing the tools for planning, budgeting, forecasting and
analyzing. Top performing services organizations have deployed integrated business applications across
all aspects of the business, giving them unprecedented visibility and control to see and take advantage
of business changes in real-time.
Technology understanding and use, has become a strategic imperative to exploit globalization and drive
market growth. Barriers to entry are being lowered as faster, nimbler, more technology-savvy firms
seize top clients and markets. In this climate, new entrants focused on niches, specific functions and
underserved constituents can quickly grow and make an impact on larger, more entrenched players. At
the same time, consultants are demanding easy-to-use, contextual, socially aware systems, which mimic
the applications they use in their personal lives. Mobile is no longer a nice to have, it has become a
strategic imperative to reach an increasingly global and virtual client base and workforce.
The growth engine of the world’s economy has shifted from manufacturing to project-based, people-
centric services businesses. These businesses rely on project-based Enterprise Resource Planning (ERP),
also known as Services Resource Planning (SRP) or Corporate Financial Management (CFM), applications
to manage the financial aspects of the firm. These solutions automate core business processes such as
quote-to-cash, resource and talent management, time capture and billing to provide the real-time
visibility necessary to improve organizational efficiency and effectiveness.
Services firms are uniquely people-driven organizations. They depend on the knowledge and skills of a
talented workforce to sell, staff and deliver a range of services typically on a project or contract basis.
The fundamental financial requirements of service-based businesses are very different from classic
manufacturing and supply-chain focused ERP applications as they must include functionality for
managing resources (people) and projects (tasks). Increasingly, project-based ERP application providers
also add rich talent management capabilities to support recruiting, on-boarding, compensating and
rewarding the employees who are their core asset.
As the world economy has shifted to a new “as a service” mindset, service-oriented firms are
increasingly bundling hardware, software, intellectual property and consulting into “subscription-based”
or “managed services” bundles. Today’s accounting, CRM and PSA systems must support a whole new
range of contracting, pricing, staffing and billing models. In this arena, the new breed of cloud-based
project-based ERP vendors excel as they were not only born in the cloud but so too were their
technology-intense early adopter clients. They have built in support for multi-element contracts and
subscription billing from the get-go.
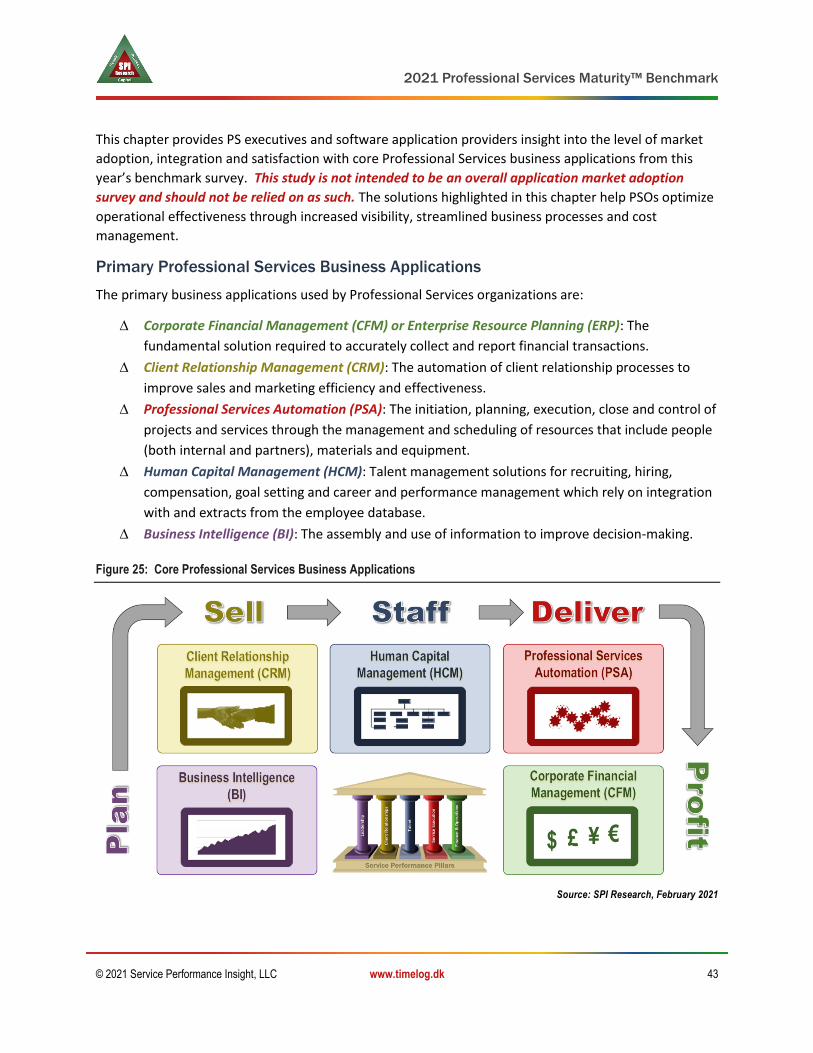
2021 Professional Services Maturity™ Benchmark
© 2021 Service Performance Insight, LLC www.timelog.dk 43
This chapter provides PS executives and software application providers insight into the level of market
adoption, integration and satisfaction with core Professional Services business applications from this
year’s benchmark survey. This study is not intended to be an overall application market adoption
survey and should not be relied on as such. The solutions highlighted in this chapter help PSOs optimize
operational effectiveness through increased visibility, streamlined business processes and cost
management.
Primary Professional Services Business Applications
The primary business applications used by Professional Services organizations are:
Corporate Financial Management (CFM) or Enterprise Resource Planning (ERP): The
fundamental solution required to accurately collect and report financial transactions.
Client Relationship Management (CRM): The automation of client relationship processes to
improve sales and marketing efficiency and effectiveness.
Professional Services Automation (PSA): The initiation, planning, execution, close and control of
projects and services through the management and scheduling of resources that include people
(both internal and partners), materials and equipment.
Human Capital Management (HCM): Talent management solutions for recruiting, hiring,
compensation, goal setting and career and performance management which rely on integration
with and extracts from the employee database.
Business Intelligence (BI): The assembly and use of information to improve decision-making.
Figure 25: Core Professional Services Business Applications
Source: SPI Research, February 2021
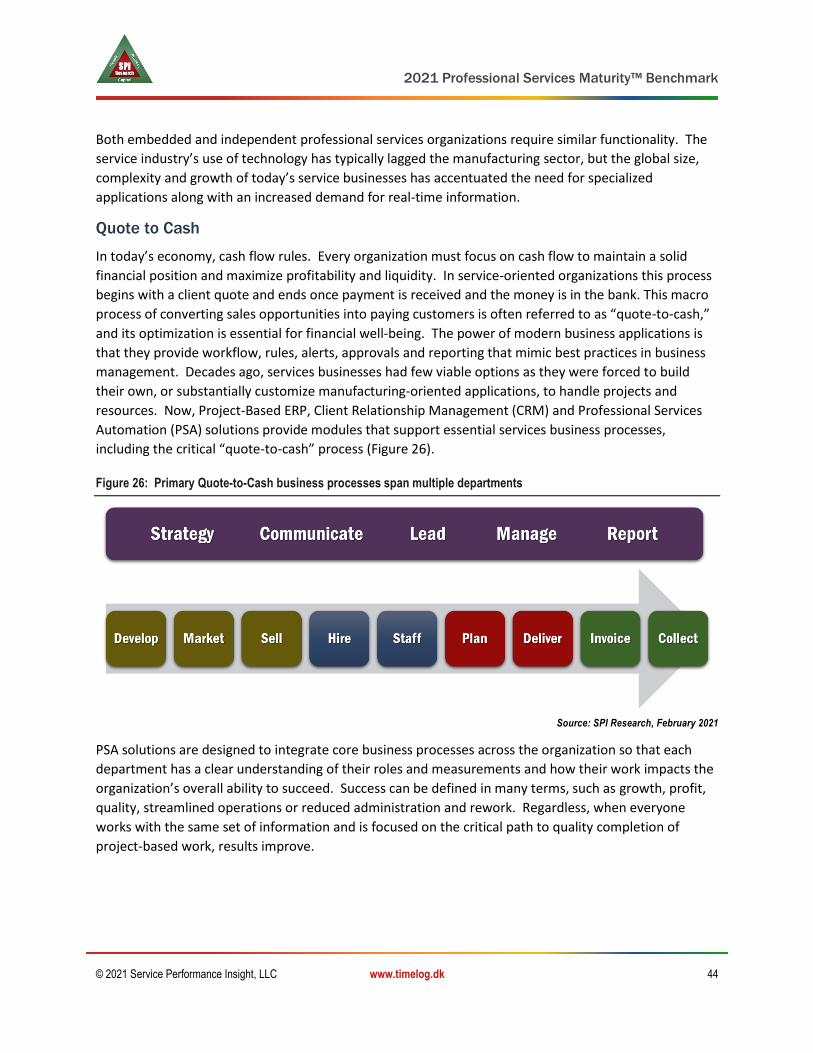
2021 Professional Services Maturity™ Benchmark
© 2021 Service Performance Insight, LLC www.timelog.dk 44
Both embedded and independent professional services organizations require similar functionality. The
service industry’s use of technology has typically lagged the manufacturing sector, but the global size,
complexity and growth of today’s service businesses has accentuated the need for specialized
applications along with an increased demand for real-time information.
Quote to Cash
In today’s economy, cash flow rules. Every organization must focus on cash flow to maintain a solid
financial position and maximize profitability and liquidity. In service-oriented organizations this process
begins with a client quote and ends once payment is received and the money is in the bank. This macro
process of converting sales opportunities into paying customers is often referred to as “quote-to-cash,”
and its optimization is essential for financial well-being. The power of modern business applications is
that they provide workflow, rules, alerts, approvals and reporting that mimic best practices in business
management. Decades ago, services businesses had few viable options as they were forced to build
their own, or substantially customize manufacturing-oriented applications, to handle projects and
resources. Now, Project-Based ERP, Client Relationship Management (CRM) and Professional Services
Automation (PSA) solutions provide modules that support essential services business processes,
including the critical “quote-to-cash” process (Figure 26).
Figure 26: Primary Quote-to-Cash business processes span multiple departments
Source: SPI Research, February 2021
PSA solutions are designed to integrate core business processes across the organization so that each
department has a clear understanding of their roles and measurements and how their work impacts the
organization’s overall ability to succeed. Success can be defined in many terms, such as growth, profit,
quality, streamlined operations or reduced administration and rework. Regardless, when everyone
works with the same set of information and is focused on the critical path to quality completion of
project-based work, results improve.

2021 Professional Services Maturity™ Benchmark
© 2021 Service Performance Insight, LLC www.timelog.dk 45
Figure 27 shows quote-to-cash is a series of interrelated processes supported by client relationship
management (CRM),
PSA and enterprise
resource corporate
financial
management (CFM)
modules. To
optimize these
fundamental business
processes, executives
rely on the
integration of essential business applications to provide visibility, transparency and control. Although
each of these applications are offered on a stand-alone basis, the true power of managing the complete
quote-to-profit business cycle is best accomplished by integrating best of breed applications together or
purchasing an integrated suite of applications.
PS Solution Adoption
In this year’s survey, commercial adoption declined in the primary business applications of CFM, CRM
and PSA while adoption increased in HCM and BI. In 2020 every organization was challenged to budget,
plan and replan throughout
the year as the pandemic
ravaged certain business
segments and accelerated
others. SPI’s clients
emphasized the importance of
business and capacity planning
tools like Workday’s Adaptive
Planning to help then navigate
a challenging year. HCM
usage also accelerated as
more and more firms realize
the benefits of integrating payroll with recruiting and skill building. The new killer application will be
integrating HCM with PSA to give employers and employees visibility to upcoming projects and the skills
they need to be part of them. The abundance of high quality, affordable cloud-based solutions has
enabled greater numbers of PSOs to adopt commercial business applications, yet a surprisingly large
number of firms still rely on antiquated homegrown applications and spreadsheets. Excel and Google
sheets remain the most-used business applications.
Cloud-based applications are outselling non-cloud by a factor of ten-to-one. Cloud solutions are
especially important in the professional services sector, as today’s virtual consulting organizations may
have skilled employees located across the globe, not collocated in physical offices. The cloud has
Figure 27: Quote-to-cash process
Source: SPI Research, February 2021
Table 22: Commercial Solution Adoption
Solution 2018 2019 2020
Corporate Financial Management (CFM) 96.6% 94.8% 94.4%
Client Relationship Management (CRM) 83.5% 86.7% 83.4%
Professional Services Automation (PSA) 76.2% 84.8% 79.0%
Human Capital Management (HCM) 61.2% 68.1% 69.7%
Business Intelligence (BI) 47.0% 44.7% 53.4%
Source: SPI Research, February 2021
2021 Professional Services Maturity™ Benchmark
© 2021 Service Performance Insight, LLC www.timelog.dk 46
enabled PS executives and workers at all levels greater mobile access to the information they need to
improve visibility and management control of resources and projects.
CRM adoption surpassed PSA adoption seven years ago, when cloud-based CRM applications, primarily
from Salesforce.com, became the standard. CRM usage is often misleading as firms may only purchase a
limited number of sales seats whereas they require PSA functionality (and licenses) for all billable
members of the organization. More and more firms are also investing in Marketing Automation to
generate leads, track prospects and build the brand. Corporate Performance Management applications
for capacity and resource planning along with budgeting and forecasting are becoming essential as are
communication and collaboration platforms like Slack, Jira, Microsoft Teams and Zoom.
This year we saw a decline in commercial PSA adoption from 84.8% to 79%. The reason for this is that
many PSOs are moving to integrated financial solutions away from standalone PSA. SPI’s benchmarking
studies show the undeniable impact PSA has on all aspects of service execution. Effective resource
management manifests in better staff retention, higher levels of billable utilization and significant
improvements in on-time, on-budget project delivery. Time and expense capture and billing simply
cannot be managed effectively with antiquated spreadsheets.
Human Capital Management (HCM) applications have experienced the greatest growth in PS adoption
in recent years. As new cloud based powerful HCM applications have come to market expect to see
adoption continue to rise to equal or even surpass PSA. It only makes sense that people, the crown
jewels of the consulting profession, will benefit from applications which empower employees to manage
their own skill and career development. Further, HCM solutions provide benefits in improved recruiting
and learning management which can be significant as the average PSO spends more than 1% of total
revenue on recruiting and another 1 to 2% on training. HCM applications are starting to provide
powerful learning management platforms so employees have a single system of record to enhance skills
and manage certifications and credentials.
Remote service delivery and collaboration tools have become prevalent, enabling consultants to work
on client projects and machines from anywhere. One could characterize 2020 as the year of Zoom with
300 million daily Zoom participants powering the new virtual world. These powerful tools have ushered
in the wave of virtual service delivery which has radically improved consulting productivity.
Interestingly, knowledge management still lags other application areas despite the productivity and
quality improvements it provides. A plethora of open-source knowledge and collaboration solutions are
starting to encroach on Microsoft’s SharePoint and Teams as the dominant knowledge management
tool with SLACK and Jira topping the list. Stand-alone BI applications are losing market-share across the
PS industry because new Artificial Intelligence, Reporting and Analytic functionality is now built into core
CFM business applications, erasing the need to buy a standalone Business Intelligence solution. In 2020,
capacity and business planning tools were essential to help businesses understand and react to market
changes.
Each year SPI Research’s Professional Services Maturity™ Benchmark quantifies the benefits achieved
by services organizations with solutions that integrate Client Relationship Management and financial
processes, Human Capital Management and financial processes, and Professional Services Automation

2021 Professional Services Maturity™ Benchmark
© 2021 Service Performance Insight, LLC www.timelog.dk 47
and financial processes. Of course, the systems themselves are only part of a broader firm-wide
commitment to behavioral change that fosters collaboration and enhanced communication,
coordination and quality management.
Figure 28 compares the adoption of commercial solutions versus homegrown, and organizations that
still rely on spreadsheets. Fewer than 5% of the organizations surveyed do not yet have a formal CFM or
accounting solution, meaning they probably use Excel and email to run the business.
Figure 28: Commercial Solution Adoption
Source: SPI Research, February 2021
Table 23 compares business solution adoption and satisfaction along with the level of financial
management (ERP) integration. The Americas usage of ERP surpasses that of EMEA and APAC. Recently
European and Asia Pacific headquartered firms have made big investments in PSA. APac PSA usage now
surpasses the Americas and EMEA is catching up. Application satisfaction is highly correlated with
usage. Typically, application satisfaction improves as business applications become more widely
adopted. CFM and PSA satisfaction surpassed all other solutions this year while CRM satisfaction took a
nose-dive. The majority of firms in this benchmark use Salesforce CRM. They are becoming
disenchanted with its high price and bloated functionality. HCM continues to receive the lowest overall
satisfaction ratings because our research shows much of HCM’s functionality has not been fully
deployed or adopted. Effective HCM usage requires effective talent management processes including
change management along with leadership training and development. Unfortunately, the role of human
resources has not yet become strategic for many consultancies.
The level of solution adoption is much higher within embedded PS organizations. The table shows CRM
is significantly more prevalent in embedded service organizations than in independents (PSOs), but this
is to be expected because embedded service organizations (ESOs) tend to be larger and have a strong

2021 Professional Services Maturity™ Benchmark
© 2021 Service Performance Insight, LLC www.timelog.dk 48
product-oriented sales force who are responsible for bringing services into deals. Product companies
tend to value and invest more in IT than independent service providers.
Table 23: Business Application Use by Organization Type and Geographic Region
Key Performance Indicator (KPI) 2020 ESO PSO Americas EMEA APac
Commercial CFM solution used 94.4% 95.9% 93.8% 95.0% 91.7% 93.5%
Satisfaction with CFM solution 3.77 3.64 3.83 3.78 3.66 3.90
Commercial CRM solution 83.4% 92.2% 79.4% 83.6% 85.7% 75.9%
Satisfaction with CRM solution 3.98 4.13 3.91 4.00 4.11 3.52
CRM is integrated with CFM 40.2% 51.7% 34.4% 40.9% 38.5% 35.0%
Commercial PSA solution 79.5% 84.5% 77.3% 79.6% 76.6% 86.2%
Satisfaction with PSA solution 3.89 3.81 3.93 3.87 4.08 3.81
PSA is integrated with CFM 52.7% 46.4% 55.8% 52.9% 50.0% 55.8%
Commercial HCM solution 69.7% 79.0% 65.4% 69.6% 73.2% 62.1%
Satisfaction with HCM solution 3.48 3.47 3.48 3.53 3.41 3.00
HCM is integrated with CFM 31.2% 31.0% 31.3% 32.5% 25.4% 28.6%
Commercial BI solution 53.4% 59.5% 50.6% 54.0% 53.8% 44.4%
Satisfaction with BI solution 3.71 3.79 3.66 3.73 3.74 3.33
BI is integrated with CFM 38.8% 44.3% 35.9% 40.2% 38.9% 21.1%
CRM / PSA integration 40.4% 53.4% 34.4% 41.2% 38.8% 33.3%
Source: SPI Research, February 2021
As one might expect, Table 24 shows higher levels of solution adoption as organizations expand. And for
the most part, greater solution integration with core financials also increases as organizations get larger.
Even with the proliferation of affordable and easy-to-use cloud solutions, the smallest organizations will
always lag in their adoption rates. SPI Research has seen adoption increase in all size organizations. This
table highlights the importance professional services organizations have placed on building a strong
financial application infrastructure to enhance visibility and management control resulting in higher
productivity and profit.
Table 24: Business Application Use by Organization Size
Key Performance Indicator (KPI) Under 10 10 - 30 31 - 100 101 - 300 301 - 700 Over 700
Commercial CFM solution used 80.3% 89.8% 98.2% 96.4% 97.9% 100.0%
Satisfaction with CFM solution 3.91 3.93 3.71 3.90 3.55 3.43
Commercial CRM solution 63.2% 81.3% 85.0% 87.3% 93.9% 91.7%
Satisfaction with CRM solution 3.82 3.96 3.99 4.06 4.00 4.04

2021 Professional Services Maturity™ Benchmark
© 2021 Service Performance Insight, LLC www.timelog.dk 49
Key Performance Indicator (KPI) Under 10 10 - 30 31 - 100 101 - 300 301 - 700 Over 700
CRM is integrated 31.3% 23.5% 34.3% 57.4% 55.0% 48.8%
Commercial PSA solution 51.8% 74.0% 84.5% 87.6% 79.1% 88.9%
Satisfaction with PSA solution 3.82 4.04 3.98 3.95 3.42 3.76
PSA is integrated 24.3% 42.1% 51.2% 71.7% 55.1% 58.5%
Commercial HCM solution 32.8% 53.1% 69.4% 85.4% 92.3% 94.3%
Satisfaction with HCM solution 3.17 3.70 3.45 3.42 3.41 3.65
HCM is integrated 18.8% 28.6% 25.9% 32.6% 40.3% 45.6%
Commercial BI solution 31.0% 33.3% 52.1% 67.0% 76.3% 76.0%
Satisfaction with BI solution 3.67 3.80 3.58 3.89 3.50 3.71
BI is integrated 23.5% 30.4% 38.3% 42.6% 35.5% 59.2%
CRM / PSA integration 21.1% 27.3% 43.9% 55.3% 45.5% 41.8%
Source: SPI Research, February 2021
Table 25 shows embedded services organizations (Software/SaaS/Hardware PS) have higher adoption
rates than independents in almost all categories. Generally, these organizations are part of a larger
technology-focused product organization, larger organizations tend to rely more heavily on business
applications to improve performance. Architects and Engineers and Management Consultancies
reported lower levels of application usage across most categories except core financials which they rely
on to run the business. This is clearly an improvement area for these segments.
Table 25: Business Application Use by Vertical Service Market
Key Performance Indicator (KPI) IT
Consult Mgmt.
Consult. SaaS PS
Software PS
Arch./ Engr.
Commercial CFM solution used 95.1% 92.8% 95.2% 96.3% 100.0%
Satisfaction with CFM solution 3.91 4.14 3.53 3.75 3.53
Commercial CRM solution 86.6% 83.1% 96.7% 89.4% 53.1%
Satisfaction with CRM solution 4.03 4.11 4.08 4.22 3.32
CRM is integrated 32.7% 35.3% 57.6% 48.9% 35.0%
Commercial PSA solution 87.0% 67.5% 91.8% 88.0% 51.6%
Satisfaction with PSA solution 4.07 4.08 3.87 4.00 3.73
PSA is integrated 61.0% 49.2% 43.1% 43.0% 52.9%
Commercial HCM solution 68.0% 59.2% 85.2% 84.8% 50.0%
Satisfaction with HCM solution 3.52 3.55 3.51 3.57 3.56
HCM is integrated 32.9% 31.3% 33.0% 20.2% 28.9%

2021 Professional Services Maturity™ Benchmark
© 2021 Service Performance Insight, LLC www.timelog.dk 50
Key Performance Indicator (KPI) IT
Consult Mgmt.
Consult. SaaS PS
Software PS
Arch./ Engr.
Commercial BI solution 49.6% 54.7% 55.9% 61.7% 41.4%
Satisfaction with BI solution 3.69 3.85 3.92 3.64 3.47
BI is integrated 35.8% 44.4% 43.4% 41.7% 50.0%
CRM / PSA integration 39.7% 37.0% 68.9% 50.0% 16.1%
Source: SPI Research, February 2021
Table 26 shows a mixed bag of business application use by marketing, VARs, Accountancies, Managed
Service providers and other PS. Managed Service providers reported the lowest use of PSA as they rely
on managed service subscription billing and entitlement platforms like Servicenow, Zuora and
Connectwise. Managed Service providers take the least advantage of commercial business applications
in comparison to all other PS verticals.
Table 26: Business Application Use by Vertical Service Market Continued
Key Performance Indicator (KPI) Marcom VAR Account. Mgd. Serv. Other PS
Commercial CFM solution used 93.3% 100.0% 100.0% 84.6% 91.4%
Satisfaction with CFM solution 3.78 3.41 3.33 4.08 3.59
Commercial CRM solution 78.3% 100.0% 72.7% 75.0% 79.1%
Satisfaction with CRM solution 3.77 4.12 4.10 4.00 3.81
CRM is integrated 32.5% 46.9% 65.0% 38.9% 36.0%
Commercial PSA solution 80.8% 76.5% 81.8% 58.3% 78.7%
Satisfaction with PSA solution 3.75 3.36 3.10 3.78 3.73
PSA is integrated 50.0% 50.0% 55.0% 50.0% 57.1%
Commercial HCM solution 60.9% 70.6% 72.7% 41.7% 74.7%
Satisfaction with HCM solution 3.50 3.08 3.33 3.63 3.37
HCM is integrated 28.1% 33.3% 43.8% 50.0% 31.9%
Commercial BI solution 56.5% 62.5% 54.5% 45.5% 53.9%
Satisfaction with BI solution 3.86 3.82 3.44 3.86 3.56
BI is integrated 34.6% 41.7% 35.7% 50.0% 30.5%
CRM / PSA integration 32.7% 44.1% 31.8% 16.7% 34.0%
Source: SPI Research, February 2021
Solution Satisfaction
Table 27 shows application satisfaction (1: very dissatisfied to 5: very satisfied). Satisfaction with CRM
tops the list followed by PSA and CFM. By vertical, Management Consultancies give the highest
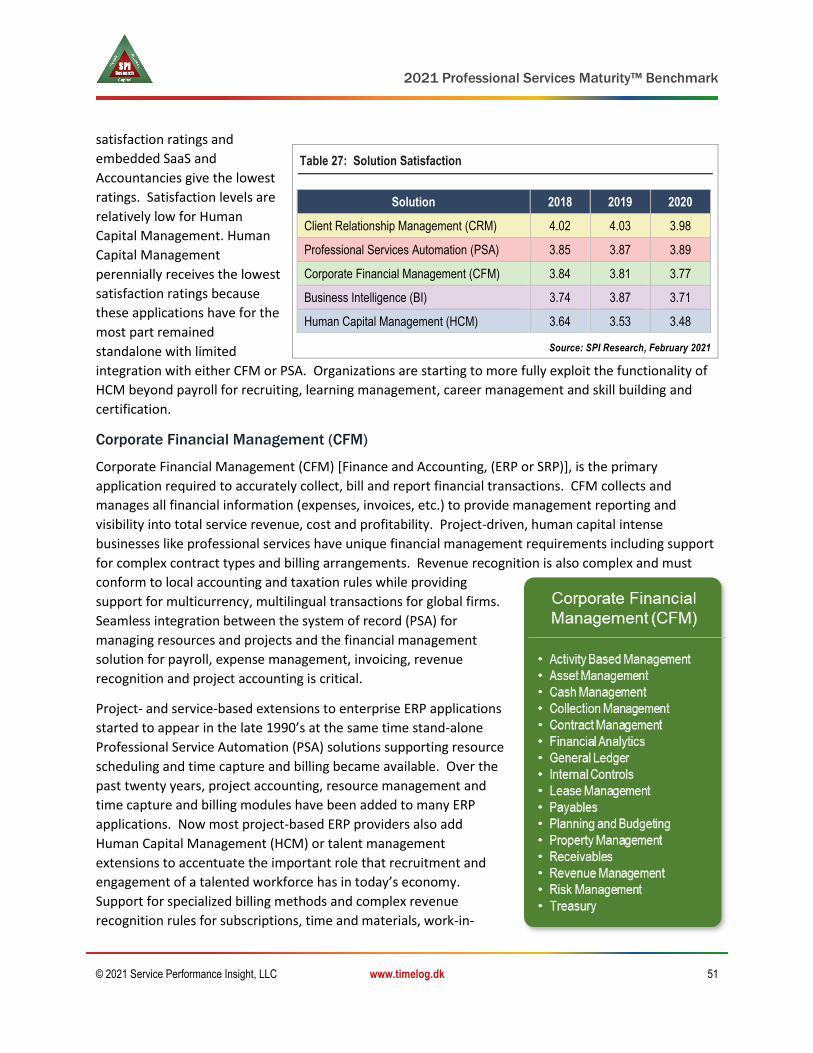
2021 Professional Services Maturity™ Benchmark
© 2021 Service Performance Insight, LLC www.timelog.dk 51
satisfaction ratings and
embedded SaaS and
Accountancies give the lowest
ratings. Satisfaction levels are
relatively low for Human
Capital Management. Human
Capital Management
perennially receives the lowest
satisfaction ratings because
these applications have for the
most part remained
standalone with limited
integration with either CFM or PSA. Organizations are starting to more fully exploit the functionality of
HCM beyond payroll for recruiting, learning management, career management and skill building and
certification.
Corporate Financial Management (CFM)
Corporate Financial Management (CFM) [Finance and Accounting, (ERP or SRP)], is the primary
application required to accurately collect, bill and report financial transactions. CFM collects and
manages all financial information (expenses, invoices, etc.) to provide management reporting and
visibility into total service revenue, cost and profitability. Project-driven, human capital intense
businesses like professional services have unique financial management requirements including support
for complex contract types and billing arrangements. Revenue recognition is also complex and must
conform to local accounting and taxation rules while providing
support for multicurrency, multilingual transactions for global firms.
Seamless integration between the system of record (PSA) for
managing resources and projects and the financial management
solution for payroll, expense management, invoicing, revenue
recognition and project accounting is critical.
Project- and service-based extensions to enterprise ERP applications
started to appear in the late 1990’s at the same time stand-alone
Professional Service Automation (PSA) solutions supporting resource
scheduling and time capture and billing became available. Over the
past twenty years, project accounting, resource management and
time capture and billing modules have been added to many ERP
applications. Now most project-based ERP providers also add
Human Capital Management (HCM) or talent management
extensions to accentuate the important role that recruitment and
engagement of a talented workforce has in today’s economy.
Support for specialized billing methods and complex revenue
recognition rules for subscriptions, time and materials, work-in-
Table 27: Solution Satisfaction
Solution 2018 2019 2020
Client Relationship Management (CRM) 4.02 4.03 3.98
Professional Services Automation (PSA) 3.85 3.87 3.89
Corporate Financial Management (CFM) 3.84 3.81 3.77
Business Intelligence (BI) 3.74 3.87 3.71
Human Capital Management (HCM) 3.64 3.53 3.48
Source: SPI Research, February 2021
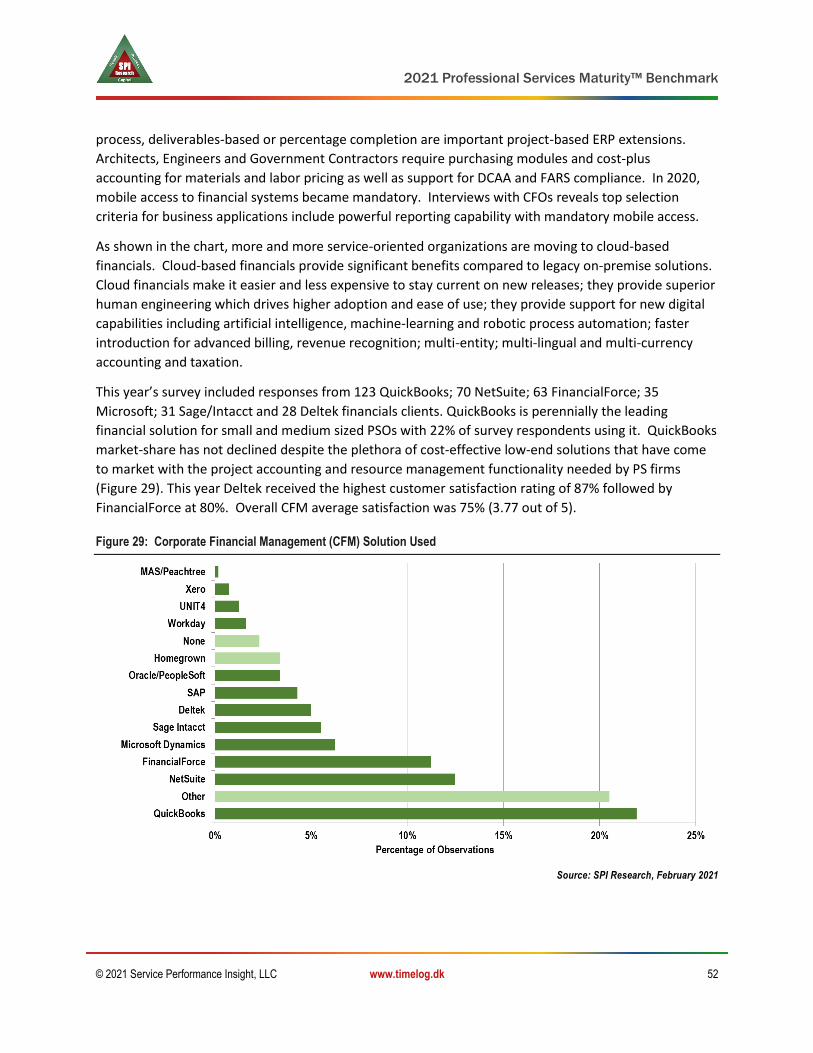
2021 Professional Services Maturity™ Benchmark
© 2021 Service Performance Insight, LLC www.timelog.dk 52
process, deliverables-based or percentage completion are important project-based ERP extensions.
Architects, Engineers and Government Contractors require purchasing modules and cost-plus
accounting for materials and labor pricing as well as support for DCAA and FARS compliance. In 2020,
mobile access to financial systems became mandatory. Interviews with CFOs reveals top selection
criteria for business applications include powerful reporting capability with mandatory mobile access.
As shown in the chart, more and more service-oriented organizations are moving to cloud-based
financials. Cloud-based financials provide significant benefits compared to legacy on-premise solutions.
Cloud financials make it easier and less expensive to stay current on new releases; they provide superior
human engineering which drives higher adoption and ease of use; they provide support for new digital
capabilities including artificial intelligence, machine-learning and robotic process automation; faster
introduction for advanced billing, revenue recognition; multi-entity; multi-lingual and multi-currency
accounting and taxation.
This year’s survey included responses from 123 QuickBooks; 70 NetSuite; 63 FinancialForce; 35
Microsoft; 31 Sage/Intacct and 28 Deltek financials clients. QuickBooks is perennially the leading
financial solution for small and medium sized PSOs with 22% of survey respondents using it. QuickBooks
market-share has not declined despite the plethora of cost-effective low-end solutions that have come
to market with the project accounting and resource management functionality needed by PS firms
(Figure 29). This year Deltek received the highest customer satisfaction rating of 87% followed by
FinancialForce at 80%. Overall CFM average satisfaction was 75% (3.77 out of 5).
Figure 29: Corporate Financial Management (CFM) Solution Used
Source: SPI Research, February 2021

2021 Professional Services Maturity™ Benchmark
© 2021 Service Performance Insight, LLC www.timelog.dk 53
Client Relationship Management (CRM)
CRM supports the management of client relationships and is
designed to improve sales and marketing effectiveness. CRM
automates lead, contact and campaign management, sales pipeline,
territory and contract management. Many CRM applications also
provide powerful call center functionality for issue management;
call handling; trouble ticketing and problem resolution. CRM allows
PSOs to track clients through the engagement (bid to bill) lifecycle,
and to specifically target customer segments and offers by
understanding details of the relationship. CRM supports analysis by
client, geography and portfolio. CRM is the system of record for
client contacts, relationships and contracts.
Figure 30 shows Salesforce.com dominance once again with use by 50% (226) of the organizations
surveyed. Sage/Intacct has gained share to move into 2nd place, followed by Microsoft. Salesforce
dominance in the PS industry is slipping somewhat from 60% market share last year but Salesforce
satisfaction is the highest at 84% compared to an overall CRM satisfaction rating of 79.6% (3.98 of 5).
Figure 30: Client Relationship Management (CRM) Solution Used
Source: SPI Research, February 2021
Table 28 compares organizations using CRM to those who do not. 16.6% of the organizations surveyed
do not use any type of CRM solution. As the table shows, CRM benefits organizations in terms of
growth. CRM users experienced significantly greater revenue and headcount growth. They have larger
sales pipelines, more revenue from new clients and more backlog. CRM users report larger, more
profitable projects resulting in significantly more revenue per consultant and employee. Improved sales

2021 Professional Services Maturity™ Benchmark
© 2021 Service Performance Insight, LLC www.timelog.dk 54
effectiveness leads to a more
efficient use of resources
down the line. Profitability is
clearly enhanced when CRM is
integrated with PSA and the
CFM application.
This table highlights the
benefits organizations receive
as they move from no CRM to
nonintegrated CRM to
integrated CRM with
significantly higher growth,
especially in their ability to
land new clients. With a
stronger sales pipeline,
revenue yields soar for billable
consultants because there is a predictable and steady stream of work. These benefits underscore the
importance of providing greater visibility and improved alignment between sales and service delivery.
These benefits are amplified as organizations grow.
According to Salesforce
research on the impact of CRM
on the professional services
industry, “sixty percent of
business development
professionals say they spend
too much time logging
activities like emails and
phone calls. Almost as many
(58%) say the same thing
about logging sales data and
client notes, while 57% say
they spend too much time
generating quotes and
proposals and gaining
approvals.” Deal structure, pricing and staffing all require tight integration between CRM and PSA
applications to ensure sales and service delivery are in synch, focused on the right opportunities that
take best advantage of skills, capabilities and resources.
Table 28: Impact – Client Relationship Management (CRM) Use
Key Performance Indicator (KPI) CRM Used
CRM Not Used ▲
Survey responses (commercial CRM) 83.4% 16.6%
Year-over-year change in PS revenue 8.8% 7.2% 21%
Year-over-year change in PS headcount 5.3% 5.0% 7%
New client % of revenue 26.3% 19.5% 35%
Deal pipeline / quarterly bookings forecast 184% 161% 14%
Quarterly revenue target in backlog 44.1% 38.8% 13%
Quarterly revenue target in backlog 44.1% 38.8% 13%
Project margin 36.3% 34.5% 5%
Source: SPI Research, February 2021
Table 29: Impact – Commercial CRM Integration
Key Performance Indicator (KPI) CRM Not
Used Used, Not Integrated
Used, Integrated
Survey responses (commercial CRM) 17.6% 34.9% 47.5%
Year-over-year change in PS revenue 7.2% 8.5% 9.0%
Year-over-year change in PS headcount 5.0% 4.1% 6.3%
New client % of revenue 23.3% 25.3% 31.6%
Deal pipeline / qtr. bookings forecast 161% 173% 193%
Quarterly revenue target in backlog 38.8% 44.5% 44.8%
Project duration (man-months) 20.4 21.2 24.8
Source: SPI Research, February 2021

2021 Professional Services Maturity™ Benchmark
© 2021 Service Performance Insight, LLC www.timelog.dk 55
Professional Services Automation (PSA)
Professional Services Automation provides the systems basis for
initiation, planning, resource management, scheduling, execution,
close and control of projects and services. PSA provides a resource
and project dashboard including the demand forecast. It helps
manage service delivery by overseeing opportunities, staffing,
project management, and collaboration. PSA is typically the system
of record for resource skills, competencies and preferences with
integration to the employee and contractor database. It is used to
collect time and expense by project and resource down to the task
level, so it is the system of record for resource utilization and
project cost and estimating.
Most PSA applications now offer billing modules with some level of revenue recognition by type of
billing method – time and materials, work in process or fixed price. They also support accurate time and
expense capture. PSA extensions for the construction industry include modules for material costs and
procurement. Although PSA is still focused on enabling project- and services-driven organizations to
better plan, staff, execute and collect all relevant information related to projects, it has become much
more than that. It has become the core solution for business planning with a view of the best projects,
best clients, best services and best people to translate the business plan into reality.
This year adoption of a commercial PSA declined from 84.8% to 79.5%. PSA satisfaction improved year
over year with a satisfaction rating of 3.89 out of 5 (77%). All key metrics improve with the use of PSA.
Figure 31: Professional Services Automation (PSA) Solution Used
Source: SPI Research, February 2021

2021 Professional Services Maturity™ Benchmark
© 2021 Service Performance Insight, LLC www.timelog.dk 56
Figure 31 shows FinancialForce garnered first place this year as the most adopted PSA solution with
approximately 22% (116 firms) of the survey. Projector is the second-most prevalent solution with 11%
(57 firms). Mavenlink is third with 8.3% (49 firms) and Kimble is fourth with 7.9% (41 firms). NetSuite is
fifth with 3.7% (19 firms). None (20.3% or 105 firms) and other (15.1% or 78 firms) are still two of the
most prevalent answers. Projector wins top honors for client satisfaction with 92.8% satisfaction.
FinancialForce is second in client satisfaction at 81%. Interestingly, the average size of the organizations
that do not use a PSA is quite large at 416 PS employees. As the PSA market has matured, SPI Research
sees solution providers coalescing by ecosystem. FinancialForce, Kimble, Mavenlink and Klient/Krow are
part of the Salesforce ecosystem and AppExchange. Microsoft Dynamics, Timelog and
UNIT4/Assistance PSA are focused on the Microsoft platform. NetSuite is now owned by Oracle and is
moving its applications to Oracle’s Cloud Infrastructure. Workday and Deltek have created their own
ecosystems.
Table 30 compares PSOs using
PSA solutions to those that do
not. The results in this table
are very powerful.
Professional Services
Automation solutions continue
to drive significant operational
performance benefits, yielding
higher revenue and profit for
professional services
organizations. The use of PSA
is on the rise due to the need
to better manage projects and
resources, especially in more
technical disciplines, as it has
become increasingly difficult
to find, hire, retain and deploy
talent. PSA solutions help match the right resources, with the right skills at the right time to the right
projects. PSA solutions yield several core benefits to PSOs, but most executives only need to look to
the 3% increase in billable utilization as a primary reason to select PSA. Just start to multiply what a
3% improvement in utilization means to revenue improvements. For a 100-person PS organization, 3%
translates to 6,000 more billable hours per year. With average bill rates of $200 per hour, the PSO can
produce $1.2M in incremental revenue! Almost all key metrics improve with PSA adoption. As shown in
the table these systems pay for themselves with substantially higher consultant revenue yields, better
project margins and more bottom-line EBITDA profit.
Table 31 highlights the benefits of integrated PSA versus standalone PSA. Again, the results demonstrate
integrated PSA enables organizations to operate at higher levels of efficiency. Perhaps most notable in
Table 30: Impact – Professional Services Automation (PSA) Use
Key Performance Indicator (KPI) PSA Used
PSA Not Used ▲
Survey responses (commercial PSA) 79.5% 20.5%
Year-over-year change in PS revenue 8.5% 7.5% 14%
Year-over-year change in PS headcount 6.3% 2.1% 204%
Use a standardized delivery methodology 67.6% 60.1% 12%
Employee billable utilization 71.9% 70.0% 3%
Quarterly revenue target in backlog 45.3% 35.4% 28%
Annual revenue per billable consultant (k) $209 $180 16%
Annual revenue per billable employee (k) $169 $149 13%
Project margin 35.8% 35.3% 1%
Source: SPI Research, February 2021

2021 Professional Services Maturity™ Benchmark
© 2021 Service Performance Insight, LLC www.timelog.dk 57
this table is the fact that PSA
users reported almost double
the headcount growth of non-
users because they were far
more successful throughout
the challenging year of 2020.
Because the delivery of
services is where PSOs make
their money, and because PSA
is the primary application used
by project managers and
others responsible for services
delivery, it is easy to
understand why the
operational and financial
benefits are so significant. SPI
Research has always
recommended organizations with more than 20 employees utilize PSA. With the affordable cloud-based
solutions now available, PSA should also be considered by smaller organizations.
Human Capital Management (HCM)
Human Capital Management (HCM) solutions (also known as talent
management solutions) give employers the tools to effectively
recruit, hire, onboard, train, evaluate and compensate employees. By
tracking performance, skills and career progression, HCM helps
companies create and maintain a high-performance workforce. Key
software modules include payroll, recruiting, employee learning, skills
tracking and certifications, compensation, performance management,
policy compliance, and succession planning — each of which help
organizations manage personnel growth and development.
HCM benefits the PSO by maintaining a database of skills, benefits
and pay rate information that is used for resource scheduling, recruiting and performance and career
management. HCM solutions provide rich applications that allow consultants to manage their own
careers and skill development (training) and bid on the projects of greatest interest for them. HCM
applications may also include workforce management functionality for time capture, time off and time
and attendance tracking including workforce forecasting, budgeting and scheduling. Employee and
manager self-service are now embedded roles in HCM business processes. Mobile access has become a
fundamental component of HCM to support virtual operations, approvals and reporting.
Figure 32 shows that HCM has made significant strides in PS adoption. Five years ago, HCM was used by
less than one-third of PSOs – now it is used by 69.7% of them although “other” and “none” still have top
Table 31: Impact – Commercial PSA Integration
Key Performance Indicator (KPI) PSA Not
Used Used, Not Integrated
Used, Integrated
Survey responses (commercial PSA) 29.2% 27.3% 43.5%
Annual company revenue (mm) $71.6 $136.1 $166.3
Year-over-year change in PS headcount 2.1% 6.4% 6.8%
Bid-to-win ratio (per 10 bids) 4.85 5.33 5.33
Deal pipeline / qtr. bookings forecast 151% 163% 196%
Well-understood career path for all emp. 3.15 3.15 3.41
Project staffing time (days) 11.37 9.97 9.36
Number of projects delivered per year 132 186 661
Executive real-time wide visibility 3.39 3.43 3.78
Source: SPI Research, February 2021
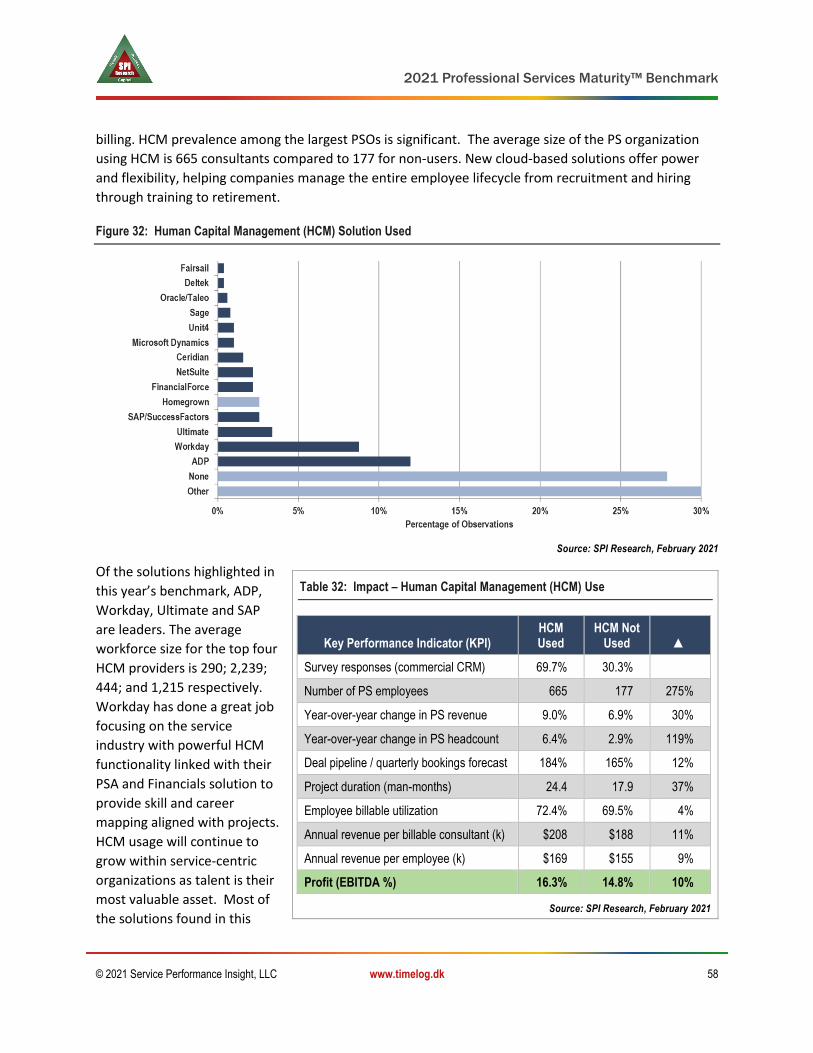
2021 Professional Services Maturity™ Benchmark
© 2021 Service Performance Insight, LLC www.timelog.dk 58
billing. HCM prevalence among the largest PSOs is significant. The average size of the PS organization
using HCM is 665 consultants compared to 177 for non-users. New cloud-based solutions offer power
and flexibility, helping companies manage the entire employee lifecycle from recruitment and hiring
through training to retirement.
Figure 32: Human Capital Management (HCM) Solution Used
Source: SPI Research, February 2021
Of the solutions highlighted in
this year’s benchmark, ADP,
Workday, Ultimate and SAP
are leaders. The average
workforce size for the top four
HCM providers is 290; 2,239;
444; and 1,215 respectively.
Workday has done a great job
focusing on the service
industry with powerful HCM
functionality linked with their
PSA and Financials solution to
provide skill and career
mapping aligned with projects.
HCM usage will continue to
grow within service-centric
organizations as talent is their
most valuable asset. Most of
the solutions found in this
Table 32: Impact – Human Capital Management (HCM) Use
Key Performance Indicator (KPI) HCM Used
HCM Not Used ▲
Survey responses (commercial CRM) 69.7% 30.3%
Number of PS employees 665 177 275%
Year-over-year change in PS revenue 9.0% 6.9% 30%
Year-over-year change in PS headcount 6.4% 2.9% 119%
Deal pipeline / quarterly bookings forecast 184% 165% 12%
Project duration (man-months) 24.4 17.9 37%
Employee billable utilization 72.4% 69.5% 4%
Annual revenue per billable consultant (k) $208 $188 11%
Annual revenue per employee (k) $169 $155 9%
Profit (EBITDA %) 16.3% 14.8% 10%
Source: SPI Research, February 2021

2021 Professional Services Maturity™ Benchmark
© 2021 Service Performance Insight, LLC www.timelog.dk 59
benchmark are provided by financial solution providers, who offer HCM integration with financials to
support workforce planning, costing and reporting. Talent management is central to PS performance as
the skills and attitudes of the consulting workforce provide tangible evidence of consulting value. And
with better management of personnel, PSOs can ensure talent is on staff and available when needed,
which helps the organization grow faster.
HCM solutions, in conjunction
with PSA, drive greater billable
utilization, which results in
higher revenue per employee
and profitability. Most of the
new breed of cloud-based
HCM applications offer mobile
access from anywhere, making
it easy for employees to keep
their profiles and time-off
requests up-to-date. Several
HCM vendors are adding rich
predictive analytics, providing
visibility into levels of
employee engagement to
provide early warning for
employees who are likely to
quit. Their recruiting tools are
very powerful with out-of-the-
box integration to all the top job sites.
Business Intelligence (BI)
Business Intelligence integrates information from core business
applications to improve strategic analysis, demand and capacity
planning, budgeting, forecasting and financial planning. BI solutions
continue to increase adoption in PSOs, whether they are offered as
stand-along tools or part of the business applications themselves for
reporting and analysis. As professional services organizations
mature, BI becomes a more critical tool to provide real-time
visibility to all aspects of the operation — allowing executives to
spot trends and take corrective action early. It also is an important
solution for annual planning, as PS executives try to uncover areas where additional growth and profit
can be extracted.
Just as we have seen in all other categories, the legacy Business Intelligence stalwarts are being
challenged and eclipsed by hungry new, born-in-the-cloud contenders like Snowflake, Tableau (now part
Table 33: Impact – Commercial HCM Integration
Key Performance Indicator (KPI) HCM Not
Used Used, Not Integrated
Used, Integrated
Survey responses (commercial CRM) 41.0% 42.9% 16.0%
Size of PS organization (employees) 177 437 847
Year-over-year change in PS revenue 6.9% 7.3% 10.6%
Project duration (man-months) 17.9 23.0 30.9
Employee billable utilization 69.5% 72.2% 75.6%
Revenue per project (k) $116 $145 $211
Annual revenue per billable consultant (k) $188 $206 $229
Annual revenue per employee (k) $155 $168 $175
Percent of annual revenue target achieved 89.1% 91.6% 93.3%
Percent of annual margin target achieved 87.7% 90.2% 92.2%
Source: SPI Research, February 2021

2021 Professional Services Maturity™ Benchmark
© 2021 Service Performance Insight, LLC www.timelog.dk 60
of Salesforce) and Looker (now part of Google Analytics). At the same time every major software
provider is looking to add Artificial Intelligence and advanced Data Analytics to their platforms. The
winners will be those that combine power with ease of use and the ability to easily integrate and
transverse vast amounts of data across platforms.
Figure 33: Business Intelligence (BI) Solution Used
Source: SPI Research, February 2021
Figure 33 shows relatively low
adoption levels of Business
Intelligence in this year's
survey, similar to previous
results. None, Microsoft,
other and homegrown are the
most prevalent BI solutions.
Of the application suite
providers, Workday/Adaptive
Insights; NetSuite/Oracle/
Hyperion; IBM/Cognos/SPSS
and SAP/ Business Objects
each have a wide following.
The results in Table 34
highlight some of the core
benefits organizations have achieved that use BI solutions. While each improvement is impressive,
growth in revenues and headcount and size of the deal pipeline stand out. The fact is BI is a strategic
solution that helps PSOs plan, budget and forecast the business. Its powerful “what if” analysis tools
help PSOs model capacity and resource plans to achieve optimal results.
Table 34: Impact – Business Intelligence (BI) Use
Key Performance Indicator (KPI) BI
Used BI Not Used ▲
Survey responses (commercial CRM) 53.4% 46.6%
Size of PS organization (employees) 708 249 184%
Year-over-year change in PS revenue 9.2% 8.1% 13%
Year-over-year change in PS headcount 6.6% 4.2% 55%
Quarterly revenue target in backlog 45.1% 41.5% 9%
Deal pipeline / qtr. bookings forecast 196% 162% 20%
Project duration (man-months) 28.5 22.1 29%
Source: SPI Research, February 2021

2021 Professional Services Maturity™ Benchmark
© 2021 Service Performance Insight, LLC www.timelog.dk 61
Application Integration
While the core business
solutions support individual
departments in their efforts to
become more productive and
profitable, as these solutions
are integrated with the core
financial management solution
(ERP) they create additional
insight and value (Figure 36).
For instance, CRM integrated
with CFM provides sales
executives with the insight
necessary to develop a pricing
strategy, supporting the highest probability of winning the bid with maximum profitability. Without this
integration, it would be much more difficult to conduct this type of analysis. Today’s PSOs simply cannot
operate with functional silos as the lines between sales, delivery and finance become blurred.
It is also important for
applications to communicate
with each other. PSA,
integrated with CRM, provides
visibility from the sales
pipeline to the resource
schedule, ensuring the right
resources are available when
needed. With integrated
HCM, human resources,
recruiting and resource
management all benefit from visibility into in-demand skills, consultant preferences and career
aspirations.
The table shows mixed levels of integration in this year’s benchmark. SPI Research believes integration
between CRM, PSA and core financials is an essential ingredient in superlative performance. Integration
provides visibility to all parts of the organization and helps break down organizational silos.
Achieving client delight and profit in professional services requires tight coordination between demand
and supply which can only be achieved through integrated business applications. Many firms that have
worked with SPI Research over the past several years have concentrated on application integration as
they have learned its benefits and worked with their vendors to ensure the integration happens.
Table 35: Impact – Commercial BI Integration
Key Performance Indicator (KPI) BI Not Used
Used, Not Integrated
Used, Integrated
Survey responses (commercial CRM) 59.1% 23.2% 17.7%
Size of PS organization (employees) 249 380 730
Year-over-year change in PS revenue 8.1% 6.3% 11.3%
Year-over-year change in PS headcount 4.2% 3.9% 8.8%
Deal pipeline / qtr. bookings forecast 162% 169% 223%
Revenue per project (k) $137 $145 $196
Project duration (man-months) 18.4 25.7 31.1
Source: SPI Research, February 2021
Table 36: Solution Integration with Core Financials
Solution 2018 2019 2020
Professional Services Automation (PSA) 56.9% 54.1% 57.8%
Business Intelligence (BI) 40.2% 44.7% 45.4%
Client Relationship Management (CRM) 47.7% 49.0% 43.3%
Human Capital Management (HCM) 32.2% 31.4% 34.1%
Source: SPI Research, February 2021

2021 Professional Services Maturity™ Benchmark
© 2021 Service Performance Insight, LLC www.timelog.dk 62
PSOs are waking up to the
necessity of coordinating sales
with service delivery. This
integration improves customer
satisfaction and defines quality
execution. Typically, application
suites, such as Deltek,
FinancialForce, Microsoft,
NetSuite, Workday and SAP offer
out-of-the-box integration
between their core business
solutions making a 360-degree
view of clients and projects a
reality.
Figure 34: Success depends on inter-departmental cooperation
Source: SPI Research, February 2021

2021 Professional Services Maturity™ Benchmark
© 2021 Service Performance Insight, LLC www.timelog.dk 63
6. Leadership Pillar
2020 has tested the mettle of even the best leaders. Shifting
to virtual operations overnight followed by a year of economic
uncertainty and turmoil has tried the most seasoned managers
but out of the chaos most professional service organizations
have survived and even thrived. Resiliency and effective
communication have been key to calming a jittery workforce while keeping a focus on delighting clients.
Surprisingly 40% of firms reported year over year revenue growth exceeding 10% while an equal number
reported low to no growth. Larger organizations outperformed smaller ones with those focused on
digital transformation and cloud technologies the winners. Best performing organizations used 2020 to
shore up internal systems and streamline cumbersome business processes, positioning them well for an
expected recovery in 2021.
Each year SPI Research finds a direct correlation between growth and success in Professional Services.
Given that the PS industry is built on the application of unique knowledge and domain expertise it is
sometimes hard to understand why the growth dynamic is so important. But… it is. In professional
services and the wider world of technology, leading firms create dominant market positions. There is a
compounding effect of how customers make decisions, the networks and ecosystems that are created,
and the ability to scale as a firm that means there is a significant advantage for the companies that grow
the fastest. By establishing market-leading positions, premium PS firms win the best deals and turn
those deals into wildly satisfied clients who continue to buy and provide referrals. They become known
as innovators in their markets. They produce tangible results and harvest the knowledge gained to do an
even better job the next time. They build a culture which embodies their values which further attracts
prospective consultants and clients who identify with those attributes.
But growth comes with a price. The unique knowledge, vision and passion that a consulting leader
brings to founding a hot new firm must be nurtured and continuously kindled within new employees.
The leader must simultaneously learn to let go and grow at the same time. Micro-managing does not
work in PS, cultivating a reputation and repeatable skills, competencies and processes does. Most
independent consulting firms can easily grow from 20 to 50 consultants, but after that things get more
interesting. This is when firms must move from heroic to repeatable and founders must move from
doers and fire fighters who wear all the hats to leaders and visionaries. The leaders who can’t make this
transition must have the courage to bring in new talent who can take the firm to the next level.
As professional services organizations grow, leadership challenges intensify. SPI’s research into this
topic over the past fourteen years has shown a powerful correlation between financial success and
confidence in leadership. In small organizations, leadership by walking around works just fine. But as
the organization grows in size; scope and complexity; geographic dispersion, communication and
alignment become issues. PSOs must implement policies to ensure communication, collaboration and
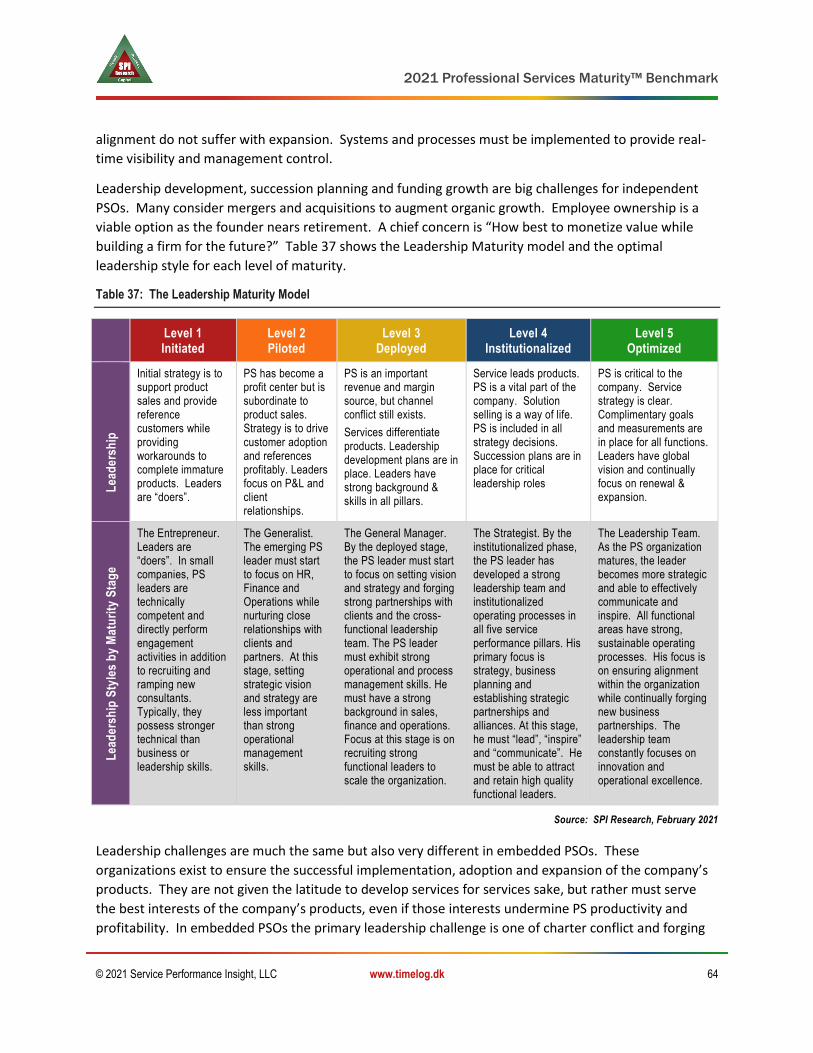
2021 Professional Services Maturity™ Benchmark
© 2021 Service Performance Insight, LLC www.timelog.dk 64
alignment do not suffer with expansion. Systems and processes must be implemented to provide real-
time visibility and management control.
Leadership development, succession planning and funding growth are big challenges for independent
PSOs. Many consider mergers and acquisitions to augment organic growth. Employee ownership is a
viable option as the founder nears retirement. A chief concern is “How best to monetize value while
building a firm for the future?” Table 37 shows the Leadership Maturity model and the optimal
leadership style for each level of maturity.
Table 37: The Leadership Maturity Model
Level 1 Initiated
Level 2 Piloted
Level 3 Deployed
Level 4 Institutionalized
Level 5 Optimized
Lea
de
rsh
ip
Initial strategy is to support product sales and provide reference customers while providing workarounds to complete immature products. Leaders are “doers”.
PS has become a profit center but is subordinate to product sales. Strategy is to drive customer adoption and references profitably. Leaders focus on P&L and client relationships.
PS is an important revenue and margin source, but channel conflict still exists.
Services differentiate products. Leadership development plans are in place. Leaders have strong background & skills in all pillars.
Service leads products. PS is a vital part of the company. Solution selling is a way of life. PS is included in all strategy decisions. Succession plans are in place for critical leadership roles
PS is critical to the company. Service strategy is clear. Complimentary goals and measurements are in place for all functions. Leaders have global vision and continually focus on renewal & expansion.
Lea
de
rsh
ip S
tyle
s b
y M
atu
rity
Sta
ge
The Entrepreneur. Leaders are “doers”. In small companies, PS leaders are technically competent and directly perform engagement activities in addition to recruiting and ramping new consultants. Typically, they possess stronger technical than business or leadership skills.
The Generalist. The emerging PS leader must start to focus on HR, Finance and Operations while nurturing close relationships with clients and partners. At this stage, setting strategic vision and strategy are less important than strong operational management skills.
The General Manager. By the deployed stage, the PS leader must start to focus on setting vision and strategy and forging strong partnerships with clients and the cross-functional leadership team. The PS leader must exhibit strong operational and process management skills. He must have a strong background in sales, finance and operations. Focus at this stage is on recruiting strong functional leaders to scale the organization.
The Strategist. By the institutionalized phase, the PS leader has developed a strong leadership team and institutionalized operating processes in all five service performance pillars. His primary focus is strategy, business planning and establishing strategic partnerships and alliances. At this stage, he must “lead”, “inspire” and “communicate”. He must be able to attract and retain high quality functional leaders.
The Leadership Team. As the PS organization matures, the leader becomes more strategic and able to effectively communicate and inspire. All functional areas have strong, sustainable operating processes. His focus is on ensuring alignment within the organization while continually forging new business partnerships. The leadership team constantly focuses on innovation and operational excellence.
Source: SPI Research, February 2021
Leadership challenges are much the same but also very different in embedded PSOs. These
organizations exist to ensure the successful implementation, adoption and expansion of the company’s
products. They are not given the latitude to develop services for services sake, but rather must serve
the best interests of the company’s products, even if those interests undermine PS productivity and
profitability. In embedded PSOs the primary leadership challenge is one of charter conflict and forging
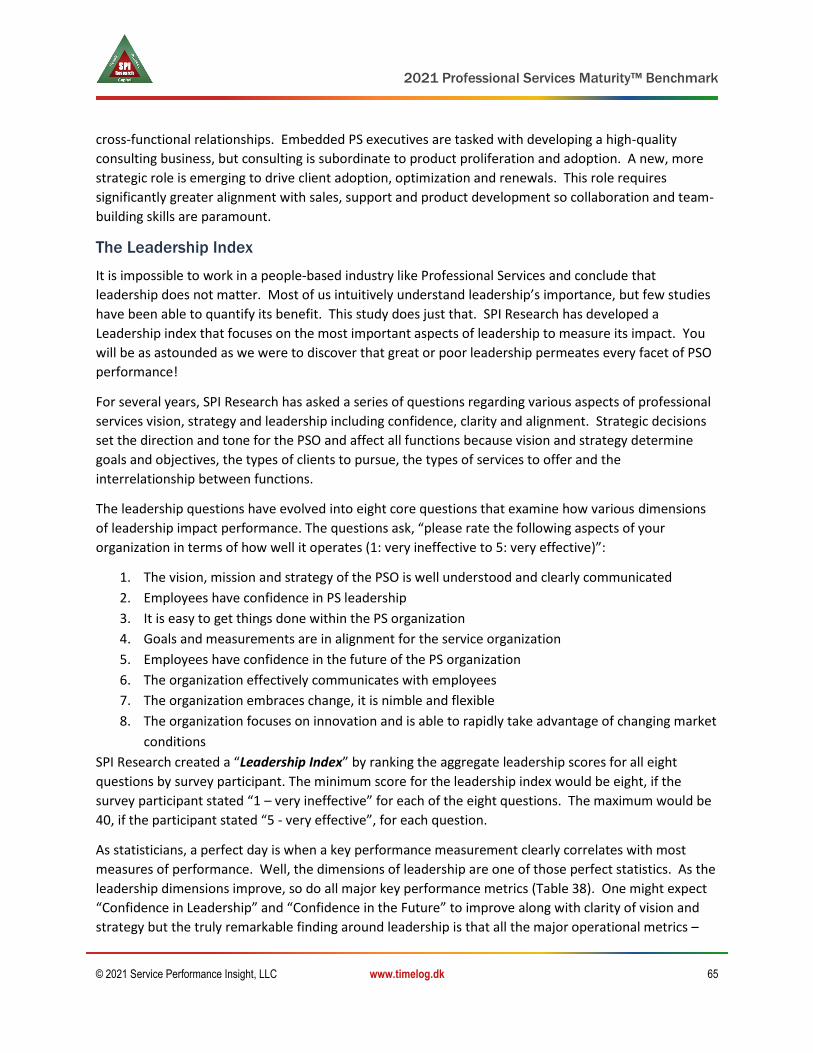
2021 Professional Services Maturity™ Benchmark
© 2021 Service Performance Insight, LLC www.timelog.dk 65
cross-functional relationships. Embedded PS executives are tasked with developing a high-quality
consulting business, but consulting is subordinate to product proliferation and adoption. A new, more
strategic role is emerging to drive client adoption, optimization and renewals. This role requires
significantly greater alignment with sales, support and product development so collaboration and team-
building skills are paramount.
The Leadership Index
It is impossible to work in a people-based industry like Professional Services and conclude that
leadership does not matter. Most of us intuitively understand leadership’s importance, but few studies
have been able to quantify its benefit. This study does just that. SPI Research has developed a
Leadership index that focuses on the most important aspects of leadership to measure its impact. You
will be as astounded as we were to discover that great or poor leadership permeates every facet of PSO
performance!
For several years, SPI Research has asked a series of questions regarding various aspects of professional
services vision, strategy and leadership including confidence, clarity and alignment. Strategic decisions
set the direction and tone for the PSO and affect all functions because vision and strategy determine
goals and objectives, the types of clients to pursue, the types of services to offer and the
interrelationship between functions.
The leadership questions have evolved into eight core questions that examine how various dimensions
of leadership impact performance. The questions ask, “please rate the following aspects of your
organization in terms of how well it operates (1: very ineffective to 5: very effective)”:
1. The vision, mission and strategy of the PSO is well understood and clearly communicated
2. Employees have confidence in PS leadership
3. It is easy to get things done within the PS organization
4. Goals and measurements are in alignment for the service organization
5. Employees have confidence in the future of the PS organization
6. The organization effectively communicates with employees
7. The organization embraces change, it is nimble and flexible
8. The organization focuses on innovation and is able to rapidly take advantage of changing market
conditions
SPI Research created a “Leadership Index” by ranking the aggregate leadership scores for all eight
questions by survey participant. The minimum score for the leadership index would be eight, if the
survey participant stated “1 – very ineffective” for each of the eight questions. The maximum would be
40, if the participant stated “5 - very effective”, for each question.
As statisticians, a perfect day is when a key performance measurement clearly correlates with most
measures of performance. Well, the dimensions of leadership are one of those perfect statistics. As the
leadership dimensions improve, so do all major key performance metrics (Table 38). One might expect
“Confidence in Leadership” and “Confidence in the Future” to improve along with clarity of vision and
strategy but the truly remarkable finding around leadership is that all the major operational metrics –
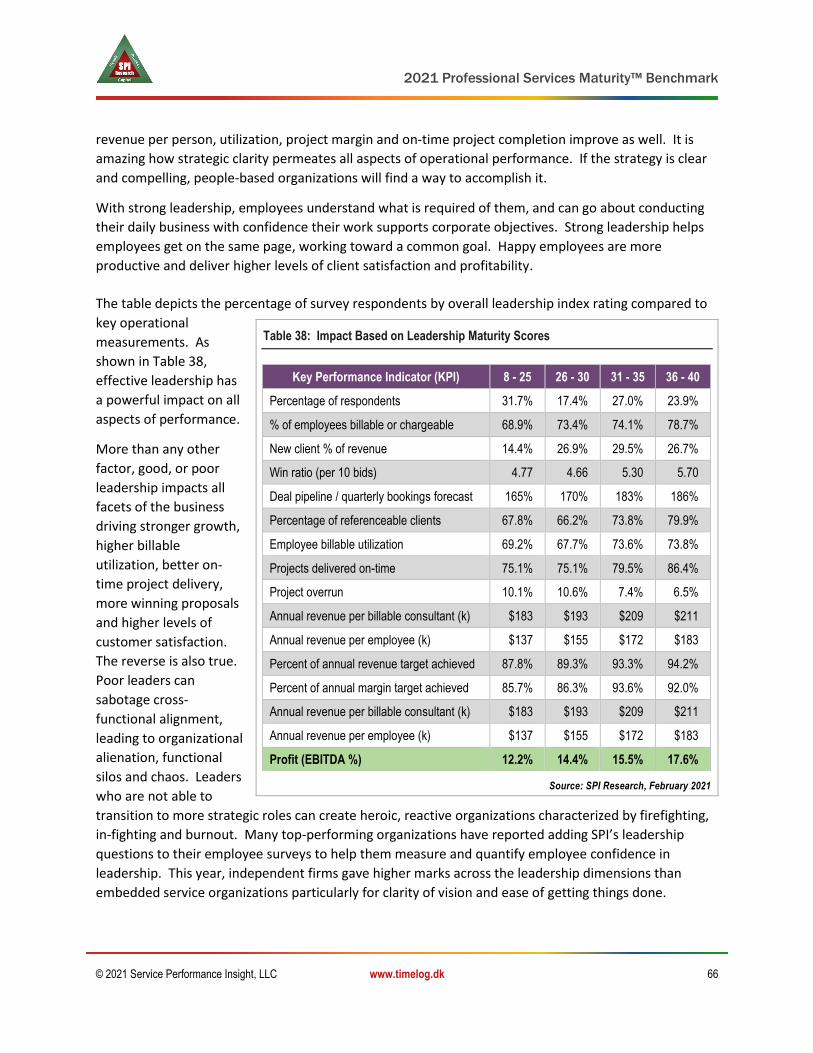
2021 Professional Services Maturity™ Benchmark
© 2021 Service Performance Insight, LLC www.timelog.dk 66
revenue per person, utilization, project margin and on-time project completion improve as well. It is
amazing how strategic clarity permeates all aspects of operational performance. If the strategy is clear
and compelling, people-based organizations will find a way to accomplish it.
With strong leadership, employees understand what is required of them, and can go about conducting
their daily business with confidence their work supports corporate objectives. Strong leadership helps
employees get on the same page, working toward a common goal. Happy employees are more
productive and deliver higher levels of client satisfaction and profitability.
The table depicts the percentage of survey respondents by overall leadership index rating compared to
key operational
measurements. As
shown in Table 38,
effective leadership has
a powerful impact on all
aspects of performance.
More than any other
factor, good, or poor
leadership impacts all
facets of the business
driving stronger growth,
higher billable
utilization, better on-
time project delivery,
more winning proposals
and higher levels of
customer satisfaction.
The reverse is also true.
Poor leaders can
sabotage cross-
functional alignment,
leading to organizational
alienation, functional
silos and chaos. Leaders
who are not able to
transition to more strategic roles can create heroic, reactive organizations characterized by firefighting,
in-fighting and burnout. Many top-performing organizations have reported adding SPI’s leadership
questions to their employee surveys to help them measure and quantify employee confidence in
leadership. This year, independent firms gave higher marks across the leadership dimensions than
embedded service organizations particularly for clarity of vision and ease of getting things done.
Table 38: Impact Based on Leadership Maturity Scores
Key Performance Indicator (KPI) 8 - 25 26 - 30 31 - 35 36 - 40
Percentage of respondents 31.7% 17.4% 27.0% 23.9%
% of employees billable or chargeable 68.9% 73.4% 74.1% 78.7%
New client % of revenue 14.4% 26.9% 29.5% 26.7%
Win ratio (per 10 bids) 4.77 4.66 5.30 5.70
Deal pipeline / quarterly bookings forecast 165% 170% 183% 186%
Percentage of referenceable clients 67.8% 66.2% 73.8% 79.9%
Employee billable utilization 69.2% 67.7% 73.6% 73.8%
Projects delivered on-time 75.1% 75.1% 79.5% 86.4%
Project overrun 10.1% 10.6% 7.4% 6.5%
Annual revenue per billable consultant (k) $183 $193 $209 $211
Annual revenue per employee (k) $137 $155 $172 $183
Percent of annual revenue target achieved 87.8% 89.3% 93.3% 94.2%
Percent of annual margin target achieved 85.7% 86.3% 93.6% 92.0%
Annual revenue per billable consultant (k) $183 $193 $209 $211
Annual revenue per employee (k) $137 $155 $172 $183
Profit (EBITDA %) 12.2% 14.4% 15.5% 17.6%
Source: SPI Research, February 2021

2021 Professional Services Maturity™ Benchmark
© 2021 Service Performance Insight, LLC www.timelog.dk 67
Leadership Issues
When things go wrong, it most often starts at the top and then cascades downward throughout the
organization, ultimately showing up in poor financial performance. Eliminating the root causes of
dysfunction and inefficiency go a long way toward driving organizational success. The most common
leadership issues facing PSOs include:
Unclear strategy – lack of clarity around target markets, target clients and why we win. Inability to capitalize on market opportunities due to lack of alignment, lack of employee engagement or leadership and cultural issues. No leverage to drive repeat sales, limited competitive differentiation, poor sales, marketing and service delivery execution.
Lack of alignment – unclear service charters – particularly a problem for embedded service organizations – with conflict between driving revenue and margin versus helping the overall company achieve its objectives of market expansion and client adoption.
Silos – exist in all companies – they usually occur in the choppy waters between groups or functions where responsibility and accountability are blurry. A classic example… who is responsible for driving new service revenues – is it sales or delivery? How can disconnected processes and poor handoffs be improved?
Reactive not proactive – because the organization lacks real-time visibility into all facets of the business, leaders must rely on past business performance rather than being able to spot trends and take advantage of them in real-time. Running the business by spreadsheet makes administration overly burdensome with endless rounds of error prone manual spreadsheet inputs. Managers have no ability to analyze and recalibrate to take advantage of changing market conditions leading to missed targets and a demoralized workforce.
Skills imbalance – the logical extension of organizational silos… where all parties are not aligned … not selling what we can deliver or not being able to deliver what has been sold. Not enough or too many people with the right skills, excessive non-billable headcount, sub-par utilization, difficulty in recruiting, ramping, retaining and inability to quickly, easily staff projects.
Immature processes – disparate or poor systems and tools. Inconsistent project methods; lack of tools and intellectual property leading to low repeatability and inability to drive efficiency and reuse.
Poor quality and customer satisfaction – Failed projects, cost overruns, difficulty securing references. No quality review processes and/or poor project visibility into budget to actuals.
Poor financial performance – All of the above factors – lack of strategic clarity, poor alignment, silos, and of out-of-date information contribute to reactive, rearview mirror business forecasting and planning. The net result is revenue and margin below targets, poor forecasting accuracy, unpredictability and high levels of risk.
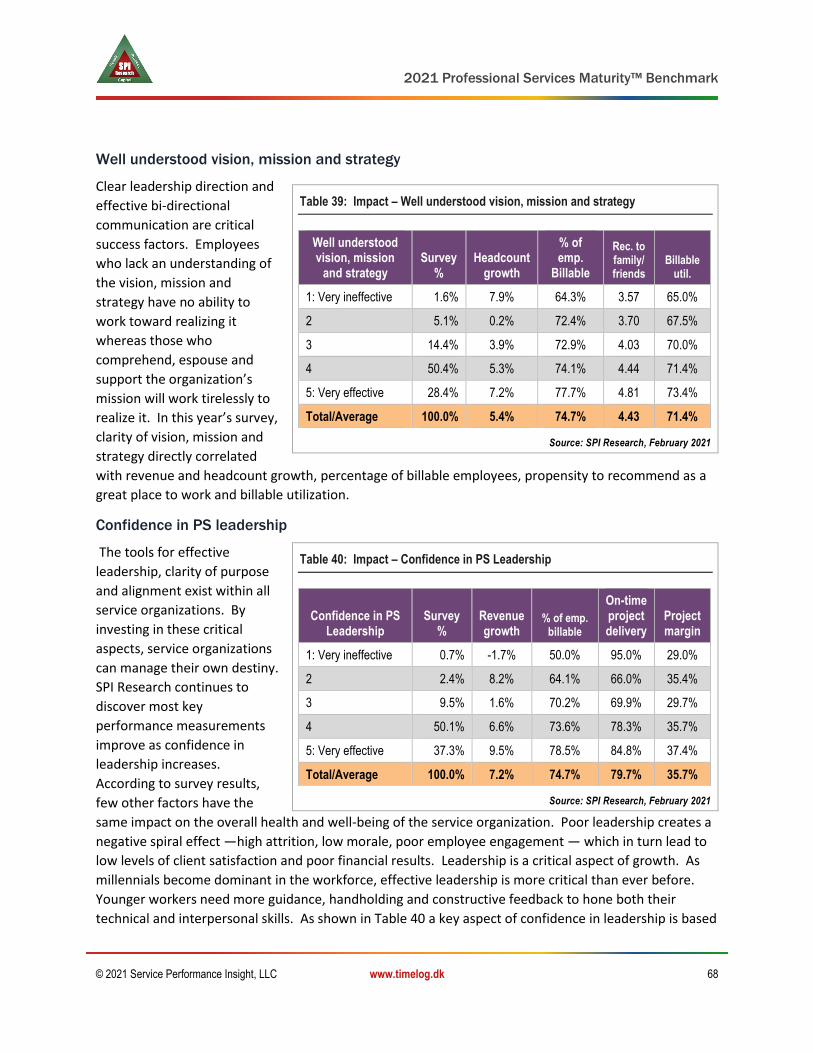
2021 Professional Services Maturity™ Benchmark
© 2021 Service Performance Insight, LLC www.timelog.dk 68
Well understood vision, mission and strategy
Clear leadership direction and
effective bi-directional
communication are critical
success factors. Employees
who lack an understanding of
the vision, mission and
strategy have no ability to
work toward realizing it
whereas those who
comprehend, espouse and
support the organization’s
mission will work tirelessly to
realize it. In this year’s survey,
clarity of vision, mission and
strategy directly correlated
with revenue and headcount growth, percentage of billable employees, propensity to recommend as a
great place to work and billable utilization.
Confidence in PS leadership
The tools for effective
leadership, clarity of purpose
and alignment exist within all
service organizations. By
investing in these critical
aspects, service organizations
can manage their own destiny.
SPI Research continues to
discover most key
performance measurements
improve as confidence in
leadership increases.
According to survey results,
few other factors have the
same impact on the overall health and well-being of the service organization. Poor leadership creates a
negative spiral effect —high attrition, low morale, poor employee engagement — which in turn lead to
low levels of client satisfaction and poor financial results. Leadership is a critical aspect of growth. As
millennials become dominant in the workforce, effective leadership is more critical than ever before.
Younger workers need more guidance, handholding and constructive feedback to hone both their
technical and interpersonal skills. As shown in Table 40 a key aspect of confidence in leadership is based
Table 39: Impact – Well understood vision, mission and strategy
Well understood vision, mission
and strategy Survey
% Headcount
growth
% of emp.
Billable
Rec. to family/ friends
Billable util.
1: Very ineffective 1.6% 7.9% 64.3% 3.57 65.0%
2 5.1% 0.2% 72.4% 3.70 67.5%
3 14.4% 3.9% 72.9% 4.03 70.0%
4 50.4% 5.3% 74.1% 4.44 71.4%
5: Very effective 28.4% 7.2% 77.7% 4.81 73.4%
Total/Average 100.0% 5.4% 74.7% 4.43 71.4%
Source: SPI Research, February 2021
Table 40: Impact – Confidence in PS Leadership
Confidence in PS Leadership
Survey %
Revenue growth
% of emp. billable
On-time project delivery
Project margin
1: Very ineffective 0.7% -1.7% 50.0% 95.0% 29.0%
2 2.4% 8.2% 64.1% 66.0% 35.4%
3 9.5% 1.6% 70.2% 69.9% 29.7%
4 50.1% 6.6% 73.6% 78.3% 35.7%
5: Very effective 37.3% 9.5% 78.5% 84.8% 37.4%
Total/Average 100.0% 7.2% 74.7% 79.7% 35.7%
Source: SPI Research, February 2021
2021 Professional Services Maturity™ Benchmark
© 2021 Service Performance Insight, LLC www.timelog.dk 69
on clarifying the growth strategy which translates to pursuing the right opportunities and having the
right resources to effectively deliver. Alignment leads to success, cementing the firm’s value proposition.
Ease of getting things done
SPI Research asked participants whether it was easy to get things done within their organization,
meaning minimal red tape, able to quickly and easily assign qualified resources, with limited
bureaucracy. Organizations
that provide an infrastructure
that supports employee
productivity enhance both
employee satisfaction and
financial success.
Table 41 shows a majority of
firms reported it is relatively
easy to get things done. As
ease of getting things done
improves, so do other metrics
including revenue and
headcount growth, on-time
project delivery and minimized
overruns.
Goals and measurements in alignment
Another survey question asked, "Are goals and measurements in alignment for the service
organization?" Alignment speaks to a clearly articulated strategy with goals and measurements
reinforcing the organization’s purpose and stimulating action. Alignment or lack of alignment has a
significant impact on bottom-line performance. Lack of alignment emanates from a lack of clarity and
conflicting or too many
priorities. It is characterized
by low levels of employee
engagement and functional
silos or factions. The highest
performing service
organizations exhibit clarity of
purpose and alignment around
a succinct set of core values
and initiatives. Effective
measurements and
compensation reinforce those
values, linking strategy to
execution. As shown in Table
Table 41: Impact – Ease of getting things done
Ease of getting things done
Survey %
Employee attrition
Rec. to family/ friends
On-time project delivery
Project overrun
1: Very ineffective 1.3% 15.9% 3.33 70.8% 12.5%
2 6.7% 15.7% 3.71 75.6% 11.7%
3 18.6% 14.5% 4.25 75.6% 9.5%
4 48.8% 10.7% 4.44 78.7% 8.2%
5: Very effective 24.6% 10.2% 4.82 86.9% 6.5%
Total/Average 100.0% 11.7% 4.43 79.8% 8.3%
Source: SPI Research, February 2021
Table 42: Impact – Goals and measurements in alignment
Goals and measurements in alignment
Survey %
Revenue growth
Bid-to-win ratio
Client reference
1: Very ineffective 1.8% 8.1% 4.13 65.6%
2 6.0% 3.9% 4.89 65.8%
3 24.1% 4.2% 4.98 69.7%
4 42.3% 7.8% 5.20 73.3%
5: Very effective 25.8% 9.8% 5.71 77.9%
Total/Average 100.0% 7.2% 5.24 73.0%
Source: SPI Research, February 2021

2021 Professional Services Maturity™ Benchmark
© 2021 Service Performance Insight, LLC www.timelog.dk 70
42 goals and measurements in alignment had a profound impact on revenue growth, win ratios and
client referenceability.
Employees have confidence in the PSO's future
The level of employee
confidence in the future of the
PS organization has a
significant impact on almost all
key performance
measurements. Firms with
the highest levels of employee
confidence experienced the
highest levels of revenue
growth, were more often seen
as a great place to work, and
experienced lower attrition
and higher utilization. Capping
it all off, they were also more
profitable.
“The world loves a winner” seems to be an appropriate description for the positive results of the
organizations with the highest levels of employee confidence. A key “chicken or egg question” always
arises around “confidence in the future” as typically the highest performing and fastest growing
organizations propel employees to have confidence in the future, while low confidence is indicative of
organizations in turmoil or going through massive change as they reposition themselves to take better
advantage of the future. A key consideration for firms that experience low to no growth is how to
reposition themselves onto a growth path while maintaining employee commitment.
Effectively communicates
with employees
Respondents were asked to
rate “our organization
effectively communicates with
employees”. ESOs reported
better communication than
independents. Talk may be
cheap but without
bidirectional communication,
employees quickly become
disenfranchised. Creating an
effective communication plan
Table 43: Impact – Employees have confidence in the PSO's future
Employees have Confidence in PSO's Future
Survey %
Org. size (emp) Attrition
Rec. to family / friends
Billable util.
1: Very ineffective 1.1% 1,579 25.2% 3.60 61.3%
2 3.8% 656 14.8% 3.71 63.9%
3 15.6% 452 14.1% 3.91 67.4%
4 46.0% 420 11.7% 4.42 71.3%
5: Very effective 33.6% 377 9.7% 4.78 74.5%
Total/Average 100.0% 433 11.7% 4.42 71.3%
Source: SPI Research, February 2021
Table 44: Impact – Effectively communicates with employees
Effectively communicates with employees
Survey %
Revenue growth
New clients
Client reference
Rec. to family/ friends
1: Very ineffective 0.7% 0.8% 8.3% 65.0% 3.67
2 5.3% 5.1% 22.7% 68.3% 4.07
3 15.7% 4.1% 25.7% 68.6% 4.16
4 47.1% 7.4% 26.9% 70.4% 4.40
5: Very effective 31.2% 9.2% 28.3% 79.7% 4.72
Total/Average 100.0% 7.1% 26.6% 73.0% 4.43
Source: SPI Research, February 2021

2021 Professional Services Maturity™ Benchmark
© 2021 Service Performance Insight, LLC www.timelog.dk 71
should be part of any improvement plan. Poor or no communication has a profound impact on
employee engagement, client satisfaction and attrition. Project overruns and their negative
consequences are exacerbated by poor communication.
Embraces change – nimble and flexible
Change is a way of life for 21st
century professional services
organizations. One of the
primary reasons why more
and more companies out-task
IT, accounting, law,
architecture, strategy and
marketing to specialized PS
organizations is that the pace
and amount of change and
technical complexity is
impossible to keep up with, so
they must reply on external
consultants and specialists.
Each leadership dimension
impacts all other leadership dimensions. Nimble organizations that can easily adapt to change, have
higher levels of billable employees and are considered better places to work. The survey shows
nimbleness and adaptability diminish as organizations grow. The glue that binds superlative leadership
scores is always executive real-time visibility. Numbers don’t lie so the best led organizations invest in
integrated systems to allow them to see and take advantage of market changes instantly.
Innovation focused
Innovation is a hot topic these
days as technology innovators
like Apple have created new
markets and destroyed leaders
like Research in Motion who
were not able to see and
respond to a “consumer-
based” future. Research into
the science of innovation
shows innovators are more
likely to take risks and have a
high tolerance for failure.
In professional services,
innovation comes from exploring and embracing new business models, processes and technologies to
Table 46: Impact – Innovation focused
Innovation focused
Survey %
Revenue growth
Client reference
Project duration
(man-mnth)
% of ann. rev.
target
1: Very ineffective 1.3% -2.1% 67.5% 43.3 91.7%
2 8.0% 4.4% 68.4% 25.9 91.1%
3 22.3% 2.9% 68.6% 25.2 89.4%
4 40.6% 8.4% 72.3% 27.0 93.9%
5: Very effective 27.7% 9.7% 79.4% 26.8 92.1%
Total/Average 100.0% 7.1% 73.1% 26.7 92.2%
Source: SPI Research, February 2021
Table 45: Impact – Embraces change - nimble and flexible
Embraces change - nimble
and flexible Survey
%
Org. size
(emp) % of emp.
billable New clients
Rec. to family/ friends
1: Very ineffective 1.3% 1,297 71.7% 8.3% 3.67
2 6.4% 1,117 70.7% 22.7% 4.07
3 18.7% 694 73.4% 25.7% 4.16
4 40.0% 304 73.9% 26.9% 4.40
5: Very effective 33.6% 272 77.2% 28.3% 4.72
Total/Average 100.0% 432 74.7% 26.6% 4.43
Source: SPI Research, February 2021
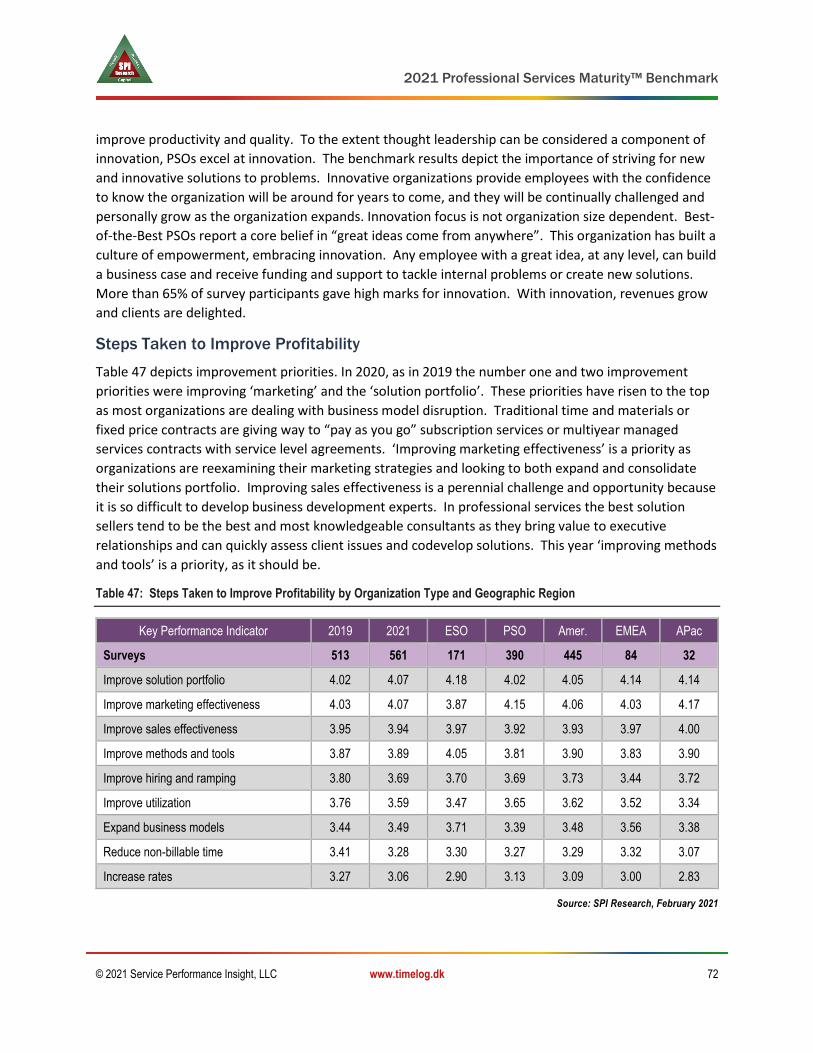
2021 Professional Services Maturity™ Benchmark
© 2021 Service Performance Insight, LLC www.timelog.dk 72
improve productivity and quality. To the extent thought leadership can be considered a component of
innovation, PSOs excel at innovation. The benchmark results depict the importance of striving for new
and innovative solutions to problems. Innovative organizations provide employees with the confidence
to know the organization will be around for years to come, and they will be continually challenged and
personally grow as the organization expands. Innovation focus is not organization size dependent. Best-
of-the-Best PSOs report a core belief in “great ideas come from anywhere”. This organization has built a
culture of empowerment, embracing innovation. Any employee with a great idea, at any level, can build
a business case and receive funding and support to tackle internal problems or create new solutions.
More than 65% of survey participants gave high marks for innovation. With innovation, revenues grow
and clients are delighted.
Steps Taken to Improve Profitability
Table 47 depicts improvement priorities. In 2020, as in 2019 the number one and two improvement
priorities were improving ‘marketing’ and the ‘solution portfolio’. These priorities have risen to the top
as most organizations are dealing with business model disruption. Traditional time and materials or
fixed price contracts are giving way to “pay as you go” subscription services or multiyear managed
services contracts with service level agreements. ‘Improving marketing effectiveness’ is a priority as
organizations are reexamining their marketing strategies and looking to both expand and consolidate
their solutions portfolio. Improving sales effectiveness is a perennial challenge and opportunity because
it is so difficult to develop business development experts. In professional services the best solution
sellers tend to be the best and most knowledgeable consultants as they bring value to executive
relationships and can quickly assess client issues and codevelop solutions. This year ‘improving methods
and tools’ is a priority, as it should be.
Table 47: Steps Taken to Improve Profitability by Organization Type and Geographic Region
Key Performance Indicator 2019 2021 ESO PSO Amer. EMEA APac
Surveys 513 561 171 390 445 84 32
Improve solution portfolio 4.02 4.07 4.18 4.02 4.05 4.14 4.14
Improve marketing effectiveness 4.03 4.07 3.87 4.15 4.06 4.03 4.17
Improve sales effectiveness 3.95 3.94 3.97 3.92 3.93 3.97 4.00
Improve methods and tools 3.87 3.89 4.05 3.81 3.90 3.83 3.90
Improve hiring and ramping 3.80 3.69 3.70 3.69 3.73 3.44 3.72
Improve utilization 3.76 3.59 3.47 3.65 3.62 3.52 3.34
Expand business models 3.44 3.49 3.71 3.39 3.48 3.56 3.38
Reduce non-billable time 3.41 3.28 3.30 3.27 3.29 3.32 3.07
Increase rates 3.27 3.06 2.90 3.13 3.09 3.00 2.83
Source: SPI Research, February 2021
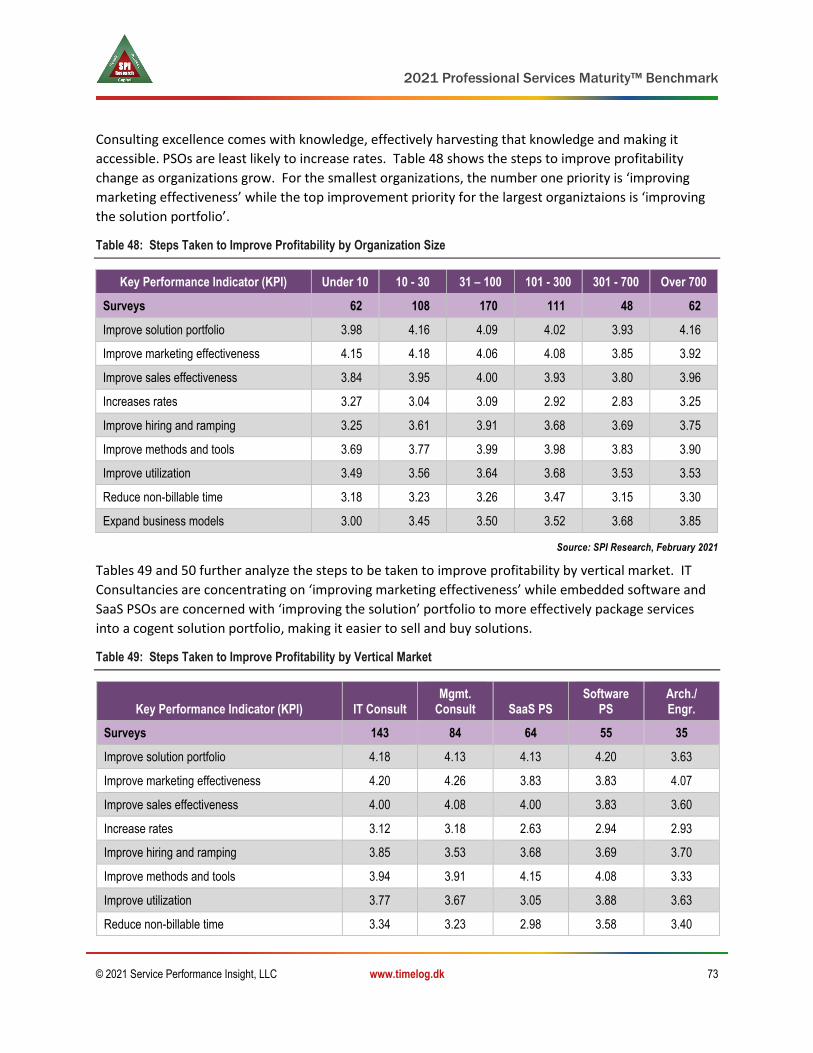
2021 Professional Services Maturity™ Benchmark
© 2021 Service Performance Insight, LLC www.timelog.dk 73
Consulting excellence comes with knowledge, effectively harvesting that knowledge and making it
accessible. PSOs are least likely to increase rates. Table 48 shows the steps to improve profitability
change as organizations grow. For the smallest organizations, the number one priority is ‘improving
marketing effectiveness’ while the top improvement priority for the largest organiztaions is ‘improving
the solution portfolio’.
Table 48: Steps Taken to Improve Profitability by Organization Size
Key Performance Indicator (KPI) Under 10 10 - 30 31 – 100 101 - 300 301 - 700 Over 700
Surveys 62 108 170 111 48 62
Improve solution portfolio 3.98 4.16 4.09 4.02 3.93 4.16
Improve marketing effectiveness 4.15 4.18 4.06 4.08 3.85 3.92
Improve sales effectiveness 3.84 3.95 4.00 3.93 3.80 3.96
Increases rates 3.27 3.04 3.09 2.92 2.83 3.25
Improve hiring and ramping 3.25 3.61 3.91 3.68 3.69 3.75
Improve methods and tools 3.69 3.77 3.99 3.98 3.83 3.90
Improve utilization 3.49 3.56 3.64 3.68 3.53 3.53
Reduce non-billable time 3.18 3.23 3.26 3.47 3.15 3.30
Expand business models 3.00 3.45 3.50 3.52 3.68 3.85
Source: SPI Research, February 2021
Tables 49 and 50 further analyze the steps to be taken to improve profitability by vertical market. IT
Consultancies are concentrating on ‘improving marketing effectiveness’ while embedded software and
SaaS PSOs are concerned with ‘improving the solution’ portfolio to more effectively package services
into a cogent solution portfolio, making it easier to sell and buy solutions.
Table 49: Steps Taken to Improve Profitability by Vertical Market
Key Performance Indicator (KPI) IT Consult Mgmt.
Consult SaaS PS Software
PS Arch./ Engr.
Surveys 143 84 64 55 35
Improve solution portfolio 4.18 4.13 4.13 4.20 3.63
Improve marketing effectiveness 4.20 4.26 3.83 3.83 4.07
Improve sales effectiveness 4.00 4.08 4.00 3.83 3.60
Increase rates 3.12 3.18 2.63 2.94 2.93
Improve hiring and ramping 3.85 3.53 3.68 3.69 3.70
Improve methods and tools 3.94 3.91 4.15 4.08 3.33
Improve utilization 3.77 3.67 3.05 3.88 3.63
Reduce non-billable time 3.34 3.23 2.98 3.58 3.40

2021 Professional Services Maturity™ Benchmark
© 2021 Service Performance Insight, LLC www.timelog.dk 74
Key Performance Indicator (KPI) IT Consult Mgmt.
Consult SaaS PS Software
PS Arch./ Engr.
Expand business models 3.59 3.22 3.62 3.75 2.77
Source: SPI Research, February 2021
For most organizations, improving sales and marketing effectiveness and clarifying and codifying the
solution portfolio are top improvement priorities.
Table 50: Steps Taken to Improve Profitability by Vertical Market
Key Performance Indicator (KPI) MarCom VAR Account Mgd. Serv. All Others
Surveys 31 17 14 13 105
Improve solution portfolio 3.96 4.25 3.67 4.11 3.94
Improve marketing effectiveness 4.00 4.06 3.92 4.44 4.00
Improve sales effectiveness 3.78 4.25 3.67 4.22 3.84
Increase rates 3.22 3.19 2.92 3.00 3.23
Improve hiring and ramping 3.65 3.69 3.91 3.56 3.63
Improve methods and tools 3.65 4.00 4.08 3.67 3.74
Improve utilization 3.61 3.81 4.08 3.33 3.40
Reduce non-billable time 3.17 3.50 3.67 3.00 3.20
Expand business models 3.22 3.69 3.67 3.78 3.58
Source: SPI Research, February 2021

2021 Professional Services Maturity™ Benchmark
© 2021 Service Performance Insight, LLC www.timelog.dk 75
7. Client Relationships Pillar
The Client Relationships pillar focuses on the activities
associated with business development and client
management. Finding and retaining customers is a primary
means of growing a business and is always one of the top
challenges for PS firms.
In this chapter, SPI Research provides the PS Sales and
Marketing Maturity Model™, along with statistics showing the
benefits of sales and marketing investments. This chapter examines service sales and marketing
effectiveness, win ratios and the impact of building a robust sales pipeline. Since referrals are a primary
driver of new and repeat business, SPI Research also explores the correlation between client satisfaction
and business success.
Cultivating new and repeat clients is the lifeblood of the service industry. Professional services
organizations are in business to provide knowledge, expertise and guidance. Their sales and marketing
organizations must define target markets and solutions by understanding key client challenges. The job
of service sales and marketing is to generate awareness and identify and close opportunities. Services
are intangible, so service sales and marketing must demonstrate concrete proof of the firm’s knowledge,
experience, differentiation and quality.
Table 51 highlights the five levels of maturity in the Client Relationships pillar. As sales and service
delivery processes mature, organizations move from selling anything and everything to anyone, to a
more careful and selective approach to client selection, solution creation, deal capture, contract and
pricing management, reference building and partnering.
Table 51: PS Sales and Marketing Maturity Model™
Level 1 Level 2 Level 3 Level 4 Level 5
Cli
ent
Re
lati
on
ship
s
Opportunistic. No defined solution sets or go to market plan. Focus is on closing deals and reference building. Individual heroics, no consistent sales, marketing or partnering plan or methodology. Ad hoc, one-off projects.
Start to use marketing to generate leads. Multiple sales models. Start investing in sales training, CRM & sales methodology. Manual integration with PSA. Start measuring sales effectiveness & customer satisfaction. Start developing partners and partner programs. Some level of proposal and contract reviews and pricing control.
Marketing, inside sales, solution sales with defined solution sets. CRM integrated with PSA. Deal, pricing and contract reviews. Partner plan and scorecard. Tight pricing and contract mgmt. controls. High levels of customer satisfaction.
CRM, PSA, CFM integration provides 360-degree view of client relationships. Business process, vertical and horizontal solutions. Vertical centers of excellence. Top client and partner programs. Global contract and pricing management. Key partner relationships. Strong customer reference programs.
Executive relationships and client advisory board. Thought leadership. Brand building and awareness. High customer satisfaction. Integrated sales, marketing and partnering programs. High quality references.
Source: SPI Research, February 2021
The effectiveness of the organization’s sales and marketing efforts determines the quality and size of the
pipeline; win ratios; discounts; client satisfaction and referenceability and the length of the sales cycle.
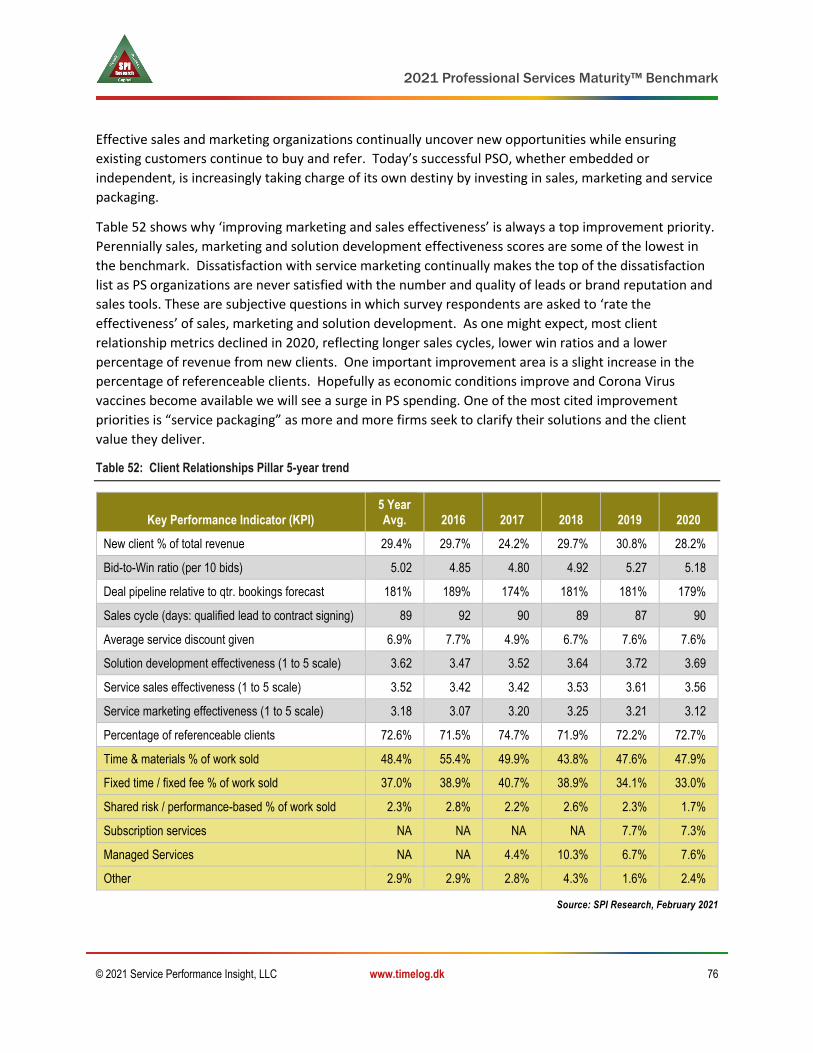
2021 Professional Services Maturity™ Benchmark
© 2021 Service Performance Insight, LLC www.timelog.dk 76
Effective sales and marketing organizations continually uncover new opportunities while ensuring
existing customers continue to buy and refer. Today’s successful PSO, whether embedded or
independent, is increasingly taking charge of its own destiny by investing in sales, marketing and service
packaging.
Table 52 shows why ‘improving marketing and sales effectiveness’ is always a top improvement priority.
Perennially sales, marketing and solution development effectiveness scores are some of the lowest in
the benchmark. Dissatisfaction with service marketing continually makes the top of the dissatisfaction
list as PS organizations are never satisfied with the number and quality of leads or brand reputation and
sales tools. These are subjective questions in which survey respondents are asked to ‘rate the
effectiveness’ of sales, marketing and solution development. As one might expect, most client
relationship metrics declined in 2020, reflecting longer sales cycles, lower win ratios and a lower
percentage of revenue from new clients. One important improvement area is a slight increase in the
percentage of referenceable clients. Hopefully as economic conditions improve and Corona Virus
vaccines become available we will see a surge in PS spending. One of the most cited improvement
priorities is “service packaging” as more and more firms seek to clarify their solutions and the client
value they deliver.
Table 52: Client Relationships Pillar 5-year trend
Key Performance Indicator (KPI) 5 Year Avg. 2016 2017 2018 2019 2020
New client % of total revenue 29.4% 29.7% 24.2% 29.7% 30.8% 28.2%
Bid-to-Win ratio (per 10 bids) 5.02 4.85 4.80 4.92 5.27 5.18
Deal pipeline relative to qtr. bookings forecast 181% 189% 174% 181% 181% 179%
Sales cycle (days: qualified lead to contract signing) 89 92 90 89 87 90
Average service discount given 6.9% 7.7% 4.9% 6.7% 7.6% 7.6%
Solution development effectiveness (1 to 5 scale) 3.62 3.47 3.52 3.64 3.72 3.69
Service sales effectiveness (1 to 5 scale) 3.52 3.42 3.42 3.53 3.61 3.56
Service marketing effectiveness (1 to 5 scale) 3.18 3.07 3.20 3.25 3.21 3.12
Percentage of referenceable clients 72.6% 71.5% 74.7% 71.9% 72.2% 72.7%
Time & materials % of work sold 48.4% 55.4% 49.9% 43.8% 47.6% 47.9%
Fixed time / fixed fee % of work sold 37.0% 38.9% 40.7% 38.9% 34.1% 33.0%
Shared risk / performance-based % of work sold 2.3% 2.8% 2.2% 2.6% 2.3% 1.7%
Subscription services NA NA NA NA 7.7% 7.3%
Managed Services NA NA 4.4% 10.3% 6.7% 7.6%
Other 2.9% 2.9% 2.8% 4.3% 1.6% 2.4%
Source: SPI Research, February 2021

2021 Professional Services Maturity™ Benchmark
© 2021 Service Performance Insight, LLC www.timelog.dk 77
An examination of the type of work sold shows a decline in fixed price contracts in favor of subscription
and managed service contracts. A top improvement priority for all service providers is solution
packaging with a focus on making services easier to sell and buy. Service providers are now offering
subscription and “managed services” as monthly, quarterly or annual contracts to drive more
predictable, recurring revenue. Buyers want predetermined monthly costs, putting the onus on service
providers to correctly package and price contracts.
The PS Sales Maturity Model™
As part of the PS Sales and Marketing Maturity Model™, SPI Research focuses on key success criteria and
processes associated with PS sales, marketing, solution development and partnering. SPI Research
charts its definitions of sales maturity levels and shows how they progress as the organization enhances
the knowledge and practice of solution selling resulting in superior client value (Table 53). As
organizations enhance their solution selling capabilities, methods, systems and tools, overall sales
effectiveness improves. These efforts pay for themselves in a higher percentage of sales quota
achievement; better sales forecasting accuracy; less churn; higher levels of adoption; improved pricing
and estimating resulting in fewer project overruns; shorter sales cycles due to better deal qualification;
larger deals; more PS revenue by account; larger pipelines and significantly stronger reference clients.
Table 53: PS Sales Maturity Model™
Level 1 Level 2 Level 3 Level 4 Level 5
Ad Hoc, Opportunistic,
Heroic
Piloted, Experimental, Pockets of Excellence
Deployed, Basics in Place for All Key
Elements
Institutionalized, in the Company
DNA / Fabric
Visionary, Agile, Innovative,
Continuous Renewal and Improvement
Clie
nt
Val
ue
Handcrafted projects, unique, highly dependent on individual team member skills.
Limited replication or codification of service solutions. Point product solutions primarily focused on rapid implementation, integration and customization. Starting to focus on adoption.
Clear, value-based sales and marketing messages developed for product / vertical /geographic audiences. Some level of client value and ROI measurement.
Client-centric, high value services developed and packaged. Demonstrated, measurable business value.
Partnerships exist with most strategic, forward-thinking clients to develop and enhance leading edge services. Solutions deliver clear and significant value.
Sal
es P
roce
ss
Opportunistic and instinctive with ad hoc service offerings. No consistent sales methodology. Variation in pricing methods. Inconsistent proposals, quotes, contracts. Limited to no investment in sales training, methods or tools.
Dedicated solution selling teams. Repeatable process for point solutions. Implementing sales methodology, reinforced in CRM. Reusable proposal boilerplate. Informal proposal roles and self-governing proposal teams. Standard price list and discount authority. Developing standard contracting and estimating tools.
Consistent solution selling methods & tools reinforced and supported in CRM. Solution-oriented best practices. Consistent estimating and risk evaluations. Bid qualification criteria. Standard contracts and statements of work. Clear roles, responsibilities and timelines. Sales organization trained to effectively sell solutions.
Solution and value selling is a way of life with appropriate measurements and controls with fully integrated supporting systems and tools. Sophisticated selling strategies including quantified client value with improved KPIs and positive ROI.
Established thought leadership and trusted advisor at highest levels. Continual investment in improving and expanding service portfolio as a means of market expansion. Effective proposal center delivers timely, high-quality estimates, proposals, contract and risk reviews.

2021 Professional Services Maturity™ Benchmark
© 2021 Service Performance Insight, LLC www.timelog.dk 78
Level 1 Level 2 Level 3 Level 4 Level 5
Par
tner
s
Ad hoc and opportunistic without clearly defined rules, certification or quality metrics.
Partner plan in place, but conflicts still exist. Defined partner programs to extend market reach. Piloting certification, training & quality metrics.
Solution sets designed with partners in mind (defined roles and deliverables for prime, hybrid, sub). Top partner program.
Co-development with partners. Partners are integral part of service packaging and rollout.
Co-opetition. Partners contribute to company's overall service innovation by providing SME feedback and insights.
Clie
nt
Sat
Pro
gra
ms
Ad hoc reference requests. No formal program. Heroic.
Client satisfaction and reference programs established to extend market reach.
Proof, testimonials and references to support solution client value. Consistent, ongoing satisfaction measures.
Client advisory board influences roadmap participates in beta programs.
Strategic clients are company and service evangelists.
Source: SPI Research, February 2021
Solution Development Effectiveness
Solution development effectiveness requires consistent PS and Sales executive funding and support. Ad
hoc teams of benched consultants cannot be effective in developing a compelling and meaningful
solution development strategy and program. Based on the Service Lifecycle Management Maturity
Model™ benchmark, very few organizations are effective at service productization. Creating an effective
and efficient solution development process is a difficult undertaking. Most firms are struggling to do
this because solution development crosses over traditional functional boundaries and requires cross-
organizational collaboration and change management. Getting all the constituent groups – professional
services, sales, marketing, product management and channel partners – on the same page to create
compelling solutions for targeted markets is a tough but worthwhile task.
Solution development requires significant leadership, organizational commitment, funding and on-going
change management. SPI Research believes that the following are critical success factors for
instantiating and sustaining a successful solution development program:
∆ Articulated and well-understood services strategy
∆ Service productization program vision
∆ Executive sponsorship
∆ Market-driven focus
∆ Global company adoption of program
∆ Resource commitment
∆ Cross-functional participation; and
∆ Repeatable sales and delivery methods, tools, and templates.
SPI Research asked how effective solution development was on a scale of 1 to 5, with 5 representing
excellent (Table 54). Solution Development effectiveness has traditionally been given a lower score than
sales effectiveness but higher marks than marketing effectiveness. This year overall solution
development effectiveness was rated higher than sales effectiveness with a score of 3.69 compared to
3.56 for sales effectiveness and 3.12 for marketing effectiveness. All the measures of solution

2021 Professional Services Maturity™ Benchmark
© 2021 Service Performance Insight, LLC www.timelog.dk 79
development, sales and marketing
effectiveness declined from the
2019 survey. For the 62.6% of firms
who gave their solution
development efforts a good score
of 4 or 5, solution development
had a positive impact on the size of
the deal pipeline, project margins
and revenue yield by consultant
and employee.
Service Marketing Effectiveness
Having a service marketing focus is not enough. Marketing must develop an effective online presence,
thought leadership, lead generation campaigns, sales tools and sales enablement to increase the firm’s
brand awareness and to showcase thought leadership and bring in qualified leads. The most successful
PS marketing efforts require a strategic focus to ensure they augment and enhance the firm’s strategy.
Marketing should be charged with bringing the firm’s vision and strategy to life through effective
positioning. Without a seat at the executive table, marketing will be relegated to tactical lead
generation and sales support activities. Effective marketing requires dedicated, skilled personnel along
with sustained funding.
SPI Research asked how effective service marketing was on a scale of 1 to 5, with 5 representing
excellent (Table 55). Marketing
effectiveness has consistently been
given an even worse score than
sales effectiveness. Marketing
effectiveness has consistently
declined from a poor score of 3.25
(65%) in 2018 to 3.21(64%) and
now 3.12(62%). More than 24% of
organizations give marketing
effectiveness a failing grade of 1 or
2. For the 33.7% of firms who gave
their marketing efforts a strong
score of 4 or 5, marketing has a
positive impact on revenue growth,
size of the sales pipeline, client
Table 54. Impact – Service Development Effectiveness
Solution development effectiveness
Survey %
Deal pipeline
Project margin
Ann. rev./
consult. (k)
Ann. rev./
emp. (k)
Very ineffective 1.6% 83% 29.2% $170 $145
Ineffective 5.8% 169% 31.0% $180 $149
Neither 29.8% 170% 35.5% $197 $157
Effective 47.1% 186% 35.7% $206 $169
Very effective 15.6% 198% 39.0% $210 $179
Total/Average 100.0% 180% 35.7% $202 $165
Source. SPI Research, February 2021
Table 55: Impact – Service Marketing Effectiveness
Service marketing
effectiveness Survey
% Revenue growth
Deal pipeline
Client refer.
Project margin
Very ineffective 5.2% 3.4% 139% 71.7% 32.8%
Ineffective 18.9% 6.3% 194% 72.9% 34.2%
Neither 42.2% 6.9% 175% 72.2% 35.2%
Effective 25.7% 7.7% 181% 73.1% 37.2%
Very effective 8.0% 7.0% 206% 76.7% 39.9%
Total/Average 100.0% 6.8% 181% 72.9% 35.8%
Source: SPI Research, February 2021

2021 Professional Services Maturity™ Benchmark
© 2021 Service Performance Insight, LLC www.timelog.dk 80
reference-ability and project margins. Marketing is certainly worth the expense if it is well-staffed, fully
funded and strategically positioned.
PS Marketing Maturity
The global economy has evolved into a services economy with services like health care, technology and
consulting representing some of the hottest areas of growth. Marketing services is an important skill,
and a tough one, for businesses to master. Without a tangible product to show and tell customers
about, service marketers must be adept at pulling together all the pieces of the marketing mix to
demonstrate value for their target clients. Services are inherently intangible, are consumed
simultaneously at the time of their production, and cannot be stored, saved or resold once they have
been used. Service offerings are unique and cannot be exactly repeated even by the same service
provider for the same customer. Service marketing has become a big business with a focus on
establishing the services brand, generating awareness and leads while providing powerful tools and
collateral to support service sales and delivery. Service marketing typically produces customer case
studies and client testimonials. The move to social marketing has accentuated the role of marketing in
building awareness. Marketing also focuses on brand building and conveying the essence of the brand
through the firm’s website and social channels.
Relationships Are Key
In service marketing, because there is no tangible product, relationships are key – both with the services
sales force and clients. Service marketers must listen to and understand the needs of customers and
prospects to identify the compelling reasons they buy and what attributes they most care about to build
differentiation for the firm. The role of service marketing is to identify target markets and clients and to
position the firm and its solutions in a differentiated way while supporting the sales force with lead
generation and reference building activities. In many organizations, service marketing is also
responsible for developing customer references, testimonials, case studies and client advisory boards.
Services Marketing versus Service Lifecycle Management
A key finding from this benchmark is most PS organizations are confusing service marketing with service
lifecycle management. Service marketing is clearly an aspect of service lifecycle management, but most
often does not encompass the truly transformational elements of building a service portfolio comprised
of repeatable sales and service delivery methods and tools, which we include in the larger scope of
service lifecycle management.
Increasingly, service marketing organizations are focused on building compelling websites which
facilitate prospective client evaluation and selection. Social marketing is another key component of
marketing which has gained tremendous importance as most buyers now carefully review prospective
service providers through online channels. A key component of service marketing is to provide
compelling service positioning and thought leadership through high value content including analyst
reviews.

2021 Professional Services Maturity™ Benchmark
© 2021 Service Performance Insight, LLC www.timelog.dk 81
Table 56: PS Marketing Maturity™ Levels
Level 1 Level 2 Level 3 Level 4 Level 5
Ad Hoc, Opportunistic,
Heroic
Piloted, Experimental, Pockets of Excellence
Deployed, Basics in Place for All Key
Elements
Institutionalized, in the Company DNA /
Fabric
Visionary, Agile, Innovative, Continuous
Renewal and Improvement
Clie
nt
Val
ue
Handcrafted projects, unique, highly dependent on individual team member skills.
Limited replication or codification of service solutions. Point product solutions primarily focused on rapid implementation.
Clear, value-based sales and marketing messages for product, vertical, geographic audiences. Some level of client value and ROI measurement.
Client-centric, high value services developed and packaged. Demonstrated, measurable business value.
Partnerships exist with most strategic, forward-thinking clients to develop and enhance leading edge services.
Mar
keti
ng
Tactical. Limited to no investment in service marketing. Simple website, ad hoc social marketing and reference building.
Campaign-driven, focused initiatives. Service marketing includes collateral, presentations, seminars, and other promotions with voice of the customer for specific service offers.
Programmatic and comprehensive. Service marketing - target-market and segment focused to establish differentiation.
Strategic and global, service portfolio reflects and supports brand and industries. Service portfolio management and strategic marketing efforts aligned.
Brand, thought leadership, and innovation are established and supported through all marketing activities.
High brand value.
Tea
m D
efin
itio
n
and
Co
mp
osi
tio
n
None. Lack of service marketing organizational definition.
Organizational structure includes borrowed or rotational roles to support service marketing efforts.
Permanent service marketing roles defined, staffed and funded.
Effective service marketing leadership and management.
Service marketing organization is strategic and continually impacts company's success.
Mar
keti
ng
Bu
dg
et P
lan
/
Bu
sin
ess
Pla
n
No budgeting for service marketing. Business planning does not incorporate service marketing.
Ad hoc, one off, impact not measurable.
Budgeting includes service marketing costs and projected results. Business planning capabilities are based on individuals' experiences.
Budgeting process fully incorporates service marketing investments, revenue, profit planning. Mature business planning capabilities.
Service marketing and portfolio planning is a strategic component of annual budgeting process.
Decisions to fund service marketing are based on complex, reliable business modeling levers as part of budget plan. Service marketing business plan justification is mature - comprehensive, fact-based, insightful.
Source: SPI Research, February 2021
SPI Research recommends organizations start with service marketing – building a compelling website
and on-line brand, creating lead generation campaigns, sales tools, service descriptions, service
packages and value-based presentations. Each of these activities will add value to the organization and
will start to build brand-awareness and generate leads. After the organization gains success and traction
with service marketing it will be in a better position to tackle true service lifecycle management, which
not only involves sales and marketing but also extends to product management and service execution
with repeatable solution delivery tools, methods and systems.

2021 Professional Services Maturity™ Benchmark
© 2021 Service Performance Insight, LLC www.timelog.dk 82
PS Sales Effectiveness Metrics
Service sales effectiveness is a
subjective question but typically
refers to the percentage of
salespeople who achieve quota and
the probability that the sales
organization will achieve its
forecast and targets. SPI Research
asked respondents to rank the
effectiveness of the service sales
organization on a scale from 1 to 5
with 5 representing perfection
(Table 57). Sales effectiveness has
a profound impact on all aspects of
PS but unfortunately 8.6% of
respondents give sales
effectiveness a failing grade of 1 or 2; 36.2% give sales effectiveness an “OK” score of 3; 55.2% give sales
effectiveness high marks. This year’s average rating of sales effectiveness declined to 3.56 (71.2%) from
3.61 (72.2%) last year.
ESOs gave higher marks for sales effectiveness (3.64 or 72.8%) than independents (3.53 or 70.6%). By
geography, EMEA gave the highest score of 3.59 (71.8%) and APAC gave the lowest of 3.5(70%).
Survey Results
The following section reviews and analyzes 2021 PS Maturity™ benchmark results from 561 participating
Professional services organizations. In this section SPI Research analyzes 20 Client Relationship key
performance measurements that are critical for measuring sales, marketing and solution development
effectiveness. The impact of the on-going Corona Virus pandemic can be seen in a decline in almost all
sales and marketing metrics.
The percentage of overall revenue from new clients is an important indicator of market expansion. A
higher percentage of new client revenue shows the organization is expanding beyond its installed
base. The size of the deal pipeline, the percentage of revenue from new clients, the length of the sales
cycle and win ratios all declined year over year. The only client relationships metric which improved
this year was client referenceability with slight improvement from 72.2% to 72.7% (Table 58).
The Win ratio shows the number of winning proposals for every 10 proposals submitted. It is a strong
indicator of the level of competition and portends market saturation when the win ratio declines below
5, indicating firms are winning less than 50% of their opportunities.
Table 57: Impact – Service Sales Effectiveness
Service sales effectiveness
Survey %
Rev. growth
Deal pipeline
% of ann. rev. target
% of ann.
margin target
Very ineffective 0.9% 9.2% 50% 81.7% 75.0%
Ineffective 7.7% 2.8% 159% 86.4% 86.3%
Neither 36.2% 6.2% 173% 90.4% 88.8%
Effective 45.3% 7.5% 188% 93.5% 91.5%
Very effective 9.9% 9.6% 209% 97.0% 95.4%
Total/Average 100.0% 6.9% 181% 92.1% 90.3%
Source: SPI Research, February 2021

2021 Professional Services Maturity™ Benchmark
© 2021 Service Performance Insight, LLC www.timelog.dk 83
Table 58: Client Relationships KPIs by Organization Type and Geographic Region
Key Performance Indicator 2019 2020 ESO PSO Amer. EMEA APac
Surveys 513 561 171 390 445 84 32
Revenue from new clients 30.8% 28.2% 36.6% 24.7% 28.7% 25.2% 27.9%
Win ratio (per 10 bids) 5.27 5.18 5.13 5.20 5.22 5.02 5.00
Deal pipeline / qtr. bookings forecast 181% 179% 197% 172% 172% 203% 213%
Length of the Sales cycle (days: qualified lead to contract signing)
87 90 103 84 90 89 76
Average Service discount 7.6% 7.6% 10.9% 6.2% 7.8% 6.9% 5.4%
Percentage of referenceable clients 72.2% 72.7% 67.2% 75.0% 73.1% 70.9% 72.7%
Solution development effectiveness 3.72 3.69 3.75 3.66 3.69 3.75 3.50
Service sales effectiveness 3.61 3.56 3.64 3.53 3.56 3.59 3.50
Service marketing effectiveness 3.21 3.12 3.06 3.15 3.14 3.00 3.18
Source: SPI Research, February 2021
The size of the deal pipeline is an important predictor of future revenue. The size of the deal pipeline in
comparison to the quarterly sales forecast declined to 179% from 181% in 2019. Table 58 shows the
size of the deal pipeline compared to the quarterly bookings forecast is stronger for ESOs. Independent
PSO pipelines declined to 172% from 176% last year. By geography the deal pipeline is strongest for Asia
Pacific and weakest for the Americas.
The level of discounting is an indicator of increased competition or slowing demand. Average
discounts remained the same year over year at 7.6%. In services, discounting has a direct impact on
profit as it is impossible to make up price concessions with volume. ESOs consistently report higher
levels of discounting, longer sales cycles and fewer client references than independents.
By organization size, the deal pipeline is strongest for the largest organizations (>700 employees) and
weakest for the smallest (Table 59). The smallest firms tend to live deal to deal with limited future
visibility. Interestingly, client reference-ability tends to decline with organization size while level of
discounting increases. For small firms, making every client a success at a reasonable price is a business
imperative. Interestingly, the length of the sales cycle in 2020 was only slightly longer than in 2019 (90
days compared to 87 days) despite tremendous market uncertainty.

2021 Professional Services Maturity™ Benchmark
© 2021 Service Performance Insight, LLC www.timelog.dk 84
Table 59: Client Relationships KPIs by Organization Size
Key Performance Indicator Under
10 10 - 30 31 - 100 101 - 300
301 - 700
Over 700
Surveys 62 108 170 111 48 62
Revenue from new clients 36.5% 30.9% 27.4% 24.3% 25.8% 24.6%
Bid-to-Win ratio (per 10 bids) 5.04 5.46 5.34 4.95 4.66 5.21
Deal pipeline relative to qtr. bookings forecast 122% 151% 207% 196% 168% 200%
Sales cycle (days: qualified lead to contract sign.) 78 88 91 95 88 90
Service discount given clients 6.8% 6.0% 7.5% 7.6% 8.6% 11.3%
Percentage of referenceable clients 75.0% 76.3% 74.6% 68.5% 66.4% 70.7%
Solution development effectiveness 3.74 3.71 3.65 3.62 3.50 4.00
Service sales effectiveness 3.51 3.48 3.57 3.59 3.46 3.83
Service marketing effectiveness 2.96 3.08 3.18 3.05 3.08 3.44
Source: SPI Research, February 2021
By vertical, embedded Software and SaaS PSOs and IT Consultancies reported the strongest deal
pipelines while accountancies and Managed Service providers reported the weakest. Management
Consultancies and Architects and Engineers reported the highest levels of client reference-ability while
embedded SaaS and Software PSOs reported the poorest (66%). Service discounting was highest for
embedded Software ESOs and lowest for Architects and Engineers (3.7%).
Table 60: Client Relationships KPIs by Vertical Market
Key Performance Indicator IT Consult Mgmt
Consult SaaS Software AEC
Surveys 143 84 64 55 35
Revenue from new clients 25.0% 27.3% 48.3% 28.8% 21.6%
Bid-to-Win ratio (per 10 bids) 5.02 5.51 5.06 5.45 5.18
Deal pipeline relative to qtr. bookings forecast 190% 175% 209% 197% 150%
Sales cycle (days: qualified lead to contract sign.) 86 85 111 102 82
Service discount given clients 7.0% 6.3% 14.4% 9.8% 3.7%
Percentage of referenceable clients 74.2% 81.5% 69.2% 66.0% 76.4%
Solution development effectiveness 3.63 3.77 3.85 3.77 3.62
Service sales effectiveness 3.52 3.49 3.54 3.70 3.62
Service marketing effectiveness 3.00 3.21 2.92 3.00 3.15
Source: SPI Research, February 2021
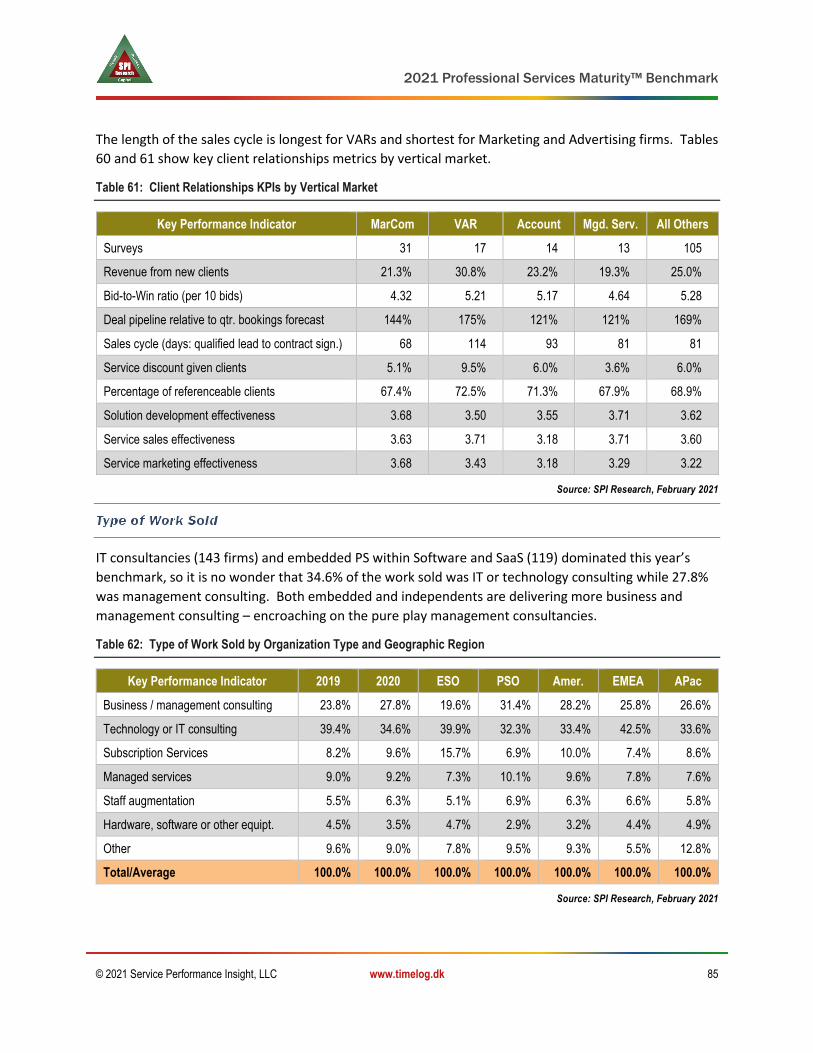
2021 Professional Services Maturity™ Benchmark
© 2021 Service Performance Insight, LLC www.timelog.dk 85
The length of the sales cycle is longest for VARs and shortest for Marketing and Advertising firms. Tables
60 and 61 show key client relationships metrics by vertical market.
Table 61: Client Relationships KPIs by Vertical Market
Key Performance Indicator MarCom VAR Account Mgd. Serv. All Others
Surveys 31 17 14 13 105
Revenue from new clients 21.3% 30.8% 23.2% 19.3% 25.0%
Bid-to-Win ratio (per 10 bids) 4.32 5.21 5.17 4.64 5.28
Deal pipeline relative to qtr. bookings forecast 144% 175% 121% 121% 169%
Sales cycle (days: qualified lead to contract sign.) 68 114 93 81 81
Service discount given clients 5.1% 9.5% 6.0% 3.6% 6.0%
Percentage of referenceable clients 67.4% 72.5% 71.3% 67.9% 68.9%
Solution development effectiveness 3.68 3.50 3.55 3.71 3.62
Service sales effectiveness 3.63 3.71 3.18 3.71 3.60
Service marketing effectiveness 3.68 3.43 3.18 3.29 3.22
Source: SPI Research, February 2021
IT consultancies (143 firms) and embedded PS within Software and SaaS (119) dominated this year’s
benchmark, so it is no wonder that 34.6% of the work sold was IT or technology consulting while 27.8%
was management consulting. Both embedded and independents are delivering more business and
management consulting – encroaching on the pure play management consultancies.
Table 62: Type of Work Sold by Organization Type and Geographic Region
Key Performance Indicator 2019 2020 ESO PSO Amer. EMEA APac
Business / management consulting 23.8% 27.8% 19.6% 31.4% 28.2% 25.8% 26.6%
Technology or IT consulting 39.4% 34.6% 39.9% 32.3% 33.4% 42.5% 33.6%
Subscription Services 8.2% 9.6% 15.7% 6.9% 10.0% 7.4% 8.6%
Managed services 9.0% 9.2% 7.3% 10.1% 9.6% 7.8% 7.6%
Staff augmentation 5.5% 6.3% 5.1% 6.9% 6.3% 6.6% 5.8%
Hardware, software or other equipt. 4.5% 3.5% 4.7% 2.9% 3.2% 4.4% 4.9%
Other 9.6% 9.0% 7.8% 9.5% 9.3% 5.5% 12.8%
Total/Average 100.0% 100.0% 100.0% 100.0% 100.0% 100.0% 100.0%
Source: SPI Research, February 2021

2021 Professional Services Maturity™ Benchmark
© 2021 Service Performance Insight, LLC www.timelog.dk 86
Table 62 depicts the types of work sold by embedded and independent service providers and by major
geographic regions. This year ESOs delivered 19.6% of their work as management consulting, showing
the shift towards more business process consulting, away from pure technology implementation. They
also have been growing their subscription and managed service revenues. Almost all PSOs provide some
level of staff augmentation whether it is buying access to a solution architect or “renting” expertise.
Many services do not really warrant or require a detailed statement of work as specific resources with
specific skills are only required on a temporary basis to fill a skills gap or accomplish a specific task.
Today many IT consultancies have equal numbers of business analysts and technical consultants – they
focus on business process improvement and streamlining cumbersome business processes. Increasingly
technology-focused PS providers are adding industry and domain experts to ensure horizontal
technologies can be adopted and modified to reflect the unique needs of vertical industry clients. The
underlying technologies themselves no longer require extensive customization and integration; they
have become easier to install and integrate with standard data loaders and connectors. Ensuring user
adoption has become the primary concern of embedded ESOs. This means today’s consultants need to
understand business processes and what business users want and need to drive user adoption.
Technology consulting now includes workflow mapping, business process modelling, rollout plans and
administrator and end-user training, all with a focus on user adoption.
Increasingly the majority of professional services are delivered virtually or remotely so one of the most
important investment areas has become virtual collaboration and messaging platforms like SLACK
(acquired by Salesforce for $27.7 billion) and Zoom.
Table 63: Type of Work Sold by Organization Size
Key Performance Indicator Under
10 10 - 30 31 - 100 101 - 300
301 - 700
Over 700
Business / management consulting 52.0% 33.5% 28.0% 19.3% 14.8% 16.7%
Technology or IT consulting 21.3% 33.6% 34.5% 41.8% 34.4% 37.6%
Subscription Services 5.8% 8.1% 10.8% 6.8% 10.6% 17.6%
Managed services 5.7% 5.9% 9.3% 11.6% 14.0% 10.6%
Staff augmentation 4.3% 4.6% 5.4% 8.2% 14.2% 4.6%
Hardware, software or other equipment resale 2.5% 3.2% 3.7% 4.1% 2.1% 4.4%
Other 8.3% 11.1% 8.2% 8.2% 9.9% 8.6%
Total/Average 100.0% 100.0% 100.0% 100.0% 100.0% 100.0%
Source: SPI Research, February 2021
Managed service revenue has increased slightly over the past five years from 7.3% in 2012 to 9.2% in
2020 but this increase is not as dramatic as we would have expected. The greatest shift has been in the
rise of subscription services, growing from 2.4% of revenue three years ago to 9.6% this year. Expect
subscription revenues to continue to climb as vendors are increasingly pricing a combination of
hardware, software, consulting and support “as a service”.

2021 Professional Services Maturity™ Benchmark
© 2021 Service Performance Insight, LLC www.timelog.dk 87
Tables 64 and 65 depict the business mix by vertical segments. In this benchmark, staff augmentation
has been increasing each year to 6.3%. It appears that every segment provides some level of
“providing/renting” a person or bank of hours in addition to statement of work driven projects.
Table 64: Type of Work Sold by Vertical Market
Key Performance Indicator IT Consult Mgmt.
Consult SaaS PS Software
PS Arch./ Engr.
Business / management consulting 10.1% 77.5% 20.0% 12.0% 21.4%
Technology or IT consulting 63.9% 9.6% 36.4% 51.3% 12.9%
Subscription Services 4.5% 2.9% 21.3% 13.9% 9.4%
Managed services 9.2% 3.8% 6.7% 7.7% 25.0%
Staff augmentation 7.1% 3.9% 4.9% 4.9% 4.6%
Hardware, software or other equipment resale 4.0% 0.4% 1.7% 4.5% 3.3%
Other 1.2% 2.1% 9.0% 5.7% 23.4%
Total/Average 100.0% 100.0% 100.0% 100.0% 100.0%
Source: SPI Research, February 2021
Table 65: Type of Work Sold by Vertical Market
Key Performance Indicator MarCom VAR Account Mgd. Serv. All Others
Business / management consulting 47.7% 4.1% 42.9% 68.1% 18.4%
Technology or IT consulting 2.8% 52.8% 10.0% 14.2% 23.9%
Subscription Services 16.3% 21.4% 14.3% 1.9% 8.7%
Managed services 15.0% 3.8% 7.1% 5.8% 10.6%
Staff augmentation 5.5% 4.1% 9.3% 4.6% 9.9%
Hardware, software or other equipment resale 1.8% 10.2% 2.9% 2.3% 5.6%
Other 10.8% 3.5% 13.6% 3.1% 22.9%
Total/Average 100.0% 100.0% 100.0% 100.0% 100.0%
Source: SPI Research, February 2021
Interestingly, the types of consulting organizations who derive a significant portion of revenue from
managed services are architects and engineers (25.0%). These firms focus on annual contracts and
retainers where they outsource entire business processes. Most SaaS embedded ESOs have started
adding managed service offers as they out-task elements of running their applications for their clients.
For many independents, the promise of managed services as a source of annuity revenue has not been
fully realized because the technology manufacturers themselves have grabbed these opportunities by
offering better economies of scale and enhanced security.

2021 Professional Services Maturity™ Benchmark
© 2021 Service Performance Insight, LLC www.timelog.dk 88
The percentage of revenue from new clients is a strong predictor of market expansion. The fastest
growing firms derive over 30% of revenue from new clients. In PS there is a strong correlation between
growth and profitability. New client growth is a critical component of success.
The bottom-line is PS organizations must constantly expand their markets, clients and solution
repertoire to stay in touch with market changes and ahead of the competition. New clients allow PSOs
to reap the benefits of previous client experiences and knowledge without the baggage of long-term
relationships in which both provider and client may have become complacent. New clients provide the
opportunity to expand knowledge, skills and expertise (Table 66).
Table 66: Impact – Percentage of Revenue from New Clients
Percentage of new clients Survey %
Revenue growth Win Ratio
Size of Pipeline
Revenue per
consultant Revenue per
employee EBITDA
Under 10% 34.4% 9.2% 4.85 153.4% $191 $160 14.2%
10% - 20% 12.3% 7.0% 5.31 205.3% $213 $172 14.4%
20% - 30% 17.5% 9.1% 5.31 197.3% $211 $171 18.1%
30% - 40% 10.7% 8.1% 5.44 179.7% $186 $150 16.7%
40% - 50% 7.7% 5.2% 5.45 165.1% $223 $184 12.0%
Over 50% 17.5% 10.8% 5.04 178.3% $205 $165 16.7%
Total / Average 100.0% 8.7% 5.18 179.3% $203 $165 15.8%
Source: SPI Research, February 2021
Primary target buyer depicts the title of key buyers such as CEO, CFO, CIO, Line of Business or Purchasing
SPI Research asked, “who is the primary buyer for your services”? For the 561 benchmark respondents,
the primary target buyer is most likely to be a Line of Business executive, as business leaders have
increasingly taken charge of their applications and have wrested control from the IT organization.
Table 67 correlates primary buyer type with other key metrics. Without knowing other aspects, it is
hard to come up with definitive best practices, but this analysis does reveal some interesting
comparisons. This year selling to the CEO produced the best EBITDA but the smallest pipeline.
Surprisingly the very few firms who sell primarily to purchasing reported the strongest revenue growth.

2021 Professional Services Maturity™ Benchmark
© 2021 Service Performance Insight, LLC www.timelog.dk 89
Table 67: Impact – Primary target buyer for services
Primary target buyer for services
Survey %
Revenue growth
New clients
Bid-to-win ratio
Deal pipeline
Project margin EBITDA
CEO 13.0% 8.9% 31.9% 5.26 145.8% 34.1% 21.6%
COO 6.7% 9.7% 35.0% 5.48 203.7% 35.9% 17.5%
CIO 22.9% 8.4% 25.2% 5.49 201.0% 36.6% 12.6%
Line of Business 39.4% 7.1% 26.2% 5.12 182.2% 36.3% 14.7%
Purchasing 1.3% 17.1% 32.3% 5.42 150.0% 45.2% 19.5%
Other 16.7% 6.1% 25.8% 4.89 170.1% 35.0% 18.5%
Total / Average 100.0% 7.8% 27.3% 5.21 180.5% 36.0% 15.9%
Source: SPI Research, February 2021
Bid-to-Win ratio measures the number of wins per ten bids. The Bid-to-Win ratio is a powerful metric for
judging sales and marketing effectiveness but must be analyzed in conjunction with the size of the
pipeline; the length of the sales cycle and the cost to pursue the bid.
If the Bid-to-Win ratio is too high, it may be an indication that the organization is not aggressive enough
in targeting new clients and new services. If it is extremely low, it is an indication the firm is competing
in a commoditized market or is not well-positioned or is not doing a good job of qualifying deals. The
best deals are those that do not require a bid (sole source) because the client has done business with
the firm before and knows they will do a good job, or they are so clearly the premium supplier that no
other providers needs be considered.
Table 68 shows the positive impact
of improving bid to win ratios
through better deal qualification;
reference selling; improved
positioning to target the right
markets and clients; and improving
overall quality and client
satisfaction resulting in more and
better referrals. This year the
optimal ratio is over 7 wins with the
highest revenue and employee
growth; and best on-time project
delivery. The win ratio declined in
2020 to 5.18 from 5.27 in 2019 as
Table 68: Impact – Bid-to-win ratio (per 10 bids)
Bid-to-win ratio (per 10 bids)
Survey %
Rev. growth
Head- count
growth
% new client Rev.
On-time proj. del.
1 - 2 wins 9.7% 5.4% 1.9% 23.0% 77.1%
3 - 4 wins 26.5% 4.9% 1.9% 26.8% 77.2%
5 - 6 wins 37.1% 7.0% 5.2% 27.7% 79.1%
7 - 8 wins 22.4% 12.1% 9.4% 28.2% 83.3%
Over 8 wins 4.3% 9.9% 8.9% 28.7% 85.0%
Total/Average 100.0% 7.6% 5.1% 27.1% 79.6%
Source: SPI Research, February 2021

2021 Professional Services Maturity™ Benchmark
© 2021 Service Performance Insight, LLC www.timelog.dk 90
purchasing cycles were delayed and fewer new deals were available due to the Corona Virus pandemic.
The deal pipeline as compared to the quarterly bookings forecast provides insight into sales effectiveness
and future revenue. The size of the deal pipeline shows direct correlation to all major growth indicators
– revenue growth; revenue per billable employee; percentage achievement of annual revenue and
margin targets and billable utilization.
A sign of caution and continued
market turbulence is that 43.1% of
benchmark participants reported
their deal pipeline was less than
two times their forecast.
Table 69 illustrates the positive
impact of a strong sales pipeline on
revenue growth; backlog; on-time
project delivery and client
referenceability.
Table 70 shows the average size of
the deal pipeline declined year over
year to 179%. ESOs reported
healthy pipelines of 197% of
forecast while independents reported leaner pipelines of 172%; independents reported a steep decline
in their deal pipelines from 176% in 2019. Asia Pacific had the strongest (213%) deal pipeline relative to
quarterly bookings forecast, while the Americas had the weakest (172%). Pipelines grew in APac and
EMEA but decreased in the Americas. By vertical, ESOs within Software companies reported the largest
pipelines. Clearly Cloud Application providers are prospering as companies in all industries retool and
transform their application infrastructure from on-premise to the cloud due to lower cost of ownership,
superior functionality, ease of use and ability to support.
Table 69: Impact – Size of deal pipeline
Deal Pipeline Survey
% Rev.
growth
Qtr. revenue target in backlog
On-time proj.
delivery Client refer.
Less than forecast 14.8% 3.2% 30.3% 77.8% 68.6%
Same as forecast 30.3% 7.8% 38.5% 79.5% 72.1%
2X forecast 29.4% 7.4% 45.6% 79.6% 72.4%
3X forecast 19.0% 10.9% 52.2% 80.3% 73.5%
4X forecast 6.4% 8.1% 51.0% 83.3% 76.8%
Total/Average 100.0% 7.6% 42.8% 79.7% 72.2%
Source: SPI Research, February 2021

2021 Professional Services Maturity™ Benchmark
© 2021 Service Performance Insight, LLC www.timelog.dk 91
The length of the sales cycle
measures the time it takes to move
a qualified lead to a signed
contract. Sales cycle length is a
leading indicator of demand as
sales cycles elongate when the
economy is contracting and shrink
when the economy is expanding.
Table 71 shows roughly 56% of
respondents reported sales cycles
of under 90 days while the other
44% reported sales cycles longer
than 90 days. Shorter sales cycles
have a positive impact on revenue
Table 70: Year-over-year change – Deal Pipeline
Deal Pipeline 2019 2020 ▲
Total Survey 181% 179% -0.9%
Embedded services organizations 193% 197% 2.1%
Independent services organizations 176% 172% -2.3%
Americas 183% 172% -5.9%
EMEA 173% 203% 17.3%
APac 179% 213% 18.7%
IT Consulting 181% 190% 5.1%
Management Consulting 172% 175% 1.6%
PS within SaaS Company 217% 209% -3.7%
PS within Software Company 190% 197% 3.6%
Architecture/Engineering 174% 150% -13.8%
Advertising/Mktg/PR 168% 144% -14.2%
Value-added Reseller (VAR) 155% 175% 12.9%
Accounting 141% 121% -14.3%
Source: SPI Research, February 2021
Table 71: Impact – Sales cycle (days: qualified lead to contract sign.)
Sales cycle Survey
% Rev.
growth New
clients Deal
pipeline Project margin
Under 30 days 5.3% 10.8% 24.4% 135% 37.3%
30 - 60 days 19.7% 9.1% 26.9% 147% 37.5%
60 - 90 days 31.0% 7.8% 30.5% 178% 37.1%
90 - 120 days 23.3% 6.4% 28.5% 208% 35.5%
120 - 150 days 10.0% 6.3% 26.4% 194% 33.4%
Over 150 days 10.6% 7.8% 21.0% 196% 31.7%
Total/Average 100.0% 7.7% 27.6% 180% 35.9%
Source: SPI Research, February 2021

2021 Professional Services Maturity™ Benchmark
© 2021 Service Performance Insight, LLC www.timelog.dk 92
growth and on-time project delivery,
but longer sales cycles appear to
increase the size of the deal pipeline.
Table 72 shows year over year changes
in the length of the sales cycles. Both
ESOs and Independents reported
slightly longer sales cycles. By
geography, the average sales cycle
increased with the sharpest increase
reported in EMEA.
Significantly longer sales cycles were
reported by all verticals except ESOs
within enterprise software companies.
Accountancies and VARS reported the
largest increase in sales cycles.
Average service discount depicts
the average discount or price
concession from list price.
In professional services, it is far
more difficult to develop a pricing
strategy than in product-based
organizations. It is easy to do
comparative shopping at a grocery
store or for products on-line. In
professional services, pricing is
more art than science with wider
variability in terms of costs,
estimates, proposals and pricing.
Professional services executives
Table 72: Year-over-year change – Length of sales cycle (days)
Sales cycle 2019 2020 ▲
Total Survey 87 90 2.4%
Embedded services organizations 101 103 2.4%
Independent services organizations 81 84 3.1%
Americas 89 90 1.3%
EMEA 82 89 9.3%
APac 75 76 2.5%
IT Consulting 82 86 4.9%
Management Consulting 78 85 8.7%
PS within SaaS Company 100 111 10.9%
PS within Software Company 104 102 -1.5%
Architecture/Engineering 79 82 3.9%
Advertising/Mktg/PR 66 68 2.5%
Value-added Reseller (VAR) 96 114 18.3%
Accounting 66 93 41.4%
Source: SPI Research, February 2021
Table 73: Impact – Service Discounting
Average Service Discount
Survey %
Bid-to-win ratio
Deal pipeline Billable util.
On-time proj.
delivery
None 20.1% 5.38 151% 73.3% 84.0%
Under 5% 25.5% 5.28 184% 72.4% 82.2%
5% - 10% 29.1% 5.18 189% 70.8% 76.7%
10% - 20% 19.1% 4.74 184% 68.9% 80.1%
20% - 30% 4.1% 4.66 189% 69.7% 72.1%
Over 30% 2.1% 5.85 190% 68.9% 62.8%
Total/Average 100.0% 5.15 179% 71.3% 79.7%
Source: SPI Research, February 2021
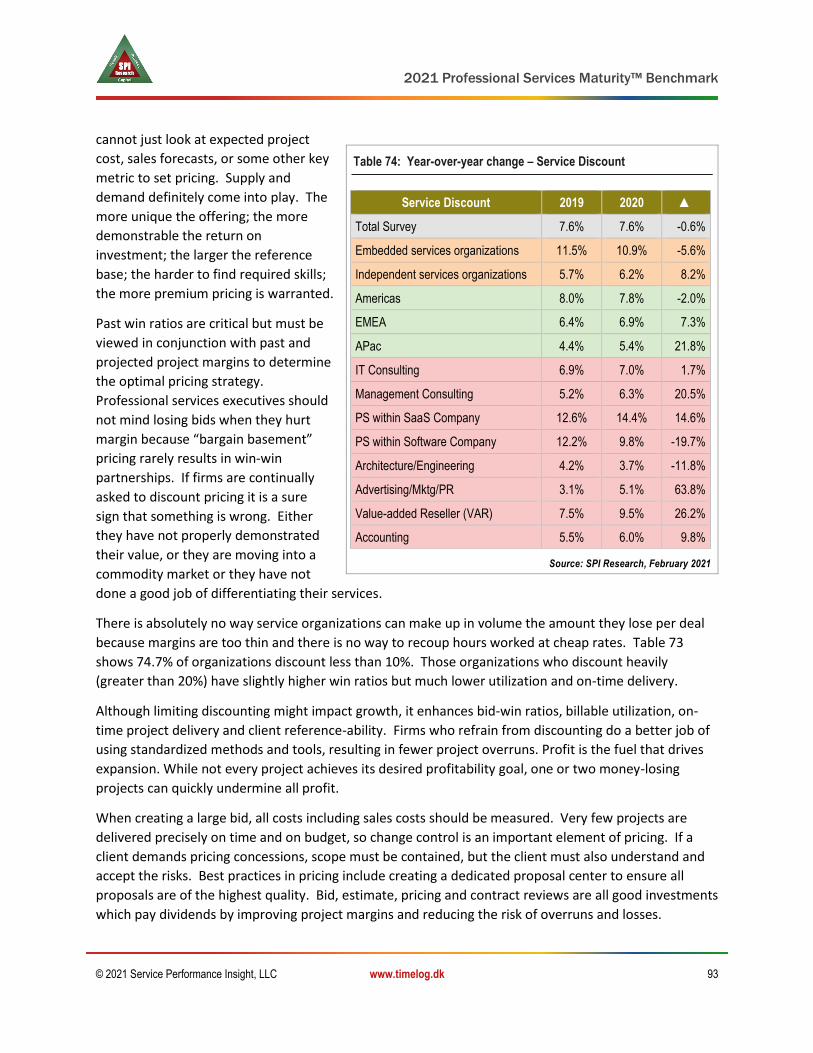
2021 Professional Services Maturity™ Benchmark
© 2021 Service Performance Insight, LLC www.timelog.dk 93
cannot just look at expected project
cost, sales forecasts, or some other key
metric to set pricing. Supply and
demand definitely come into play. The
more unique the offering; the more
demonstrable the return on
investment; the larger the reference
base; the harder to find required skills;
the more premium pricing is warranted.
Past win ratios are critical but must be
viewed in conjunction with past and
projected project margins to determine
the optimal pricing strategy.
Professional services executives should
not mind losing bids when they hurt
margin because “bargain basement”
pricing rarely results in win-win
partnerships. If firms are continually
asked to discount pricing it is a sure
sign that something is wrong. Either
they have not properly demonstrated
their value, or they are moving into a
commodity market or they have not
done a good job of differentiating their services.
There is absolutely no way service organizations can make up in volume the amount they lose per deal
because margins are too thin and there is no way to recoup hours worked at cheap rates. Table 73
shows 74.7% of organizations discount less than 10%. Those organizations who discount heavily
(greater than 20%) have slightly higher win ratios but much lower utilization and on-time delivery.
Although limiting discounting might impact growth, it enhances bid-win ratios, billable utilization, on-
time project delivery and client reference-ability. Firms who refrain from discounting do a better job of
using standardized methods and tools, resulting in fewer project overruns. Profit is the fuel that drives
expansion. While not every project achieves its desired profitability goal, one or two money-losing
projects can quickly undermine all profit.
When creating a large bid, all costs including sales costs should be measured. Very few projects are
delivered precisely on time and on budget, so change control is an important element of pricing. If a
client demands pricing concessions, scope must be contained, but the client must also understand and
accept the risks. Best practices in pricing include creating a dedicated proposal center to ensure all
proposals are of the highest quality. Bid, estimate, pricing and contract reviews are all good investments
which pay dividends by improving project margins and reducing the risk of overruns and losses.
Table 74: Year-over-year change – Service Discount
Service Discount 2019 2020 ▲
Total Survey 7.6% 7.6% -0.6%
Embedded services organizations 11.5% 10.9% -5.6%
Independent services organizations 5.7% 6.2% 8.2%
Americas 8.0% 7.8% -2.0%
EMEA 6.4% 6.9% 7.3%
APac 4.4% 5.4% 21.8%
IT Consulting 6.9% 7.0% 1.7%
Management Consulting 5.2% 6.3% 20.5%
PS within SaaS Company 12.6% 14.4% 14.6%
PS within Software Company 12.2% 9.8% -19.7%
Architecture/Engineering 4.2% 3.7% -11.8%
Advertising/Mktg/PR 3.1% 5.1% 63.8%
Value-added Reseller (VAR) 7.5% 9.5% 26.2%
Accounting 5.5% 6.0% 9.8%
Source: SPI Research, February 2021
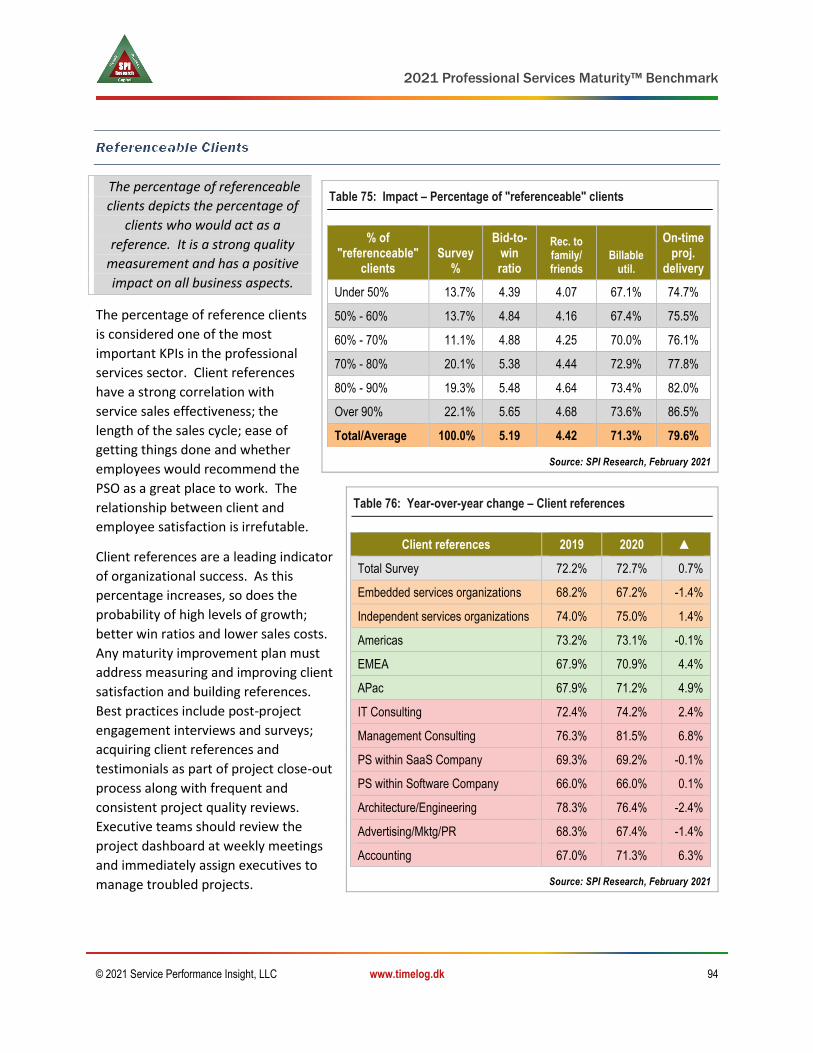
2021 Professional Services Maturity™ Benchmark
© 2021 Service Performance Insight, LLC www.timelog.dk 94
The percentage of referenceable
clients depicts the percentage of
clients who would act as a
reference. It is a strong quality
measurement and has a positive
impact on all business aspects.
The percentage of reference clients
is considered one of the most
important KPIs in the professional
services sector. Client references
have a strong correlation with
service sales effectiveness; the
length of the sales cycle; ease of
getting things done and whether
employees would recommend the
PSO as a great place to work. The
relationship between client and
employee satisfaction is irrefutable.
Client references are a leading indicator
of organizational success. As this
percentage increases, so does the
probability of high levels of growth;
better win ratios and lower sales costs.
Any maturity improvement plan must
address measuring and improving client
satisfaction and building references.
Best practices include post-project
engagement interviews and surveys;
acquiring client references and
testimonials as part of project close-out
process along with frequent and
consistent project quality reviews.
Executive teams should review the
project dashboard at weekly meetings
and immediately assign executives to
manage troubled projects.
Table 75: Impact – Percentage of "referenceable" clients
% of "referenceable"
clients Survey
%
Bid-to-win ratio
Rec. to family/ friends
Billable util.
On-time proj.
delivery
Under 50% 13.7% 4.39 4.07 67.1% 74.7%
50% - 60% 13.7% 4.84 4.16 67.4% 75.5%
60% - 70% 11.1% 4.88 4.25 70.0% 76.1%
70% - 80% 20.1% 5.38 4.44 72.9% 77.8%
80% - 90% 19.3% 5.48 4.64 73.4% 82.0%
Over 90% 22.1% 5.65 4.68 73.6% 86.5%
Total/Average 100.0% 5.19 4.42 71.3% 79.6%
Source: SPI Research, February 2021
Table 76: Year-over-year change – Client references
Client references 2019 2020 ▲
Total Survey 72.2% 72.7% 0.7%
Embedded services organizations 68.2% 67.2% -1.4%
Independent services organizations 74.0% 75.0% 1.4%
Americas 73.2% 73.1% -0.1%
EMEA 67.9% 70.9% 4.4%
APac 67.9% 71.2% 4.9%
IT Consulting 72.4% 74.2% 2.4%
Management Consulting 76.3% 81.5% 6.8%
PS within SaaS Company 69.3% 69.2% -0.1%
PS within Software Company 66.0% 66.0% 0.1%
Architecture/Engineering 78.3% 76.4% -2.4%
Advertising/Mktg/PR 68.3% 67.4% -1.4%
Accounting 67.0% 71.3% 6.3%
Source: SPI Research, February 2021

2021 Professional Services Maturity™ Benchmark
© 2021 Service Performance Insight, LLC www.timelog.dk 95
As shown in Table 76 ESOs continued to lose ground with referenceable clients. Given the charter of
ESOs which is increasingly focused on adoption, and expansion poor referenceability must be addressed.
Service productizing is a key improvement priority to decrease implementation time and increase client
knowledge and self-sufficiency.
Pricing structure refers to the percentage of work sold by deal structure: time and materials; fixed fee;
performance-based; subscription; managed services or other.
Every year, SPI Research has seen a shift in pricing and deal structure. As clients have become
increasingly concerned about risk and cost overruns, they have pushed more accountability to the PSO
through fixed fee and shared risk contracts. Until 2014 the percentage of fixed fee work steadily
increased from 35.5% in 2009 to 44% in 2013. In 2014 SPI Research saw a resurgence in time and
materials priced contracts – signaling increased demand for services. 2014 was the first time in eight
years that we saw an increase in time and materials pricing from 51.7% in 2013 to 58.8% in 2014 but
since that time we have seen a steady decline in time and materials priced contracts in favor of
subscription-priced and managed services.
Managed service contracts bundle hardware, software, services and technology refresh into a monthly
or annual contract price, often with response time and service level agreements. Time and materials-
based pricing puts emphasis on accurate resource management, time collection and reporting. Fixed
price pricing puts an emphasis on accurate estimates, project costing and change management. Either
way PSA applications are critical to support accurate time and cost capture and billing.
Table 77: Fee Structure by Organization Type and Geographic Region
Fee Structure 2019 2020 ESO PSO Americas EMEA APac
Time & Materials 47.6% 47.9% 38.8% 51.7% 46.1% 59.2% 47.9%
Fixed Time / Fixed Fee 34.1% 33.0% 35.5% 32.0% 33.4% 28.5% 37.6%
Shared Risk / Performance based 2.3% 1.7% 1.2% 2.0% 1.7% 1.0% 3.3%
Subscription Services 7.7% 7.3% 14.3% 4.3% 8.2% 2.8% 4.1%
Managed Services 6.7% 7.6% 8.2% 7.4% 8.0% 7.5% 2.7%
Other 1.6% 2.4% 1.9% 2.7% 2.5% 0.9% 4.4%
Total / Average 100.0% 100.0% 100.0% 100.0% 100.0% 100.0% 100.0%
Source: SPI Research, February 2021
Table 77 compares billing models for embedded and independent PSOs. ESOs have been steadily
shifting away from fixed fee contracts in favor of subscription and managed service pricing.
Independents have always preferred time and materials contracts; they are moving away from fixed
price work due to the cost and time overruns which are inherent with fixed price contracts. By

2021 Professional Services Maturity™ Benchmark
© 2021 Service Performance Insight, LLC www.timelog.dk 96
geography, time and materials is the prevalent pricing structure. EMEA predominantly sells time and
materials contracts although they are often “daily” contracts which are far less favorable for the service
provider than hourly contracts.
Table 78: Fee Structure by Organization Size
Key Performance Indicator Under 10 10 - 30 31 - 100 101 - 300 301 - 700 Over 700
Time & Materials 41.8% 55.8% 47.3% 53.2% 39.9% 35.6%
Fixed Time / Fixed Fee 45.8% 31.3% 33.5% 31.1% 27.4% 28.8%
Shared Risk / Performance based 1.0% 2.4% 1.9% 0.5% 2.6% 2.4%
Subscription Services 3.3% 6.1% 8.1% 5.9% 10.2% 12.8%
Managed Services 4.0% 3.7% 7.7% 6.8% 13.9% 16.8%
Other 4.1% 0.7% 1.5% 2.5% 5.9% 3.6%
Total / Average 100.0% 100.0% 100.0% 100.0% 100.0% 100.0%
Source: SPI Research, February 2021
Table 78 compares deal structure by size of organization. The percentage of managed services and
subscription or recurring revenues goes up proportionately with the size of the organization while the
percentage of fixed price contracts goes down.
By vertical, architects, marketing and advertising firms rely on fixed price contracts (Tables 79 and 80).
IT consultancies favor time and materials contracts (61.3%). As the SaaS market has become more
mature a greater emphasis is being placed on customer adoption, so SaaS firms focus on “time to value”
with subscription pricing which includes the cost of software and implementation services. Net profit is
not necessarily tied to pricing structure as it is possible to make good service margins with any type of
contract as long as costs, deliverables and client expectations are properly set. Accurate estimating,
excellent project management, good communication and change control are the most important
elements in ensuring quality services are delivered at planned margins.
Table 79: Fee Structure by Service Market Vertical
Fee Structure IT Consult Mgmt.
Consult SaaS PS Software PS Arch./ Engr.
Time & Materials 61.3% 54.2% 36.9% 43.7% 38.4%
Fixed Time / Fixed Fee 23.2% 33.6% 38.3% 35.4% 53.5%
Shared Risk / Performance based 1.2% 3.5% 0.5% 0.9% 1.3%
Subscription Services 4.1% 2.6% 19.2% 14.7% 3.1%
Managed Services 9.0% 4.2% 4.9% 4.7% 3.3%
Other 1.2% 1.9% 0.2% 0.5% 0.4%
Total / Average 100.0% 100.0% 100.0% 100.0% 100.0%
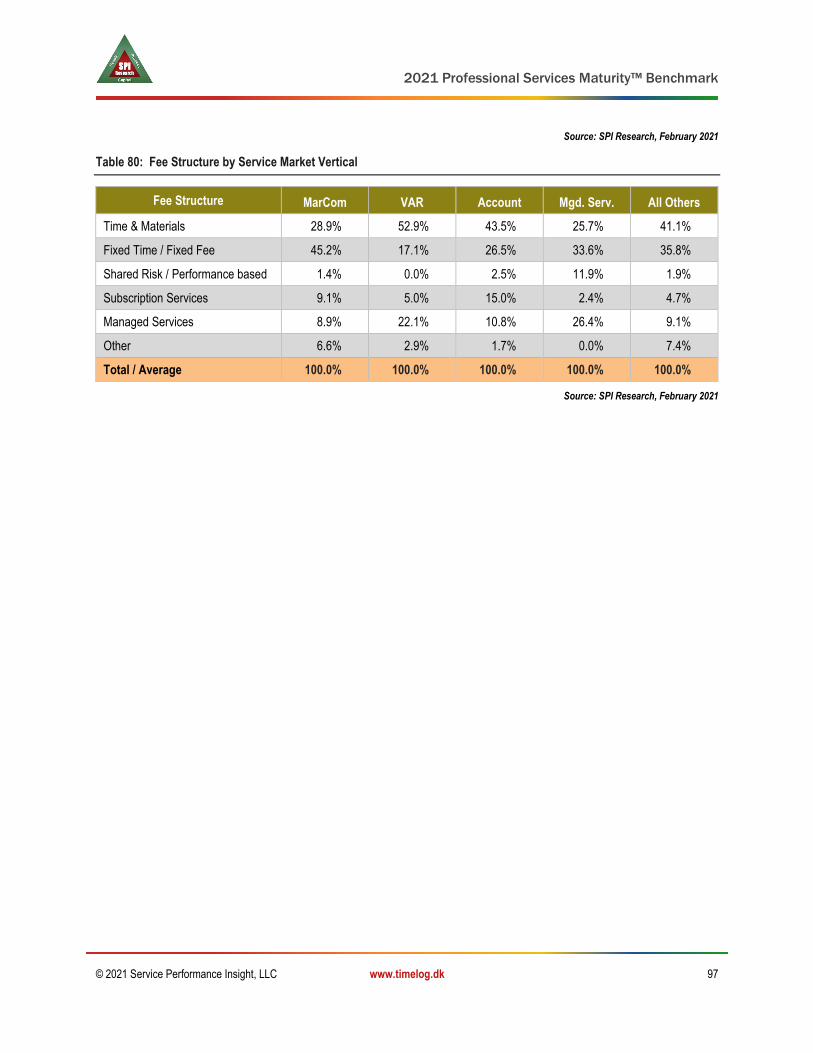
2021 Professional Services Maturity™ Benchmark
© 2021 Service Performance Insight, LLC www.timelog.dk 97
Source: SPI Research, February 2021
Table 80: Fee Structure by Service Market Vertical
Fee Structure MarCom VAR Account Mgd. Serv. All Others
Time & Materials 28.9% 52.9% 43.5% 25.7% 41.1%
Fixed Time / Fixed Fee 45.2% 17.1% 26.5% 33.6% 35.8%
Shared Risk / Performance based 1.4% 0.0% 2.5% 11.9% 1.9%
Subscription Services 9.1% 5.0% 15.0% 2.4% 4.7%
Managed Services 8.9% 22.1% 10.8% 26.4% 9.1%
Other 6.6% 2.9% 1.7% 0.0% 7.4%
Total / Average 100.0% 100.0% 100.0% 100.0% 100.0%
Source: SPI Research, February 2021
2021 Professional Services Maturity™ Benchmark
© 2021 Service Performance Insight, LLC www.timelog.dk 98
8. Talent Pillar
The shift to a digital economy is fundamentally rewriting the
rules of employment relationships. The Corona Virus
pandemic has accelerated the move to virtual operations and
accentuated the importance of collaboration and
communication tools to support remote service delivery.
Technologies like AI (Artificial Intelligence), Security, Mobile
and Analytics are fueling disruption and change in our personal
and professional lives.
SPI’s PS Maturity™ research over the past fourteen years supports the notion that only a handful (less
than 20%) of Professional services organizations achieve greatness. These leaders are able to quickly
seize market opportunities and drive best-in-class performance through the effective use of technology
in conjunction with enlightened management and workforce practices.
Over this same timeframe, real growth in billable hours (utilization) has been miniscule. Almost all PS
productivity improvement has come from the effective use of technology to lower overhead and
administrative costs in combination with the move to virtual (remote) consulting delivery. PS employees
are working the same number of annual hours (2,080 hours per year) but they are working smarter
through the use of agile development methodologies; virtual consulting delivery (limiting travel time);
maximizing multi-tasking across multiple projects while limiting administrative time for time and
expense capture and meetings. They are taking advantage of knowledge sharing and service
productizing to quickly support and propel employees to greater levels of expertise and productivity.
Firms are seeking younger workers with hot new skillsets— but competition to recruit them is fierce.
The millennial generation, born between 1981 and 1996, became the largest segment of the U.S.
workforce in 2016, supplanting retiring baby boomers. Millennial workers are less loyal than previous
generations, and more inclined to hop between jobs, which makes retention even harder. According to
a Gallup poll, in 2016, 21% of millennials switched jobs compared to fewer than 7% job change for older
workers. All firms must learn to manage multi-generational and multi-cultural workforces, especially
since we are seeing a younger and younger workforce (53.6% are under 40 years of age).
Attrition has been increasing steadily over the past ten years but declined in 2020 as workers not only
sheltered in place but also stayed in place in their jobs. Annual attrition declined to an all-time low of
5.5% according to SPI’s 2020 PS Talent benchmark which was conducted in the 2nd quarter of 2020 in the
midst of the pandemic. By the end of 2020 annualized attrition had ticked back up to 11.6%. Attrition is
one of the number one PS profit busters as it takes 120.7 work-days to recruit, hire and ramp new
consultants. A tremendous amount of time and money goes into recruiting highly skilled consultants – at
least 10% of base salary goes to recruiting fees plus the considerable amount of time management and
colleagues must devote to interviewing, reference checking, on-boarding, mentoring and acclimating
new workers.

2021 Professional Services Maturity™ Benchmark
© 2021 Service Performance Insight, LLC www.timelog.dk 99
A clear differentiator for all service providers is their ability to attract, retain and engage hard to find
talent. Establishing the firm as a great place to work is now of equal importance with cultivating a
reputation for quality delivery and excellent customer satisfaction.
SPI has tracked the number of annual consulting hours delivered off-site versus on the client’s site for
the past 14 years. Each year more and more work has been delivered virtually but the Covid pandemic
has permanently caused a shift to virtual operations. Firms are finding productivity has been improved
with virtual operations plus the cost and time of travel and commuting has been slashed. As the world
emerges from the pandemic, we expect many PSOs will move to hybrid operations with far fewer
employees required to travel to a client’s site or work in a headquarters office. Long term this means
firms can hire the best available employees, regardless of location and employees themselves can move
to lower cost locales or nearer family, enhancing their life-work balance.
Today’s consulting workforce is increasingly virtual, with more consulting hours delivered off-site as on
the client’s site this year. In this year’s benchmark, 60% of billable hours were delivered virtually. The
new world of consulting work depends on a global multi-lingual, multi-generational, multi-cultural,
technically skilled, project-based workforce. Analytic, organization and communication skills are fueling
this new world of work.
Top performing organizations continually point to their unique, employee-centered cultures as the
number one element in their business success. Culture is defined as the system of values, beliefs and
behaviors that define how work really gets done. Culture brings together the implicit and explicit
reward systems that define how an organization actually works in practice, no matter what an
organizational chart, business strategy, or corporate mission statement may say.
SPI Research’s “Talent” pillar encompasses all elements of the Professional Services workforce strategy.
Talent focuses on both the people processes and systems required to recruit, hire, ramp, retain and
motivate a high-quality consulting workforce. The following table shows how PSOs mature across the
Talent pillar:
Table 81: Talent Maturity Model
Level 1 Initiated
Level 2 Piloted
Level 3 Deployed
Level 4 Institutionalized
Level 5 Optimized
Tal
ent
Hire as needed. Generalist skills. Chameleons, Jack of all Trades. Individual heroics. May perform presales as well as consulting delivery.
Begin forecasting workload. Start developing job and skill descriptions & compensation plans. Rudimentary career paths. Start measuring employee satisfaction
Resource, skill and career management. Employee satisfaction surveys. Training plans. Goals and measurements aligned with compensation. Attrition <15%
Business process and vertical skills in addition to technical and project skills. Career ladder and mentoring programs. Training investments to support career. Low attrition, high satisfaction
Continually staff and train to meet future needs. Highly skilled, motivated workforce. Outsource commodity skills or peak demand. Sophisticated variable on and off-shore workforce model.
Source: SPI Research, February 2021
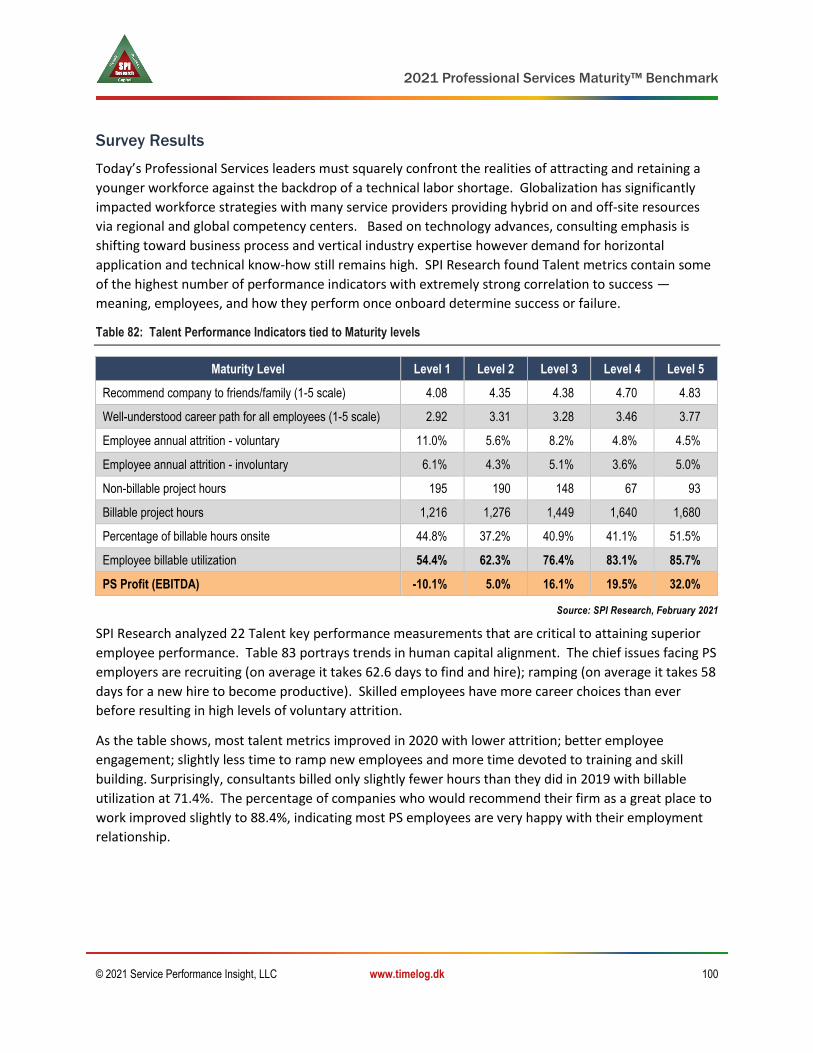
2021 Professional Services Maturity™ Benchmark
© 2021 Service Performance Insight, LLC www.timelog.dk 100
Survey Results
Today’s Professional Services leaders must squarely confront the realities of attracting and retaining a
younger workforce against the backdrop of a technical labor shortage. Globalization has significantly
impacted workforce strategies with many service providers providing hybrid on and off-site resources
via regional and global competency centers. Based on technology advances, consulting emphasis is
shifting toward business process and vertical industry expertise however demand for horizontal
application and technical know-how still remains high. SPI Research found Talent metrics contain some
of the highest number of performance indicators with extremely strong correlation to success —
meaning, employees, and how they perform once onboard determine success or failure.
Table 82: Talent Performance Indicators tied to Maturity levels
Maturity Level Level 1 Level 2 Level 3 Level 4 Level 5
Recommend company to friends/family (1-5 scale) 4.08 4.35 4.38 4.70 4.83
Well-understood career path for all employees (1-5 scale) 2.92 3.31 3.28 3.46 3.77
Employee annual attrition - voluntary 11.0% 5.6% 8.2% 4.8% 4.5%
Employee annual attrition - involuntary 6.1% 4.3% 5.1% 3.6% 5.0%
Non-billable project hours 195 190 148 67 93
Billable project hours 1,216 1,276 1,449 1,640 1,680
Percentage of billable hours onsite 44.8% 37.2% 40.9% 41.1% 51.5%
Employee billable utilization 54.4% 62.3% 76.4% 83.1% 85.7%
PS Profit (EBITDA) -10.1% 5.0% 16.1% 19.5% 32.0%
Source: SPI Research, February 2021
SPI Research analyzed 22 Talent key performance measurements that are critical to attaining superior
employee performance. Table 83 portrays trends in human capital alignment. The chief issues facing PS
employers are recruiting (on average it takes 62.6 days to find and hire); ramping (on average it takes 58
days for a new hire to become productive). Skilled employees have more career choices than ever
before resulting in high levels of voluntary attrition.
As the table shows, most talent metrics improved in 2020 with lower attrition; better employee
engagement; slightly less time to ramp new employees and more time devoted to training and skill
building. Surprisingly, consultants billed only slightly fewer hours than they did in 2019 with billable
utilization at 71.4%. The percentage of companies who would recommend their firm as a great place to
work improved slightly to 88.4%, indicating most PS employees are very happy with their employment
relationship.
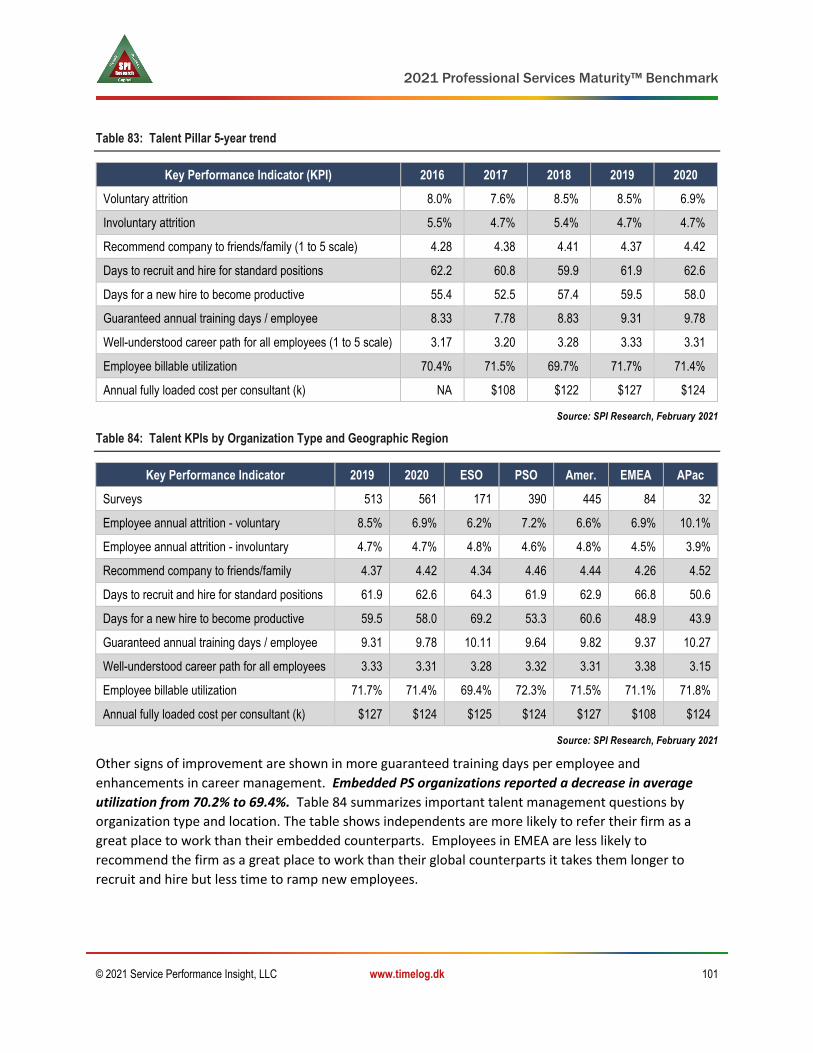
2021 Professional Services Maturity™ Benchmark
© 2021 Service Performance Insight, LLC www.timelog.dk 101
Table 83: Talent Pillar 5-year trend
Key Performance Indicator (KPI) 2016 2017 2018 2019 2020
Voluntary attrition 8.0% 7.6% 8.5% 8.5% 6.9%
Involuntary attrition 5.5% 4.7% 5.4% 4.7% 4.7%
Recommend company to friends/family (1 to 5 scale) 4.28 4.38 4.41 4.37 4.42
Days to recruit and hire for standard positions 62.2 60.8 59.9 61.9 62.6
Days for a new hire to become productive 55.4 52.5 57.4 59.5 58.0
Guaranteed annual training days / employee 8.33 7.78 8.83 9.31 9.78
Well-understood career path for all employees (1 to 5 scale) 3.17 3.20 3.28 3.33 3.31
Employee billable utilization 70.4% 71.5% 69.7% 71.7% 71.4%
Annual fully loaded cost per consultant (k) NA $108 $122 $127 $124
Source: SPI Research, February 2021
Table 84: Talent KPIs by Organization Type and Geographic Region
Key Performance Indicator 2019 2020 ESO PSO Amer. EMEA APac
Surveys 513 561 171 390 445 84 32
Employee annual attrition - voluntary 8.5% 6.9% 6.2% 7.2% 6.6% 6.9% 10.1%
Employee annual attrition - involuntary 4.7% 4.7% 4.8% 4.6% 4.8% 4.5% 3.9%
Recommend company to friends/family 4.37 4.42 4.34 4.46 4.44 4.26 4.52
Days to recruit and hire for standard positions 61.9 62.6 64.3 61.9 62.9 66.8 50.6
Days for a new hire to become productive 59.5 58.0 69.2 53.3 60.6 48.9 43.9
Guaranteed annual training days / employee 9.31 9.78 10.11 9.64 9.82 9.37 10.27
Well-understood career path for all employees 3.33 3.31 3.28 3.32 3.31 3.38 3.15
Employee billable utilization 71.7% 71.4% 69.4% 72.3% 71.5% 71.1% 71.8%
Annual fully loaded cost per consultant (k) $127 $124 $125 $124 $127 $108 $124
Source: SPI Research, February 2021
Other signs of improvement are shown in more guaranteed training days per employee and
enhancements in career management. Embedded PS organizations reported a decrease in average
utilization from 70.2% to 69.4%. Table 84 summarizes important talent management questions by
organization type and location. The table shows independents are more likely to refer their firm as a
great place to work than their embedded counterparts. Employees in EMEA are less likely to
recommend the firm as a great place to work than their global counterparts it takes them longer to
recruit and hire but less time to ramp new employees.

2021 Professional Services Maturity™ Benchmark
© 2021 Service Performance Insight, LLC www.timelog.dk 102
The average time to recruit, hire and ramp a new consultant decreased from 121 days to 120.7 days in
2020 with the Americas reporting the longest recruiting and ramping time of 123.5 days. Obviously,
reducing the time and cost of finding and ramping new employees has a major impact on growth and
profitability. Top performing firms provide innovative college hiring and ramping programs – with
intense on-boarding programs of three months or more to ensure new consultants are quickly
successful and productive. The need for skill and leadership development has resulted in a big increase
in the days of guaranteed training – moving from 3.8 days in 2008 to over 9.78 days on average in
2020. PS organizations of all types and sizes are investing in training to ensure their workforces remain
engaged and qualified by enhancing their skills and certifications.
PS organizations are finally starting to realize the importance of providing employee career paths and
opportunities – this has led to a slight improvement in the benchmark of “a well-understood career
path,” which has advanced from a score of 2.67 out of 5 (53%) in 2009 to 3.31 (66.2%) in 2020.
Table 85: Talent KPIs by Organization Size
Key Performance Indicator Under
10 10 - 30 31 - 100 101 - 300
301 - 700
Over 700
Surveys 62 108 170 111 48 62
Employee annual attrition - voluntary 3.1% 4.8% 7.5% 7.4% 10.5% 9.5%
Employee annual attrition - involuntary 2.2% 3.9% 4.9% 5.3% 5.9% 6.5%
Recommend company to friends/family 4.24 4.58 4.55 4.41 4.18 4.15
Days to recruit and hire for standard positions 64.8 66.9 61.7 60.2 54.4 65.8
Days for a new hire to become productive 50.4 64.7 57.2 57.9 49.6 62.0
Guaranteed annual training days / employee 8.78 9.77 9.75 9.89 9.44 11.32
Well-understood career path for all employees 3.17 3.25 3.33 3.28 3.50 3.45
Employee billable utilization 68.6% 71.1% 72.4% 71.6% 70.0% 73.3%
Annual fully loaded cost per consultant (k) $122 $125 $124 $121 $124 $133
Source: SPI Research, February 2021
Table 85 shows Talent scores by organization size. Attrition tends to rise in direct proportion to
organization size as employees feel less loyalty and their work becomes more impersonal. This year
organizations with 300 to 700 employees reported the highest attrition (16.4%). One of the reasons for
this is that these large organizations are experiencing the highest numbers of mergers and acquisitions
which often lead to attrition. Management span of control grows proportionately with organization size
as larger organizations provide more employee and management support structures. Small to midsize
organizations were more likely to be viewed as “great places to work” with higher employee
recommendation scores. Several important trends emerge as organizations grow in size – they offer
more guaranteed training days and tend to have clearer job descriptions and skill plans which provide
better defined career paths for their employees.
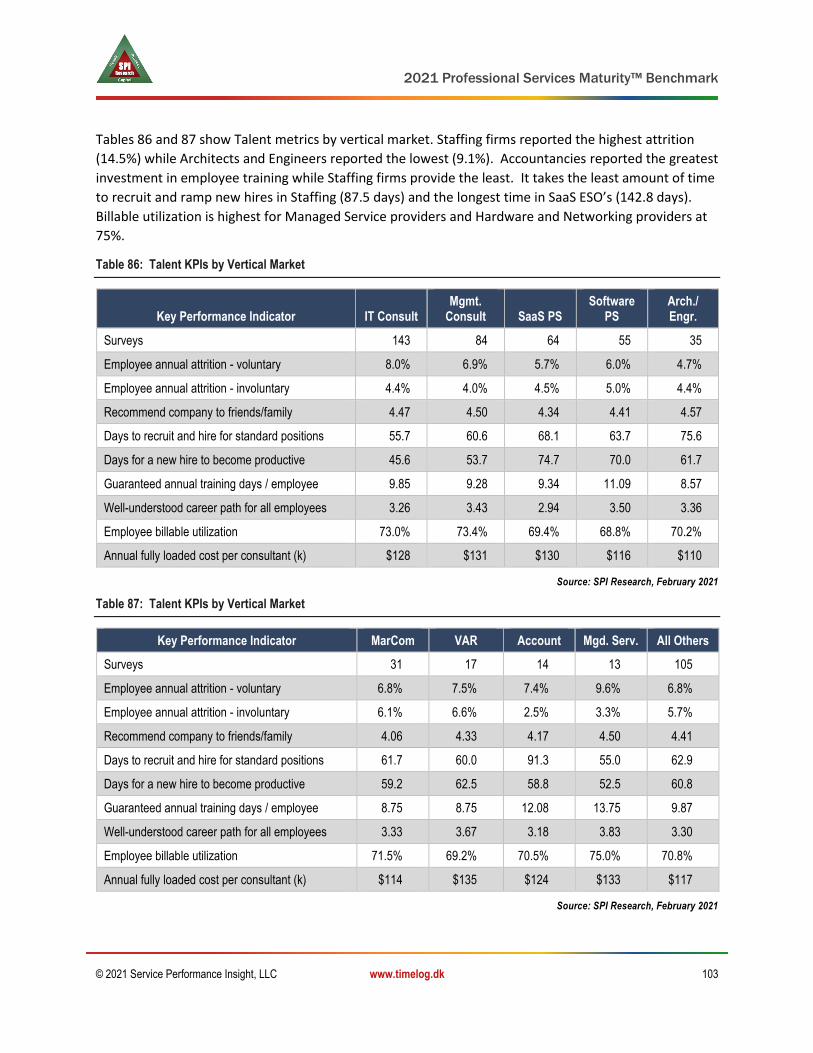
2021 Professional Services Maturity™ Benchmark
© 2021 Service Performance Insight, LLC www.timelog.dk 103
Tables 86 and 87 show Talent metrics by vertical market. Staffing firms reported the highest attrition
(14.5%) while Architects and Engineers reported the lowest (9.1%). Accountancies reported the greatest
investment in employee training while Staffing firms provide the least. It takes the least amount of time
to recruit and ramp new hires in Staffing (87.5 days) and the longest time in SaaS ESO’s (142.8 days).
Billable utilization is highest for Managed Service providers and Hardware and Networking providers at
75%.
Table 86: Talent KPIs by Vertical Market
Key Performance Indicator IT Consult Mgmt.
Consult SaaS PS Software
PS Arch./ Engr.
Surveys 143 84 64 55 35
Employee annual attrition - voluntary 8.0% 6.9% 5.7% 6.0% 4.7%
Employee annual attrition - involuntary 4.4% 4.0% 4.5% 5.0% 4.4%
Recommend company to friends/family 4.47 4.50 4.34 4.41 4.57
Days to recruit and hire for standard positions 55.7 60.6 68.1 63.7 75.6
Days for a new hire to become productive 45.6 53.7 74.7 70.0 61.7
Guaranteed annual training days / employee 9.85 9.28 9.34 11.09 8.57
Well-understood career path for all employees 3.26 3.43 2.94 3.50 3.36
Employee billable utilization 73.0% 73.4% 69.4% 68.8% 70.2%
Annual fully loaded cost per consultant (k) $128 $131 $130 $116 $110
Source: SPI Research, February 2021
Table 87: Talent KPIs by Vertical Market
Key Performance Indicator MarCom VAR Account Mgd. Serv. All Others
Surveys 31 17 14 13 105
Employee annual attrition - voluntary 6.8% 7.5% 7.4% 9.6% 6.8%
Employee annual attrition - involuntary 6.1% 6.6% 2.5% 3.3% 5.7%
Recommend company to friends/family 4.06 4.33 4.17 4.50 4.41
Days to recruit and hire for standard positions 61.7 60.0 91.3 55.0 62.9
Days for a new hire to become productive 59.2 62.5 58.8 52.5 60.8
Guaranteed annual training days / employee 8.75 8.75 12.08 13.75 9.87
Well-understood career path for all employees 3.33 3.67 3.18 3.83 3.30
Employee billable utilization 71.5% 69.2% 70.5% 75.0% 70.8%
Annual fully loaded cost per consultant (k) $114 $135 $124 $133 $117
Source: SPI Research, February 2021
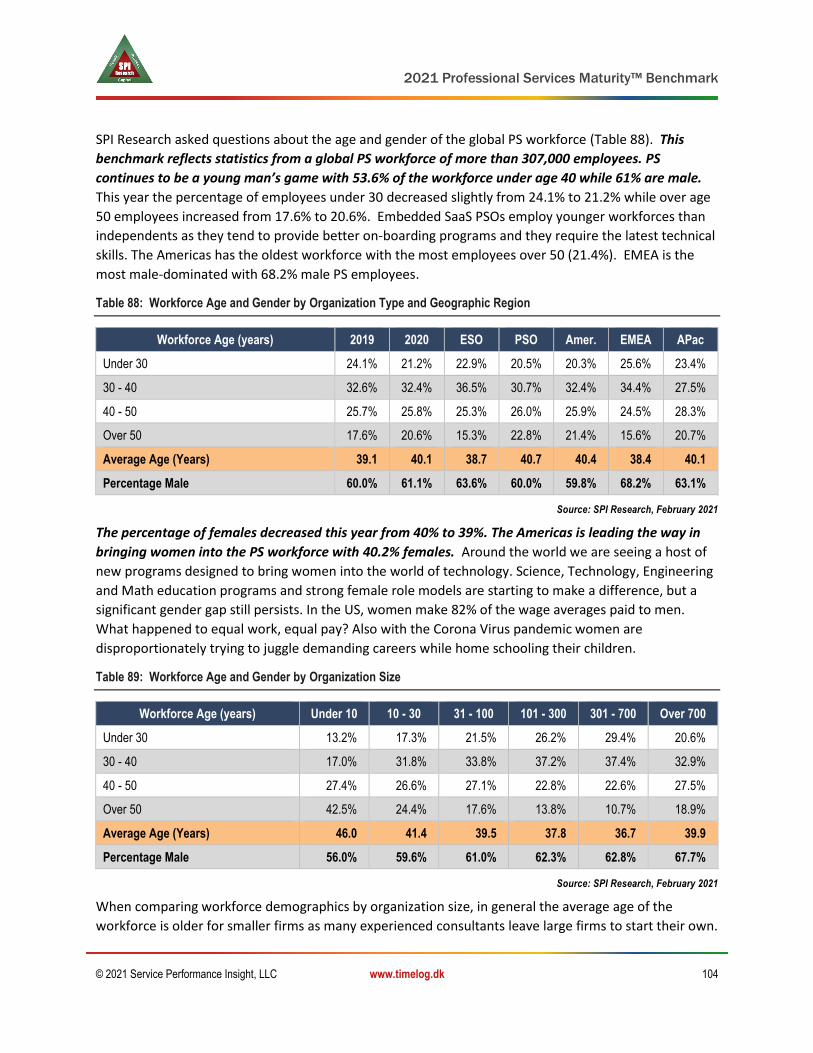
2021 Professional Services Maturity™ Benchmark
© 2021 Service Performance Insight, LLC www.timelog.dk 104
SPI Research asked questions about the age and gender of the global PS workforce (Table 88). This
benchmark reflects statistics from a global PS workforce of more than 307,000 employees. PS
continues to be a young man’s game with 53.6% of the workforce under age 40 while 61% are male.
This year the percentage of employees under 30 decreased slightly from 24.1% to 21.2% while over age
50 employees increased from 17.6% to 20.6%. Embedded SaaS PSOs employ younger workforces than
independents as they tend to provide better on-boarding programs and they require the latest technical
skills. The Americas has the oldest workforce with the most employees over 50 (21.4%). EMEA is the
most male-dominated with 68.2% male PS employees.
Table 88: Workforce Age and Gender by Organization Type and Geographic Region
Workforce Age (years) 2019 2020 ESO PSO Amer. EMEA APac
Under 30 24.1% 21.2% 22.9% 20.5% 20.3% 25.6% 23.4%
30 - 40 32.6% 32.4% 36.5% 30.7% 32.4% 34.4% 27.5%
40 - 50 25.7% 25.8% 25.3% 26.0% 25.9% 24.5% 28.3%
Over 50 17.6% 20.6% 15.3% 22.8% 21.4% 15.6% 20.7%
Average Age (Years) 39.1 40.1 38.7 40.7 40.4 38.4 40.1
Percentage Male 60.0% 61.1% 63.6% 60.0% 59.8% 68.2% 63.1%
Source: SPI Research, February 2021
The percentage of females decreased this year from 40% to 39%. The Americas is leading the way in
bringing women into the PS workforce with 40.2% females. Around the world we are seeing a host of
new programs designed to bring women into the world of technology. Science, Technology, Engineering
and Math education programs and strong female role models are starting to make a difference, but a
significant gender gap still persists. In the US, women make 82% of the wage averages paid to men.
What happened to equal work, equal pay? Also with the Corona Virus pandemic women are
disproportionately trying to juggle demanding careers while home schooling their children.
Table 89: Workforce Age and Gender by Organization Size
Workforce Age (years) Under 10 10 - 30 31 - 100 101 - 300 301 - 700 Over 700
Under 30 13.2% 17.3% 21.5% 26.2% 29.4% 20.6%
30 - 40 17.0% 31.8% 33.8% 37.2% 37.4% 32.9%
40 - 50 27.4% 26.6% 27.1% 22.8% 22.6% 27.5%
Over 50 42.5% 24.4% 17.6% 13.8% 10.7% 18.9%
Average Age (Years) 46.0 41.4 39.5 37.8 36.7 39.9
Percentage Male 56.0% 59.6% 61.0% 62.3% 62.8% 67.7%
Source: SPI Research, February 2021
When comparing workforce demographics by organization size, in general the average age of the
workforce is older for smaller firms as many experienced consultants leave large firms to start their own.

2021 Professional Services Maturity™ Benchmark
© 2021 Service Performance Insight, LLC www.timelog.dk 105
The largest organizations have the highest percentage of employees under 40 as they invest in college
recruiting and hiring. Large firms like Deloitte and Accenture provide an excellent introduction to the
world of consulting because they provide structured on-boarding programs combined with career
planning and skill/position progression. The largest organizations traditionally have done a better job of
recruiting women as they are able to provide more flexibility and invest in diversity.
By vertical market, the big three – IT Consulting, Software and Architects and Engineers are heavily male
dominated with 65% male employees. Surprisingly this year two industries reported more than 50%
female workers! Accountancies and marketing and advertising have more female employees than
male. Marketing and advertising firms have the youngest workforce with an average age of 38.5
years. Management consultancies employ the most over 50 employees. Marketing and Advertising and
cloud (SaaS) PSOs contain the most under age 30 employees with almost 1/3 of their employees in their
20s. They also have the fewest employees over age 50.
Table 90: Workforce Age and Gender by Vertical Market
Workforce Age (years) IT Consult Mgmt.
Consult SaaS PS Software
PS Arch./ Engr.
Under 30 20.6% 16.5% 26.2% 21.4% 18.0%
30 - 40 31.7% 27.9% 38.6% 36.7% 34.7%
40 - 50 28.2% 23.4% 22.2% 25.8% 25.0%
Over 50 19.5% 32.2% 12.9% 16.1% 22.4%
Average Age (Years) 40.2 42.9 37.5 39.1 40.7
Percentage Male 66.1% 54.3% 62.6% 67.8% 64.0%
Source: SPI Research, February 2021
Table 91: Workforce Age and Gender by Vertical Market
Workforce Age (years) MarCom VAR Account Mgd. Serv. All Others
Under 30 30.7% 12.5% 14.1% 27.5% 23.7%
30 - 40 26.1% 31.1% 40.0% 40.7% 30.1%
40 - 50 24.9% 33.4% 30.9% 21.2% 26.2%
Over 50 18.3% 23.0% 15.0% 10.7% 20.0%
Average Age (Years) 38.5 42.3 40.1 36.8 39.7
Percentage Male 43.2% 67.1% 47.7% 60.8% 59.4%
Source: SPI Research, February 2021

2021 Professional Services Maturity™ Benchmark
© 2021 Service Performance Insight, LLC www.timelog.dk 106
Why Do Employees Leave?
Employees leave for a variety of reasons but typically there is a primary catalyst for moving on.
Why do employees leave? Obviously, employees leave for a variety of reasons. In many cases there is a
primary catalyst which is the reason for moving on. Table 92 shows the top reasons why employees
leave. The number one rationale (43.3%) is “better opportunity” which translates to a better work
environment, perhaps better compensation or more opportunity for advancement. “Other (20.9%)” is
in second place. “Other” covers a magnitude of issues – “work/life” balance, lack of diversity or leaving
the industry entirely.
Table 92: Why employees leave
Why employees leave Survey % Employee attrition
Recommend to family/ friends
Billable utilization
On-time project delivery EBITDA
Better opportunity 43.3% 13.2% 4.52 72.0% 81.6% 12.7%
Money 13.3% 13.1% 4.46 71.3% 74.9% 17.5%
Mgmt. dissatisfaction 4.2% 15.5% 3.83 71.5% 80.3% 10.7%
Travel 3.0% 9.4% 4.69 72.7% 83.5% 23.0%
Stress 5.6% 14.2% 4.13 72.1% 78.0% 27.0%
Lack of career advance. 9.8% 10.5% 4.29 71.3% 75.5% 12.5%
Other 20.9% 7.6% 4.51 71.4% 80.4% 19.9%
Total/Average 100.0% 11.8% 4.44 71.7% 79.7% 15.6%
Source: SPI Research, February 2021
“Money” is the third most prevalent reason employees leave. A younger, less traditional workforce
requires challenging projects; exposure to hot new technologies and leading-edge clients plus training,
communication and teamwork to remain engaged but money is often a determining factor. “Lack of
career advancement” was cited as the primary reason to leave by 9.8%. Interestingly these firms
experienced the least growth which would explain why career opportunities are limited.
“Management dissatisfaction”, “Stress” and “Travel” are also major reasons employees quit.
Management dissatisfaction leads to high attrition and makes the workplace one that employees would
not recommend to their friends and family. With more than one quarter of PS employees under the age
of 30, leadership development must be a top priority. The table shows “management dissatisfaction”
has a profound negative impact on attrition, employee engagement and billable utilization. The best
firms are intentionally grooming and growing a new generation of leaders.
Employee annual attrition – voluntary
Employee attrition is defined as the number of employees who left the company, either voluntarily or
involuntarily, over the past year divided by the weighted average number of employees.
Attrition Rate = Number of Attritions/Weighted Average Number of Employees *100

2021 Professional Services Maturity™ Benchmark
© 2021 Service Performance Insight, LLC www.timelog.dk 107
Voluntary attrition, employees
who leave who are not asked
to leave, is one of the most
important key performance
indicators in the services
sector as employees are the
most valuable resource.
Annual attrition in the
professional services sector
has been steadily climbing
since the recession ended.
Table 93 shows the correlation
between voluntary attrition;
revenue growth; win ratio and
profit; demonstrating the
negative consequences of high
voluntary attrition rates. As attrition
rises, most other aspects of
performance suffer. The probability of
on-time project delivery decreases
while project overruns increase.
Remaining employees must pick up the
pieces from exiting workers and must
quickly come up to speed to reestablish
client relationships. Clients are forced
to back-track to reestablish previous
decisions and vendor commitments.
The costs of high voluntary attrition
permeate all aspects of the firm. Lower
employee engagement influences the
firm’s ability to recruit new top talent.
The very real cost to replace leaving
employees shows up in 120.7 workdays
on average to find, recruit, hire and
ramp new consultants. But this lost
time is just the tip of the iceberg, as it
does not measure lost productivity time
for recruiters and managers nor the
impact on the remaining workforce
from taking over work after a valuable employee has left or while mentoring a replacement hire.
Table 93: Impact – Voluntary Attrition
Employee annual attrition - Voluntary
Survey %
Revenue growth
Bid-to-win ratio
Ann. rev./ emp.
(k) EBITDA
None 16.7% 10.2% 5.42 $161 17.8%
1% - 5% 32.1% 7.4% 5.41 $171 18.3%
5% - 10% 27.3% 7.0% 5.01 $170 13.7%
10% - 15% 15.8% 9.1% 5.00 $158 14.4%
15% - 25% 5.4% 3.2% 4.50 $158 16.4%
Over 25% 2.7% 0.6% 5.25 $150 4.6%
Total/Average 100.0% 7.6% 5.19 $166 15.9%
Source: SPI Research, February 2021
Table 94: Year-over-year change – Voluntary Attrition
Voluntary Attrition 2019 2020 ▲
Total Survey 8.5% 6.9% -19.0%
Embedded services organizations 7.3% 6.2% -15.3%
Independent services organizations 9.1% 7.2% -21.2%
Americas 8.5% 6.6% -21.9%
EMEA 8.1% 6.9% -15.1%
APac 10.1% 10.1% -0.3%
IT Consulting 9.3% 8.0% -13.8%
Management Consulting 9.1% 6.9% -23.7%
PS within SaaS Company 8.4% 5.7% -32.4%
PS within Software Company 7.0% 6.0% -13.7%
Architecture/Engineering 7.1% 4.7% -33.9%
Advertising/Mktg/PR 10.3% 6.8% -34.2%
Value-added Reseller (VAR) 4.9% 7.5% 53.1%
Accounting 7.8% 7.4% -5.4%
Source: SPI Research, February 2021

2021 Professional Services Maturity™ Benchmark
© 2021 Service Performance Insight, LLC www.timelog.dk 108
SPI Research believes the real cost to replace a valuable consultant is more than $150,000 creating a big
bottom-line profit divot and making it hard to increase revenue and margins when firms must backfill
leaving employees.
Table 94 shows Voluntary Attrition trends by geography, vertical and size of organization. Year over
year, ESOs did a better job of employee retention than independents. APac experienced the highest
attrition. By vertical, IT Consultancies and VARs have the highest attrition. Larger organizations
experience more voluntary attrition than smaller ones, but the impact of voluntary attrition is enormous
on small organizations.
Employee annual attrition – involuntary
Involuntary attrition refers to employees who are laid off or fired. It is calculated based on the number of
employees terminated within the period divided by the weighted average number of employees.
Involuntary attrition typically refers to an employer decision to terminate the employee. Reasons for
involuntary attrition include poor performance, excessive absenteeism or violation of a workplace policy
that is considered a terminable offense. Attrition due to layoffs, reduction in force or job elimination is
typically involuntary because the employment relationship ends based on the employer's circumstances,
not the employee's decision. Involuntary attrition or layoffs may have a temporary positive impact on
per consultant and per employee
revenue yield as well as utilization
because available work is performed by
fewer employees. However, the long-
term effects of involuntary attrition
show up in lower top-line growth and
poor employee engagement.
Interestingly, voluntary attrition rises
directly in response to involuntary
attrition as non-impacted employees
fear they will be next or become
disenfranchised with their prospects for
long-term career growth.
Table 95 shows involuntary attrition
trends by geography, vertical and size
of organization. Unfortunately,
involuntary attrition increased in both
embedded and independent PSOs due
to the negative impact of the Corona
Virus pandemic. EMEA and APac
experienced a big increase in
involuntary attrition as did Marketing
and Advertising firms, VARS and AEC firms. VARs reported the worst involuntary attrition at 6.6%.
Table 95: Year-over-year change – Involuntary Attrition
Involuntary Attrition 2019 2020 ▲
Total Survey 4.7% 4.7% -0.2%
Embedded services organizations 4.7% 4.8% 2.1%
Independent services organizations 4.7% 4.6% -1.2%
Americas 4.9% 4.8% -2.5%
EMEA 3.9% 4.5% 16.4%
APac 3.3% 3.9% 17.4%
IT Consulting 4.8% 4.4% -9.1%
Management Consulting 4.9% 4.0% -18.0%
PS within SaaS Company 4.7% 4.5% -3.5%
PS within Software Company 4.8% 5.0% 3.5%
Architecture/Engineering 3.8% 4.4% 16.1%
Advertising/Mktg/PR 3.9% 6.1% 56.7%
Value-added Reseller (VAR) 4.9% 6.6% 34.5%
Accounting 6.4% 2.5% -60.9%
Source: SPI Research, February 2021
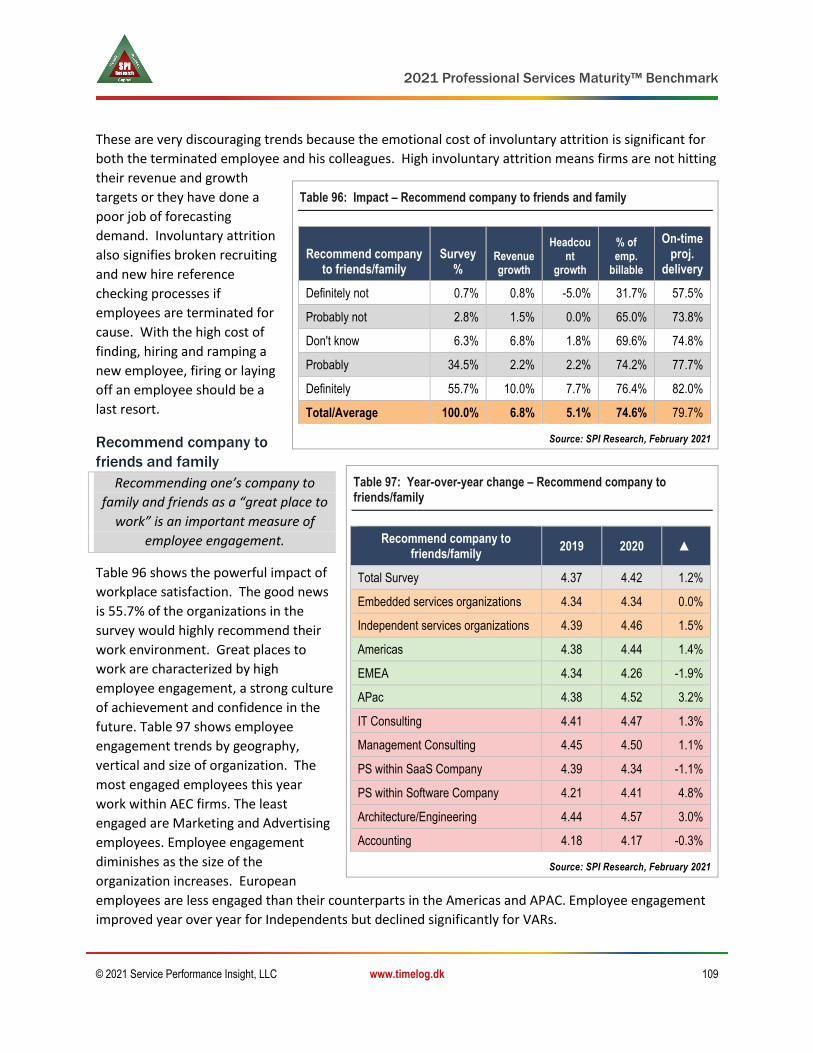
2021 Professional Services Maturity™ Benchmark
© 2021 Service Performance Insight, LLC www.timelog.dk 109
These are very discouraging trends because the emotional cost of involuntary attrition is significant for
both the terminated employee and his colleagues. High involuntary attrition means firms are not hitting
their revenue and growth
targets or they have done a
poor job of forecasting
demand. Involuntary attrition
also signifies broken recruiting
and new hire reference
checking processes if
employees are terminated for
cause. With the high cost of
finding, hiring and ramping a
new employee, firing or laying
off an employee should be a
last resort.
Recommend company to
friends and family
Recommending one’s company to
family and friends as a “great place to
work” is an important measure of
employee engagement.
Table 96 shows the powerful impact of
workplace satisfaction. The good news
is 55.7% of the organizations in the
survey would highly recommend their
work environment. Great places to
work are characterized by high
employee engagement, a strong culture
of achievement and confidence in the
future. Table 97 shows employee
engagement trends by geography,
vertical and size of organization. The
most engaged employees this year
work within AEC firms. The least
engaged are Marketing and Advertising
employees. Employee engagement
diminishes as the size of the
organization increases. European
employees are less engaged than their counterparts in the Americas and APAC. Employee engagement
improved year over year for Independents but declined significantly for VARs.
Table 96: Impact – Recommend company to friends and family
Recommend company to friends/family
Survey %
Revenue growth
Headcount
growth
% of emp.
billable
On-time proj.
delivery
Definitely not 0.7% 0.8% -5.0% 31.7% 57.5%
Probably not 2.8% 1.5% 0.0% 65.0% 73.8%
Don't know 6.3% 6.8% 1.8% 69.6% 74.8%
Probably 34.5% 2.2% 2.2% 74.2% 77.7%
Definitely 55.7% 10.0% 7.7% 76.4% 82.0%
Total/Average 100.0% 6.8% 5.1% 74.6% 79.7%
Source: SPI Research, February 2021
Table 97: Year-over-year change – Recommend company to friends/family
Recommend company to friends/family
2019 2020 ▲
Total Survey 4.37 4.42 1.2%
Embedded services organizations 4.34 4.34 0.0%
Independent services organizations 4.39 4.46 1.5%
Americas 4.38 4.44 1.4%
EMEA 4.34 4.26 -1.9%
APac 4.38 4.52 3.2%
IT Consulting 4.41 4.47 1.3%
Management Consulting 4.45 4.50 1.1%
PS within SaaS Company 4.39 4.34 -1.1%
PS within Software Company 4.21 4.41 4.8%
Architecture/Engineering 4.44 4.57 3.0%
Accounting 4.18 4.17 -0.3%
Source: SPI Research, February 2021

2021 Professional Services Maturity™ Benchmark
© 2021 Service Performance Insight, LLC www.timelog.dk 110
Time to recruit and hire for standard positions (days)
Time to recruit and hire is the length of time in work days from job posting to employment start date.
SPI Research considers the length of time to recruit and ramp new employees to be very important
determinants in overall performance, sustainable growth and profit. “Ramping” time is critical because
it not only focuses on making employees productive faster, but also reduces the non-billable time and
cost of other resources who support the hiring and on-boarding process. Most firms do not track the full
cost of recruiting and hiring, but it is substantial (in many cases over 50% of the first-year new hire base
salary). This year the average cost of recruiting declined to .7% of total revenue. The most mature
firms create a dedicated recruiting function, armed with in-depth skill and personality profiles for
targeted positions. Since all indicators point to a continuing talent shortage for years to come, firms
would be well-served to examine and improve their recruiting, on-boarding and training functions.
Recruiting must be closely aligned with the sales pipeline and resource management plan. Table 98
shows recruiting time trends by geography, vertical and organization size. ESOs take longer to recruit
than independents. APac has the shortest recruiting time and EMEA has the longest.
Accountancies spend the longest time
in recruiting; IT Consultancies the least.
When comparing the time required to
recruit for standard positions (such as
consultants) to other key performance
indicators, as it takes longer to recruit
and hire, billable utilization suffers,
because current employees must spend
more time helping with the process,
which limits their own bandwidth and
billable time.
Project overruns increase because
more seasoned employees are tasked
with hiring and ramping new
employees plus new hires are not
available to fill required roles and may
make mistakes due to inexperience. A
key factor in longer recruiting times is
the fact that these organizations report
poor visibility to the sales and resource
pipeline. Maintaining a “warm pool” of
recruiting candidates with clearly
defined job roles is a good practice.
Table 98: Year-over-year change – Time to recruit and hire for standard positions (days)
Time to recruit and hire for standard positions (days) 2019 2020 ▲
Total Survey 61.9 62.6 1.2%
Embedded services organizations 69.4 64.3 -7.3%
Independent services organizations 58.4 61.9 6.0%
Americas 62.5 62.9 0.6%
EMEA 60.2 66.8 11.0%
APac 58.0 50.6 -12.8%
IT Consulting 53.4 55.7 4.4%
Management Consulting 61.6 60.6 -1.6%
PS within SaaS Company 69.3 68.1 -1.8%
PS within Software Company 69.8 63.7 -8.8%
Architecture/Engineering 66.8 75.6 13.1%
Advertising/Mktg/PR 55.0 61.7 12.1%
Value-added Reseller (VAR) 72.9 60.0 -17.7%
Accounting 63.8 91.3 43.0%
Source: SPI Research, February 2021

2021 Professional Services Maturity™ Benchmark
© 2021 Service Performance Insight, LLC www.timelog.dk 111
Time for a new hire to become productive (days)
Time to productivity is the length of time in workdays from employment start date to the date when
target billable utilization is achieved.
34% of the PSOs in the survey reported
over 60 days for a new consultant to
become productive once hired. Well-
structured on-boarding and mentoring
programs are mandatory for
organizations planning on significant
growth. This year the average time for
a new hire to become productive
decreased from 59.5 to 58 days. Each
extra day of ramping time is significant.
At $200 per hour, each extra on-
boarding day translates to a potential
loss in revenue per consultant of
$1,600 per day. This is one metric that
has shown considerable degradation
over the years. ESOs take longer than
independents. PS within SaaS and
Software companies take the longest to
ramp employees, averaging 73 days.
Smaller organizations take longer than
larger ones as they require employees
to perform more roles and have less
well-defined on-boarding programs.
Guaranteed annual training days
per employee
The guaranteed number of training days per employee per year is the average number of budgeted
training days per employee.
Like the annual training budget, this indicator, while promised to employees, is not necessarily utilized,
but does reflect the organization's commitment to employee development and shows the organization
is investing in the future and skill growth of its employees.
Across the benchmark the average cost of training declined this year to .9% of total revenue but the
number of guaranteed training days soared to 9.78 (highest ever reported). The pandemic has inspired
employees to take advantage of working from home to improve their skills. Companies like Pluralsight
and Udemy offer thousands of online technical development classes making training and certification
easy and affordable. Top performing organizations mandate more than two weeks of training per year.
Table 99: Year-over-year change – Time for a new hire to become productive (days)
Time for a new hire to become productive (days) 2019 2020 ▲
Total Survey 59.5 62.6 5.2%
Embedded services organizations 73.5 64.3 -12.5%
Independent services organizations 52.8 61.9 17.3%
Americas 61.9 62.9 1.6%
EMEA 50.2 66.8 33.2%
APac 47.6 50.6 6.2%
IT Consulting 51.8 45.6 -11.9%
Management Consulting 48.8 53.7 10.1%
PS within SaaS Company 76.2 74.7 -1.9%
PS within Software Company 73.1 70.0 -4.2%
Architecture/Engineering 55.4 61.7 11.3%
Advertising/Mktg/PR 42.5 59.2 39.2%
Value-added Reseller (VAR) 79.3 62.5 -21.2%
Accounting 55.0 58.8 6.8%
Source: SPI Research, February 2021
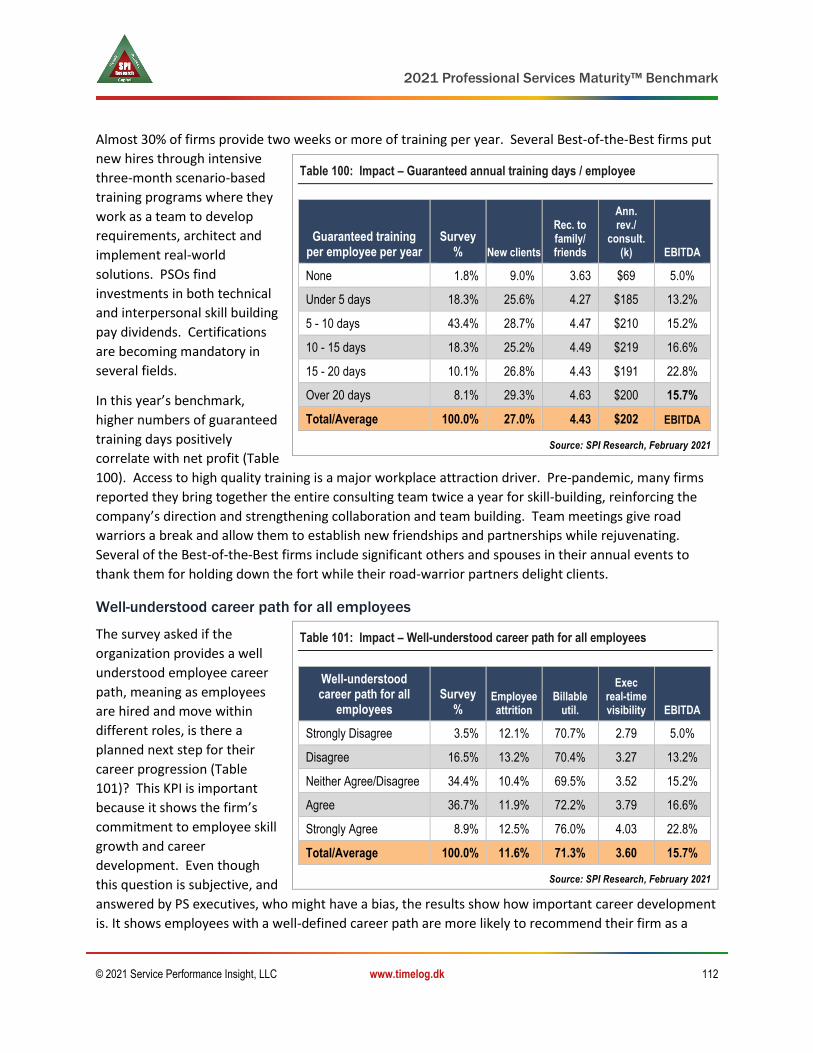
2021 Professional Services Maturity™ Benchmark
© 2021 Service Performance Insight, LLC www.timelog.dk 112
Almost 30% of firms provide two weeks or more of training per year. Several Best-of-the-Best firms put
new hires through intensive
three-month scenario-based
training programs where they
work as a team to develop
requirements, architect and
implement real-world
solutions. PSOs find
investments in both technical
and interpersonal skill building
pay dividends. Certifications
are becoming mandatory in
several fields.
In this year’s benchmark,
higher numbers of guaranteed
training days positively
correlate with net profit (Table
100). Access to high quality training is a major workplace attraction driver. Pre-pandemic, many firms
reported they bring together the entire consulting team twice a year for skill-building, reinforcing the
company’s direction and strengthening collaboration and team building. Team meetings give road
warriors a break and allow them to establish new friendships and partnerships while rejuvenating.
Several of the Best-of-the-Best firms include significant others and spouses in their annual events to
thank them for holding down the fort while their road-warrior partners delight clients.
Well-understood career path for all employees
The survey asked if the
organization provides a well
understood employee career
path, meaning as employees
are hired and move within
different roles, is there a
planned next step for their
career progression (Table
101)? This KPI is important
because it shows the firm’s
commitment to employee skill
growth and career
development. Even though
this question is subjective, and
answered by PS executives, who might have a bias, the results show how important career development
is. It shows employees with a well-defined career path are more likely to recommend their firm as a
Table 100: Impact – Guaranteed annual training days / employee
Guaranteed training per employee per year
Survey % New clients
Rec. to family/ friends
Ann. rev./
consult. (k) EBITDA
None 1.8% 9.0% 3.63 $69 5.0%
Under 5 days 18.3% 25.6% 4.27 $185 13.2%
5 - 10 days 43.4% 28.7% 4.47 $210 15.2%
10 - 15 days 18.3% 25.2% 4.49 $219 16.6%
15 - 20 days 10.1% 26.8% 4.43 $191 22.8%
Over 20 days 8.1% 29.3% 4.63 $200 15.7%
Total/Average 100.0% 27.0% 4.43 $202 EBITDA
Source: SPI Research, February 2021
Table 101: Impact – Well-understood career path for all employees
Well-understood career path for all
employees Survey
% Employee attrition
Billable util.
Exec real-time visibility EBITDA
Strongly Disagree 3.5% 12.1% 70.7% 2.79 5.0%
Disagree 16.5% 13.2% 70.4% 3.27 13.2%
Neither Agree/Disagree 34.4% 10.4% 69.5% 3.52 15.2%
Agree 36.7% 11.9% 72.2% 3.79 16.6%
Strongly Agree 8.9% 12.5% 76.0% 4.03 22.8%
Total/Average 100.0% 11.6% 71.3% 3.60 15.7%
Source: SPI Research, February 2021

2021 Professional Services Maturity™ Benchmark
© 2021 Service Performance Insight, LLC www.timelog.dk 113
great place to work and are less likely to leave. Interestingly, employees work harder and are happier at
firms with well-defined career paths. Numerous studies have shown that employees become
increasingly productive with longer tenure so keeping them engaged is an investment worth making.
Employee billable utilization
For simplicity, in this benchmark, employee billable utilization is calculated by dividing the total annual
billable hours by 2,000.
SPI Research defines employee utilization on a 2,000 hour per year basis. This key performance
indicator is central to organizational profitability. Utilization is consistently the most measured key
performance indicator but must be examined in conjunction with overall revenue and profit per person
along with leading indicators like backlog and the size of the sales pipeline to become truly meaningful.
Utilization is a major indicator of opportunity and workload balance. It provides a signal to expand or
contract the workforce.
To improve margins, PS executives must continually focus on increasing employee billable utilization, as
well as increasing the percentage of billable employees. The primary gain from increased utilization is a
significant increase in net profit. Table 102 shows the actual (not theoretical) benefits this year’s firms
experienced from increasing employee utilization. In this year’s survey, 59% of organizations achieved
70% or higher billable utilization. Clearly utilization and revenue growth are intertwined because work is
plentiful. Most organizations (35.2%) target 70 to 80% utilization (1,400 to 1,500 annual billable hours
per employee) because this target provides plenty of room for vacations, training and paid time off
without too much time spent on non-billable activities like non-billable travel, administration and free
sales support.
Table 102: Impact – Employee Billable Utilization
Employee billable
utilization Survey
% Revenue growth
% of emp. billable
On-time proj. delivery
Project margin
Ann. rev./ consult. (k)
Exec realtime visibility
Under 50% 3.7% 1.6% 52.8% 64.7% 29.4% $98 2.53
50% - 60% 14.3% 3.3% 71.5% 77.1% 32.7% $175 3.33
60% - 70% 22.8% 7.0% 74.9% 79.1% 35.4% $211 3.55
70% - 80% 35.2% 8.7% 75.6% 79.9% 37.3% $213 3.70
80% - 90% 19.8% 9.5% 79.6% 81.6% 38.0% $212 3.75
Over 90% 4.4% 14.2% 80.5% 89.7% 35.4% $213 3.83
Total/Average 100.0% 7.7% 75.0% 79.5% 36.0% $203 3.58
Source: SPI Research, February 2021
Understandably, firms reporting the highest levels of utilization also deliver the largest projects, making
it easier to keep utilization high without the churn associated with numerous short projects. Running a
growing PS organization at greater than 80% utilization can produce strong profits but may not be

2021 Professional Services Maturity™ Benchmark
© 2021 Service Performance Insight, LLC www.timelog.dk 114
sustainable over the long run due to
employee burnout. At the other end of
the spectrum, organizations who
reported less than 60% utilization
reported some of the worst metrics.
The key to success is to have the right
balance of meaningful work with
enough time set aside for skill and
client relationship building. Although PS
firms would like to abandon the billable
utilization metric (and all the
accompanying time tracking it entails),
unfortunately there is no other metric
which provides as good a picture of
workforce productivity. Perhaps as
more and more firms shift to
subscription and fixed price work the
focus on billable utilization will decline
but if this is the case firms must ratchet
up their focus on project accounting
and budget to actual performance. But
here again, how can budget to actual
performance be measured without
tracking work effort?
Table 103 depicts the annual change in billable utilization by type of organization, geography, vertical
and size. Independents bill more hours than embedded service organizations. IT and Management
Consultancies bill the most hours; embedded PS within software bills the least. Billable utilization
increases with organization size as larger firms do not ask employees to perform as many non-billable
tasks and roles have greater clarity.
Annual fully loaded cost per consultant
Fully loaded cost includes base and variable compensation as well as the cost of fringe benefits and
healthcare.
Average fully loaded employee cost decreased slightly to $124K compared to $127K last year. 47% (196)
firms reported loaded cost per consultant of more than $120K. 30% (125) of firms reported a fully
loaded cost of $100 to $120,000. Another 30% reported a fully loaded cost of $120,000 to $150,000.
1.7% of firms pay employees more than $200,000. Interestingly, firms that pay the most are growing
the fastest; have the largest sales pipelines and the highest utilization but they also have the highest
attrition.
Table 103: Year-over-year change – Employee Billable Utilization
Employee Billable Utilization 2019 2020 ▲
Total Survey 71.7% 71.4% -0.4%
Embedded services organizations 70.2% 69.4% -1.1%
Independent services organizations 72.4% 72.3% -0.1%
Americas 71.5% 71.5% 0.0%
EMEA 72.4% 71.1% -1.8%
APac 72.3% 71.8% -0.7%
IT Consulting 73.1% 73.0% -0.2%
Management Consulting 73.0% 73.4% 0.5%
PS within SaaS Company 72.7% 69.4% -4.5%
PS within Software Company 69.8% 68.8% -1.4%
Architecture/Engineering 71.0% 70.2% -1.1%
Advertising/Mktg/PR 70.0% 71.5% 2.1%
Value-added Reseller (VAR) 67.1% 69.2% 3.1%
Accounting 69.1% 70.5% 2.0%
Source: SPI Research, February 2021
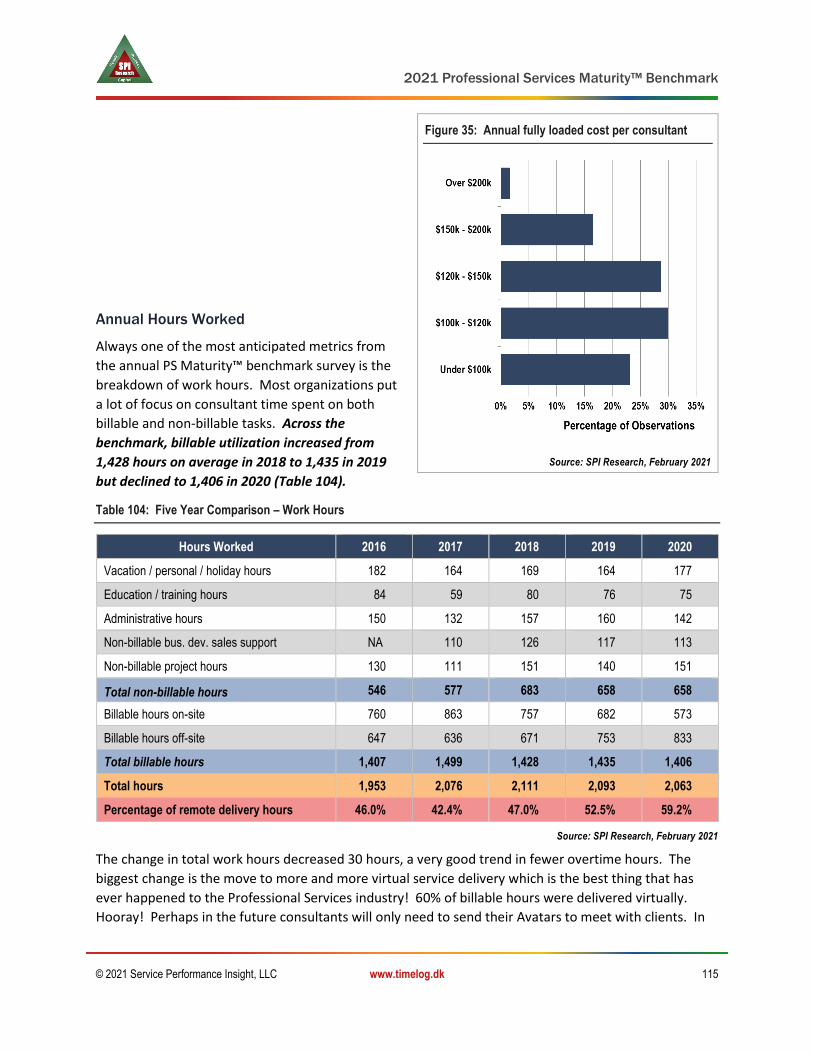
2021 Professional Services Maturity™ Benchmark
© 2021 Service Performance Insight, LLC www.timelog.dk 115
Annual Hours Worked
Always one of the most anticipated metrics from
the annual PS Maturity™ benchmark survey is the
breakdown of work hours. Most organizations put
a lot of focus on consultant time spent on both
billable and non-billable tasks. Across the
benchmark, billable utilization increased from
1,428 hours on average in 2018 to 1,435 in 2019
but declined to 1,406 in 2020 (Table 104).
Table 104: Five Year Comparison – Work Hours
Hours Worked 2016 2017 2018 2019 2020
Vacation / personal / holiday hours 182 164 169 164 177
Education / training hours 84 59 80 76 75
Administrative hours 150 132 157 160 142
Non-billable bus. dev. sales support NA 110 126 117 113
Non-billable project hours 130 111 151 140 151
Total non-billable hours 546 577 683 658 658
Billable hours on-site 760 863 757 682 573
Billable hours off-site 647 636 671 753 833
Total billable hours 1,407 1,499 1,428 1,435 1,406
Total hours 1,953 2,076 2,111 2,093 2,063
Percentage of remote delivery hours 46.0% 42.4% 47.0% 52.5% 59.2%
Source: SPI Research, February 2021
The change in total work hours decreased 30 hours, a very good trend in fewer overtime hours. The
biggest change is the move to more and more virtual service delivery which is the best thing that has
ever happened to the Professional Services industry! 60% of billable hours were delivered virtually.
Hooray! Perhaps in the future consultants will only need to send their Avatars to meet with clients. In
Figure 35: Annual fully loaded cost per consultant
Source: SPI Research, February 2021

2021 Professional Services Maturity™ Benchmark
© 2021 Service Performance Insight, LLC www.timelog.dk 116
many ways, virtual service delivery has not only reduced the travel burn and burnout which has
historically been the life of a consultant, but it has also significantly benefited clients because they can
now take advantage of the most talented and best fit consultants, regardless of location. The
ramifications of virtual Professional Services are significant in that it forces PS firms to establish a strong
on-line presence plus it necessitates excellent communication and collaboration tools and practices.
Table 105 shows a comparison of hours worked for embedded and independent PSOs and geographic
region. Not surprisingly, EMEA headquartered firms enjoy more vacation time than workaholic
Americans. Embedded organizations waste the most time on non-billable administration – endless
meetings and chit chat account for 150 annual hours. EMEA headquartered organizations do the best
job of limiting administrative time at 98 hours – enabling them to take more PTO and training. ESOs and
independents logged almost the same non-billable sales support hours. Organizations worked 30 fewer
overall hours in 2020. By geography, APac worked billed the most hours. EMEA headquartered firms
worked the least hours but more of them were billable than in the Americas.
Table 105: Hours Worked by Organization Type and Geographic Region
Not 2019 2020 ESO PSO Amer. EMEA APac
Vacation / personal / holiday hours 164 177 194 169 174 205 155
Education / training hours 76 75 82 73 75 77 77
Administrative hours 160 142 150 139 149 98 146
Non-billable bus. dev. sales support 117 113 111 113 107 122 153
Non-billable project hours 140 151 251 108 163 108 95
Total non-billable hours 658 658 788 601 668 611 627
Billable hours on-site 682 573 388 652 540 625 852
Billable hours off-site 753 833 881 812 862 793 567
Total billable hours 1,435 1,406 1,269 1,464 1,402 1,418 1,420
Total hours 2,093 2,063 2,057 2,066 2,071 2,029 2,047
Percentage of remote delivery hours 52.5% 59.2% 69.4% 55.4% 61.5% 55.9% 40.0%
Source: SPI Research, February 2021
The number of hours worked on-site has been steadily decreasing over the past 5 years. Five years ago,
56% of work hours were performed on the client’s site, this year only 40% were delivered on-site but
this number is much higher than expected. With stay-at-home orders around the world we expected to
see on-site billable hours drop to zero, but this was not the case. Across all job titles, billable hours
average 1,469 for independents compared to 1,269 hours for embedded service organizations. The
average ESO consultant spends 251 hours (6.3 weeks) on non-billable project activities while the
independents spend only 108 hours.
The table shows consultants in the Americas were billable 1,402 hours; EMEA based consultants billed
1,418 hours and Asia Pacific consultants billed 1,420 hours. Workaholic Americans take shorter

2021 Professional Services Maturity™ Benchmark
© 2021 Service Performance Insight, LLC www.timelog.dk 117
vacations; spend less time in training; and more time on non-billable administration. This year EMEA
firms invested the most in vacations and education and training. APac firms deliver the most hours on-
site. Non-billable administrative time decreased year over year to 142 hours. Excessive administrative
time usually results from not having enough billable work combined with poor systems and processes.
Table 106: Hours Worked by Vertical Market
Hours Worked IT Consult Mgmt.
Consult SaaS PS Software
PS Arch./ Engr.
Vacation / personal / holiday hours 166 171 176 201 157
Education / training hours 75 75 69 76 82
Administrative hours 122 165 146 132 126
Non-billable bus. dev. sales support 136 114 129 91 96
Non-billable project hours 145 127 187 121 115
Total non-billable hours 644 652 708 621 576
Billable hours on-site 556 508 521 645 734
Billable hours off-site 835 921 839 781 738
Total billable hours 1,392 1,429 1,360 1,426 1,471
Total hours 2,036 2,082 2,069 2,047 2,048
Percentage of remote delivery hours 60.0% 64.4% 61.7% 54.8% 50.1%
Source: SPI Research, February 2021
When examining annual hours by vertical it is clear to see best and worst practices. Embedded Software
and SaaS PS organizations spend the most non-billable hours in administration and non-billable business
development and project hours leading to the lowest number of billable hours yet they make the most
profit because they are able to charge high bill rates. Charter confusion and conflict within cloud
software companies means valuable consultants spend an inordinate amount of time in meetings,
performing sales support and non-billable project activities. It is inevitable that cloud growth rates will
have to level off at some point; when they do, they will need to focus on improving the productivity of
their PS organizations.
Table 107: Hours Worked by Vertical Market
Hours Worked MarCom VAR Account Mgd. Serv. All Others
Vacation / personal / holiday hours 157 142 170 176 165
Education / training hours 91 90 81 67 79
Administrative hours 130 181 174 176 122
Non-billable bus. dev. sales support 88 60 176 96 109
Non-billable project hours 224 123 227 180 85
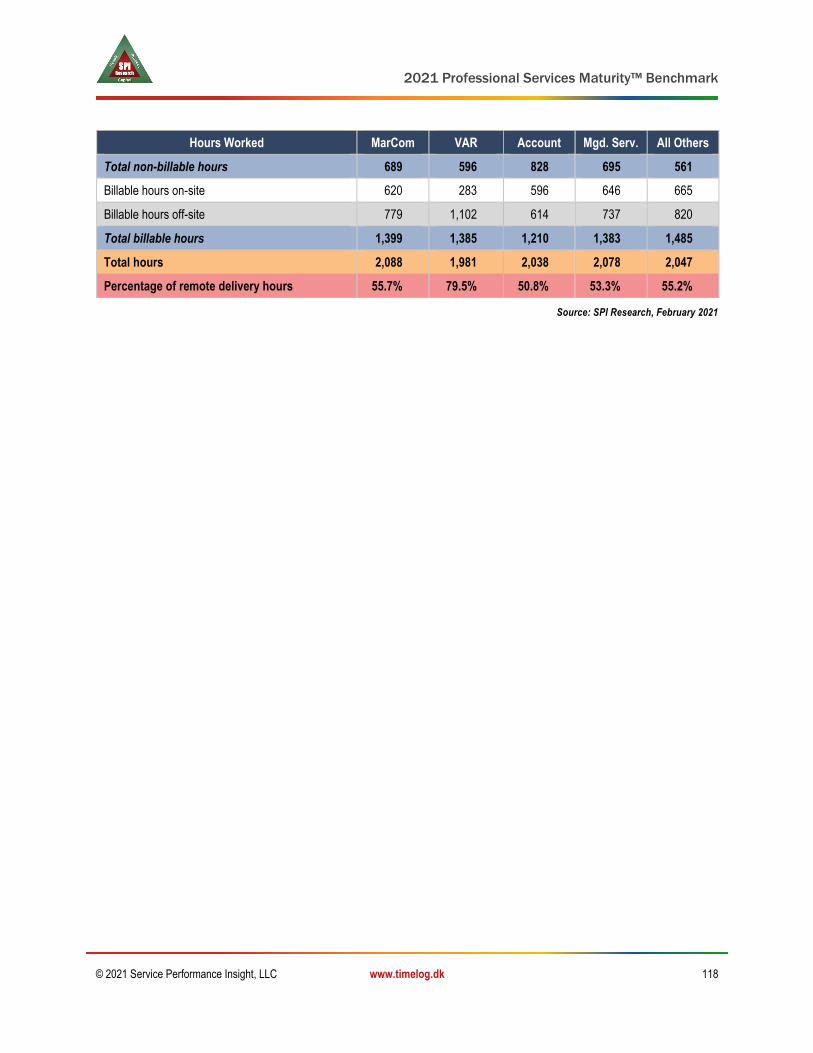
2021 Professional Services Maturity™ Benchmark
© 2021 Service Performance Insight, LLC www.timelog.dk 118
Hours Worked MarCom VAR Account Mgd. Serv. All Others
Total non-billable hours 689 596 828 695 561
Billable hours on-site 620 283 596 646 665
Billable hours off-site 779 1,102 614 737 820
Total billable hours 1,399 1,385 1,210 1,383 1,485
Total hours 2,088 1,981 2,038 2,078 2,047
Percentage of remote delivery hours 55.7% 79.5% 50.8% 53.3% 55.2%
Source: SPI Research, February 2021
2021 Professional Services Maturity™ Benchmark
© 2021 Service Performance Insight, LLC www.timelog.dk 119
9. Service Execution Pillar
The Service Execution Pillar measures the quality, efficiency
and repeatability of service delivery. It focuses on the core
activities for planning, scheduling and delivery of service
engagements. Regardless of the maturity of every other area
of the PSO it will not succeed unless it can successfully and
profitably deliver services, with an emphasis on quality,
timeliness and customer value.
The Service Execution pillar is where money is made in professional services. Work must be scoped, bid,
sold, delivered and invoiced in order to generate revenue and maximize project margin. The alignment
of sales, service and finance is critical for success. All project-related information (time, expense, project
details and knowledge) must be captured to be invoiced and to improve the next service delivered.
In an increasingly competitive consulting marketplace, success most often comes down to operational
excellence – with visibility and management controls in place to ensure effective resource and project
management. Done right, gross project margins of more than 60% are possible. Done wrong, project
yields can drop to single digits, or go negative.
Table 108 highlights the maturity levels in the Service Execution pillar, as the PSO moves from basic
reactive “all hands-on deck” project delivery to greater efficiency, repeatability and higher quality
service execution.
Table 108: Service Execution Performance Pillar Mapped Against Service Maturity
Level 1 Initiated
Level 2 Piloted
Level 3 Deployed
Level 4 Institutionalized
Level 5 Optimized
Ser
vice
Exe
cuti
on
No scheduling. Reactive. Ad hoc. Heroic. Scheduling by spreadsheet. No consistent project delivery methods. No project quality controls or knowledge management.
Skeleton methodology in place. Centralized resource mgmt. Initiating project mgmt. and technical skill development. Starting to measure project satisfaction and harvest knowledge.
PSA deployed for resource and project management. Collaborative portal. Earned Value Analysis. Project dashboard. Global Project Management Office, project quality reviews and measurements. Effective change management.
Integrated project and resource management. Effective scheduling. Using portfolio management. Global PMO. Global project dashboard. Global Knowledge Management. Global resource management.
Integrated solutions. Continual checks and balances to assure superior utilization and bill rates. Complete visibility to global project quality. Multi-disciplinary resource management.
Source: SPI Research, February 2021
In 2020 we saw a mixed bag of Service Execution metrics – all of the subjective self-assessment metrics
of “effectiveness” in resource management; estimating and pricing; change control; quality and
knowledge management improved. Most of the objective service execution metrics also improved with
faster project staffing times; more projects delivered on-time; fewer project overruns and better use of

2021 Professional Services Maturity™ Benchmark
© 2021 Service Performance Insight, LLC www.timelog.dk 120
standardized delivery metrics and tools. A few service execution financial metrics improved as well with
better fixed price and subcontractor margins but due to project delays and fewer deals overall revenue
per project and per consultant declined. A very positive aspect of 2020 is that many PSOs used the
lockdown to focus on assessing and improving operations as we saw a surge of improvement projects.
Service Execution Best Practices
Becoming a top performing service delivery organization does not happen overnight but it certainly
won’t happen at all without clear roles, tools and methods designed to enhanced repeatable service
delivery best practices. In this section we outline the key headquarters functions which define and
improve service operations. By the time a PS organization grows to 20 consultants, a PS operations
function becomes mandatory. By the time a PS organization grows to 100 consultants, some
combination of a service engineering and a PMO function is warranted. Best run service organizations
not only invest in these key functions but they also capitalize on best-in-class tools and business
applications to support the goal of repeatable, consistent, high quality and profitable service delivery.
Figure 36: Professional Services Headquarters Functions
Source: SPI Research, February 2021
Operations
Service operations is the heart and soul of building a scalable high quality service organization. Service
operations is responsible for business and capacity planning and forecasting. This function works with
Finance and Practice leaders to develop the annual business plan and drives operations reviews to
achieve revenue and margin targets. In independent firms, Service Operations may report into Finance
or may report directly to the CEO. In independent firms, service sales and delivery operations are
typically combined but in embedded technology firms, service operations is a peer to sales operations.
Depending on the size of the organization, service engineering, service marketing and the project
management office may report into operations however with larger organizations, each of these
functions may report directly to the Practice or Regional VP. Service operations is typically charged with
time and expense capture along with running the resource management function. The most important
tool for service operations is Professional Services Automation which includes resource management,
time and expense capture and billing. Top performing PSOs invest in business and capacity planning
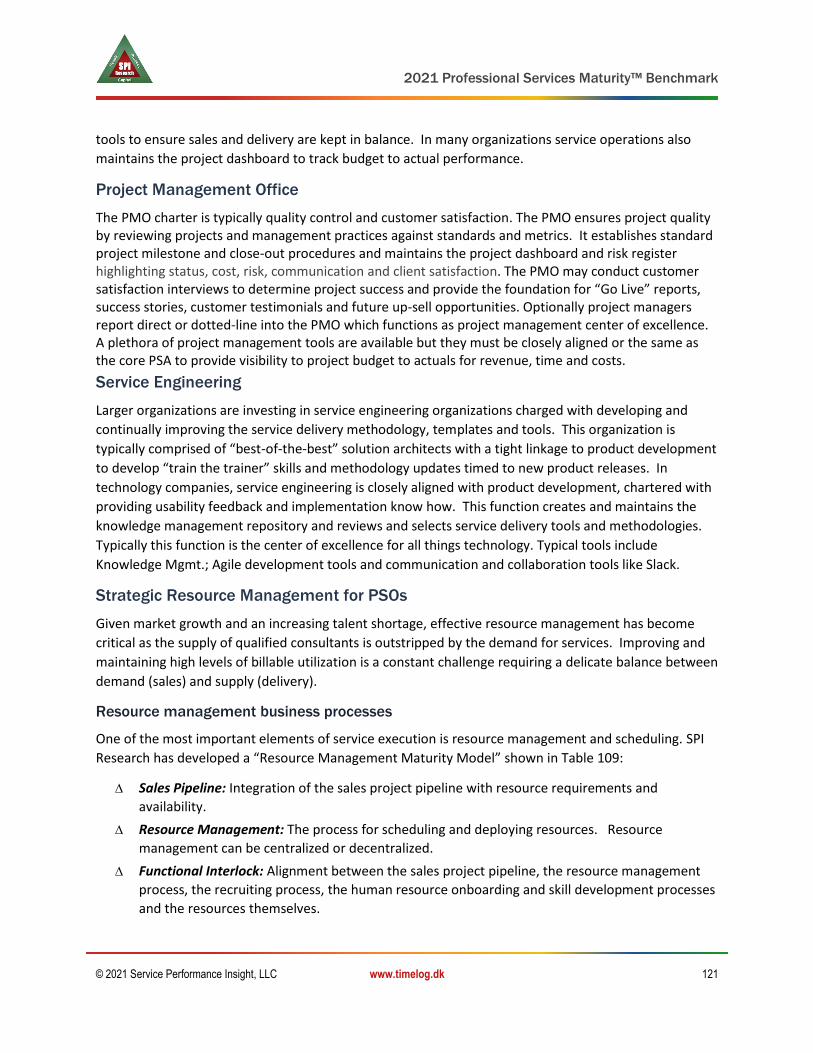
2021 Professional Services Maturity™ Benchmark
© 2021 Service Performance Insight, LLC www.timelog.dk 121
tools to ensure sales and delivery are kept in balance. In many organizations service operations also
maintains the project dashboard to track budget to actual performance.
Project Management Office
The PMO charter is typically quality control and customer satisfaction. The PMO ensures project quality by reviewing projects and management practices against standards and metrics. It establishes standard project milestone and close-out procedures and maintains the project dashboard and risk register highlighting status, cost, risk, communication and client satisfaction. The PMO may conduct customer satisfaction interviews to determine project success and provide the foundation for “Go Live” reports, success stories, customer testimonials and future up-sell opportunities. Optionally project managers report direct or dotted-line into the PMO which functions as project management center of excellence. A plethora of project management tools are available but they must be closely aligned or the same as the core PSA to provide visibility to project budget to actuals for revenue, time and costs.
Service Engineering
Larger organizations are investing in service engineering organizations charged with developing and
continually improving the service delivery methodology, templates and tools. This organization is
typically comprised of “best-of-the-best” solution architects with a tight linkage to product development
to develop “train the trainer” skills and methodology updates timed to new product releases. In
technology companies, service engineering is closely aligned with product development, chartered with
providing usability feedback and implementation know how. This function creates and maintains the
knowledge management repository and reviews and selects service delivery tools and methodologies.
Typically this function is the center of excellence for all things technology. Typical tools include
Knowledge Mgmt.; Agile development tools and communication and collaboration tools like Slack.
Strategic Resource Management for PSOs
Given market growth and an increasing talent shortage, effective resource management has become
critical as the supply of qualified consultants is outstripped by the demand for services. Improving and
maintaining high levels of billable utilization is a constant challenge requiring a delicate balance between
demand (sales) and supply (delivery).
Resource management business processes
One of the most important elements of service execution is resource management and scheduling. SPI
Research has developed a “Resource Management Maturity Model” shown in Table 109:
∆ Sales Pipeline: Integration of the sales project pipeline with resource requirements and
availability.
∆ Resource Management: The process for scheduling and deploying resources. Resource
management can be centralized or decentralized.
∆ Functional Interlock: Alignment between the sales project pipeline, the resource management
process, the recruiting process, the human resource onboarding and skill development processes
and the resources themselves.
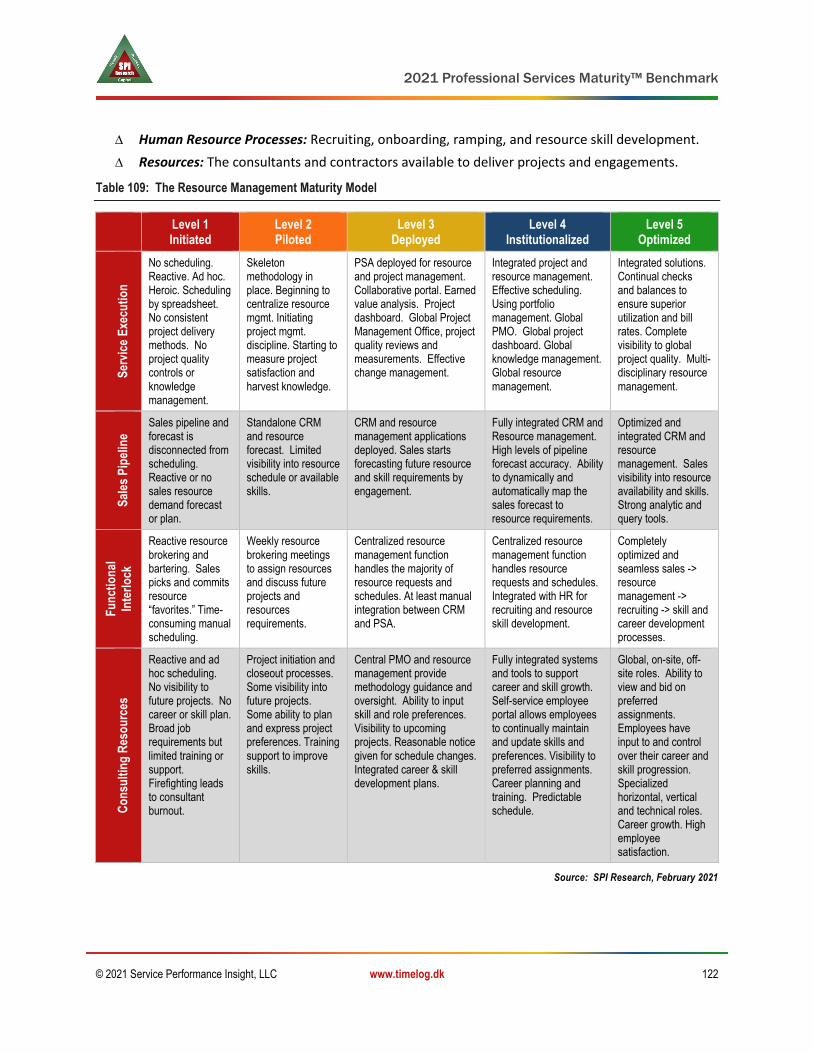
2021 Professional Services Maturity™ Benchmark
© 2021 Service Performance Insight, LLC www.timelog.dk 122
∆ Human Resource Processes: Recruiting, onboarding, ramping, and resource skill development.
∆ Resources: The consultants and contractors available to deliver projects and engagements.
Table 109: The Resource Management Maturity Model
Level 1 Initiated
Level 2 Piloted
Level 3 Deployed
Level 4 Institutionalized
Level 5 Optimized
Ser
vice
Exe
cuti
on
No scheduling. Reactive. Ad hoc. Heroic. Scheduling by spreadsheet. No consistent project delivery methods. No project quality controls or knowledge management.
Skeleton methodology in place. Beginning to centralize resource mgmt. Initiating project mgmt. discipline. Starting to measure project satisfaction and harvest knowledge.
PSA deployed for resource and project management. Collaborative portal. Earned value analysis. Project dashboard. Global Project Management Office, project quality reviews and measurements. Effective change management.
Integrated project and resource management. Effective scheduling. Using portfolio management. Global PMO. Global project dashboard. Global knowledge management. Global resource management.
Integrated solutions. Continual checks and balances to ensure superior utilization and bill rates. Complete visibility to global project quality. Multi-disciplinary resource management.
Sal
es P
ipel
ine
Sales pipeline and forecast is disconnected from scheduling. Reactive or no sales resource demand forecast or plan.
Standalone CRM and resource forecast. Limited visibility into resource schedule or available skills.
CRM and resource management applications deployed. Sales starts forecasting future resource and skill requirements by engagement.
Fully integrated CRM and Resource management. High levels of pipeline forecast accuracy. Ability to dynamically and automatically map the sales forecast to resource requirements.
Optimized and integrated CRM and resource management. Sales visibility into resource availability and skills. Strong analytic and query tools.
Fu
nct
ion
al
Inte
rlo
ck
Reactive resource brokering and bartering. Sales picks and commits resource “favorites.” Time-consuming manual scheduling.
Weekly resource brokering meetings to assign resources and discuss future projects and resources requirements.
Centralized resource management function handles the majority of resource requests and schedules. At least manual integration between CRM and PSA.
Centralized resource management function handles resource requests and schedules. Integrated with HR for recruiting and resource skill development.
Completely optimized and seamless sales -> resource management -> recruiting -> skill and career development processes.
Co
nsu
ltin
g R
eso
urc
es
Reactive and ad hoc scheduling. No visibility to future projects. No career or skill plan. Broad job requirements but limited training or support. Firefighting leads to consultant burnout.
Project initiation and closeout processes. Some visibility into future projects. Some ability to plan and express project preferences. Training support to improve skills.
Central PMO and resource management provide methodology guidance and oversight. Ability to input skill and role preferences. Visibility to upcoming projects. Reasonable notice given for schedule changes. Integrated career & skill development plans.
Fully integrated systems and tools to support career and skill growth. Self-service employee portal allows employees to continually maintain and update skills and preferences. Visibility to preferred assignments. Career planning and training. Predictable schedule.
Global, on-site, off-site roles. Ability to view and bid on preferred assignments. Employees have input to and control over their career and skill progression. Specialized horizontal, vertical and technical roles. Career growth. High employee satisfaction.
Source: SPI Research, February 2021
2021 Professional Services Maturity™ Benchmark
© 2021 Service Performance Insight, LLC www.timelog.dk 123
Which resource management strategy is best?
SPI’s research shows there may not be "one magic bullet" resourcing strategy that is clearly superior to
all others. The five strategies that follow enable PSOs to manage talent and fulfill client demands.
Although centralized resource management is the most prevalent strategy, each organization must
create a resourcing strategy that works best for their business, with the ultimate goal of increasing
utilization and client and employee satisfaction.
1. Centrally-managed – Most resource management pundits favor "centralized" resource
management. It provides superior management visibility into the entire project backlog and level
of skills required both today and in the future. In centralized resource management, a dedicated
resource management team is responsible for managing the master resource schedule and
making staffing decisions based on skills, availability, location, cost, preference, etc. Centralized
management is the most efficient way to manage a large workforce. In this year’s benchmark,
centralized management produced some of the best results with fewer project overruns and the
best revenue per consultant and project margins.
2. Local resource management – Local resource management is the preferred form of resourcing for
young organizations where the workforce is small enough to foster real esprit de corps, and
employees wear many hats. Smaller organizations can't afford the overhead of a dedicated
resource management function, as relationships and roles are fluid, requiring more local control
and finesse. Staffing locally also provides the benefit of closer client relationships and less travel.
3. Account-based – Resource management by account may be a good strategy for very large
accounts where there is a strong backlog of projects, but account-based resourcing can cause big
issues if account revenue dries up. An example was Electronic Data Systems' (EDS) reliance on
revenue from General Motors. As the relationship with General Motors soured, and its fortunes
began to wane, Electronic Data Systems was left holding the bag. The other drawback to account-
based resourcing is that it narrows consultant range of experience as teams are not exposed to
diverse business models and client challenges.
4. By horizontal skill set – Managing resources by horizontal skill set is useful for developing best
practices, repeatable processes and shared knowledge. For example, many firms have project and
program managers report directly or indirectly to the Project Management Office (PMO). By
building affinity around "birds of a feather," project managers or specialized consultants can more
easily share best practices and standardize methodologies, templates, etc. As organizations grow,
a horizontal or competency-based overlay reporting structure can help firms develop repeatable
best practices and deep, shared domain expertise while still enjoying the efficiency of centralized
management.
5. Centers of excellence – The current trend towards vertical and offshore Centers of Excellence
(COE) was pioneered by Accenture over the last decades. The advantage of industry-specific
"Centers of Excellence" is the development of deep industry domain knowledge. In theory, each

2021 Professional Services Maturity™ Benchmark
© 2021 Service Performance Insight, LLC www.timelog.dk 124
Center of Excellence acts as a clearinghouse for specialized knowledge, expertise and solutions.
Clients and prospects delight in seeing a "Vision of the Future" for their unique industry
challenges. The downside of COE can be excessive overhead, the creation of an ivory tower
mentality along with the inability to learn from emerging new horizontal and vertical trends.
Further, use of horizontal skills sets and technologies outside the COE can become cumbersome
and inefficient. Centers of Excellence are favored for outsourced consulting – particularly
development and managed service centers where consultants are collocated to maximize
collaboration, repeatability and quality control while minimizing cost.
Table 110: Impact – Resource Management Strategy
Resource Mgmt. Strategy
Survey %
Revenue growth
Billable utilization
On-time proj. delivery
Project overrun
Revenue / Consult (k)
Project margin
Centrally Managed 44.0% 7.3% 71.1% 81.2% 7.5% $210 38.9%
Locally Managed 23.1% 6.6% 70.3% 77.6% 9.5% $195 32.9%
By Account 9.2% 10.1% 72.0% 80.8% 8.8% $183 30.0%
By Horizontal Skill Set 8.2% 9.8% 73.6% 80.0% 9.3% $204 33.5%
Center of Excellence 10.1% 6.8% 71.4% 82.4% 9.1% $203 37.7%
Other 5.4% 3.2% 73.2% 71.4% 8.4% $194 35.6%
Total / Average 100.0% 7.4% 71.4% 79.8% 8.4% $203 36.0%
Source: SPI Research, February 2021
To improve utilization, PSOs must improve resource management effectiveness. As Table 110 shows,
there are pluses and minuses to different resource management strategies. Green shading indicates
“Best” while red shading indicates “Worst” based on responses from 561 firms. This year “Centrally
Managed” comes out on top with the highest number of “best” scores. By account and “other”
resourcing showed the worst results, because resources may be hoarded by account, prohibiting
redeployment to more lucrative clients and services.
Survey Results
Table 111 shows 5-year trends for Service Execution KPIs. The table shows a mixed bag of
improvements and declines. Project staffing time decreased due to lower attrition and more stability in
the workforce due to “sheltering in place” and “working from home”. Revenue per project declined due
to holdups and project cancellations caused by the pandemic while staff size and project durations
increased as consultants were able to focus on fewer, larger projects. On-time project delivery
improved while project overruns decreased. Use of standardized delivery methodologies improved.
Project margins for fixed priced projects and subcontractors were the best reported for the past five
years! Subcontractor margin also improved nicely. All of the subjective questions around resource
management; estimating; change control; project quality and knowledge management improved.
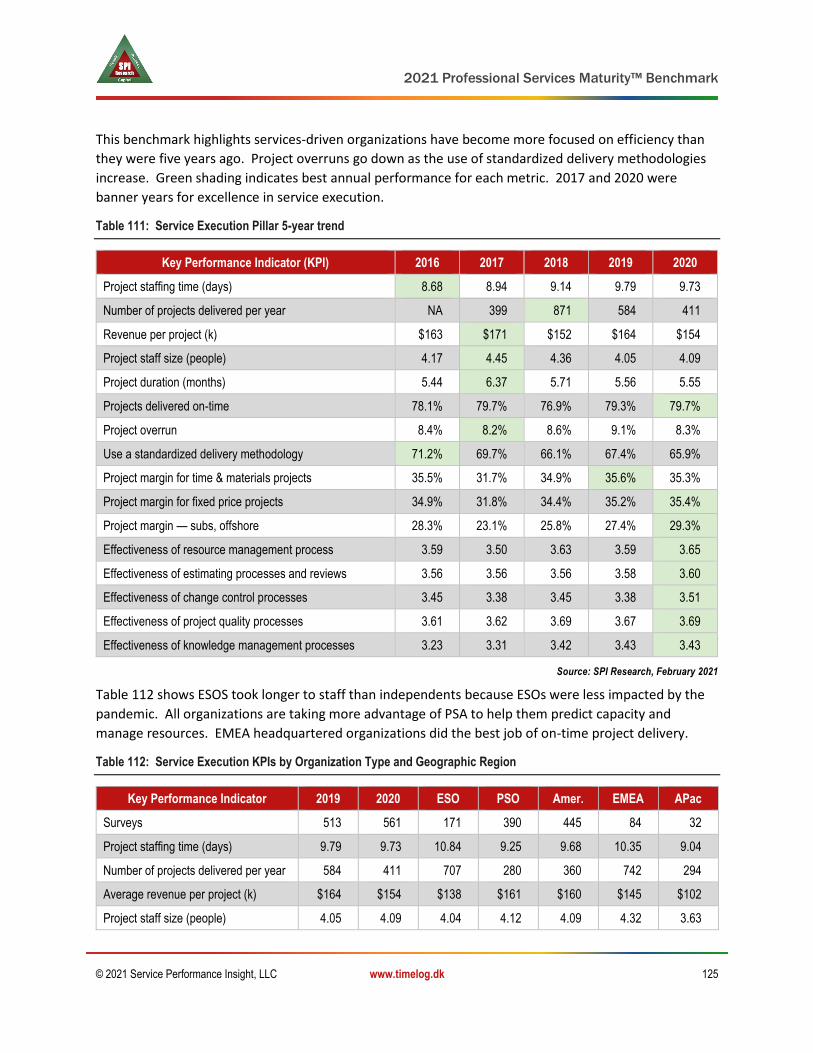
2021 Professional Services Maturity™ Benchmark
© 2021 Service Performance Insight, LLC www.timelog.dk 125
This benchmark highlights services-driven organizations have become more focused on efficiency than
they were five years ago. Project overruns go down as the use of standardized delivery methodologies
increase. Green shading indicates best annual performance for each metric. 2017 and 2020 were
banner years for excellence in service execution.
Table 111: Service Execution Pillar 5-year trend
Key Performance Indicator (KPI) 2016 2017 2018 2019 2020
Project staffing time (days) 8.68 8.94 9.14 9.79 9.73
Number of projects delivered per year NA 399 871 584 411
Revenue per project (k) $163 $171 $152 $164 $154
Project staff size (people) 4.17 4.45 4.36 4.05 4.09
Project duration (months) 5.44 6.37 5.71 5.56 5.55
Projects delivered on-time 78.1% 79.7% 76.9% 79.3% 79.7%
Project overrun 8.4% 8.2% 8.6% 9.1% 8.3%
Use a standardized delivery methodology 71.2% 69.7% 66.1% 67.4% 65.9%
Project margin for time & materials projects 35.5% 31.7% 34.9% 35.6% 35.3%
Project margin for fixed price projects 34.9% 31.8% 34.4% 35.2% 35.4%
Project margin — subs, offshore 28.3% 23.1% 25.8% 27.4% 29.3%
Effectiveness of resource management process 3.59 3.50 3.63 3.59 3.65
Effectiveness of estimating processes and reviews 3.56 3.56 3.56 3.58 3.60
Effectiveness of change control processes 3.45 3.38 3.45 3.38 3.51
Effectiveness of project quality processes 3.61 3.62 3.69 3.67 3.69
Effectiveness of knowledge management processes 3.23 3.31 3.42 3.43 3.43
Source: SPI Research, February 2021
Table 112 shows ESOS took longer to staff than independents because ESOs were less impacted by the
pandemic. All organizations are taking more advantage of PSA to help them predict capacity and
manage resources. EMEA headquartered organizations did the best job of on-time project delivery.
Table 112: Service Execution KPIs by Organization Type and Geographic Region
Key Performance Indicator 2019 2020 ESO PSO Amer. EMEA APac
Surveys 513 561 171 390 445 84 32
Project staffing time (days) 9.79 9.73 10.84 9.25 9.68 10.35 9.04
Number of projects delivered per year 584 411 707 280 360 742 294
Average revenue per project (k) $164 $154 $138 $161 $160 $145 $102
Project staff size (people) 4.05 4.09 4.04 4.12 4.09 4.32 3.63

2021 Professional Services Maturity™ Benchmark
© 2021 Service Performance Insight, LLC www.timelog.dk 126
Key Performance Indicator 2019 2020 ESO PSO Amer. EMEA APac
Project duration (months) 5.56 5.55 4.99 5.80 5.70 4.92 5.02
Projects delivered on-time 79.3% 79.7% 75.0% 81.8% 79.5% 81.3% 79.2%
Project overrun 9.1% 8.3% 9.6% 7.8% 8.3% 8.8% 7.3%
Use a standardized delivery method. 67.4% 65.9% 71.5% 63.4% 66.6% 63.2% 63.1%
Project margin for T&M projects 35.6% 35.3% 33.6% 36.0% 35.4% 35.1% 34.5%
Project margin for fixed-price projects 35.2% 35.4% 34.0% 36.1% 35.5% 35.6% 33.9%
Project margin — subs., offshore 27.4% 29.3% 31.0% 28.6% 29.1% 31.5% 27.3%
Effect. of resource mgmt. process 3.59 3.65 3.50 3.72 3.64 3.76 3.62
Effect. of estimating proc. and reviews 3.58 3.60 3.46 3.66 3.60 3.65 3.50
Effect. of change control processes 3.38 3.51 3.50 3.51 3.51 3.52 3.42
Effect. of project quality processes 3.67 3.69 3.53 3.76 3.70 3.71 3.46
Effect. of knowledge mgmt. processes 3.43 3.43 3.28 3.49 3.46 3.24 3.46
Source: SPI Research, February 2021
The nature of projects is shifting towards more configuration, workflow analysis, user interfaces and
report design away from the complex, custom mega projects of the past making them somewhat easier
to manage and keep within scope. A host of accelerators, configuration, project and knowledge
management tools have come to market to enhance knowledge sharing and collaboration while
facilitating more natural oversight, guidance and real-time quality reviews to mitigate risks.
Table 113 shows the differences in service execution metrics by size of organization. Historically, the
smallest organizations staff faster than larger organizations. The number, size and complexity of projects
increases proportionately to organization size with the largest organizations delivering projects
averaging 37-man months (3 years) but typically on-time project delivery diminishes with organization
size. The downside of larger organizations is shown in decreasing on-time project delivery and increasing
project overruns. This chart shows why the consulting industry is filled with small boutique firms as
project margins and project quality metrics such as on-time delivery are very respectable for the
smallest organizations.
Table 113: Service Execution KPIs by Organization Size
Key Performance Indicator Under
10 10 - 30 31 - 100 101 - 300
301 - 700
Over 700
Surveys 62 108 170 111 48 62
Project staffing time (days) 9.22 6.95 9.58 10.05 14.71 12.36
Number of projects delivered per year 65 86 209 327 1,672 1,508
Average revenue per project (k) $66 $136 $144 $166 $154 $326
Project staff size (people) 1.86 3.52 3.90 4.88 5.46 5.89

2021 Professional Services Maturity™ Benchmark
© 2021 Service Performance Insight, LLC www.timelog.dk 127
Key Performance Indicator Under
10 10 - 30 31 - 100 101 - 300
301 - 700
Over 700
Project duration (months) 4.51 5.74 5.10 5.84 6.58 6.34
Projects delivered on-time 80.9% 81.2% 80.4% 78.5% 75.4% 79.7%
Project overrun 7.4% 8.4% 7.4% 8.6% 10.6% 9.8%
Use a standardized delivery methodology 59.1% 72.3% 66.3% 65.3% 61.1% 63.5%
Project margin for time & materials projects 35.5% 34.3% 35.5% 36.2% 35.4% 34.6%
Project margin for fixed price projects 36.3% 33.9% 34.6% 38.6% 35.7% 32.6%
Project margin — subcontractors, offshore 29.7% 29.4% 29.5% 29.8% 28.1% 28.1%
Effectiveness of resource management process 3.76 3.74 3.65 3.55 3.44 3.78
Effectiveness of estimating processes and reviews 3.76 3.66 3.58 3.52 3.38 3.71
Effectiveness of change control processes 3.76 3.46 3.46 3.41 3.53 3.69
Effectiveness of project quality processes 3.90 3.73 3.60 3.59 3.75 3.81
Effectiveness of knowledge mgmt. processes 3.60 3.53 3.32 3.44 3.31 3.44
Source: SPI Research, February 2021
Tables 114 and 115 show service execution metrics by vertical market. Remarkably, many service
execution metrics are very similar across markets. Managed Service providers deliver the largest
projects averaging $271K. Architects and engineers and Marcom deliver the smallest projects, averaging
$99K and $70K respectively. Management consultancies do the best job of on-time project delivery
(85.8%) while VARs and Software PSOs reported the worst on-time project delivery. VARs reported the
best time-and-materials project margins at 36.8%; VARS delivered the best fixed price margins (40%)
and hardware PS delivers the best subcontractor margins (43.2%).
Table 114: Service Execution KPIs by Vertical Market
Key Performance Indicator IT Consult Mgmt.
Consult SaaS PS Software
PS Arch./ Engr.
Surveys 143 84 64 55 35
Project staffing time (days) 9.80 9.31 8.89 12.61 7.12
Number of projects delivered per year 246 135 444 406 559
Average revenue per project (k) $183 $173 $117 $132 $99
Project staff size (people) 4.25 3.52 3.77 4.39 4.09
Project duration (months) 5.79 5.73 4.67 4.93 6.81
Projects delivered on-time 81.1% 85.8% 75.0% 74.1% 77.1%
Project overrun 8.2% 5.9% 11.0% 8.6% 11.0%
Use a standardized delivery methodology 66.0% 62.8% 76.0% 70.9% 63.8%

2021 Professional Services Maturity™ Benchmark
© 2021 Service Performance Insight, LLC www.timelog.dk 128
Key Performance Indicator IT Consult Mgmt.
Consult SaaS PS Software
PS Arch./ Engr.
Project margin for time & materials projects 39.6% 36.2% 30.3% 34.7% 30.9%
Project margin for fixed price projects 37.8% 38.4% 30.1% 37.2% 35.4%
Project margin — subcontractors, offshore 32.4% 26.6% 29.3% 29.2% 22.0%
Effectiveness of resource management process 3.70 3.91 3.42 3.69 3.69
Effectiveness of estimating processes and reviews 3.64 3.75 3.28 3.52 3.69
Effectiveness of change control processes 3.51 3.65 3.43 3.48 3.35
Effectiveness of project quality processes 3.74 3.85 3.55 3.52 3.69
Effectiveness of knowledge mgmt. processes 3.42 3.58 3.40 3.14 3.69
Source: SPI Research, February 2021
Table 115: Service Execution KPIs by Vertical Market
Key Performance Indicator MarCom VAR Account Mgd. Serv.
All Others
Surveys 31 17 14 13 105
Project staffing time (days) 5.74 10.83 12.95 13.33 9.78
Number of projects delivered per year 282 230 193 223 1,031
Average revenue per project (k) $70 $267 $181 $271 $136
Project staff size (people) 5.18 3.92 3.21 4.83 4.33
Project duration (months) 5.65 5.54 5.21 7.92 5.40
Projects delivered on-time 80.0% 71.3% 76.7% 82.5% 81.3%
Project overrun 8.0% 8.3% 10.2% 9.2% 7.4%
Use a standardized delivery methodology 62.9% 68.3% 55.5% 73.3% 59.7%
Project margin for time & materials projects 31.4% 43.2% 33.6% 27.5% 33.4%
Project margin for fixed price projects 31.0% 35.5% 31.8% 31.7% 33.7%
Project margin — subcontractors, offshore 33.8% 40.6% 26.4% 42.5% 27.4%
Effectiveness of resource management process 3.09 3.33 3.45 3.33 3.65
Effectiveness of estimating processes and reviews 3.73 3.89 3.27 4.00 3.62
Effectiveness of change control processes 3.55 4.11 3.45 4.00 3.40
Effectiveness of project quality processes 3.91 3.67 3.64 3.67 3.63
Effectiveness of knowledge mgmt. processes 3.45 3.33 3.45 2.67 3.45
Source: SPI Research, February 2021
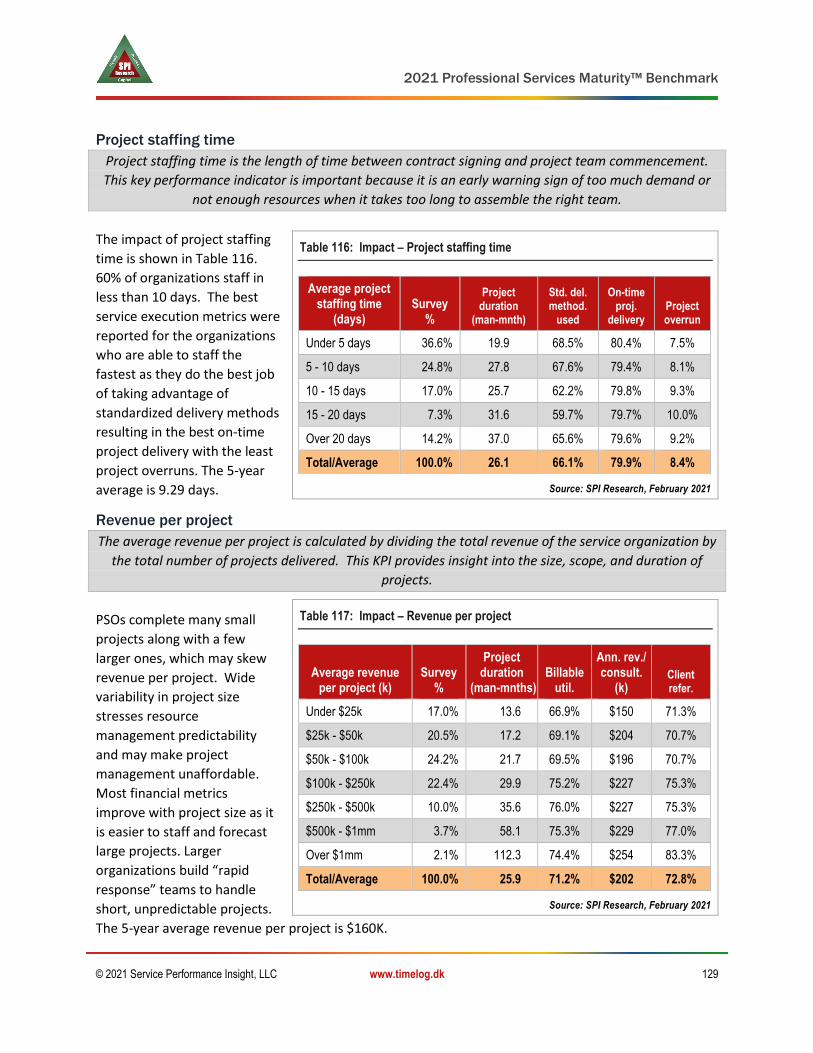
2021 Professional Services Maturity™ Benchmark
© 2021 Service Performance Insight, LLC www.timelog.dk 129
Project staffing time
Project staffing time is the length of time between contract signing and project team commencement.
This key performance indicator is important because it is an early warning sign of too much demand or
not enough resources when it takes too long to assemble the right team.
The impact of project staffing
time is shown in Table 116.
60% of organizations staff in
less than 10 days. The best
service execution metrics were
reported for the organizations
who are able to staff the
fastest as they do the best job
of taking advantage of
standardized delivery methods
resulting in the best on-time
project delivery with the least
project overruns. The 5-year
average is 9.29 days.
Revenue per project
The average revenue per project is calculated by dividing the total revenue of the service organization by
the total number of projects delivered. This KPI provides insight into the size, scope, and duration of
projects.
PSOs complete many small
projects along with a few
larger ones, which may skew
revenue per project. Wide
variability in project size
stresses resource
management predictability
and may make project
management unaffordable.
Most financial metrics
improve with project size as it
is easier to staff and forecast
large projects. Larger
organizations build “rapid
response” teams to handle
short, unpredictable projects.
The 5-year average revenue per project is $160K.
Table 116: Impact – Project staffing time
Average project staffing time
(days) Survey
%
Project duration
(man-mnth)
Std. del. method.
used
On-time proj.
delivery Project overrun
Under 5 days 36.6% 19.9 68.5% 80.4% 7.5%
5 - 10 days 24.8% 27.8 67.6% 79.4% 8.1%
10 - 15 days 17.0% 25.7 62.2% 79.8% 9.3%
15 - 20 days 7.3% 31.6 59.7% 79.7% 10.0%
Over 20 days 14.2% 37.0 65.6% 79.6% 9.2%
Total/Average 100.0% 26.1 66.1% 79.9% 8.4%
Source: SPI Research, February 2021
Table 117: Impact – Revenue per project
Average revenue per project (k)
Survey %
Project duration
(man-mnths) Billable
util.
Ann. rev./ consult.
(k) Client refer.
Under $25k 17.0% 13.6 66.9% $150 71.3%
$25k - $50k 20.5% 17.2 69.1% $204 70.7%
$50k - $100k 24.2% 21.7 69.5% $196 70.7%
$100k - $250k 22.4% 29.9 75.2% $227 75.3%
$250k - $500k 10.0% 35.6 76.0% $227 75.3%
$500k - $1mm 3.7% 58.1 75.3% $229 77.0%
Over $1mm 2.1% 112.3 74.4% $254 83.3%
Total/Average 100.0% 25.9 71.2% $202 72.8%
Source: SPI Research, February 2021

2021 Professional Services Maturity™ Benchmark
© 2021 Service Performance Insight, LLC www.timelog.dk 130
Project staff size
The project staff size is the FTE number of resources dedicated to projects. Shorter, more iterative,
“agile” projects cause more scheduling issues but may result in improved project value and ROI.
Larger projects may improve
utilization but show the
poorest use of standard
delivery methods. Across the
benchmark, the average
project staff size has declined
every year, making effective
resource management
imperative (table 118). The 5-
year average is 4.23.
Project duration
The average project duration, expressed in months, pertains to how long it takes to deliver projects. The
average project duration, like average project staff size, is important in that it shows the length and scale
of projects. Longer projects may be easier to forecast and staff but are not necessarily more profitable
because they may entail more risk and complexity.
Unlike project staff size,
project duration has remained
relatively constant, averaging
5.72 months over the past 5
years. Table 119 shows larger
projects enhance billable
utilization and predictability
but may also involve greater
complexity and risk resulting
in more project overruns.
Projects under 3 months in
duration stress resource
scheduling, resulting in poor
billable utilization.
Table 118: Impact – Project staff size
Average project staff size (people)
Survey %
Project duration
(man-months)
Billable util.
Std. del. method.
used
On-time project delivery
1 - 2 28.9% 6.1 69.6% 62.9% 80.3%
3 - 5 52.7% 22.1 71.7% 68.1% 80.0%
6 - 8 13.5% 49.0 72.5% 68.2% 78.9%
9 - 11 2.1% 100.6 71.1% 56.7% 73.3%
Over 11 2.8% 147.6 75.8% 50.0% 77.5%
Total/Average 100.0% 26.2 71.3% 65.9% 79.7%
Source: SPI Research, February 2021
Table 119: Impact – Project duration
Project Duration (months) Survey %
Employee attrition
Billable util.
On-time delivery
Project margin
Under 1 4.5% 8.1% 67.5% 72.9% 33.2%
1 - 3 24.6% 11.3% 69.9% 79.9% 34.6%
3 - 6 36.6% 11.7% 71.2% 80.2% 37.8%
6 - 9 16.7% 12.0% 73.7% 80.2% 36.4%
9 - 12 10.8% 11.6% 70.7% 76.9% 36.5%
Over 12 6.8% 12.5% 75.7% 84.8% 30.8%
Total/Average 100.0% 11.5% 71.4% 79.7% 36.0%
Source: SPI Research, February 2021
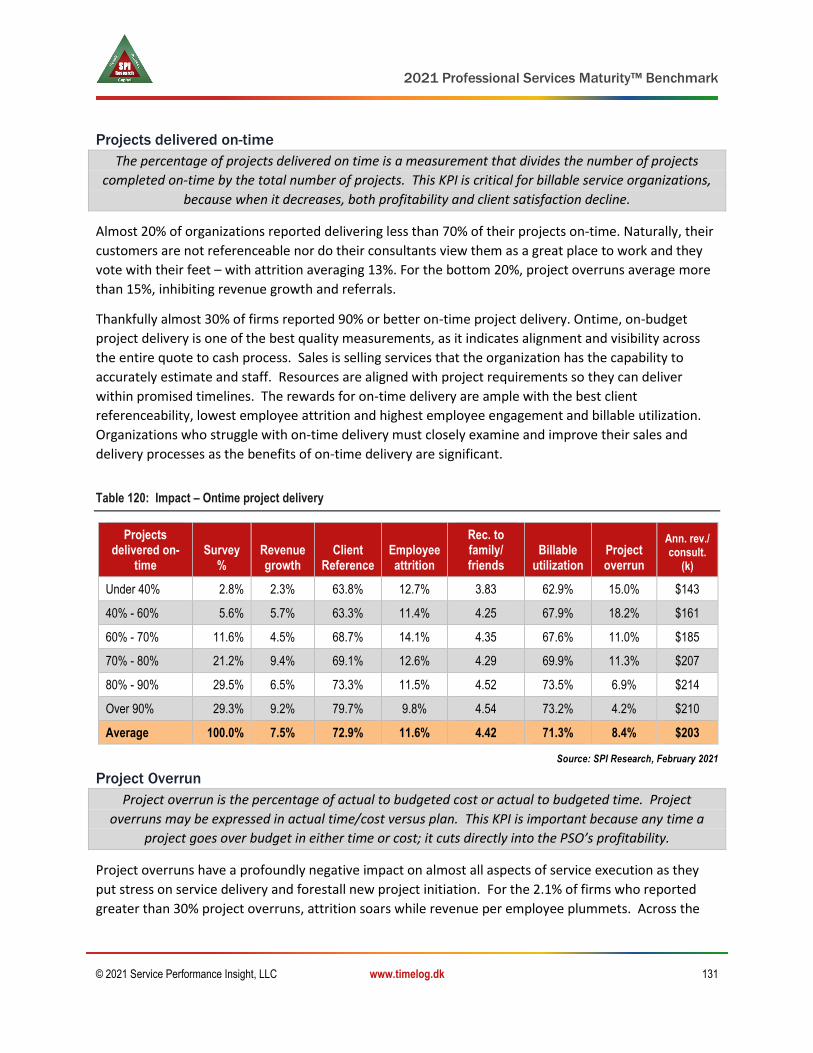
2021 Professional Services Maturity™ Benchmark
© 2021 Service Performance Insight, LLC www.timelog.dk 131
Projects delivered on-time
The percentage of projects delivered on time is a measurement that divides the number of projects
completed on-time by the total number of projects. This KPI is critical for billable service organizations,
because when it decreases, both profitability and client satisfaction decline.
Almost 20% of organizations reported delivering less than 70% of their projects on-time. Naturally, their
customers are not referenceable nor do their consultants view them as a great place to work and they
vote with their feet – with attrition averaging 13%. For the bottom 20%, project overruns average more
than 15%, inhibiting revenue growth and referrals.
Thankfully almost 30% of firms reported 90% or better on-time project delivery. Ontime, on-budget
project delivery is one of the best quality measurements, as it indicates alignment and visibility across
the entire quote to cash process. Sales is selling services that the organization has the capability to
accurately estimate and staff. Resources are aligned with project requirements so they can deliver
within promised timelines. The rewards for on-time delivery are ample with the best client
referenceability, lowest employee attrition and highest employee engagement and billable utilization.
Organizations who struggle with on-time delivery must closely examine and improve their sales and
delivery processes as the benefits of on-time delivery are significant.
Table 120: Impact – Ontime project delivery
Projects delivered on-
time Survey
% Revenue growth
Client Reference
Employee attrition
Rec. to family/ friends
Billable utilization
Project overrun
Ann. rev./ consult.
(k)
Under 40% 2.8% 2.3% 63.8% 12.7% 3.83 62.9% 15.0% $143
40% - 60% 5.6% 5.7% 63.3% 11.4% 4.25 67.9% 18.2% $161
60% - 70% 11.6% 4.5% 68.7% 14.1% 4.35 67.6% 11.0% $185
70% - 80% 21.2% 9.4% 69.1% 12.6% 4.29 69.9% 11.3% $207
80% - 90% 29.5% 6.5% 73.3% 11.5% 4.52 73.5% 6.9% $214
Over 90% 29.3% 9.2% 79.7% 9.8% 4.54 73.2% 4.2% $210
Average 100.0% 7.5% 72.9% 11.6% 4.42 71.3% 8.4% $203
Source: SPI Research, February 2021
Project Overrun
Project overrun is the percentage of actual to budgeted cost or actual to budgeted time. Project
overruns may be expressed in actual time/cost versus plan. This KPI is important because any time a
project goes over budget in either time or cost; it cuts directly into the PSO’s profitability.
Project overruns have a profoundly negative impact on almost all aspects of service execution as they
put stress on service delivery and forestall new project initiation. For the 2.1% of firms who reported
greater than 30% project overruns, attrition soars while revenue per employee plummets. Across the

2021 Professional Services Maturity™ Benchmark
© 2021 Service Performance Insight, LLC www.timelog.dk 132
benchmark, project overruns
decreased from 9.1% to 8.3%
this year. Architects and
engineers and SaaS ESOs
reported the largest overruns
at 11%. Overruns increase
with project size and
complexity which is a primary
reason that most
organizations are moving to
agile “sprints” – breaking
projects down into more
manageable pieces.
Standardized delivery methodology use
A standardized (or structured) delivery methodology is used to incorporate best-practices and quality
into projects. Repeatable frameworks include tools, templates and knowledge.
Mature firms invest significant time and attention into methodology development as a means to
standardize delivery processes; define expectations and institutionalize quality. Using a standardized
delivery methodology is a critical component of a services productization strategy. It helps improve
project forecasting and resource management thereby improving profitability. PSOs who can accurately
plan and execute services in a structured way, are not only more productive but also more likely to
deliver with quality. There is significant effort involved in developing, implementing and adhering to
standardized delivery
methodologies, but the net
impact for PSOs is beneficial.
Table 122 shows the use of
standardized delivery methods
and tools has a positive impact
on on-time project delivery,
project margins and EBITDA.
This year ESOs did a better job
of standardizing delivery
methodologies with 71.5% of
their projects taking
advantage of standardized
methods and tools. SaaS ESOs
Table 121: Impact – Project overrun
Project overrun Survey
% Employee attrition
Rec. to family/ friends
Billable util.
On-time project delivery
Never 5.7% 5.6% 4.46 75.5% 86.3%
0% - 5% 33.0% 11.1% 4.49 73.2% 87.2%
5% - 10% 35.4% 11.8% 4.44 70.2% 79.2%
10% - 20% 19.3% 12.3% 4.31 68.4% 72.4%
20% - 30% 4.5% 13.8% 4.37 71.9% 64.7%
Over 30% 2.1% 20.3% 4.11 69.4% 53.9%
Total/Average 100.0% 11.6% 4.42 71.2% 79.7%
Source: SPI Research, February 2021
Table 122: Impact – Standardized delivery methodology use
Percentage of projects where a
std. delivery meth. is used Survey %
On-time project delivery
Employee attrition
Project margin EBITDA
Under 20% 8.1% 76.7% 14.5% 37.3% 12.1%
20% - 40% 8.8% 77.1% 11.0% 31.2% 15.0%
40% - 60% 19.0% 78.1% 12.3% 33.6% 16.8%
60% - 80% 24.2% 78.4% 11.8% 35.5% 15.6%
Over 80% 40.0% 82.2% 10.8% 38.1% 16.2%
Total/Average 100.0% 79.6% 11.7% 36.0% 15.7%
Source: SPI Research, February 2021

2021 Professional Services Maturity™ Benchmark
© 2021 Service Performance Insight, LLC www.timelog.dk 133
reported the use of standardized methods on more than 76% of their projects.
Project margin trends
Project margin is the percentage of revenue which remains after accounting for the direct costs of
project delivery
Figure 37 shows average project margins
have varied greatly but stayed the same
this year. This metric underscores the
importance of a holistic view of PS, as one
important metric like project margin can
cause a ripple effect leading to lower
overall net profit.
Leading professional services organizations
strive to achieve project margins over 35%
but as the figure shows, less than one third
of the organizations surveyed consistently
achieve project margins greater than 40%.
Low project margins are caused by a
variety of issues including poor estimates,
scope change, lack of a clear project
charter, poor project management, poor
execution and communication combined
with not having enough or poorly prepared
consultants. Organizations with lower
project margins struggle to meet annual
margin targets. Very few organizations are
making more than 30% margin on
subcontractors.
Projects can be structured in a variety of
ways – fixed price, milestone based, time
and materials or cost plus. Typically, time
and materials-based projects produce the
best margins as long as bill rates are set
appropriately. “Not to exceed” projects
should be avoided as they provide none of
the benefits of fixed price projects but
carry all of the risks. Cost-plus contracts
are also undesirable; they are most
prevalent in government work which tends
to be penny-wise and pound-foolish.
Figure 37: Project Margin Five-year Trend
Source: SPI Research, February 2021
Figure 38: Project Margin Comparison by Type
Source: SPI Research, February 2021
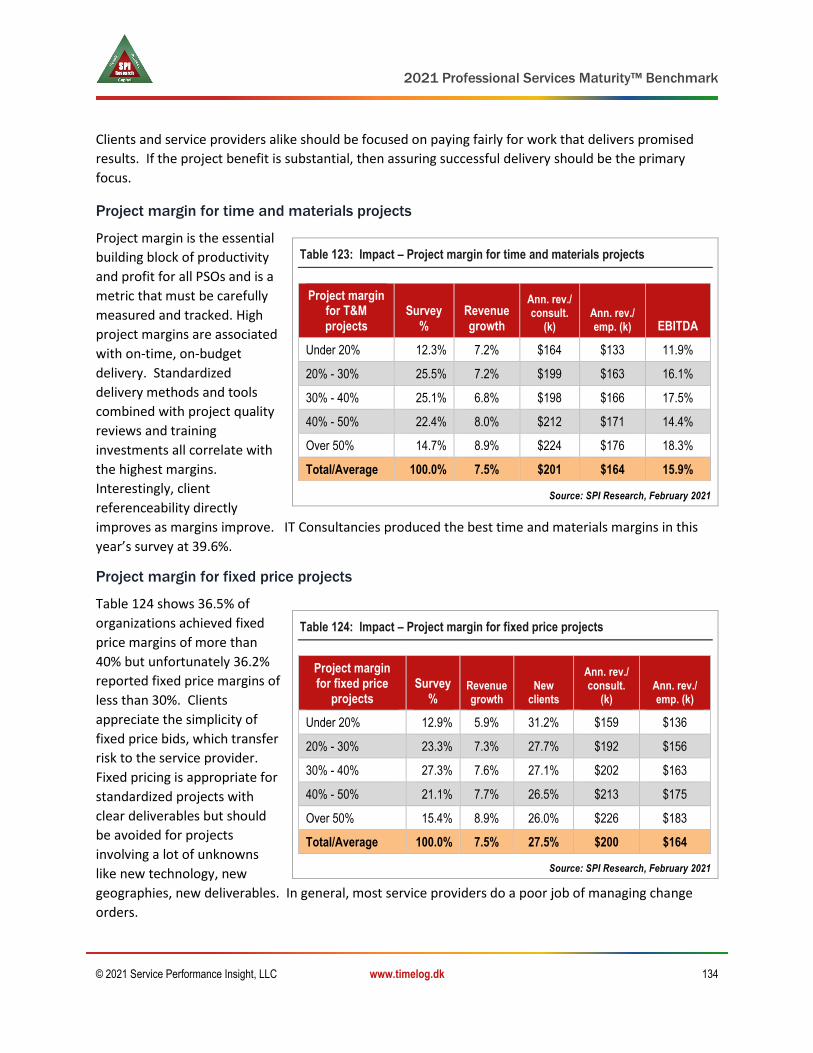
2021 Professional Services Maturity™ Benchmark
© 2021 Service Performance Insight, LLC www.timelog.dk 134
Clients and service providers alike should be focused on paying fairly for work that delivers promised
results. If the project benefit is substantial, then assuring successful delivery should be the primary
focus.
Project margin for time and materials projects
Project margin is the essential
building block of productivity
and profit for all PSOs and is a
metric that must be carefully
measured and tracked. High
project margins are associated
with on-time, on-budget
delivery. Standardized
delivery methods and tools
combined with project quality
reviews and training
investments all correlate with
the highest margins.
Interestingly, client
referenceability directly
improves as margins improve. IT Consultancies produced the best time and materials margins in this
year’s survey at 39.6%.
Project margin for fixed price projects
Table 124 shows 36.5% of
organizations achieved fixed
price margins of more than
40% but unfortunately 36.2%
reported fixed price margins of
less than 30%. Clients
appreciate the simplicity of
fixed price bids, which transfer
risk to the service provider.
Fixed pricing is appropriate for
standardized projects with
clear deliverables but should
be avoided for projects
involving a lot of unknowns
like new technology, new
geographies, new deliverables. In general, most service providers do a poor job of managing change
orders.
Table 123: Impact – Project margin for time and materials projects
Project margin for T&M projects
Survey %
Revenue growth
Ann. rev./ consult.
(k) Ann. rev./ emp. (k) EBITDA
Under 20% 12.3% 7.2% $164 $133 11.9%
20% - 30% 25.5% 7.2% $199 $163 16.1%
30% - 40% 25.1% 6.8% $198 $166 17.5%
40% - 50% 22.4% 8.0% $212 $171 14.4%
Over 50% 14.7% 8.9% $224 $176 18.3%
Total/Average 100.0% 7.5% $201 $164 15.9%
Source: SPI Research, February 2021
Table 124: Impact – Project margin for fixed price projects
Project margin for fixed price
projects Survey
% Revenue growth
New clients
Ann. rev./ consult.
(k) Ann. rev./ emp. (k)
Under 20% 12.9% 5.9% 31.2% $159 $136
20% - 30% 23.3% 7.3% 27.7% $192 $156
30% - 40% 27.3% 7.6% 27.1% $202 $163
40% - 50% 21.1% 7.7% 26.5% $213 $175
Over 50% 15.4% 8.9% 26.0% $226 $183
Total/Average 100.0% 7.5% 27.5% $200 $164
Source: SPI Research, February 2021

2021 Professional Services Maturity™ Benchmark
© 2021 Service Performance Insight, LLC www.timelog.dk 135
Project margin — subcontractors and offshore
Subcontractor margin is an important metric which represents the gross margin after paying for the cost
of the resource. Markup represents the sales price, not the cost of delivery.
Use of subcontractors has
remained relatively constant
across this benchmark,
averaging 11.5% of revenue
for the past 5 years. Although
service providers would like to
use more contingent labor,
few great subcontractors are
available on an on-going basis.
Further, highly skilled
independent consultants
understand their value which
is why average subcontractor
margin hovers at 26.8% for the
past five years. Table 125
shows significant benefits for the few firms who are able to enjoy greater than 40% subcontractor
margin with commensurate high project and EBITDA margins. These organizations are more likely to
judiciously use subcontractors because they use standardized methods and tools. A word of caution –
excessive use of subcontractors undermines quality and knowledge capture leading to commoditization.
Organizations who rely on subcontractors for more than 20% of revenue run the risk of being viewed as
transactional staffing providers instead of high value consultancies.
Effectiveness of the resource management processes
SPI Research asked survey
respondents to rate the
effectiveness of their resource
management process with 1 =
very ineffective and 5 = very
effective. Resource
management is critical to
project planning and
execution. PSOs who
effectively and efficiently
manage resources show much
higher utilization rates, more
projects delivered on-time and
fewer project overruns
Table 125: Impact – Project margin — subs, offshore
Average project margin — subs,
offshore Survey
% New
clients
Std. del. method.
used Ann. rev./
consult. (k)
Ann. rev./
emp. (k)
Under 20% 28.6% 22.1% 64.8% $186 $149
20% - 30% 26.1% 29.3% 64.3% $189 $148
30% - 40% 22.1% 25.1% 68.4% $213 $176
40% - 50% 11.6% 30.4% 66.5% $223 $195
Over 50% 11.6% 30.7% 69.5% $232 $197
Total/Average 100.0% 26.6% 66.2% $202 $166
Source: SPI Research, February 2021
Table 126: Impact – Effectiveness of the resource management processes
Effect. of resource
mgmt. process Survey
% Client
ref.
Project duration
(man-mnth)
Std. del. method.
used
On-time proj.
delivery
1 – poor 0.8% 63.3% 18.7 63.3% 66.7%
2 10.4% 65.6% 31.8 63.2% 69.8%
3 25.9% 69.5% 26.2 62.6% 76.1%
4 48.7% 75.4% 26.1 67.6% 82.1%
5 – great 14.2% 78.5% 23.3 73.0% 85.6%
Total/Average 100.0% 73.2% 26.3 66.6% 79.7%
Source: SPI Research, February 2021
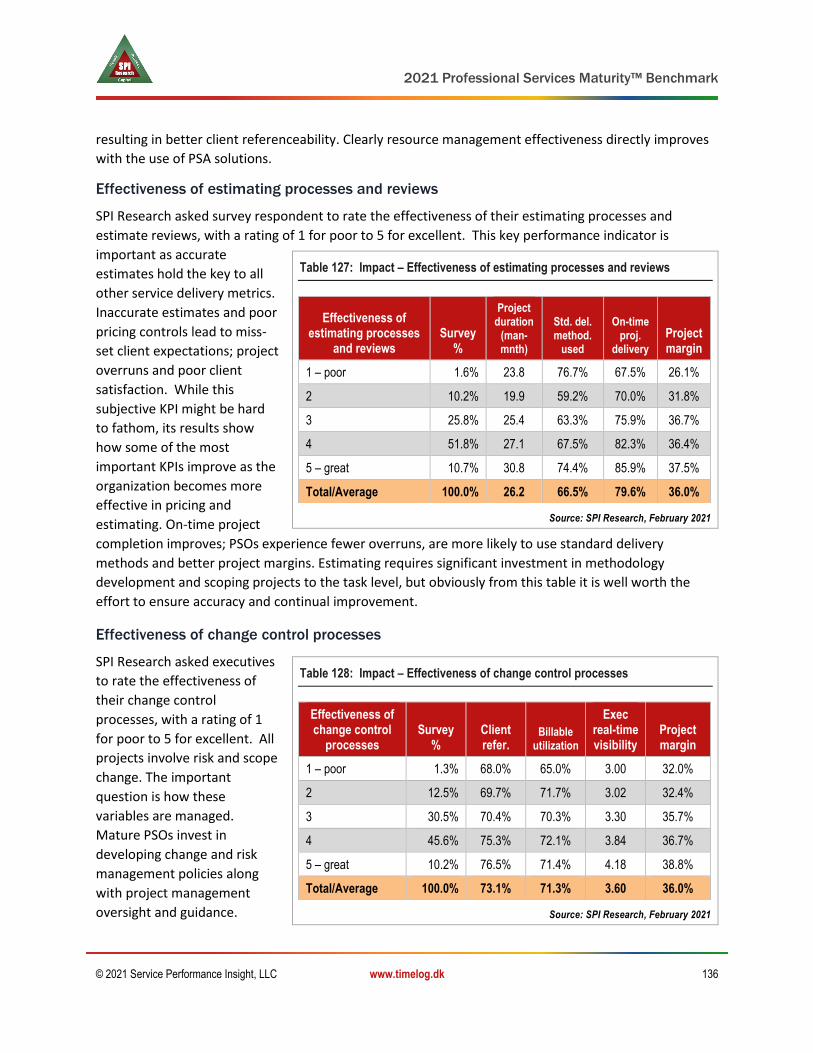
2021 Professional Services Maturity™ Benchmark
© 2021 Service Performance Insight, LLC www.timelog.dk 136
resulting in better client referenceability. Clearly resource management effectiveness directly improves
with the use of PSA solutions.
Effectiveness of estimating processes and reviews
SPI Research asked survey respondent to rate the effectiveness of their estimating processes and
estimate reviews, with a rating of 1 for poor to 5 for excellent. This key performance indicator is
important as accurate
estimates hold the key to all
other service delivery metrics.
Inaccurate estimates and poor
pricing controls lead to miss-
set client expectations; project
overruns and poor client
satisfaction. While this
subjective KPI might be hard
to fathom, its results show
how some of the most
important KPIs improve as the
organization becomes more
effective in pricing and
estimating. On-time project
completion improves; PSOs experience fewer overruns, are more likely to use standard delivery
methods and better project margins. Estimating requires significant investment in methodology
development and scoping projects to the task level, but obviously from this table it is well worth the
effort to ensure accuracy and continual improvement.
Effectiveness of change control processes
SPI Research asked executives
to rate the effectiveness of
their change control
processes, with a rating of 1
for poor to 5 for excellent. All
projects involve risk and scope
change. The important
question is how these
variables are managed.
Mature PSOs invest in
developing change and risk
management policies along
with project management
oversight and guidance.
Table 127: Impact – Effectiveness of estimating processes and reviews
Effectiveness of estimating processes
and reviews Survey
%
Project duration
(man-mnth)
Std. del. method.
used
On-time proj.
delivery
Project margin
1 – poor 1.6% 23.8 76.7% 67.5% 26.1%
2 10.2% 19.9 59.2% 70.0% 31.8%
3 25.8% 25.4 63.3% 75.9% 36.7%
4 51.8% 27.1 67.5% 82.3% 36.4%
5 – great 10.7% 30.8 74.4% 85.9% 37.5%
Total/Average 100.0% 26.2 66.5% 79.6% 36.0%
Source: SPI Research, February 2021
Table 128: Impact – Effectiveness of change control processes
Effectiveness of change control
processes Survey
% Client refer.
Billable utilization
Exec real-time visibility
Project margin
1 – poor 1.3% 68.0% 65.0% 3.00 32.0%
2 12.5% 69.7% 71.7% 3.02 32.4%
3 30.5% 70.4% 70.3% 3.30 35.7%
4 45.6% 75.3% 72.1% 3.84 36.7%
5 – great 10.2% 76.5% 71.4% 4.18 38.8%
Total/Average 100.0% 73.1% 71.3% 3.60 36.0%
Source: SPI Research, February 2021

2021 Professional Services Maturity™ Benchmark
© 2021 Service Performance Insight, LLC www.timelog.dk 137
Clients and service providers alike must consider the impact of changes and how they will affect
timelines and subsequent projects. A critical component of change control is to ensure project margins
do not suffer. Ideally, project changes are clearly outlined; client perception is appropriately managed
and change orders are put in place. Too many change orders not only impact the budget and schedule
but are signs of scope creep as well as inadequate executive sponsorship and poor communication.
Table 128 compares the effectiveness of change control processes to other key performance indicators.
Again, like the organizations with high levels of resource management and estimating effectiveness,
those organizations that manage change the best demonstrate significantly better KPIs in both the
service execution and finance and operations pillars. Organizations that focus on basic execution issues
such as resource management, estimating and change control drive superior results compared to those
organizations that place less emphasis on these critical business processes.
Effectiveness of project quality processes
SPI Research asked executives
to rate the effectiveness of
project quality processes, with
a rating of 1 for poor to 5 for
excellent. Quality must be a
core organizational attribute
that is built into the culture
and management practices.
Most leading professional
services organizations build in
quality checks and balances to
assure the work is done
correctly. As more PSOs work
to productize their services
offerings, they must
incorporate quality processes and procedures, as well as metrics. High quality service delivery underlies
client satisfaction and drives referrals and repeat business. Table 129 shows results improve across the
board as quality processes are implemented.
Effectiveness of knowledge management processes
Organizations are finally starting to do a better job of capturing, packaging and repurposing knowledge.
Top-performing organizations understand differentiation comes from their unique knowledge and their
ability to create, harvest and repurpose industry-leading intellectual property. Although a plethora of
powerful and inexpensive knowledge management tools exist, they lose their effectiveness without a
centrally managed and empowered knowledge management function. The key to knowledge
management is not only capturing it and codifying it but also continually pruning it and improving it. In
today’s world of social media overload, great search capability is a must to surface the best knowledge
when it is needed.
Table 129: Impact – Effectiveness of project quality processes
Effectiveness of project quality
processes Survey
% Client refer.
On-time proj.
delivery Ann. rev./
consult. (k)
Project margin
1 – poor 0.8% 50.0% 88.3% $258 30.3%
2 6.7% 67.5% 66.8% $182 32.5%
3 28.5% 69.3% 74.0% $189 33.6%
4 50.5% 74.4% 82.0% $207 37.1%
5 – great 13.5% 81.6% 88.1% $220 38.9%
Total/Average 100.0% 73.3% 79.6% $202 36.0%
Source: SPI Research, February 2021
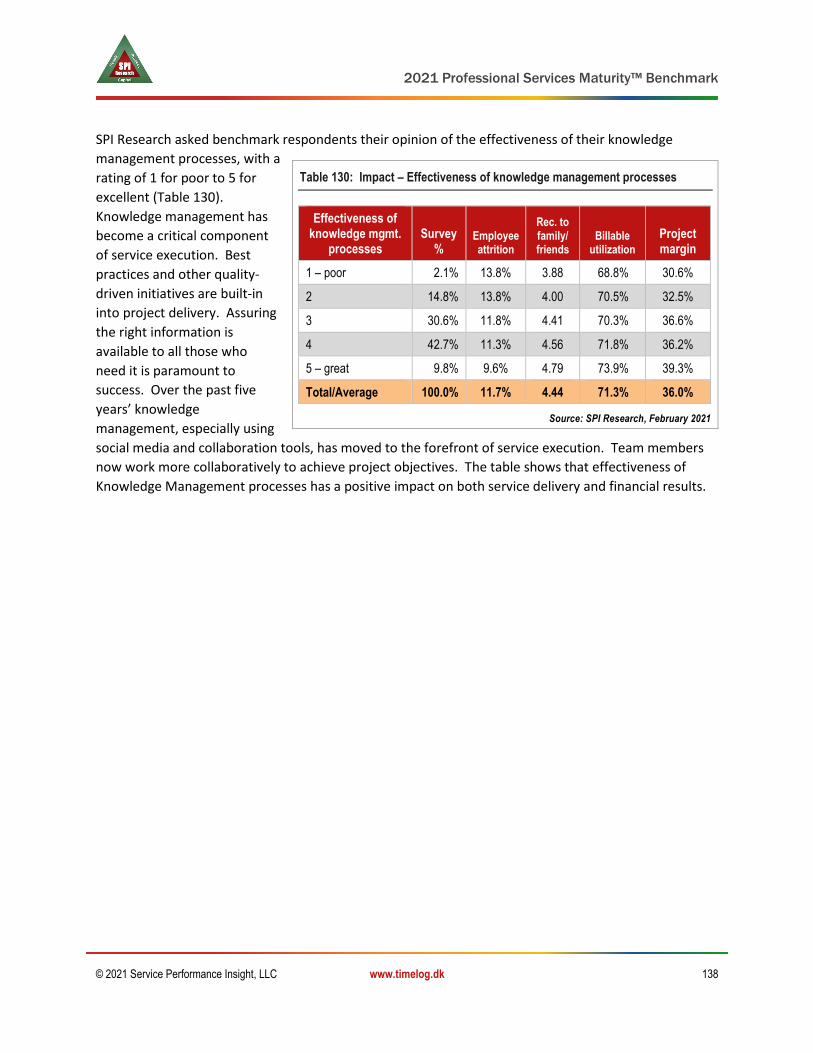
2021 Professional Services Maturity™ Benchmark
© 2021 Service Performance Insight, LLC www.timelog.dk 138
SPI Research asked benchmark respondents their opinion of the effectiveness of their knowledge
management processes, with a
rating of 1 for poor to 5 for
excellent (Table 130).
Knowledge management has
become a critical component
of service execution. Best
practices and other quality-
driven initiatives are built-in
into project delivery. Assuring
the right information is
available to all those who
need it is paramount to
success. Over the past five
years’ knowledge
management, especially using
social media and collaboration tools, has moved to the forefront of service execution. Team members
now work more collaboratively to achieve project objectives. The table shows that effectiveness of
Knowledge Management processes has a positive impact on both service delivery and financial results.
Table 130: Impact – Effectiveness of knowledge management processes
Effectiveness of knowledge mgmt.
processes Survey
% Employee attrition
Rec. to family/ friends
Billable utilization
Project margin
1 – poor 2.1% 13.8% 3.88 68.8% 30.6%
2 14.8% 13.8% 4.00 70.5% 32.5%
3 30.6% 11.8% 4.41 70.3% 36.6%
4 42.7% 11.3% 4.56 71.8% 36.2%
5 – great 9.8% 9.6% 4.79 73.9% 39.3%
Total/Average 100.0% 11.7% 4.44 71.3% 36.0%
Source: SPI Research, February 2021
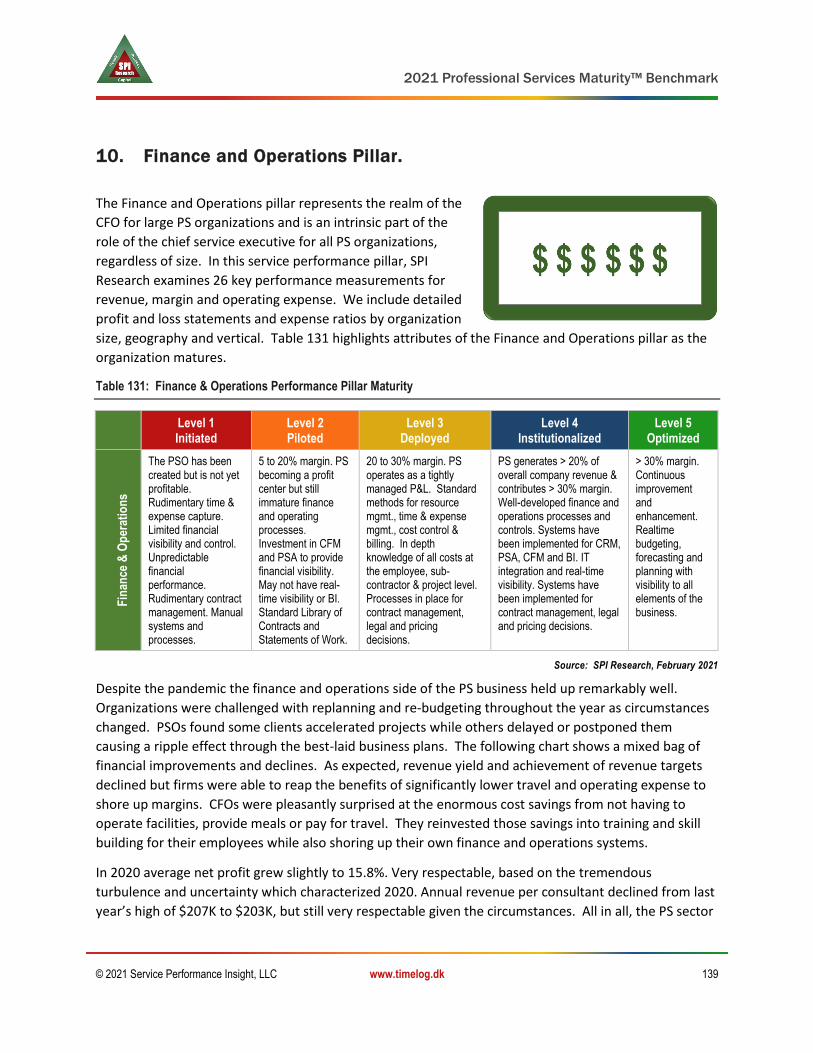
2021 Professional Services Maturity™ Benchmark
© 2021 Service Performance Insight, LLC www.timelog.dk 139
10. Finance and Operations Pillar.
The Finance and Operations pillar represents the realm of the
CFO for large PS organizations and is an intrinsic part of the
role of the chief service executive for all PS organizations,
regardless of size. In this service performance pillar, SPI
Research examines 26 key performance measurements for
revenue, margin and operating expense. We include detailed
profit and loss statements and expense ratios by organization
size, geography and vertical. Table 131 highlights attributes of the Finance and Operations pillar as the
organization matures.
Table 131: Finance & Operations Performance Pillar Maturity
Level 1 Initiated
Level 2 Piloted
Level 3 Deployed
Level 4 Institutionalized
Level 5 Optimized
Fin
ance
& O
per
atio
ns
The PSO has been created but is not yet profitable. Rudimentary time & expense capture. Limited financial visibility and control. Unpredictable financial performance. Rudimentary contract management. Manual systems and processes.
5 to 20% margin. PS becoming a profit center but still immature finance and operating processes. Investment in CFM and PSA to provide financial visibility. May not have real-time visibility or BI. Standard Library of Contracts and Statements of Work.
20 to 30% margin. PS operates as a tightly managed P&L. Standard methods for resource mgmt., time & expense mgmt., cost control & billing. In depth knowledge of all costs at the employee, sub-contractor & project level. Processes in place for contract management, legal and pricing decisions.
PS generates > 20% of overall company revenue & contributes > 30% margin. Well-developed finance and operations processes and controls. Systems have been implemented for CRM, PSA, CFM and BI. IT integration and real-time visibility. Systems have been implemented for contract management, legal and pricing decisions.
> 30% margin. Continuous improvement and enhancement. Realtime budgeting, forecasting and planning with visibility to all elements of the business.
Source: SPI Research, February 2021
Despite the pandemic the finance and operations side of the PS business held up remarkably well.
Organizations were challenged with replanning and re-budgeting throughout the year as circumstances
changed. PSOs found some clients accelerated projects while others delayed or postponed them
causing a ripple effect through the best-laid business plans. The following chart shows a mixed bag of
financial improvements and declines. As expected, revenue yield and achievement of revenue targets
declined but firms were able to reap the benefits of significantly lower travel and operating expense to
shore up margins. CFOs were pleasantly surprised at the enormous cost savings from not having to
operate facilities, provide meals or pay for travel. They reinvested those savings into training and skill
building for their employees while also shoring up their own finance and operations systems.
In 2020 average net profit grew slightly to 15.8%. Very respectable, based on the tremendous
turbulence and uncertainty which characterized 2020. Annual revenue per consultant declined from last
year’s high of $207K to $203K, but still very respectable given the circumstances. All in all, the PS sector

2021 Professional Services Maturity™ Benchmark
© 2021 Service Performance Insight, LLC www.timelog.dk 140
performed much better than expected. In many ways, 2020 allowed organizations to take a break from
meteoric double-digit growth to hunker down and fix the basics, positioning the PS industry well for
2021 and the future.
Underlying these numbers there is a tale of two cities of haves and have nots. Well-positioned high
growth firms focused on the cloud were called upon to help clients shift to virtual, cloud-based
operations overnight while firms who had already been stalled went into a free fall, perhaps never to
recover. In each of the key financial metrics we see a bifurcation between firms with good or improving
numbers versus those with poor and declining further numbers. As a case in point, 27.5% of firms
reported revenue per consultant under $150K, indicating they had poor direct labor margins. On the
other hand, 49.2% of the organizations reported revenue per consultant greater than $200K.
In response to the pandemic backlog declined to 43.0% from 44.7% in 2019. This means PS
organizations started 2021 with less committed work. Other declining KPIs were on the revenue or
growth side of the business with lower revenue yields per consultant and employee resulting in missed
revenue targets. But on the financial “hygiene” or expense control side of the business firms were able
to dramatically reduce non-billable employee discretionary spending to $1,390 – the lowest in this
benchmark’s history. Other operational metrics improved with lower revenue leakage, fewer inaccurate
invoices and lower DSO. These operational metrics indicate firms were able to use 2020 to clean up their
back offices and shore up broken business processes which will provide a big payback in the years to
come.
Table 132: Finance & Operations Pillar 5-year trend
Key Performance Indicator (KPI) 2016 2017 2018 2019 2020
Annual revenue per billable consultant (k) $205 $196 $206 $207 $203
Annual revenue per employee (k) $163 $159 $166 $170 $165
Quarterly revenue target in backlog 45.6% 46.2% 44.7% 44.7% 43.0%
Percent of annual revenue target achieved 92.1% 93.0% 93.8% 93.6% 92.1%
Percent of annual margin target achieved 90.1% 89.1% 90.3% 89.7% 90.3%
Revenue leakage 4.30% 4.39% 4.29% 4.54% 4.26%
% of invoices redone due to error/client rejections 2.2% 2.2% 2.3% 2.5% 1.8%
Days sales outstanding (DSO) 44.6 48.2 46.3 45.8 41.9
Quarterly non-billable expense per employee $1,579 $1,615 $1,606 $1,718 $1,390
Executive real-time wide visibility 3.51 3.66 3.56 3.52 3.60
Profit (EBITDA) 14.2% 16.8% 18.5% 15.2% 15.8%
Source: SPI Research, February 2021
Declining leading indicators like backlog portend slower revenue growth in 2021 but we may see a big
uptick in spending towards the second half of the year as the economy starts to recover from the
pandemic. Hiring was curtailed in 2020 with only 5.5% headcount growth. Lower headcount growth
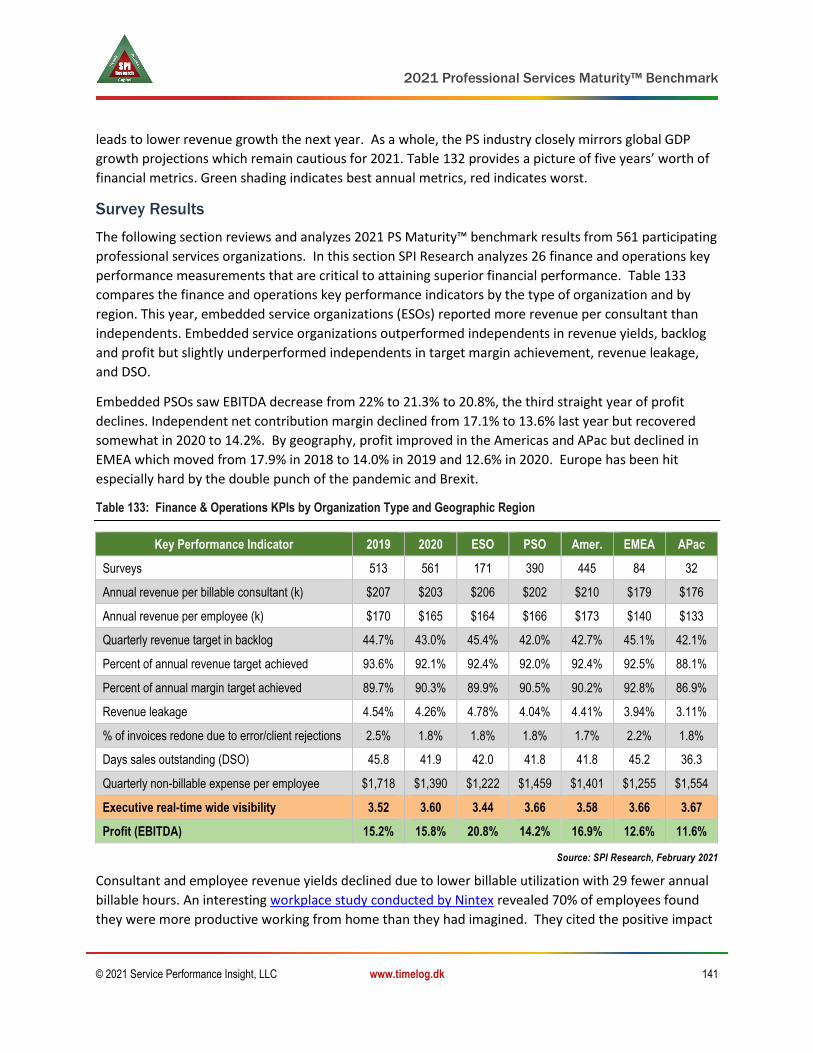
2021 Professional Services Maturity™ Benchmark
© 2021 Service Performance Insight, LLC www.timelog.dk 141
leads to lower revenue growth the next year. As a whole, the PS industry closely mirrors global GDP
growth projections which remain cautious for 2021. Table 132 provides a picture of five years’ worth of
financial metrics. Green shading indicates best annual metrics, red indicates worst.
Survey Results
The following section reviews and analyzes 2021 PS Maturity™ benchmark results from 561 participating
professional services organizations. In this section SPI Research analyzes 26 finance and operations key
performance measurements that are critical to attaining superior financial performance. Table 133
compares the finance and operations key performance indicators by the type of organization and by
region. This year, embedded service organizations (ESOs) reported more revenue per consultant than
independents. Embedded service organizations outperformed independents in revenue yields, backlog
and profit but slightly underperformed independents in target margin achievement, revenue leakage,
and DSO.
Embedded PSOs saw EBITDA decrease from 22% to 21.3% to 20.8%, the third straight year of profit
declines. Independent net contribution margin declined from 17.1% to 13.6% last year but recovered
somewhat in 2020 to 14.2%. By geography, profit improved in the Americas and APac but declined in
EMEA which moved from 17.9% in 2018 to 14.0% in 2019 and 12.6% in 2020. Europe has been hit
especially hard by the double punch of the pandemic and Brexit.
Table 133: Finance & Operations KPIs by Organization Type and Geographic Region
Key Performance Indicator 2019 2020 ESO PSO Amer. EMEA APac
Surveys 513 561 171 390 445 84 32
Annual revenue per billable consultant (k) $207 $203 $206 $202 $210 $179 $176
Annual revenue per employee (k) $170 $165 $164 $166 $173 $140 $133
Quarterly revenue target in backlog 44.7% 43.0% 45.4% 42.0% 42.7% 45.1% 42.1%
Percent of annual revenue target achieved 93.6% 92.1% 92.4% 92.0% 92.4% 92.5% 88.1%
Percent of annual margin target achieved 89.7% 90.3% 89.9% 90.5% 90.2% 92.8% 86.9%
Revenue leakage 4.54% 4.26% 4.78% 4.04% 4.41% 3.94% 3.11%
% of invoices redone due to error/client rejections 2.5% 1.8% 1.8% 1.8% 1.7% 2.2% 1.8%
Days sales outstanding (DSO) 45.8 41.9 42.0 41.8 41.8 45.2 36.3
Quarterly non-billable expense per employee $1,718 $1,390 $1,222 $1,459 $1,401 $1,255 $1,554
Executive real-time wide visibility 3.52 3.60 3.44 3.66 3.58 3.66 3.67
Profit (EBITDA) 15.2% 15.8% 20.8% 14.2% 16.9% 12.6% 11.6%
Source: SPI Research, February 2021
Consultant and employee revenue yields declined due to lower billable utilization with 29 fewer annual
billable hours. An interesting workplace study conducted by Nintex revealed 70% of employees found
they were more productive working from home than they had imagined. They cited the positive impact

2021 Professional Services Maturity™ Benchmark
© 2021 Service Performance Insight, LLC www.timelog.dk 142
of no commuting, fewer interruptions, more time spent with family and better life-work balance. 67% of
respondents reported they were able to get their work done in fewer hours by working from home. The
study went on to underscore the tale of two cities we see in other areas, higher level employees with
fewer care giving responsibilities were far more productive than their lower-level counterparts with
young children at home.
Backlog is always a very important KPI. Backlog declined from 44.7% to 43.0% The Americas reported
declining backlog from 45.5% to 42.7%. Backlog increased in APac from 38.7% to 42.1%. EMEA
reported an increase in backlog from 42.5% to 42.7%.
Non-billable discretionary employee expense plummeted to $1,390, far below the five-year average of
$1,579. Coming out of the pandemic it will be interesting to see if companies return to lavish offices and
plentiful employee meals and travel or if they choose to maintain a flexible work-from-home model with
an emphasis on employee investments in training, skill building and work-from-home technologies.
Discretionary spending directly impacts bottom-line net profit. 2020 has proven that the knowledge
workers who comprise the Professional Services industry benefited from a virtual work environment.
Table 134 compares finance and operations KPI’s by organization size. Best performance is highlighted in
green and worst performance is highlighted in red.
Table 134: Finance & Operations KPIs by Organization Size
Key Performance Indicator Under
10 10 - 30 31 - 100 101 - 300
301 - 700
Over 700
Surveys 62 108 170 111 48 62
Annual revenue per billable consultant (k) $178 $212 $212 $206 $189 $190
Annual revenue per employee (k) $158 $169 $171 $168 $148 $158
Quarterly revenue target in backlog 30.1% 40.1% 45.6% 47.2% 48.1% 41.6%
Percent of annual revenue target achieved 86.5% 93.2% 91.5% 93.8% 90.2% 96.6%
Percent of annual margin target achieved 86.5% 90.2% 90.1% 91.4% 90.0% 94.0%
Revenue leakage 3.12% 3.97% 4.26% 4.99% 3.92% 4.90%
% of invoices redone due to error/client rejections 1.0% 1.4% 1.8% 2.1% 2.4% 2.6%
Days sales outstanding (DSO) 25.8 38.6 44.6 44.9 50.8 44.2
Quarterly non-billable expense per employee $1,256 $1,176 $1,440 $1,311 $1,884 $1,685
Executive real-time wide visibility 3.64 3.69 3.65 3.52 3.23 3.70
Profit (EBITDA) 19.3% 17.6% 11.5% 16.8% 23.7% 16.3%
Source: SPI Research, February 2021
Tables 135 and 136 show financial results by vertical market. SaaS ESOs have experienced wild
fluctuations in net profit as their charters swing from PS as a customer adoption engine to PS as a profit
center. No doubt cloud service providers, both embedded and independent, are very profitable because

2021 Professional Services Maturity™ Benchmark
© 2021 Service Performance Insight, LLC www.timelog.dk 143
they are able to charge some of the highest bill rates and deliver the majority of their services virtually.
SaaS ESOs saw best-ever profit in 2017 and 2018 at 26.2% decline to 23.7% in 2019 and now 18.3% in
2020. The big profit buster for embedded service organizations is the amount of non-billable time they
spend on endless meetings (administration) and non-billable sales support and business development
activities. This is an important KPI to watch, as many organizations are turning to the cloud for their
information infrastructure.
Table 135: Finance & Operations KPIs by Vertical Market
Key Performance Indicator IT Consult Mgmt.
Consult SaaS PS Software
PS Arch./ Engr.
Surveys 143 84 64 55 35
Annual revenue per billable consultant (k) $211 $208 $216 $190 $188
Annual revenue per employee (k) $172 $172 $166 $152 $162
Quarterly revenue target in backlog 44.9% 39.3% 44.5% 47.2% 45.4%
Percent of annual revenue target achieved 92.2% 91.8% 92.4% 91.0% 92.1%
Percent of annual margin target achieved 89.0% 91.8% 88.8% 90.6% 90.2%
Revenue leakage 4.03% 3.10% 5.28% 4.63% 5.69%
% of invoices redone due to error/client rejections 2.0% 1.4% 1.4% 1.9% 2.5%
Days sales outstanding (DSO) 42.5 38.6 39.3 45.6 46.8
Quarterly non-billable expense per employee $1,410 $1,625 $1,117 $1,283 $1,240
Executive real-time wide visibility 3.77 3.80 3.38 3.44 3.74
Profit (EBITDA) 13.4% 10.6% 18.3% 23.4% 15.8%
Source: SPI Research, February 2021
As shown in Table 136, Managed Service providers had an especially tough year in 2020, barely eking
out a profit. Seen as a bastion of recurring revenue, the managed service market has become crowded,
leading to intense competition and compression in rates and profits. Market dynamics are at play with
yesterday’s darlings becoming today’s train wrecks which shows how important it is to focus on growth
markets and building differentiation.
Table 136: Finance & Operations KPIs by Vertical Market
Key Performance Indicator MarCom VAR Account Mgd. Serv. All Others
Surveys 31 17 14 13 105
Annual revenue per billable consultant (k) $175 $241 $210 $175 $187
Annual revenue per employee (k) $153 $208 $173 $133 $152
Quarterly revenue target in backlog 40.0% 42.8% 35.5% 35.0% 40.9%
Percent of annual revenue target achieved 85.0% 96.1% 86.4% 91.7% 94.3%

2021 Professional Services Maturity™ Benchmark
© 2021 Service Performance Insight, LLC www.timelog.dk 144
Key Performance Indicator MarCom VAR Account Mgd. Serv. All Others
Percent of annual margin target achieved 84.4% 92.2% 82.7% 86.7% 94.4%
Revenue leakage 3.56% 3.28% 6.32% 4.00% 4.14%
% of invoices redone due to error/client rejections 1.5% 2.2% 2.7% 1.3% 1.7%
Days sales outstanding (DSO) 35.6 37.0 35.5 31.7 45.3
Quarterly non-billable expense per employee $1,175 $1,361 $2,136 $750 $1,383
Executive real-time wide visibility 3.56 4.00 3.09 3.33 3.33
Profit (EBITDA) 20.9% 22.6% 23.5% 1.5% 18.5%
Source: SPI Research, February 2021
Steps Taken to Improve Profitability
Each year SPI Research asks, “What
steps will your organization take to
improve profitability?” This year
“improving the solution portfolio”
and “marketing effectiveness” rose
to the top of the list. PSOs are
becoming keenly aware of the need
to create repeatable service offers
with an emphasis on recurring
subscription (consumption-based)
pricing. Improving marketing
effectiveness is a perennial
challenge area as few firms are
happy with their websites, the
amount and quality of leads and
with the quality of their thought
leadership content. Marketing is
also charged with building the brand and establishing the firm’s culture and reputation as a “Great Place
to Work”. The Best-of-the-Best are investing in “Chief Revenue Officers” as a key member of the
executive team. They conduct market research and stay abreast of shifting technology trends, investing
not in where the ball currently is but on where they think it is going to be. This attention to portfolio
expansion into hot new growth areas manifests in “first mover advantages” and allows them to develop
skills and references in anticipation of where the market is going. A critical component of market
expansion is not only anticipating where the market is going but having the courage to hire and develop
solutions in advance of demand. Improving methods and tools is another improvement priority as PSOs
must ensure they provide their consultants the latest technologies and methodologies.
Table 137: Steps Taken to Improve Profitability Comparison: 2019-2020
Steps Taken to Improve Profitability 2019 2020 Change
Improve solution portfolio 4.02 4.07 1.2%
Improve marketing effectiveness 4.03 4.07 0.9%
Improve sales effectiveness 3.95 3.94 -0.4%
Improve methods and tools 3.87 3.89 0.5%
Improve hiring and ramping 3.80 3.69 -2.8%
Improve utilization 3.76 3.59 -4.5%
Expand business models 3.44 3.49 1.3%
Reduce non-billable time 3.41 3.28 -3.8%
Increase rates 3.27 3.06 -6.4%
Source: SPI Research, February 2021

2021 Professional Services Maturity™ Benchmark
© 2021 Service Performance Insight, LLC www.timelog.dk 145
Annual revenue per billable consultant (k)
Annual revenue per billable consultant depicts the service organization’s total revenue divided by the
FTE (Full-time equivalent) billable consultants. Alternatively, this metric is derived by multiplying the
consultant’s average bill rate times billable hours. Revenue per consultant provides an indication of
consultant productivity; the
likelihood the firm will be profitable
is foretold by the labor multiplier.
SPI Research considers revenue per
billable consultant to be one of the
most important KPIs, but it must be
viewed in conjunction with labor
cost. Revenue per billable
consultant should minimally equal
1.5 times the fully loaded cost of
the consultant. Headcount and
capacity planning should be based
on expectations of a 2X revenue
yield to consultant cost. Revenue
multipliers of three and higher are
typical for engineering and
architecture firms while a labor
multiplier greater than three is
standard in management
consulting and legal professional services. Billable consultant revenue yield is a strong predictor of PS
profit. Average consultant
annual revenue production
declined from its zenith last
year of $207K to $203K in
2020.
Chicken or egg? Table 138
depicts the impact of
increasing revenue per
consultant. Deal pipelines are
far more robust in
organizations with the highest
revenue yields. Clearly more
revenue per consultant
improves project and net
margins as well as billable
utilization, client
Figure 39: Revenue per Billable Consultant Five-year Trend
Source: SPI Research, February 2021
Table 138: Impact – Revenue per Billable Consultant
Revenue per billable consultant
Survey %
Project duration
(man-mnth)
Std. del. method.
used Billable
util.
On-time proj.
delivery
Under $100k 11.4% 34.3 59.3% 64.8% 74.2%
$100k - $150k 16.1% 29.9 62.3% 67.9% 76.5%
$150k - $200k 23.3% 25.1 65.1% 70.1% 78.9%
$200k - $250k 24.1% 23.0 68.9% 73.2% 80.3%
$250k - $300k 15.8% 20.1 71.1% 75.7% 82.8%
Over $300k 9.3% 29.5 71.8% 72.8% 85.6%
Total/Average 100.0% 26.1 66.4% 71.0% 79.5%
Source: SPI Research, February 2021
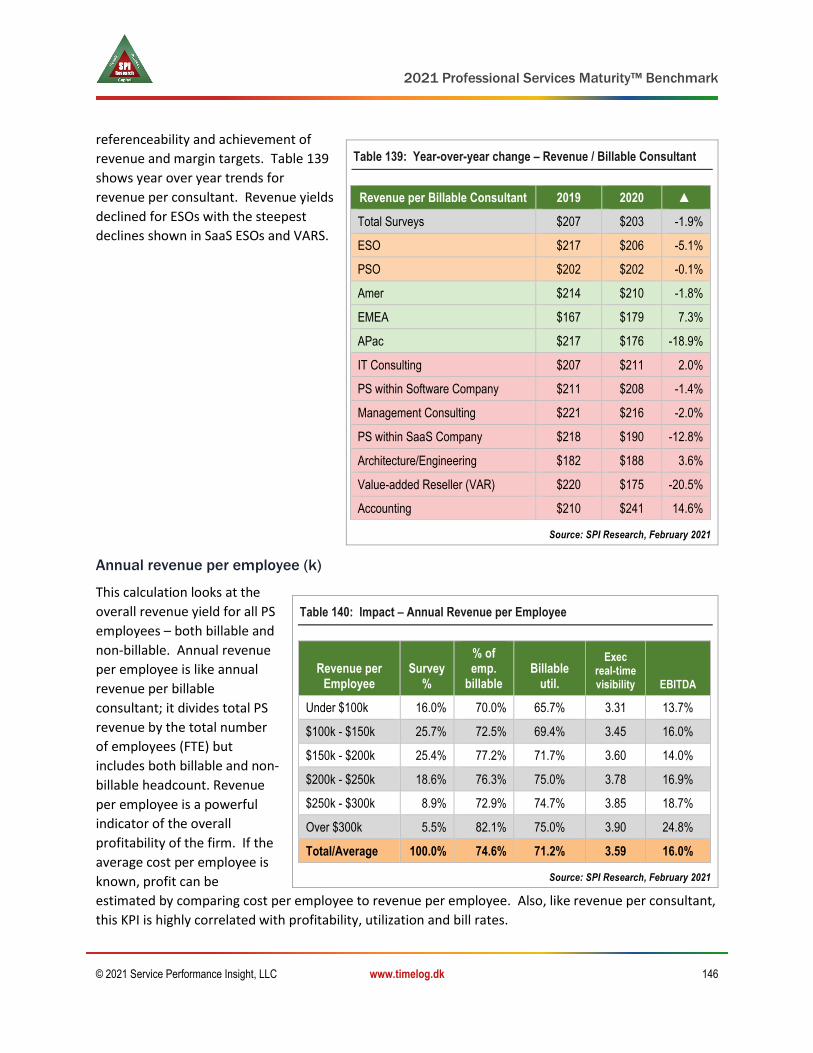
2021 Professional Services Maturity™ Benchmark
© 2021 Service Performance Insight, LLC www.timelog.dk 146
referenceability and achievement of
revenue and margin targets. Table 139
shows year over year trends for
revenue per consultant. Revenue yields
declined for ESOs with the steepest
declines shown in SaaS ESOs and VARS.
Annual revenue per employee (k)
This calculation looks at the
overall revenue yield for all PS
employees – both billable and
non-billable. Annual revenue
per employee is like annual
revenue per billable
consultant; it divides total PS
revenue by the total number
of employees (FTE) but
includes both billable and non-
billable headcount. Revenue
per employee is a powerful
indicator of the overall
profitability of the firm. If the
average cost per employee is
known, profit can be
estimated by comparing cost per employee to revenue per employee. Also, like revenue per consultant,
this KPI is highly correlated with profitability, utilization and bill rates.
Table 139: Year-over-year change – Revenue / Billable Consultant
Revenue per Billable Consultant 2019 2020 ▲
Total Surveys $207 $203 -1.9%
ESO $217 $206 -5.1%
PSO $202 $202 -0.1%
Amer $214 $210 -1.8%
EMEA $167 $179 7.3%
APac $217 $176 -18.9%
IT Consulting $207 $211 2.0%
PS within Software Company $211 $208 -1.4%
Management Consulting $221 $216 -2.0%
PS within SaaS Company $218 $190 -12.8%
Architecture/Engineering $182 $188 3.6%
Value-added Reseller (VAR) $220 $175 -20.5%
Accounting $210 $241 14.6%
Source: SPI Research, February 2021
Table 140: Impact – Annual Revenue per Employee
Revenue per Employee
Survey %
% of emp.
billable Billable
util.
Exec real-time visibility EBITDA
Under $100k 16.0% 70.0% 65.7% 3.31 13.7%
$100k - $150k 25.7% 72.5% 69.4% 3.45 16.0%
$150k - $200k 25.4% 77.2% 71.7% 3.60 14.0%
$200k - $250k 18.6% 76.3% 75.0% 3.78 16.9%
$250k - $300k 8.9% 72.9% 74.7% 3.85 18.7%
Over $300k 5.5% 82.1% 75.0% 3.90 24.8%
Total/Average 100.0% 74.6% 71.2% 3.59 16.0%
Source: SPI Research, February 2021
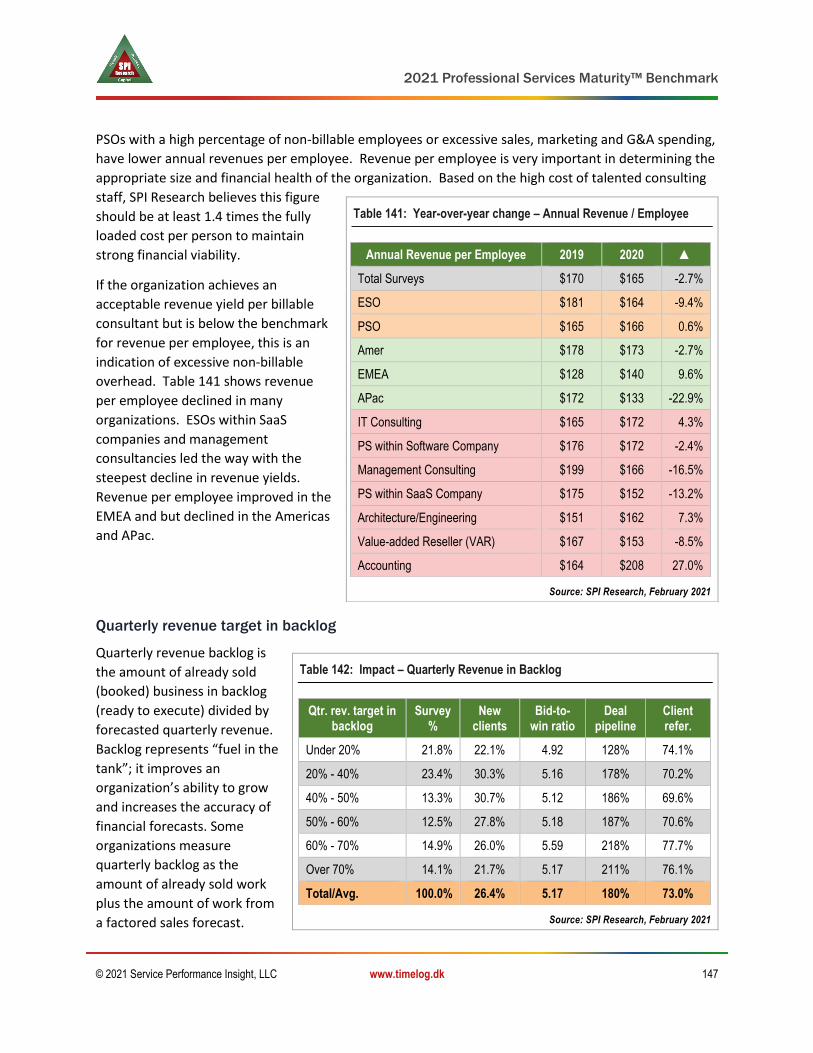
2021 Professional Services Maturity™ Benchmark
© 2021 Service Performance Insight, LLC www.timelog.dk 147
PSOs with a high percentage of non-billable employees or excessive sales, marketing and G&A spending,
have lower annual revenues per employee. Revenue per employee is very important in determining the
appropriate size and financial health of the organization. Based on the high cost of talented consulting
staff, SPI Research believes this figure
should be at least 1.4 times the fully
loaded cost per person to maintain
strong financial viability.
If the organization achieves an
acceptable revenue yield per billable
consultant but is below the benchmark
for revenue per employee, this is an
indication of excessive non-billable
overhead. Table 141 shows revenue
per employee declined in many
organizations. ESOs within SaaS
companies and management
consultancies led the way with the
steepest decline in revenue yields.
Revenue per employee improved in the
EMEA and but declined in the Americas
and APac.
Quarterly revenue target in backlog
Quarterly revenue backlog is
the amount of already sold
(booked) business in backlog
(ready to execute) divided by
forecasted quarterly revenue.
Backlog represents “fuel in the
tank”; it improves an
organization’s ability to grow
and increases the accuracy of
financial forecasts. Some
organizations measure
quarterly backlog as the
amount of already sold work
plus the amount of work from
a factored sales forecast.
Table 141: Year-over-year change – Annual Revenue / Employee
Annual Revenue per Employee 2019 2020 ▲
Total Surveys $170 $165 -2.7%
ESO $181 $164 -9.4%
PSO $165 $166 0.6%
Amer $178 $173 -2.7%
EMEA $128 $140 9.6%
APac $172 $133 -22.9%
IT Consulting $165 $172 4.3%
PS within Software Company $176 $172 -2.4%
Management Consulting $199 $166 -16.5%
PS within SaaS Company $175 $152 -13.2%
Architecture/Engineering $151 $162 7.3%
Value-added Reseller (VAR) $167 $153 -8.5%
Accounting $164 $208 27.0%
Source: SPI Research, February 2021
Table 142: Impact – Quarterly Revenue in Backlog
Qtr. rev. target in backlog
Survey %
New clients
Bid-to-win ratio
Deal pipeline
Client refer.
Under 20% 21.8% 22.1% 4.92 128% 74.1%
20% - 40% 23.4% 30.3% 5.16 178% 70.2%
40% - 50% 13.3% 30.7% 5.12 186% 69.6%
50% - 60% 12.5% 27.8% 5.18 187% 70.6%
60% - 70% 14.9% 26.0% 5.59 218% 77.7%
Over 70% 14.1% 21.7% 5.17 211% 76.1%
Total/Avg. 100.0% 26.4% 5.17 180% 73.0%
Source: SPI Research, February 2021
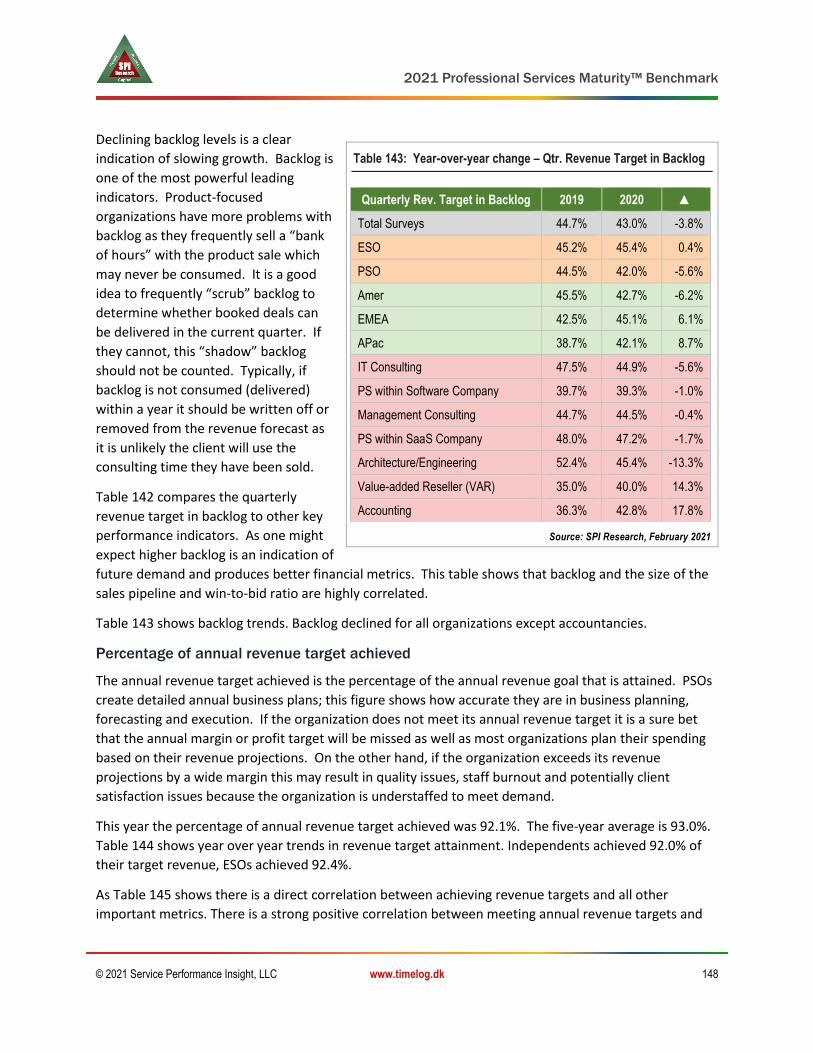
2021 Professional Services Maturity™ Benchmark
© 2021 Service Performance Insight, LLC www.timelog.dk 148
Declining backlog levels is a clear
indication of slowing growth. Backlog is
one of the most powerful leading
indicators. Product-focused
organizations have more problems with
backlog as they frequently sell a “bank
of hours” with the product sale which
may never be consumed. It is a good
idea to frequently “scrub” backlog to
determine whether booked deals can
be delivered in the current quarter. If
they cannot, this “shadow” backlog
should not be counted. Typically, if
backlog is not consumed (delivered)
within a year it should be written off or
removed from the revenue forecast as
it is unlikely the client will use the
consulting time they have been sold.
Table 142 compares the quarterly
revenue target in backlog to other key
performance indicators. As one might
expect higher backlog is an indication of
future demand and produces better financial metrics. This table shows that backlog and the size of the
sales pipeline and win-to-bid ratio are highly correlated.
Table 143 shows backlog trends. Backlog declined for all organizations except accountancies.
Percentage of annual revenue target achieved
The annual revenue target achieved is the percentage of the annual revenue goal that is attained. PSOs
create detailed annual business plans; this figure shows how accurate they are in business planning,
forecasting and execution. If the organization does not meet its annual revenue target it is a sure bet
that the annual margin or profit target will be missed as well as most organizations plan their spending
based on their revenue projections. On the other hand, if the organization exceeds its revenue
projections by a wide margin this may result in quality issues, staff burnout and potentially client
satisfaction issues because the organization is understaffed to meet demand.
This year the percentage of annual revenue target achieved was 92.1%. The five-year average is 93.0%.
Table 144 shows year over year trends in revenue target attainment. Independents achieved 92.0% of
their target revenue, ESOs achieved 92.4%.
As Table 145 shows there is a direct correlation between achieving revenue targets and all other
important metrics. There is a strong positive correlation between meeting annual revenue targets and
Table 143: Year-over-year change – Qtr. Revenue Target in Backlog
Quarterly Rev. Target in Backlog 2019 2020 ▲
Total Surveys 44.7% 43.0% -3.8%
ESO 45.2% 45.4% 0.4%
PSO 44.5% 42.0% -5.6%
Amer 45.5% 42.7% -6.2%
EMEA 42.5% 45.1% 6.1%
APac 38.7% 42.1% 8.7%
IT Consulting 47.5% 44.9% -5.6%
PS within Software Company 39.7% 39.3% -1.0%
Management Consulting 44.7% 44.5% -0.4%
PS within SaaS Company 48.0% 47.2% -1.7%
Architecture/Engineering 52.4% 45.4% -13.3%
Value-added Reseller (VAR) 35.0% 40.0% 14.3%
Accounting 36.3% 42.8% 17.8%
Source: SPI Research, February 2021

2021 Professional Services Maturity™ Benchmark
© 2021 Service Performance Insight, LLC www.timelog.dk 149
profitability, assuming revenue and
profit targets are set appropriately. SPI
Research also found organizations who
achieved their revenue targets had
lower attrition rates, reflecting financial
stability and the organization’s ability
to reward performance and reinvest in
the business.
Table 145: Impact – Percentage of annual revenue target achieved
Percentage of annual target
revenue achieved Survey % Revenue growth
Headcount growth
% of emp. billable
Bid-to-win ratio
Deal pipeline
Client reference EBITDA
Under 80% 14.1% 2.3% -1.5% 71.7% 4.01 123% 68.7% 7.4%
80% - 90% 26.3% 3.8% 2.9% 72.9% 5.05 178% 72.8% 15.0%
90% - 100% 35.5% 7.0% 6.1% 75.4% 5.29 191% 71.9% 16.4%
100% - 110% 18.6% 12.5% 9.5% 76.4% 5.70 193% 76.5% 19.3%
Over 110% 5.6% 21.0% 15.0% 82.1% 6.60 203% 82.3% 24.9%
Total/Average 100.0% 7.3% 5.3% 74.8% 5.20 179% 73.1% 15.8%
Source: SPI Research, February 2021
Percent of annual margin target achieved
The annual margin target achieved, similar to the annual revenue target achieved, is the percentage of
the annual profit goal which was attained. SPI Research measures revenue and margin target
attainment to calibrate the accuracy of annual business plans. Even if PSOs don’t accurately measure
Table 144: Year-over-year change – % of annual revenue target achieved
Percentage of annual revenue target achieved 2019 2020 ▲
Total Surveys 93.6% 92.1% -1.6%
ESO 93.1% 92.4% -0.7%
PSO 93.8% 92.0% -1.9%
Amer 93.6% 92.4% -1.3%
EMEA 94.0% 92.5% -1.5%
APac 92.2% 88.1% -4.5%
IT Consulting 93.1% 92.2% -1.0%
PS within Software Company 95.3% 91.8% -3.7%
Management Consulting 95.6% 92.4% -3.3%
PS within SaaS Company 92.4% 91.0% -1.5%
Architecture/Engineering 95.8% 92.1% -3.8%
Value-added Reseller (VAR) 88.8% 85.0% -4.3%
Accounting 87.1% 96.1% 10.3%
Source: SPI Research, February 2021

2021 Professional Services Maturity™ Benchmark
© 2021 Service Performance Insight, LLC www.timelog.dk 150
other benchmark metrics, they usually know if they achieved their targets or not. Target attainment is
important from a planning and investment perspective. If the organization does not meet its margin
goals it might have to scale back future spending, potentially limiting growth.
Table 146: Impact – Percentage of annual margin target achieved
Percentage of annual target revenue
achieved Survey
% Revenue growth
Headcount growth
% of emp. billable
On-time proj.
delivery Project margin
Project overrun EBITDA
Under 80% 21.3% 4.3% 0.5% 70.3% 73.7% 30.6% 12.1% 9.2%
80% - 90% 23.9% 4.2% 2.5% 73.4% 79.2% 34.7% 6.3% 15.1%
90% - 100% 33.2% 8.4% 7.6% 76.4% 81.2% 38.4% 8.2% 15.7%
100% - 110% 15.7% 10.2% 8.5% 77.2% 81.7% 38.4% 6.6% 28.1%
Over 110% 5.9% 15.8% 12.6% 81.4% 87.7% 40.7% 8.0% 17.0%
Total/Average 100.0% 7.2% 5.3% 74.8% 79.6% 36.0% 8.3% 16.2%
Source: SPI Research, February 2021
Perhaps one of the most important
gauges of financial maturity is the
ability to consistently achieve annual
revenue and margin targets. The
number of firms who achieve their
margin target is always less than the
percentage of firms who achieve their
revenue targets. Only 21.5% of survey
respondents achieved 100% or more of
their annual margin target!
Table 146 shows a direct correlation
between margin target attainment and
backlog, revenue and headcount
growth, billable utilization and on-time
project delivery. The percentage of
annual margin target achieved was
slightly higher (90.3% vs 89.7%) in
2020. Organizations from EMEA had
the highest (92.8%) percent of annual
margin target achievement.
Independents reported better target
margin attainment than ESOs (90.5%
versus 89.9%).
Table 147: Year-over-year change – Percentage of annual target margin achieved
Percentage of Annual Target Margin Achieved 2019 2020 ▲
Total Surveys 89.7% 90.3% 0.7%
ESO 89.8% 89.9% 0.1%
PSO 89.7% 90.5% 0.9%
Amer 90.0% 90.2% 0.2%
EMEA 88.7% 92.8% 4.7%
APac 88.9% 86.9% -2.2%
IT Consulting 88.8% 89.0% 0.2%
PS within Software Company 92.4% 91.8% -0.6%
Management Consulting 91.3% 88.8% -2.7%
PS within SaaS Company 90.5% 90.6% 0.1%
Architecture/Engineering 89.9% 90.2% 0.3%
Value-added Reseller (VAR) 88.6% 84.4% -4.8%
Accounting 85.6% 92.2% 7.7%
Source: SPI Research, February 2021

2021 Professional Services Maturity™ Benchmark
© 2021 Service Performance Insight, LLC www.timelog.dk 151
Revenue Leakage
Revenue leakage refers to revenue that has been earned but is lost before it can be realized. Causes of
revenue leakage include billing errors, time the firm is unable to bill for product or project delivery
issues and incorrect statements of work or misquotes. Revenue leakage is difficult to determine in
many cases, making it a “silent
killer” of profitability. In many
instances, organizations don’t
even realize revenue has not
been billed, making it a very
difficult figure to calculate. It
is also a barometer for overall
operational efficiency, as PSOs
with higher levels of revenue
leakage reported lower
utilization, poorer on-time
project delivery, more project
overruns and lower EBITDA
than organizations that better manage
contracts, capturing all hours and
expenses and billing accurately.
Average reported revenue leakage this
year was the lowest it has been in 5
years at 4.26%. ESOs reported
significantly more revenue leakage than
independents (4.78% versus 4.04%). By
geography, the Americas reported the
most revenue leakage as did
Accountancies.
Table 148: Impact – Revenue Leakage
Revenue Leakage Survey
% Client
reference Billable
util.
On-time proj.
delivery
Exec realtime visibility
Under 2% 37.6% 75.7% 72.3% 83.7% 3.70
2% - 5% 34.9% 72.7% 71.0% 79.4% 3.60
5% - 10% 19.4% 70.6% 70.8% 76.5% 3.44
Over 10% 8.1% 70.7% 67.4% 69.8% 3.43
Total/Average 100.0% 73.3% 71.1% 79.7% 3.59
Source: SPI Research, February 2021
Table 149: Year-over-year change – Revenue Leakage
Revenue Leakage 2019 2020 ▲
Total Surveys 4.5% 4.3% -5.3%
ESO 4.8% 4.8% -0.3%
PSO 4.4% 4.0% -8.2%
Amer 4.7% 4.4% -6.3%
EMEA 4.1% 3.9% -3.8%
APac 3.6% 3.1% -13.6%
IT Consulting 4.7% 4.0% -14.2%
PS within Software Company 3.4% 3.1% -8.8%
Management Consulting 5.2% 5.3% 1.5%
PS within SaaS Company 4.5% 4.6% 2.8%
Architecture/Engineering 5.4% 5.7% 5.3%
Value-added Reseller (VAR) 4.7% 3.6% -24.3%
Accounting 5.4% 3.3% -39.3%
Source: SPI Research, February 2021
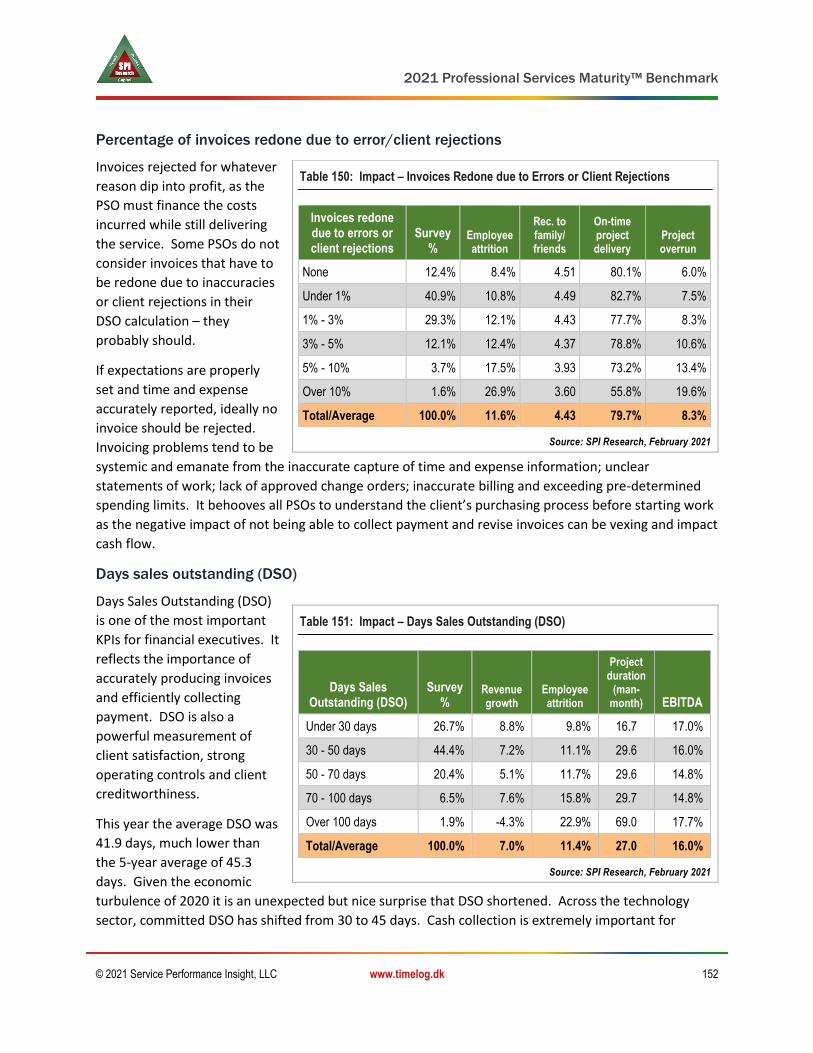
2021 Professional Services Maturity™ Benchmark
© 2021 Service Performance Insight, LLC www.timelog.dk 152
Percentage of invoices redone due to error/client rejections
Invoices rejected for whatever
reason dip into profit, as the
PSO must finance the costs
incurred while still delivering
the service. Some PSOs do not
consider invoices that have to
be redone due to inaccuracies
or client rejections in their
DSO calculation – they
probably should.
If expectations are properly
set and time and expense
accurately reported, ideally no
invoice should be rejected.
Invoicing problems tend to be
systemic and emanate from the inaccurate capture of time and expense information; unclear
statements of work; lack of approved change orders; inaccurate billing and exceeding pre-determined
spending limits. It behooves all PSOs to understand the client’s purchasing process before starting work
as the negative impact of not being able to collect payment and revise invoices can be vexing and impact
cash flow.
Days sales outstanding (DSO)
Days Sales Outstanding (DSO)
is one of the most important
KPIs for financial executives. It
reflects the importance of
accurately producing invoices
and efficiently collecting
payment. DSO is also a
powerful measurement of
client satisfaction, strong
operating controls and client
creditworthiness.
This year the average DSO was
41.9 days, much lower than
the 5-year average of 45.3
days. Given the economic
turbulence of 2020 it is an unexpected but nice surprise that DSO shortened. Across the technology
sector, committed DSO has shifted from 30 to 45 days. Cash collection is extremely important for
Table 150: Impact – Invoices Redone due to Errors or Client Rejections
Invoices redone due to errors or client rejections
Survey %
Employee attrition
Rec. to family/ friends
On-time project delivery
Project overrun
None 12.4% 8.4% 4.51 80.1% 6.0%
Under 1% 40.9% 10.8% 4.49 82.7% 7.5%
1% - 3% 29.3% 12.1% 4.43 77.7% 8.3%
3% - 5% 12.1% 12.4% 4.37 78.8% 10.6%
5% - 10% 3.7% 17.5% 3.93 73.2% 13.4%
Over 10% 1.6% 26.9% 3.60 55.8% 19.6%
Total/Average 100.0% 11.6% 4.43 79.7% 8.3%
Source: SPI Research, February 2021
Table 151: Impact – Days Sales Outstanding (DSO)
Days Sales Outstanding (DSO)
Survey %
Revenue growth
Employee attrition
Project duration
(man-month) EBITDA
Under 30 days 26.7% 8.8% 9.8% 16.7 17.0%
30 - 50 days 44.4% 7.2% 11.1% 29.6 16.0%
50 - 70 days 20.4% 5.1% 11.7% 29.6 14.8%
70 - 100 days 6.5% 7.6% 15.8% 29.7 14.8%
Over 100 days 1.9% -4.3% 22.9% 69.0 17.7%
Total/Average 100.0% 7.0% 11.4% 27.0 16.0%
Source: SPI Research, February 2021

2021 Professional Services Maturity™ Benchmark
© 2021 Service Performance Insight, LLC www.timelog.dk 153
independents as they must fund operations from cashflow. Table 151 shows longer payment times
correlate with negative revenue growth and high attrition but don’t necessarily torpedo net profit.
Quarterly non-billable expense per employee
Quarterly non-billable expense
per employee shows how well
PSOs manage employee
expenses not related to
billable work. Ideally, this
metric is minimized, but there
are always expenses due to
travel, training, IT and
business development that
cannot be billed to clients.
The quarterly non-billable
expense per employee
declined to the lowest level
ever reported at $1,390,
almost $200 less than the 5-year average of $1,579. Excessive non-billable employee expense is usually
a symptom of poor or ineffective business expense policies. It may also be a symptom of runaway
business development costs with non-essential personnel wasting valuable time and money chasing
non-qualified opportunities. Common causes of high non-billable discretionary spending are high
business development and training expenses or employee expense misuse.
Real-time visibility
Real-time information visibility is one of the most important management tools. SPI Research asked
survey respondents whether their executives had real-time visibility into all business activities (sales,
service, marketing, finance, etc.). The rewards are significant for organizations who have integrated
systems and management dashboards that allow them to pinpoint issues and spot trends in real-time.
Executives who have real-time visibility run companies that are much more profitable than those that do
not as they are able to take advantage of changing market conditions. Surprisingly despite market
turbulence, real-time visibility increased this year. Firms intently focused on their sales pipelines and
backlog to ensure they had enough work to keep staff billable. Most organizations started planning and
replanning their forecasts as the Corona Virus epidemic unfolded.
Real-time visibility is a very important key performance indicator. As Table 153 shows, organizations
that have comprehensive visibility can make the decisions necessary to grow and achieve high levels of
profitability. And it is not for just those KPI’s listed in this table, it is for a majority of the other metrics
tracked by SPI Research as well.
Table 152: Impact – Quarterly non-billable expense per employee
Quarterly non-billable expense
per employee Survey
%
% of emp.
billable Employee attrition
On-time project delivery
Project overrun
Under $1,500 74.2% 75.4% 11.0% 80.4% 7.5%
$1,500 - $2,500 16.7% 73.9% 11.5% 77.5% 10.2%
$2,500 - $5,000 4.8% 70.8% 17.6% 74.4% 11.3%
$5,000 - $7,500 3.0% 70.5% 12.6% 81.4% 11.6%
Over $7,500 1.3% 71.0% 19.5% 73.0% 11.0%
Total/Average 100.0% 74.7% 11.6% 79.6% 8.3%
Source: SPI Research, February 2021
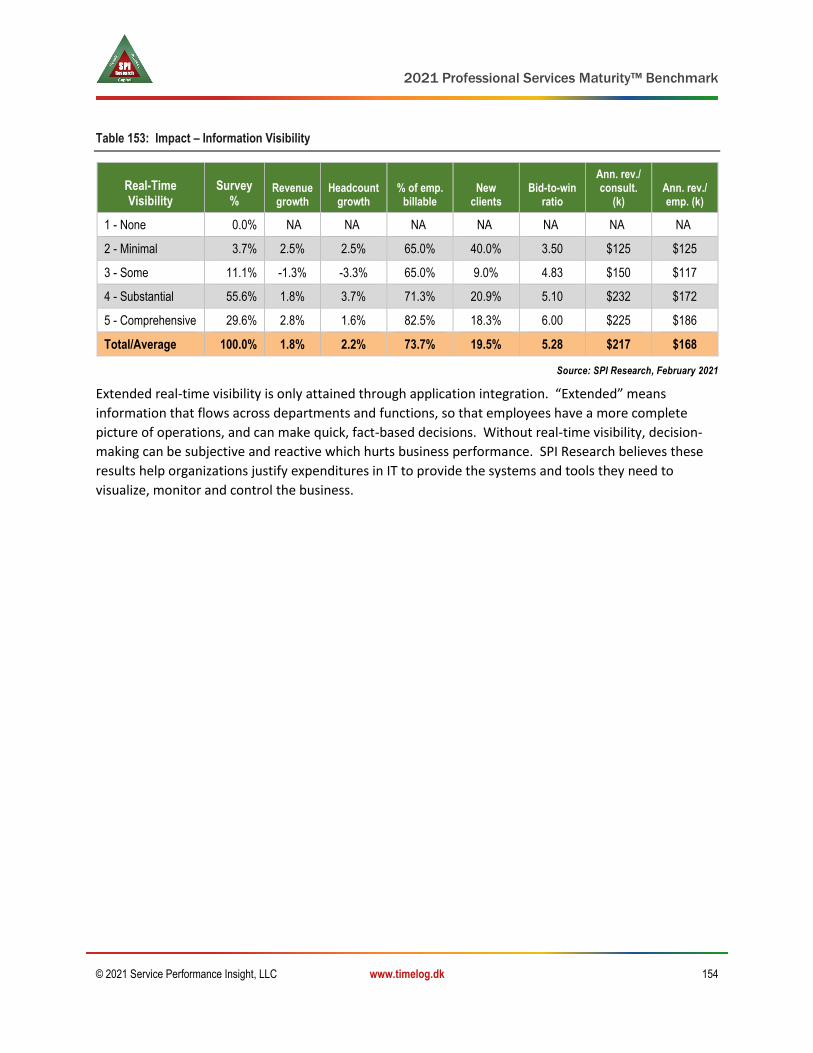
2021 Professional Services Maturity™ Benchmark
© 2021 Service Performance Insight, LLC www.timelog.dk 154
Table 153: Impact – Information Visibility
Real-Time Visibility
Survey %
Revenue growth
Headcount growth
% of emp. billable
New clients
Bid-to-win ratio
Ann. rev./ consult.
(k) Ann. rev./ emp. (k)
1 - None 0.0% NA NA NA NA NA NA NA
2 - Minimal 3.7% 2.5% 2.5% 65.0% 40.0% 3.50 $125 $125
3 - Some 11.1% -1.3% -3.3% 65.0% 9.0% 4.83 $150 $117
4 - Substantial 55.6% 1.8% 3.7% 71.3% 20.9% 5.10 $232 $172
5 - Comprehensive 29.6% 2.8% 1.6% 82.5% 18.3% 6.00 $225 $186
Total/Average 100.0% 1.8% 2.2% 73.7% 19.5% 5.28 $217 $168
Source: SPI Research, February 2021
Extended real-time visibility is only attained through application integration. “Extended” means
information that flows across departments and functions, so that employees have a more complete
picture of operations, and can make quick, fact-based decisions. Without real-time visibility, decision-
making can be subjective and reactive which hurts business performance. SPI Research believes these
results help organizations justify expenditures in IT to provide the systems and tools they need to
visualize, monitor and control the business.
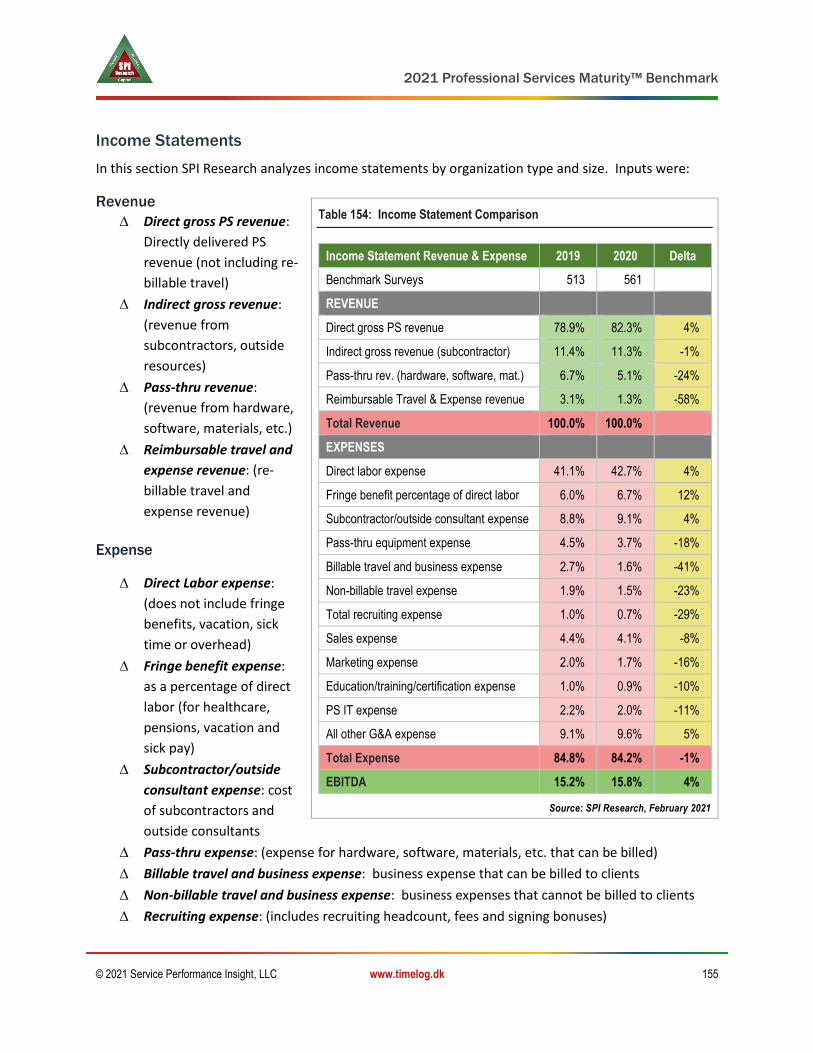
2021 Professional Services Maturity™ Benchmark
© 2021 Service Performance Insight, LLC www.timelog.dk 155
Income Statements
In this section SPI Research analyzes income statements by organization type and size. Inputs were:
Revenue
Direct gross PS revenue:
Directly delivered PS
revenue (not including re-
billable travel)
Indirect gross revenue:
(revenue from
subcontractors, outside
resources)
Pass-thru revenue:
(revenue from hardware,
software, materials, etc.)
Reimbursable travel and
expense revenue: (re-
billable travel and
expense revenue)
Expense
Direct Labor expense:
(does not include fringe
benefits, vacation, sick
time or overhead)
Fringe benefit expense:
as a percentage of direct
labor (for healthcare,
pensions, vacation and
sick pay)
Subcontractor/outside
consultant expense: cost
of subcontractors and
outside consultants
Pass-thru expense: (expense for hardware, software, materials, etc. that can be billed)
Billable travel and business expense: business expense that can be billed to clients
Non-billable travel and business expense: business expenses that cannot be billed to clients
Recruiting expense: (includes recruiting headcount, fees and signing bonuses)
Table 154: Income Statement Comparison
Income Statement Revenue & Expense 2019 2020 Delta
Benchmark Surveys 513 561
REVENUE
Direct gross PS revenue 78.9% 82.3% 4%
Indirect gross revenue (subcontractor) 11.4% 11.3% -1%
Pass-thru rev. (hardware, software, mat.) 6.7% 5.1% -24%
Reimbursable Travel & Expense revenue 3.1% 1.3% -58%
Total Revenue 100.0% 100.0%
EXPENSES
Direct labor expense 41.1% 42.7% 4%
Fringe benefit percentage of direct labor 6.0% 6.7% 12%
Subcontractor/outside consultant expense 8.8% 9.1% 4%
Pass-thru equipment expense 4.5% 3.7% -18%
Billable travel and business expense 2.7% 1.6% -41%
Non-billable travel expense 1.9% 1.5% -23%
Total recruiting expense 1.0% 0.7% -29%
Sales expense 4.4% 4.1% -8%
Marketing expense 2.0% 1.7% -16%
Education/training/certification expense 1.0% 0.9% -10%
PS IT expense 2.2% 2.0% -11%
All other G&A expense 9.1% 9.6% 5%
Total Expense 84.8% 84.2% -1%
EBITDA 15.2% 15.8% 4%
Source: SPI Research, February 2021

2021 Professional Services Maturity™ Benchmark
© 2021 Service Performance Insight, LLC www.timelog.dk 156
Sales expense: (includes sales headcount, bonus and non-reimbursable sales expense)
Marketing expense: (includes marketing headcount, bonus and marketing program expense)
Education, training and certification expense: (includes the cost of training and certification)
PS IT expense: supporting the IT infrastructure (personnel, applications, networking, etc.)
General and Administrative: non-billable headcount, general and administration costs,
facilities, headcount and overhead.
Profits surprisingly increased in 2020 when compared to 2019 due to a significant decline in spending.
By category, rebillable business travel decreased almost 50% causing a big profit improvement as
rebillable travel is usually billed at or below cost, reducing net profit. Recruiting costs were reduced by
29% with a slowdown in hiring and lower attrition. Nonbillable travel expense was cut by 23%.
Table 154 shows the PS industry did a great job or reining in costs based on expectations of significant
declines in revenue which did not happen. One of the unexpected positive benefits of the pandemic
were reductions in discretionary spending which did not have a commensurate impact on reduced
revenue. As the economy comes out of the pandemic, CFOs should carefully review which costs are
really essential to grow revenues and which ones can be cut without impacting the business. Hopefully
organizations will evaluate the many positive benefits from allowing employees to work from home –
think of the long-term positive impact on the climate if business travel and work commutes are
permanently reduced!
Table 155 provides income statement comparison for embedded versus independents as well as by
geography. Sources of revenue for independents and ESOs were very similar this year but independents
derived slightly less revenue from subcontractors, reimbursable travel and pass-through hardware and
software.
The cost of healthcare and fringe benefits including paid time off continued to climb in the Americas
reflecting runaway healthcare costs. APAC firms pay substantially less for fringe benefits, particularly
healthcare than their counterparts in the Americas and Europe. All businesses should look to Asia for
positive ideas to improve workplace wellness without commensurate skyrocketing medical costs.
Table 155: Income Statement by Organization Type and Embedded Service Type
Key performance indicator (KPI) Survey ESO PSO Americas EMEA APac
Surveys 561 171 390 445 84 32
REVENUE
Direct gross PS revenue 82.3% 81.0% 82.8% 82.9% 80.7% 80.0%
Indirect gross revenue (subcontractor) 11.3% 11.4% 11.2% 11.0% 15.0% 7.3%
Pass-thru rev. (hardware, software, mat.) 5.1% 5.6% 4.9% 4.8% 3.4% 10.8%
Reimbursable Travel & Expense revenue 1.3% 2.0% 1.1% 1.3% 0.9% 1.9%
Total Revenue 100.0% 100.0% 100.0% 100.0% 100.0% 100.0%

2021 Professional Services Maturity™ Benchmark
© 2021 Service Performance Insight, LLC www.timelog.dk 157
Key performance indicator (KPI) Survey ESO PSO Americas EMEA APac
EXPENSES
Direct labor expense 42.7% 42.7% 42.7% 42.2% 46.8% 40.6%
Fringe benefit percentage of direct labor 6.7% 7.5% 6.5% 7.3% 5.5% 3.7%
Subcontractor/outside consultant expense 9.1% 9.5% 9.0% 8.0% 15.3% 8.5%
Pass-thru equipment expense 3.7% 3.9% 3.6% 3.5% 2.2% 8.4%
Billable travel and business expense 1.6% 1.8% 1.5% 1.8% 1.1% 0.8%
Non-billable travel expense 1.5% 1.9% 1.3% 1.7% 0.8% 0.7%
Total recruiting expense 0.7% 0.7% 0.7% 0.7% 0.8% 0.5%
Sales expense 4.1% 3.3% 4.3% 4.0% 3.6% 5.4%
Marketing expense 1.7% 1.4% 1.8% 1.8% 0.9% 1.9%
Education/training/certification expense 0.9% 1.0% 0.8% 0.9% 1.0% 0.8%
PS IT expense 2.0% 2.1% 1.9% 2.0% 1.6% 2.2%
All other G&A expense 9.6% 3.3% 11.6% 9.4% 7.8% 14.8%
Total Expenses 84.2% 79.2% 85.8% 83.1% 87.4% 88.4%
2020 EBITDA 15.8% 20.8% 14.2% 16.9% 12.6% 11.6%
2019 EBITDA Comparison 15.2% 21.3% 13.6% 16.2% 14.0% 5.4%
Source: SPI Research, February 2021
Table 156 provides analysis of income statements by organization size. Net profit improved for all size
organizations except those with 31 to 100 employees. These size organizations spent more on
subcontractors but were not able to make good margins on them. Smaller organizations spent relatively
more on sales and marketing than their larger counterparts.
Table 156: Income Statement by Organization Size
Key performance indicator (KPI)
Under 10 10 - 30 31 – 100 101 - 300 301 - 700 Over 700
Surveys 62 108 170 111 48 62
REVENUE
Direct gross PS revenue 79.6% 85.5% 80.0% 83.6% 83.3% 79.7%
Indirect gross revenue (subs.) 11.9% 10.0% 11.6% 11.5% 12.9% 10.7%
Pass-thru rev. (hw, sw, mat.) 7.7% 3.3% 7.3% 3.1% 2.6% 8.1%
Reimbursable Travel & Expense 0.8% 1.2% 1.1% 1.7% 1.2% 1.5%
Total Revenue 100.0% 100.0% 100.0% 100.0% 100.0% 100.0%

2021 Professional Services Maturity™ Benchmark
© 2021 Service Performance Insight, LLC www.timelog.dk 158
Key performance indicator (KPI)
Under 10 10 - 30 31 – 100 101 - 300 301 - 700 Over 700
EXPENSES
Direct labor expense 44.8% 41.3% 43.6% 42.8% 39.1% 45.1%
Fringe benefit % of direct labor 6.1% 6.5% 6.6% 7.0% 7.1% 7.7%
Subcontractor/outside consultant 8.8% 7.5% 10.5% 8.8% 10.1% 7.5%
Pass-thru equipment expense 4.0% 3.4% 5.4% 1.7% 1.7% 5.2%
Billable travel and business 2.9% 1.5% 1.5% 1.5% 1.2% 2.3%
Non-billable travel expense 0.3% 1.8% 1.8% 1.2% 1.1% 1.0%
Total recruiting expense 0.1% 0.7% 0.6% 1.0% 0.5% 1.3%
Sales expense 4.2% 3.8% 4.8% 3.9% 2.4% 3.1%
Marketing expense 1.1% 2.1% 2.1% 1.3% 0.5% 0.9%
Education/training/certification 0.7% 1.0% 0.8% 1.1% 0.5% 1.3%
PS IT expense 0.4% 2.3% 1.7% 2.3% 1.8% 2.7%
All other G&A expense 7.2% 10.5% 9.1% 10.6% 10.3% 5.6%
Total Expenses 80.7% 82.4% 88.5% 83.2% 76.3% 83.7%
2020 EBITDA 19.3% 17.6% 11.5% 16.8% 23.7% 16.3%
2019 EBITDA Comparison 16.0% 13.8% 15.7% 15.8% 15.5% 14.0%
Source: SPI Research, February 2021
In this year’s survey, SPI Research received profitability metrics from most of the vertical markets (only
markets with sufficient income statement data are shown). This year we received significantly more
completed surveys from architects and engineers. With economic improvement, this sector has seen
profit improvement year over year as well as revenue growth however architects reported the highest
level of G&A overhead spending in the benchmark at 13.3% of total revenue.
Table 157 shows income statement comparison for the five primary verticals represented in this
benchmark. Management consultancies, software ESOs and Accountancies had a very good year from a
net profit point of view.
The cloud is here to stay and as these organizations mature, they are leading the charge in investing in
tools and technology to streamline their PS operations. The large cloud PSOs have large development
centers throughout India, Asia and Eastern Europe, allowing them to take advantage of strong technical
talent at substantially lower costs. Management consultancies and enterprise software and SaaS ESOs
have high direct labor costs as they must pay a premium for the unique skills their clients require. SaaS
ESOs and Accountancies spend the most on IT. Architects and engineers have the highest G&A cost
which dilutes their margins.

2021 Professional Services Maturity™ Benchmark
© 2021 Service Performance Insight, LLC www.timelog.dk 159
Table 157: Income Statement by PS Market Vertical
Key performance indicator (KPI) IT Consult Mgmt.
Consult SaaS PS Software PS Arch./ Engr.
Surveys 143 84 64 55 35
REVENUE
Direct gross PS revenue 77.2% 87.3% 81.1% 86.1% 87.4%
Indirect gross revenue (subs.) 14.5% 10.4% 13.4% 9.3% 7.5%
Pass-thru rev. (hw, sw, mat.) 7.6% 1.4% 3.3% 2.4% 3.8%
Reimbursable Travel & Expense 0.6% 1.0% 2.2% 2.2% 1.3%
Total Revenue 100.0% 100.0% 100.0% 100.0% 100.0%
EXPENSES
Direct labor expense 40.6% 46.9% 46.2% 45.1% 40.3%
Fringe benefit % of direct labor 5.5% 5.9% 7.9% 7.7% 9.4%
Subcontractor/outside consultant 10.9% 7.8% 11.4% 7.5% 6.6%
Pass-thru equipment expense 5.4% 0.7% 1.1% 3.0% 3.5%
Billable travel and business 0.7% 2.3% 2.1% 1.7% 2.3%
Non-billable travel expense 1.4% 1.2% 2.2% 1.5% 1.6%
Total recruiting expense 0.7% 0.9% 1.0% 0.7% 0.5%
Sales expense 5.7% 4.5% 2.8% 2.9% 2.5%
Marketing expense 1.8% 2.2% 1.6% 0.5% 1.5%
Education/training/certification 0.6% 1.1% 1.2% 0.6% 1.0%
PS IT expense 2.0% 2.3% 2.6% 2.3% 1.7%
All other G&A expense 11.3% 13.5% 1.6% 3.0% 13.3%
Total Expenses 86.6% 89.4% 81.7% 76.6% 84.2%
2020 EBITDA 13.4% 10.6% 18.3% 23.4% 15.8%
2019 EBITDA Comparison 11.9% 23.1% 13.1% 23.7% 17.6%
Source: SPI Research, February 2021
Table 158 shows income statements for accountancies, advertising and marketing agencies, Managed
Service providers and other PS.

2021 Professional Services Maturity™ Benchmark
© 2021 Service Performance Insight, LLC www.timelog.dk 160
Table 158: Income Statement by PS Market Vertical
Key performance indicator (KPI) MarCom VAR Account Mgd. Serv. All Others
Surveys 31 17 14 13 105
REVENUE
Direct gross PS revenue 85.7% 75.2% 87.9% 45.0% 83.8%
Indirect gross revenue (subs.) 9.0% 7.3% 9.3% 26.2% 8.7%
Pass-thru rev. (hw, sw, mat.) 4.2% 14.9% 1.5% 28.2% 5.6%
Reimbursable Travel & Expense 1.1% 2.6% 1.3% 0.7% 1.8%
Total Revenue 100.0% 100.0% 100.0% 100.0% 100.0%
EXPENSES
Direct labor expense 55.8% 31.6% 36.7% 30.3% 41.9%
Fringe benefit % of direct labor 5.2% 8.1% 7.6% 2.4% 7.4%
Subcontractor/outside consultant 9.0% 7.2% 4.9% 14.9% 9.1%
Pass-thru equipment expense 1.9% 9.6% 1.7% 24.6% 4.1%
Billable travel and business 0.3% 2.5% 3.4% 0.7% 1.6%
Non-billable travel expense 0.4% 1.1% 1.6% 0.4% 1.4%
Total recruiting expense 0.3% 0.4% 0.3% 0.4% 0.7%
Sales expense 0.4% 4.3% 1.8% 11.3% 3.1%
Marketing expense 0.2% 2.9% 2.7% 1.9% 1.6%
Education/training/certification 0.1% 1.1% 1.4% 0.5% 1.2%
PS IT expense 0.2% 1.5% 2.8% 0.8% 1.4%
All other G&A expense 5.4% 7.2% 11.6% 10.3% 8.1%
Total Expenses 79.1% 77.4% 76.5% 98.5% 81.5%
2020 EBITDA 20.9% 22.6% 23.5% 1.5% 18.5%
2019 EBITDA Comparison 12.7% 7.8% 25.0% 19.8% 14.7%
Source: SPI Research, February 2021

2021 Professional Services Maturity™ Benchmark
© 2021 Service Performance Insight, LLC www.timelog.dk 161
11. 2021 Professional Services Maturity™ Model Results
SPI Research has spent over a decade developing and improving the Professional Services Maturity™
Model. Over 35,000 billable professional services organizations use the model to benchmark and
improve organizational performance. With over 6,000 billable services organizations (over 2,500 during
the past five years) participating over the past fourteen years, SPI Research has further refined the
model to improve its accuracy.
561 firms participated from September through November of 2020 representing over 300,000
consultants worldwide, continuing to make this the most comprehensive study of the global PS industry.
While most the participating organizations are headquartered in North America, the firms surveyed
have employees distributed globally, and SPI Research believes it to be an accurate representation of
the global PS industry. SPI Research clients continue to use the model to develop, prioritize and
implement performance
gains.
In this chapter, SPI Research
reveals the analytic basis of
the model and gives insight
into our survey techniques.
For this year’s model, SPI
Research used the current
database of 561 firms
surveyed in 2020.
Maturity Levels
The maturity rating for each
Service Performance Pillar varies based on the performance of the organization. In each of the five
performance pillars, every firm operates at one of the five maturity levels (Figure 40):
∆ Level 1 (Initiated – 30% of the respondents): In the initial stages, the focus of the organization
is primarily on client acquisition and building a reference base. To accomplish this core mission,
the organization must recruit and hire excellent staff. Therefore, at Maturity Level 1 the priority
focus areas are Customer Relationships and Human Capital Management.
∆ Level 2 (Piloted – 25% of the respondents): The organization is becoming a profit center, so
focus is still on client relationships, but human capital and finance and operations have become
more important as the organization moves from a cost center to a profit center.
∆ Level 3 (Deployed – 25% of the respondents): The organization has now deployed core
operating processes in all five service performance pillars. At this point, the organization must
continue to accentuate Human Capital Alignment, but the key focus has shifted to Finance and
Operations and Service Execution. The organization must start to consider strategy and vision to
Figure 40: Professional Services Maturity Model™ Levels
Source: SPI Research, February 2020

2021 Professional Services Maturity™ Benchmark
© 2021 Service Performance Insight, LLC www.timelog.dk 162
ensure the focus is on the right clients, markets and competition. At this level, the organization
must have deployed standard business processes across all dimensions.
∆ Level 4 (Institutionalized – 15% of the respondents): At this level, the organization must start
optimizing across all dimensions. However, maintaining and growing service revenue and
margin is of paramount importance. The organization must start developing a differentiated
approach to clients with vertical and horizontal market segments and geographies so a focus on
the Client Relationship pillar is critical.
∆ Level 5 (Optimized – 5% of the respondents): The organization has achieved “black belt” status
in all functional areas. Processes are fully developed, deployed and institutionalized. The
organization is now developing comprehensive measurement, monitoring, and optimization
processes across all pillars.
While every organization should strive to attain Maturity Level 5 in each of the five service performance
pillars, some areas are more important than others depending on the overall maturity of the company
or its market. For instance, early in the life of a professional services organization client relationships
are far more important than profitability because without clients there can be no future. Over time,
client relationships always remain important, but the organization must equally focus efforts on other
Pillars. To be a truly optimized organization, the firm should aspire to reach Level 5 in all dimensions.
Model Improvements
Each year SPI Research makes modifications to improve the model based on additional surveys, its own
analysis, and feedback from PSOs that use the model. This year, there were no changes to the questions
asked, however, the model change slightly in terms of the weight other specific questions. These mainly
were changes to emphasize the importance of specific KPIs SPI Research found as not having a strong
impact on overall performance.
As is the case each year, not every question is included in the PS Maturity™ model. Demographic
information is not part of the PS Maturity™ model but helps PS executives better compare their
organizations to the benchmark. This year several questions were removed, which SPI Research felt did
not help PSOs improve performance.
Model Inputs
SPI Research conducts correlation analysis between the questions to determine what, if any, impact
each of the key performance indicators (KPIs) have on each other. The questions were then rated by
relative importance from 0.0 (unimportant) to 1.0 (very important) for each of the KPIs. Each question
was assigned a maximum value based on the answer given and the weight of the question. At the
bottom of each of the following tables is the total maximum value possible in each maturity rating. Here
is a synopsis of the SPI Research methodology:
∆ Factor: Respondent’s unique answers to the given question. Some questions are answered
within a range to reduce the time to complete the survey.
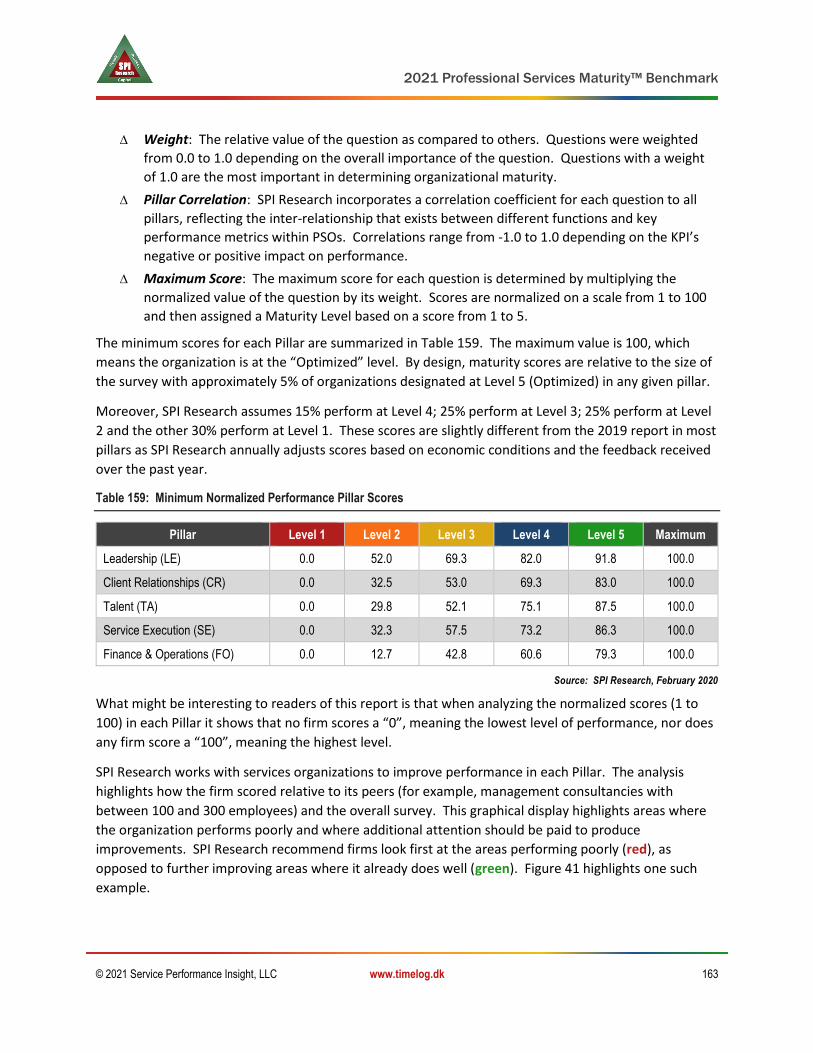
2021 Professional Services Maturity™ Benchmark
© 2021 Service Performance Insight, LLC www.timelog.dk 163
∆ Weight: The relative value of the question as compared to others. Questions were weighted
from 0.0 to 1.0 depending on the overall importance of the question. Questions with a weight
of 1.0 are the most important in determining organizational maturity.
∆ Pillar Correlation: SPI Research incorporates a correlation coefficient for each question to all
pillars, reflecting the inter-relationship that exists between different functions and key
performance metrics within PSOs. Correlations range from -1.0 to 1.0 depending on the KPI’s
negative or positive impact on performance.
∆ Maximum Score: The maximum score for each question is determined by multiplying the
normalized value of the question by its weight. Scores are normalized on a scale from 1 to 100
and then assigned a Maturity Level based on a score from 1 to 5.
The minimum scores for each Pillar are summarized in Table 159. The maximum value is 100, which
means the organization is at the “Optimized” level. By design, maturity scores are relative to the size of
the survey with approximately 5% of organizations designated at Level 5 (Optimized) in any given pillar.
Moreover, SPI Research assumes 15% perform at Level 4; 25% perform at Level 3; 25% perform at Level
2 and the other 30% perform at Level 1. These scores are slightly different from the 2019 report in most
pillars as SPI Research annually adjusts scores based on economic conditions and the feedback received
over the past year.
Table 159: Minimum Normalized Performance Pillar Scores
Pillar Level 1 Level 2 Level 3 Level 4 Level 5 Maximum
Leadership (LE) 0.0 52.0 69.3 82.0 91.8 100.0
Client Relationships (CR) 0.0 32.5 53.0 69.3 83.0 100.0
Talent (TA) 0.0 29.8 52.1 75.1 87.5 100.0
Service Execution (SE) 0.0 32.3 57.5 73.2 86.3 100.0
Finance & Operations (FO) 0.0 12.7 42.8 60.6 79.3 100.0
Source: SPI Research, February 2020
What might be interesting to readers of this report is that when analyzing the normalized scores (1 to
100) in each Pillar it shows that no firm scores a “0”, meaning the lowest level of performance, nor does
any firm score a “100”, meaning the highest level.
SPI Research works with services organizations to improve performance in each Pillar. The analysis
highlights how the firm scored relative to its peers (for example, management consultancies with
between 100 and 300 employees) and the overall survey. This graphical display highlights areas where
the organization performs poorly and where additional attention should be paid to produce
improvements. SPI Research recommend firms look first at the areas performing poorly (red), as
opposed to further improving areas where it already does well (green). Figure 41 highlights one such
example.
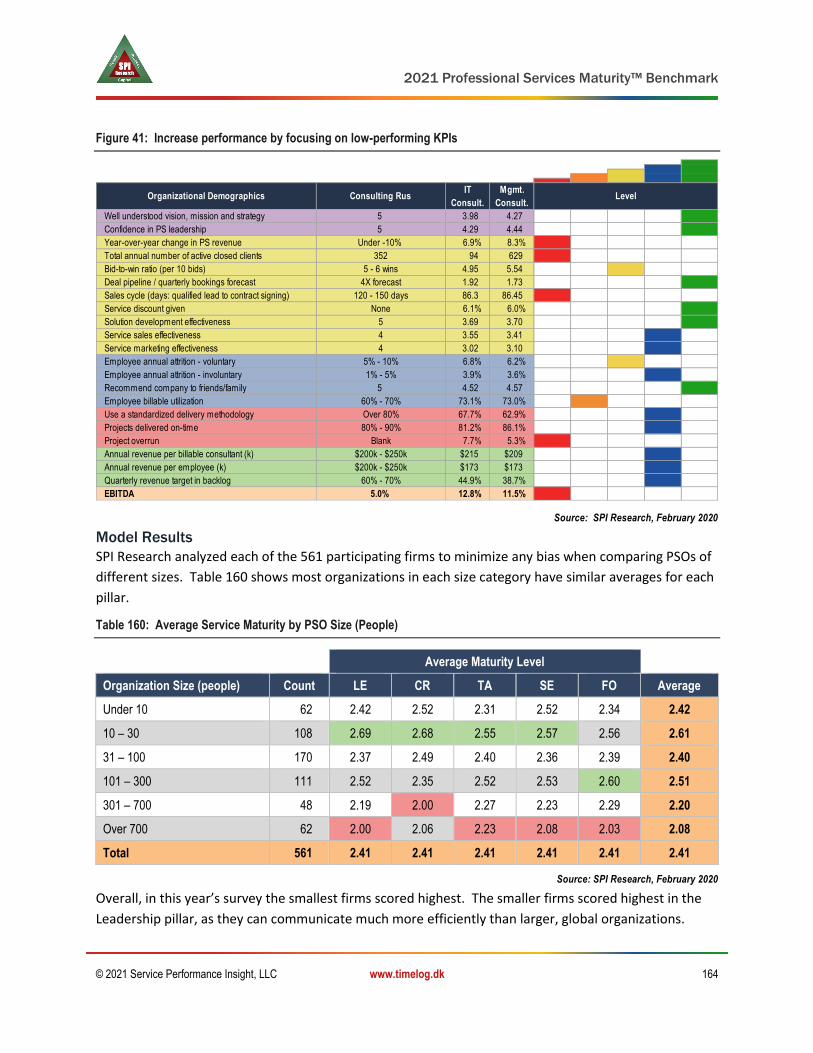
2021 Professional Services Maturity™ Benchmark
© 2021 Service Performance Insight, LLC www.timelog.dk 164
Figure 41: Increase performance by focusing on low-performing KPIs
Source: SPI Research, February 2020
Model Results
SPI Research analyzed each of the 561 participating firms to minimize any bias when comparing PSOs of
different sizes. Table 160 shows most organizations in each size category have similar averages for each
pillar.
Table 160: Average Service Maturity by PSO Size (People)
Average Maturity Level
Organization Size (people) Count LE CR TA SE FO Average
Under 10 62 2.42 2.52 2.31 2.52 2.34 2.42
10 – 30 108 2.69 2.68 2.55 2.57 2.56 2.61
31 – 100 170 2.37 2.49 2.40 2.36 2.39 2.40
101 – 300 111 2.52 2.35 2.52 2.53 2.60 2.51
301 – 700 48 2.19 2.00 2.27 2.23 2.29 2.20
Over 700 62 2.00 2.06 2.23 2.08 2.03 2.08
Total 561 2.41 2.41 2.41 2.41 2.41 2.41
Source: SPI Research, February 2020
Overall, in this year’s survey the smallest firms scored highest. The smaller firms scored highest in the
Leadership pillar, as they can communicate much more efficiently than larger, global organizations.
Organizational Demographics Consulting RusIT
Consult.
Mgmt.
Consult.
Well understood vision, mission and strategy 5 3.98 4.27
Confidence in PS leadership 5 4.29 4.44
Year-over-year change in PS revenue Under -10% 6.9% 8.3%
Total annual number of active closed clients 352 94 629
Bid-to-win ratio (per 10 bids) 5 - 6 wins 4.95 5.54
Deal pipeline / quarterly bookings forecast 4X forecast 1.92 1.73
Sales cycle (days: qualified lead to contract signing) 120 - 150 days 86.3 86.45
Service discount given None 6.1% 6.0%
Solution development effectiveness 5 3.69 3.70
Service sales effectiveness 4 3.55 3.41
Service marketing effectiveness 4 3.02 3.10
Employee annual attrition - voluntary 5% - 10% 6.8% 6.2%
Employee annual attrition - involuntary 1% - 5% 3.9% 3.6%
Recommend company to friends/family 5 4.52 4.57
Employee billable utilization 60% - 70% 73.1% 73.0%
Use a standardized delivery methodology Over 80% 67.7% 62.9%
Projects delivered on-time 80% - 90% 81.2% 86.1%
Project overrun Blank 7.7% 5.3%
Annual revenue per billable consultant (k) $200k - $250k $215 $209
Annual revenue per employee (k) $200k - $250k $173 $173
Quarterly revenue target in backlog 60% - 70% 44.9% 38.7%
EBITDA 5.0% 12.8% 11.5%
Level

2021 Professional Services Maturity™ Benchmark
© 2021 Service Performance Insight, LLC www.timelog.dk 165
Smaller firms also scored higher in the Client Relationships pillar, fueling strong growth along the way.
However, in Talent, smaller firms scored lower, as many lack the training, compensation and internal
growth potential that tend to keep attrition low and employees happy.
SPI Research found it interesting that the smallest firms scored the highest level of maturity in delivering
services. This result is atypical, as larger firms have more tools and methodologies in place to perform
efficiently and effectively. However, sometimes larger firms have very bureaucratic processes, which
slow the ability to deliver services, and potential profit, down. Overall, midsize firms will show the
greatest Finance & Operations maturity, primarily due to not being so small as to worry about profit, but
not so large, as to worry about corporate bureaucracy.
Table 161: Average Service Maturity by PSO Type
Average Maturity Level
PSO Type Count LE CR TA SE FO Average
Embedded 171 2.24 2.25 2.30 2.17 2.39 2.27
Independent 390 2.49 2.48 2.46 2.52 2.42 2.47
Total 561 2.41 2.41 2.41 2.41 2.41 2.41
Source: SPI Research, February 2020
SPI Research analyzed the maturity of PSOs by type (embedded vs. independent), and the results are
summarized in Table 161. This year’s results show independents scored better in every performance
pillar. In the past embedded organizations exhibited greater maturity in all five dimensions. Embedded
PSOs are typically early adopters of business applications as they receive the benefit of sophisticated IT
investments while independents tend to forego solution acquisition in favor of business development
and marketing expenditures. However, in this year’s survey the Independents operated at a higher
overall level.
Table 162 shows the average level of maturity for each of the performance pillars by select vertical
markets. IT consultancies, management consultancies and VARs scored the highest in at least one pillar.
Accountancies and Government Contractors scored the lowest overall. Several of the markets where SPI
Research did not have enough quantitative data showed lower results. However, it is difficult to analyze
those markets when there are less than 20 surveys.
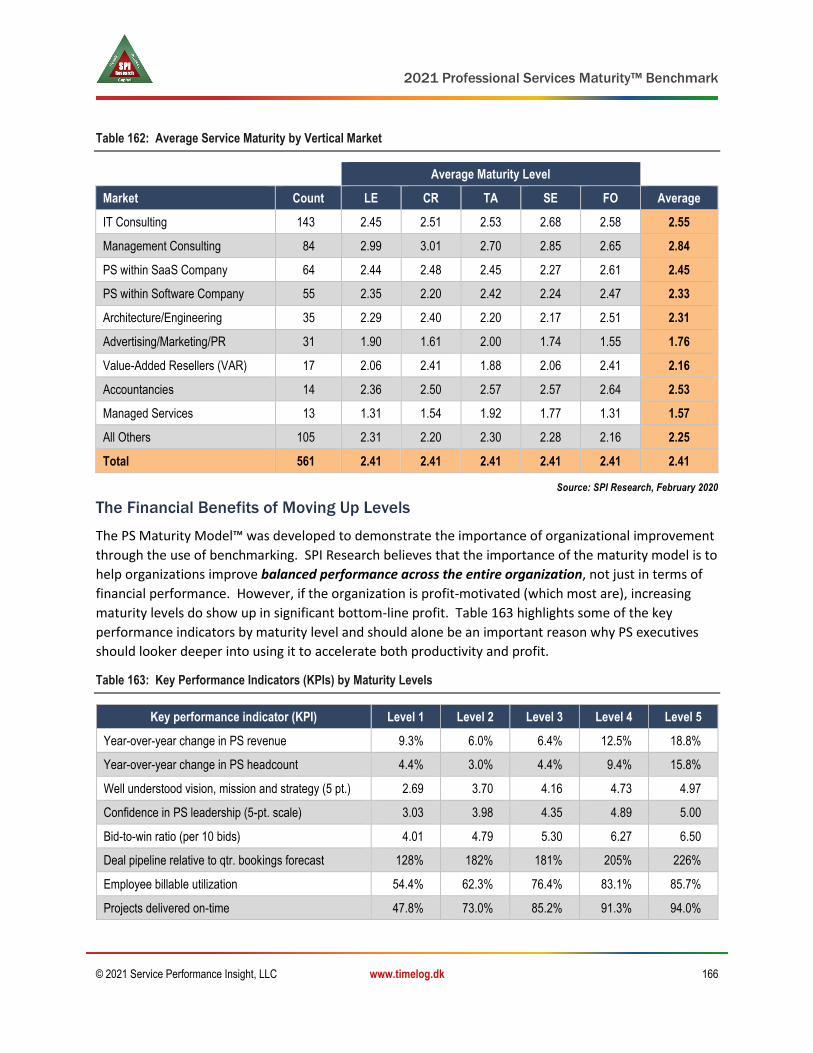
2021 Professional Services Maturity™ Benchmark
© 2021 Service Performance Insight, LLC www.timelog.dk 166
Table 162: Average Service Maturity by Vertical Market
Average Maturity Level
Market Count LE CR TA SE FO Average
IT Consulting 143 2.45 2.51 2.53 2.68 2.58 2.55
Management Consulting 84 2.99 3.01 2.70 2.85 2.65 2.84
PS within SaaS Company 64 2.44 2.48 2.45 2.27 2.61 2.45
PS within Software Company 55 2.35 2.20 2.42 2.24 2.47 2.33
Architecture/Engineering 35 2.29 2.40 2.20 2.17 2.51 2.31
Advertising/Marketing/PR 31 1.90 1.61 2.00 1.74 1.55 1.76
Value-Added Resellers (VAR) 17 2.06 2.41 1.88 2.06 2.41 2.16
Accountancies 14 2.36 2.50 2.57 2.57 2.64 2.53
Managed Services 13 1.31 1.54 1.92 1.77 1.31 1.57
All Others 105 2.31 2.20 2.30 2.28 2.16 2.25
Total 561 2.41 2.41 2.41 2.41 2.41 2.41
Source: SPI Research, February 2020
The Financial Benefits of Moving Up Levels
The PS Maturity Model™ was developed to demonstrate the importance of organizational improvement
through the use of benchmarking. SPI Research believes that the importance of the maturity model is to
help organizations improve balanced performance across the entire organization, not just in terms of
financial performance. However, if the organization is profit-motivated (which most are), increasing
maturity levels do show up in significant bottom-line profit. Table 163 highlights some of the key
performance indicators by maturity level and should alone be an important reason why PS executives
should looker deeper into using it to accelerate both productivity and profit.
Table 163: Key Performance Indicators (KPIs) by Maturity Levels
Key performance indicator (KPI) Level 1 Level 2 Level 3 Level 4 Level 5
Year-over-year change in PS revenue 9.3% 6.0% 6.4% 12.5% 18.8%
Year-over-year change in PS headcount 4.4% 3.0% 4.4% 9.4% 15.8%
Well understood vision, mission and strategy (5 pt.) 2.69 3.70 4.16 4.73 4.97
Confidence in PS leadership (5-pt. scale) 3.03 3.98 4.35 4.89 5.00
Bid-to-win ratio (per 10 bids) 4.01 4.79 5.30 6.27 6.50
Deal pipeline relative to qtr. bookings forecast 128% 182% 181% 205% 226%
Employee billable utilization 54.4% 62.3% 76.4% 83.1% 85.7%
Projects delivered on-time 47.8% 73.0% 85.2% 91.3% 94.0%
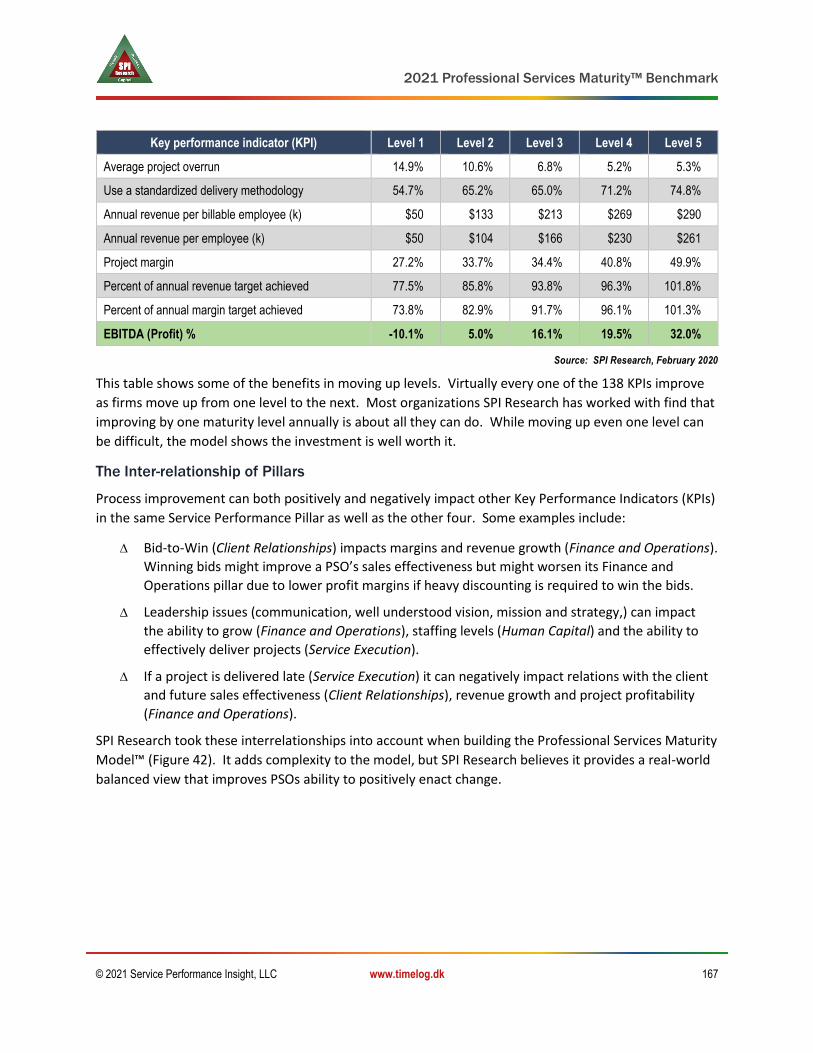
2021 Professional Services Maturity™ Benchmark
© 2021 Service Performance Insight, LLC www.timelog.dk 167
Key performance indicator (KPI) Level 1 Level 2 Level 3 Level 4 Level 5
Average project overrun 14.9% 10.6% 6.8% 5.2% 5.3%
Use a standardized delivery methodology 54.7% 65.2% 65.0% 71.2% 74.8%
Annual revenue per billable employee (k) $50 $133 $213 $269 $290
Annual revenue per employee (k) $50 $104 $166 $230 $261
Project margin 27.2% 33.7% 34.4% 40.8% 49.9%
Percent of annual revenue target achieved 77.5% 85.8% 93.8% 96.3% 101.8%
Percent of annual margin target achieved 73.8% 82.9% 91.7% 96.1% 101.3%
EBITDA (Profit) % -10.1% 5.0% 16.1% 19.5% 32.0%
Source: SPI Research, February 2020
This table shows some of the benefits in moving up levels. Virtually every one of the 138 KPIs improve
as firms move up from one level to the next. Most organizations SPI Research has worked with find that
improving by one maturity level annually is about all they can do. While moving up even one level can
be difficult, the model shows the investment is well worth it.
The Inter-relationship of Pillars
Process improvement can both positively and negatively impact other Key Performance Indicators (KPIs)
in the same Service Performance Pillar as well as the other four. Some examples include:
∆ Bid-to-Win (Client Relationships) impacts margins and revenue growth (Finance and Operations).
Winning bids might improve a PSO’s sales effectiveness but might worsen its Finance and
Operations pillar due to lower profit margins if heavy discounting is required to win the bids.
∆ Leadership issues (communication, well understood vision, mission and strategy,) can impact
the ability to grow (Finance and Operations), staffing levels (Human Capital) and the ability to
effectively deliver projects (Service Execution).
∆ If a project is delivered late (Service Execution) it can negatively impact relations with the client
and future sales effectiveness (Client Relationships), revenue growth and project profitability
(Finance and Operations).
SPI Research took these interrelationships into account when building the Professional Services Maturity
Model™ (Figure 42). It adds complexity to the model, but SPI Research believes it provides a real-world
balanced view that improves PSOs ability to positively enact change.

2021 Professional Services Maturity™ Benchmark
© 2021 Service Performance Insight, LLC www.timelog.dk 168
Figure 42: Key Performance Indicators (KPIs) are Correlated
Source: SPI Research, February 2020
Model Conclusions
In 14 years of building the Professional Services Maturity Model™ SPI Research has seen the correlation
of KPIs vary from year-to-year, as the economy and competitive environment dictate how PS
organizations operate. The model is an aggregate built for PSOs (both embedded and independent),
different size organizations, as well as for the different vertical markets surveyed. Therefore, the results
will have some type of “generic bias.” PS executives who wish to have their organization compared
directly to their peer group (i.e., IT Consultants with 100 to 300 employees) should contact SPI Research.
As organizations grow, they will gain greater operational efficiency and other advantages, while losing
intimacy and ease of communication. Every vertical market has its own constraints, particularly in
pricing strategies, in many cases limiting the ability for high levels of profitability. The key to this
maturity model is for executives to drill down on their own vertical market, as well as organization size,
to better determine relative performance. SPI Research can further segment this information to help PS
executives specifically analyze performance relative to their exact peer group. Contact SPI Research for
more information on the Professional Services Maturity Model™.

2021 Professional Services Maturity™ Benchmark
© 2021 Service Performance Insight, LLC www.timelog.dk 169
12. Conclusions and Recommendations
COVID, COVID, COVID! The world is tired of worrying about the pandemic, but it continues to rage on. A
glimmer of relief is on the horizon as vaccines are starting to roll out. Despite the social and economic
catastrophe in its wake, many sectors of the economy have performed well. In fact, a strange K-shaped
recovery is exacerbating the already enormous gulf between rich and poor. The rich are getting richer
with stocks, savings accounts, and high-end homes at all-time highs while the poor are
disproportionately dying and losing already low-paying jobs. The technology and professional services
sector is to a lesser extent experiencing the same bifurcation with 20% of PS organizations thriving while
the bottom 20% struggle to survive.
Because of the pandemic, the global economic marketplace has shifted, and shifted toward a more
distributed and remote workforce. While this trend has been occurring in the professional services
market for some time, other industries were shocked into it. The net result is that businesses will
operate differently in 2021 than they did in 2019. Long term the impact on the professional services
market will be extremely positive, with more clients accepting and embracing virtual service delivery.
Interestingly, with fewer in-office distractions and shorter to no commutes and business travel,
corporations have been reaping benefits in lower operating costs which they are reinvesting in
technology to streamline the business and support a future virtual work world. The tech giants are
thriving and reinvesting in more growth, more innovation and more employees.
This year’s Professional Services Maturity™ Benchmark had somewhat different results than in previous
years, but not necessarily worse. In the middle of 2020 SPI Research expected very negative findings.
But as the year progressed it turned out business conditions were not as bad as preconceived. The
biggest change was the overnight move to remote work. Prior to the pandemic almost all PS
organizations performed some, if not most work virtually but this trend clearly accelerated in 2020.
Remote work can drive higher performance if managed correctly, and the Professional Services market
has the talent to do so. However, personal interaction is as important in business as it is in life. How will
PSO's groom and grow new employees? What are the long-term ramifications for managers and
leaders? How can systems and tools help build culture and a sense of belonging? All of these are major
questions facing Professional Services organizations.
You Can’t Fix What You Can’t Measure
The Professional Services Maturity™ Benchmark provides clear metrics and guidance on over 160 key
performance measurements. SPI Research likes to say, “Running a service organization is a game of
singles and doubles.” Small percentage improvements in just a few key performance areas can have
dramatic bottom-line results. PS executives often feel isolated and have a limited support base to rely
on for advice. The Professional Services Maturity™ Benchmark and score-carding process takes the
guesswork out of metrics. Completing the PS Maturity™ survey can highlight new avenues for
improvement and enable PSOs to conduct their own self-assessment.
2021 Professional Services Maturity™ Benchmark
© 2021 Service Performance Insight, LLC www.timelog.dk 170
Most PSOs consider themselves leaders and they probably are in one or more areas. To continue to
remain relevant in this competitive and fragmented market, they must have unique and specific
capabilities that set them apart. However, as with most organizations as they scale, inefficiencies and
blind-spots start to appear, threatening to derail growth and undermine productivity. There may be
areas of immaturity or overly cumbersome or manual systems and processes. This benchmark helps PS
executives measure and compare their performance, armed with an objective fact base and competitive
comparisons. By developing a measurable annual improvement plan and backing it up with clear
enhancement initiatives and goals the organization can create and institutionalize a continuous cycle of
improvement and renewal.
Digital Transformation is not just for your clients
Knowledge is power, and data fuels knowledge. Analytics have enabled firms to better prepare and
operate in a changing world. A lack of actionable information hinders progress. Effective and integrated
business applications provide the cornerstone for any type of business transformation.
The Professional Services Maturity Model™ is based on accurate and timely information. Needless to
say, PS firms cannot run optimally without accurate and timely information. Scrimping on systems costs
more in the long run. Service providers need to use and recommend the right tools for the job including
upgrading their own information infrastructure. The acumen they use to help their clients embrace
digital transformation must also be brought to bear on their own systems. Investments in IT will pay off.
Dramatic improvements are possible when PSOs implement the right information technologies, but only
when real-time information and consistent metrics are visible and reinforced throughout the
organization. The quote to cash business cycle is at the heart of providing visibility to the three key areas
underpinning growth – pipeline, projects and people. In a knowledge intensive business, like
Professional Services, arming employees with a view of active deals, the resources required to
effectively deliver projects, and the skills and competencies needed both today and tomorrow goes a
long way towards enhancing progress.
Choppy Seas in 2020 should lead to Smooth Sailing in 2021
2020 was a strange and challenging year for Professional Services with a global pandemic and US
elections, which led to uncertainly in the market. A year ago, SPI Research highlighted that after an
exceptional 2019, there would be smooth sailing in 2020. Ouch! Leading firms did quite well in 2020 –
they grew and invested in their employees. Unfortunately, an equal number of firms suffered, and if
they survive, they enter 2021 working even harder to catch up. Many were acquired by their more
successful brethren as economies of scale are working to drive market consolidation.
The good news is that in 2021 there will be no more major contentious US elections and the new
administration looks to focus on defeating the virus along with infrastructure, which will lead to jobs in
all markets. Debt is something everyone should be worried about, and could cause problems down the
road. Likewise, higher interest rates or rising inflation can slow growth. But SPI believes the good news
outweighs the bad, and 2021 will be a year for companies in all markets to reevaluate and change,
creating an even greater need for professional services.

2021 Professional Services Maturity™ Benchmark
© 2021 Service Performance Insight, LLC www.timelog.dk 171
SPI Research continues to advocate PSOs must concentrate on their weakest links, while also continuing
to improve in each of SPI Research’s five core pillars:
1. Leadership: build leaders for the future. A new young millennial workforce requires strong
front-line management and guidance. With changing workforce dynamics, effective, ethical and
collaborative leadership is required more than ever before.
2. Client Relationships: selling professional services has become increasingly difficult, as client
organizations look for demonstrable value and demand “pay as you go” subscription pricing.
Marketing and sales campaigns must address client’s key challenges and provide the means for
clients to buy the way they want to. New usage-based business models make it easier for
buyers to buy but more complex for service providers to provide. Measurable business value
and adoption are driving references and growth.
3. Talent: your talent pool is your most critical asset, and continued understanding of how the
workforce changes, and how they wish to be treated, from training to compensation to social
programs, is critical to understand and cultivate a high-quality workforce.
4. Service Execution: delivering services on time and on budget with sufficient margin fosters
growth and profitability. Always keep an eye on project budgets to actuals, eliminating overruns
before they spiral out of control. You can't have your best people on every project, there must
be a mix between higher-level skills and lower level and lower cost talent. Implementing
standardized business processes and systems helps you better understand and track effort for
the services delivered.
5. Finance & Operations: keep an eye on the bottom-line! Cash flow is critical, and it is imperative
for your organization to track costs and expenses to determine where improvement is needed.
Predictable financial performance provides the breathing room to make investments into new
growth areas.
SPI Research believes benchmarking is an activity that should be conducted continuously, as the insights
it delivers enable PSOs to make changes in real time that are necessary for growth and prosperity.
Continue to compare your organization to the High-Performance PSOs. This information will shed light
on best practices and help galvanize your organization around improvement priorities.
Stay healthy and best of luck for a prosperous and profitable 2021!
Jeanne Urich and Dave Hofferberth

2021 Professional Services Maturity™ Benchmark
© 2021 Service Performance Insight, LLC www.timelog.dk 172
13. Appendices
Appendix A: Acronyms Used in This Report
Table 164: Lexicon of Acronyms and Abbreviations
Acronym Meaning Acronym Meaning
AI Artificial Intelligence PA Project Accounting
APac Asia-Pacific PaaS Platform as a Service
BI Business Intelligence PMI Project Management Institute
BPM Business Process Management PMO Project Management Office
BPO Business Process Outsourcing PMP Project Management Professional
CEO Chief Executive Officer PPM Project Portfolio Management
CFM Core/Corporate Financial Management PS Professional Services
CFO Chief Financial Officer PSA Professional Services Automation
CIO Chief Information Officer PSO Professional Services Organization
CRM Client Relationship Management ROI Return on Investment
DSO Days Sales Outstanding RSD Remote Service Delivery and Collaboration
EMEA Europe, Middle East, Africa SaaS Software as a Service
ERP Enterprise Resource Planning SCM Supply Chain Management
ESO Embedded Service Organization SM Social Media
EVM Earned Value Management SMAC Social, Mobile, Analytics, Cloud
HCM Human Capital Management SRP Service Resource Planning
HR Human Resources SLA Service Level Agreement
IaaS Infrastructure as a Service SLM Service Lifecycle Management
IoT Internet of Things STEM Science, technology, math and engineering
ISV Independent Software Vendor SVC Service Value Chain
IT Information Technology VSOE Vendor-Specific Objective Evidence
KPI Key Performance Indicator WBS Work Breakdown Structure
MarCom Marketing Communication / Advertising YoY Year-over-year
NAICS North American Industry Classification System
Source: SPI Research, February 2021

2021 Professional Services Maturity™ Benchmark
© 2021 Service Performance Insight, LLC www.timelog.dk 173
Appendix B: Financial Terminology
The following table contains a list of standard key performance measurement terms and definitions
used in the benchmark report. The terms and definitions have been compiled from our knowledge and
experience and a variety of sources including www.wikipedia.org http://www.investopedia.com and
Morris, Manning and Martin, LLP. SPI Research is interested in expanding and evolving common key
performance measurements, standards and definitions for Professional services organizations. If you
would like to add terms or suggest changes, your comments and suggestions will be appreciated.
Table 165: Standard Key Performance Indicator (KPI) Definitions
Term Definition
70% utilization ~ 1,400 billable hours/year or 350 hours/quarter
Allocations Corporate allocations refer to a company’s policy of distributing the cost of shared resources, for example, facilities, healthcare, IT and Sales, General and Administrative (SG&A) costs to specific functions or departments.
Annual Billable Utilization %
Annual Billable Hours/(2080 hours – vacation and holidays) or
Billable days/(260 days – 10 vacation – 10 holidays ~ 240 days)
Attrition % Attrition % = (Voluntary + involuntary) / Total Beginning Employees
Backlog
Backlog = Bookings - Billings
The total value of contract commitments yet to be executed:
Total Backlog = Previous fiscal year’s contracts not yet billed
+ Latest fiscal year’s sales
- Latest fiscal year’s revenue
Bid Win Ratio The ratio of successful bids (resulting in signed contracts) divided by the total number of bids or proposals issued. Bid Win ratio is a good measure of sales and marketing effectiveness because it demonstrates the organization is pursuing appropriate types of business and is able to beat its competitors.
Billings Completed, accepted work that can been billed (T&M, Work in process, Milestone, Deliverables)
Bookings Signed Contracts (signed PS Agreement + signed SOW + PO)
Burdened Cost Typically employee burdened costs are the costs per employee for benefits (Healthcare, Pensions, 401K) and an apportioned cost for the employee’s facility and IT usage + all discretionary expense. The difference between burdened cost and fully burdened cost is that fully burdened cost includes an allocation for corporate SG&A costs.
Capitalization
Expensed computing equipment: expenses (typically less than $100k) vs. capitalized (paid for over a time period). Servers for example, are typically capitalized and depreciated over a 3 year period. Capital expenditures usually refer to expenses a company makes for property, buildings or equipment. Capitalized items typically have a useful life of several years.
Cash The value of the most liquid assets within the balance sheet. Cash equivalents are assets such as money market accounts that can be accessed quickly and are not subject to significant change. Does not include the value of accounts receivable.
Cash flow Is the balance of the amounts of cash being received and paid by a business during a defined period of time, sometimes tied to a specific project. The timing of cash flows into and out of projects is used as input to financial models such as internal rate of return, and net present value.
Cost per person Cost Per person = Base + Fringe (~25%) + Bonus

2021 Professional Services Maturity™ Benchmark
© 2021 Service Performance Insight, LLC www.timelog.dk 174
Term Definition
Days Sales Outstanding (DSO)
A measure of the average number of days that it takes a company to collect revenue after a sale has been made and a bill has been issued. A low DSO means that it takes a company fewer days to collect its accounts receivable. A high DSO means that a company is selling its product to slow-paying customers and it is taking longer to collect money. Days sales outstanding is calculated as:
DSO is a key performance measurement of the credit-worthiness of a company’s clients; a general indicator for client satisfaction and the effectiveness of the billing and collection process. DSO is reported either quarterly or annually.
Depreciation An expense recorded to allocate a tangible asset's cost over its useful life. Because depreciation is a non-cash expense, it increases free cash flow while decreasing reported earnings.
Direct Costs Cost incurred as a direct consequence of producing a good or service, as opposed to overhead or indirect costs.
EBITDA
Earnings Before Interest, Taxes, Depreciation and Amortization.
EBITDA is essentially net Income with interest, taxes, depreciation, and amortization added back to it. EBITDA can be used to analyze and compare profitability between companies and industries because it eliminates the effects of financing and accounting decisions. However, this is a non-GAAP measure that allows a greater amount of discretion as to what is (and is not) included in the calculation. This also means that companies often change the items included in their EBITDA calculation from one reporting period to the next.
EITF
An organization formed in 1984 by the Financial Accounting Standards Board (FASB) to provide assistance with timely financial reporting. The EITF holds public meetings in order to identify and resolve accounting issues occurring in the financial world. EITF 08-01 and EITF 09-03 are scheduled to go into effect in June, 2010. These new rulings provide revenue recognition guidelines around the value of multi-element contracts which include products and services. These new rulings will allow companies to more accurately recognize revenue as services are delivered for complex multi-element contracts. They create a hierarchy of evidence to support revenue recognition including VSOE (Vendor Specific Objective Evidence), TPE (Third Party Evidence) and ESP (Estimated Selling Price).
FASB
A seven-member independent board consisting of accounting professionals who establish and communicate standards of financial accounting and reporting in the United States. FASB standards, known as generally accepted accounting principles (GAAP), govern the preparation of corporate financial reports and are recognized as authoritative by the Securities and Exchange Commission.
Fixed Costs Fixed costs are costs that remain the same regardless of changes in the business. For example, facility lease costs remain the same for the life of the lease, regardless of the level of occupancy. If the business is expanding, the percentage of fixed costs may decrease whereas if the business is contracting, the percentage of fixed costs may increase.
Fringe Benefits
A collection of various benefits provided by an employer, which are exempt from taxation as long as certain conditions are met. Fringe benefits commonly include health insurance, group term life coverage, education reimbursement, childcare and assistance reimbursement, cafeteria plans, employee discounts, personal use of a company owned vehicle and other similar benefits.
Gross Margin
Gross Margin = (Total Services Revenue – Expense or Cost to Deliver the Services)
The gross profit generated per dollar of services delivered.
A company's total sales revenue minus its cost of goods or services sold. This dollar amount represents the gross amount of money the company generated over the cost of producing its goods or services.
Gross Margin Percentage
Gross Margin % = (Total Services Revenue – Expense or Cost of Services Delivered) / Total Services Revenue
Gross Margin %= Gross Margin / Revenue

2021 Professional Services Maturity™ Benchmark
© 2021 Service Performance Insight, LLC www.timelog.dk 175
Term Definition
Gross Profit Percentage
A company's total sales or service revenue minus cost of goods or services sold, divided by the total sales revenue, expressed as a percentage. Gross profit and gross margin are used interchangeably.
Income Statement or Profit and Loss Statement
A financial statement that summarizes the revenues, costs and expenses incurred during a specific period of time - usually a fiscal quarter or year. The statement of profit and loss follows a general format that begins with an entry for revenue and subtracts from revenue the costs of running the business, including cost of goods sold, operating expenses, tax expense and interest expense. The bottom line is net income (profit).
Labor Burdened Cost
Labor Burdened Cost per Productive Hour (or Fully-burdened Cost) (Labor Burdened Cost + gross payroll labor cost) ÷ the number of actual work (productive) hours
Number of actual productive hours ÷ the total additional cost of the employee = Employee labor burden cost per productive hour
Labor Multiplier
Labor multiplier = total $ amount of labor hours billed / fully loaded (burdened) labor cost
Note: a labor multiplier of 1.0 indicates a breakeven point.
Any usability cost-benefit analysis should value people's time based on their fully loaded cost and not simply on their take-home salary. The cost to a company of having a staff member work for an hour is not that person's hourly rate but also includes the cost of benefits, bonuses, vacation time, facility costs (office space, heating and cleaning, computers etc.), and the many other costs associated with having that person employed.
The simplest way to derive the average loaded cost of an employee is to add up all corporate or division expenses and divide by the total number of productive hours worked.
Commonly, the fully loaded cost of an employee is at least twice his or her salary. This is why consultants charge so much more than regular employees: their billable hours have to cover the many overhead costs that are implicit for full-time employees. In fact, looking at common consulting rates for the kind of staff you are dealing with is a shortcut for estimating the fully loaded value of your employees' time.
EXAMPLE:
base rate/hour (BR)= dollar per hour pay for the staff category
OH multiplier (OHM) = firm's overhead (OH) percentage + 100%
Profit multiplier (PM)= profit percentage + 100%
"loaded" rate/hour = BR X OHM X PM
Base rate/hour= $45.00 per hour
overhead multiplier = 135% overhead + 100% = 235% = 2.35
Profit multiplier = 10% profit + 100% = 110% = 1.1
"loaded" rate/hour = $45.00 X 2.35 X 1.1
Lagging Indicators
Investopedia explains LAGGING INDICATORS Lagging indicators confirm long-term trends, but they do not predict them. Some examples are unemployment, corporate profits and labor cost per unit of output. Interest rates are another good lagging indicator as interest rates change after severe market changes.
In services, billable utilization, revenue per person and net profits are lagging indicators because they reflect changes in market conditions after the change has already occurred.
Leading Indicators
A measurable economic factor that changes before the economy starts to follow a particular pattern or trend. Leading indicators are used to predict changes in the economy, but are not always accurate. In services, leading indicators are backlog and sales pipeline because they are predictors of future revenue.
What Does the COMPOSITE INDEX OF LEADING INDICATORS Mean? An index published monthly by the Conference Board used to predict the direction of the economy's movements in the months to come. The index is made up of 10 economic components, whose changes tend to precede changes in the overall economy. These 10 components include: 1. The average weekly hours worked by manufacturing workers 2. The average number of initial applications for unemployment insurance 3. The amount of manufacturers' new orders for consumer goods and materials

2021 Professional Services Maturity™ Benchmark
© 2021 Service Performance Insight, LLC www.timelog.dk 176
Term Definition
4. The speed of delivery of new merchandise to vendors from suppliers 5. The amount of new orders for capital goods unrelated to defense 6. The amount of new building permits for residential buildings 7. The S&P 500 stock index 8. The inflation-adjusted monetary supply (M2) 9. The spread between long and short interest rates
10.Consumer sentiment
Loaded Cost per Person
Base + Fringe Benefits (~25%) + Target Variable Compensation + % Corporate and Practice Overhead allocation per person. Non-billable time (bench time) must be added to calculate the actual cost per hour of productive time.
Margin % Margin % = (Revenue - Cost)/Revenue
Markup %
Markup % = (Revenue-Cost)/Cost
For example, 60% markup = 40% margin
Measurement Utilization %
Billable Hours + Approved non-billable hours (pre-sales, Customer Satisfaction, Special Projects)/(2080 hours or 260 days -vacation and holidays)
Measurement Utilization
Measurement Utilization = (Billable Hours + Approved non-billable hours)/ (2080 hours – Vacations – Holidays) Approved non-billable hours are usually associated with presales, overtime not billed to clients, customer satisfaction resolution time, internal projects or skills training.
Net Income
A company's total earnings (or profit). Net income is calculated by taking revenues and adjusting for the cost of doing business, depreciation, interest, taxes and other expenses. This number is found on a company's income statement and is an important measure of how profitable the company is over a period of time. The measure is also used to calculate earnings per share.
Often referred to as "the bottom line" since net income is listed at the bottom of the income statement.
Net income is calculated by starting with a company's total revenue. From this, the cost of sales, along with any other expenses that the company incurred during the period, is removed to reach earnings before tax. Tax is deducted from this amount to reach the net income number.
Non-billable Travel
Non-billable travel expense represents travel expense which cannot be re-billed to a client. Typically consulting non-billable travel is associated with business development or training activities.
On-Target Earnings (OTE)
The typical pay structure for a salesperson is composed of a fairly low basic salary with an additional amount of commission. The package will usually be called OTE or on-target earnings, meaning that if a salesperson hits the specified target, they will be guaranteed that amount of money. A higher commission can be paid if the person performs beyond this target.
Operating Income
Operating income would not include items such as investments in other firms, taxes or interest. In addition, nonrecurring items such as cash paid for a lawsuit settlement are often not included.
Operating income is required to calculate operating margin, which describes a company's operating efficiency.
Operating Income = Gross Income – Operating Expenses – Depreciation
Operating Margin
Operating margin is a measurement of what proportion of a company's revenue is left over after paying for variable costs of service delivery such as wages and benefits.
Operating Margin = Operating Income / Net Sales
Operating Profit = (Total Service Revenue – Total cost of service delivery – Total Operating Expense)/ Total Service Revenue
Operating Profit / Margin
The amount of profit realized from a business's own operations. A ratio used to measure a company's pricing strategy and operating efficiency.
Overhead Costs
Usually, fixed costs - a business cost that is not directly accountable to a particular function or product; a fixed cost such as facilities.
Costs incurred that cannot be attributed to the production of any particular unit of output.
The general, fixed cost of running a business such as rent, lighting, and heating expenses, which cannot be charged or attributed to a specific product or part of the work operation.

2021 Professional Services Maturity™ Benchmark
© 2021 Service Performance Insight, LLC www.timelog.dk 177
Term Definition
Profit Margin = Return on Sales (ROS)
The percentage of every dollar of sales that makes it to the bottom line. Profit Margin is Net Income after Tax divided by Net Sales.
A ratio of profitability calculated as net income divided by revenues, or net profits divided by sales. It measures how much out of every dollar of sales a company actually keeps in earnings.
Project Margin £$€
Project Revenue – Direct Cost of project service delivery
Revenue Estimate
Revenue Estimate = Billable headcount X Billable hours X Average Bill rate X Average Utilization Rate
Revenue
Revenue = Billings that can be recognized within the time period + Re-billable travel and expense
The amount of money that a company actually bills during a specific period, including sales discounts.
Revenue per person
Actual Bill Rate * Billable Hours + re-billable travel and expense
Recurring Revenue
The best revenues are those that continue year in and year out, they are often referred to as “recurring” revenue. Examples of recurring revenues are multi-year maintenance contracts and multi-year Software as Service (SaaS) subscription revenues. Temporary revenue increases, such as those that might result from a short-term promotion, are less valuable and garner a lower price-to-earnings multiple for a company.
Run Rate
How the financial performance of a company would look if you were to extrapolate current results out over a specified period of time.
Revenue Recognition
http://www.mmmlaw.com/publications/article_detail.asp?articleid=103
(Selected excerpts from the article)
Any business generating revenue from licensing, selling, leasing or otherwise marketing software will experience serious problems from failure to recognize the significance of the New SOP. This section summarizes the importance of revenue recognition. Revenue recognition is a fundamental component of generally accepted accounting principles (GAAP) and is a key consideration in maintaining the integrity of financial statements. The central issue is one of timing and amount :
When should revenue generated in a software transaction be recognized in a software company’s income statement, and in what amounts?
In most cases, companies strive to recognize revenue as quickly as possible, thereby improving their financial performance. Even private software companies generally try to improve financial performance by accelerating revenues whenever possible. Before issuance of SOP 91-1 in December 1991, there was no specific guidance for recognizing revenue in software transactions. The ensuing lack of uniformity among software companies in their revenue recognition policies led to the inability of third parties to make meaningful comparisons among companies. Similarly, the New SOP is designed to provide even greater uniformity by addressing inconsistent applications of SOP 91-1 in software transactions. Basic Revenue Recognition Criteria. SOP 91-1 and the New SOP each define basic criteria that must be satisfied before revenue can be recognized. Under the New SOP if an arrangement to deliver software does not require significant production, modification, or customization of the software, then the New SOP specifies four criteria which must be met prior to recognizing revenue from a single-element arrangement or for individual elements in a multiple-element arrangement.1 These four criteria are:
1. persuasive evidence of an arrangement exists;
2. delivery has occurred;
3. the software vendor’s fee is fixed or determinable; and
4. Collectability is probable.
Although these basic revenue recognition criteria are substantially the same as those contained in SOP 91-1, the New SOP takes a fundamentally different approach in certain areas such as: (1) providing detailed guidelines for recognition of revenue in "multiple-element arrangements," and (2) eliminating the concept of remaining "significant vendor obligations" under SOP 91-1.
Changing Sales Behavior. A software company’s sales force will be critical to implementation of the New SOP. As a general rule, software companies tend to bundle software and services together in order to offer a turn-key software solution to the buyer. Additionally, the description of and the fees for the software and services being offered are typically combined. This

2021 Professional Services Maturity™ Benchmark
© 2021 Service Performance Insight, LLC www.timelog.dk 178
Term Definition
bundling makes the sale easier for a sales representative because it makes the offering easier for the buyer to understand and it prevents the buyer from removing elements of the transaction that the buyer might not otherwise pay for if they knew the individual price for the element. However, the result of this bundling could be a deferral of revenue recognition. Therefore, many software companies will have to change the manner in which their sales personnel work in order to achieve their revenue recognition goals. Sales Force Compensation. From an internal perspective, many companies base compensation and bonus arrangements, at least in part, on recognized revenue within a specified time period. If revenue recognition policies are changed, bonus plans may be affected. With the adoption of the New SOP, benefit plans will require further examination to verify the suitability of these plans in achieving a company's objectives and motivating employees to complete all the requirements for revenue recognition as a basis for earning a bonus.
Subcontractor Margin
Subcontractor Margin = (Total subcontractor generated revenue – total subcontractor cost)/ Total subcontractor generated revenue
Variable Costs Variable costs are costs that vary based upon usage. Training, travel and business expenses are variable, whereas costs for facilities are treated as a “fixed” cost because they do not vary based on use. Commonly variable costs may also be termed “discretionary” because management can make decisions to make or not make the expenditure.
VSOE
VSOE = Vendor-Specific Objective Evidence (accounting/contracting)
VSOE is the price established by management having relevant authority. Once a firm has established the VSOE price and officially acknowledged it as such, that price must not be expected to change prior to the introduction of that element into the marketplace. The introduction of that deliverable into the marketplace on a separate basis ought to be within a very short period of time after the VSOE price is set. Accounting firms have differing opinions on how long is too long, so make certain you are aware of your accounting firm’s guidelines.
Vendor Specific Objective Evidence (VSOE) is an agreed-upon value for goods and services. For service organizations, VSOE is usually established by the company’s auditors based on historical bill rates or actual realized revenues from service packages. When VSOE service prices are set the effect can be very painful because the firm’s auditors review past engagements to set current VSOE rates. This means if a firm’s services were significantly discounted in the past the service organization will be penalized with “Past sins” when auditors calculate current VSOE rates. With software companies the accepted practice is to amortize each sale across the contract's lifetime and to apply all labor hours whether billable or not.
Source: Investopedia, Wikipedia, Morris, Manning and Martin, LLP, and SPI Research, February 2021

2021 Professional Services Maturity™ Benchmark
© 2021 Service Performance Insight, LLC www.timelog.dk 179
Appendix C: Professional Services Maturity™ Benchmark Survey Tool

2021 Professional Services Maturity™ Benchmark
© 2021 Service Performance Insight, LLC www.timelog.dk 180
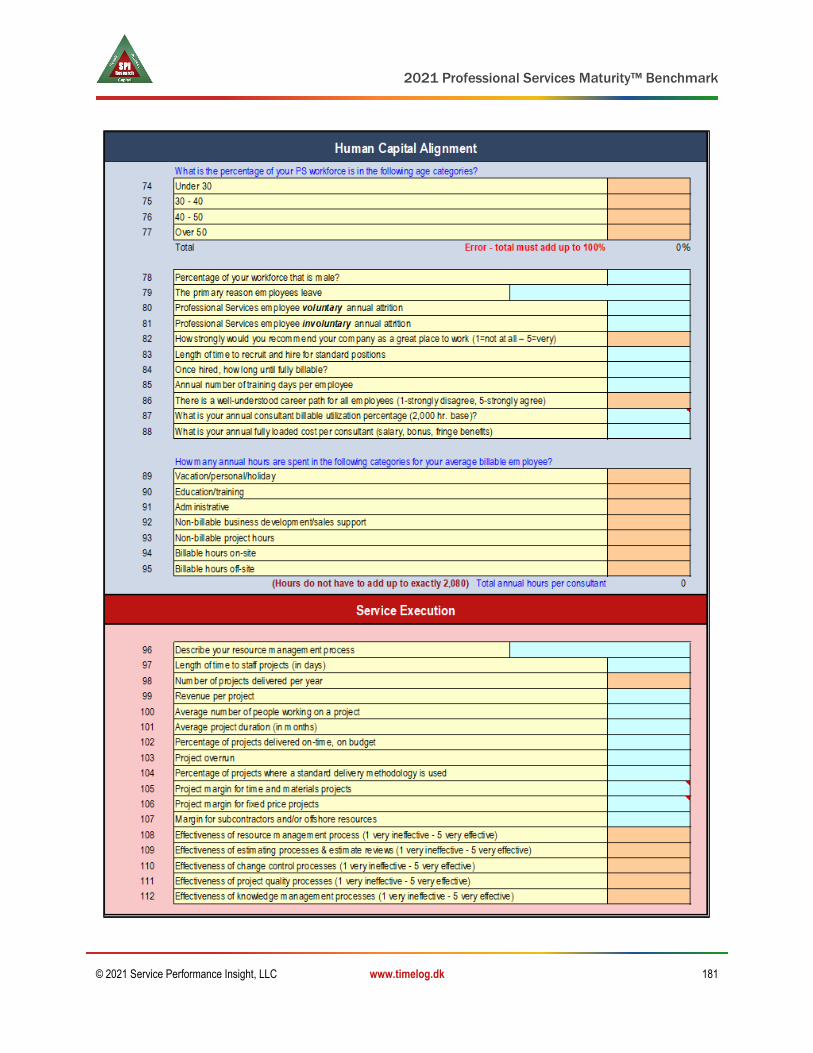
2021 Professional Services Maturity™ Benchmark
© 2021 Service Performance Insight, LLC www.timelog.dk 181

2021 Professional Services Maturity™ Benchmark
© 2021 Service Performance Insight, LLC www.timelog.dk 182

2021 Professional Services Maturity™ Benchmark
© 2021 Service Performance Insight, LLC www.timelog.dk 183
Appendix D: Related SPI Research
SPI Research has produced several publications for services-driven organizations that include:
2020 Professional Services Talent Benchmark (August 2020): This important 108-page study
profiles talent priorities, the move to virtual service delivery, level of employee investment and
the impact of business applications. The study provides analysis of target and realized bill rates;
compensation and utilization across a broad range of professional service verticals, geographies
and job levels around the globe. It provides an unprecedented view of Professional Services
workforce distribution and composition by industry segment through an analysis of organization
structures for various service segments including IT Consulting; Management Consulting;
Architects and Engineers and embedded service organizations within technology companies.
The study provides analysis of target and realized bill rates, compensation and utilization across
a broad range of professional service verticals, geographies and job levels around the globe.
Based on survey data from 127 Professional Service organizations, representing more than
20,000 consultants, this independent study profiles published and realized bill rates, base and
variable compensation and billable utilization across 12 job roles.
2019 PS Human Capital Management (HCM) End-user Survey (September 2019): The 2019
Human Capital Management (HCM) End-user Survey Report is the first professional services end-
user survey. It is based on 52 billable professional services organizations, and details many of the
drivers behind the purchase and use of HCM, analyses user satisfaction by module, and both
qualifies and quantifies its benefits. The 45-page report consists of 46 figures and tables, and
highlights some of the trends in HCM use, most notable its movement to the Cloud. The average
firm size was 446 employees, and the organizations showed an annual profit of 11.6%.
2017 Professional Services Automation End-user Survey (September 2017): For the first time in
over a decade, during the second quarter of 2017, SPI Research conducted a Professional
Services Automation (PSA) end-user survey. This examination of 68 billable organizations using
PSA is truly an independent research study – the PSA solution providers had no input or control
over the survey or respondents. The survey asked both quantitative and qualitative questions
regarding why firms selected PSA, which attributes were most important, and how buyers
perceived their benefits. Most importantly, this study looked at both pre- and post-PSA
deployment. The report contains: PSA definition and core modules, why PSA was purchased,
how PSA is used, user satisfaction with various components and aspects of PSA, pre- and post-
PSA deployment benchmarks, and participant interviews, and long with 36 insightful figures and
tables.
2017 Professional Services Automation Buyers Guide (July 2017): The growth engine of the
world’s economy has shifted from manufacturing to project-based, people-centric services
businesses. These businesses rely on Professional Services Automation (PSA) solutions. PSA
automates core business processes such as quote-to-cash, resource management, project

2021 Professional Services Maturity™ Benchmark
© 2021 Service Performance Insight, LLC www.timelog.dk 184
management, time capture and billing. It provides the real-time visibility necessary to improve
organizational efficiency and effectiveness. This PSA Buyer’s Guide provides an overview of
important trends, business processes and selection criteria to help project- and services-based
businesses evaluate and choose PSA applications, which will provide the level of insight,
management and control needed to improve productivity and profitability.
2013 Professional Services Sales and Marketing Maturity™ Benchmark (October 2013): Most
professional services organizations are dissatisfied with their sales, marketing (and packaging)
effectiveness. For the past eight years, over 1,500 PS organizations that have completed SPI
Research’s benchmark surveys have consistently given their sales and marketing efforts failing
marks. The results for the very few firms that have successfully implemented PS sales, marketing
and packaging disciplines, and made these activities central to their value proposition are
extraordinary with 47 percent of all services sold as packaged solutions, 28.6 percent net profit
and $255,000 annual revenue yield per consultant.
Information on these and any other SPI Research publications can be found at www.spiresearch.com or
by e-mail at [email protected].

2021 Professional Services Maturity™ Benchmark
Service Performance Insight (SPI Research) is a global research, consulting and training organization dedicated to helping professional service organizations (PSOs) make quantum improvements in productivity and profit. In 2007, SPI developed the PS Maturity Model™ as a strategic planning and management framework. It is now the industry-leading performance improvement tool used by over 35,000 service and project-oriented organizations to chart their course to service excellence.
SPI provides a unique depth of operating experience combined with unsurpassed analytic capability. We not only diagnose areas for improvement but also provide the business value of change. We then work collaboratively with our clients to create new management processes to transform and ignite performance. Visit www.SPIresearch.com for more information on Service Performance Insight, LLC.
© 2021 Service Performance Insight, LLC www.timelog.dk 185
About Service Performance Insight
R. David Hofferberth, PE, Service Performance Insight founder, managing director and licensed professional engineer has served as an industry analyst, market consultant and product director. He is focused on the services economy, especially productivity and technologies that help organizations perform at their highest capacity.
Dave’s background includes application and analytical tool development to support business decision-making processes. He has more than 30 years of domestic and international information technology experience with firms including the Aberdeen Group and Oracle. Contact Hofferberth at
[email protected] or 239-207-7773.
Jeanne Urich, Service Performance Insight managing director, is a management consultant specializing in improvement and transformation for project- and service-oriented organizations. She has been a corporate officer and leader of the worldwide service organizations of Vignette, Blue Martini and Clarify, responsible for leading the growth of their professional services, education, account management and alliances organizations.
Jeanne is a world-renowned thought-leader, speaker and author on all
aspects of Professional Services. Contact Urich at [email protected] or 650-342-4690.