2021 fortuna advisors buyback roi report
TRANSCRIPT
2021 Fortuna Advisors Buyback ROI ReportA year of financial shock and recovery
JULY 2021
2 0 2 1 F O R T U N A A D V I S O R S B U Y B A C K R O I R E P O R T 2
TABLE OF CONTENTS Letter from the CEO 3
Buybacks in 2020: A Flight to Liquidity 4
The Important Role of Buybacks 7
2020 Buyback Effectiveness is Correlated with 10 Better Organic & Inorganic Capital Deployment
Buyback Timing: No Winning Streak for 2020 12
Buyback ROI by Sector 16
The Role of Buybacks amid Growth in Intangible Investments 18
Concluding Remarks 20
Full List: 2021 Fortuna Advisors Buyback ROI Ranking 21
ABOUT FORTUNA ADVISORS
Fortuna Advisors LLC is a strategy consulting firm that collaborates with corporate leaders to design and implement value-based analytics that improve strategic decisions and align organizational behaviors to deliver superior Total Shareholder Returns.
CONTACT US
Email: [email protected]: 212-248-0881 www.fortuna-advisors.com
Thank you to Chris Moore, Riley Whately, Jason Gould, and Michael Chew of Fortuna Advisors for their contributions to this report.

2 0 2 1 F O R T U N A A D V I S O R S B U Y B A C K R O I R E P O R T 3
It is a straightforward concept: when a company repurchases shares and its subsequent TSR is positive, it produces positive Buyback ROI. In other words, the company has earned a return on its investment in its own shares by retiring them before the market value increase, which is concentrated in fewer shares.
In 2020, the global COVID-19 pandemic was devastating for many businesses that experienced disrupted supply chains, operating shutdowns, government-imposed restrictions and regulations, as well as a general state of fear across the range of stakeholders. And though things were opening up by mid-2021, many businesses are still experiencing the ill-effects of the virus and its residual effects.
Rightly, in the face of such a crisis, companies conserved cash, which meant less buybacks. Indeed, the total dollar amount committed to share repurchases in 2020 dropped to levels not seen since 2016, before the Tax Cuts and Jobs Act of 2017 reduced the tax burden on repatriating foreign earnings. As the economic recovery began to take shape towards the end of 2020, buybacks ticked up, but were still down 27% year over year.
Unlike the prior year, most companies did not achieve a Buyback ROI that exceeded their TSR, meaning their buybacks were poorly timed relative to share price development during the year. Repurchase timing is an overlooked factor in most analyses. We measure “Buyback Effectiveness” as the relative success of a company’s timing in repurchasing shares when the price is below the long-term share price trendline, which results in repurchasing more shares per dollar spent.
Buyback ROI and Buyback Effectiveness are measures of a buyback program’s success, and improving them should be the goal of every CEO, CFO, or Treasurer. They are a sign that management teams are taking active steps to be good stewards of investor capital, rather than just providing an artificial boost to EPS performance by reducing the share count.
Fortuna developed our VIBE (Value-Inspired Buyback Execution) service to help clients achieve better Buyback ROI and Buyback Effectiveness. The VIBE platform provides four objective signals designed to limit the human biases that lead many executives to always believe their shares are undervalued—biases that get in
the way of better buyback timing. VIBE helps companies reap more value from their buyback programs by enabling them to repurchase significantly more shares for the same amount, or to retire the same number of shares while spending less. And this objective, fact-based approach means managers don’t have to justify their rationale for repurchasing shares to investors.
This year we also take note of the increasing role intangible assets play in value creation, and the new considerations they introduce into the buyback discussion. Intangible investments, which tend to be accounted for on the income statement rather than balance sheet, produce different earnings, cash flow, and tax profiles than tangible intensive businesses, which affects how companies should approach their capital allocation decisions and communicate their narrative to investors.
Last, and most important, we at Fortuna wish the very best and a speedy recovery to all whose health and well-being have been directly impacted by the COVID-19 virus. And as for the economy, we likewise hope for a continued strong recovery.
Dear Reader,
Our mission at Fortuna Advisors is to help companies create more value and achieve higher total shareholder return (TSR) by developing new and innovative analytics. In 2011, we developed “Buyback ROI” to compare share repurchases to other capital uses, such as capital expenditures and acquisitions.
Letter from the CEO

$BILLIONS % OF TOTAL ASSETS
0
500
Cash & Equivalents % of Total Assets (RH Axis)
1,000
1,500
2,000
2,500
3,500
3,000
0%
1%
2%
3%
4%
7%
10%
9%
8%
Q1 ‘
16
Q2
‘16
Q3
‘16
Q4
‘16
Q1 ‘
17
Q2
‘17
Q3
‘17
Q4
‘17
Q1 ‘
18
Q2
‘18
Q3
‘18
Q4
‘18
Q1 ‘
19
Q2
‘19
Q3
‘19
Q4
‘19
Q1 ‘
20
Q2
‘20
Q3
‘20
Q4
‘20
FIGURE 2 | Corporate Cash Holdings: 2016–2020Cash Balances Surged in 2020
0
50
100
150
200
250
Q1 ‘
16
Q2
‘16
Q3
‘16
Q4
‘16
Q1 ‘
17
Q2
‘17
Q3
‘17
Q4
‘17
Q1 ‘
18
Q2
‘18
Q3
‘18
Q4
‘18
Q1 ‘
19
Q2
‘19
Q3
‘19
Q4
‘19
Q1 ‘
20
Q2
‘20
Q3
‘20
Q4
‘20
$BILLIONS
FIGURE 1 | Quarterly Buybacks: 2016–20202nd Quarter 2020 Buybacks Plummeted
2 0 2 1 F O R T U N A A D V I S O R S B U Y B A C K R O I R E P O R T 4
Buybacks in 2020: A Flight to LiquidityFor ten years, Fortuna Advisors has advocated for a proactive, value-based approach to share buybacks, starting with the introduction of “Buyback ROI” in our 2011 study. Since then, we have periodically published our Buyback ROI ranking for the S&P 500’s largest share repurchasers. The purpose of our Buyback ROI Reports has been twofold: (1) to show the staggering amounts of capital that have been deployed in repurchases; and (2) to demonstrate how value is created—or in far too many cases destroyed—through share repurchase programs.
After a record buyback year in 2018, 2019 buyback levels fell off only slightly. Q1 2020 was off to another strong start, as companies bought back $194 billion of their own shares, suggesting it would have been another strong year for buybacks, potentially exceeding 2019 levels. Of course, when the Covid-19 pandemic occurred, governments

$BILLIONS
Buybacks Cash Acquisitions Capex Dividends
0
200
400
600
800
2018 2019 2020
-29% -21% -12% -4%
FIGURE 3 | Capital Deployment: 2018–2020All Forms of Capital Deployment Fell in 2020 vs. 2019
2 0 2 1 F O R T U N A A D V I S O R S B U Y B A C K R O I R E P O R T 5
and corporations across the globe responded in unison to control the spread, resulting in a global recession from which many parts of the world and the economy are still working to emerge.
The corporate response was the largest flight to liquidity since the Great Recession of 2008. In Q2 2020, corporate buybacks totaled $88 billion, a 55% drop from Q1 levels, as shown in Figure 1. This was the largest quarterly drop in buyback volume over the last five years.
Companies hoarded cash, with many tapping their revolving credit facilities, as they shifted focus to solvency while assessing and preparing for the impact of the pandemic. In the first two quarters of 2020, cash stockpiles rose by two thirds, from $2.0 trillion to $3.3 trillion, in aggregate, as shown in Figure 2. Cash as a percentage of total assets skyrocketed from 5.9% at the end of 2019 to 9.2% at the end
of Q2–an increase of almost three standard deviations when compared to the last 20 quarters.
Many other forms of capital deployment also plunged, as shown in Figure 3. Capital expenditures fell to $106 billion in Q2, the third lowest quarterly value in the last five years, and cash acquisitions fell to a five-year low of $205 billion for the entire year. Dividends fell only a modest 4% from their 2019 levels. Though discretionary, dividends play an important role in attracting a more stable, income-oriented investor base; and thus are an important signal of a management team’s ability to weather crises.
We did note a muted recovery towards the end of the year, as Q4 2020 buybacks crept up to $127 billion; but this was still well below pre-pandemic levels.
Buybacks declined much more steeply than other forms of capital deployment during 2020.

Time 0
$100.00Buyback
Dividends
Ending Price
Cash Flows
Annualized IRR = Buyback ROI
Q1
$1.00
$1.00
Q2
$1.00
$1.00
Q3
$1.00
$1.00
Q4
$1.00
$110.00
$111.00
14.2%
FIGURE 4 Calculation of Buyback ROI
Buyback Effectiveness = - 1(1 + Buyback ROI)
( 1 + TSR)
FIGURE 5 Calculation of Buyback Effectiveness
2 0 2 1 F O R T U N A A D V I S O R S B U Y B A C K R O I R E P O R T 6
Buyback ROI is calculated as an annualized internal rate of return (IRR) that accounts for: (1) the cash outflows associated with share repurchases; (2) the estimated cash “inflows” of dividends “avoided”; and (3) an estimated final “inflow” related to the final value of the accumulated shares repurchased.
If a company’s share price starts the year at $100, pays a dividend of $1 at the end of each quarter and has a year-end share price of $110, it would have an outflow of $100, $4 of quarterly “inflows,” and a final “inflow” of $110 at the end of the year—resulting in a Buyback ROI of 14.2%, as shown in Figure 4.
While it is easier to achieve a posi-tive Buyback ROI when a company’s TSR is generally increasing, it can also be achieved through effective timing of repurchases.
Buyback Effectiveness measures the value attributable to optimizing the timing of repurchases. It is calculated as the compound differ-ence between Buyback ROI and the company’s TSR, as shown in Figure 5. When Buyback ROI exceeds TSR, a company has executed buybacks when its stock was priced below the long-term trend, on average. When Buyback ROI trails TSR, a company
Fortuna Advisors developed Buyback ROI and Buyback Effectiveness to enable comparison of a company’s share repurchase activity to its other uses of capital. In general terms, when the value of an acquired asset increases, we say it has earned a positive return on investment. Our thinking behind buybacks is similar–when the implied value of a company’s repurchased shares increases over a period, it has earned a positive Buyback ROI.
has executed buybacks above this long-term price trend.
If the company had 16% TSR while generating the 14.2% Buyback ROI described above, it would mean it had negative Buyback Effectiveness due to poor timing. Alternatively, if it had 12% TSR with 14.2% Buyback ROI, it would have benefitted from good timing on its buybacks and positive Buyback Effectiveness.
To improve Buyback Effectiveness, companies should push towards having a real-time perspective on their intrinsic value per share and how that compares to market price per share – they are rarely the same. With the right toolkit and metrics, company Treasurers can build confidence on the best times to execute buybacks.
Fortuna Buyback Metrics Explained

2 0 2 1 F O R T U N A A D V I S O R S B U Y B A C K R O I R E P O R T 7
Companies generally repurchase shares for three reasons. Most repurchases are designed to efficiently return capital to shareholders willing to reduce their ownership in a company in part or in whole and redeploy the capital elsewhere. Such repurchases have the effect of reducing the number of shares outstanding, which concentrates future value creation (or destruction) for remaining shareholders.
Alternatively, companies also repurchase shares in the public market to offset newly issued shares awarded to employees as equity-based compensation. This form of repurchase is intended to reduce the net new shares issued and avoid dilution to existing shareholders that wish to retain their existing level of ownership in a company. In both cases, such repurchases are recorded in companies’ cash flow statements as a purchase of common stock under financing activities.
A third form of repurchase occurs when an employee’s equity-based compensation vests and is therefore treated as taxable income. To meet the company’s obligation to withhold tax on taxable income, companies may net share settle the equity-based compensation awarded to the employee – in effect, they are “repurchasing” shares that had been awarded to the employee, which results in reducing the company’s diluted number of shares outstanding. This payment of the tax obligations related to equity-based compensation is also recorded as a financing activity on the cashflow statement. For the purposes of our study, we do not distinguish between these three forms of repurchase activity.
Regardless of form, we continue to believe repurchases have a rightful place in the capital markets. The role of the capital markets is to move capital from where there is excess supply of capital to where there is an unmet need for capital. Investors and companies are thought of as the two sides of that market, but the investors themselves must first gather the capital that they will then allocate to companies.
This capital can come from places like insurance companies, pension funds, endowments, or family offices that have capital today, but no use for it until some future event. Capital can also come from investors’ prior investments. When an investment has succeeded and produced a return in excess of what can be profitably redeployed within a company, buybacks serve as an efficient method to distribute such excess return through the capital markets to other companies with better growth prospects. Further, we believe restrictions on buybacks would, at best, result in higher dividends, and at worst, slow innovation and breed corporate complacency, as companies have less pressure to be efficient with their capital.
The importance of developing a thoughtful buyback policy took the forefront in 2020. Many companies that bought back billions in stock from 2016 to 2019 had to raise capital to maintain solvency. Opponents of buybacks pointed out that had these companies been more temperate with buybacks in prior years, not only could they have had the financial flexibility to weather the pandemic better in 2020, they would have also been poised to pursue more opportunistic investment. While some headlines in 2020 may have cast a
The Important Role of Buybacks
Once companies have invested in growth and financial flexibility, buybacks can play an important economic role in releasing capital to more productive uses.
shadow over the practice, we believe this should not diminish the important role buybacks play in recycling, and better allocating, capital across markets.
Companies have three primary options when considering how to deploy capital: value creation, financial flexibility, or value distribution. Companies should first consider value-creating growth opportunities that exceed their cost of capital. These can include organic growth, acquisition, or collaborative growth. If no attractive opportunities for growth exist, companies should consider the optimal level of financial flexibility–let 2020 be a reminder of that. Once value creation and financial flexibility are fully evaluated and funded, the last option should be distribution of capital back to shareholders either through dividends or buybacks.

Sources of Capital
Value Creation Financial Flexibility Value Distribution
OrganicGrowth
CollaborativeGrowth
AcquisitiveGrowth
Cash fromOperations
Cash fromFinancing
AttractiveGrowth?
FutureReinvestmentOpportunity?
Cash fromInvesting
DebtRepayment Hold Cash Pension
FundingShare
Repurchase Dividends
Yes No
Yes No
FIGURE 6Hierarchy of Capital Allocation Choices
2 0 2 1 F O R T U N A A D V I S O R S B U Y B A C K R O I R E P O R T 8
When a company decides to distribute capital to investors through buybacks, they should do so systematically, rather than arbitrarily. If companies are allocating capital to repurchase their shares instead of investing in growth, they should apply the same discipline as with any other investment to ensure they are optimizing the “return” they earn. The best way to do this is to compare a company’s intrinsic value per share to the market value per share and repurchase shares when management believes, based on
objective analysis, that their shares are undervalued.
Such valuation signals can be used to indicate when shares are likely undervalued—a good time to execute a repurchase; or when shares are likely overvalued—an excellent time to use those shares as acquisition currency. With these signals in mind, Fortuna has developed a value-inspired buyback execution methodology, or “VIBE,” which helps companies understand their buyback prospects at any point in time.

2 0 2 1 F O R T U N A A D V I S O R S B U Y B A C K R O I R E P O R T 9
The Philosophical Debate Over BuybacksThe debate about whether or not a company should use its capital to buy back stock can be intense. Broad statements in favor or against buybacks lack nuance and the simple recognition that both sides have a similar goal in mind–that the earnings and cashflow of a business be put to good use. The difference comes in how the two sides believe that goal is most likely to be achieved.
Many in the anti-buyback camp believe the optimal allocation of capital, for the good of the company and all its stakeholders, is achieved by companies committing to strengthening their own balance sheets, increasing their employees’ wages, and continually striving for growth. These are all choices a company has for allocating its capital internally, so an anti-buyback philosophy is implicitly an argument that company managers are good allocators of capital–that their reinvestments within the company will lead to incremental value creation for the firm’s employees, stakeholders, and shareholders.
If investors were confident compa-nies could do this effectively, the debate would favor leaving capital at the original company to compound in value through effec-tive reinvestment. For example, a long-term Amazon investor has done much better from the com-pany reinvesting in its business than they would have if Amazon had repurchased that investor’s stock along the way, forcing the investor to find a new use for the capital.
But buyback proponents believe examples like Amazon are all too
rare, and that professional investors tend to be better capital allocators than company managers—thanks both to their dedicated skill sets and to the sharper edge of their results-oriented environment. Professional investors can also more efficiently re-allocate capital within a sector, or from one sector to another, to support secular shifts in the way value is created.
For example, the emergence of Tesla, backed by significant investor capital, has changed the auto industry over the last ten years. For decades, car companies tested electric vehicle concepts, but never committed enough capital internally for electric vehicles to be anything more than a niche product. As recently as 2013-2017, GM spent more on buybacks ($16B) than Tesla spent on its entire capex and R&D budget ($12B). Tesla’s success in reshaping consumer preferences and delivering electric vehicles to meet that demand has made it the most valuable car company in the world. In the last year, most major car companies have committed to transitioning to electric vehicle production in the next 15 years—and have cut their level of buybacks to have the capital to do it. This wouldn’t have happened if professional investors had lacked the resources to shift capital investment within the auto industry. So while the benefits may not materialize at the original company, recycling capital through buybacks can result in better overall economic outcomes.
The question, then, is not really whether buybacks are “good” or “bad,” but whether corporate managers are good or bad at
allocating the capital entrusted to them by their investors, and whether and when they should return that capital. The answer to this question varies by industry and by management team. Indeed, a large part of Fortuna’s practice is helping our corporate clients capture the upside of becoming better investors of their own capital.
The real question is not whether buybacks are “good” or “bad,” but whether corporate managers are good or bad at allocating capital.
For those with a strong view either way on this debate, we would like to understand your perspectives. Please feel free to email us at [email protected] to share your views or suggest a call for a discussion.

Rank
1
2
3
4
5
6
7
8
9
10
Company
Etsy, Inc.
NVIDIA Corporation
ServiceNow, Inc.
Generac Holdings Inc.
Apple Inc.
Teradyne, Inc.
MSCI Inc.
PayPal Holdings, Inc.
KLA Corporation
Copart, Inc.
Buybacks ($ millions)
703
6,540
1,556
253
307,213
1,839
2,946
10,295
2,688
786
Buyback ROI
100.1%
64.5%
60.5%
54.7%
50.6%
50.2%
49.3%
48.6%
48.3%
46.9%
TSR
84.8%
74.5%
44.8%
50.2%
40.3%
43.3%
45.7%
45.3%
33.4%
46.3%
Buyback Effectiveness
16.7%
-7.9%
11.1%
4.3%
11.2%
7.4%
3.6%
4.3%
11.6%
1.6%
Median Top 10
Median of All Ranked Companies
2,263
3,255
50.4%
11.1%
45.4%
13.1%
5.8%
-0.3%
FIGURE 7Top 10 Buyback ROI Companies
2 0 2 1 F O R T U N A A D V I S O R S B U Y B A C K R O I R E P O R T 1 0
2020 Buyback Effectiveness is Correlated with Better Organic & Inorganic Capital DeploymentThere are two determinants of Buyback ROI. One is share price appreciation (or Total Shareholder Return), and the other is timing (or Buyback Effectiveness). For example, in last year’s report, NVIDIA had the highest Buyback ROI, despite negative Buyback Effectiveness. In that report, we showed that if NVIDIA had delivered positive Buyback Effectiveness by better timing as little as one-fifth of their buybacks, they could have bought back an additional 25 million shares (an increase of 34%!) for the same dollar amount. And their TSR would have been expected to rise
an additional 1.4% per year due to the additional reduction to share count.
NVIDIA was second in Buyback ROI this year. But, like last year, they were the only member of the top ten (shown in Figure 7) with negative Buyback Effectiveness.
As another example, consider the performance of ServiceNow, which achieved the third highest Buyback ROI this year. While they delivered Total Shareholder Returns of 44.8%, they created incremental ROI with advantageous timing of repurchase activity, resulting in a Buyback
Effectiveness of 11.1% and Buyback ROI of 60.5%.
In addition to effective management of their repurchase activity, ServiceNow also reinvested significantly in their operations. We measure internal reinvestment with a metric called “Reinvestment Rate”, which is the percentage of reinvestable cash flow available to management (essentially, EBITDA minus tax) that is allocated to internal reinvestment. ServiceNow’s Reinvestment Rate was nearly 100%,

0.13x
9.1%
17.6%0.40x
5-Yr Reinvestment Effect. 5-Yr Annualized TSR
Below-MedianBuyback Effect.
Above-MedianBuyback Effect.
Below-MedianBuyback Effect.
Above-MedianBuyback Effect.
3.1x 1.9x
FIGURE 8Buyback Effectiveness Relationship to Reinvestment Effectiveness and TSR
NOTE Reinvestment Effectiveness is calculated as the change in revenue over a period divided by the incremental capital invested during a period.
2 0 2 1 F O R T U N A A D V I S O R S B U Y B A C K R O I R E P O R T 1 1
which is 40% higher than the median company in our report.
Not only did the company invest aggressively in its business, it also invested effectively. We can quantify this aspect using a measure we call Reinvestment Effectiveness, which tracks the incremental revenue generated per dollar of incremental capital invested over the same period. ServiceNow’s Reinvestment Effectiveness was 0.86x, nearly four times higher than the median company in the report.
There is a strong relationship in fact between companies that create value through internal reinvestment
and that create value through their repurchase programs. Companies that achieved above-median Buyback Effectiveness also had median Reinvestment Effectiveness that was nearly four times higher than companies that delivered below-median Buyback Effectiveness, as shown in Figure 8. The combined success of capital allocation to internal reinvestment and to share purchases relates to stronger value creation, with the above-median Buyback Effectiveness group achieving 8.5% higher annualized TSR.
Companies with above-median Buyback Effectiveness generated 3x more revenue per dollar invested and nearly 2x better Total Shareholder Returns.

-20%
-5%
-4%
-3%
-8%
-7%
-6%
-2%
-1%
1%
2%
3%
0%
CO
MM
UN
ICA
TIO
N S
ERV
ICES
CO
NSU
MER
STA
PLES
CO
NSU
MER
DIS
CRE
TIO
NA
RY
HEA
LTH
CA
RE
MA
TERI
ALS
INFO
RMA
TIO
N T
ECN
OLO
GY
IND
UST
RIA
LS
FIN
AN
CIA
LS
REA
L ES
TATE
UTI
LITI
ES
CHANGE INBUYBACKEFFECTIVENESS(2019-2020)
WIDTH = TOTAL BUYBACKS OVER 5 YEARS 100% = $3.0 TRILLION
ENER
GY
FIGURE 10 | Change in Buyback Effectiveness by Sector (2019-2020)IT, Financials, and Energy drove the decline in Buyback Effectiveness since 2019
-5.00%
-4.00%
-3.00%
-2.00%
-1.00%
0.00%
1.00%
2016
-4.30%
-2.50%
2017
-0.60%
2019
-0.25%
2020
-1.30%
2018
FIGURE 9 | Buyback Effectiveness: 2016-2020Buyback Effectiveness Dropped for the First Time in Four Years
2 0 2 1 F O R T U N A A D V I S O R S B U Y B A C K R O I R E P O R T 1 2
Buyback Timing: No Winning Streak for 2020As we stated, most companies overlook the importance of timing and relative valuation when determining their buyback plans. As a result, in nearly every year since our creation of Buyback ROI, median Buyback Effectiveness has been negative. The trend had been improving over the last four years, and for the first time in 2019, more companies had positive Buyback Effectiveness than negative. Unfortunately, many companies reverted to negative Buyback Effectiveness in 2020; and as seen in Figure 9, the median Buyback Effectiveness dropped to -0.25%. There are still many examples of companies that did time their repurchases to correspond to relative undervaluation of their shares – in this study, 169 of 359 companies had positive Buyback Effectiveness.
-5.00%
-4.00%
-3.00%
-2.00%
-1.00%
0.00%
1.00%
2016
-4.30%
-2.50%
2017
-0.60%
2019
-0.25%
2020
-1.30%
2018The financial and tech sectors, which together accounted for almost 50% of total buybacks, were key contributors to the decline in Buyback Effectiveness in the past year (see Figure 10). Median
Buyback Effectiveness for financials dropped by 3.6 percentage points, from 0.6% to -3.0%; while tech saw a decline of 1.3 percentage points. Fully 70 companies in these two sectors

Rank
1
2
3
4
5
6
7
8
9
10
Company
Lennar Corporation
Etsy, Inc.
DaVita Inc.
T-Mobile US, Inc.
Chipotle Mexican Grill, Inc.
Newell Brands Inc.
D.R. Horton, Inc.
Tractor Supply Company
QUALCOMM Incorporated
KLA Corporation
Buybacks ($ millions)
1,192
703
6,435
22,062
1,594
1,745
1,182
1,942
32,091
2,688
Buyback ROI
32.9%
100.1%
23.1%
43.9%
32.8%
-0.0%
35.7%
25.3%
41.0%
48.3%
TSR
10.2%
84.8%
11.0%
28.1%
23.6%
-10.3%
18.0%
12.0%
29.4%
33.4%
Buyback Effectiveness
20.8%
16.7%
15.2%
14.0%
14.0%
13.3%
13.1%
12.8%
12.3%
11.6%
FIGURE 11Top 10 Buyback Effectiveness Companies — Last 5 Years
2 0 2 1 F O R T U N A A D V I S O R S B U Y B A C K R O I R E P O R T 1 3
had negative Buyback Effectiveness. In total, five sectors saw declines in median Buyback Effectiveness while six sectors saw improvements.
The Top 10 Buyback Effectiveness Companies in Figure 11 suggests that companies in any sector can achieve success in executing repurchases while their shares are relatively undervalued. Lennar Corporation and D.R. Horton are homebuilders. Etsy and Newell Brands make consumer goods. Qualcomm and KLA operate in the semiconductor and wireless sectors. By luck or by skill, management in any industry should be able to develop a view on the intrinsic value of their shares and recognize capital market signals that suggest better or worse times to execute buybacks.
Even companies that deliver negative TSR can find ways to execute repurchases while their shares are relatively undervalued. In last year’s report, we highlighted Hess Corporation, who ranked in the Top
10 for Buyback Effectiveness despite negative TSR; this year Newell Brands overcame its poor TSR performance to rank 6th through impressive Buyback Effectiveness of 13.3%. Congrats to the treasury department and management team at Newell Brands!

Bottom Quartile 3rd Quartile Top Quartile2nd Quartile
4 4
6
8
FIGURE 13 | Median Number of Buyback Opportunity Quarters
NOTE A buyback opportunity quarter exists when a company reported repurchases during a quarter and when the average share price for that quarter was below the long-term price trend line.
4th Quartile 3RD Quartile Top Quartile2nd Quartile
73%
27%
61%
39%
47%
53%
30%
70%
Positive Buyback Eff. Negative Buyback Eff.
FIGURE 12 | Split of Buyback Effectiveness by TSR QuartileBuyback Effectiveness by TSR Quartile
2 0 2 1 F O R T U N A A D V I S O R S B U Y B A C K R O I R E P O R T 1 4
Half of the top Buyback Effectiveness companies generated top-quartile TSR, suggesting a relationship between TSR quartile and Buyback Effectiveness, which we see in Figure 12. When a company’s share price is generally rising, it is easier to execute a repurchase below trend, thus creating incremental Buyback ROI from the repurchase. In our study, 70% of top quartile TSR companies that repurchased shares, achieved positive Buyback Effectiveness with those repurchases.
By contrast, only 27% of 4th quartile TSR companies were able to achieve positive Buyback Effectiveness. An underperforming share price can seem like an attractive time to repurchase shares, but for most this is a subpar value creation strategy. For an underperforming company, the repurchase only serves to leverage that underperformance onto a more concentrated shareholder base.
For companies delivering below median TSR, it is even more critical that they develop a value-inspired buyback policy in order to optimize their repurchase timing. Figure 13 displays the median number of quarters over the last five years during which a company in each TSR quartile could have executed share repurchases and achieved positive Buyback Effectiveness. Companies in the 4th TSR quartile had only 4 quarters (or a 1 in 5 chance) of an attractive buyback opportunity. Companies in the Top TSR quartile had double the number of opportunities.

Q1 ‘
16
Q2
‘16
Q3
‘16
Q4
‘16
Q1 ‘
17
Q2
‘17
Q3
‘17
Q4
‘17
Q1 ‘
18
Q2
‘18
Q3
‘18
Q4
‘18
Q1 ‘
19
Q2
‘19
Q3
‘19
Q4
‘19
Q1 ‘
20
Q2
‘20
Q3
‘20
Q4
‘20
0
1,000
Buyback Amount Average Share Price
2,000
3,000
4,000
5,000
7,000
8,000
9,000
6,000
0
200
400
600
800
1,000
1,400
1,600
1,800
1,200
Constant Share Price Trend
ALPHABET SHARE PRICE ($)
BUYBACKAMOUNT($ BILLIONS)
FIGURE 14 | Alphabet Inc. Buyback EffectivenessHow Alphabet Inc. Achieved Strong Buyback Effectiveness
2 0 2 1 F O R T U N A A D V I S O R S B U Y B A C K R O I R E P O R T 1 5
Google’s parent, Alphabet Inc., shows how a company can achieve positive Buyback Effectiveness with an upward trending share price. Figure 14 shows Alphabet’s buybacks by quarter as well as their average share price for that quarter and their constant share price trend. We can see Alphabet’s share repurchases increasing during the period when the average share price line drops below the constant share price trend. During those quarters, Alphabet achieved positive Buyback Effectiveness of 4.5%, which contributed to their Buyback ROI of 23.1%.
Case Study: Alphabet's Buyback Effectiveness
2 0 2 1 F O R T U N A A D V I S O R S B U Y B A C K R O I R E P O R T 1 6
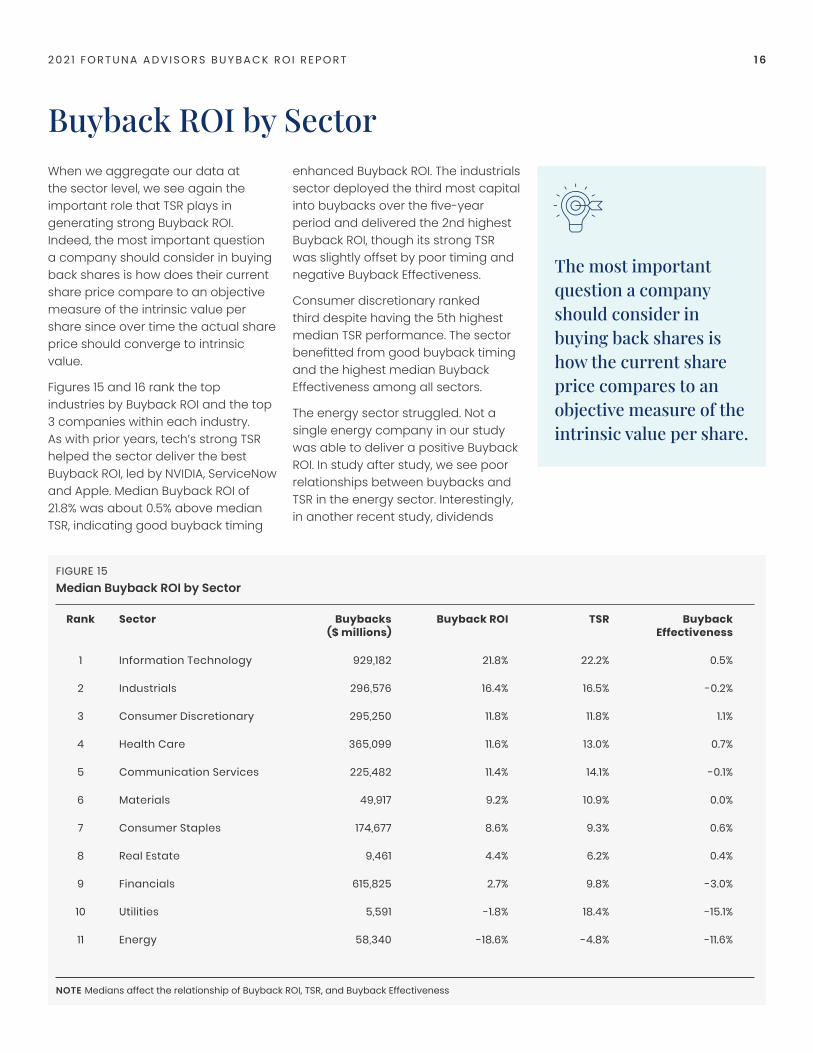
Buyback ROI by SectorWhen we aggregate our data at the sector level, we see again the important role that TSR plays in generating strong Buyback ROI. Indeed, the most important question a company should consider in buying back shares is how does their current share price compare to an objective measure of the intrinsic value per share since over time the actual share price should converge to intrinsic value.
Figures 15 and 16 rank the top industries by Buyback ROI and the top 3 companies within each industry. As with prior years, tech’s strong TSR helped the sector deliver the best Buyback ROI, led by NVIDIA, ServiceNow and Apple. Median Buyback ROI of 21.8% was about 0.5% above median TSR, indicating good buyback timing
enhanced Buyback ROI. The industrials sector deployed the third most capital into buybacks over the five-year period and delivered the 2nd highest Buyback ROI, though its strong TSR was slightly offset by poor timing and negative Buyback Effectiveness.
Consumer discretionary ranked third despite having the 5th highest median TSR performance. The sector benefitted from good buyback timing and the highest median Buyback Effectiveness among all sectors.
The energy sector struggled. Not a single energy company in our study was able to deliver a positive Buyback ROI. In study after study, we see poor relationships between buybacks and TSR in the energy sector. Interestingly, in another recent study, dividends
Rank
1
2
3
4
5
6
7
8
9
10
11
Sector
Information Technology
Industrials
Consumer Discretionary
Health Care
Communication Services
Materials
Consumer Staples
Real Estate
Financials
Utilities
Energy
Buybacks ($ millions)
929,182
296,576
295,250
365,099
225,482
49,917
174,677
9,461
615,825
5,591
58,340
Buyback ROI
21.8%
16.4%
11.8%
11.6%
11.4%
9.2%
8.6%
4.4%
2.7%
-1.8%
-18.6%
TSR
22.2%
16.5%
11.8%
13.0%
14.1%
10.9%
9.3%
6.2%
9.8%
18.4%
-4.8%
Buyback Effectiveness
0.5%
-0.2%
1.1%
0.7%
-0.1%
0.0%
0.6%
0.4%
-3.0%
-15.1%
-11.6%
FIGURE 15Median Buyback ROI by Sector
The most important question a company should consider in buying back shares is how the current share price compares to an objective measure of the intrinsic value per share.
NOTE Medians affect the relationship of Buyback ROI, TSR, and Buyback Effectiveness

SectorInformation TechnologyIndustrialsConsumer DiscretionaryHealth CareCommunication ServicesMaterialsConsumer StaplesReal EstateFinancialsUtilitiesEnergy
CompanyNVIDIA CorporationGenerac Holdings Inc.Etsy, Inc.IDEXX Laboratories, Inc.T-Mobile US, Inc.Ball CorporationCostco Wholesale CorporationSBA Communications CorporationMSCI Inc.Evergy, Inc.Hess Corporation
Buyback ROI64.5%54.7%100.1%42.0%43.9%35.0%28.4%26.8%49.3%-0.2%-6.1%
#1 in Sector
SectorInformation TechnologyIndustrialsConsumer DiscretionaryHealth CareCommunication ServicesMaterialsConsumer StaplesReal EstateFinancialsUtilitiesEnergy
CompanyServiceNow, Inc.Copart, Inc.Pool CorporationAlign Technology, Inc.Take-Two Interactive Software, Inc.The Sherwin-Williams CompanyThe Estée Lauder Companies Inc.American Tower Corporation (REIT)S&P Global Inc.NRG Energy, Inc.Cabot Oil & Gas Corporation
Buyback ROI60.5%46.9%42.2%
41.1%27.6%32.6%28.0%21.8%
30.4%-3.3%
-10.0%
#2 in Sector
SectorInformation TechnologyIndustrialsConsumer DiscretionaryHealth CareCommunication ServicesMaterialsConsumer StaplesReal EstateFinancialsUtilitiesEnergy
CompanyApple Inc.Old Dominion Freight Line, Inc.D.R. Horton, Inc.Thermo Fisher Scientific Inc.Charter Communications, Inc.FMC CorporationWalmart Inc.Weyerhaeuser CompanyMoody's Corporation-Valero Energy Corporation
Buyback ROI50.6%45.2%35.7%35.3%26.0%27.6%22.7%4.4%
28.9%-
-10.4%
#3 in Sector
FIGURE 16Top Buyback ROI Companies by Sector
2 0 2 1 F O R T U N A A D V I S O R S B U Y B A C K R O I R E P O R T 1 7
showed a positive relationship to TSR in Oil & Gas Equipment & Services, despite the negative relationship between TSR and buybacks. Both dividends and buybacks involve the distribution of capital out of an industry facing stiff headwinds, but dividends avoid the timing risk that buybacks face, suggesting companies in this industry tend to buy back more shares when the price is high than when it’s low.

2 0 2 1 F O R T U N A A D V I S O R S B U Y B A C K R O I R E P O R T 1 8
The Role of Buybacks amid Growth in Intangible InvestmentsAs we’ve stated in this report, buybacks are one of several capital allocation choices available to managers. When there are attractive opportunities for growth, managers should allocate capital to them. Companies lacking such opportunities should evaluate their need for financial flexibility, and only then return capital to shareholders who can reinvest it in other companies with better prospects.
While this prioritization is simple in concept, it can be challenging in practice. What constitutes an “attractive opportunity for growth” can be hard to judge. In the face of uncertainty, it can be easier to return capital to shareholders, thereby reducing share count and boosting EPS, than to risk it on uncertain investments in growth.
This difficulty is compounded by the fact that how companies invest in growth is changing. Growth investment once meant capital expenditure and perhaps working capital—balance sheet items that reflected the belief that growth meant increasing a company’s asset base to serve new customers. But today, growth comes primarily through intangible, rather than tangible, investments. In 1979, tangible investments were 1.7x the size of intangible investments, but since then the share of US non-farm investment comprised of intangibles has steadily increased, while tangibles have decreased. Today, intangible
investment is around 1.5x tangible investment.1
This has profound implications for companies considering a value-inspired buyback program. From an accounting perspective, intangible investment is typically recorded as an expense on the income statement, so an increase in intangible investment may be recorded as a 100% deduction to current earnings. When investment is recorded as an asset on the balance sheet, only the scheduled depreciation of the balance sheet asset is deducted. This means that, all else equal, building an intangible asset tends to initially depress earnings relative to tangible assets—see, for example, the long history of Amazon showing little to no accounting earnings.
The accounting treatment of intangibles increases the burden on companies to develop a compelling value-creation narrative for investors. They must convince investors first that the investment in intangibles will lead to stronger future earnings and cash flow, and then that this will produce a better ROI than returning capital to shareholders. When done effectively, equity investors will look through the accounting treatment and value intangible-intensive businesses at a higher multiple of earnings than tangible-intensive ones. The success of developing this narrative and improving valuation impacts TSR and thus Buyback ROI.
The growing role of intangible investments has a profound impact on how companies manage buybacks.
1 Mauboussin, M., & Callahan, D. (2020, September 15). One Job: Expectations and the Role of Intangible Investments. Morgan Stanley.https://www.morganstanley.com/im/publication/insights/articles/articles_onejob.pdf
2 0 2 1 F O R T U N A A D V I S O R S B U Y B A C K R O I R E P O R T 1 9
Companies that deliver on their intangible investments can turn into cash-generating machines. The initial cash expense to develop a new pharmaceutical drug, software application, or customer relationship can be significant. But when companies succeed in building these assets, the cost and capital intensity to commercialize them can be much lower. In the case of software specifically, marginal costs of production are often modelled as approaching zero, even if this is not strictly true in reality.
A tangible-asset-intensive business looks to build assets and reduce expenses to monetize those assets: build a factory and minimize the cost of labor to produce goods in that factory, for example. With an intangible-asset-intensive business, the approach is reversed: build a team of computer engineers to develop a software application and minimize the cost of assets needed to produce and commercialize it. This lower capital intensity of commercialization is why we see technology, pharma, and financial services companies among the most significant users of buybacks.
Credit investors and lenders also evaluate intangible-intensive businesses differently. While a strong narrative may support higher equity valuations, credit investors will emphasize downside protection, should the narrative never materialize. To address this, intangible-intensive businesses with a lower ratio of tangible asset value to market value will need to hold a greater level of cash on their balance sheets than tangible-intensive businesses.
As investment has shifted from tangible to intangible investment since the 1970s, there has been a strongly correlated increase (R2 of 0.77) in the level of cash on balance sheets relative to assets.2 Increased cash on the balance sheet can attract the attention of activists, so intangible-intensive businesses need to work hard to calibrate the level of cash needed to maintain credit capacity and defend it from those that would like it allocated to more immediate uses.
Intangible intensive companies thus have a different set of considerations as they evaluate and optimize their buyback programs, which include:
1. How will intangible investments convert to future value creation, and how does this compare to the ROI of repurchases?
2. What is the narrative on which equity investors can build a valuation case for intangible investment? Is this better than investors’ next-best use of that capital?
3. What is the appropriate level of cash to hold on the balance sheet to serve as collateral for borrowing? And how should a company defend the level of cash to activists that may want that cash allocated to reinvestment or returned to shareholders?
2 Falato, Antonio and Kadyrzhanova, Dalida and Sim, Jae W. and Steri, Roberto, Rising Intangible Capital, Shrinking Debt Capacity, and the US Corporate Savings Glut (December 11, 2020). Journal of Finance, Forthcoming, Available at SSRN: https://ssrn.com/abstract=3198030 or http://dx.doi.org/10.2139/ssrn.3198030
The accounting treatment of intangibles increases the burden on companies to develop a compelling value-creation narrative for investors.

2 0 2 1 F O R T U N A A D V I S O R S B U Y B A C K R O I R E P O R T 2 0
Concluding RemarksOur study suggests that with the right tools and analytical approach, companies in any sector can achieve strong Buyback ROI. The allocation of capital to share repurchases should be treated with the same duty of care as all major capital allocation decisions. Buyback ROI presents a framework for companies to measure share repurchase performance relative to other capital allocation choices. Value-inspired buyback execution (VIBE) provides companies with a tool to improve Buyback ROI through objective signals on when shares are undervalued in the market compared to intrinsic value.
We hope that, as attitudes about buybacks evolve, companies will continue to embrace careful and comprehensive planning for buybacks, as they would with any substantial capital outlay. Better-informed buyback programs can lead the way to more value creation for all stakeholders, and to a better overall allocation of resources across the economy.

2 0 2 1 F O R T U N A A D V I S O R S B U Y B A C K R O I R E P O R T 2 1
Rank
123456789101112131415161718192021222324252627282930313233343536
37383940414243444546474849505152
5354555657585960
Rank
616263646566676869707172737475767778798081828384858687888990919293949596
979899100101102103104105106107108109110111112
113114115116117118119120
Company Name
EtsyNVIDIA ServiceNowGenerac HoldingsAppleTeradyneMSCIPayPal HoldingsKLA CopartLam Research Cadence Design SystemsOld Dominion Freight LineT-Mobile USAdobeSynopsysPool IDEXX LaboratoriesAlign TechnologyQUALCOMMMicrosoft FortinetAutodeskCintas Quanta ServicesANSYSD.R. HortonThermo Fisher ScientificBall Intuitive SurgicalDeere & CompanyZoetisQorvoLennar Chipotle Mexican GrillThe Sherwin-Williams CompanyIntuitDollar General MastercardTarget S&P GlobalTrane TechnologiesBest BuyBroadcomMoody's Mettler-Toledo InternationalSTERISUnited RentalsCostco Wholesale The Estée Lauder CompaniesNIKETake-Two Interactive SoftwareFMC XilinxMicron TechnologyAbbott LaboratoriesEdwards Lifesciences Domino's PizzaAgilent TechnologiesSBA Communications
Company Name
CDW Applied MaterialsVerisk AnalyticsCharter CommunicationsLindeTexas InstrumentsKansas City SouthernLowe's CompaniesTractor Supply CompanyIHS MarkitVisaCumminsFacebookAMETEKLeidos HoldingsHologicAlphabetDaVitaMaxim Integrated ProductsSkyworks SolutionsGlobal PaymentsMotorola SolutionsWalmartNorfolk Southern AccentureAnalog DevicesPulteGroupT. Rowe Price GroupThe Home DepotAmerican TowerParker-Hannifin BlackRockUnitedHealth GroupNXP SemiconductorsEaton Broadridge Financial SolutionsStarbucks IQVIA HoldingsEli Lilly and CompanyJacobs Engineering GroupVeriSignIDEX eBayHumanaUnion Pacific Dover Varian Medical SystemsCSX Avery Dennison Church & DwightNVRThe Procter & Gamble CompanyW.W. GraingerThe Clorox CompanyRockwell AutomationNasdaqMasco Brown-Forman Illinois Tool WorksTrimble
Total Buybacks
($ millions)
7036,5401,556
253307,213
1,8392,946
10,2952,688
7869,8342,362
90722,06212,0162,087
6111,4911,171
32,09185,832
2,3493,2401,9788441,3211,182
5,5102,0023,2553,417
2,3802,5471,192
1,5943,838
3,3156,244
23,6659,2446,4853,167
5,52214,7112,9722,925
3112,5572,9973,98416,912
940
6972,881
2,9051,9983,110
2,9942,5563,568
Total Buybacks
($ millions)
2,56611,463
1,71035,766
5,35715,3012,48619,1081,942
4,43538,328
4,28137,690
7281,0561,792
67,1596,4351,823
3,4201,718
2,38432,346
8,13413,6111,5252,2934,280
32,5991,0752,0338,627
17,0308,912
5,6351,204
23,2896,52511,6101,4953,482
47318,6197,451
24,8521,393
93711,937
1,2131,5502,793
29,124
3,2111,700
3,5621,384
2,9891,187
7,206806
Buyback ROI
100.1%64.5%60.5%54.7%50.6%50.2%49.3%48.6%48.3%46.9%46.2%45.3%45.2%43.9%43.2%42.2%42.2%42.0%
41.1%41.0%
39.9%38.9%37.4%36.4%36.2%35.7%35.7%35.3%35.0%34.5%33.5%33.4%33.0%32.9%32.8%32.6%
32.5%32.5%
31.1%31.0%
30.4%30.2%30.0%28.9%28.9%28.8%28.7%28.4%28.4%28.0%27.6%27.6%
27.6%27.4%27.2%27.1%27.1%
27.0%26.9%26.8%
Buyback ROI
26.7%26.4%26.3%26.0%25.7%25.6%25.4%25.3%25.3%24.0%23.8%23.7%23.6%23.4%23.4%23.3%23.1%23.1%
22.9%22.9%22.9%22.7%22.7%22.4%22.2%22.2%22.1%22.1%
22.0%21.8%21.6%21.6%21.4%21.3%21.3%21.3%
21.2%21.1%21.1%21.1%21.1%21.1%
21.0%21.0%
20.6%20.6%20.4%20.4%20.0%20.0%19.9%19.7%
19.7%19.7%19.6%19.5%19.3%19.3%18.7%18.6%
Buyback Effectiveness
16.7%-7.9%
11.1%4.3%11.2%7.4%3.6%4.3%11.6%1.6%1.8%3.7%5.8%
14.0%2.3%4.1%4.7%-1.7%
-4.4%12.3%3.6%8.0%1.5%3.2%8.7%4.9%13.1%4.9%9.7%
-0.1%3.5%2.6%7.6%
20.8%14.0%7.3%
1.4%4.2%2.0%8.1%0.1%1.4%
-1.2%0.5%3.8%0.7%5.2%3.6%5.9%2.8%9.3%
-8.2%
-0.7%2.1%
-2.5%4.1%
0.8%-3.0%
1.9%3.7%
Buyback Effectiveness
0.5%-6.8%
4.4%0.4%4.6%
-0.3%5.7%5.2%
12.8%2.4%1.3%
2.0%1.6%6.2%0.8%9.5%4.5%15.2%
3.1%7.2%0.1%1.0%
0.4%-1.5%
1.9%1.5%1.2%
3.8%2.2%0.4%
-0.2%3.6%
-3.2%8.2%1.2%
-1.5%
8.7%1.1%
5.2%0.3%1.2%
-0.4%6.4%
1.1%-0.4%-0.6%
0.4%-6.0%-0.4%
2.3%-0.5%
3.0%
3.0%5.4%-1.2%-0.1%3.3%3.8%
-1.4%-3.2%
Full List: 2021 Fortuna Advisors Buyback ROI Ranking

2 0 2 1 F O R T U N A A D V I S O R S B U Y B A C K R O I R E P O R T 2 2
Rank
121122123124125126127128129130131132133134135
136
137138139140
141142143144145146
147148149150151152153154155156
157158159160161162163164165166167168169170171172
173174175176177
178179180181182183
Rank
184185186187188189190191192193194195196
197198
199200201
202203204
205206207208
209210211212213214215216217218219220
221222223224225226227228229
230231232233234235236237238239240241242243244245246
Company Name
Amphenol NortonLifeLockSeagate TechnologyCaterpillarAkamai TechnologiesUnited Parcel ServiceO'Reilly AutomotiveIntercontinental ExchangeAptivFiservHCA HealthcareStryker Ameriprise FinancialWaste ManagementFidelity National Information ServicesExpeditors International of WashingtonEcolabRepublic ServicesTE ConnectivityFortune Brands Home & SecurityHoneywell InternationalIlluminaMcDonald's Monster Beverage AonMarsh & McLennan CompaniesMorgan StanleyAutomatic Data ProcessingAnthemAutoZoneCelanese Jack Henry & AssociatesCitrix SystemsStanley Black & DeckerCarMaxWillis Towers Watson Public CompanyThe TJX CompaniesFedEx Berkshire HathawayThe Hershey CompanyYum! BrandsJ.B. Hunt Transport ServicesCorningElectronic ArtsAssurantAmgenRoss StoresQuest DiagnosticsMartin Marietta MaterialsDarden RestaurantsComcast Johnson Controls InternationalV.F. AbbVieOracle PepsiCoLaboratory of America HoldingsLockheed Martin Mondelez InternationalPPG IndustriesAmerican Express CompanyThe Walt Disney CompanyAllegion
Company Name
Hilton Worldwide HoldingsWhirlpool MedtronicFLEETCOR TechnologiesMerck &PentairC.H. Robinson WorldwideEmerson ElectricAlbemarle Raymond James FinancialSysco AmcorColgate-Palmolive CompanyHPArcher-Daniels-Midland CompanyJohnson & JohnsonJPMorgan Chase &Cognizant Technology Solutions Cerner The Coca-Cola CompanyEastman Chemical CompanyKimberly-Clark Baxter InternationalNorthrop Grumman Bristol-Myers Squibb CompanyA. O. Smith AmerisourceBergen The Western Union CompanyRegeneron PharmaceuticalsGlobe LifeMcKesson Discover Financial ServicesRobert Half InternationalThe Allstate General Motors CompanyWaters International Paper CompanyCigna PfizerRegions Financial The KrogerNetAppThe Goldman Sachs GroupGartnerThe Charles Schwab The PNC Financial Services GroupSnap-onF5 NetworksGenuine Parts CompanyWeyerhaeuser CompanyEverest Re Group,Capital One Financial Intel General MillsThe Travelers CompaniesLyondellBasell Industries N.V.Constellation BrandsAlexion PharmaceuticalsAflacBooking HoldingsRaytheon Technologies Cisco SystemsFifth Third Bancorp
Total Buybacks
($ millions)
3,1223,3473,8868,9752,3466,7378,912
5,2652,168
5,9077,8041,378
8,2063,3022,014
2,206
2,1762,2504,7641,676
17,0822,176
26,9485,2597,9972,936
21,6355,051
8,4897,3302,876
4734,786
9842,9431,947
7,6184,630
30,9021,880
10,8071,049
9,9835,1531,971
35,6844,3062,1406841,194
17,14510,006
3,48621,06485,92112,588
1,803
7,3349,6653,759
16,29718,092
647
Total Buybacks
($ millions)
4,6102,697
10,6553,094
22,6001,0051,259
3,6997941,314
5,160866
6,650
11,2232,110
31,17274,993
7,530
3,6749,9021,283
3,9503,6544,89811,866
8244,3282,2097,6281,6898,5418,1701,198
8,6077,182
4,6391,487
9,23531,063
4,1617,198
5,66929,451
7363,220
12,588
1,1052,008
6332,429
8067,112
45,2042,315
7,4539,4142,8821,9067,24018,3014,19451,1155,482
Buyback ROI
18.2%18.2%18.2%18.1%
18.0%17.7%17.7%17.6%17.6%17.4%16.9%16.9%16.7%16.6%16.5%
16.5%
16.4%16.4%16.2%16.0%
16.0%15.9%15.9%15.8%15.6%15.6%
15.4%15.4%14.8%14.7%14.6%14.6%14.4%14.3%14.1%
14.0%
14.0%14.0%13.7%13.6%13.6%13.4%13.3%12.9%12.8%12.8%12.8%12.3%12.2%11.9%11.9%11.7%
11.7%11.6%11.5%11.5%11.4%
11.4%11.1%11.1%
10.9%10.8%10.8%
Buyback ROI
10.5%10.4%10.4%10.1%9.9%9.8%9.6%9.5%9.5%9.1%
8.9%8.8%8.8%
8.7%8.5%
8.3%8.3%8.2%
8.0%8.0%8.0%
7.9%7.9%7.9%7.6%
7.2%7.1%
6.9%6.7%6.7%6.7%6.6%6.6%6.4%6.4%6.2%5.6%
5.5%5.5%5.3%5.1%
5.0%4.9%4.8%4.8%4.6%
4.6%4.6%4.5%4.4%4.2%4.0%3.9%3.6%3.6%3.4%3.3%3.1%
3.0%2.7%2.7%2.7%2.5%
Buyback Effectiveness
-0.9%-0.1%3.0%
-4.1%6.1%3.1%
5.3%0.4%6.0%
-0.6%0.3%
-2.8%3.4%
-2.5%-1.3%
1.3%
2.7%-2.5%
2.2%4.0%
-1.0%1.2%
-1.1%3.6%
-2.2%-1.9%
1.0%-0.9%-3.5%5.5%
-0.6%-2.1%-1.6%
1.1%3.3%0.6%
1.1%0.3%2.9%0.4%
-2.4%0.3%
-3.5%-0.1%0.8%1.6%
-3.2%-2.3%-0.6%-3.5%-0.0%
5.7%
3.6%-3.6%0.4%0.8%0.5%
-2.3%3.7%2.5%0.3%4.1%
-1.2%
Buyback Effectiveness
-4.9%2.8%0.1%
-1.5%-1.8%0.9%
-0.2%-3.0%-8.8%-1.4%
-4.3%1.3%1.7%
-4.7%0.7%
-2.3%-5.5%
3.8%
3.7%0.5%
-0.9%
1.4%-8.5%-4.1%6.2%
-2.1%4.8%0.2%6.8%
-2.7%8.4%-1.8%0.9%
-4.8%0.1%
-5.2%-1.8%
-1.8%-1.5%
-6.0%7.0%
-8.0%-0.5%-4.9%-3.6%-4.6%
2.3%-2.3%-0.9%
0.6%-2.1%-0.1%
-6.0%-1.0%-1.7%1.4%
-5.0%9.6%
-4.8%-4.8%-2.7%-8.2%-5.4%

2 0 2 1 F O R T U N A A D V I S O R S B U Y B A C K R O I R E P O R T 2 3
Rank
247248249250
251252253254255256257258259260261262263264265266267268269270271
272
273274275276277278279
280281282283284285286287288289290291292293294295296297298299300301302303304305306307
308309310311
Rank
312
313314315316317318319320321
322323324325326327328329330331332333334335336337338339340341342343344345346347348349350351352353354
355356357358359
Company Name
Truist Financial HasbroBank of America The Interpublic Group of CompaniesChubbWestRock CompanyConagra BrandsMarriott InternationalLeggett & PlattNorthern Trust BorgWarnerKellogg CompanyMetLifeState Street Sealed Air Advance Auto PartsHenry ScheinUniversal Health ServicesUlta BeautyThe J. M. Smucker CompanyNewell BrandsEvergyTyson Foods3M CompanyThe Hartford Financial Services GroupWestinghouse Air Brake Technologies Expedia GroupCitizens Financial GroupSynchrony FinancialThe Boeing CompanyPrincipal Financial GroupCampbell Soup CompanyInternational Business Machines Las Vegas SandsGeneral Dynamics Nucor Cardinal HealthDiscoveryNRG EnergyDENTSPLY SIRONAThe Mosaic CompanyJuniper NetworksThe GapCVS Health U.S. BancorpPrudential FinancialGilead SciencesBiogenTapestryCitigroupSouthwest AirlinesThe Bank of New York Mellon KeyCorpHanesbrandsMohawk IndustriesHess MGM Resorts InternationalCboe Global MarketsL BrandsHuntington BancsharesHewlett Packard Enterprise CompanyLincoln National FLIR SystemsOmnicom GroupDelta Air Lines
Company Name
Zions Ban, National AssociationTextronHuntington Ingalls IndustriesLoews Altria GroupHost Hotels & ResortsRalph Lauren InvescoDuPont de NemoursAmerican International GroupFranklin ResourcesCabot Oil & Gas M&T Bank Valero Energy Royal Caribbean GroupPVHViacomCBSAT&TLumen TechnologiesComericaPhillips 66CF Industries HoldingsUnited Airlines HoldingsMarathon Petroleum Western Digital ConocoPhillipsPerrigo CompanyUnum GroupAlaska Air GroupExxon Mobil Walgreens Boots AllianceChevron Nielsen HoldingsGeneral Electric CompanySimon Property GroupWells Fargo & CompanyAmerican Airlines GroupViatrisCarnivalNOVSchlumbergerHollyFrontier Norwegian Cruise Line HoldingsDevon Energy DXC Technology CompanyMarathon Oil Diamondback EnergyOccidental Petroleum
Total Buybacks
($ millions)
3,424792
73,189856
3,898610
1,9839,454
4953,259
8541,482
10,7275,728
2,1191,3001,914
2,0922,1501,3921,7452,6723,320
12,4662,502
451
2,8603,8368,44428,791
1,757659
14,710
2,0346,141
1,3882,7883,6362,9191,866
2282,7431,0039,262
14,2067,86918,187
19,265506
51,0707,801
12,6693,0571,029
6121,5002,996
7841,2081,837
9,573
3,329657
2,5848,224
Total Buybacks
($ millions)
2,279
2,5621,736
3,3506,465
8471,5671,2108,172
17,559
4,1051,5585,7655,6771,201
1,3694,861
9,49939
3,8099,370
9557,691
6,8061,685
10,519756
1,5641,101
3,35016,930
6,120629
24,1801,543
68,4658,222
9844,975
202,4521,058
1,121
5,0201,5941,1842,1621,544
Buyback ROI
2.4%2.4%2.2%2.1%
2.1%2.1%1.9%1.5%1.5%1.5%1.4%1.3%1.1%
1.0%0.8%0.8%0.7%0.7%0.1%0.1%
-0.0%-0.2%-0.3%-0.4%-0.4%
-0.5%
-0.5%-0.6%-0.7%-0.7%-0.9%-0.9%-1.6%
-2.2%-2.3%-2.6%-2.6%-3.3%-3.3%-3.6%-3.6%-3.7%-4.1%-4.1%-4.1%-4.1%
-4.6%-4.7%-4.8%-4.9%-5.0%-5.2%-5.4%-5.6%-5.9%-6.1%-6.2%-6.3%-6.4%-6.5%-6.7%
-7.0%-7.0%-7.2%-7.6%
Buyback ROI
-7.8%
-7.8%-8.1%
-8.5%-8.5%-8.6%-8.6%-8.8%-9.0%-9.1%
-9.8%-10.0%-10.0%-10.4%-10.9%-11.7%-11.7%-12.7%-12.7%-12.9%-13.0%-14.4%-14.5%-15.0%-15.6%-15.9%-16.0%-16.1%
-16.6%-18.1%
-18.5%-18.6%-20.0%-22.1%-22.1%
-24.5%-25.1%
-26.6%-27.6%-28.6%-29.3%-30.1%
-34.8%
-37.1%-38.9%-46.4%-51.3%-52.3%
Buyback Effectiveness
-4.5%-4.1%
-8.5%-0.3%
-4.3%0.5%-3.1%
-8.4%-1.2%
-4.8%1.8%
-0.3%-2.2%-1.1%0.6%2.9%
-0.9%0.0%
-7.2%-2.1%13.3%
-8.9%-6.9%-5.1%-1.3%
2.1%
0.9%-7.8%-2.0%-8.4%-3.3%-2.7%-2.9%
-9.5%-4.8%-9.7%
4.1%-0.1%
-21.3%-0.6%
3.7%-0.1%-2.7%
1.3%-6.6%-5.4%
3.1%-4.2%-4.1%-6.2%-5.5%-5.6%
-10.4%4.9%3.3%
-3.7%-10.1%-12.1%
8.3%-10.1%-12.6%
-5.4%-13.8%-5.5%-3.6%
Buyback Effectiveness
-14.1%
-8.3%-14.1%
-10.4%-6.7%-8.0%-4.1%0.9%
-9.0%-1.2%
-3.7%-8.6%-11.0%-8.4%-7.0%-9.2%-6.5%
-14.8%-3.1%
-17.4%-9.3%-11.2%-8.2%-11.6%
-10.9%-12.1%5.6%
-10.0%-8.1%
-9.0%-7.1%
-20.3%-4.5%-3.9%
-10.4%-15.3%-6.8%-8.9%-12.8%-10.4%-10.1%-21.9%-19.8%
-21.7%-37.7%-33.5%-44.5%-36.6%

FROM 2016–2020
53%of S&P 500 repurchasers
failed to create value from stock buybacks
Actual Market Price RCE-Implied Value
Best timeto buy
Worst timeto buy
Managements know the key to creating value from buybacks is to concentrate repurchases when share prices are low. Unfortunately for all stakeholders, 53% of companies repurchased more shares when their prices were above the trend, from 2016–2020.
Fortuna Advisors developed VIBE as a fact-based platform to provide managements with real-time signals to help override natural biases, limited information, and human error to better inform the timing of share repurchases.
Buyback programs can and should be sources of immense value for many companies. VIBE can help them harness it.
VIBEVALUE INSPIRED BUYBACK EXECUTION
VIBE Signals include:
1PERFORMANCE & VALUATIONBased on the company and its peers, indicates the likelihood of a desirable Buyback ROI.
2CONSENSUS VS. PRICEBased on the dividend yield and an expected share price CAGR, derived from consensus EPS growth.
3RCE-IMPLIED PREMIUMBased on Fortuna Advisors’ Residual Cash Earnings (RCE) measure of intrinsic share value
4VIBE SIMULATIONSBased on 1000+ simulations that incorporate growth, margins, and asset intensity.