2021 fm global resilience index
TRANSCRIPT

2021 FM GLOBAL RESILIENCE INDEX METHODOLOGY

1 2021 FM GLOBAL RESILIENCE INDEX METHODOLOGY
SECTION 1
THE FACTORS OF RESILIENCEThe risk of disruption to a company’s operations is a complex exposure, subject to many different influences. The process of identifying for an index a set of core drivers with significant impact on enterprise resilience to disruptive events is partly heuristic, partly statistical and partly practical.
Research into the causes of operational disruption and the drivers of recov-ery highlights some common themes. Conflict and political unrest, terrorism, corruption, vulnerability to oil shortag-es and price shocks, natural disasters including extreme weather events, rapid urbanization, maturity and investment in risk management, infrastructure, and cor-porate governance all appear regularly. Increasingly, cyber risk and supply chain visibility also loom large.
To meet statistical criteria, the drivers of the index must demonstrably have an impact on resilience; represent faithfully the intended property; have sufficient sensitivity to detect changes in resilience, but not so much volatility as to disrupt the index; exhibit minimal correlation across drivers; and be calculated consistently (over a period of time to allow back-testing).
Practical considerations require that the data are available, quantitative (or quantifiable), global, annual and from credible sources.
Twelve core drivers of resilience have been selected for inclusion in the FM Global Resilience Index. These drivers are categorized as pertaining to econom-ic, risk quality or supply chain factors, and are summarized below.
1. Economic – This factor represents political and macroeconomic in-fluences on resilience. Combining to form this factor are four drivers: productivity, political risk, oil inten-sity and urbanization rate. Terrorism was found to be highly correlated with political instability, so these two variables are combined into a single driver: political risk.
2. Risk quality – A unique attribute of the FM Global Resilience Index is its ability to draw upon the wealth of experience and data gathered over many years by FM Global’s team of property risk engineers who visit and assess more than 100,000 locations annually across the world. The metrics have the advantage of being applied consistently across all indus-try sectors and regions. This factor comprises three drivers sourced from FM Global: exposure to natural hazards, natural hazard risk quality and fire risk quality. An additional fourth driver is included to capture the inherent cyber risk of a country.
3. Supply chain – This comprises four drivers: control of corruption, quality of infrastructure, corporate governance and supply chain visibility. Provided in Section 2 is an overview of the FM Global Resilience Index structure and construction. Full technical data definitions are provided in Section 3.
The FM Global Resilience Index is a composite
measure of countries’ relative enterprise
resilience to disruptive events.

2021 FM GLOBAL RESILIENCE INDEX METHODOLOGY 2
SECTION 2
THE INDEX STRUCTUREDescribed in this section are the structure and construction of the FM Global Resilience Index. There are three levels to the index, as referenced in Table 1.
Table 1: The index structure
I. INDEX THE FM GLOBAL RESILIENCE INDEX
II. FACTORS Economic Risk Quality Supply Chain
III. DRIVERS
ProductivityExposure to Natural Hazards
Control of Corruption
Political RiskNatural Hazard Risk Quality
Quality of Infrastructure
Oil Intensity Fire Risk Quality Corporate Governance
Urbanization Rate
Inherent Cyber Risk Supply Chain Visibility
LEVELS TO THE INDEXLevel I provides a country ranking of enterprise resilience to disruptive events. Level I is an equally weighted composite measure of the three factors in Level II.
Level II comprises three factors, the core elements of resilience: economic, risk quality and supply chain. Each factor in Level II is an equally weighted composite of its respective drivers in Level III.
Level III includes a set of 12 drivers that determines the enterprise resilience to disruptive events for a country. Each driver measures a different aspect of resilience.
The index combines equally the 12 core drivers of resilience and provides ranked scores for 130 countries and territories around the world. Selected for inclusion are the largest countries (by gross domestic product) with the most complete set of data across the most recent five years.
The structure of the index enables busi-ness executives to identify the sources of strength and vulnerability in a country’s resilience, both broadly across factors (economic, risk quality or supply chain), and more precisely across the 12 drivers. Such analysis offers opportunities to managers seeking to improve their com-pany’s resilience to disruptive events.
3 2021 FM GLOBAL RESILIENCE INDEX METHODOLOGY
INDEX CONSTRUCTIONDescribed below are the key procedures applied to construct the FM Global Resil-ience Index from the underpinning data.
1. Annual data, for the most recent five years, are collected for the maximum number of countries and territories for each of the 12 drivers.
2. A common set of countries and terri-tories with complete data availability across the 12 drivers is identified and aligned into a consistent data set.
3. Each data series is standardized through the calculation of z-scores to enable comparison and combination of drivers with different units. Where necessary, z-scores are inverted for consistency across variables.
4. The z-scores are converted into scores on a scale of 0-100 for presentation purposes.
5. The scores of the 12 drivers then are combined with equal weighting to form the index.
The index comprises the rankings for the top 130 countries and territories for which data are available. China and the United States are each subdivided into three ranked regions because their geographical spread includes disparate exposures to natural hazards such as wind, flood and earthquake.
Based on data availability, new entrants to, and exits from, the index may emerge. In order to maintain consistency in the interpretation of results, the index is restricted to the top 130 countries and territories in any given year.
Many simulations were carried out to determine the most appropriate weight-ing scheme. Ultimately, very little difference emerged in rankings from the adoption of various weighting schemes so, rather than impose a subjective system of aggregation without good reason to do so, it is appropriate to remain with equal weights across the 12 core drivers of resilience.
The overall composite index is, by design, a simplified, summary measure of resilience. The FM Global Resilience Index provides an indication of countries’ relative enterprise resilience to disruptive events. In combination with addition-al information, this provides business executives with a source of guidance on enterprise risk when making deci-sions about risk improvement priorities, sourcing suppliers or the destination of physical investments.
The index comprises the rankings for the top 130
countries and territories for which data are available.

2021 FM GLOBAL RESILIENCE INDEX METHODOLOGY 4
SECTION 3
SOURCES AND DEFINITIONSProvided in this section is the technical definition of each index driver and its data source.
Table 2: Definitions and data sources
ECONOMIC
PRODUCTIVITYGross domestic product (GDP) based on purchasing power parity, divided by total population
International Monetary Fund (IMF)
POLITICAL RISK
The perceived likelihood that the govern-ment will be destabilized or overthrown by unconstitutional or violent means, including politically motivated violence and terrorism
World Bank
OIL INTENSITY
Vulnerability to an oil shock (shortage, disruption, price hike); oil consumption divided by GDP; measures dependency on oil for productivity
U.S. Energy Information Administration
URBANIZATION RATE
The average annual rate of change in the extent to which a country’s population is living in an urban area
United Nations (UN)
RISK QUALITY
EXPOSURE TO NATURAL HAZARDS
The percentage of a country’s area devoted to economic activities that is exposed to at least one natural hazard: wind, flood or earthquake
FM Global
NATURAL HAZARD RISK QUALITY
The quality and enforcement of a country’s building code with respect to natural haz-ard-resistant design (80%), combined with the level of natural hazard risk improvement achieved, given the inherent natural hazard risks in a country (20%)
FM Global
FIRE RISK QUALITY
The quality and enforcement of a country’s building code with respect to fire-based design (80%), combined with the level of fire risk improvement achieved, given the inherent fire risks in a country (20%)
FM Global
INHERENT CYBER RISK
Vulnerability to a cyber attack combined equally with the country’s ability to recover; captured by internet penetration (the percentage of individuals in a country who have access to the internet) and civil liberties
UN and Freedom House, respectively
5 2021 FM GLOBAL RESILIENCE INDEX METHODOLOGY
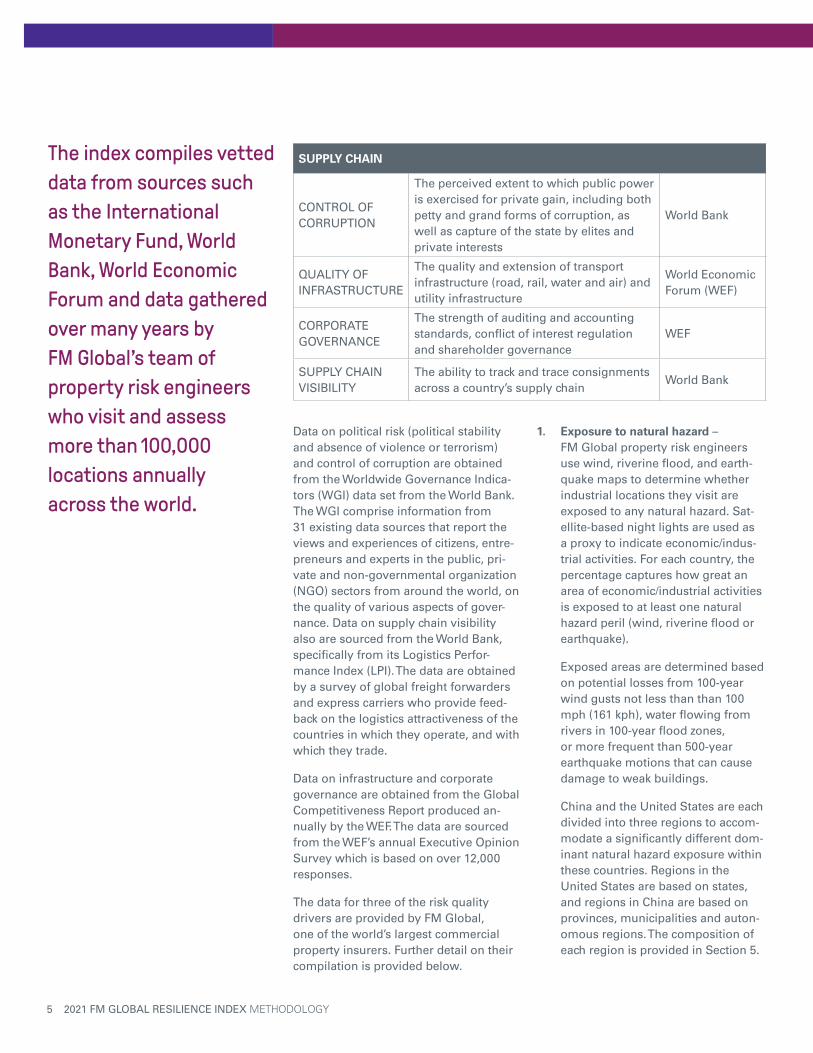
Data on political risk (political stability and absence of violence or terrorism) and control of corruption are obtained from the Worldwide Governance Indica-tors (WGI) data set from the World Bank. The WGI comprise information from 31 existing data sources that report the views and experiences of citizens, entre-preneurs and experts in the public, pri-vate and non-governmental organization (NGO) sectors from around the world, on the quality of various aspects of gover-nance. Data on supply chain visibility also are sourced from the World Bank, specifically from its Logistics Perfor-mance Index (LPI). The data are obtained by a survey of global freight forwarders and express carriers who provide feed-back on the logistics attractiveness of the countries in which they operate, and with which they trade.
Data on infrastructure and corporate governance are obtained from the Global Competitiveness Report produced an-nually by the WEF. The data are sourced from the WEF’s annual Executive Opinion Survey which is based on over 12,000 responses.
The data for three of the risk quality drivers are provided by FM Global, one of the world’s largest commercial property insurers. Further detail on their compilation is provided below.
1. Exposure to natural hazard – FM Global property risk engineers use wind, riverine flood, and earth-quake maps to determine whether industrial locations they visit are exposed to any natural hazard. Sat-ellite-based night lights are used as a proxy to indicate economic/indus-trial activities. For each country, the percentage captures how great an area of economic/industrial activities is exposed to at least one natural hazard peril (wind, riverine flood or earthquake). Exposed areas are determined based on potential losses from 100-year wind gusts not less than than 100 mph (161 kph), water flowing from rivers in 100-year flood zones, or more frequent than 500-year earthquake motions that can cause damage to weak buildings. China and the United States are each divided into three regions to accom-modate a significantly different dom-inant natural hazard exposure within these countries. Regions in the United States are based on states, and regions in China are based on provinces, municipalities and auton-omous regions. The composition of each region is provided in Section 5.
SUPPLY CHAIN
CONTROL OF CORRUPTION
The perceived extent to which public power is exercised for private gain, including both petty and grand forms of corruption, as well as capture of the state by elites and private interests
World Bank
QUALITY OF INFRASTRUCTURE
The quality and extension of transport infrastructure (road, rail, water and air) and utility infrastructure
World Economic Forum (WEF)
CORPORATE GOVERNANCE
The strength of auditing and accounting standards, conflict of interest regulation and shareholder governance
WEF
SUPPLY CHAIN VISIBILITY
The ability to track and trace consignments across a country’s supply chain
World Bank
The index compiles vetted
data from sources such
as the International
Monetary Fund, World
Bank, World Economic
Forum and data gathered
over many years by
FM Global’s team of
property risk engineers
who visit and assess
more than 100,000
locations annually
across the world.

2021 FM GLOBAL RESILIENCE INDEX METHODOLOGY 6
2. Natural hazard risk quality – To capture the quality of a country’s management of natural hazard risks, two components are combined. Dominant (and weighted 80%) is a measure of the quality and enforcement of a country’s building code with respect to natural haz-ard-resistant design. A full exposition of the building code rating method-ology is provided in Section 4. The remaining component (weighted 20%) reflects the risk quality of actual facilities and is obtained from FM Global’s proprietary RiskMark® database available to FM Global clients.
RiskMark is a benchmarking algo-rithm that calculates the risk quality of FM Global’s insured locations. It uses a 100-point scale (100 representing the best-managed, highest-quality risk), and the scale comprises the following four components:
• Fire Hazards and Equipment Hazards: 36 points
• Natural Hazards: 30 points• Human Element and Other
Factors: 19 points• Inherent Occupancy
Hazards: 15 points
The RiskMark score of a location includes a measure of both inherent risks and risks where there are rec-ommendations for improvement. The potential RiskMark score represents the highest possible score achievable by that location, given those inher-ent risks. The percentage potential RiskMark score provides a way to measure risk improvement oppor-tunities given the inherent risks. It is calculated by dividing the actual RiskMark score by the potential Risk-Mark score.
For the risk quality driver, natural hazard risk quality, the weighted average (by total insured value) percentage potential RiskMark score for the natural hazard component is provided for each country or region where there is a statistically sufficient number of locations. Those countries with few locations are rated solely by the quality and enforcement of the country’s building code with respect to natural hazard-resistant design.
3. Fire risk quality – For this risk quality driver, fire risk quality, the same log-ic as natural hazard applies. The qual-ity of a country’s management of fire risk combines two components: a measure of the quality and enforce-ment of a country’s building code with respect to fire-based design (weighted 80%), and a measure of the fire risk quality of actual facilities visited by FM Global property risk engineers.
For this metric, the weighted average (by total insured value) percentage potential RiskMark score for the fire subcomponent of the fire and equip-ment hazards component is provided for each country or region where there is a statistically sufficient number of locations. Again, those countries with few locations are rat-ed solely by the quality and enforce-ment of the country’s building code with respect to fire-based design.
The fourth risk quality driver, inherent cyber risk, combines equally a country’s vulnerability to cyber attack with the country’s ability to recover from such an attack. The former is captured by a measure of internet penetration, using data sourced from the International Tele-communications Union (ITU), a division of the UN. To reflect a country’s ability to help businesses heal and recover from a cyber attack, a measure of civil liberties is used, combining freedoms of expres-sion, assembly, association, education and religion, and an established and fair legal system that ensures the rule of law, allows free economic activity, and strives for equal opportunities for all. The data are sourced from Freedom House, a nonprofit watchdog organization.

7 2021 FM GLOBAL RESILIENCE INDEX METHODOLOGY
SECTION 4Described in this section is the method by which FM Global property risk engineers estimated the quality of building codes around the world with respect to natural haz-ard and fire risks. Evaluation of the outcome of building codes and regulations entails a method that is based not only on the requirements of the code but also on the level of its enforcement. The approach adopted combines an understanding of the require-ments with actual observations by FM Global property risk engineers in the field.
NATURAL HAZARD ELEMENTS SCORE
Is there a regularly used and updated building code that includes manda-tory requirements for natural hazard-resistant designs published?
0, 1, 2
Are these requirements regularly enforced? 0, 1, 2
Are there current, nationally recognized flood maps available? 0, 1
FIRE ELEMENTS SCORE
Is there a regularly used and updated building code that includes manda-tory requirements for fire-based design published in the country?
0, 1, 2
Are these requirements regularly enforced? 0, 1, 2
Based on a 5,000-m2 building, would the code require automatic sprinklers to be installed in any office/warehouse/factory buildings?
0, 1
BUILDING CODE RATING METHODOLOGY1. National building codes and their
implementation were reviewed first in order to define the key questions for a survey that would yield the most, and most relevant, responses.
2. Based on this review, and follow-ing a pilot study, the following filter questions were established to address natural hazard and fire risk, respectively:
a. Is there a regularly used and updated building code that in-cludes mandatory requirements for natural hazard-resistant de-signs published in the country?
b. Is there a regularly used and updated building code that in-cludes mandatory requirements for fire-based design published in the country?
3. To ensure that requirements are fully understood, they need to be adopt-ed fully and within the mainstream of building practice in a country. A revised code or draft code would not meet these criteria.
A code quality score of 2 was assigned for observed full code covering natural hazard/fire elements, 1 for limited code covering these elements, and 0 where these elements are absent.
a. In the case of natural hazards, matching design requirements for seismic, wind, snow, etc., were considered.
b. In the case of fire risk, require-ments covering fire-rated com-partmentation, fire protection, combustibility requirements for materials, etc., were considered.

2021 FM GLOBAL RESILIENCE INDEX METHODOLOGY 8
4. As noted, the presence of strong enforcement will ensure that the outcome of a code is delivered. Therefore, for each natural hazard and fire risk, the following contin-gency question was asked: Are these requirements regularly enforced?
5. The focus is placed on what is ob-served in a country rather than what is intended, and responses to the question of enforcement concentrate on the skill, education and training available to implement the require-ments regularly. A code enforcement score of 2 was assigned for observed strong and consistent enforcement, 1 for limited enforcement, and 0 for negligible or poor enforcement. The code enforcement score is applied as a multiplier to the code quality score, reflecting the practical power
of effective code enforcement.
6. A final modifier was added to the re-sultant score (quality x enforcement) to introduce the observed availability of flood maps into the natural hazard elements and the requirements for automatic sprinkler protection into the fire elements.
a. There are limited elements with-in building codes with respect to flood hazard. Usually, it is considered in the wider ele-ments of building laws relating to development and land use that determine where a build-ing can be sited. However, this requires a scheme of flood maps to assess the risk. A score of 1 is added if nationally recognized flood maps are present and available in the country.
b. FM Global’s experience shows that a key driver in minimizing fire damage is the presence of automatic sprinkler protection. In the industrial arena, the typi-cal target occupancies are offic-es, warehouses and factories, in
particular, buildings of moderate size at 5,000 square meters. Such buildings represent a reasonable scale of investment where fire protection makes economic sense based on value alone in most territories. A score of 1 is added if there is a requirement for the installation of automatic sprinklers within this size of building in any of the specified occupancies.
7. The questions were distributed to FM Global property risk engineers who were surveyed and interviewed for their expert assessment of build-ing code quality and enforcement, based on their actual observations in the field.
8. For those countries where limited observations were available, second-ary research in the form of a litera-ture review of the available code was used to supplement the primary field research.
9. Finally, the ratings were reviewed iteratively by the engineering and standards community to ensure consistency in grading, and to reach consensus on the relative ratings.
The FM Global engineering team oper-ates across the world, visiting industrial and commercial clients to undertake property risk evaluations. The engineers apply their training and assess the current conditions to the applicable FM Global standards in order to deter-mine if there are opportunities to en-hance the protection of a facility against natural hazard and fire risks. Through this work, FM Global engineers enjoy unique access to observe the practice and appli-cation of building codes and regulations across different countries.
The index provides
business executives with
a source of guidance
on enterprise resilience
when making decisions
about risk improvement
priorities, sourcing
suppliers or the
destination of physical
investments.
9 2021 FM GLOBAL RESILIENCE INDEX METHODOLOGY
CHINA 1 CHINA 2 CHINA 3UNITED STATES 1
UNITED STATES 2
UNITED STATES 3
Wind EarthquakeMiscella-neous
Wind Earthquake Miscellaneous
Fujian Hebei Anhui Alabama Alaska Arizona
Guangdong Jiangsu Beijing Connecticut California Arkansas
Hainan Neimenggu Chongqing Delaware Hawaii Colorado
Jilin Ningxia Gansu Florida NevadaDistrict of Columbia
Liaoning Sichuan Guangxi Georgia Oregon Idaho
Shandong Tianjin Guizhou Louisiana Puerto Rico Illinois
Shanghai Yunnan Heilongjiang Maine Utah Indiana
Zhejiang Henan Maryland Washington Iowa
Hubei Massachusetts Kansas
Hunan Mississippi Kentucky
JiangxiNew Hampshire
Michigan
Qinghai New Jersey Minnesota
Shaanxi (Shanxi)
New York Missouri
XinjiangNorth Carolina
Montana
Rhode Island Nebraska
South Carolina
New Mexico
Texas North Dakota
Virgin Islands Ohio
Virginia Oklahoma
Pennsylvania
South Dakota
Tennessee
Vermont
West Virginia
Wisconsin
Wyoming
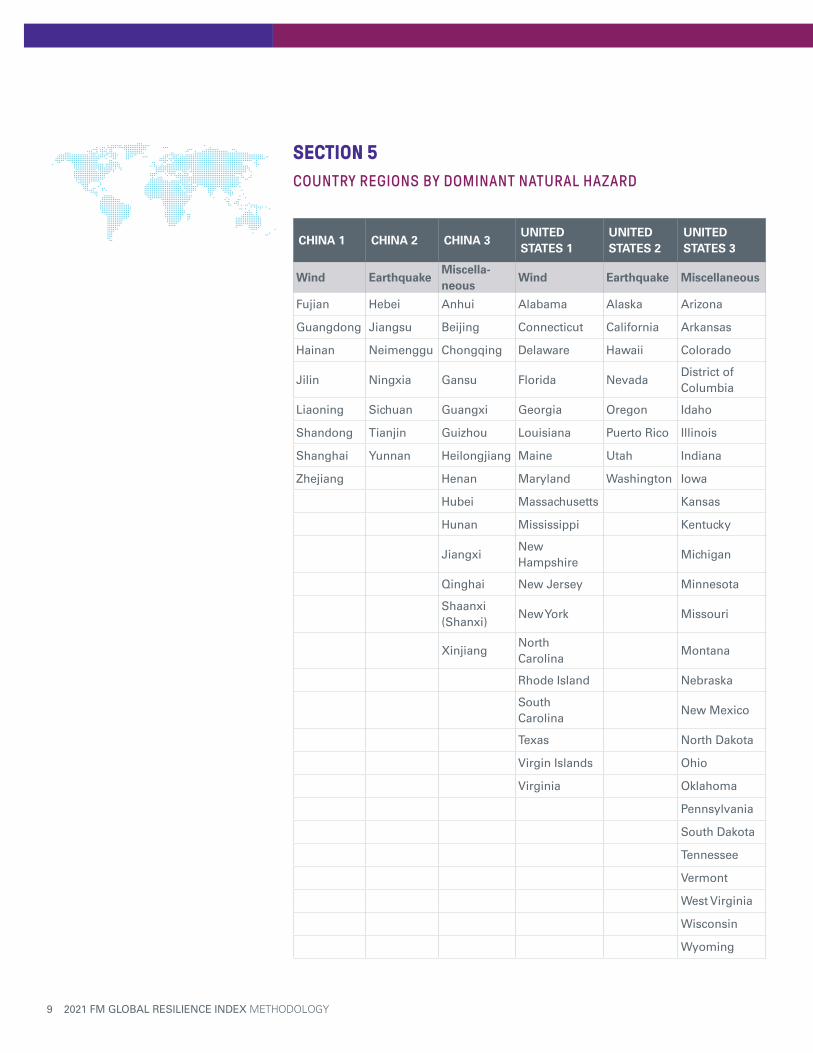
SECTION 5COUNTRY REGIONS BY DOMINANT NATURAL HAZARD

CHINA 1 CHINA 2 CHINA 3UNITED STATES 1
UNITED STATES 2
UNITED STATES 3
Wind EarthquakeMiscella-neous
Wind Earthquake Miscellaneous
Fujian Hebei Anhui Alabama Alaska Arizona
Guangdong Jiangsu Beijing Connecticut California Arkansas
Hainan Neimenggu Chongqing Delaware Hawaii Colorado
Jilin Ningxia Gansu Florida NevadaDistrict of Columbia
Liaoning Sichuan Guangxi Georgia Oregon Idaho
Shandong Tianjin Guizhou Louisiana Puerto Rico Illinois
Shanghai Yunnan Heilongjiang Maine Utah Indiana
Zhejiang Henan Maryland Washington Iowa
Hubei Massachusetts Kansas
Hunan Mississippi Kentucky
JiangxiNew Hampshire
Michigan
Qinghai New Jersey Minnesota
Shaanxi (Shanxi)
New York Missouri
XinjiangNorth Carolina
Montana
Rhode Island Nebraska
South Carolina
New Mexico
Texas North Dakota
Virgin Islands Ohio
Virginia Oklahoma
Pennsylvania
South Dakota
Tennessee
Vermont
West Virginia
Wisconsin
Wyoming
ABOUT FM GLOBALEstablished nearly two centuries ago, FM Global is a mutual insurance company whose capital, scientific research capability and engineering expertise are solely dedicated to property risk management and the resilience of its client-owners. These owners, who share the belief that the majority of property loss is preventable, represent many of the world’s largest organizations, including 1 of every 3 Fortune 500 companies. They work with FM Global to better understand the hazards that can impact their business continuity in order to make cost-effective risk management decisions, combining property loss prevention with insurance protection. fmglobal.com
ABOUT PENTLAND ANALYTICSPentland Analytics provides advanced analytics and advisory services to the executive management of the world's leading companies. The firm converts complex business issues into mathematical models that yield fresh insights and direction. The results inform strategic decisions and help to build clients' resilience, reputation and long-term owner value. pentlandanalytics.com
W00234 © 2020 Pentland Analytics (Rev. 05/2021)