2021 drinking water risk assessment for state small water
TRANSCRIPT

State Water Resources Control Board Page | i
DRINKING WATER RISK ASSESSMENT FOR STATE SMALL WATER SYSTEMS & DOMESTIC WELLSInforming the 2021-22 Safe & Affordable Drinking Water Fund Expenditure Plan
The Risk Assessment is a component of the Needs Assessment. Access full Needs Assessment Report:
https://www.waterboards.ca.gov/drinking_water/certlic/drinkingwater/documents/needs/2021_needs_assessment.pdf
April 2021

State Water Resources Control Board Page | ii
Acknowledgements
Contributors
This report was prepared by the California State Water Resources Control Board within the California Environmental Protection Agency (CalEPA), in partnership with the UCLA Luskin Center for Innovation (UCLA).
UCLA in turn partnered with Corona Environmental Consulting (Corona), Sacramento State University Office of Water Programs, the Pacific Institute and the UNC Environmental Finance Center to carry out much of the analysis contained in this report.
State Water Board Contributing Authors
Kristyn Abhold, Jeffrey Albrecht, William Allen, Michelle Frederick, Emily Houlihan, Mawj Khammas, David Leslie, Hee Kyung Lim, and Bansari Tailor
UCLA Team Contributing Authors
Gregory Pierce (Principal Investigator, Needs Assessment Contract), Peter Roquemore, and Kelly Trumbull
Corona Team Contributing Authors
Tarrah Henrie, Craig Gorman, Chad Seidel, Vivian Jensen, Carleigh Samson, Nathan MacArthur, Brittany Gregory, and Adam McKeagney
OWP at Sacramento State Team Contributing Authors
Maureen Kerner, Erik Porse, Khalil Lezzaik, Dakota Keene, and Caitlyn Leo
Pacific Institute Team Contributing Authors
Morgan Shimabuku and Lillian Holmes
UNC Team Contributing Authors
Shadi Eskaf
Acknowledgments
We are grateful to Julien Gattaciecca and Jacqueline Adams (UCLA), Laura Feinstein and Leo Rodriguez (Pacific Institute), and Julia Cavalier and Jeff Hughes (UNC) for their advice, analysis and background research which helped to inform this report. We also thank Julia Ekstrom (Department of Water Resources) and Carolina Balazs (Office of Environmental Health Hazards Assessment) for their insight on methodology and coordinating their agency’s data sharing which was incorporated into the Risk Assessment. Additionally, we acknowledge the contributions and insights from comment letters received by the Board from a diverse group of stakeholders on a draft version of this report, as well as input received at public meetings and workshops on versions of this work held around the state.
State Water Resources Control Board Page | iii
CONTENTSDEFINITION OF TERMS ........................................................................................................... 4
RISK ASSESSMENT RESULTS FOR STATE SMALL WATER SYSTEMS & DOMESTIC WELLS .................................................................................................................................... 10
Overview .............................................................................................................................. 10Risk Assessment Methodology ......................................................................................... 10
Risk Assessment Results..................................................................................................... 12Limitations of the Risk Assessment for State Small Water Systems & Domestic Wells ....... 16Refinement Opportunities .................................................................................................... 16
APPENDIX B: RISK ASSESSMENT METHODOLOGY FOR STATE SMALL WATER SYSTEMS & DOMESTIC WELLS .......................................................................................... 18
INTRODUCTION ..................................................................................................................... 18Risk Assessment Methodology Development Process ........................................................ 19Intended Use of This Analysis .............................................................................................. 19
METHODOLOGY .................................................................................................................... 19Data Processing ................................................................................................................... 19Depth Filter .......................................................................................................................... 24
Wells with Known Numeric Depths ................................................................................... 26Wells with Unknown Numeric Depths ............................................................................... 27
De-Clustering ....................................................................................................................... 27Long-Term Average .......................................................................................................... 27Recent Results .................................................................................................................. 28
Unit of Analysis .................................................................................................................... 28Risk Factors ......................................................................................................................... 28
Water Quality Risk (“Hazard”) ........................................................................................... 28Domestic Well and State Small System Density (“Exposure”) .......................................... 32Combined Risk (Water Quality and Domestic Well/State Small Reliant Population) ......... 32

Page | 4
DEFINITION OF TERMSThis report includes the following defined terms.
“Affordability Threshold” means the level, point, or value that delineates if a water system’s residential customer charges, designed to ensure the water systems can provide drinking water that meets State and Federal standards, are unaffordable. For the purposes of the 2021 Affordability Assessment, the State Water Board employed affordability thresholds for the following indicators: Percent Median Household Income; Extreme Water Bill; and Percent Shut-Offs. Learn more about current and future indicators and affordability thresholds in Appendix E.
“Adequate supply” means sufficient water to meet residents’ health and safety needs at all times. (Health & Saf. Code, § 116681, subd. (a).)
“Administrator” means an individual, corporation, company, association, partnership, limited liability company, municipality, public utility, or other public body or institution which the State Water Board has determined is competent to perform the administrative, technical, operational, legal, or managerial services required for purposes of Health and Safety Code section 116686, pursuant to the Administrator Policy Handbook adopted by the State Water Board. (Health & Saf. Code, §§ 116275, subd. (g), 116686, subd. (m)(1).)
“Affordability Assessment” means the identification of any community water system that serves a disadvantaged community that must charge fees that exceed the affordability threshold established by the State Water Board in order to supply, treat, and distribute potable water that complies with Federal and state drinking water standards. The Affordability Assessment evaluates several different affordability indicators to identify communities that may be experiencing affordability challenges. (Health & Saf. Code, § 116769, subd. (2)(B).
“At-Risk public water systems” or “At-Risk PWS” means community water systems with 3,300 service connections or less and K-12 schools that are at risk of failing to meet one or more key Human Right to Water goals: (1) providing safe drinking water; (2) accessible drinking water; (3) affordable drinking water; and/or (4) maintaining a sustainable water system.
“At-Risk state small water systems and domestic wells” or “At-Risk SSWS and domestic wells” means state small water systems and domestic wells that are located in areas where groundwater is at high risk of containing contaminants that exceed safe drinking water standards. This definition may be expanded in future iterations of the Needs Assessment as more data on domestic wells and state small water systems becomes available.
“California Native American Tribe” means Federally recognized California Native American Tribes, and non-Federally recognized Native American Tribes on the contact list maintained by the Native American Heritage Commission for the purposes of Chapter 905 of the Statutes of 2004. (Health & Saf. Code, § 116766, subd. (c)(1).) Typically, drinking water systems for Federally recognized tribes fall under the regulatory jurisdiction of the United States Environmental Protection Agency (U.S. EPA), while public water systems operated by non-Federally recognized tribes currently fall under the jurisdiction of the State Water Board.
State Water Resources Control Board Page | 5
“Capital costs” means the costs associated with the acquisition, construction, and development of water system infrastructure. These costs may include the cost of infrastructure (treatment solutions, consolidation, etc.), design and engineering costs, environmental compliance costs, construction management fees, general contractor fees, etc. Full details of the capital costs considered and utilized in the Needs Assessment are in Appendix C.
“Community water system” or “CWS” means a public water system that serves at least 15 service connections used by yearlong residents or regularly serves at least 25 yearlong residents of the area served by the system. (Health & Saf. Code, § 116275, subd. (i).)
“Consistently fail” means a failure to provide an adequate supply of safe drinking water. (Health & Saf. Code, § 116681, subd. (c).)
“Consolidation” means joining two or more public water systems, state small water systems, or affected residences into a single public water system, either physically or managerially. For the purposes of this document, consolidations may include voluntary or mandatory consolidations. (Health & Saf. Code, § 116681, subd. (e).)
“Contaminant” means any physical, chemical, biological, or radiological substance or matter in water. (Health & Saf. Code, § 116275, subd. (a).)
“Cost Assessment” means the estimation of funding needed for the Safe and Affordable Drinking Water Fund for the next fiscal year based on the amount available in the fund, anticipated funding needs, and other existing State Water Board funding sources. Thus, the Cost Assessment estimates the costs related to the implementation of interim and/or emergency measures and longer-term solutions for HR2W list systems and At-Risk public water systems, state small water systems, and domestic wells. The Cost Assessment also includes the identification of available funding sources and the funding and financing gaps that may exist to support interim and long-term solutions. (Health & Saf. Code, § 116769.)
“Disadvantaged community” or “DAC” means the entire service area of a community water system, or a community therein, in which the median household income is less than 80% of the statewide annual median household income level. (Health & Saf. Code, § 116275, subd. (aa).)
“Domestic well” means a groundwater well used to supply water for the domestic needs of an individual residence or a water system that is not a public water system and that has no more than four service connections. (Health & Saf. Code, § 116681, subd. (g).)
“Drinking Water Needs Assessment” or “Needs Assessment” means the comprehensive identification of California drinking water needs. The Needs Assessment consist of three core components: the Affordability Assessment, Risk Assessment, and Cost Assessment. The results of the Needs Assessment inform the State Water Board’s annual Fund Expenditure Plan for the Safe and Affordable Drinking Water Fund and the broader activities of the SAFER Program. (Health & Saf. Code, § 116769.)
“Fund Expenditure Plan” or “FEP” means the plan that the State Water Board develops pursuant to Article 4 of Chapter 4.6 of the Health and Safety Code for the Safe and Affordable Drinking Water Fund, established pursuant to Health and Safety Code § 116766.

State Water Resources Control Board Page | 6
“Human consumption” means the use of water for drinking, bathing or showering, hand washing, oral hygiene, or cooking, including, but not limited to, preparing food and washing dishes. (Health & Saf. Code, § 116275, subd. (e).)
“Human Right to Water” or “HR2W” means the recognition that “every human being has the right to safe, clean, affordable, and accessible water adequate for human consumption, cooking and sanitary purposes,” as defined in Assembly Bill 685 (AB 685). (California Water Code § 106.3, subd. (a).)
“Human Right to Water list” or “HR2W list” means the list of public water systems that are out of compliance or consistently fail to meet primary drinking water standards. Systems that are assessed for meeting the HR2W list criteria include Community Water Systems and Non-Community Water Systems that serve K-12 schools and daycares. The HR2W list criteria were expanded in April 2021 to better align with statutory definitions of what it means for a water system to “consistently fail” to meet primary drinking water standards. (California Health and Safety Code § 116275(c).)
“Interim replacement water” or “Interim solution” includes, but is not limited to; bottled water, vended water, and point-of-use or point-of-entry treatment units. (Health & Saf. Code, § 116767, subd. (q).)
“Loan” means any repayable financing instrument, including a loan, bond, installment sale agreement, note, or other evidence of indebtedness.
“Local cost share” means a proportion of the total interim and/or long-term project cost that is not eligible for a State grant and would therefore be borne by water systems, their ratepayers, and/or domestic well owners. Some local cost share needs may be eligible for public or private financing (i.e. a loan). Some local costs share needs may not be eligible for financing and is typically funded through available reserves or cash on hand.
“Maximum contaminant level” or “MCL” means the maximum permissible level of a contaminant in water. (Health & Saf. Code, § 116275, subd. (f).)
“Median household income” or “MHI” means the household income that represents the median or middle value for the community. The methods utilized for calculating median household income are included in Appendix A and Appendix E. Median household incomes in this document are estimated values for the purposes of this statewide assessment. Median household income for determination of funding eligibility is completed on a system by system basis by the State Water Board’s Division of Financial Assistance.
“Net present worth” or “NPW” means the estimate of the total sum of funds that need to be set aside today to cover all expenses (capital, including other essential infrastructure costs, and annual O&M) during the potential useful life of the infrastructure investment, which is conservatively estimated at 20-years. The estimate of the total sum of funds is adjusted by an annual discount rate which accounts for the higher real cost of financial outlays in the immediate future when compared to the financial outlays in subsequent years.
“Non-Community Water System” means a public water system that is not a community water system. (Health & Saf. Code, § 116275, subd. (j).)

State Water Resources Control Board Page | 7
“Non-transient Non-Community Water System” means a public water system that is not a community water system and that regularly serves at least 25 of the same persons for six months or more during a given year, such as a school. (Health & Saf. Code, § 116275, subd. (k).)
“Operations and maintenance” or “O&M” means the functions, duties and labor associated with the daily operations and normal repairs, replacement of parts and structural components, and other activities needed by a water system to preserve its capital assets so that they can continue to provide safe drinking water.
“Other essential infrastructure” or “OEI” encompasses a broad category of additional infrastructure needed for the successful implementation of the Cost Assessment’s long-term modeled solutions and to enhance the system’s sustainability. OEI includes storage tanks, new wells, well replacement, upgraded electrical, added backup power, replacement of distribution system, additional meters, and land acquisition.
“Potentially At-Risk” means community water systems with 3,300 service connections or less and K-12 schools that are potentially at risk of failing to meet one or more key Human Right to Water goals: (1) providing safe drinking water; (2) accessible drinking water; (3) affordable drinking water; and/or (4) maintaining a sustainable water system.
“Primary drinking water standard” means: (1) Maximum levels of contaminants that, in the judgment of the state board, may have an adverse effect on the health of persons. (2) Specific treatment techniques adopted by the state board in lieu of maximum contaminant levels pursuant to Health & Saf. Code, § 116365, subd. (j). (3) The monitoring and reporting requirements as specified in regulations adopted by the state board that pertain to maximum contaminant levels. (Health & Saf. Code, § 116275, subd. (c).)
“Public water system” or “PWS” means a system for the provision to the public of water for human consumption through pipes or other constructed conveyances that has 15 or more service connections or regularly serves at least 25 individuals daily at least 60 days out of the year. A PWS includes any collection, pretreatment, treatment, storage, and distribution facilities under control of the operator of the system that are used primarily in connection with the system; any collection or pretreatment storage facilities not under the control of the operator that are used primarily in connection with the system; and any water system that treats water on behalf of one or more public water systems for the purpose of rendering it safe for human consumption. (Health & Saf. Code, § 116275, subd. (h).)
“Refined grant needs” means the estimated costs, generated from the Cost Assessment Model, that have been adjusted by removing costs for water systems that have existing funding agreements with the State Water Board and identifying the proportion of costs that are grant-eligible.
“Resident” means a person who physically occupies, whether by ownership, rental, lease, or other means, the same dwelling for at least 60 days of the year. (Health & Saf. Code, § 116275, subd. (t).)
“Risk Assessment” means the identification of public water systems, with a focus on community water systems and K-12 schools, that may be at risk of failing to provide an

State Water Resources Control Board Page | 8
adequate supply of safe drinking water. It also includes an estimate of the number of households that are served by domestic wells or state small water systems in areas that are at high-risk for groundwater contamination. Different Risk Assessment methodologies have been developed for different system types: (1) public water systems; (2) state small water systems and domestic wells; and (3) tribal water systems. (Health & Saf. Code, § 116769)
“Risk indicator” means the quantifiable measurements of key data points that allow the State Water Board to assess the potential for a community water system or a transient non-community water system that serves a K-12 school to fail to sustainably provide an adequate supply of safe drinking water due to water quality, water accessibility, affordability, institutional, and/or TMF capacity issues.
“Risk threshold” means the levels, points, or values associated with an individual risk indicator that delineates when a water system is more at-risk of failing, typically based on regulatory requirements or industry standards.
“Safe and Affordable Drinking Water Fund” or “SADWF” means the fund created through the passage of Senate Bill 200 (SB 200) to help provide an adequate and affordable supply of drinking water for both the near and long terms. SB 200 requires the annual transfer of 5 percent of the annual proceeds of the Greenhouse Gas Reduction Fund (GGRF) (up to $130 million) into the Fund until June 30, 2030. (Health & Saf. Code, § 116766)
“Safe and Affordable Funding for Equity and Resilience Program” or “SAFER Program” means a set of State Water Board tools, funding sources, and regulatory authorities designed to meet the goals of ensuring safe, accessible, and affordable drinking water for all Californians.
“Safe drinking water” means water that meets all primary and secondary drinking water standards, as defined in Health and Safety Code section 116275.
“Score” means a standardized numerical value that is scaled between 0 and 1 for risk points across risk indicators. Standardized scores enable the evaluation and comparison of risk indicators.
“Secondary drinking water standards” means standards that specify maximum contaminant levels that, in the judgment of the State Water Board, are necessary to protect the public welfare. Secondary drinking water standards may apply to any contaminant in drinking water that may adversely affect the public welfare. Regulations establishing secondary drinking water standards may vary according to geographic and other circumstances and may apply to any contaminant in drinking water that adversely affects the taste, odor, or appearance of the water when the standards are necessary to ensure a supply of pure, wholesome, and potable water. (Health & Saf. Code, § 116275, subd. (d).)
“Service connection” means the point of connection between the customer’s piping or constructed conveyance, and the water system’s meter, service pipe, or constructed conveyance, with certain exceptions set out in the definition in the Health and Safety Code. (See Health & Saf. Code, § 116275, subd. (s).)

State Water Resources Control Board Page | 9
“Severely disadvantaged community” or “SDAC” means the entire service area of a community water system in which the MHI is less than 60% of the statewide median household income. (See Water Code § 13476, subd. (j))
“Small community water system” means a CWS that serves no more than 3,300 service connections or a yearlong population of no more than 10,000 persons. (Health & Saf. Code, § 116275, subd. (z).)
“Small disadvantaged community” or “small DAC” means the entire service area, or a community therein, of a community water system that serves no more than 3,300 service connections or a year-round population of no more than 10,000 in which the median household income is less than 80% of the statewide annual median household income.
“State small water system” or “SSWS” means a system for the provision of piped water to the public for human consumption that serves at least five, but not more than 14, service connections and does not regularly serve drinking water to more than an average of 25 individuals daily for more than 60 days out of the year. (Health & Saf. Code, § 116275, subd. (n).)
“State Water Board” means the State Water Resources Control Board.
“Technical, Managerial and Financial capacity” or “TMF capacity” means the ability of a water system to plan for, achieve, and maintain long term compliance with drinking water standards, thereby ensuring the quality and adequacy of the water supply. This includes adequate resources for fiscal planning and management of the water system.
“Waterworks Standards” means regulations adopted by the State Water Board entitled “California Waterworks Standards” (Chapter 16 (commencing with Section 64551) of Division 4 of Title 22 of the California Code of Regulations). (Health & Saf. Code, § 116275, subd. (q).)
“Weight” means the application of a multiplying value or weight to each risk indicator and risk category within the Risk Assessment, as certain risk indicators and categories may be deemed more critical than others.
State Water Resources Control Board Page | 10
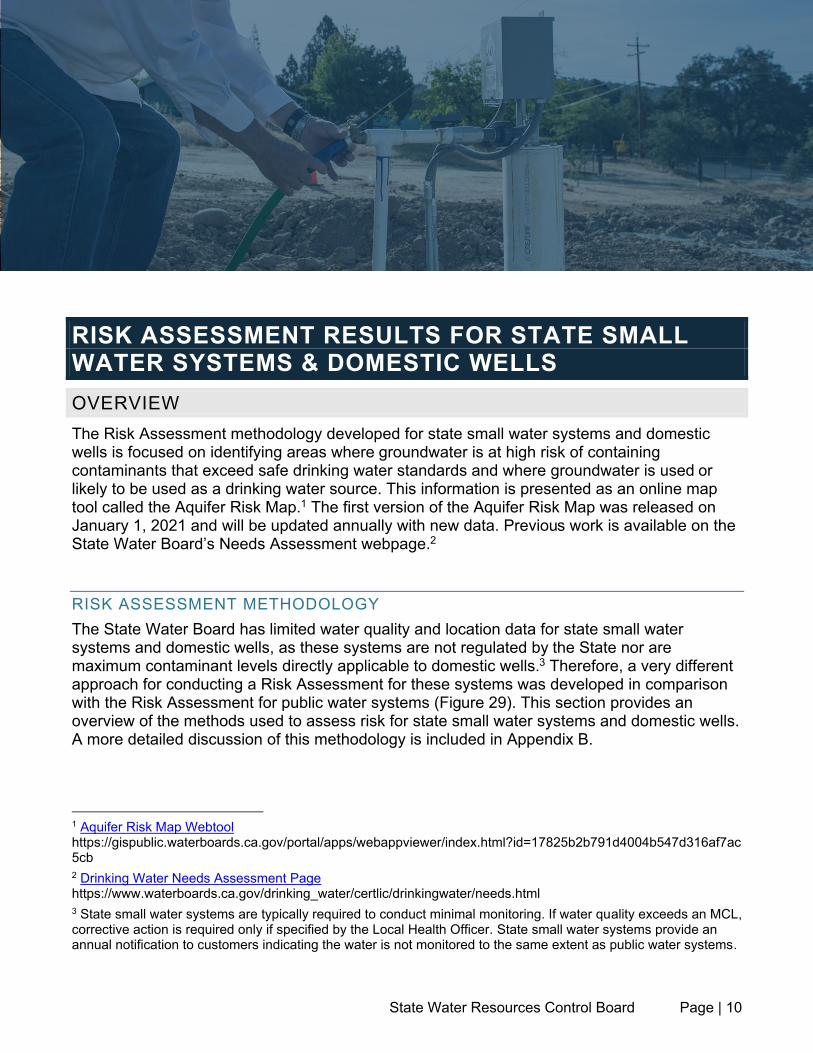
RISK ASSESSMENT RESULTS FOR STATE SMALL WATER SYSTEMS & DOMESTIC WELLSOVERVIEWThe Risk Assessment methodology developed for state small water systems and domestic wells is focused on identifying areas where groundwater is at high risk of containing contaminants that exceed safe drinking water standards and where groundwater is used or likely to be used as a drinking water source. This information is presented as an online map tool called the Aquifer Risk Map.1 The first version of the Aquifer Risk Map was released on January 1, 2021 and will be updated annually with new data. Previous work is available on the State Water Board’s Needs Assessment webpage.2
RISK ASSESSMENT METHODOLOGYThe State Water Board has limited water quality and location data for state small water systems and domestic wells, as these systems are not regulated by the State nor are maximum contaminant levels directly applicable to domestic wells.3 Therefore, a very different approach for conducting a Risk Assessment for these systems was developed in comparison with the Risk Assessment for public water systems (Figure 29). This section provides an overview of the methods used to assess risk for state small water systems and domestic wells. A more detailed discussion of this methodology is included in Appendix B.
1 Aquifer Risk Map Webtool https://gispublic.waterboards.ca.gov/portal/apps/webappviewer/index.html?id=17825b2b791d4004b547d316af7ac5cb2 Drinking Water Needs Assessment Page https://www.waterboards.ca.gov/drinking_water/certlic/drinkingwater/needs.html3 State small water systems are typically required to conduct minimal monitoring. If water quality exceeds an MCL, corrective action is required only if specified by the Local Health Officer. State small water systems provide an annual notification to customers indicating the water is not monitored to the same extent as public water systems.

State Water Resources Control Board Page | 11
Figure 29: Risk Assessment Methodology for State Small Water Systems & Domestic Wells
The Risk Assessment for domestic wells and state small systems involved the following steps:
STEP 1: Publicly available source water quality data from shallow wells was collected.
STEP 2: This data was averaged per square mile to provide a best estimate of state small water system and domestic well depth groundwater quality. The average groundwater quality for each square mile section was compared to the maximum contaminant level (MCL) to classify sections as “high”, “medium”, or “low” risk. Sections without data were classified as “no data”. For more detail on this comparison criteria, refer to Appendix B.
STEP 3: The groundwater quality estimates per square mile sections were averaged by census block groups to rank the relative risk that a census block group may not meet primary drinking water standards (water quality risk). This averaging characterized each census block group based on the number of contaminants that may exceed primary drinking water standards, the magnitude of this exceedance, and the area potentially affected.
STEP 4: Location data for domestic wells was obtained from Department of Water Resources well completion record database, and location data for state small water systems was obtained from the Rural Community Assistance Corporation. This location data was used to calculate the density of state small water systems and domestic well users per square mile in each census block group (exposure risk).
State Water Resources Control Board Page | 12
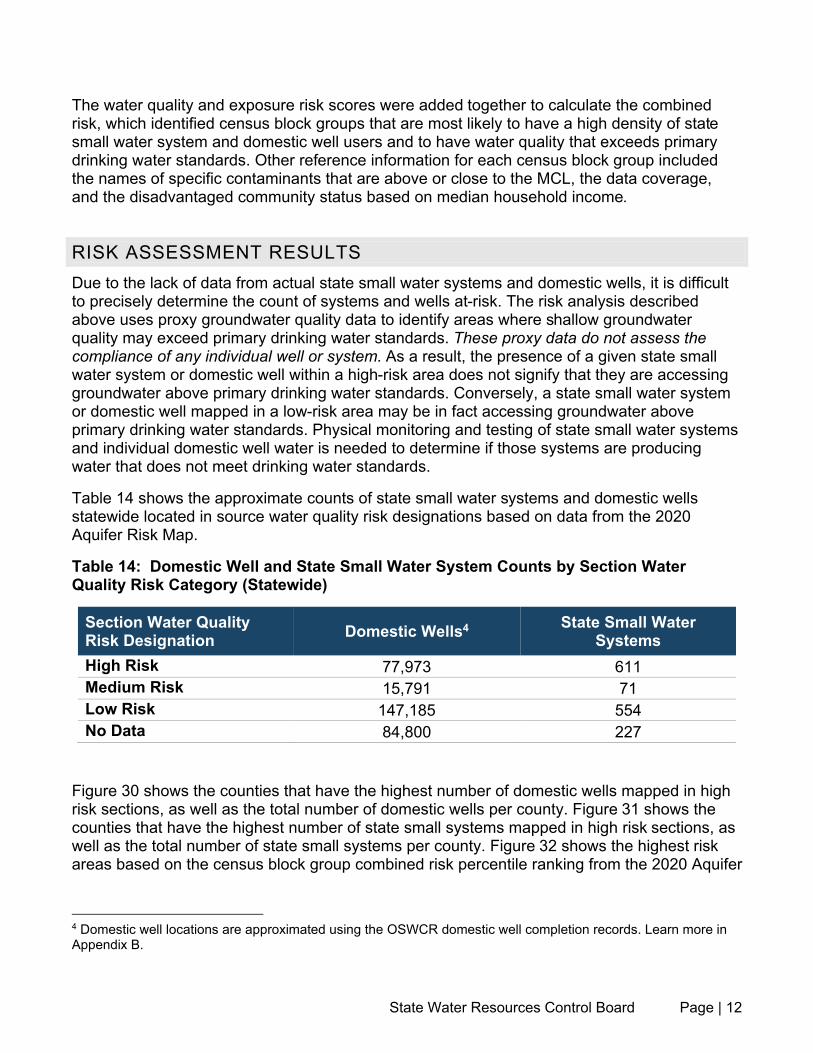
The water quality and exposure risk scores were added together to calculate the combined risk, which identified census block groups that are most likely to have a high density of state small water system and domestic well users and to have water quality that exceeds primary drinking water standards. Other reference information for each census block group included the names of specific contaminants that are above or close to the MCL, the data coverage, and the disadvantaged community status based on median household income.
RISK ASSESSMENT RESULTSDue to the lack of data from actual state small water systems and domestic wells, it is difficult to precisely determine the count of systems and wells at-risk. The risk analysis described above uses proxy groundwater quality data to identify areas where shallow groundwater quality may exceed primary drinking water standards. These proxy data do not assess the compliance of any individual well or system. As a result, the presence of a given state small water system or domestic well within a high-risk area does not signify that they are accessing groundwater above primary drinking water standards. Conversely, a state small water system or domestic well mapped in a low-risk area may be in fact accessing groundwater above primary drinking water standards. Physical monitoring and testing of state small water systems and individual domestic well water is needed to determine if those systems are producing water that does not meet drinking water standards.
Table 14 shows the approximate counts of state small water systems and domestic wells statewide located in source water quality risk designations based on data from the 2020 Aquifer Risk Map.
Table 14: Domestic Well and State Small Water System Counts by Section Water Quality Risk Category (Statewide)
Section Water Quality Risk Designation Domestic Wells4 State Small Water
SystemsHigh Risk 77,973 611Medium Risk 15,791 71Low Risk 147,185 554No Data 84,800 227
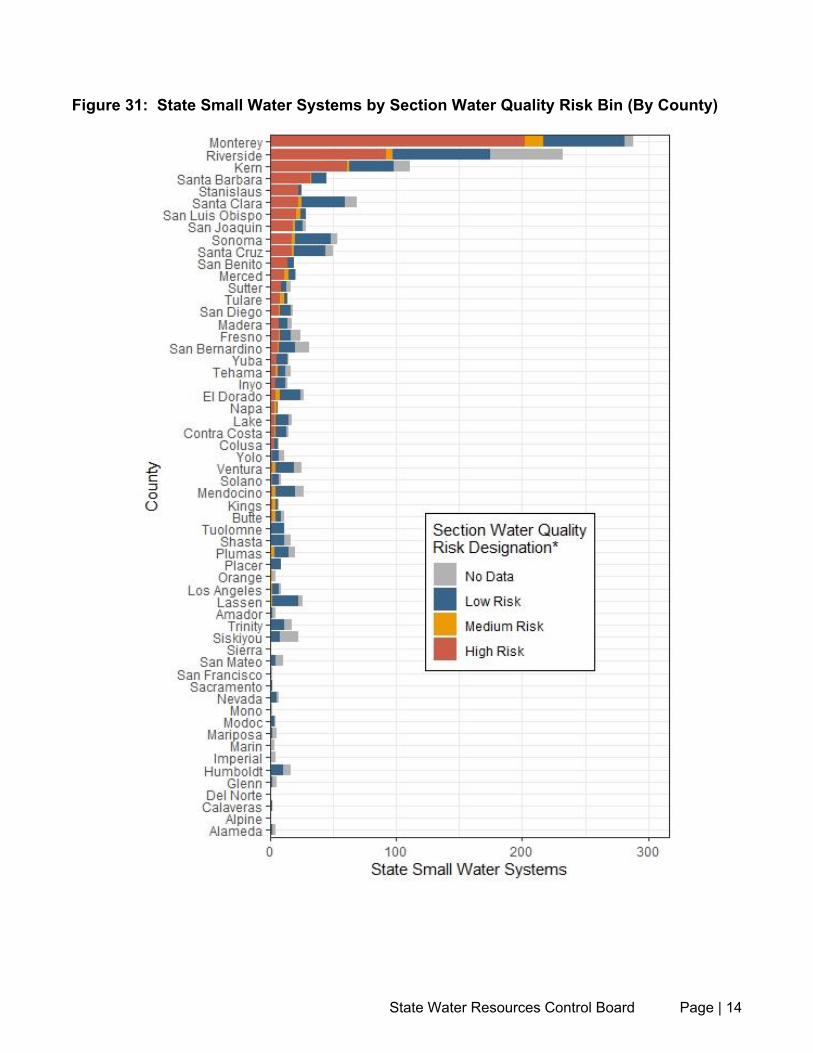
Figure 30 shows the counties that have the highest number of domestic wells mapped in high risk sections, as well as the total number of domestic wells per county. Figure 31 shows the counties that have the highest number of state small systems mapped in high risk sections, as well as the total number of state small systems per county. Figure 32 shows the highest risk areas based on the census block group combined risk percentile ranking from the 2020 Aquifer
4 Domestic well locations are approximated using the OSWCR domestic well completion records. Learn more in Appendix B.

State Water Resources Control Board Page | 13
Risk Map. For more detail about the Section Water Quality Risk Designations, please refer to Appendix B.
Figure 30: Domestic Well Records by Section Water Quality Risk Bin (By County)
State Water Resources Control Board Page | 14
Figure 31: State Small Water Systems by Section Water Quality Risk Bin (By County)

State Water Resources Control Board Page | 15
Figure 32: Combined Risk Percentile for Domestic Wells and State Small Water Systems (Census Block Groups)

State Water Resources Control Board Page | 16
Statewide, the top contaminants that contributed to higher risk designations in domestic wells and state small water systems are nitrate, arsenic, 1,2,3-trichloropropane, gross alpha, uranium, and hexavalent chromium. Figure 33 shows the proportion of domestic wells in high risk areas where the contaminant may exceed drinking water standards. Note that multiple contaminants may exceed drinking water standards at a single location.
Figure 33: Constituents Contributing to Shallow Water Quality Risk
LIMITATIONS OF THE RISK ASSESSMENT FOR STATE SMALL WATER SYSTEMS & DOMESTIC WELLSThe state small water system and domestic well risk ranking developed using this methodology is not intended to depict actual groundwater quality conditions at any given domestic supply well or small water system location. The purpose of this risk map analysis is to prioritize areas that may not meet primary drinking water standards to inform additional investigation and sampling efforts. The current lack of available state small water system and domestic well water quality data makes it impossible to characterize the actual water quality for any individual state small water system or domestic well. The analysis described here thus represents a good faith effort at using readily available data to estimate water quality risk for state small water systems and domestic wells.
REFINEMENT OPPORTUNITIESProvisions under SB 200 requires Counties to provide location and any available water quality data for state small water systems and domestic wells. The State Water Board is assisting Counties in complying with these provisions and is developing a new database to collect and
State Water Resources Control Board Page | 17
validate this data as it is submitted.5 Future iterations of the Aquifer Risk Map and Risk Assessment for state small water systems and domestic wells will incorporate the locational and water quality data collected through this effort. When sufficient information becomes available, it may be possible to expand the Risk Assessment methodology for state small water systems and domestic wells to better align with the approach employed by the Risk Assessment for public water systems. This can only be achieved if specific, rather than proxy, state small water system and domestic well water quality data are available.
State Water Board staff are partnering with OEHHA to explore additional metrics that may be incorporated into future iterations of the Risk Assessment for state small water systems and domestic wells. In particular, the group will be exploring data availability of metrics that align with the risk indicator categories employed by the Risk Assessment for public water systems: Water Quality, Accessibility, Affordability, and TMF Capacity.
Future work may involve connecting the State Water Board’s source water quality risk data to the Department of Water Resources drought risk assessment of rural/self-supported communities. The drought risk assessment identifies census block groups that are at risk of water shortage or water supply issues.
5 State Small Water System and Domestic Well Water Quality Data https://www.waterboards.ca.gov/drinking_water/certlic/drinkingwater/small_water_system_quality_data.html

State Water Resources Control Board Page | 18
APPENDIX B: RISK ASSESSMENT METHODOLOGY FOR STATE SMALL WATER SYSTEMS
& DOMESTIC WELLS
INTRODUCTIONThe aquifer risk map was developed to fulfill requirements of Senate Bill (SB 200, Monning, 2019), and is a component of California’s Safe and Affordable Fund for Equity and Resilience (SAFER) Program. The aquifer risk map is intended to help prioritize areas where domestic wells and state small water systems may be accessing groundwater that does not meet primary drinking water standards (maximum contaminant level or MCL). In accordance with SB 200, the risk map is available to the public and is to be updated annually starting January 1, 2021. SB 200 also requires that a Fund Expenditure Plan be developed annually. The Fund Expenditure Plan states that the risk map will be used by Water Board staff to help prioritize areas for available SAFER funding.
The aquifer risk map contains several data layers. The water quality risk layer compiles available de-clustered, depth-filtered water quality results, applies risk factors to those data, and ranks, by percentile, the relative risk of groundwater in an area not meeting primary drinking water standards. The domestic well density layer plots the density of domestic wells based on available well record data.6 The state small water system layer shows the locations of state small water systems, based on data provided by counties and other oversight agencies.7 The combined risk layer combines the water quality risk ranking with the domestic well and state small system density of an area to calculate the overall risk to domestic well and state small systems. By combining these two data elements, areas with a relatively high density of reported domestic wells or state small water systems, and a high relative risk to water quality, are assigned the highest combined risk. Other reference layers that can be overlaid on the map for reference include boundaries of priority areas in the Central Valley CV-SALTS program, Groundwater Sustainability Agency boundaries, and Disadvantaged Community status data.
6 The well record information is from the Department of Water Resources Online System for Well Completion Reports.https://dwr.maps.arcgis.com/apps/webappviewer/index.html?id=181078580a214c0986e2da28f8623b377 The small water system location data may not represent the actual location of the well head or of the service boundaries. Due to constraints in locating small water systems, the location may represent the administrative address, or another location associated with the system. Additionally, the locations for Monterey County were provided for all systems with 2 – 14 connections. To isolate the systems in Monterey County that fit the definition of state small water systems (5 – 14 connections) only systems that serve four or more APNs were included in this analysis (totaling 268 systems in Monterey County).
State Water Resources Control Board Page | 19
RISK ASSESSMENT METHODOLOGY DEVELOPMENT PROCESSThree public webinars were held by the State Water Board over the course of 2020 to solicit public feedback on the development of the aquifer risk map. The first webinar on April 17, 2021 involved the presentation of available data, previous work, and information about the initial map development. The second webinar on July 22, 2020 presented several draft methodologies and the initial results. The third webinar on October 9, 2020 presented the final draft methodology. All three webinars were held remotely over Zoom and included opportunities for public participants to ask questions directly during the meeting or to submit questions via email during or after the meeting.
The aquifer risk map work was influenced by previous work developing the Domestic Well Water Quality Tool, which provided an estimate of the number and location of domestic wells at-risk for water quality issues. Development of the Domestic Well Water Quality Tool involved a public workshop on January 18, 2019.
INTENDED USE OF THIS ANALYSISThe water quality risk ranking developed using this methodology are not intended to depict actual groundwater quality conditions at any given domestic supply well or small water system location. The purpose of this risk map analysis is to prioritize areas that may not meet primary drinking water standards to inform additional investigation and sampling efforts. The current lack of available domestic well and state small system water quality data makes it impossible to characterize the water quality for individual domestic wells and state small systems. The analysis described here thus represents a best effort at using the available data to estimate water quality risk for domestic wells and state small systems.
METHODOLOGYDATA PROCESSINGWater quality results from the Division of Drinking Water (DDW), the US Geological Survey (USGS)-Groundwater Ambient Monitoring and Assessment (GAMA) programs’ Priority Basin and Domestic Well Projects, the USGS-National Water Information System dataset, the Department of Water Resources (DWR), local groundwater monitoring projects, and the Irrigated Lands Regulatory Program (AGLAND) were included in this analysis. Water quality data from most regulated clean-up and monitoring sites (Geotracker) were not included in this analysis as these data were not considered to be representative of groundwater typically accessed by domestic wells. Results were only included if the well met the depth-filtering criteria developed in the Domestic Well Needs Assessment project. Data from all chemical constituents with a Maximum Contaminant Level (MCL) are assessed, and several additional chemical constituents including hexavalent chromium, copper, lead, and N-

State Water Resources Control Board Page | 20
Nitrosodimethylamine (NDMA) are included in the analysis as well8. Water quality results were converted to an MCL Index9 to allow comparison between chemical constituents (see Table B1 for chemical constituent codes and MCL values). A more detailed presentation of data collection, data standardization, and data filtering are outlined in the Needs Assessment Domestic Well Water Quality Tool White Paper.10 The R script used to download, process, and filter the water quality data is available on GitHub.11
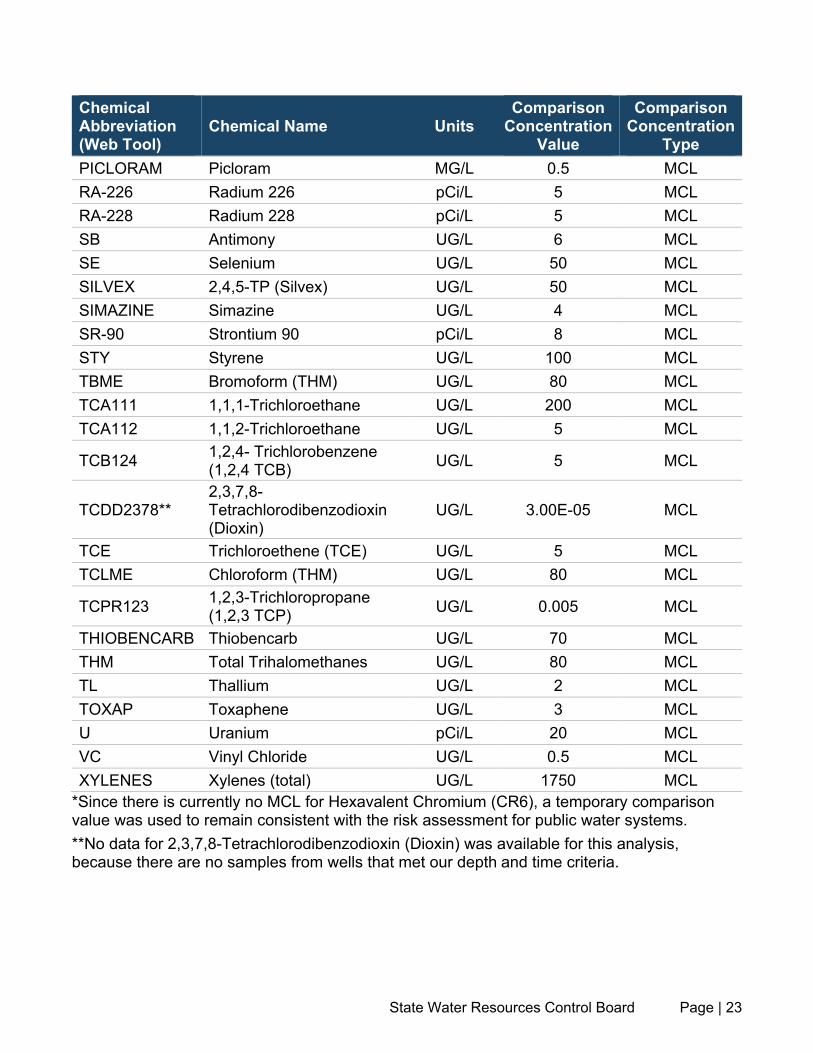
Table B1: Chemical Constituent Codes and Maximum Contaminant Values for Aquifer Risk Map Chemical Constituents
Chemical Abbreviation (Web Tool)
Chemical Name UnitsComparison
Concentration Value
Comparison Concentration
Type
24D 2,4-Dichlorophenoxyacetic acid (2,4 D) UG/L 70 MCL
AL Aluminum UG/L 1000 MCLALACL Alachlor UG/L 2 MCLALPHA Gross Alpha radioactivity pCi/L 15 MCLAS Arsenic UG/L 10 MCLATRAZINE Atrazine UG/L 1 MCLBA Barium MG/L 1 MCL
BDCME Bromodichloromethane (THM) UG/L 80 MCL
BE Beryllium UG/L 4 MCLBETA Gross beta pCi/L 50 MCLBHCGAMMA Lindane (Gamma-BHC) UG/L 0.2 MCL
BIS2EHP Di(2-ethylhexyl)phthalate (DEHP) UG/L 4 MCL
BRO3 Bromate UG/L 10 MCLBTZ Bentazon UG/L 18 MCLBZ Benzene UG/L 1 MCLBZAP Benzo(a)pyrene UG/L 0.2 MCL
8 The comparison concentration values for chemicals without an MCL are as follows: Hexavalent Chromium – 10 micrograms per liter (µG/L); Copper – 1.3 milligrams per liter (MG/L); Lead – 15 µG/L; N-Nitrosodimethylamine (NDMA) – 0.1 µG/L.9 See page 5 of the Domestic Well Needs Assessment White Paper. The MCL index consists of the finding divided by the MCL, with a special consideration for non-detect results with a reporting limit above the MCL.10 GAMA Needs Assessment White Paper-Draft https://gispublic.waterboards.ca.gov/portal/home/item.html?id=70feb9f4b00f4b3384a9a0bf89f9f18a11 Methodology script (GitHub) https://github.com/EmilyHoulihan/Aquifer_Risk_Map

State Water Resources Control Board Page | 21
Chemical Abbreviation (Web Tool)
Chemical Name UnitsComparison
Concentration Value
Comparison Concentration
TypeBZME Toluene UG/L 150 MCLCD Cadmium UG/L 5 MCLCHLORDANE Chlordane UG/L 0.1 MCLCHLORITE Chlorite MG/L 1 MCLCLBZ Chlorobenzene UG/L 70 MCLCN Cyanide (CN) UG/L 150 MCLCR Chromium UG/L 50 MCL
CR6 Chromium, Hexavalent (Cr6) UG/L 10
Temporary comparison
level*CRBFN Carbofuran UG/L 18 MCLCTCL Carbon Tetrachloride UG/L 0.5 MCLCU Copper MG/L 1.3 Action LevelDALAPON Dalapon UG/L 200 MCL
DBCME Dibromochloromethane (THM) UG/L 80 MCL
DBCP 1,2-Dibromo-3-chloropropane (DBCP) UG/L 0.2 MCL
DCA11 1,1-Dichloroethane (1,1 DCA) UG/L 5 MCL
DCA12 1,2 Dichloroethane (1,2 DCA) UG/L 0.5 MCL
DCBZ12 1,2 Dichlorobenzene (1,2-DCB) UG/L 600 MCL
DCBZ14 1,4-Dichlorobenzene (p-DCB) UG/L 5 MCL
DCE11 1,1 Dichloroethylene (1,1 DCE) UG/L 6 MCL
DCE12C cis-1,2 Dichloroethylene UG/L 6 MCLDCE12T trans-1,2, Dichloroethylene UG/L 10 MCL
DCMA Dichloromethane (Methylene Chloride) UG/L 5 MCL
DCP13 1,3 Dichloropropene UG/L 0.5 MCL
DCPA12 1,2 Dichloropropane (1,2 DCP) UG/L 5 MCL
DINOSEB Dinoseb UG/L 7 MCLDIQUAT Diquat UG/L 20 MCL

State Water Resources Control Board Page | 22
Chemical Abbreviation (Web Tool)
Chemical Name UnitsComparison
Concentration Value
Comparison Concentration
TypeDOA Di(2-ethylhexyl)adipate MG/L 0.4 MCLEBZ Ethylbenzene UG/L 300 MCLEDB 1,2 Dibromoethane (EDB) UG/L 0.05 MCLENDOTHAL Endothall UG/L 100 MCLENDRIN Endrin UG/L 2 MCLF Fluoride MG/L 2 MCL
FC11 Trichlorofluoromethane (Freon 11) UG/L 150 MCL
FC113 1,1,2-Trichloro-1,2,2-Trifluoroethane (Freon 113) MG/L 1.2 MCL
GLYP Glyphosate (Round-up) UG/L 700 MCLH-3 Tritium pCi/L 20000 MCLHCCP Hexachlorocyclopentadiene UG/L 50 MCLHCLBZ Hexachlorobenzene (HCB) UG/L 1 MCLHEPTACHLOR Heptachlor UG/L 0.01 MCLHEPT-EPOX Heptachlor Epoxide UG/L 0.01 MCLHG Mercury UG/L 2 MCLMOLINATE Molinate UG/L 20 MCL
MTBE MTBE (Methyl-tert-butyl ether) UG/L 13 MCL
MTXYCL Methoxychlor UG/L 30 MCLNI Nickel UG/L 100 MCL
NNSM N-Nitrosodimethylamine (NDMA) UG/L 0.01 NL
NO2 Nitrite as N MG/L 1 MCLNO3N Nitrate as N MG/L 10 MCLOXAMYL Oxamyl UG/L 50 MCLPB Lead UG/L 15 Action Level
PCA 1,1,2,2 Tetrachloroethane (PCA) UG/L 1 MCL
PCATE Perchlorate UG/L 6 MCL
PCB1016 Polychlorinated Biphenyls (PCBs) UG/L 0.5 MCL
PCE Tetrachloroethene (PCE) UG/L 5 MCLPCP Pentachlorophenol (PCP) UG/L 1 MCL
State Water Resources Control Board Page | 23
Chemical Abbreviation (Web Tool)
Chemical Name UnitsComparison
Concentration Value
Comparison Concentration
TypePICLORAM Picloram MG/L 0.5 MCLRA-226 Radium 226 pCi/L 5 MCLRA-228 Radium 228 pCi/L 5 MCLSB Antimony UG/L 6 MCLSE Selenium UG/L 50 MCLSILVEX 2,4,5-TP (Silvex) UG/L 50 MCLSIMAZINE Simazine UG/L 4 MCLSR-90 Strontium 90 pCi/L 8 MCLSTY Styrene UG/L 100 MCLTBME Bromoform (THM) UG/L 80 MCLTCA111 1,1,1-Trichloroethane UG/L 200 MCLTCA112 1,1,2-Trichloroethane UG/L 5 MCL
TCB124 1,2,4- Trichlorobenzene (1,2,4 TCB) UG/L 5 MCL
TCDD2378**2,3,7,8-Tetrachlorodibenzodioxin (Dioxin)
UG/L 3.00E-05 MCL
TCE Trichloroethene (TCE) UG/L 5 MCLTCLME Chloroform (THM) UG/L 80 MCL
TCPR123 1,2,3-Trichloropropane (1,2,3 TCP) UG/L 0.005 MCL
THIOBENCARB Thiobencarb UG/L 70 MCLTHM Total Trihalomethanes UG/L 80 MCLTL Thallium UG/L 2 MCLTOXAP Toxaphene UG/L 3 MCLU Uranium pCi/L 20 MCLVC Vinyl Chloride UG/L 0.5 MCLXYLENES Xylenes (total) UG/L 1750 MCL
*Since there is currently no MCL for Hexavalent Chromium (CR6), a temporary comparison value was used to remain consistent with the risk assessment for public water systems.**No data for 2,3,7,8-Tetrachlorodibenzodioxin (Dioxin) was available for this analysis, because there are no samples from wells that met our depth and time criteria.

State Water Resources Control Board Page | 24
DEPTH FILTERMost available groundwater quality data is sourced from public (municipal) supply wells. This is a result of California’s requirement for monitoring and reporting of groundwater from wells that are part of a public water system that supplies water to 15 or more service connections. In contrast, domestic wells (any system that serves less than 5 connections) and state small water systems (5 – 14 connections) are not regulated by the state and therefore lack comprehensive data.
For many regions, municipal supply wells access a deeper portion of the groundwater resource when compared with domestic wells. This deeper groundwater is typically less affected by contaminants introduced at the ground surface than shallower groundwater. As a result, use of data from municipal wells would likely result in a systematically low bias for an estimate of the shallower groundwater typically accessed by domestic wells.
Accordingly, staff developed a method to filter data that more likely represents shallower groundwater accessed by domestic wells, as summarized below.
Since well depth varies throughout the state, a domestic depth zone was defined numerically for each groundwater unit12 based on Total Completed Depth statistics from the OSWCR database. Based on well depth data in the OSCWR database, a well depth interval per groundwater unit was determined for wells classified as domestic and for wells classified as public (Figure 1). These well depth statistics were then compared to assess whether domestic and public well depth intervals overlap, which indicates that they access the same groundwater source. For groundwater units where the depth interval for public and domestic wells overlapped (or the public interval was shallower) water quality data from public wells was included in the analysis. For groundwater units where the depth interval for public wells was deeper than the depth interval for domestic wells, water quality data from public wells was screened out of the analysis. For details on the maximum domestic well depth and the comparison of public and domestic wells for each groundwater unit, see Attachment B1.13
12 This project uses Groundwater Units as areas of analysis. Groundwater Units consist of groundwater basins as defined by DWR Bulletin 118, and the connecting upland areas associated with each of these basins as delineated by the USGS. Use of Groundwater Units results in coverage of the entire state. Averaging of well depths and groundwater quality within a Groundwater Unit was considered reasonable based on the assumed relative consistency of hydrogeologic conditions within each Unit. https://water.ca.gov/-/media/DWR-Website/Web-Pages/Programs/Groundwater-Management/Bulletin-118/Files/B118-Interim-Update-2016.pdf https://www.sciencedirect.com/science/article/pii/S2214581814000305?via%3Dihub13 Attachment B1 lists the depth filter output for each groundwater unit in California. The table shows the ID, name, maximum domestic depth (in feet) and whether that groundwater unit has domestic and public wells at similar depths. The numeric value in the third column indicates the domestic depth maximum cutoff – only wells with shallower depths are used to estimate domestic/state small water quality. A “no” in the final column indicates that domestic and public wells are accessing different groundwater depths, and public wells are not used to estimate domestic/state small water quality when well depth is unknown. A “yes” in the final column indicates that domestic and public wells are accessing similar groundwater depths, and public wells are used to estimated domestic/state small water quality when well depth is unknown. depth_filtered_by_groundwater_unit_arm https://gispublic.waterboards.ca.gov/portal/home/item.html?id=55258176731a4cefb24fc571d8136276

State Water Resources Control Board Page | 25
Figure B1 illustrates the numeric depth filter which is based on the average of section maximum/minimum well depths per Groundwater Unit. Wells with a known depth that fall within the “domestic well depth interval” are included in the analysis. Wells with a known depth that fall outside the “domestic well depth interval” are screened out of the analysis. For wells without a known depth - if the “public bottom” depth of a Groundwater Unit is shallower or within 10% of the “domestic bottom” depth, then wells classified as public are included in the analysis. If the “public bottom” depth of a Groundwater Unit is more than 10% deeper than the “domestic bottom” depth, then wells classified as public are screened out of the analysis.
Figure B1: Numeric Depth Filter
Figure B2 illustrates the depth filter by well type (for wells with unknown depth) in California. This map shows basins where domestic wells and public wells may be accessing similar groundwater depths (pink) and basins where domestic wells and public wells are accessing

State Water Resources Control Board Page | 26
different groundwater depths (blue). For the basins show in pink, public wells were used as a proxy for domestic depth water quality.
Figure B2: Depth by Well Type
Most wells with water quality data do not have well construction data (indicating the depth of well or screen interval). Wells with depth data were filtered based on their numeric well construction; wells without numeric construction data were filtered by well type.
WELLS WITH KNOWN NUMERIC DEPTHSStaff used OSWCR Total Completed Depth section summary statistics to determine a “Domestic Bottom” and “Domestic Top” depth for each Groundwater Unit. The domestic well depth zone was defined as the range between “Domestic Bottom” depth14 and “Domestic Top” depth15. For Group 1 wells, if the given depth of the well fell between the “Domestic Top” depth
14 Domestic Bottom = average of section maximum domestic well depths (from OSWCR) plus 3 standard deviations of section maximum well depths for each groundwater unit.15 Domestic Top = average of section minimum domestic well depths (from OSWCR) minus 3 standard deviations of section minimum well depths for groundwater unit.

State Water Resources Control Board Page | 27
and the “Domestic Bottom” depth, water quality data from that well was included in the analysis.
WELLS WITH UNKNOWN NUMERIC DEPTHSStaff used OSWCR well depth information to compare “Domestic Bottom” depth (defined above) to “Public Bottom” depth16 (defined below). If the “Public Bottom” depth for a given Groundwater Unit was shallower than the “Domestic Bottom” depth, or within 10% of “Domestic Bottom” depth (shallower or deeper), then it was considered reasonable to include data from public wells into the analysis for that Groundwater Unit. If the “Public Bottom” depth for a given Groundwater Unit was more than 10% deeper than the “Domestic Bottom” depth, water quality data from public wells was screened out of the analysis for that Groundwater Unit.
DE-CLUSTERINGAvailable water quality results were spatially and temporally de-clustered to square mile sections to account for differences in data sampling density within each section over space and time. This was conducted to prevent certain areas with a high density of wells and frequent sampling to achieve a disproportionate weighting to the overall risk characterization of an area. To expand the coverage of the water quality risk map, averaged, de-clustered data from sections that contain a well(s) that provide water quality data (“source sections”) are projected onto neighboring sections that do not include a well providing water quality data.
Water quality data is assessed using two metrics - the long-term (20 year17) average and all recent results (within 2 years18). The temporal and spatial de-clustering methodology for each metric is outlined below and is further described in the Domestic Well Needs Assessment White Paper.19
LONG-TERM AVERAGE
1. Water quality results from each well for each chemical constituent are averaged per year (for the past 20 years).
2. The results from step one are averaged per well.3. The results from step two are averaged for all the wells that lie within a section.
16 Public Bottom = average of section maximum public well depths (from OSWCR) plus 3 standard deviations of section maximum well depths for groundwater units.17 To calculate the 20-year average, water quality results with sample collection dates between January 1, 2000 and January 1, 2020 were used.18 To calculate results within the last two years, water quality results with sample collection dates between January 1, 2018 and January 1, 2020 were used.19 For this map, on the “source” and “neighbor” sections described in the Domestic Well Needs Assessment White Paper are used. The Domestic Well Needs Assessment White Paper also describes the calculations for “groundwater unit” sections, which are not included in this map.

State Water Resources Control Board Page | 28
4. For sections that do not contain a well with water quality data, the de-clustered data from step three are projected onto adjacent sections.
RECENT RESULTS1. All recent (within the past 2 years) results in a section are categorized as “under” (less
than 80 percent of MCL), “close” (80 percent – 100 percent of MCL), or “over” (greater than MCL).
2. The count of recent results in each category are summarized per square mile section for each constituent.
3. For square mile sections that do not contain a well with recent water quality data, the results from step two is averaged for all adjacent sections.
UNIT OF ANALYSISGroundwater quality risk is summarized by census block group. This allows the water quality risk to be combined with existing census information, such as disadvantaged community status and other demographic information. This also allows the data to be combined with the results of the Department of Water Resources Drought and Water Shortage Risk mapping, which identifies water accessibility risk throughout the state. Water quality data can also be viewed as individual well points and compiled into square mile public land survey sections. The well point and section-level data allow the user to better understand the potential distribution of available water quality data within a census block that contributed to the overall risk ranking for that block. State small system location data is available as point locations, and domestic well density information is available as both count per square mile and as count per census block group.
RISK FACTORS
WATER QUALITY RISK (“HAZARD”)Water quality data for census block groups are calculated using data from all sections within the census block group. Prioritization of census block groups is based on five water quality risk factors that capture different aspects of water quality risk based on the available data. Several additional informational fields are included for reference.
Table B2: Water Quality Risk Factors for Domestic Wells and State Small Water Systems (For Each Census Block Group)
Risk Factor Notification Description
Count of chemical constituents above MCL
CRF1 Number of individual chemical constituents which have a long-term (20 year) average or recent result (within the past 2 years) above the MCL.

State Water Resources Control Board Page | 29
Risk Factor Notification Description
Count of chemical constituents within 80 percent of MCL
CRF2 Number of chemical constituents with a long-term average or recent result within 80 percent and 100 percent of the MCL.
Average MCL Index (for results above MCL)
CRF3 Magnitude of the average result for chemical constituents with a long-term average or recent result above the MCL.
Percent of high risk sections
CRF4 Percentage of square mile sections in the census block group that contain at least one constituent with a long-term average or recent result above the MCL (i.e., “high risk”).
Percent of medium risk sections
CRF5 Percentage of square mile sections in the census block group that contain at least one constituent with a long-term average or recent result within 80 percent – 100 percent of the MCL (i.e., “medium risk”).
Table B3: Additional Reference Information for Water Quality Risk Factors for Domestic Well and State Small Water Systems (For Each Census Block Group)
Reference Data Description
List of chemical constituents above MCL
List of chemical constituents with a long-term or recent result above the MCL
List of chemical constituents within 80 percent of MCL
List of chemical constituents with a long-term or recent result within 80 percent – 100 percent of MCL.
Percent area with water quality data
The percentage of sections in the census block group that contain water quality data.
These water quality risk factors are aggregated into a final water quality score, calculated as:
The water quality scores for all census block groups are converted into percentiles to normalize the scores. Higher scores and high percentiles indicate areas that are at relatively

State Water Resources Control Board Page | 30
higher risk for water quality issues in domestic wells and state small water systems. Census block groups with a score of zero (no constituents above or close to the MCL) are automatically assigned to the 0th percentile and are not included in the percentile calculation. Approximately 33 percent of census block groups fall into this category. It is important to note that because of the data filtering and de-clustering involved in these calculations, a risk percentile of zero does not necessarily mean there is no water quality risk in an area (see discussion on areas with sparse/no available data, below).
In addition to the census block group percentiles, detailed data layers show water quality data summarized at the square mile section level and at the point (well) level. These layers display similar risk factors for sections and well points:
Table B4: Water Quality Data for Domestic Wells and State Small Water Systems (For Each Square Mile Section)
Section Data Risk Information Description
Section Risk Category
Categorizes sections as being “high”, “medium”, or “low” water quality risk.“High”: contains at least one constituent with a long-term average or recent result above the MCL“Medium”: contains at least one constituent with a long-term average or recent result within 80 percent – 100 percent of the MCL“Low”: contains no constituents with a long-term average or recent result greater than 80 percent of the MCL
Count of chemical constituents above MCL
Number of chemical constituents in the section that have a long-term (20 year) average or recent result (within the past 2 years) above the MCL.
Count of chemical constituents within 80 percent of MCL
Number of chemical constituents in the section that have a long-term (20 year) average or recent result (within the past 2 years) within 80 percent and 100 percent of the MCL.
Average MCL Index (for results above MCL)
Average magnitude of chemical constituents that are above the MCL in the section.
List of chemical constituents above MCL
List of chemical constituents with a long-term or recent result above the MCL in the section
List of chemical constituents close to MCL
List of chemical constituents with a long-term or recent result within 80 percent – 100 percent of MCL in the section

State Water Resources Control Board Page | 31
Table B5: Water Quality Data for Domestic Wells and State Small Water Systems (For Each Well)
Point Data Risk Information Description
Well Risk Category Categorizes wells as being in a section that has a “high”, “medium”, or “low” water quality risk:
“High”: contains at least one constituent with a long-term average or recent result above the MCL
“Medium”: contains at least one constituent with a long-term average or recent result within 80 percent – 100 percent of the MCL
“Low”: contains no constituents with a long-term average or recent result greater than 80 percent of the MCL
Count of chemical constituents above MCL
Number of chemical constituents in the well that have a long-term (20 year) average or recent result (within the past 2 years) above the MCL.
Count of chemical constituents within 80 percent of MCL
Count of chemical constituents in the well that have a long-term (20 year) average or recent result (within the past 2 years) within 80 percent and 100 percent of the MCL.
Average MCL Index (for results above MCL)
Average magnitude of chemical constituents that are above the MCL in the well.
List of chemical constituents above MCL
List of chemical constituents with a long-term or recent result above the MCL in the well.
List of chemical constituents close to MCL
List of chemical constituents with a long-term or recent result within 80 percent – 100 percent of MCL in the well.
Areas with No Available Water Quality DataOut of 23,212 census block groups, approximately 5,183 (22%) do not contain water quality data for any of the chemical constituents.
Most (3,250, or 63%) of these “no data” block groups are in the most densely populated areas of the state (i.e., Los Angeles and San Francisco Bay metropolitan areas), where census block groups are very small (less than 1 square mile) and do not overlap a square mile section with a well with water quality data. These areas are predominantly served by municipal water systems and are less likely to have a significant population reliant on domestic wells. However,

State Water Resources Control Board Page | 32
there are several block groups with no data in Imperial County and parts of Humboldt, Trinity, and Shasta Counties, where there are likely populations of domestic well users. Currently, block groups with no water quality data are not included in the percentile ranking process and are assigned a water quality risk percentile of zero. Due to the data filtering and de-clustering involved in these calculations, a risk percentile score of “zero” does not mean there is not a water quality risk in each area.
Areas with Sparse Available Water Quality DataAdditionally, there are 118 census block groups that contain sparse (less than 10%) data coverage. While these block groups are included in the percentile ranking, they are flagged on the tool with the hatch marks to alert the user to this concern.
Individual Chemical ConstituentsSingle-chemical constituent layers are available as square mile section data for Nitrate, Arsenic, 1,2,3-Trichloropropane, Hexavalent Chromium, and Uranium. These layers display the long-term average and the count of recent results over, close to, and under the MCL per square mile section for a single chemical constituent.
DOMESTIC WELL AND STATE SMALL SYSTEM DENSITY (“EXPOSURE”)This layer identifies areas where available data indicates a relatively high density of domestic wells and state small systems. The density of domestic wells is calculated from the count of domestic well records per mile in the California Department of Water Resources Online System for Well Completion Reports (OSWCR). OSWCR records with a completion date prior to 1970 were not included in this assessment to avoid including wells that may no longer be in use. Exposure risk is based on the number of domestic wells and state small water systems per square mile in the census block group (density). The “exposure risk” is calculated by normalizing the density to percentiles for all census block groups.
COMBINED RISK (WATER QUALITY AND DOMESTIC WELL/STATE SMALL RELIANT POPULATION)The combined risk layer combines the water quality risk (“hazard”) with the domestic well and state small density (“exposure”) using the following equation:
To avoid under-representing the risk of areas with little to no data, the final equation to calculate combined risk is additive (instead of multiplicative) because areas with a water quality risk or domestic well and state small system density of “zero” might just have low or no available data. A “zero” does not necessarily indicate no risk to water quality or no domestic

State Water Resources Control Board Page | 33
well/state small system users because of the uncertainty in both individual risk layers. The final combined risk value is then re-normalized to a percentile.
The metadata for this layer includes the following fields:
Table B6: Risk Factors for Domestic Wells and State Small Water Systems (For Each Census Block Group)
Combined Risk Factor Description
Water quality risk percentile
See above section “Water Quality Risk (Hazard)”
Domestic well and state small system density percentile
See above section “Domestic Well and State Small System Density (Exposure)”
Table B7: Additional Reference Information for Domestic Wells and State Small Water Systems (For Each Census Block Group)
Reference Data Description
Count of domestic wells in census block group
Count of domestic wells from OSWCR, excluding those drilled prior to 1970.
Count of state small water systems in census block group
Count of state small water systems from RCAC.
Disadvantaged community status of census block group
From the Department of Water Resources (2018), this indicates if a census block group is disadvantaged (Median Household Income (MHI) is less than $56,982, or 80% of California MHI) or severely disadvantaged (MHI is less than $42,737, or 60% of California MHI). MHI information is not available for some areas.