2021 annual energy paper
TRANSCRIPT

EYE ON THE MARKET
2021 Annual Energy Paper
Future shock. Absent decarbonization shock treatment, humans will be wedded to petroleum and other fossil fuels for longer than they would like. Wind and solar power reach new heights every year but still represent just 5% of global primary energy consumption. In this year’s energy paper, we review why decarbonization is taking so long: transmission obstacles, industrial energy use, the gargantuan mineral and pipeline demands of sequestration and the slow motion EV revolution. Other topics include our oil & gas views, President Biden’s energy agenda, China, the Texas power outage and client questions on electrified shipping, sustainable aviation fuels, low energy nuclear power, hydrogen and carbon accounting.
MICHAEL CEMBALEST | JP MORGAN ASSET AND WEALTH MANAGEMENT

1
MICHAEL CEMBALEST
Eye on the Market
Chairman of Market and Investment Strategy
J.P. Morgan Asset Management
Welcome to our 11th annual energy paper. Each year, we examine what’s happening on the ground as the fourth great energy transition unfolds. Our main focus this year: why is the transition taking so long? Deep decarbonization plans assume massive changes in electric vehicles, electricity transmission grids, industrial energy use and carbon sequestration, but each faces headwinds often not accounted for by energy futurists. As shown below, many prior forecasts of the renewable transition were too ambitious since they ignored energy density, intermittency and the complex realities of incumbent energy systems. We follow up with an update to our bullish oil and gas call from last year and examine Biden’s energy agenda. We discuss China’s rare earth metals diplomacy, US distributed solar power and conclude with last words on the Texas power outage and answers to client questions on electrified shipping, sustainable aviation fuels, hydrogen and carbon accounting.
As always, I would like to acknowledge the insights and oversight provided by our technical advisor Vaclav Smil, who has patiently guided my energy journey since this paper’s inception 11 years ago. This effort has been one of the most rewarding experiences in my 34 years at JP Morgan.
Physicist Bent Sorensen
Amory Lovins, Rocky Mountain Institute
Carter Administration (solar only)
Clinton Presidential Advisory Panel
Intergovernmental Panel on Climate Change
Google 2030 Clean Energy Plan
National Renewable Energy Laboratory
In 2020, Mark Jacobson (Stanford) forecast 80% by 2030
2
3
1
7
65
4
0%
10%
20%
30%
40%
50%
1960 1970 1980 1990 2000 2010 2020 2030
Source: EIA, listed authors, Vaclav Smil, JPMAM. 2019. Renew ables include w ind, solar, hydropower, geothermal, biomass, w ood and waste.
Overly ambitious forecasts of the 4th great energy transitionRenew able share of US primary energy consumptionLines start when forecasts were made and end in year of forecast
Actual renewable share of US primary energy
1
2
3
4
5
6
7

2
Executive Summary
President Biden just announced a new GHG emissions target: a 50% decline by 2030 vs a 2005 baseline. This very ambitious target implies a decarbonization pace in the next 10 years that’s four times faster than in the last 15 years. Even with the amount of money the administration plans to dedicate to the task, it’s an enormous hurdle. In this paper, we will be discussing some of the reasons why.
The even more important and larger question: even if the US succeeds, what about everyone else? Over the last 25 years, the developed world shifted much of its carbon-intensive manufacturing of steel, cement, ammonia and plastics to the developing world. As a result, developing world adoption of wind, solar, storage and nuclear power may end up being the primary determinant of future global emissions outcomes. That has certainly been the case over the last decade: Europe and Japan reduced primary energy use1 by 4%-6% but developing world increases were 6x higher than their reductions; China/India energy use is still soaring; and Africa’s energy use is rising from per capita levels seen in Europe in the 19th century. The world gets more energy efficient every year, but levels of emissions keep rising. That’s why most deep decarbonization ideas rely on replacement of fossil fuels rather than reducing fossil fuel consumption per capita or per unit of performance.
1 Primary energy refers to thermal energy contained in fossil and biomass fuels and also to thermal equivalents of primary electricity generated from nuclear and renewable sources. Converting primary electricity to primary energy can be done by using its thermal equivalent (1 kWh=3.6 MJ or 3,412 BTU) or by using an average annual heat rate of fossil fuel plants (40% efficiency, equal to 9 MJ/kWh or 8,530 BTU). Final energy consumption is equal to primary energy less (a) energy lost in the conversion of fossil fuels (crude oil refining, natural gas processing) (b) energy lost in conversion of fossil fuels to electricity, (c) power plant consumption of electricity and (d) transmission losses.
2
3
4
5
6
7
8
1990 1995 2000 2005 2010 2015 2020 2025 2030
The Biden plan: halving emissions from 2005 to 2030GHG emissions, billion tonnes of CO2 equivalent
Source: EPA, UN, JPMAM. 2019.
Biden 2030 plan
0%
10%
20%
30%
40%
50%
60%
70%
80%
90%
100%
1995 2019 1998 2020 1998 2019 1998 2020 2005 2019
Source: UN Dept. of Social and Economic Affairs, Worldsteel, PlasticsEurope, USGS. 2020.
A shift in energy intensive manufacturing to the emerging world, % of global production
Manufacturing SteelAmmonia Cement
Developed economies
Emerging economies
Plastic
-400
-200
0
200
400
600
800
EU Japan US LatinAmerica
SE Asiaex-
Ch/India
MiddleEast
Africa China India
Historical change 2010 to 2019
Projected change 2019 to 2040
Source: International Energy Agency Stated Policies Scenario. 2020.
Change in primary energy use, past and futureMillion tonnes of oil equivalent
10
15
20
25
30
35
0.20
0.25
0.30
0.35
0.40
0.45
0.50
0.55
0.60
1965 1970 1975 1980 1985 1990 1995 2000 2005 2010 2015 2020
Source: BP Statistical Review of World Energy, Conference Board. 2020.
Global CO2 intensity declining, CO2 emissions risingTonnes of CO2 / thousand $2019 GDP Billion tonnes
CO2 intensity CO2 emissions

3
How is the global energy transition going? Taken together, the aggregate impact of nuclear, hydroelectric and solar/wind generation reduced global reliance on fossil fuels from ~95% of primary energy in 1975 to ~85% in 2020. In other words, energy transitions take a long time and lots of money. The IEA expects fossil fuel reliance to decline at a more rapid pace now, fueled in part by “Big Oil” companies becoming “Big Energy” companies and by a faster global EV transition. In 2021 renewables are for the first time expected to garner more capital spending than upstream oil & gas. This process is influenced by diverging costs of capital: 3%-5% for solar and wind, 10%-15% for natural gas and up to 20% for oil projects.
However, the IEA still projects that 70%-75% of global primary energy consumption may be met via fossil fuels in the year 2040. Why don’t rapid wind and solar price declines translate into faster decarbonization? As we will discuss, renewable energy is still mostly used to generate electricity, and electricity as a share of final energy consumption on a global basis is still just 18%. In other words, direct use of fossil fuels is still the primary mover in the modern world, as the demise of fossil fuels continues to be prematurely declared by energy futurists2. As shown in the last three charts, wind/solar capacity is growing and gains in renewable electricity generation are impressive, but in primary energy terms they are much smaller.
2 An example: the CEO of the Rocky Mountain Institute wrote last year, citing Carbon Tracker, that post-COVID global fossil fuel consumption may never surpass 2019 levels. Really? The EIA projects a full recovery in liquid fuels consumption by 2022 and projects the same for natural gas. Global coal consumption is projected to decline by 240 million metric tons from 2019 to 2025, but the IEA’s projected increase for global natural gas consumption by 2025 of 390 billion cubic meters is 2.8x the decline in coal in energy (exajoule) terms. So, even if liquid fuels consumption plateaus at 2019 levels, world fossil fuel demand has almost certainly not peaked yet. Also: December 2020 global CO2 emissions were already above December 2019 levels (IEA).
70%
75%
80%
85%
90%
95%
100%
'65 '70 '75 '80 '85 '90 '95 '00 '05 '10 '15 '20 '25 '30 '35 '40
Source: BP Statistical Review of World Energy, IEA. 2020.
The world uses fossil fuels for ~85% of its energy% of global primary energy consumption from coal, oil and nat gas
Nuclearadoption
era Solar/windera begins
IEA Stated Policies Scenario
Pre-existinghydropower
$0
$20
$40
$60
$80
$100
$120
$140
$160
$180
$200
$220
2010 2012 2014 2016 2018 2020
Source: Lawrence Berkeley National Laboratory, IRENA. 2020.
Average power purchase agreement prices for wind and solar, Real 2019 $ per megawatt hour
US windGlobal wind
US solarphotovoltaic
Global solar photovoltaic Note: PPAs reflect the benefit of subsidies such as the US ITC
0
10
20
30
40
50
60
70
1998 2001 2004 2007 2010 2013 2016 2019
Wind and solar capacity additionsy/y change, gigawatts
Source: BP Statistical Review of Energy. 2020.
China
Europe
US
India
0%
2%
4%
6%
8%
10%
12%
14%
16%
18%
1998 2001 2004 2007 2010 2013 2016 2019
Wind and solar share of total electricitygeneration, %
Source: BP Statistical Review of Energy. 2020.
China
Europe
US
India
0%
1%
2%
3%
4%
5%
6%
7%
1998 2001 2004 2007 2010 2013 2016 2019
Wind and solar share of total primary energy consumption, %
Source: BP Statistical Review of Energy. 2020.
China
Europe
US
India
4
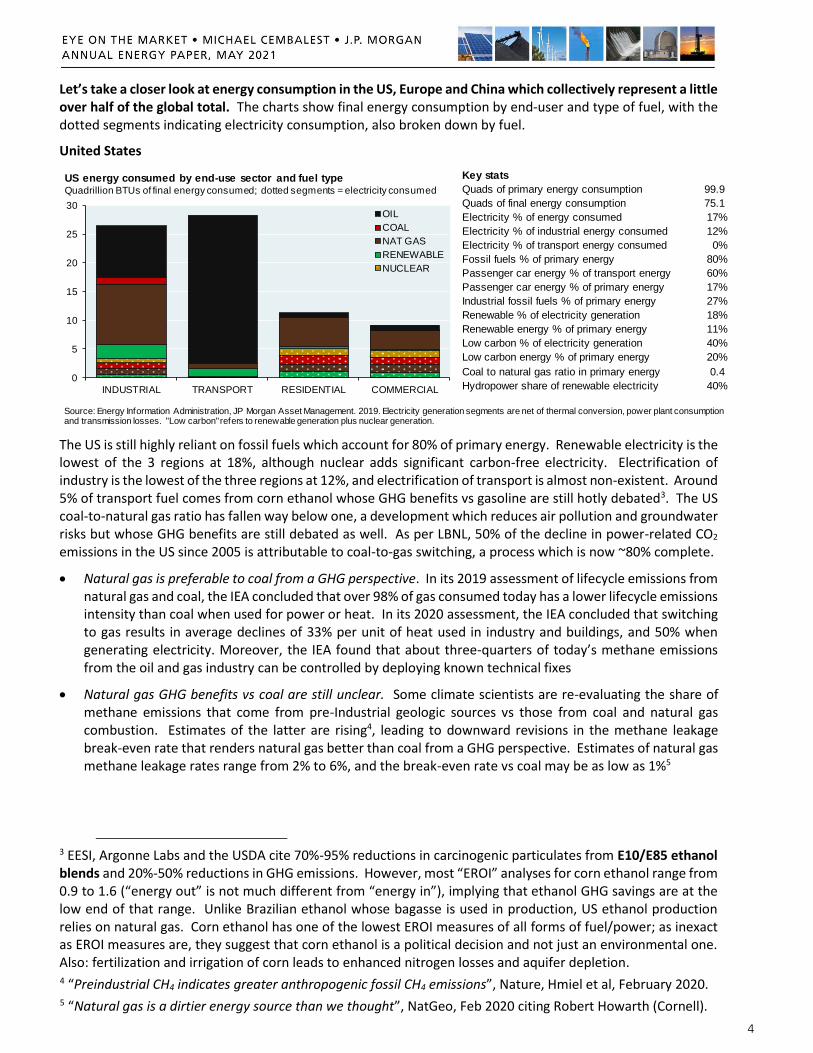
Let’s take a closer look at energy consumption in the US, Europe and China which collectively represent a little over half of the global total. The charts show final energy consumption by end-user and type of fuel, with the dotted segments indicating electricity consumption, also broken down by fuel.
United States
The US is still highly reliant on fossil fuels which account for 80% of primary energy. Renewable electricity is the lowest of the 3 regions at 18%, although nuclear adds significant carbon-free electricity. Electrification of industry is the lowest of the three regions at 12%, and electrification of transport is almost non-existent. Around 5% of transport fuel comes from corn ethanol whose GHG benefits vs gasoline are still hotly debated3. The US coal-to-natural gas ratio has fallen way below one, a development which reduces air pollution and groundwater risks but whose GHG benefits are still debated as well. As per LBNL, 50% of the decline in power-related CO2 emissions in the US since 2005 is attributable to coal-to-gas switching, a process which is now ~80% complete.
Natural gas is preferable to coal from a GHG perspective. In its 2019 assessment of lifecycle emissions from natural gas and coal, the IEA concluded that over 98% of gas consumed today has a lower lifecycle emissions intensity than coal when used for power or heat. In its 2020 assessment, the IEA concluded that switching to gas results in average declines of 33% per unit of heat used in industry and buildings, and 50% when generating electricity. Moreover, the IEA found that about three-quarters of today’s methane emissions from the oil and gas industry can be controlled by deploying known technical fixes
Natural gas GHG benefits vs coal are still unclear. Some climate scientists are re-evaluating the share of methane emissions that come from pre-Industrial geologic sources vs those from coal and natural gas combustion. Estimates of the latter are rising4, leading to downward revisions in the methane leakage break-even rate that renders natural gas better than coal from a GHG perspective. Estimates of natural gas methane leakage rates range from 2% to 6%, and the break-even rate vs coal may be as low as 1%5
3 EESI, Argonne Labs and the USDA cite 70%-95% reductions in carcinogenic particulates from E10/E85 ethanol blends and 20%-50% reductions in GHG emissions. However, most “EROI” analyses for corn ethanol range from 0.9 to 1.6 (“energy out” is not much different from “energy in”), implying that ethanol GHG savings are at the low end of that range. Unlike Brazilian ethanol whose bagasse is used in production, US ethanol production relies on natural gas. Corn ethanol has one of the lowest EROI measures of all forms of fuel/power; as inexact as EROI measures are, they suggest that corn ethanol is a political decision and not just an environmental one. Also: fertilization and irrigation of corn leads to enhanced nitrogen losses and aquifer depletion. 4 “Preindustrial CH4 indicates greater anthropogenic fossil CH4 emissions”, Nature, Hmiel et al, February 2020. 5 “Natural gas is a dirtier energy source than we thought”, NatGeo, Feb 2020 citing Robert Howarth (Cornell).
Key stats
Quads of primary energy consumption 99.9
Quads of final energy consumption 75.1
Electricity % of energy consumed 17%
Electricity % of industrial energy consumed 12%
Electricity % of transport energy consumed 0%
Fossil fuels % of primary energy 80%
Passenger car energy % of transport energy 60%
Passenger car energy % of primary energy 17%
Industrial fossil fuels % of primary energy 27%
Renewable % of electricity generation 18%
Renewable energy % of primary energy 11%
Low carbon % of electricity generation 40%
Low carbon energy % of primary energy 20%
Coal to natural gas ratio in primary energy 0.4
Hydropower share of renewable electricity 40%0
5
10
15
20
25
30
INDUSTRIAL TRANSPORT RESIDENTIAL COMMERCIAL
OIL
COAL
NAT GAS
RENEWABLE
NUCLEAR
US energy consumed by end-use sector and fuel typeQuadrillion BTUs of final energy consumed; dotted segments = electricity consumed
Source: Energy Information Administration, JP Morgan Asset Management. 2019. Electricity generation segments are net of thermal conversion, power plant consumption and transmission losses. "Low carbon" refers to renewable generation plus nuclear generation.

5
China
It would be great news if China succeeds with its plan for 25% EVs as a share of vehicle sales by 2025. Even though China’s passenger cars represent only 25% of its transport energy consumption vs 60% in the US, that would still be a lot of Chinese electric cars.
But…put EVs aside for a moment and focus on the elephant in the room: the number one issue for China and the world is decarbonization of China’s massive industrial sector, which consumes 4x more primary energy than its transport sector and more primary energy than US and European industrial sectors combined. China has electrified larger parts of its industrial sector than the US (23% vs 12%), but since China’s grid is so reliant on coal, electrification provides fewer climate benefits.
In contrast to the US, China uses 10x more coal than natural gas. In 2020, China built over 3x as much new coal capacity as all other countries combined, equal to one large coal plant per week. China commissioned 38.4 GW of new coal plants in 2020, over 3x the amount commissioned in the rest of the world. Its coal fleet grew by net 29.8 GW in 2020 while non-China net capacity declined by 17.2 GW. China initiated 73.5 GW of new coal plant proposals in 2020, over 5x the rest of the world combined. You get the point.
There’s a lot of discussion on China’s plan to forge ahead with nuclear as the developed world retreats from it. China currently has 50 GW of nuclear and plans to increase this figure to 130 GW by 2030. The new nuclear plants will represent ~6% of China’s 2030 electricity generation and ~3% of its primary energy. So, nuclear is a material part of China’s decarbonization agenda but hardly a game changer on its own.
Key stats
Quads of primary energy consumption 151.0
Quads of final energy consumption 101.5
Electricity % of energy consumed 23%
Electricity % of industrial energy consumed 23%
Electricity % of transport energy consumed 4%
Fossil fuels % of primary energy 81%
Passenger car energy % of transport energy 25%
Passenger car energy % of primary energy 3%
Industrial fossil fuels % of primary energy 57%
Renewable % of electricity generation 31%
Renewable energy % of primary energy 17%
Low carbon % of electricity generation 35%
Low carbon energy % of primary energy 19%
Coal to natural gas ratio in primary energy 10.6
Hydropower share of renewable electricity 58%0
10
20
30
40
50
60
70
80
INDUSTRIAL TRANSPORT RESIDENTIAL COMMERCIAL
OIL
COAL
NAT GAS
RENEWABLE
NUCLEAR
China energy consumed by end-use sector and fuel typeQuadrillion BTUs of final energy consumed; dotted segments = electricity consumed
Source: Energy Information Administration, JP Morgan Asset Management. 2019. Electricity generation segments are net of thermal conversion, power plant consumption and transmission losses. "Low carbon" refers to renewable generation plus nuclear generation.
-40
-20
0
20
40
60
80
100
2000 2002 2004 2006 2008 2010 2012 2014 2016 2018 2020
China and coalCoal capacity: additions and retirements, gigawatts
Source: Centre for Research on Energy and Clean Air. February 2021.
Other additions
China net additions
US/EU net retirements
Other retirements

6
Europe
Europe is further along than the US and China on renewable/nuclear penetration on the grid and on reducing fossil fuels as a share of primary energy. Even so, electrification of Europe’s transport sector was still just 1% at the end of 2019, and its industrial sector is still heavily reliant on fossil fuels.
Europe also faces a unique challenge: while its coal to natural gas ratio is the same (0.4) as in the US, this is the byproduct of large amounts of natural gas imported from Russia every year. As shown below, European oil and gas imports from Russia have now converged with total European oil and gas production. There are a host of geopolitical and energy security issues here that are not in Europe’s favor. Europe could import LNG from the US, Qatar and Australia but at a higher cost than pipeline imports from Russia.
Key stats
Quads of primary energy consumption 82.5
Quads of final energy consumption 59.4
Electricity % of energy consumed 19%
Electricity % of industrial energy consumed 19%
Electricity % of transport energy consumed 1%
Fossil fuels % of primary energy 66%
Passenger car energy % of transport energy 50%
Passenger car energy % of primary energy 11%
Industrial fossil fuels % of primary energy 24%
Renewable % of electricity generation 47%
Renewable energy % of primary energy 23%
Low carbon % of electricity generation 71%
Low carbon energy % of primary energy 34%
Coal to natural gas ratio in primary energy 0.4
Hydropower share of renewable electricity 46%0
5
10
15
20
25
INDUSTRIAL TRANSPORT RESIDENTIAL COMMERCIAL
OIL
COAL
NAT GAS
RENEWABLE
NUCLEAR
OECD Europe energy consumed by end-use sector and fuel typeQuadrillion BTUs of final energy consumed; dotted segments = electricity consumed
Source: Energy Information Administration, JP Morgan Asset Management. 2019. Electricity generation segments are net of thermal conversion, power plant consumption and transmission losses. "Low carbon" refers to renewable generation plus nuclear generation.
0
2,000
4,000
6,000
8,000
10,000
12,000
14,000
'80 '82 '84 '86 '88 '90 '92 '94 '96 '98 '00 '02 '04 '06 '08 '10 '12 '14 '16 '18
Source: BP Statistical Review of World Energy, Gazprom, Eurostat, Perovic et al, JPMAM calculations. 2019. Europe includes EU, Norway and Turkey.
European production vs European imports from RussiaThousand barrels per day of oil equivalent
European oil and gas production
European oil and gas imports from Russia

7
The world is gearing up to spend trillions of dollars to accelerate the fourth great energy transition6, this time to renewables. Market valuations of renewable companies skyrocketed in early 2020; I’m not sure all of them make sense. One example: why did the total valuation of the world’s competitive, high-volume auto industry gain 70% in market capitalization in the three years ending January 2021? A subsequent selloff eroded some of the gains but the increases since 2019 are still among the largest on record. Below we compare these renewable gains to prior episodes, some of which were sustainable while others were not. Generous subsidies, tax incentives and grid preferences will sustain many of them even if they are unprofitable. For investors, the challenge will be sorting out the long-term winners that will survive even when/if the subsidies go away.
This year we start with the four big obstacles to faster deep decarbonization: slow penetration of EVs, required upgrades to transmission infrastructure, geologic carbon sequestration and electrification of industrial energy use. The overarching message of this paper is not climate nihilism; it’s that the behavioral, political and structural changes required for deep decarbonization are still grossly underestimated. If so, the companies we all rely on for dispatchable, thermal power and energy will need to survive and prosper until we get there.
Michael Cembalest JP Morgan Asset Management
6 The first three: [i] mastery of fire; [ii] a shift from foraging to agriculture and domesticated animals and [iii] a shift from biomass and human/animal labor to combustion of fossil fuels and to mechanical prime movers.
Collapsed
Collapsed
Collapsed
UnknownCollapsed
Kept goingKept going
0%
200%
400%
600%
800%
1000%
1200%
1400%
ELEC VEH (M)2019-current
ELEC VEH (E)2019-current
SOLAR2019-current
HYDROGEN2019-current
BATTERY2019-current
NIKKEI index1985-1989
NASDAQ 1001997-2000
COMMODITIES2005-2008
FANG2017-2021
AGRICULTURE2003-2006
INTERACTIVEHOME ENT.2012-2015
HEALTHCAREFACILITIES2009-2012
Renewable stock price surge (2019-2021) vs prior sector/country stock price gains of 200%+ in 3 years or lessLabels indicate what happened 3 years after the stock price surge
Source: Bloomberg, JPMAM. April 26, 2021. EV companies presented both market-cap (M) and equal (E) weighted given Tesla's outsized impact on the former.
Jan 2021 Peak
$0.0
$0.5
$1.0
$1.5
$2.0
$2.5
Jan '18 Jul '18 Jan '19 Jul '19 Jan '20 Jul '20 Jan '21
Mill
ion
s
Market value of global auto industryMarket capitalization, US$, trillions
Source: "Big Market Delusion: Electric Vehicles". March 2021.
EV specialists
Traditional automakers
Total (Traditional + EV)

8
Table of Contents
[1] Electric vehicles, Will Ferrell, Norway and the rest of the world ...................................................................... 10
Forget about Norway: how is the EV revolution going everywhere else? The latest on EV penetration, vehicle replacement cycles, ICE car break-even mileage and why hybrids don’t count (as much)
[2] Transmission Dreams .................................................................................................................................... 15
MIT and Princeton have laid out grand scale deep decarbonization ideas that acknowledge the need for massive electricity grid expansion
[3] …and Transmission Realities .......................................................................................................................... 18
Grid expansion can be a hornet's nest of cost, complexity and NIMBYism, particularly in the US
[4] The Song Remains the Same: geologic sequestration of carbon may face the steepest climb of all .................. 22
The highest ratio in the history of science: CCS academic publications vs real-life CCS implementation
[5] Decarbonization of the industrial sector: costs, challenges and limitations ..................................................... 24
Even assuming greater renewable electricity, only some industrial processes can be easily electrified
[6] Oil and gas update: our bullish call on the sector, one year later .................................................................... 27
As the sector refocuses on profitability, valuations are rising and have more to go
[7] Biden’s energy agenda: how much oil and gas will the US need in the future? ................................................ 30
The energy math on grid decarbonization, Federal land production bans, EV incentives and mileage targets
[8] China’s rare earth metal diplomacy revving up again ..................................................................................... 34
China saber-rattling on rare earth metal exports is leading other countries to develop their own
[9] China: how new laws on residential heating systems actually lead to greater GHG emissions ......................... 35
Replacing coal-fired residential heating with electric heaters solves one problem, causes another
[10] US solar power: distributed small-scale generation is growing, but customers face headwinds ..................... 36
Many utilities no longer pay solar customers at a retail rate for electricity exported to the grid
Epilogue: Last words on the Texas power outage and why I write this paper ....................................................... 37
“What about…”: Answers to client energy questions ........................................................................................... 39
Q&A on electrified shipping, sustainable aviation fuels, low energy nuclear power, Saudi Arabia's green hydrogen plant and the unintended consequences of MSCI's carbon accounting methodology
9
Acknowledgements and a quick note on our process
Our energy paper is overseen by Vaclav Smil, Distinguished Professor Emeritus in the Faculty of Environment at the University of Manitoba and a Fellow of the Royal Society of Canada. His inter-disciplinary research includes studies of energy systems (resources, conversions and impact), environmental change (particularly global biogeochemical cycles), and the history of technical advances and interactions among energy, environment, food, economy, and population. He is the author of more than 40 books (the latest two, Grand Transitions: How the Modern World Was Made and Numbers Don’t Lie were published last year) and more than 400 papers on energy subjects and has lectured in North America, Europe, and Asia. In 2015, he received the OPEC award for research, in 2019 American Energy Society named him Energy Writer of the Year, and he is described by Bill Gates as his favorite author.
Vaclav and I agreed upfront that we would cover energy sources which reach, at the minimum, early stages of commercialization. Many ideas work on paper or in small-scale lab settings but are not widely commercialized and thus have no real world impact, either for cost or operational reasons. Examples include advanced biofuels like cellulosic ethanol, low energy nuclear reactions, quantum glass batteries, underground thermal energy storage, geoengineering (solar radiation management), ocean thermal energy conversion, liquid fuels from genetically modified algae and electricity generated from the coldness of the universe.
Links to topics from prior papers, which you can access here
The environmental impact of renewable energy (2020)
Cost declines required to make the hydrogen economy a reality (2020)
Measuring climate benefits of reforestation (2020)
How much energy is stored, and how? (2020)
The water intensity of hydraulic fracking (2020)
Geothermal update: present and future (2020)
Germany and Energiewende: A dispassionate assessment (2019)
Wildfires: anthropogenic climate change and risks for utilities in fire-prone areas (2019)
High voltage direct current lines: China leads, US lags (2018)
The Dream Team rebuttal of the Jacobson “100% renewable electricity by 2050” plan (2018)
Better safe than sorry: sea level rise, coastal exposure and flood mitigation (2018)
Hydraulic fracturing: the latest from the EPA and some conflicting views from its Advisory Board (2017)
Forest biomass: not as green as you might think (2017)
The myth of carbon-free college campuses (2017)
US hydropower: how much potential for expansion? (2016)
Nuclear power: skyrocketing costs in the developed world (2014 and 2015)
Acronyms
BEV battery electric vehicle; BTU British thermal unit; CCGT combined cycle gas turbine; CCS carbon capture and storage; CH4 methane; DACC direct air carbon capture; E&P exploration and production; EIA Energy Information Agency; EPA Environmental Protection Agency; ERCOT Electric Reliability Council Of Texas; EROI Energy return on investment; EV electric vehicle; FERC Federal Energy Regulatory Commission; GHG greenhouse gas; GW gigawatt; HVDC high voltage direct current; ICE internal combustion engine; IEA International Energy Agency; IRENA International Renewable Energy Agency; kg kilogram; km kilometer; kV kilovolt; kWh kilowatt hour; LBNL Lawrence Berkeley National Laboratory; LENR low energy nuclear reactions; LMP locational marginal pricing; LNG liquid natural gas; m3 cubic meter; MJ megajoule; MMT million metric tonnes; mpg miles per gallon; Mtoe million tons of oil equivalent; MWh megawatt hour; NaOH sodium hydroxide; NGL natural gas liquid; NIMBY not in my backyard; NOAA National Oceanic and Atmospheric Administration; NOx nitrogen oxides; NREL National Renewable Energy Lab; OECD Organisation for Economic Co-operation and Development; OPEC Organization of the Petroleum Exporting Countries; PHEV plug-in electric vehicle; REE rare earth element; RNG renewable natural gas; SUV sport utility vehicle; TWh terawatt hour; USGS US Geological Survey; Wh watt hour.

10
[1] Electric vehicles, Will Ferrell, Norway and the rest of the world
Passenger cars and light vehicles account for 40%-50% of global transport energy use. Other categories could be electrified (buses, heavy trucks) while some are more difficult (shipping, see p.39). A faster EV revolution in the US could have a large climate benefit since the US accounts for 25% of global transport energy consumption and since light vehicles represent 60% of this amount, both figures being the highest in the world.
I enjoyed the Will Ferrell commercial for GM during the Super Bowl which stated that Norway is “eating our lunch” on EVs. As shown below, they sure are: Norway EV sales were 60% of all vehicle sales last year compared to 2% in the US. But there are a few things about Norway that are important to understand:
Norway has 5 million people and a population density that is 5%-15% of most other European nations
97% of Norway’s electricity comes from hydropower; its electricity prices are 40%-70% of European levels
In Norway, EVs are exempt from VAT taxes and receive a 50% discount on toll roads and parking fees while ICE cars are subject to a 25% VAT, a CO2 tax, an NOx tax and a weight tax. As a result, Norwegian ICE cars are more expensive to buy and 75% more expensive to operate
A full conversion to EVs would put its EV subsidies at the second largest gov’t expenditure behind pensions
So, let’s dispense with Norway as a paradigm for the world’s high density, car-loving countries and see how the EV revolution is going elsewhere. Other than in a few small Northern European countries, EV sales as a share of vehicle sales are still mostly less than 10%7. Globally, the EV share in 2020 was 4.5%, up from ~2.5% in 2018 and 2019. Note how this compares to IEA scenarios of 20%-40% EV shares in the year 2030.
7 Light vehicle sales > 500k units and EV shares < 2%: JPN, INDIA, BRA, RUS, MEX, AUSTRA, TUR, THA and MAL.
Light-duty vehicle
Air
BusOther
Heavy truck
Marine
Other truck
Rail
0
10
20
30
40
50
60
Passenger Freight
Source: Energy Information Administration. 2016.
World transportation energy consumption by modeQuadrillion BTUs
Australia / New Zealand
South Korea
Russia
India
China
OECD Europe
US
2%
2%
3%
3%
12%
18%
25%
0% 20% 40% 60% 80% 100%
Passenger vehicle Road freight vehicle Air Marine Rail
Transportation energy consumption by region and mode % of world transportation energy consumption
Source: Energy Information Administration. 2016.
% of region total by mode (2012)
No
rwa
y
Ice
lan
d
Sw
ed
en
N
eth
erl
an
ds
F
inla
nd
D
en
ma
rk
Sw
itze
rla
nd
G
erm
an
y
Ho
ng
Ko
ng
P
ort
ug
al
Belg
ium
F
ran
ce
U
nit
ed
Kin
gd
om
A
us
tria
C
hin
a
Sp
ain
It
aly
S
ou
th K
ore
a
Can
ad
a
New
Ze
ala
nd
U
nit
ed
Sta
tes
0%
10%
20%
30%
40%
50%
60%
70%
80%
90%
100%Fossilfuels
Nuclear
Hydro andGeo
Wind andsolar
2020 EVshare ofsales
EV share of 2020 sales vs electricity generation mix
Source: IRENA, EIA, EV Volumes, JPMAM. 2020.
IEA Stated Policies Scenario
IEA Sustainable Development Scenario
0%
10%
20%
30%
40%
50%
2018 2019 2020 2030 2030
Global EV share of light vehicle salesBEV and PHEV sales as % of light vehicle sales
Source: EV Volumes, IEA, JPMAM. 2020.

11
EV analyses are defined by the scope of what an EV is assumed to be. Our definition includes battery electric vehicles (BEV) and plug-in hybrid electric vehicles (PHEV) since the prime mover in both cases is the electric motor, even though some PHEVs have large backup fuel tanks as well. We do not include hybrid electric vehicles (HEV) since its primary mover is usually an internal combustion engine (this depends on the length of average trips and other driving behaviors). We include light trucks and not just passenger cars since the former is 75% (!!!) of all vehicle sales in the US. The next chart illustrates battery capacity by EV type and is another indication of why we only include BEVs and PHEVs in our EV analysis, and not hybrids.
To be clear, hybrid vehicles can make substantial contributions to fuel economy; the 2021 Toyota Prius is EPA rated at up to 58 mpg in city driving. But the world envisioned in deep decarbonization plans involves large fleets of electric vehicles powered by green electricity8, in which case our EV definition is a better measure of how the transition is going. Answer: in most places with a lot of people, gradually so far.
There has been an enormous decline in battery costs over the last decade, which in principle should boost the pace of EV sales. Some analysts project EV cost parity by 2023.
8 Grid expansion required: 40% EV penetration would increase electricity consumption by 440 TWh compared to current generation of 4,400 TWh (a 10% increase), and by more in the future depending on the growth rate of the total vehicle stock. Load management investments would be needed to prevent surges in demand that could overwhelm transmission networks. Households generally consume 1-2 kWh per hour while a Level 2 EV charger can consume 8-9 kWh per hour.
Te
sla
Mo
de
l X
Te
sla
Mo
de
l S
Au
di e
-tro
n
Po
rsch
e T
ayca
n T
urb
o
Ja
gu
ar
I-P
AC
E
Po
rsch
e T
ayca
n 4
S
Po
lesta
r 2
Te
sla
Mo
de
l Y
Ch
evro
let B
olt
Hyu
nd
ai K
on
a
Te
sla
Mo
de
l 3 B
MW
i3/i3
s
Nis
sa
n L
EA
F
Hyu
nd
ai Io
niq
VW
E-G
olf
Min
i C
oo
pe
r E
lectr
ic
Fia
t 5
00
e
Ch
evy V
olt
Po
rsch
e C
aye
nn
e
Po
rsch
e P
an
am
era
Ch
rysle
r P
acific
a
BM
W 3
30
e
BM
W i8
Min
i C
oo
pe
r S
E
Hyu
nd
ai S
on
ata
Kia
Op
tim
a P
HE
V
BM
W X
5 x
dri
ve
40
e
Vo
lvo
XC
90
T8
Me
rce
de
s G
LE
55
0e
Fo
rd F
usio
n E
ne
rgi
To
yo
ta P
riu
s P
rim
e
Au
di A
3 E
-Tro
n
Me
rce
de
s S
55
0e
Fo
rd C
-Ma
x E
ne
rgi
Me
rce
de
s C
35
0e
To
yo
ta C
am
ry H
yb
rid
Kia
Op
tim
a H
yb
rid
To
yo
ta P
riu
s H
yb
rid
Ho
nd
a In
sig
ht H
yb
rid
Bu
ick R
eg
alw
/ e
Assis
t
Do
dg
e R
am
15
00
eT
orq
ue
BM
W A
ctive
Hyb
rid
7
0
20
40
60
80
100
120Battery electric vehicle (BEV) Plug-in hybrid (PHEV) Hybrid (HEV) Mild hybrid (MHEV)
Electric vehicle battery capacity by type Kilowatt hour, sorted in descending order by capacity
Source: Car and Driver, Automotive World, vehicle manufacturers. February 2021.
$10
$100
$1,000
$10,000
10 1,000 100,000 10,000,000
Lithium ion battery learning curveBattery cost $ per kWh
Cumulative battery MWh producedSource: ARK Investment Management. 2021.
Te
sla
Mo
de
l X
Po
rsc
he
Ta
yc
an
Te
sla
Mo
de
l S
Au
di
e-t
ron
Te
sla
Mo
de
l Y
Te
sla
Mo
de
l 3
Ch
evy B
olt
Nis
sa
n L
ea
f
GM
C S
ierr
a 1
50
0
Ra
m 1
50
0
Fo
rd F
-15
0
Ch
evro
let
Sil
ve
rad
o 1
50
0
To
yo
ta R
AV
4
To
yo
ta C
am
ry
Ho
nd
a C
R-V
Ch
evro
let
Eq
uin
ox
To
yo
ta C
am
ry H
yb
rid
To
yo
ta C
oro
lla H
yb
rid
Ho
nd
a In
sig
ht
$0
$10
$20
$30
$40
$50
$60
$70
$80
$90
$100Electric vehicles Traditional vehicles Hybrids
Top-selling EV, traditional vehicle & hybrid vehicle prices$, thousands, manufacturer suggested retail price
Source: Edmunds, Car and Driver, CleanTechnica. 2021. Excludes subsidies.

12
Now that battery costs have fallen, many countries and car companies have made commitments to rapidly ramp up EV penetration and production in the years ahead. We’ll see; I think it makes more sense to track how quickly EVs are actually selling and actual CO2 emissions from the transportation sector rather than tracking non-binding future milestones9. There are four key things to understand about the EV revolution:
[i] the good news: in most parts of the world, EVs entail GHG benefits per mile vs internal combustion engine (ICE) cars irrespective of the fuel composition of the electricity grid; but…
[ii] the lifecycle of today’s light vehicles is getting longer which delays vehicle replacement
[iii] EVs still cost more than comparable ICE vehicles when looking at the highest selling cars/trucks in the US
[iv] some research indicates behavioral issues which may reduce assumed GHG benefits from the EV transition
Let’s take a closer look.
[i] EV GHG benefits per mile generally exist irrespective of the fuel composition of the grid
Throughout most of the US and Europe (but not necessarily China), EVs entail positive GHG benefits per mile vs most ICE cars. How can we tell? The Union for Concerned Scientists estimates “break-even” mileage by US region, which is the mileage your ICE car must achieve to produce the same emissions as the average EV10. See the blue and gold dots in the chart: from California at the top of the range to the Midwest at the bottom, the mileage of all top selling US cars and light trucks are way below these break-even levels. The only overlap is the grey dots: Toyota and Hyundai hybrids in coal- and gas-dependent regions. As more renewables are added to the grid and if EV fuel efficiency improves, these break-even figures may rise. However, ICE mileage could improve as well, such as Mazda’s SkyActiv-X engine which may improve fuel economy by 20%-30%.
9 Example: Japan had a very low share of EVs in 2020 at just 0.7% of vehicle sales. The Japanese government plans to phase out ICE cars in the mid 2030’s at which point all cars must be hybrid or fully electric. That’s an aggressive timetable compared to current production. 10 UCS analyzed emissions from fueling and driving both types of vehicles. For ICE cars: emissions from extracting crude oil, moving oil to refineries, gasoline refining, gasoline distribution and tailpipe emissions. For EVs: power plant emissions and emissions from production of coal, natural gas and other fuels.
CaliforniaFlorida NYCLong Island NY
Texas Northwest
Illinois
Rockies
Virginia/Carolina
New EnglandMidwest Southeast Penn./Delaware
1 2 3 45 6 789101112
20 30 40 50 60 70 80 90 100 110 120 130
How efficient does your ICE car need to be for its emissions to be the same as an EV?
Miles per gallonSource: Union of Concerned Scientists, US Department of Energy. 2021. ICE = internal combustion engineNote: Miles per gallon = combined city/highway mileage
Top selling cars and light trucks in the US sorted by miles per gallon:1. Ram 15002. Ford F-1503. Chevrolet Silverado4. Toyota RAV45. Honda CR-V6. Chevrolet Equinox
Highest mileage cars:7. Honda Insight8. Toyota Camry Hybrid9. Toyota Corolla Hybrid10. Hyundai Elantra Hybrid11. Toyota Prius Eco12. Hyundai Ioniq Blue
ICE car mpg at which emissions = average EV emissions
mpg of top selling US cars and light trucks
mpg of highest mileage cars

13
[ii] Longer vehicle lives delay the EV revolution
My college roommate bought a new Ford Mustang in 1983. It was a not a very good car; it was in the shop a lot, and one day I recall someone almost punching a hole through the door. Since then the quality of domestic and imported cars has improved, leading to longer useful lives. The average age of light vehicles in operation has doubled since 1972. That’s great for productivity and household wealth but has the unintended consequence of delaying penetration of new technologies like EVs. Misunderstanding of this dynamic may partially explain why so many projections of the US EV share of sales in 2020 made ten years ago were wrong (Deutsche Bank 11%, PwC 10%, BNEF 9%, Roland Berger 7%, BCG 5% vs actual 2020 US levels of 2%).
The chart on the right shows a proxy for the vehicle replacement cycle in years (i.e., divide the stock of cars by annual sales, and that’s the number of years it could take for the entire stock to be electrified if EVs were 100% of new vehicle sales). EV penetration as a % of the stock depends on projections of the annual EV share of total sales, the growth rate in overall vehicle sales and vehicle scrappage rates. Bloomberg New Energy Finance (BNEF) now projects 30% US EV penetration by 2037, and I think they will be too high again.
[iii] When considering the kind of cars and light trucks US buyers prefer, the EV price gap is still large
In some research we’ve seen, analysts compare the price of a Toyota Camry to an EV like the Chevy Bolt or Nissan Leaf to illustrate the declining price gap between EVs and ICE cars. However, as mentioned earlier, SUVs and other light trucks account for 75% of US light vehicle sales. As a result, the Bolt and Leaf are not really product substitutes for people buying light trucks and SUVs. The table shows what we see as more relevant comparisons. The price gaps (measured in dollars and % terms) are larger than Camry-Bolt comparisons, and the range differentials in miles are often larger as well. Learning curves may drive all EV costs down further, but we consider the most relevant ICE-EV price gaps to be larger than the ones often reported.
Note: the IEA concluded that by 2040, the global ascent of SUVs has the potential to offset carbon savings from more than 100 million EVs
6
7
8
9
10
11
12
1972 1977 1982 1987 1992 1997 2002 2007 2012 2017
Average age of US light vehicles in operationYears
Source: US Bureau of Transportation Statistics, IHS Markit. 2020.
New
Ze
ala
nd
Fin
lan
d
Po
rtu
ga
l
Ita
ly
Sp
ain
Ne
the
rla
nd
s
Ice
lan
d
Sw
itze
rla
nd
No
rwa
y
US
A
Ho
ng
Ko
ng
Un
ite
d K
ing
do
m
Fra
nc
e
Au
str
ia
Sw
ed
en
So
uth
Ko
rea
Ge
rma
ny
Ca
na
da
De
nm
ark
Ch
ina
Be
lgiu
m
0
5
10
15
20
25
30
35
40
Vehicle replacement cycle in yearsTotal light vehicle registrations divided by light vehicle sales
Source: European Automobile Manufacturers Association, country departments of transportation, EV Volumes. 2019.
Electric vehicle: Chevy Bolt Ford F150 EV Chevy Silverado EV Dodge Ram EV SUV EV Composite SUV EV Composite
ICE vehicle: Toyota Camry Ford F150 Chevy Silverado Dodge Ram Toyota RAV4 Honda CRV
EV price ($, thousands) $32.0 $70.0 $50.0 $70.0 $44.8 $44.8
ICE price ($, thousands) $26.0 $30.6 $29.0 $30.5 $27.4 $26.5
Price gap ($, thousands) $6.0 $39.4 $21.0 $39.5 $17.4 $18.3
Price gap (%) 23% 129% 72% 130% 64% 69%
ICE range - EV range (miles) 193 320 208 268 155 134
ICE units sold (2020) 294,000 787,000 593,000 564,000 430,000 324,000
Sources: Car and Driver, JPMAM. 2021. EV and ICE model costs based on entry level vehicles. ICE mileage from Department of Energy.
SUV EV composite based on average of Volkswagen ID4, Hyundai Kona EV and Volvo XC40 Recharge.

14
[iv] Research points to behavioral issues which may reduce GHG benefits from the EV transition
Tracking actual CO2 emissions from the transport sector will be the best way of measuring the contribution of EVs to climate mitigation.
Will EVs replace ICE cars or supplement them? In Norway, subsidies promoted new EV purchases but two-thirds of families supplemented their ICE cars instead of replacing them, with 60% of driving miles by two-car families via their ICE cars vs 40% from their EVs11. Other analyses on Norway found that EV subsidies resulted in a sharp reduction in public transit and bicycle use compared to people owning ICE cars
What kind of cars would most EV buyers have bought instead? A study from UC Davis found that many EV buyers would have bought higher mileage cars instead, which could mean that the emissions savings from EV transitions could be overstated by as much as 50%12
Why do EV owners tend to drive their cars for much fewer miles per year than ICE cars? Whether the answer is range anxiety or their status as a second car rather than a replacement, the implications are not positive for EV adoption trends and GHG benefits. University of Chicago researchers extrapolated miles driven by monitoring their electricity bills before and after purchase. Adopting an EV increased household electricity consumption by 2.9 kWh per day. After correcting for out-of-home charging, this translated to approximately 5,300 miles traveled per year by EV owners, which is under half of the US fleet average13
Pulling it all together
Biden’s policies (see Section 7) may substantially increase US EV penetration. But as things stand now, the US has the highest share of global transport energy consumption, the highest vehicle share of transport energy, the highest number of vehicles per capita, the longest distance driven per capita, the lowest public transit usage, the lowest gasoline prices AND almost the lowest EV penetration as well. No wonder Will Ferrell is so mad.
11 Statistics Norway, August 15 2019 12 “Correcting Estimates of Electric Vehicle Emissions Abatement: Implications for Climate Policy”, Muehlegger and Rapson (UC Davis, NBER), January 2021 13 “Low Energy: Estimating Electric Vehicle Electricity Use”, Burlig et al. (University of Chicago), February 2021
EV share of
light vehicle
sales
Avg
gasoline
price
% income
spent on
gasoline
Cars per
1,000
people
Vehicle
km per
capita
Biking
frequency
Public
transit
usage
Road fuel
consum.
per capita
Australia 1% 3.78 1.53 741 10,800 0.02 27 580
Canada 3% 4.06 2.92 667 8,500 0.03 23 886
Denmark 14% 7.02 0.95 508 6,300 0.25 – 244
France 9% 6.56 0.59 590 6,250 0.04 28 106
Germany 13% 6.16 1.09 610 7,000 0.13 33 222
Italy 4% 6.81 0.99 707 6,250 0.12 – 158
Japan 1% 5.02 1.38 718 4,000 0.16 31 329
Netherlands 22% 7.19 1.17 543 6,150 0.25 – 242
Norway 62% 7.35 0.53 754 6,500 0.16 – 213
Sweden 30% 6.47 1.23 542 7,000 0.16 32 302
UK 9% 5.99 1.08 544 6,250 0.04 37 220
United States 2% 3.05 2.16 875 14,000 0.02 12 1,106
Source: California State University, EV Volumes. 2020.

15
[2] Transmission Dreams
Most deep decarbonization plans acknowledge the need for massive transmission grid updates. In this section, we look at two recent ones: an MIT study on electricity optimization between Canada and New England, and a Princeton analysis aiming for full decarbonization by 2050.
MIT: Electricity optimization in New England14
The goal: decarbonize New England electricity and examine benefits of new transmission to allow greater trade of Canada hydropower and New England wind/solar power. The first chart shows the capacity mix required for 80% decarbonization of New England electricity by 2050.
Now let’s look at generation. The chart below (left) shows modeled New England electricity generation for a 2-week period in October 2050 resulting from the new capacity mix. There’s some bilateral trade of hydro, wind and solar using 2.2 GW of existing cross-border transmission capacity (red & green segments), but it’s pretty small. New England CO2 emissions would fall from 27.5 million metric tons (MMT) per year today to 6.7 MMT per year in 2050.
Now let’s add some more transmission. The chart on the right assumes 4 GW in new transmission lines which would allow New England to double its electricity imports/exports. MIT estimates that the financial cost of building new transmission would be offset by lower cost Canadian hydropower, and that New England CO2 emissions would fall from 6.7 MMT per year to just 2.0 MMT per year. So: it looks like there’s a positive cost/benefit from a lot more transmission in this decarbonized system. Sounds great on paper, until the New Hampshire siting committee gets involved…which we discuss in the next secetion.
14 “Two-Way Trade in Green Electrons: Deep Decarbonization of the Northeastern US and the Role of Canadian Hydropower”, Dimanchev et al, MIT Center for Energy and Environmental Policy Research, February 2020.
-10
-5
0
5
10
15
20
25
10/1 10/2 10/3 10/4 10/5 10/6 10/7 10/8 10/9 10/10 10/11 10/12 10/13 10/14 10/15
Curtailment IMPORTS CCGT CCS Pumped Hydro Hydro Solar Offshore WindOnshore Wind New CCGT Existing CCGT Existing Nuclear Storage Charging EXPORTS
Modeled hourly New England generation using 2050 capacity mixGigawatt hours
Source: "Two-Way Trade in Green Electrons: Deep Decarbonization of the Northeastern US and the Role of Canadian Hydropower." Emil Dimanchev et al., MIT. February 2020.
-10
-5
0
5
10
15
20
25
10/1 10/2 10/3 10/4 10/5 10/6 10/7 10/8 10/9 10/10 10/11 10/12 10/13 10/14 10/15
Modeled hourly New England generation using 2050 capacity mix + 4 gigawatts of new transmission, Gigawatt hours
0
5
10
15
20
25
30
35
40
45
50
2019 2050 w/ 80%decarbonization
2050 w/ 80%decarbonization &4 GW transmission
OtherSolarWindHydroNuclearCoalPetroleumNatural Gas
New England capacity mix by energy sourceGigawatts
Source: EIA, Emil Dimanchev, MIT Center for Energy and Environmental Policy Research. February 2020.

16
The Princeton paper proposes Net Zero primary energy by 205015 (i.e., not just decarbonization of electricity, but decarbonization of everything). As illustrated in the first chart below, this transformative proposal includes a 14x buildout of wind and solar capacity and a 3x-5x buildout of transmission capacity16.
Consider the pace of Princeton’s transmission expansion relative to history. The base case $76 billion per year cost of this proposal is three times higher than prevailing spending on transmission infrastructure (second chart). Furthermore, some current investment is replacing old transmission infrastructure rather than adding new capacity. The third chart is quite the hockey stick: from 2004 to 2020, US transmission grid miles only grew by 1.2% per year and would have to accelerate to 3.9%-5.7% (these are very big differences when compounded over decades). Finally, look in the fourth chart at where this new capacity would need to be built: Texas, but also California and the Northeast, regions with NIMBY and other obstacles to development. As a result, any analysis of Transmission Dreams also has to confront Transmission Realities…which we address next.
15 Larson, Greig, Jenkins, Mayfield, Pascale, Zhang, Drossman, Williams, Pacala, Socolow, Baik, Birdsey, Duke, Jones, Haley, Leslie, Paustian and Swan, “Net-Zero America: Potential Pathways, Infrastructure, and Impacts”, interim report, Princeton University, December 15, 2020. 16 Other Net Zero proposals have lower transmission targets for 2050 than Princeton but they are still enormous relative to today’s grid. Examples include the Zero Carbon Consortium Deep Decarbonization Pathways Project and the Carbon Neutral Pathways Project from James Williams at the University of San Francisco. Both entail transmission buildouts that are 65%-80% of Princeton levels.
Current (2020)
Base case (2030)
Base case (2040)
Base case (2050)Land constrained case (2050)
Renewable case (2050)
0.0
0.2
0.4
0.6
0.8
1.0
1.2
1.4
1.6
1.8
0 1 2 3 4 5 6
Princeton Net Zero planTransmission lines > 345 kilovolts, million gigawatt-kilometers
Source: "Net Zero America", Larson et al., Princeton. 2020. Wind and solar capacity installed (terawatts)
Base case: net zero, fossil fuel CO2 emissions offset by CCSRenewable case: net zero, no fossil fuels, no CCS
20
14
20
15
20
16
20
17
20
18
20
19
20
20
20
20
-20
50
pro
jec
ted
$0
$10
$20
$30
$40
$50
$60
$70
$80
$90
Historical and projected transmission investmentUS$ per year, billions
Source: Edison Electric Institute, "Net Zero America", Larson et al., Princeton. 2020.
Princeton base case annual transmission
investment
Base case (2030)
Base case (2040)
Base case (2050)
2020
Base case: no CCS (2050)
0
100
200
300
400
500
600
700
800
900
1,000
1,100
1,200
1978 1988 1998 2008 2018 2028 2038 2048
Princeton Net Zero
Historical
US transmission infrastructureThousands of gigawatt-miles
Source: DOE, UT Austin, "Net Zero America", Larson et al., Princeton. 2020.
Dept. of Energy UT AustinMontana
Maine
Nebraska
Missouri
New Mexico
Massachusetts
New York
New Jersey
California
Texas
$0 $20 $40 $60 $80 $100 $120 $140 $160
Bulk transmission
Solar connections
Onshore wind connections
Offshore wind connections
Princeton plan transmission required by stateTop ten states sorted by required investment from 2020-2050
Source: "Net Zero America", Larson et al., Princeton. 2020.
2018 US$, billions

17
A brief comment on the pace of wind and solar expansion assumed in the Princeton paper
The primary purpose of Sections 2 and 3 is to examine new transmission required in deeply decarbonized systems. That said, it’s also worth examining the generation expansion in the Princeton report. The chart below shows generation capacity additions measured as watts per capita per year, highlighting peaks by fuel type. The challenge with the Princeton plan is not just its level but its consistency: while peak capacity additions in the US were 2/3 of the 300 watt figure in the Princeton plan, they were only sustained for a couple of years. The Princeton plan requires 300 watts every year for 30 years. It remains to be seen if the climate threat (see bottom chart on warming oceans) translates into support for this magnitude of capacity expansion.
For anyone thinking that energy efficiencies will reduce electricity demand, remember the parable of the airline industry: despite a 75% decline in jet aircraft fuel consumption per kilometer since 1960, aircraft fuel consumption and related CO2 emissions quadrupled as declining ticket prices led to a surge in aviation. In other words, increased use can more than offset any efficiency gains.
0
50
100
150
200
250
300
350
1960 1970 1980 1990 2000 2010 2020 2030 2040 2050
Historical (US)
Historical (Germany)
Historical (China)
Source: "Net Zero America" (Princeton study), American Public Power Association, EIA, China Electricity Council, Fraunhofer ISE, Clack et al. (pre-2014 data). 2020.
Historical rates of installed electric-generating capacity per capitaCapacity additions, watts per year per capita
Coal and nuclear peak
2nd nuclear peak
Natural gas peak Germany solar
PV peakGermany wind peak
Princeton Net Zero by 2050 base casewind and solar capacity additions
-150
-100
-50
0
50
100
150
200
250
1958 1964 1969 1974 1979 1984 1989 1994 1999 2004 2009 2014 2019
Source: Cheng, L. et al., Advances in Atmospheric Sciences; Dahlman and Lindsey, National Oceanic and Atmospheric Administration. February 2020.
Warming oceansZettajoules
Ocean heat content change in upper 2000 m vs 1981-2010 baseline (Cheng)
Ocean heat content change in upper 700 m vs 1955-2006 baseline (NOAA)
0.0
0.2
0.4
0.6
0.8
1.0
1.2
1940 1950 1960 1970 1980 1990 2000 2010 2020
Global carbon dioxide emissions from aviationBillion tonnes of CO2 emissions
Source: Our World in Data. 2018.
18
[3] …and Transmission Realities
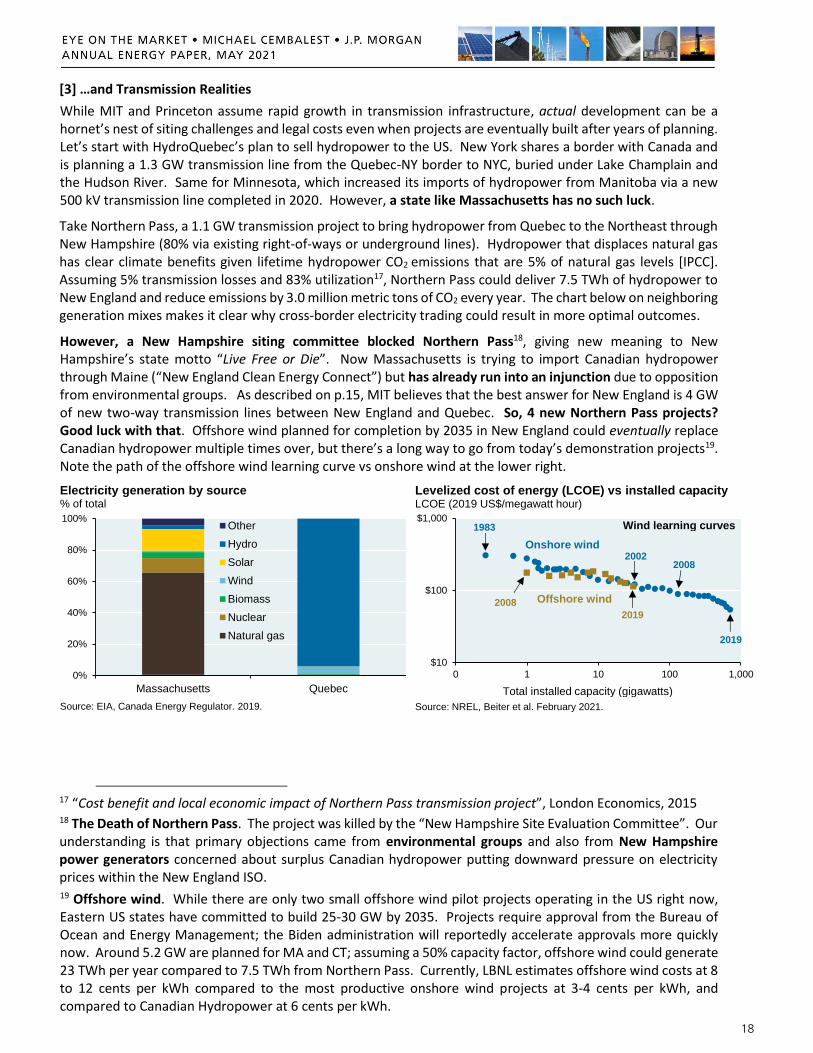
While MIT and Princeton assume rapid growth in transmission infrastructure, actual development can be a hornet’s nest of siting challenges and legal costs even when projects are eventually built after years of planning. Let’s start with HydroQuebec’s plan to sell hydropower to the US. New York shares a border with Canada and is planning a 1.3 GW transmission line from the Quebec-NY border to NYC, buried under Lake Champlain and the Hudson River. Same for Minnesota, which increased its imports of hydropower from Manitoba via a new 500 kV transmission line completed in 2020. However, a state like Massachusetts has no such luck.
Take Northern Pass, a 1.1 GW transmission project to bring hydropower from Quebec to the Northeast through New Hampshire (80% via existing right-of-ways or underground lines). Hydropower that displaces natural gas has clear climate benefits given lifetime hydropower CO2 emissions that are 5% of natural gas levels [IPCC]. Assuming 5% transmission losses and 83% utilization17, Northern Pass could deliver 7.5 TWh of hydropower to New England and reduce emissions by 3.0 million metric tons of CO2 every year. The chart below on neighboring generation mixes makes it clear why cross-border electricity trading could result in more optimal outcomes.
However, a New Hampshire siting committee blocked Northern Pass18, giving new meaning to New Hampshire’s state motto “Live Free or Die”. Now Massachusetts is trying to import Canadian hydropower through Maine (“New England Clean Energy Connect”) but has already run into an injunction due to opposition from environmental groups. As described on p.15, MIT believes that the best answer for New England is 4 GW of new two-way transmission lines between New England and Quebec. So, 4 new Northern Pass projects? Good luck with that. Offshore wind planned for completion by 2035 in New England could eventually replace Canadian hydropower multiple times over, but there’s a long way to go from today’s demonstration projects19. Note the path of the offshore wind learning curve vs onshore wind at the lower right.
17 “Cost benefit and local economic impact of Northern Pass transmission project”, London Economics, 2015 18 The Death of Northern Pass. The project was killed by the “New Hampshire Site Evaluation Committee”. Our understanding is that primary objections came from environmental groups and also from New Hampshire power generators concerned about surplus Canadian hydropower putting downward pressure on electricity prices within the New England ISO. 19 Offshore wind. While there are only two small offshore wind pilot projects operating in the US right now, Eastern US states have committed to build 25-30 GW by 2035. Projects require approval from the Bureau of Ocean and Energy Management; the Biden administration will reportedly accelerate approvals more quickly now. Around 5.2 GW are planned for MA and CT; assuming a 50% capacity factor, offshore wind could generate 23 TWh per year compared to 7.5 TWh from Northern Pass. Currently, LBNL estimates offshore wind costs at 8 to 12 cents per kWh compared to the most productive onshore wind projects at 3-4 cents per kWh, and compared to Canadian Hydropower at 6 cents per kWh.
0%
20%
40%
60%
80%
100%
Massachusetts Quebec
Other
Hydro
Solar
Wind
Biomass
Nuclear
Natural gas
Electricity generation by source% of total
Source: EIA, Canada Energy Regulator. 2019.
$10
$100
$1,000
0 1 10 100 1,000
Levelized cost of energy (LCOE) vs installed capacity LCOE (2019 US$/megawatt hour)
Source: NREL, Beiter et al. February 2021.
Total installed capacity (gigawatts)
Onshore wind
Offshore wind 2008
2019
2019
2002
1983
2008
Wind learning curves
19
What about outside the Northeast?
We’ve written before about the fate of Clean Line’s Plains & Eastern project which aimed to connect Oklahoma wind and Tennessee. While Federal courts eventually overrode Arkansas landowner objections, mounting court costs crippled the project’s finances. The Tennessee Valley Authority declined to support it (reportedly at the urging of Ten. Senator Lamar Alexander), and the TVA stuck with its mix of nuclear, gas and coal. Clean Line sold the project to NextEra Energy, but they were unable to get anywhere either: Arkansas Senators Cotton and Boozman argued to Trump Energy Secretary Perry that the Obama administration violated Arkansas property rights in approving the project in the first place. The project was finally euthanized in 2018, and Clean Line eventually sold or liquidated its other projects after years of endless court fights at state and county levels20.
Another legacy Clean Line project is on the ropes as well: the Grain Belt Express, designed to bring wind power from Kansas to the East Coast by joining SPP, MISO and PJM grids. In February 2021, the Missouri State House passed a bill banning the use of eminent domain for above-ground utility projects; its State Senate will review next. Meanwhile, five hundred Missouri landowners along the route continue their fight against the project. Easement payments of $150,000 have been offered (110% of assessed land value) and landowners can continue to farm or build on the easements, but so far only a third of landowners have accepted.
Some developers take advantage of corridors used for existing infrastructure. Siemens is working on a 350-mile 2.1 GW underground HVDC connection between Iowa’s wind farms and Chicago. The majority of the line will run alongside a railroad corridor right of way, which should make it easier to obtain permits, a strategy used to expand high-speed internet networks. Other good news: the Southern Cross project will join ERCOT with the SPP region (OK, KS, NE and the Dakotas) and begins construction in 2022.
However, even when projects are approved, they’re built at a snail’s pace compared to deep decarbonization requirements. The TransWest Express project, designed to bring wind power from Wyoming to California, has been in development since 2007 despite being fast-tracked by the Obama administration, despite being only 15% reliant on private lands, and despite having been granted eminent domain status by the 4 states it traverses. TransWest is projected to begin delivering power in 2023.
Transmission challenges in Germany were addressed through underground cabling and legislation. In some places, burying transmission cables reduced resistance although at a large increase in cost. Germany passed an “acceleration law” in 2019 to streamline and simplify transmission approval procedures. As of Q3 2020, Germany had completed 20% of planned transmission build-out with another 11% approved for construction. Even so, bottlenecks hamper transmission of its wind generation: Germany is reportedly exporting wind power to Denmark and paying Danish wind farms not to generate power. Reports cite Danish wind curtailment as high as 6% as a result21. Germany intends to shut down its last remaining nuclear plants in 2022 which will amplify the importance of completing North-South transmission lines for wind.
China relocated 1.3 million people during the construction of the Three Gorges Dam and related transmission networks. China does not face the same constraints as Western countries with respect to building transmission lines over objections from local municipalities. Let’s just leave it at that.
20 “Ambitious Clean Line energy: Wrapping Up”, Wind Power Monthly, February 2019. 21 “Germany’s Maxed-Out Grid Is Causing Trouble Across Europe”, Greentech Media, March 31, 2020.
20
The transmission road not taken: Federal override of state objections
Unlike natural gas pipelines in the 1930’s and the interstate highway system in the 1950’s, there is no broad legislation supporting Federal eminent domain for electricity transmission projects
Since 2005, transmission projects can qualify as “national interest electric transmission corridors” according to the US DoE, in which case FERC statutes allow such projects to proceed even if states do not grant approval (Section 1221 of the Energy Policy Act)
However, 2010/2011 Court of Appeals judgments limited Section 1221 FERC backstop siting authority and provoked a state backlash. National interest electricity corridors haven’t been used since
A former NYU law professor now at the DoE believes that Section 1222 can be used instead. While its geographic scope excludes the Northeast and Florida, this statute involves the Federal gov’t participating in the project itself, in which case it has pre-emptive siting authority that overrides any state objections. A Federal District court in Arkansas upheld this statute in 2017. We’re watching to see if it’s used more actively by the Biden administration
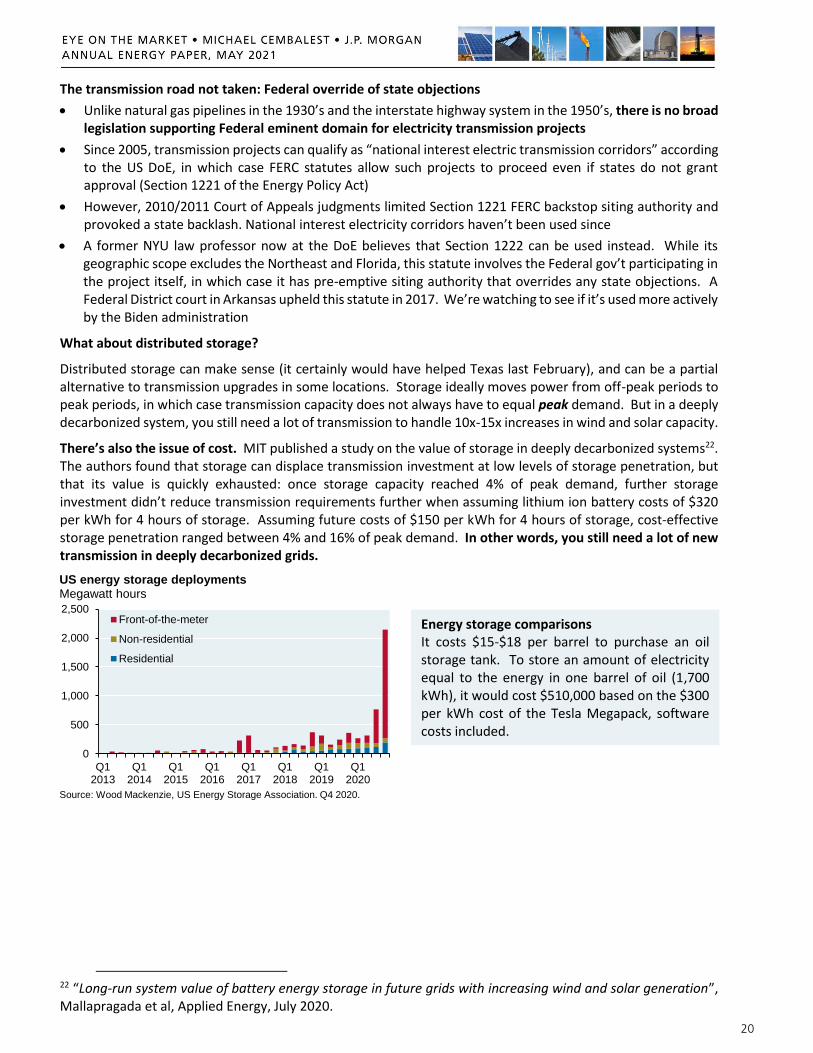
What about distributed storage?
Distributed storage can make sense (it certainly would have helped Texas last February), and can be a partial alternative to transmission upgrades in some locations. Storage ideally moves power from off-peak periods to peak periods, in which case transmission capacity does not always have to equal peak demand. But in a deeply decarbonized system, you still need a lot of transmission to handle 10x-15x increases in wind and solar capacity.
There’s also the issue of cost. MIT published a study on the value of storage in deeply decarbonized systems22. The authors found that storage can displace transmission investment at low levels of storage penetration, but that its value is quickly exhausted: once storage capacity reached 4% of peak demand, further storage investment didn’t reduce transmission requirements further when assuming lithium ion battery costs of $320 per kWh for 4 hours of storage. Assuming future costs of $150 per kWh for 4 hours of storage, cost-effective storage penetration ranged between 4% and 16% of peak demand. In other words, you still need a lot of new transmission in deeply decarbonized grids.
22 “Long-run system value of battery energy storage in future grids with increasing wind and solar generation”, Mallapragada et al, Applied Energy, July 2020.
0
500
1,000
1,500
2,000
2,500
Q12013
Q12014
Q12015
Q12016
Q12017
Q12018
Q12019
Q12020
Front-of-the-meter
Non-residential
Residential
US energy storage deploymentsMegawatt hours
Source: Wood Mackenzie, US Energy Storage Association. Q4 2020.
Energy storage comparisons It costs $15-$18 per barrel to purchase an oil storage tank. To store an amount of electricity equal to the energy in one barrel of oil (1,700 kWh), it would cost $510,000 based on the $300 per kWh cost of the Tesla Megapack, software costs included.

21
What can happen when there isn’t enough transmission in areas with a lot of renewable energy? Negative wholesale electricity pricing…and the jury is out on consequences for consumers
The map shows US regions according to frequency of “negative marginal pricing”. In other words, the percentage of time power producers are paid below zero for their generation. You might think, “why would a power producer ever accept negative prices??” One example23: wind operators flooding Midwestern grids at the same time since there’s not enough interstate transmission to export surplus electricity to other places, and not enough distributed storage to save it for periods of higher demand. As a result, wind operators might accept negative pricing of -$5 per MWh since without it, they would not collect tax credits worth $24 per MWh that are only payable if they generate electricity.
Negative wholesale electricity prices sound like a good thing, but are they? Not necessarily; negative prices mean that at certain times of day, there’s so much wind/solar oversupply in that location that prices decline until some producers (wind, gas, solar or nuclear) agree for economic reasons to cut back until generation equals demand. Later that day, there could be a sharp decline in wind/solar generation, in which case other forms of dispatchable power are still needed (that’s what happens in California for those familiar with the “duck curve”). That power could come from natural gas; or from utility-scale pumped storage, lithium ion batteries or fuel cells; or imported from other regions. Either way, it has to come from someplace. And if there are too many hours of low or negative prices for thermal producers, they may stop adding new capacity to the grid, leaving it exposed to brownouts and instability.
Ultimately, the price of electricity incorporates the cost of the ecosystem needed to meet demand, including periods of unanticipated spikes, and including whatever backup thermal capacity, storage capacity and new transmission are needed to accompany growing renewables. That’s the reason that I do not pay much attention to “levelized costs of energy” as estimated by the EIA and Lazard, since they do not incorporate the entire cost implications of highly renewable grids. Europe is further along in its renewable transition, and higher shares of wind and solar are in many cases associated with higher electricity prices (see chart above right).
23 Another reason: nuclear facilities cannot be easily ramped up and down during the day. To be present on the grid when intraday prices are high, nuclear operators also participate during periods of negative prices.
AT
BE
BG
CY
CZ
DK
EE
FIFR
DE
GR
HU
IEIT
LV LTNLPL
PT
RO
SK
SI
ES
SE
BA
UK
0.05
0.10
0.15
0.20
0.25
0.30
0.35
0% 10% 20% 30% 40% 50% 60% 70%
European household electricity prices vs wind and solar penetration, Euros per kilowatt hour
Source: Eurostat, EMBER. 2020. Electricity prices include all taxes and levies.
Wind and solar generation as % of electricity generation
CAISO
ERCOT
MISO PJM
NYISO ISO-NE
SPP
Source: Ryan Wiser, Lawrence Berkeley National Laboratory. March 2021.

22
[4] The Song Remains the Same: geologic sequestration of carbon may face the steepest climb of all
After 20 years of planning and conjecture, by the end of 2020 carbon capture and storage (CCS) facilities stored just 0.1% of global CO2 emissions. Challenges include cost overruns, failure of bellwether projects (Kemper Mississippi), the US Dep’t of Energy withdrawing support for demonstration projects (FutureGen), cancellations in Europe, legal uncertainties about liability and a 20%-40% energy drag required to perform CCS in the first place. Norwegian Authorities just approved the Northern Lights sequestration project involving Total, Equinor and Shell whose 2024 capacity will be just 0.0045% of global emissions. The highest ratio in the history of science: the number of academic papers written on CCS divided by real-life implementation of it.
As a result, I’m not sure what to make of the Princeton study’s sequestration assumptions. The authors assume that 65,000 miles of CO2 pipeline infrastructure will divert 929 million tonnes of CO2 each year from cement, gas-powered generation, natural gas reforming and biofuel production facilities to centralized locations where they will be mostly sequestered underground (a small amount is assumed to be converted into synthetic fuels). This compares to current US CCS infrastructure of 5,280 miles and 80 million tonnes per year, mostly used for enhanced oil recovery24. The Princeton CCS buildout, just to sequester an amount equal to 15% of current US GHG emissions, would require infrastructure whose throughput volume would be higher than the volume of oil flowing through US distribution and refining pipelines, a system which has taken over 100 years to build (see box). Princeton’s CCS projections are not that different from the ones found in pieces from Morgan Stanley, Goldman and other research houses.
We had a conversation with Peter Haugan, Director of the Geophysical Institute at the University of Bergen (Norway). We talked about the Sleipner Field in the North Sea, one of the few existing CCS locations on the planet. As it turns out, CCS is a very complex process: some nearby CO2 injection sites were abandoned since they turned out to be much less permeable than originally anticipated, in which case higher levels of pressure could have caused cracks; and in other locations, polluted water injection sites did cause cracks since injected water was found at the surface of the ocean. In other words, the success of Sleipner so far is not a clear signal regarding the ease of CCS injection, even in well-known formations like the ones in the North Sea.
24 A 2021 paper by David Victor (Brookings/ Deep Decarbonization Initiative) and a group of colleagues examined attempted CCS projects and found that capital cost, technological readiness and credibility of project revenues were the most important factors in getting projects completed (compared to population proximity, employment impact or local opposition).
0
200
400
600
800
1,000
1,200
1965 1975 1985 1995 2005 2015
Academic papers on carbon capture Number of papers published per year
Source: PubMed. 2020.
Princeton CCS proposal for the US Buildout = 850 million tonnes of CO2 stored per year via 65,000 miles of pipeline infrastructure Supercritical CO2 storage = 800 kg/m3 Supercritical CO2 stored per year = 1.1 billion m3
US annual oil production 2019 = 746 million tonnes distributed and refined across 190,000 miles of pipelines Density of oil = 1.15 m3 per tonne US annual oil production = 858 million m3

23
What about carbon mineralization? Carbon mineralization is a form of storage in which carbon dioxide, rather than being stored as a compressed gas underground, reacts with certain rocks (magnesite, basalt, etc) and is permanently mineralized. It’s not as easy as it sounds…
In ex-situ versions of this idea, billions of tons of calcite or magnesite would need to be mined each year even if just a small amount of annual CO2 emissions were removed from the atmosphere. To mineralize 15% of global CO2 emissions, much more magnesite would need to be mined every year than annual global mining of iron ore, for example. The materials handling costs would be enormous, and efforts to accelerate the chemical reaction vs its natural rate have been very challenging
The in-situ version of the idea involves injection of CO2 (mixed in water) into basalt rocks, and in which the carbon mineralization reaction can occur in just a year or two. However, while you don’t have to mine and move rocks in this version, you do need to move the CO2 to where the basalt rocks are… which brings us back to the need for a massive build-out of CCS infrastructure (pipelines, compression, storage etc) to make even a small difference
What about direct air carbon capture as an option for gathering CO2 emissions from distributed sources (i.e., vehicles)? Some net-zero studies allow for small amounts of fossil fuel combustion that are offset by direct air carbon capture (DACC). However, the material and energy demands of DACC are beyond daunting:
The most promising direct air capture method is based on aqueous hydroxide solutions
Let’s assume that 10 gigatons of CO2 are captured each year, around 25% of global emissions
Somewhere between 1.7 and 3.0 gigatons of NaOH (caustic soda) would be needed; NaOH reacts with CO2 to create water and sodium carbonate Na2CO3, which can be heated to produce a gaseous CO2 stream…
This amount of NaOH is 20-40 times its recent annual production, and also equivalent to 40%-67% of recent global crude oil extraction by weight
Electrolysis required to produce the NaOH would consume 25%-40% of world electricity, and hydroxide regeneration (used to reduce NaOH requirements by regenerating and reusing most of the reactant) would claim another 11%-17% of global primary energy. Putting both pieces together, NaOH electrolysis plus regeneration would require 15%-24% of global primary energy to capture 25% of CO2 emissions
A last nail in the coffin: 2,400 – 3,800 kWh per tonne of captured CO2 via DACC would be needed before whatever energy is required to actually store the CO2 underground; DACC energy needs appear to be 6x-10x higher than traditional CCS energy estimates, a process which itself is stuck in neutral
As per authors of the paper cited below, “DACC is unfortunately an energetically and financially costly distraction in effective mitigation of climate changes at a meaningful scale” 25.
25 “Unrealistic energy and materials requirement for direct air capture in deep mitigation pathways”, Chatterjee and Huang, Nature Communications, 2020.
Sequestration summary
To sequester 15%-20% of US CO2 emissions, CCS volumes would need to exceed oil production, refining and distribution volumes
Mineralizing 15% of global CO2 emissions would require more tons of mined magnesite and basalt than current global mined tons of iron ore
Sequestering 25% of global CO2 through direct air capture would require 25%-40% of the world’s electricity generation plus 11%-17% of its primary energy

24
[5] Decarbonization of the industrial sector: costs, challenges and limitations
The industrial sector is the largest fossil fuel end-user on a global basis. Could some industrial processes be electrified to eventually use more renewable energy as the grid is decarbonized?
In 2018, Lawrence Berkeley Laboratory outlined the possibilities: some primary metals, secondary steel, machinery, wood products, plastics and rubber. What do they have in common? Most use fossil fuels primarily for “process heat” which could be replaced by electric heat. We also assume high electrification potential for certain mining activities related to transport, excavation, pit crushing and belt conveying systems.
For other uses, it gets harder. Chemicals, pulp/paper and food take advantage of integrated systems in which fuel combustion waste heat powers related processes, referred to as CHP (combined heat and power). CHP-intensive sectors are harder to electrify since producers would need to purchase energy previously obtained at little to no cost, and/or redesign the entire process. Other hard to electrify sectors include non-metallic minerals such as glass, brick and cement which require temperatures in excess of 1400°C, and which are non-conductive solids (i.e., harder to electrify production of things that do not conduct electricity). Finally, oil/coal refining exploits “own-use” fuel consumption, a source of energy lost when switching to electricity.
The challenge: low/medium electrification potential sectors use 2.5x the energy as high potential sectors. Even if we assume that all sectors are eventually electrified using new technologies26, there’s still a large increase in cost. In addition to upfront switching costs, industrial companies would face costs per unit of energy that are 3x-6x higher for electricity than for direct natural gas. Electric heating efficiency gains vs combustion could offset part of this cost, but not all of it.
26 For cement (8% of global CO2 emissions), there are pilot projects underway to (a) use less limestone, less heat and more clay; (b) cure cement with captured CO2 instead of water; (c) add bacteria to concrete that absorbs CO2 from the air; and (d) create cement bricks from bacteria and aggregate. Some approaches could only be used for light-duty load-bearing materials such as pavers, facades and temporary structures.
Industrial sectors with high electrification potential
Sector
Heat
requirement HVAC
Process
Heat CHP
Primary metals ex. steel 1200°C 6% 75% 7%
Fabricated metal 430°C-680°C 20% 61% 7%
Machinery 730°C 46% 39% 4%
Secondary steel 1425°C-1540°C 4% 87% 0%
Wood products 180°C 10% 50% 14%
Vehicle parts (drying) 150°C 31% 33% 12%
Plastics and rubber 260°C 20% 33% 24%
Source: LBNL, "Electrification of buildings and industry ", March 2018.
Fuel consumption shares:
Industrial sectors with medium/low electrification potential
Sector
Heat
requirement HVAC
Process
Heat CHP
Food/beverages 120°C-500°C 4% 25% 40%
Chemicals 100°C-850°C 1% 32% 43%
Pulp and paper 650°C 2% 21% 63%
Non-metallic minerals 870°C-1600°C 3% 90% 1%
Oil/coal products 220°C-540°C 0% 58% 22%
Source: LBNL, "Electrification of buildings and industry ", March 2018.
Fuel consumption shares:
High23%
5.9 quad BTUs
Medium (Chemicals, food processing)
33%8.7 quad BTUs
Low (Refining, paper, cement, glass, primary steel)
28%7.2 quad BTUs
US industrial energy use by electrification potential
Source: EIA (2020), LBNL, "Electrification of buildings and industry", 2018.
Includes: iron, secondary steel, aluminum, metal products, wood, plastics and mining
Texas
Cali
forn
ia
Lo
uis
ian
a
Ind
ian
a
Illi
no
is
Oh
io
Pe
nn
sylv
an
ia
UK
Germ
an
y
Italy
Fra
nc
e
Jap
an
Ch
ina
0x
1x
2x
3x
4x
5x
6x
7x
Source: EIA, Eurostat, IAEE, CEIC, IFPEN, JPMAM, World Bank. 2019. States shown are largest industrial users of US primary energy.
Electricity is 3x-6x more expensive than natural gasCost per megajoule of energy, electricity price divided by natural gas price; for industrial users

25
Bottom line: chemistry and cost explain the low rate of industrial electrification around the world, and why the electricity share of US industrial energy use has been roughly unchanged at 12%-15% since the early 1980’s.
A comment on primary steel production Secondary (recycled) steel is produced in electric arc furnaces, which allows for green electricity to be used when available. However, primary steel production accounts for ~70% of global steel production and is much harder to decarbonize. Most primary steel production relies on coke ovens and blast furnaces that use carbon as a reducing agent to strip oxygen from iron oxide, a process which produces CO2. Around 5% is produced using direct reduced iron (DRI) whose CO2 footprint per ton is roughly half of the blast furnace method. DRI uses natural gas to generate carbon monoxide and hydrogen, which is used to reduce iron ore in a furnace, which is then combined with scrap steel in an electric arc furnace. The lower carbon content of natural gas vs coal is part of the reason for DRI’s lower carbon footprint.
Some pilot projects aim to decrease the carbon footprint of primary steel by using green hydrogen as the reducing agent to strip oxygen from iron oxide. A consortium of Swedish companies (Vattenfall, LKAB and SSAB) aims to do just that, planning for some commercial production in 2026. However, the Nordic steel industry produces just 6 million metric tons per year, which is 0.35% of global production. So, even if the entire Nordic steel industry adopts this new approach by 2045 (the stated roadmap), it won’t have much of an impact unless other countries adopt the same approach, and do so much faster.
As a reminder, China and other emerging country production methods will be the primary drivers of future global emission changes given Western deindustrialization over the last 25 years. At last count, China made 50% of the world’s steel, 33% of the world’s ammonia, 61% of the world’s cement and 31% of the world’s plastics. Its transition to cleaner energy and more modern production methods may be the single largest determinant of the planet’s future over the next two decades.
0%
5%
10%
15%
20%
25%
30%
35%
40%
45%
1950 1960 1970 1980 1990 2000 2010 2020
Industrial energy use by typeShare of industrial energy use
Source: EIA. 2020.
Natural gas
Electricity
Steel production volumes by type, MMT per year
PrimaryBlast furnace: basic oxygen
furnace (BF-BOF)1,186
PrimaryDirect reduction of iron: electric
arc furnace (DRI-EAF)89
Primary Other 8
Secondary Electric arc furnace 388
Secondary Basic oxygen furnace 60
Total 1,731
Source: World Steel Association. 2019.
Blast furnace:
basic oxygen furnace
Direct reduction of iron:
electric arc furnace
Electricity 87 312
Coal 1,592 44
Natural gas 50 508
Total 1,729 864
Current primary steelmaking emissions
Kilograms of CO2 per ton of steel
Source: Resources for the Future, "Potential of hydrogen for
decarbonization ", 2021.
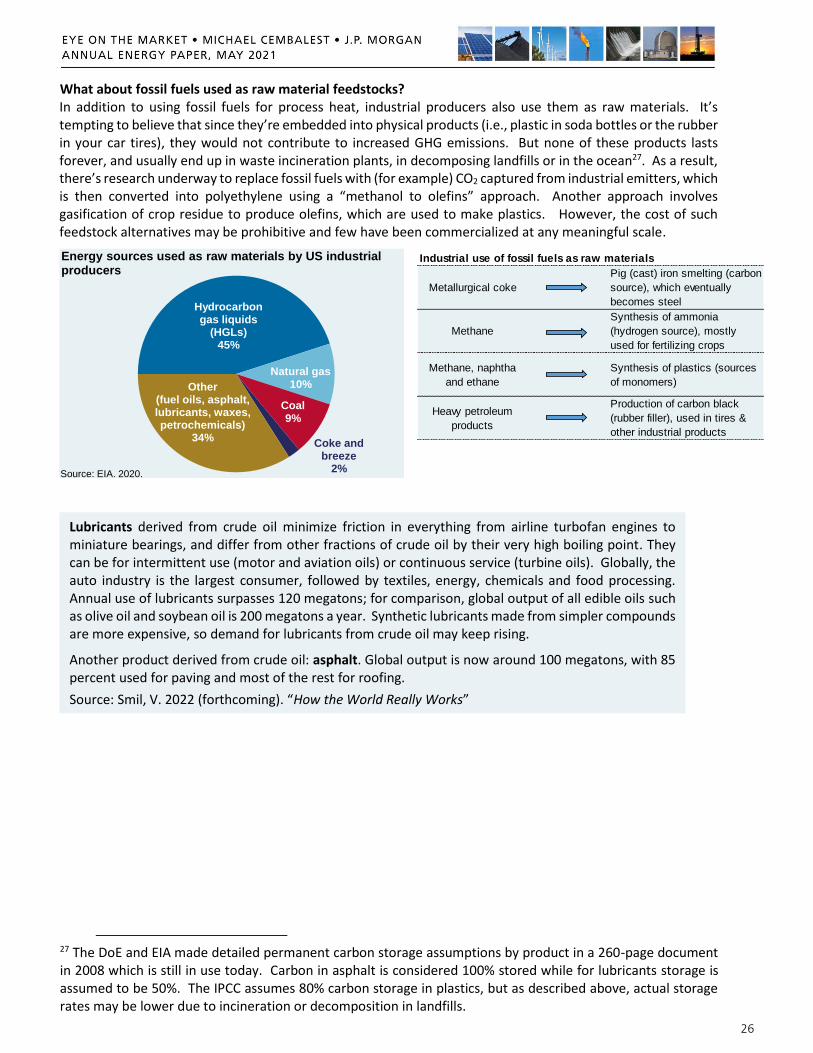
26
What about fossil fuels used as raw material feedstocks? In addition to using fossil fuels for process heat, industrial producers also use them as raw materials. It’s tempting to believe that since they’re embedded into physical products (i.e., plastic in soda bottles or the rubber in your car tires), they would not contribute to increased GHG emissions. But none of these products lasts forever, and usually end up in waste incineration plants, in decomposing landfills or in the ocean27. As a result, there’s research underway to replace fossil fuels with (for example) CO2 captured from industrial emitters, which is then converted into polyethylene using a “methanol to olefins” approach. Another approach involves gasification of crop residue to produce olefins, which are used to make plastics. However, the cost of such feedstock alternatives may be prohibitive and few have been commercialized at any meaningful scale.
27 The DoE and EIA made detailed permanent carbon storage assumptions by product in a 260-page document in 2008 which is still in use today. Carbon in asphalt is considered 100% stored while for lubricants storage is assumed to be 50%. The IPCC assumes 80% carbon storage in plastics, but as described above, actual storage rates may be lower due to incineration or decomposition in landfills.
Hydrocarbon gas liquids
(HGLs)45%
Natural gas10%
Coal9%
Coke and breeze
2%
Other (fuel oils, asphalt, lubricants, waxes, petrochemicals)
34%
Energy sources used as raw materials by US industrial producers
Source: EIA. 2020.
Lubricants derived from crude oil minimize friction in everything from airline turbofan engines to miniature bearings, and differ from other fractions of crude oil by their very high boiling point. They can be for intermittent use (motor and aviation oils) or continuous service (turbine oils). Globally, the auto industry is the largest consumer, followed by textiles, energy, chemicals and food processing. Annual use of lubricants surpasses 120 megatons; for comparison, global output of all edible oils such as olive oil and soybean oil is 200 megatons a year. Synthetic lubricants made from simpler compounds are more expensive, so demand for lubricants from crude oil may keep rising.
Another product derived from crude oil: asphalt. Global output is now around 100 megatons, with 85 percent used for paving and most of the rest for roofing.
Source: Smil, V. 2022 (forthcoming). “How the World Really Works”
Industrial use of fossil fuels as raw materials
Metallurgical coke
Pig (cast) iron smelting (carbon
source), which eventually
becomes steel
Methane
Synthesis of ammonia
(hydrogen source), mostly
used for fertilizing crops
Methane, naphtha
and ethane
Synthesis of plastics (sources
of monomers)
Heavy petroleum
products
Production of carbon black
(rubber filler), used in tires &
other industrial products

27
[6] Oil and gas update: our bullish call on the sector, one year later
In last year’s paper we made a bullish call on the oil & gas sector. Since then, energy rebounded and outperformed the overall market. We recommend that investors stick with the oil & gas sector for now.
During the prior decade, investing in the US shale revolution was often a train wreck. Take a 23-stock universe of companies associated with the US shale boom from 2010-201928:
As a group, their aggregate free cash flow was negative in every year
Seven of these companies never experienced a single year of positive cash flow
Another eleven companies only experienced positive free cash flow in 3 or fewer years out of 10
We felt that this poor performance was based on (a) the collapse in capital discipline by management and by investors and (b) the supply shock from hydraulic fracturing rather than (c) a sign that demand for fossil fuels was at a permanent, downward inflection point. In other words, investors and management could solve this problem after a period of bankruptcies, consolidation and a renewed focus on free cash flow. Since last summer, signals are mostly positive. The industry is now more focused on generating cash flow for investors, and both rig counts and capital spending have bottomed out.
28 The 23 companies in our shale universe: Antero, Apache, Cabot, Callon, Chesapeake, Cimarex, Continental, Denbury, Diamondback, EOG, EQT, Hess, Laredo, Marathon, Matador, Murphy, Oasis, PDC, Pioneer, Range, SM, Southwestern, and Whiting. The following 6 companies were included in the shale analysis in our 2020 energy paper, but have since been acquired: Anadarko, Carrizo, Concho, Noble, WPX and QEP.
-$80
-$60
-$40
-$20
$0
$20
$40
$60
2010 2011 2012 2013 2014 2015 2016 2017 2018 2019 2020
Thousands
Source: Bloomberg. 2020.
Shale revolution: a revolution in supply, not profitSelect cash flow measures for 23 shale companies, US$, billions
Operating cash flow
Capital expenditure
Free cash flow
-$12
-$8
-$4
$0
$4
$8
2013 2014 2015 2016 2017 2018 2019 2020 2021 2022
Source: Bloomberg. Q4 2020. Dots represent estimates.
Energy sector free cash flowUS$, billions
S&P 1500 Oil and Gas E&P Index
Shale revolution portfolio(23 companies)
250
500
750
1,000
1,250
1,500
1,750
2,000
2,250
2012 2013 2014 2015 2016 2017 2018 2019 2020 2021
Source: Baker Hughes, Bloomberg. April 23, 2021.
Number of US oil and gas rigs
Jan 1, 2020
-80%
-60%
-40%
-20%
0%
20%
40%
60%
2016 2017 2018 2019 2020 2021
Hundre
ds
Source: Federal Reserve Bank of Dallas. Q4 2020.
E&P year ahead capital spending expectations Share of firms expecting increased capex - expecting decreased capex
Jan 1, 2020

28
Market results. Shale stocks rebounded from 2020 lows and outperformed the broad market since our energy paper last year. However, these gains are eclipsed by the rise in renewable energy stocks. Despite the rebound, the oil & gas sector still trades close to the largest discount vs the market in its 90-year history.
We recommend that investors stick with oil & gas for now. World demand for liquid fuels should continue to rebound as COVID vaccinations increase and economies reopen. As demand grows, we expect supply to recover more slowly. “Big Oil” return on capital fell to single digits by 2016 due to excess competition; we expect these returns to rise back to 1990’s levels of 10%-15%. And while publicly traded oil companies only represent 2/3 of global production, their trends are notable: 60% decline in reserve lives since 2014, steepening oil cost curves since 2017 and declining capital commitments29.
29 “Top Projects 2021: Shrinking Reserves and Rising Profits”, Goldman Sachs, March 24, 2021. See Exhibits 1-4.
0
100
200
300
400
500
600
2013 2014 2015 2016 2017 2018 2019 2020 2021
Source: Bloomberg. April 26, 2021.
Energy rebound vs the market since June 2020Cumulative total return index, January 2013=100
S&P 500
Shale revolution portfolio (23 companies)
Avg. of 5 renewable
energy indexes
63%
40%
123%
Returns sinceJune 2020
0.3
0.6
0.9
1.2
1.5
1.8
2.1
2.4
2.7
1928 1938 1948 1958 1968 1978 1988 1998 2008 2018
Source: Empirical Research Partners. March 2021. Equal weighted portfolio.
Energy sector valuations at all-time lows vs the market Energy stocks price to book divided by market price to book
1928-2021average
$0
$20
$40
$60
$80
$100
$120
$140
$160
0 5,000 10,000 15,000 20,000 25,000 30,000 35,000 40,000 45,000
Cost curve for new oil projects (pre-sanction, under development and producing) 2009-2020Breakeven prices (US$ / barrel)
Source: Goldman Sachs. 2021. Identified projects (pre-sanction, under development and producing) are evaluated each year and assigned a breakeven price and peak oil production. The oil cost curve depicts the cumulative peak oil production of identified projects.
Cumulative peak oil production (thousand barrels of oil equivalent per day)
20092011
2013
2020 2015 2019 2017

29
Lastly, the world is not on track to strand a lot of oil and gas in the future and is much closer to the IEA Stated Policies scenario than its Sustainable Development scenario30. Only in the latter are oil, gas and coal assets projected to be left stranded in the ground, which you can see in the table. As a result, peak oil demand forecasts may end up being just as wrong as peak oil supply forecasts were a generation ago31.
This is the “oil wedge” chart: it shows different projections of future oil demand and the amount of oil supply from existing fields assuming no new development. Even in the IEA’s highly ambitious Sustainable Development scenario, world oil demand in 2040 is still twice the level of supply from existing fields. Is everyone sure that we should starve this industry of capital starting now?
30 The IEA Stated Policies scenario is not the status quo; it reflects some far-reaching and ambitious targets that have been legislated or announced by govt’s around the world. The IEA Sustainable Development scenario is even more ambitious, and assumes the following by 2030: global primary energy use declines 7% from 2019 to 2030 (compared to a 20% increase over the prior 11 years); solar generation grows by a factor of 5.6x, wind generation grows by a factor of 2.4x; nuclear generation increases by 23% (no decommissioning); coal use for power/heat declines by 51%; and electric vehicles sales reach 40% from today’s 4.5% levels. 31 See Vaclav’s 2006 “Peak Oil: A Catastrophic Cult and Complex Realities”. Global oil production has risen by 20%-60% since the dates of various peak oil supply forecasts made in prior decades.
75
80
85
90
95
100
105
110
2018 2019 2020 2021 2022
World liquid fuels consumption Million barrels per day
Source: EIA Short-term Energy Outlook. March 2021.
Comparing stranded asset risks in IEA scenarios
Proven
reserves, 2018
Cumul. extraction,
2019-2070
Stranded
in 2070
Percent
stranded
Oil 235,931 265,353 0 0%
Nat gas 169,334 228,266 0 0%
Coal 596,540 197,890 398,650 67%
Proven
reserves, 2018
Cumul. extraction,
2019-2070
Stranded
in 2070
Percent
stranded
Oil 235,931 137,478 98,454 42%
Nat gas 169,334 125,259 44,075 26%
Coal 596,540 77,560 518,980 87%
Source: BP, IEA, JPM. Units show n are million tons of oil equivalent. 2019.
Sustainable Development Scenario: large amounts of stranded oil, gas & coal
Stated Policies Scenario: only coal assets stranded
20
40
60
80
100
120
140
1970 1980 1990 2000 2010 2020 2030 2040
Oil "future production wedge": demand vs existing field supply Million barrels per day
Source: BP. 2019.
Oil supply
Oil supply (assumingno new development)
Demand forecasts
BP (base case)Wood Mackenzie
BP (Even Faster Transition)
EIAIEA Current PoliciesOPECIEA New Policies
IEA Sustainable Development

30
[7] Biden’s energy agenda: how much oil and gas will the US need in the future?
For the first time in my lifetime the US is “energy independent”, at least on a net basis. However, 60%-80% of US oil, gas and NGL production is reliant on hydraulic fracturing, and the US is still 75%-80% reliant on fossil fuels for primary energy. Against this backdrop, the Biden administration announced policies to reduce oil & gas supply and demand and to decarbonize the electricity grid by 2035. In this section, we analyze each. To start out, here are some charts on US energy independence and US reliance on hydraulic fracturing.
[a] Oil supply and demand
Biden’s energy agenda includes the following policies which impact oil/gasoline:
Ban on new leases for oil & gas production on Federal lands, which currently account for 9% of onshore oil, 9% of onshore gas, 16% of offshore oil and 3% of offshore gas (executive action)
Termination of 500,000 barrel per day Keystone XL32 pipeline project (executive action)
Electrification of the Federal vehicle fleet (executive action)
$100 billion over ten years for extension of Federal income tax credits for EVs by eliminating the 200,000 unit cap, tax credits for used EV purchases and point-of-sale trade-in rebates for EVs (legislation)
Improvement in public transit infrastructure, designed to reduce car ownership (legislation)
A 6% annual emissions reduction in new model years 2026-2030 vs 2020 baseline (executive action)
32 Gasoline is only part of the energy supply lost from the Keystone XL cancellation. Other annual energy supply losses include 2.3 billion gallons of distillate fuels and 800 million gallons of jet fuel, both of which would need to be produced on US private lands or imported from someplace other than Canada.
-200
-100
0
100
200
300
400
500
600
700
800
1972 1978 1984 1990 1996 2002 2008 2014 2020
Source: EIA, JPMAM. December 2020.
US net energy deficit, in energy termsNet imports of oil, natural gas and coal in million tonnes of oil equiv.
MaximumUS energy
dependence
2020 US energy independence
70
80
90
100
110
120
5
6
7
8
9
10
11
12
13
'10 '11 '12 '13 '14 '15 '16 '17 '18 '19 '20 '21
US crude oil and natural gas productionMillion barrels per day Billion cubic feet per day
Source: EIA. January 2021.
Natural gas production
Crude oil production
0
2
4
6
8
10
12
2000 2003 2006 2009 2012 2015 2018
Source: EIA. 2019.
US oil production by typeMillion barrels per day
Tight oil (fracking
dependent)
Gulf of MexicoAlaska
Conventional onshore0
5
10
15
20
25
30
35
2000 2003 2006 2009 2012 2015 2018
Source: EIA. 2019.
US dry natural gas production by typeTrillion cubic feet per year
Shale gas
Conventional onshore
Conventional offshoreOther
Tight gas
Fracking dependent
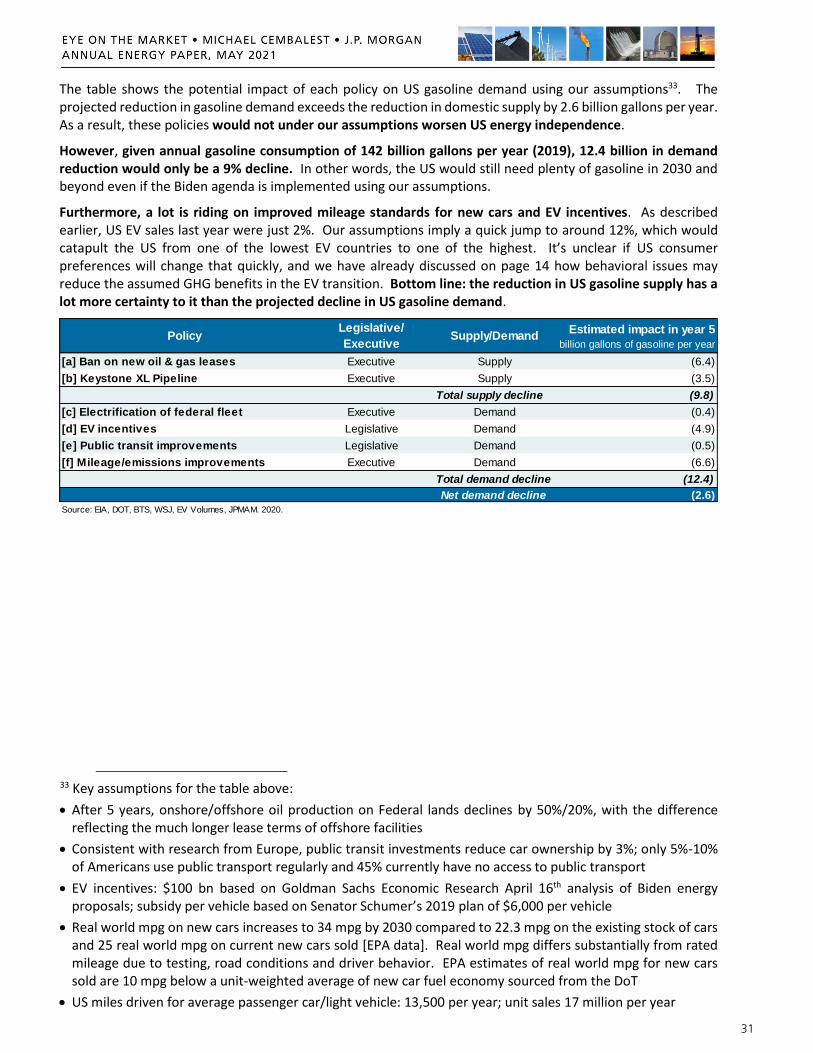
31
The table shows the potential impact of each policy on US gasoline demand using our assumptions33. The projected reduction in gasoline demand exceeds the reduction in domestic supply by 2.6 billion gallons per year. As a result, these policies would not under our assumptions worsen US energy independence.
However, given annual gasoline consumption of 142 billion gallons per year (2019), 12.4 billion in demand reduction would only be a 9% decline. In other words, the US would still need plenty of gasoline in 2030 and beyond even if the Biden agenda is implemented using our assumptions.
Furthermore, a lot is riding on improved mileage standards for new cars and EV incentives. As described earlier, US EV sales last year were just 2%. Our assumptions imply a quick jump to around 12%, which would catapult the US from one of the lowest EV countries to one of the highest. It’s unclear if US consumer preferences will change that quickly, and we have already discussed on page 14 how behavioral issues may reduce the assumed GHG benefits in the EV transition. Bottom line: the reduction in US gasoline supply has a lot more certainty to it than the projected decline in US gasoline demand.
33 Key assumptions for the table above:
After 5 years, onshore/offshore oil production on Federal lands declines by 50%/20%, with the difference reflecting the much longer lease terms of offshore facilities
Consistent with research from Europe, public transit investments reduce car ownership by 3%; only 5%-10% of Americans use public transport regularly and 45% currently have no access to public transport
EV incentives: $100 bn based on Goldman Sachs Economic Research April 16th analysis of Biden energy proposals; subsidy per vehicle based on Senator Schumer’s 2019 plan of $6,000 per vehicle
Real world mpg on new cars increases to 34 mpg by 2030 compared to 22.3 mpg on the existing stock of cars and 25 real world mpg on current new cars sold [EPA data]. Real world mpg differs substantially from rated mileage due to testing, road conditions and driver behavior. EPA estimates of real world mpg for new cars sold are 10 mpg below a unit-weighted average of new car fuel economy sourced from the DoT
US miles driven for average passenger car/light vehicle: 13,500 per year; unit sales 17 million per year
PolicyLegislative/
ExecutiveSupply/Demand
Estimated impact in year 5
billion gallons of gasoline per year
[a] Ban on new oil & gas leases Executive Supply (6.4)
[b] Keystone XL Pipeline Executive Supply (3.5)
Total supply decline (9.8)
[c] Electrification of federal fleet Executive Demand (0.4)
[d] EV incentives Legislative Demand (4.9)
[e] Public transit improvements Legislative Demand (0.5)
[f] Mileage/emissions improvements Executive Demand (6.6)
Total demand decline (12.4)
Net demand decline (2.6)
Source: EIA, DOT, BTS, WSJ, EV Volumes, JPMAM. 2020.

32
[b] How much natural gas will the US need in the future (i.e., 2035)?
The Biden administration aims to decarbonize the US electricity grid by 2035. In this section we examine implications for the US natural gas industry. By 2035, we assume the following:
Since most nuclear plants will be 50 years old or more and since many are already unprofitable, 2/3 will be decommissioned; coal plants will be decommissioned as well; hydropower grows by 5% as per prior studies
US electricity demand grows by 10% to accommodate 30% EV penetration with EVs @3.3 miles per kWh; the overall light vehicle fleet grows by 1% per year; non-EV electricity demand remains constant as efficiency improvements offset a projected rise in population (as has been the case since 2005)
Median national capacity factors of 25% for utility-scale tracking solar and 35% for onshore wind
If we stop there, the US natural gas industry would need to increase its share of electricity generation from 39% to 77% [Scenario B]. Next, we include wind and solar growth of 25-30 GW per year projected by LBNL before the impact of any Biden infrastructure spending, in which case the natural gas share of generation would be 57% [Scenario C]. Finally, we assume a faster 73 GW pace of wind/solar growth based on the rate of peak US capacity additions during the natural gas boom of the late 1990’s. This is very aggressive since that capacity boom only lasted two years, and we assume this pace is sustained for 15 years. In this case, the natural gas share of generation would fall to 23% in 2035 [Scenario D].
The Scenario D wind/solar capacity expansion would require a lot of new transmission infrastructure as well. The third chart illustrates just how much of a challenge this will be given Federal, state and local transmission bottlenecks discussed in Sections 2 and 3. Without adequate interstate transmission expansion, renewable penetration of this magnitude would be close to impossible, even with growth in distributed storage.
0
500
1,000
1,500
2,000
2,500
3,000
3,500
4,000
4,500
5,000
5,500
A: current B: coal shut down2/3 nuclear shut down30% EV penetration
C: B + current wind/solarprojections
D: B + wind/solar growth athistorical peak pace
Other
Solar
Wind
Hydro
Nuclear
Coal
Petroleum
Nat. gas
US electricity generation mix Terawatt hours
Source: BP, EIA, Lawrence Berkeley National Laboratory, JPMAM. 2019.
20192035 2035 2035
0
50
100
150
200
250
300
1960 1970 1980 1990 2000 2010 2020 2030
Source: American Public Power Association, EIA, China Electricity Council, Fraunhofer ISE, BP, LBNL, Clack et al. (pre-2014 data), JPMAM. 2020.
Historical rates of installed electric-generating capacity Capacity additions, watts per year per capita
Coal and nuclear peak
2nd nuclear peak
Natural gas peak
Scenario D
Scenario C
2020
Scenario D (2035)
Scenario C (2035)
0
100
200
300
400
1978 1988 1998 2008 2018 2028 2038
US transmission infrastructureThousand gigawatt-miles
Source: DOE, UT Austin, BP, EIA, Princeton Net Zero, LBNL, JPMAM. 2020.
Dept. of Energy
UT Austin
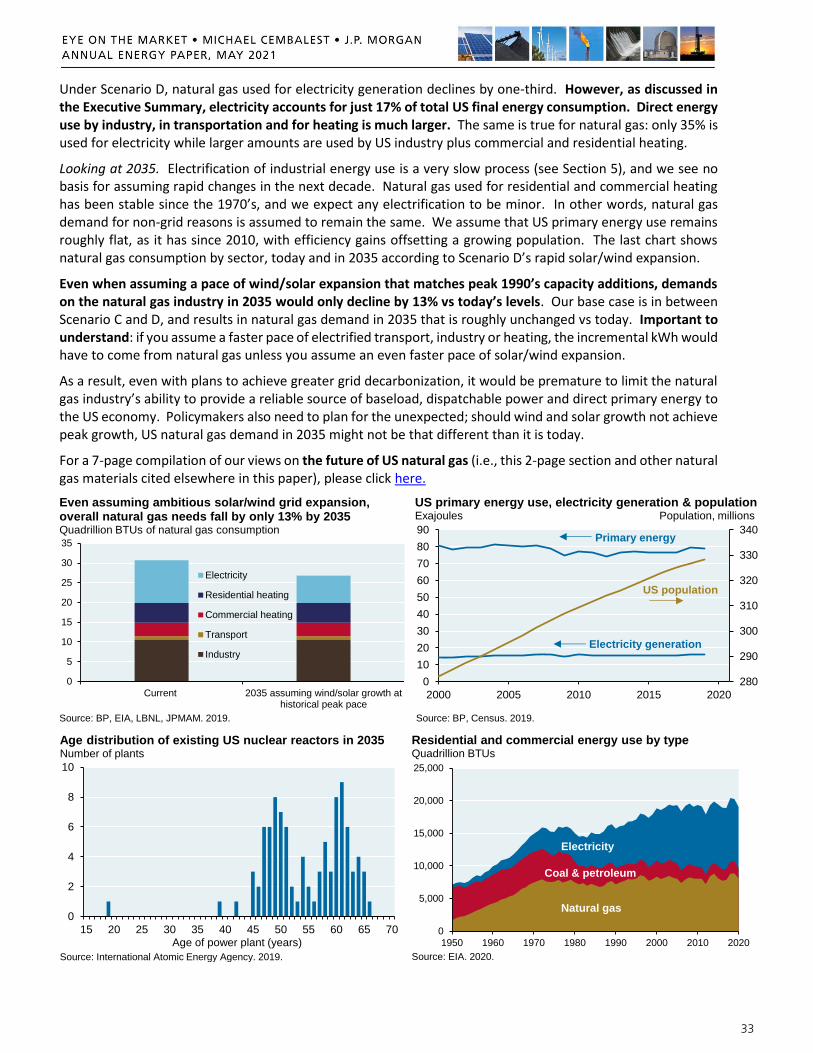
33
Under Scenario D, natural gas used for electricity generation declines by one-third. However, as discussed in the Executive Summary, electricity accounts for just 17% of total US final energy consumption. Direct energy use by industry, in transportation and for heating is much larger. The same is true for natural gas: only 35% is used for electricity while larger amounts are used by US industry plus commercial and residential heating.
Looking at 2035. Electrification of industrial energy use is a very slow process (see Section 5), and we see no basis for assuming rapid changes in the next decade. Natural gas used for residential and commercial heating has been stable since the 1970’s, and we expect any electrification to be minor. In other words, natural gas demand for non-grid reasons is assumed to remain the same. We assume that US primary energy use remains roughly flat, as it has since 2010, with efficiency gains offsetting a growing population. The last chart shows natural gas consumption by sector, today and in 2035 according to Scenario D’s rapid solar/wind expansion.
Even when assuming a pace of wind/solar expansion that matches peak 1990’s capacity additions, demands on the natural gas industry in 2035 would only decline by 13% vs today’s levels. Our base case is in between Scenario C and D, and results in natural gas demand in 2035 that is roughly unchanged vs today. Important to understand: if you assume a faster pace of electrified transport, industry or heating, the incremental kWh would have to come from natural gas unless you assume an even faster pace of solar/wind expansion.
As a result, even with plans to achieve greater grid decarbonization, it would be premature to limit the natural gas industry’s ability to provide a reliable source of baseload, dispatchable power and direct primary energy to the US economy. Policymakers also need to plan for the unexpected; should wind and solar growth not achieve peak growth, US natural gas demand in 2035 might not be that different than it is today.
For a 7-page compilation of our views on the future of US natural gas (i.e., this 2-page section and other natural gas materials cited elsewhere in this paper), please click here.
0
5
10
15
20
25
30
35
Current 2035 assuming wind/solar growth athistorical peak pace
Electricity
Residential heating
Commercial heating
Transport
Industry
Even assuming ambitious solar/wind grid expansion, overall natural gas needs fall by only 13% by 2035Quadrillion BTUs of natural gas consumption
Source: BP, EIA, LBNL, JPMAM. 2019.
280
290
300
310
320
330
340
0
10
20
30
40
50
60
70
80
90
2000 2005 2010 2015 2020
US primary energy use, electricity generation & populationExajoules Population, millions
Source: BP, Census. 2019.
Electricity generation
US population
Primary energy
0
2
4
6
8
10
15 20 25 30 35 40 45 50 55 60 65 70
Age distribution of existing US nuclear reactors in 2035Number of plants
Source: International Atomic Energy Agency. 2019.
Age of power plant (years)0
5,000
10,000
15,000
20,000
25,000
1950 1960 1970 1980 1990 2000 2010 2020
Residential and commercial energy use by typeQuadrillion BTUs
Source: EIA. 2020.
Natural gas
Electricity
Coal & petroleum
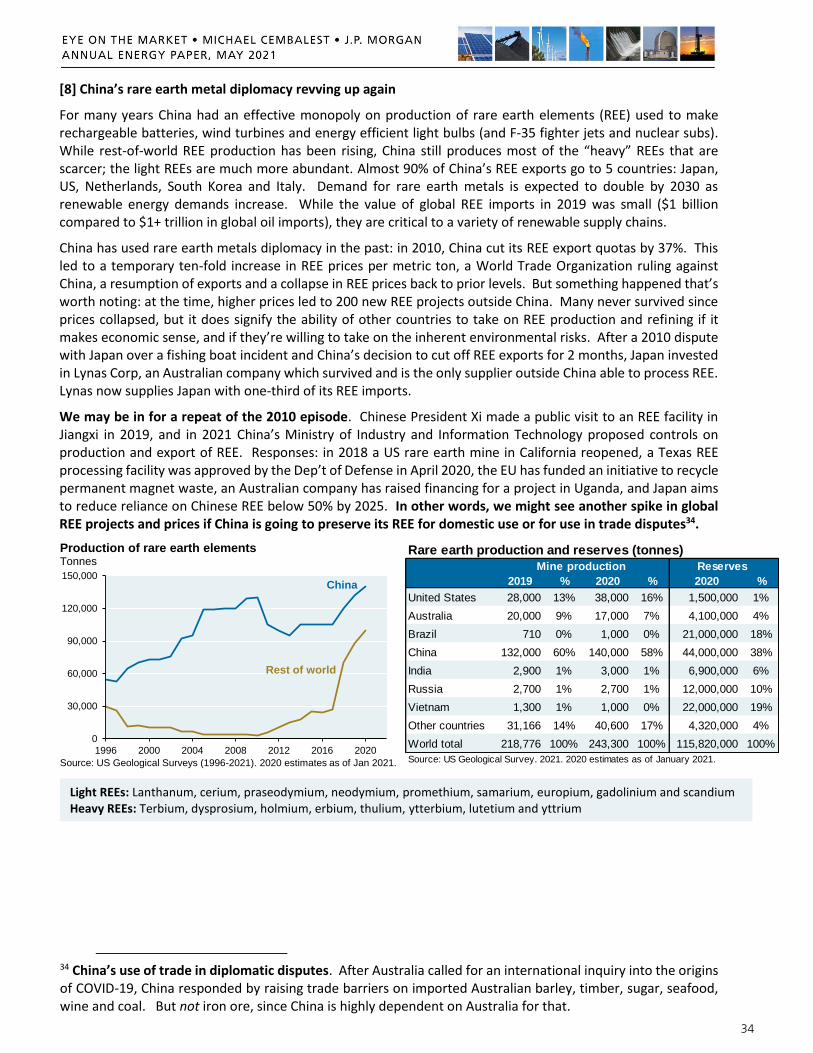
34
[8] China’s rare earth metal diplomacy revving up again
For many years China had an effective monopoly on production of rare earth elements (REE) used to make rechargeable batteries, wind turbines and energy efficient light bulbs (and F-35 fighter jets and nuclear subs). While rest-of-world REE production has been rising, China still produces most of the “heavy” REEs that are scarcer; the light REEs are much more abundant. Almost 90% of China’s REE exports go to 5 countries: Japan, US, Netherlands, South Korea and Italy. Demand for rare earth metals is expected to double by 2030 as renewable energy demands increase. While the value of global REE imports in 2019 was small ($1 billion compared to $1+ trillion in global oil imports), they are critical to a variety of renewable supply chains.
China has used rare earth metals diplomacy in the past: in 2010, China cut its REE export quotas by 37%. This led to a temporary ten-fold increase in REE prices per metric ton, a World Trade Organization ruling against China, a resumption of exports and a collapse in REE prices back to prior levels. But something happened that’s worth noting: at the time, higher prices led to 200 new REE projects outside China. Many never survived since prices collapsed, but it does signify the ability of other countries to take on REE production and refining if it makes economic sense, and if they’re willing to take on the inherent environmental risks. After a 2010 dispute with Japan over a fishing boat incident and China’s decision to cut off REE exports for 2 months, Japan invested in Lynas Corp, an Australian company which survived and is the only supplier outside China able to process REE. Lynas now supplies Japan with one-third of its REE imports.
We may be in for a repeat of the 2010 episode. Chinese President Xi made a public visit to an REE facility in Jiangxi in 2019, and in 2021 China’s Ministry of Industry and Information Technology proposed controls on production and export of REE. Responses: in 2018 a US rare earth mine in California reopened, a Texas REE processing facility was approved by the Dep’t of Defense in April 2020, the EU has funded an initiative to recycle permanent magnet waste, an Australian company has raised financing for a project in Uganda, and Japan aims to reduce reliance on Chinese REE below 50% by 2025. In other words, we might see another spike in global REE projects and prices if China is going to preserve its REE for domestic use or for use in trade disputes34.
34 China’s use of trade in diplomatic disputes. After Australia called for an international inquiry into the origins of COVID-19, China responded by raising trade barriers on imported Australian barley, timber, sugar, seafood, wine and coal. But not iron ore, since China is highly dependent on Australia for that.
0
30,000
60,000
90,000
120,000
150,000
1996 2000 2004 2008 2012 2016 2020
Production of rare earth elements Tonnes
Source: US Geological Surveys (1996-2021). 2020 estimates as of Jan 2021.
China
Rest of world
Rare earth production and reserves (tonnes)
2019 % 2020 % 2020 %
United States 28,000 13% 38,000 16% 1,500,000 1%
Australia 20,000 9% 17,000 7% 4,100,000 4%
Brazil 710 0% 1,000 0% 21,000,000 18%
China 132,000 60% 140,000 58% 44,000,000 38%
India 2,900 1% 3,000 1% 6,900,000 6%
Russia 2,700 1% 2,700 1% 12,000,000 10%
Vietnam 1,300 1% 1,000 0% 22,000,000 19%
Other countries 31,166 14% 40,600 17% 4,320,000 4%
World total 218,776 100% 243,300 100% 115,820,000 100%
Reserves Mine production
Source: US Geological Survey. 2021. 2020 estimates as of January 2021.
Light REEs: Lanthanum, cerium, praseodymium, neodymium, promethium, samarium, europium, gadolinium and scandium Heavy REEs: Terbium, dysprosium, holmium, erbium, thulium, ytterbium, lutetium and yttrium

35
[9] China: how new laws on residential heating systems actually lead to greater GHG emissions
Due to its low price and high heat value, coal is a primary winter heating fuel in Northern China. In rural communities, coal-fueled “kang” bed-stoves have been around for almost 2,000 years. However, without desulfurization and denitrification, kang bed-stove combustion of coal releases sulfur dioxide, nitrogen oxide and other air pollutants directly into the atmosphere. In the Beijing/Tianjin/Hebei region, annual rural coal consumption can exceed 40 million tons, contributing to ~15% of that region’s overall sulfur dioxide, 4% of its nitrogen oxide and 23% of its airborne nanoparticles. The first chart illustrates the huge seasonal swing in Central and Northern China air quality in winter when coal usage rises, and how particulate matter surges above recommended limits in Western countries. An alternative air quality measure shows that in some Northern China regions, air quality sometimes registers as “terrible” or “poisonous” in winter months.
The problem: direct combustion of coal for heat is more efficient than combustion of coal to make electricity to power electric heaters, and China’s grid is still highly reliant on coal. On the right, we show the estimated heating efficiency of kang bed-stoves (62%) compared to the efficiency of China’s electricity grid (38%, net of transmission losses). Also: China’s electricity grid is 65% reliant on coal. Putting the pieces together, a 2020 paper estimated that for every 1 kg of coal consumed by a kang bed-stove, 1.9-2.2 kg of coal would be needed to indirectly power an electric heater in the same home35. The authors estimate 200 million metric tons of additional CO2 emissions this year in China simply due to the shift from kang bed-stoves to electric heating (around 2% of China’s overall CO2 emissions). As per the chart on the left, the policy may be helping to reduce particulate matter as intended, along with other decarbonization steps.
Urbanization and further penetration of renewables on the grid will solve part of this problem in China, but there’s a broader issue at work here. “Electrification of everything” can improve air and water quality in countries with substantial rural combustion of fossil fuels, and provides a means to eventually use greener power on the grid. However, electrification before grid decarbonization can improve some environmental issues while at the same time making others worse.
35 “Exploring the trade-offs between electric heating policy and carbon mitigation in China”, Kammen et al, Nature Communications, 2020.
0
25
50
75
100
125
150
2013 2014 2015 2016 2017 2018 2019 2020 2021
China particulate matterMicrograms per cubic meter, particulate matter (<2.5 micrometers)
Source: Bloomberg, EPA, JPMAM. March 31, 2021.
Regions included: Beijing, Shanghai, Shenyang, Chengdu
US EPA primary annual standard
US EPA 24-hour standard0%
10%
20%
30%
40%
50%
60%
70%
Kang heating system Electric heaters powered byelectricity grid
Efficiency of Chinese heating systems %
Source: Kammen, UC Berkeley; Zheng, North China Electric Power University. November 2020.

36
[10] US solar power: distributed small-scale generation is growing, but customers face headwinds
US solar power is still a small contributor at 2.8% of electricity generation and 1.2% of primary energy. Wood MacKenzie expects solar generation to double by 2025, but that’s still single digits in share terms. On a national level, utility-scale solar power on the grid accounts for 2/3 of solar generation while small-scale distributed solar on residential, commercial and industrial rooftops accounts for the rest. In some states, distributed solar accounts for more generation than grid solar (MA, HI, VT, NJ, MD). In the third chart, we show solar capacity factors by state; fixed-tilt is an upper limit proxy for distributed rooftop solar.
Many states no longer reimburse solar customers at the full retail rate irrespective of time of day. Many now pay a fixed discount to the retail rate, or a time-of-use amount which depends on the time of day (ToD), or a wholesale rate. Some utilities take an even more localized approach, only maintaining generous incentives for customers in places with strained, over-utilized transmission grids. Falling compensation rates increase the value of distributed storage to such customers, allowing them to forgo electricity purchases at higher prices; but this has its own payback period due to the additional capital cost of storage capacity.
Less generous reimbursement approaches have been adopted since (a) many solar customers flood the grid with electricity when it’s abundant, reducing its value; and (b) customers that export solar need in some way to bear a greater cost of transmission upgrades that are often required to accommodate two-way electricity flows. According to a study of industrial solar customers in California, changes to net metering rules reduced electricity savings by 30% and substantially lengthened payback periods.
Industrial and commercial utility-scale
Residential small-scale
Industrial small-scale
Commercial small-scale
Grid electricity
US solar generation by source
Source: Energy Information Administration, JPMAM. 2019.
0%
2%
4%
6%
8%
10%
12%
14%
16%
18%
20%
CA MA NV HI VT UT AZ NC NM NJ MD ID DE CO RI
Small-scale solar
Grid electricity + non-gridutility scale solar
Top 15 states by solar share of electricity generation% of total electricity generation
Source: Energy Information Administration, JPMAM. 2019.
AZ NV CA UT NM CO ID NC HI MD DE NJ MA VT
-5%
0%
5%
10%
15%
20%
25%
30%
35% Tracking mount Fixed tilt mount
Utility scale solar capacity factors by state
Source: Lawrence Berkeley National Lab, JPMAM. 2019. Gray bar = estimate.
Select reimbursement approaches by state AZ initial 30% below ToD retail rate, reimbursement declines over time; CA full ToD retail rate; if positive net balance at end of year, reimbursed at 3-4¢ per kWh; monthly transmission charge; HI wholesale rate (~50% of retail rate) plus monthly transmission charge; MA full retail rate, 60% of retail rate for positive export balance; MD full retail rate; NJ full retail rate, avoided cost for positive export balance; NM utility-dependent (full retail rate or net avoided cost); NV 75%-95% of retail rate; UT full retail rate; VT full retail rate, 10%-20% below retail rate for positive export balance

37
Epilogue: Last words on the Texas power outage and why I write this paper each year
Here’s a chart on the outage and a table showing ERCOT’s seasonal resource adequacy assessment.
Now let’s look at what some politicians, regulators and journalists had to say about this.
In my view, these are highly inaccurate diagnoses of the outage given the following readily available information:
The decline in Texas natural gas generation was four times larger than the decline in wind
ERCOT said the outage was primarily due to natural gas supply issues due to freezing of gathering lines and failure of electric pumps. The table above shows the underperformance by fuel type according to ERCOT’s own worst-case risk assessment analysis prepared in 2020
Texas has a “critical loop” problem: many of its natural gas production sites, compression facilities and hubs are electrified instead of using natural gas to power their operations. As a result, if their electricity is cut for some reason, it creates a downward spiral since these facilities can no longer supply natural gas to power plants, creating the need for even greater outages that affect more natural gas operators. This is what happened during the outage when Texas utility Oncor cut power to dozens of natural gas facilities
There’s an easy solution here: natural gas operators are supposed to file a form so that they are on a “critical infrastructure list”. However, as reported in the Texas Tribune, many natural gas operators hadn’t filled out the form or didn’t even know it existed (!!). After the outage, Oncor added 168 natural gas facilities to its critical list, a five-fold increase from January of this year
0
10,000
20,000
30,000
40,000
50,000
60,000
70,000
Feb 12 Feb 13 Feb 14 Feb 15 Feb 16 Feb 17 Feb 18
Electricity generation in TexasMegawatt hours
Source: EIA. February 22, 2021. Renewable includes wind, solar and hydroelectric. Thermal includes natural gas, coal and nuclear.
Blackouts beganThermal
Renewable
Coal Nuclear Gas Wind
Total capacity 13.6 5.2 48.4 25.0
Expected offline 2.8 1.1 10.0 23.2
Expected online 10.8 4.1 38.3 1.8
Minimum during crisis
(Feb. 15)7.6 3.8 27.5 0.6
Underperformance 3.2 0.3 10.8 1.1
Source: ERCOT 2020 SARA report, EIA, JPMAM. 2021.
ERCOT seasonal resource adequacy assessment: winter
worst case, gigawatts
“Bad Takes Department”: some people blamed the Texas power outage primarily on wind
“This is what happens when you force the grid to rely in part on wind as a power source. When weather conditions get bad as they did this week, intermittent renewable energy like wind isn’t there when you need it.” – U.S. Representative Dan Crenshaw (Texas Tribune)
“We should never build another wind turbine in Texas.”
– Sid Miller, Texas agriculture commissioner (Texas Tribune)
“The windmills failed, like the silly fashion accessories they are, and people in Texas died.”
– Tucker Carlson, Fox News (Austin American-Statesman)
“[The outages] are proof that green energy is not ready for primetime. [In sub-freezing temperatures], wind and solar just don’t work for power.” – Larry Kudlow, Fox News (Austin American-Statesman)
“The cold-driven February 2021 shortage in Texas was caused by over-reliance, not under-reliance, on weather-dependent renewables like solar panels and wind turbines.” – Michael Shellenberger (energy journalist)

38
Another problem: in Texas, natural gas pipelines are contractually obligated to prioritize residential customers while power plants usually don’t have contracts that guarantee supply. When demand for natural gas spiked during the cold weather, most residences received uninterrupted natural gas while many power plants didn’t
Remarkably, the president of the North American Electric Reliability Corporation (NERC) said this: “Our gas system, quite frankly, is designed for industrial use and space heating. It’s not designed to serve large power plants. We don’t think of gas as the same criticality as we do power. That makes sense, except when you realize a power system without reliable gas supply is not that useful”
NERC and the Texas Public Policy Foundation warned years ago that ERCOT’s load vs its capacity reserve margin was too small
Texas relies heavily on just-in-time production of natural gas and has less gas storage than other states with high shares of gas-powered electricity generation; more gas storage should be the easiest fix rather than more costly winterization of equipment
Texas decided years ago not to participate in the Tres Amigas interconnection project which could have provided backup power from Western and Eastern grids. One reason Texas reportedly declined to participate: it would have required the state to be regulated by FERC (national) instead of ERCOT (state)
I understand concerns about large shares of wind power. It’s intermittent, requires new transmission lines and suffers from energy density problems that we describe elsewhere. And in contrast to normal years when Texas wind generates high capacity factors in winter, Texas wind output collapsed this February. However, as shown in the table on the prior page, a wind decline was something ERCOT had planned for; the larger and sudden collapse in natural gas generation was not. As a result, the outage is primarily a natural gas story and to say otherwise indicates to me that someone has an agenda they’re pushing. The Texas outage and its misdiagnoses are one reason I write this paper every year: as long as there’s misinformation36 about energy out there (whether accidental or intentional), there’s still more work to do. See you next year.
36 Misinformation in Texas was not confined to energy in 2021. Two of the more absurd election lawsuits were filed in Texas this year. They rhyme with contentions that wind was the primary issue in the Texas power outage.
[1] An original jurisdiction Supreme Court case filed by Texas AG Paxton which alleged that other states violated Texas rights by using non-legislative means to change election rules. UT professor Stephen Vladeck called the suit the “craziest” lawsuit filed during the election season, and election law expert Rick Hasen at UC Irvine characterized it as “the dumbest case I've ever seen filed on an emergency basis at the Supreme Court”.
[2] The lawsuit filed by Texas Rep Gohmert which petitioned the US District Court for Eastern Texas to grant VP Pence the “exclusive authority and sole discretion under the 12th Amendment to determine which slates of electors for a State, or neither, may be counted”. Constitutional scholar Ned Foley at Ohio State described the suit as “breathtaking and preposterous”; even the Trump DoJ described it as a “walking legal contradiction”.
0%
10%
20%
30%
40%
50%
Jan Feb Mar Apr May Jun Jul Aug Sep Oct Nov Dec
Texas wind vs California solar capacity factors by month%, 2019 capacity factor
Source: EIA. 2019.
Texas wind
California solar

39
“What about…” Answers to client energy questions
What about low energy nuclear reactions which are supposed to produce energy at room temperature?
Currently, LENR does not meet our commercialization test. I will write about it when/if a commercial application gives off substantial levels of heat without radiation. There’s still plenty of skepticism: in May 2019, researchers from British Columbia, MIT, Maryland, Lawrence Berkeley National Laboratory and Google revisited LENR and failed to find evidence of fusion or heat.
What about that Saudi green hydrogen plant under construction?
Saudi Arabia is building a hydrogen plant powered by 4 GW of wind and solar to produce 650 tonnes of green hydrogen daily in 2025. Most hydrogen is used today in oil and gas refining to remove sulfur or to produce ammonia, 80% of which is used as fertilizer. The Saudi plant’s green hydrogen output will be just 0.3% of global “brown” hydrogen generated via steam reformation of natural gas. Some people envision hydrogen used in stationary fuel cells for backup electricity generation. So, now let’s look at it this way: assuming 60% round trip fuel cell efficiency, the Saudi facility’s output could instead be used to generate 4.74 TWh per year. That would represent just 1.3% of Saudi electricity consumption and 0.018% of global electricity consumption.
What about sustainable aviation fuels and renewable natural gas?
Sustainable aviation fuels (SAF) are made from used cooking oils, solid waste and food waste. They’re expensive to produce given the aggregation and distillation required, and currently cost 2x regular jet fuel. In 2019, less than 200,000 metric tons of SAF were produced globally, equal to less than 0.1% of commercial airlines jet fuel consumption. Even if all announced SAF projects were completed, volumes would reach just ~1% of expected global jet fuel demand in 203037. So, nothing to get too excited about yet.
Same goes for renewable natural gas (RNG). US RNG volumes are 200-300 mm gallons per year. According to Platts, potential from US landfills is 2.9 billion gasoline gallon equivalents (GGE) per year, while NREL estimates potential at 4.8 billion GGE per year from landfills, agricultural waste, wastewater and other organic waste. In 2019, 142 billion gallons of gasoline were consumed in the US. So, even if RNG from all landfills and other sites were channeled into central processing facilities, RNG could offset ~2.5% of annual US gasoline demand. Similar percentages apply to renewable diesel made from animal fats, waste and used cooking oils on a global scale. Germany has been converting waste to energy as well using biogas from crops, waste and landfills to generate electricity. This is not cheap, nearly 20 cents/kWh compared to 9 cents/kWh for onshore German wind.
Renewable energy solutions that contribute 1%-3% of a given fuel supply after a decade or more of investment at high cost entail carbon reductions that could much more readily be achieved by retiring old, less energy-efficient equipment, pricing kilometers flown or driven closer to their true all-in cost, investing in lighter vehicle materials and most of all, putting curb weight limits on sport utility vehicles as their adoption spreads globally.
What about electrifying the world’s container ships?
The first one was scheduled to begin operating in 2020 but was delayed by COVID. Its specifications: capable of carrying 120 twenty foot equivalent units (TEUs) at a speed of 6 knots for 30 nautical miles. Compare that to Maersk’s Triple-E class ships which carry 150x as much cargo over distances 400x greater at speeds 3x-4x faster. What would it take to make an electric version of Maersk’s ship, matching its speed and performance? Even when incorporating the higher efficiency of electric motors, using today’s state of the art electric batteries with 300 Wh/kg of energy density, the electric version of the Maersk ship would have to dedicate 40% of its cargo capacity to the batteries themselves (obviously an economic non-starter)38. Or to put it another way: an electric ship whose batteries and motors weighed no more than the fuel and diesel engine in today’s container ships would need battery energy densities to improve by 10x vs current levels. Final bit of context: in the past 70 years, energy densities of the best commercial batteries haven’t even quadrupled.
37 “Sustainable Aviation Fuels as a Pathway to Net-Zero Aviation”, Kevin Soubly et al, McKinsey/WEF, 2020. 38 Smil, V. 2019. “Electric container ships are a hard sail”. IEEE Spectrum March 2019:22.

40
What about MSCI’s carbon accounting idea for portfolio investors: a ratio of emissions to sales?
MSCI’s carbon accounting approach for portfolio investors uses an intensity measure based on the ratio of a company’s emissions to sales39. I understand what its creators are trying to do: if a company grows revenues while keeping its carbon footprint the same, this may indicate that the company has figured out how to improve its energy efficiency. Sorry, but I still have a lot of questions.
Two pharmaceutical companies have the same emissions footprint, except Company A is in the US and charges a lot more for the same exact drugs that Company B sells in Germany, whose gov’t negotiates drug prices as part of its single payer system. If I sell Company B stock and buy Company A stock, my portfolio carbon accounting will improve for no climate-related reason at all, right?
I manage a fund that invests in companies that produce cement, steel, glass, rubber and plastic; in other words, the materials that make modern energy-efficient megacities possible. Company A is an industrial company in France, while Company B makes the same products and is located in Italy. I sell my Company B stock and buy Company A stock. My portfolio carbon accounting improves since France’s grid is more reliant on nuclear power while Italy is more reliant on fossil fuels. Should Company B be “penalized” by capital allocators due to something completely outside the company’s control?
I’m a small cap manager with a 3% tracking error budget vs the Russell 2000, while Firm B’s budget is 7%. This allowed Firm B to run a larger underweight to energy than I did from 2019 to 2020. Is Barron’s going to write an article on small cap managers saying that I don’t pay enough attention to climate issues like Firm B does, even though the results are the by-product of temporary sector preferences?
A recession hits and the revenues of the companies in my portfolio drop by 20% while their emissions drop by 5%. Are my stakeholders going to ask me if I have lost my focus on climate issues?
There’s a lot of good that can come from more accurate accounting of emissions. In our asset management business, we use quantitative and qualitative signals to inform our climate judgments of companies. Many simplified accounting formulas don’t separate climate issues that companies control vs ones they don’t, and may convey signals to investors that are not in line with sustainable decarbonization goals.
39 The formula is based on the ratio of Scope 1 emissions plus Scope 2 emissions, divided by the company’s sales. Scope 1 refers to direct emissions, for example resulting from on-site fossil fuel combustion. Scope 2 refers to indirect emissions, for example resulting from purchase of electricity from a utility. See “Carbon footprinting methodology for underwriting portfolios”, CRO Forum (Netherlands), April 2020; and “MSCI Carbon Footprint Index Ratios Methodology”, MSCI, January 2018.

41
IMPORTANT INFORMATION The views, opinions and estimates expressed herein constitute Michael Cembalest’s judgment based on current market conditions and are subject to change without notice. Information herein may differ from those expressed by other areas of J.P. Morgan. This information in no way constitutes J.P. Morgan Research and should not be treated as such. The views contained herein are not to be taken as advice or a recommendation to buy or sell any investment in any jurisdiction, nor is it a commitment from J.P. Morgan or any of its subsidiaries to participate in any of the transactions mentioned herein. Any forecasts, figures, opinions or investment techniques and strategies set out are for information purposes only, based on certain assumptions and current market conditions and are subject to change without prior notice. All information presented herein is considered to be accurate at the time of production. This material does not contain sufficient information to support an investment decision and it should not be relied upon by you in evaluating the merits of investing in any securities or products. In addition, users should make an independent assessment of the legal, regulatory, tax, credit and accounting implications and determine, together with their own professional advisers, if any investment mentioned herein is believed to be suitable to their personal goals. Investors should ensure that they obtain all available relevant information before making any investment. It should be noted that investment involves risks, the value of investments and the income from them may fluctuate in accordance with market conditions and taxation agreements and investors may not get back the full amount invested. Both past performance and yields are not reliable indicators of current and future results. Non-affiliated entities mentioned are for informational purposes only and should not be construed as an endorsement or sponsorship of J.P. Morgan Chase & Co. or its affiliates.
For J.P. Morgan Asset Management Clients: J.P. Morgan Asset Management is the brand for the asset management business of JPMorgan Chase & Co. and its affiliates worldwide. To the extent permitted by applicable law, we may record telephone calls and monitor electronic communications to comply with our legal and regulatory obligations and internal policies. Personal data will be collected, stored and processed by J.P. Morgan Asset Management in accordance with our privacy policies at https://am.jpmorgan.com/global/privacy. ACCESSIBILITY For U.S. only: If you are a person with a disability and need additional support in viewing the material, please call us at 1-800-343-1113 for assistance. This communication is issued by the following entities: In the United States, by J.P. Morgan Investment Management Inc. or J.P. Morgan Alternative Asset Management, Inc., both regulated by the Securities and Exchange Commission; in Latin America, for intended recipients’ use only, by local J.P. Morgan entities, as the case may be.; in Canada, for institutional clients’ use only, by JPMorgan Asset Management (Canada) Inc., which is a registered Portfolio Manager and Exempt Market Dealer in all Canadian provinces and territories except the Yukon and is also registered as an Investment Fund Manager in British Columbia, Ontario, Quebec and Newfoundland and Labrador. In the United Kingdom, by JPMorgan Asset Management (UK) Limited, which is authorized and regulated by the Financial Conduct Authority; in other European jurisdictions, by JPMorgan Asset Management (Europe) S.à r.l. In Asia Pacific (“APAC”), by the following issuing entities and in the respective jurisdictions in which they are primarily regulated: JPMorgan Asset Management (Asia Pacific) Limited, or JPMorgan Funds (Asia) Limited, or JPMorgan Asset Management Real Assets (Asia) Limited, each of which is regulated by the Securities and Futures Commission of Hong Kong; JPMorgan Asset Management (Singapore) Limited (Co. Reg. No. 197601586K), which this advertisement or publication has not been reviewed by the Monetary Authority of Singapore; JPMorgan Asset Management (Taiwan) Limited; JPMorgan Asset Management (Japan) Limited, which is a member of the Investment Trusts Association, Japan, the Japan Investment Advisers Association, Type II Financial Instruments Firms Association and the Japan Securities Dealers Association and is regulated by the Financial Services Agency (registration number “Kanto Local Finance Bureau (Financial Instruments Firm) No. 330”); in Australia, to wholesale clients only as defined in section 761A and 761G of the Corporations Act 2001 (Commonwealth), by JPMorgan Asset Management (Australia) Limited (ABN 55143832080) (AFSL 376919). For all other markets in APAC, to intended recipients only.
For J.P. Morgan Private Bank Clients: ACCESSIBILITY J.P. Morgan is committed to making our products and services accessible to meet the financial services needs of all our clients. Please direct any accessibility issues to the Private Bank Client Service Center at 1-866-265-1727. LEGAL ENTITY, BRAND & REGULATORY INFORMATION In the United States, bank deposit accounts and related services, such as checking, savings and bank lending, are offered by JPMorgan Chase Bank, N.A. Member FDIC. JPMorgan Chase Bank, N.A. and its affiliates (collectively “JPMCB”) offer investment products, which may include bank-managed investment accounts and custody, as part of its trust and fiduciary services. Other investment products and services, such as brokerage and advisory accounts, are offered through J.P. Morgan Securities LLC (“JPMS”), a member of FINRA and SIPC. Annuities are made available through Chase Insurance Agency, Inc. (CIA), a licensed insurance agency, doing business as Chase Insurance Agency Services, Inc. in Florida. JPMCB, JPMS and CIA are affiliated companies under the common control of JPMorgan Chase & Co. Products not available in all states. In Luxembourg, this material is issued by J.P. Morgan Bank Luxembourg S.A. (JPMBL), with registered office at European Bank and Business Centre, 6 route de Treves, L-2633, Senningerberg, Luxembourg. R.C.S Luxembourg B10.958. Authorised and regulated by Commission de Surveillance du Secteur Financier (CSSF) and jointly supervised by the European Central Bank (ECB) and the CSSF. J.P. Morgan Bank Luxembourg S.A. is authorized as a credit institution in accordance with the Law of 5th April 1993. In the United Kingdom, this material is issued by J.P. Morgan Bank Luxembourg S.A– London Branch. Prior to Brexit,(Brexit meaning that the UK leaves the European Union under Article 50 of the Treaty on European Union, or, if later, loses its ability to passport financial services between the UK and the remainder of the EEA), J.P. Morgan Bank Luxembourg S.A– London Branch is subject to limited regulation by the Financial Conduct Authority and the Prudential Regulation Authority. Details about the extent of our regulation by the Financial Conduct Authority and the Prudential Regulation Authority are available from us on request. In the event of Brexit, in the UK, J.P. Morgan Bank Luxembourg S.A.– London Branch is authorised by the Prudential Regulation Authority, subject to regulation by the Financial Conduct Authority and limited regulation by the Prudential Regulation Authority. Details about the extent of our regulation by the Prudential Regulation Authority are available from us on request. In Spain, this material is distributed by J.P. Morgan Bank Luxembourg S.A., Sucursal en España, with registered office at Paseo de la Castellana, 31, 28046 Madrid, Spain. J.P. Morgan Bank Luxembourg S.A., Sucursal en España is registered under number 1516 within the administrative registry of the Bank of Spain and supervised by the Spanish Securities Market Commission (CNMV). In Germany, this material is distributed by J.P. Morgan Bank Luxembourg S.A., Frankfurt Branch, registered office at Taunustor 1 (TaunusTurm), 60310 Frankfurt, Germany, jointly supervised by the Commission de Surveillance du Secteur Financier (CSSF) and the European Central Bank (ECB), and in certain areas also supervised by the Bundesanstalt für Finanzdienstleistungsaufsicht (BaFin). In Italy, this material is distributed by J.P. Morgan Bank Luxembourg S.A– Milan Branch, registered office at Via Catena Adalberto 4, Milan 20121, Italy and regulated by Bank of Italy and the Commissione Nazionale per le Società e la Borsa (CONSOB). In the Netherlands, this material is distributed by J.P. Morgan Bank Luxembourg S.A., Amsterdam Branch, with registered office at World Trade

42
Centre, Tower B, Strawinskylaan 1135, 1077 XX, Amsterdam, The Netherlands. J.P. Morgan Bank Luxembourg S.A., Amsterdam Branch is authorised and regulated by the Commission de Surveillance du Secteur Financier (CSSF) and jointly supervised by the European Central Bank (ECB) and the CSSF in Luxembourg; J.P. Morgan Bank Luxembourg S.A., Amsterdam Branch is also authorised and supervised by De Nederlandsche Bank (DNB) and the Autoriteit Financiële Markten (AFM) in the Netherlands. Registered with the Kamer van Koophandel as a branch of J.P. Morgan Bank Luxembourg S.A. under registration number 71651845. In Denmark, this material is distributed by J.P. Morgan Bank Luxembourg, Copenhagen Br, filial af J.P. Morgan Bank Luxembourg S.A. with registered office at Kalvebod Brygge 39-41, 1560 København V, Denmark. J.P. Morgan Bank Luxembourg, Copenhagen Br, filial af J.P. Morgan Bank Luxembourg S.A.is authorised and regulated by Commission de Surveillance du Secteur Financier (CSSF) and jointly supervised by the European Central Bank (ECB) and the CSSF. J.P. Morgan Bank Luxembourg, Copenhagen Br, filial af J.P. Morgan Bank Luxembourg S.A. is also subject to the supervision of Finanstilsynet (Danish FSA) and registered with Finanstilsynet as a branch of J.P. Morgan Bank Luxembourg S.A. under code 29009. In Sweden, this material is distributed by J.P. Morgan Bank Luxembourg S.A. - Stockholm Bankfilial, with registered office at Hamngatan 15, Stockholm, 11147, Sweden. J.P. Morgan Bank Luxembourg S.A. - Stockholm Bankfilial is authorised and regulated by Commission de Surveillance du Secteur Financier (CSSF) and jointly supervised by the European Central Bank (ECB) and the CSSF. J.P. Morgan Bank Luxembourg S.A., Stockholm Branch is also subject to the supervision of Finansinspektionen (Swedish FSA). Registered with Finansinspektionen as a branch of J.P. Morgan Bank Luxembourg S.A.. In France, this material is distributed by JPMorgan Chase Bank, N.A. (“JPMCB”), Paris branch, which is regulated by the French banking authorities Autorité de Contrôle Prudentiel et de Résolution and Autorité des Marchés Financiers. In Switzerland, this material is distributed by J.P. Morgan (Suisse) SA, which is regulated in Switzerland by the Swiss Financial Market Supervisory Authority (FINMA). In Hong Kong, this material is distributed by JPMCB, Hong Kong branch. JPMCB, Hong Kong branch is regulated by the Hong Kong Monetary Authority and the Securities and Futures Commission of Hong Kong. In Hong Kong, we will cease to use your personal data for our marketing purposes without charge if you so request. In Singapore, this material is distributed by JPMCB, Singapore branch. JPMCB, Singapore branch is regulated by the Monetary Authority of Singapore. Dealing and advisory services and discretionary investment management services are provided to you by JPMCB, Hong Kong/Singapore branch (as notified to you). Banking and custody services are provided to you by JPMCB Singapore Branch. The contents of this document have not been reviewed by any regulatory authority in Hong Kong, Singapore or any other jurisdictions. This advertisement has not been reviewed by the Monetary Authority of Singapore. JPMorgan Chase Bank, N.A., a national banking association chartered under the laws of the United States, and as a body corporate, its shareholder’s liability is limited. JPMorgan Chase Bank, N.A. (JPMCBNA) (ABN 43 074 112 011/AFS Licence No: 238367) is regulated by the Australian Securities and Investment Commission and the Australian Prudential Regulation Authority. Material provided by JPMCBNA in Australia is to “wholesale clients” only. For the purposes of this paragraph the term “wholesale client” has the meaning given in section 761G of the Corporations Act 2001 (Cth). Please inform us if you are not a Wholesale Client now or if you cease to be a Wholesale Client at any time in the future. JPMS is a registered foreign company (overseas) (ARBN 109293610) incorporated in Delaware, U.S.A. Under Australian financial services licensing requirements, carrying on a financial services business in Australia requires a financial service provider, such as J.P. Morgan Securities LLC (JPMS), to hold an Australian Financial Services Licence (AFSL), unless an exemption applies. JPMS is exempt from the requirement to hold an AFSL under the Corporations Act 2001 (Cth) (Act) in respect of financial services it provides to you, and is regulated by the SEC, FINRA and CFTC under US laws, which differ from Australian laws. Material provided by JPMS in Australia is to “wholesale clients” only. The information provided in this material is not intended to be, and must not be, distributed or passed on, directly or indirectly, to any other class of persons in Australia. For the purposes of this paragraph the term “wholesale client” has the meaning given in section 761G of the Act. Please inform us immediately if you are not a Wholesale Client now or if you cease to be a Wholesale Client at any time in the future. This material has not been prepared specifically for Australian investors. It: may contain references to dollar amounts which are not Australian dollars; may contain financial information which is not prepared in accordance with Australian law or practices; may not address risks associated with investment in foreign currency denominated investments; and does not address Australian tax issues. With respect to countries in Latin America, the distribution of this material may be restricted in certain jurisdictions. We may offer and/or sell to you securities or other financial instruments which may not be registered under, and are not the subject of a public offering under, the securities or other financial regulatory laws of your home country. Such securities or instruments are offered and/or sold to you on a private basis only. Any communication by us to you regarding such securities or instruments, including without limitation the delivery of a prospectus, term sheet or other offering document, is not intended by us as an offer to sell or a solicitation of an offer to buy any securities or instruments in any jurisdiction in which such an offer or a solicitation is unlawful. Furthermore, such securities or instruments may be subject to certain regulatory and/or contractual restrictions on subsequent transfer by you, and you are solely responsible for ascertaining and complying with such restrictions. To the extent this content makes reference to a fund, the Fund may not be publicly offered in any Latin American country, without previous registration of such fund´s securities in compliance with the laws of the corresponding jurisdiction. Public offering of any security, including the shares of the Fund, without previous registration at Brazilian Securities and Exchange Commission–CVM is completely prohibited. Some products or services contained in the materials might not be currently provided by the Brazilian and Mexican platforms. References to “J.P. Morgan” are to JPM, its subsidiaries and affiliates worldwide. “J.P. Morgan Private Bank” is the brand name for the private banking business conducted by JPM. This material is intended for your personal use and should not be circulated to or used by any other person, or duplicated for non-personal use, without our permission. If you have any questions or no longer wish to receive these communications, please contact your J.P. Morgan representative. © 2021 JPMorgan Chase & Co. All rights reserved.