2020 semi-annual report - golden opportunities
TRANSCRIPT

2020 Semi-annual Report
1 Message to Shareholders
5 Interim Management Report of Fund Performance
23 Financial Statements
40 Notes to the Condensed Interim Financial Statements
53 Board of Directors and Corporate Information
TABLE OF CONTENTS
2020 Brings Unprecedented Times This is Golden Opportunities Fund’s February 29, 2020 Semi-annual
Report; however, what we are experiencing today, only weeks following,
is a completely different time in our lives. Golden Opportunities made
the choice to not take the filing extension offered by securities regulators
across Canada and instead file the Fund’s Semi-annual Report in a
timely manner. At this time, we feel it is more important than ever to
communicate to our shareholders and that we would be remiss if we
didn’t begin by addressing the unprecedented times we live in today as
communities continue to band together across the world to help flatten
the curve for the Coronavirus (COVID-19). As changes are happening
very rapidly, we caution that from the time of writing this report, to
the actual release date, the events around COVID-19, the impact to our
global and local economy, as well as Government intervention may have
changed once again.
At this early state, we are unable to forecast how each Golden
Opportunities portfolio company will perform once we get through this
current economic situation, which we will. We can advise though of the
proactive steps taken in the short-term and on what gives us comfort in
the long-term with respect to the Fund’s portfolio.
The 2020 economy has been faced with challenges of historic proportion
from the worldwide impact of COVID-19, to the drop in oil prices due to
the Saudi Arabia and Russia dispute, as well as the rail blockades.
The impact of COVID-19, a Black Swan event, has been felt by all
economies and businesses, has impacted our daily lives and could put
our economy into a recession. Golden Opportunities’ Fund Manager,
Westcap Mgt. Ltd., is working diligently with your portfolio companies to
ensure the health and safety of their employees while focusing on critical
business issues for stability in the long-term. The full economic impact of
COVID-19 is not yet known; however, you can rest assured as we continue
to be fully engaged to minimize any potential negative impact.
The Fund Manager’s initial focus when addressing the situation was on the
health, safety and well-being of the Westcap team members, both mentally
and physically, by transitioning them out of the office to work remotely. This
transition happened quickly and efficiently which enabled the deployment
of the Westcap portfolio teams to assist in the execution of pandemic
and continuity plans for our portfolio companies. Liquidity management
strategies were implemented including the reduction of non-essential
expenses and staffing levels, as well as third-party engagement with
portfolio lenders, suppliers, etc., was prioritized while we worked alongside
the leadership teams in which we have invested. In the next stage, we will
go on the offense and focus on working with our portfolio companies
to access available government support/stimulus programs. Hands-on
involvement, strong communication and sharing knowledge of best
practices across companies in these times is essential.
There are several forecasts of when this crisis may turn and what must
happen for Canada to get through, but the reality is that no one knows
for certain. We are in uncharted territory. We do know that sweeping
measures are being taken by the Federal and Provincial Governments
to flatten the curve. This represents the tipping point for communities
and businesses to resume operations in a gradual manner as can be
seen from Wuhan, China, which is now starting to return to some level of
normality. At this early stage, we are not able to advise of the operational
impact to each portfolio company; however, we can identify key factors
that will play an integral role going forward.
Strong Liquidity For the last several reporting periods, Golden Opportunities has
confirmed its strong liquidity position due to a number of successful exits.
Today, this strong liquidity remains an important asset due to strategic
liquidity management decisions that have been made over the past
year. In addition, Golden Opportunities achieved another successful
sell-out of the Fund’s units available for tax credits this RRSP season which
occurred during the semi-annual reporting period. At this semi-annual
reporting period end, Golden Opportunities’ cash and liquid securities are
equal to 39% of the Fund’s total venture portfolio which can be used to
assist investee companies through this unprecedented time should it be
required or appropriate.
Government Stimulus and Support ProgramsFederal, Provincial and Municipal Governments all recognize that
support and stimulus programs must be deployed to help Canadian and
Saskatchewan businesses through this unprecedented time. How these
programs will look and the impact that they will have on our portfolio
companies can only be positive, yet it is too early to quantify the degree
or extent.
Essential Services Under the state of emergency declared by many provinces, including
Saskatchewan, a list of essential service businesses that can remain open
and functioning is an important benchmark, notwithstanding the impact
that the pandemic situation and the oil price war will have on them. The
continuity plans being executed for the Fund’s portfolio companies based
on whether they are an essential service and can remain operational
thereby mitigating some of the short-term business interruption. In
addition, there are Golden Opportunities portfolio companies that have
not seen revenue disruption at this time due to the sector that they
operate in, with the caveat that COVID-19 can change circumstances at
any time. We are pleased to report that the overwhelming majority of
the companies in the Fund’s portfolio are confirmed an essential service
within current guidelines of the applicable provinces.
MESSAGE TO SHAREHOLDERSTo our valued shareholders:
1
Golden Opportunities Fund Inc. | 2020 Semi-annual Report
Fund Design in Venture Capital: Invest, Hold and Execute The philosophy, design and investment thesis of Retail Venture
Capital (RVC) Funds such as Golden Opportunities is long-term in
nature in order to provide patient capital to local growth companies.
The eight-year holding period for RVC Funds, mandated by
government acts and regulations, provides our portfolio companies
with time to execute on their strategies through various cycles. Most
of our investments are not publicly traded entities, yet for those that
are public their current trading prices are reflected in the weekly
pricing policy of the Fund. COVID-19 is unprecedented and far
reaching; however, the asset class, although still impacted, is designed
for long-term holds through various cycles and events.
Top Ten HoldingsThe Fund’s top ten holdings represent $153.4 million or 70% of the total
invested venture portfolio. The impact to operational revenues and
earnings by the pandemic is too early to quantify and will vary for each
company based on factors such as sector, time period of disruption and
government stimulus packages that may provide support. We trust that
the following reporting of the portfolio diversification and brief overview
of the Fund’s top ten holdings will provide some comfort and perspective
of the Fund’s portfolio as we continue to work closely with each company
through this.
1. Warman Home Centre LP (Class A-share)
Classified as an essential service, with five separate operating divisions,
the well-known brand of Warman Home Centre services builders, the
farm industry, commercial and private individuals in the home renovation
and construction market. The overall size and diversity of the company’s
product offerings enable it to continue to perform in periods of high
and low construction cycles. The company has a very low debt to fair
market value and is encouraged by the Saskatchewan Government’s
announcement of a provincial sales tax rebate on all new home
construction commencing April 1, 2020 for a three-year period to help
stimulate the housing sector in the days ahead after several years of
lower housing starts.
2. Golden Health Care Inc. (Class A-share)
Classified as an essential service, Golden Health Care Inc. is one of the
largest private sector, Saskatchewan-based long-term care providers.
Caring for our elderly in all times, the good, the difficult or during a
pandemic, is a vital service. Through the company’s aging-in-place
model, its six separate locations provide levels 1 to 4 care and are
currently maintaining their occupancy and focusing on the highest
safety measures for their staff and residents. The Fund does not see
the demand for long-term care for seniors changing as our lives and
businesses return to normal.
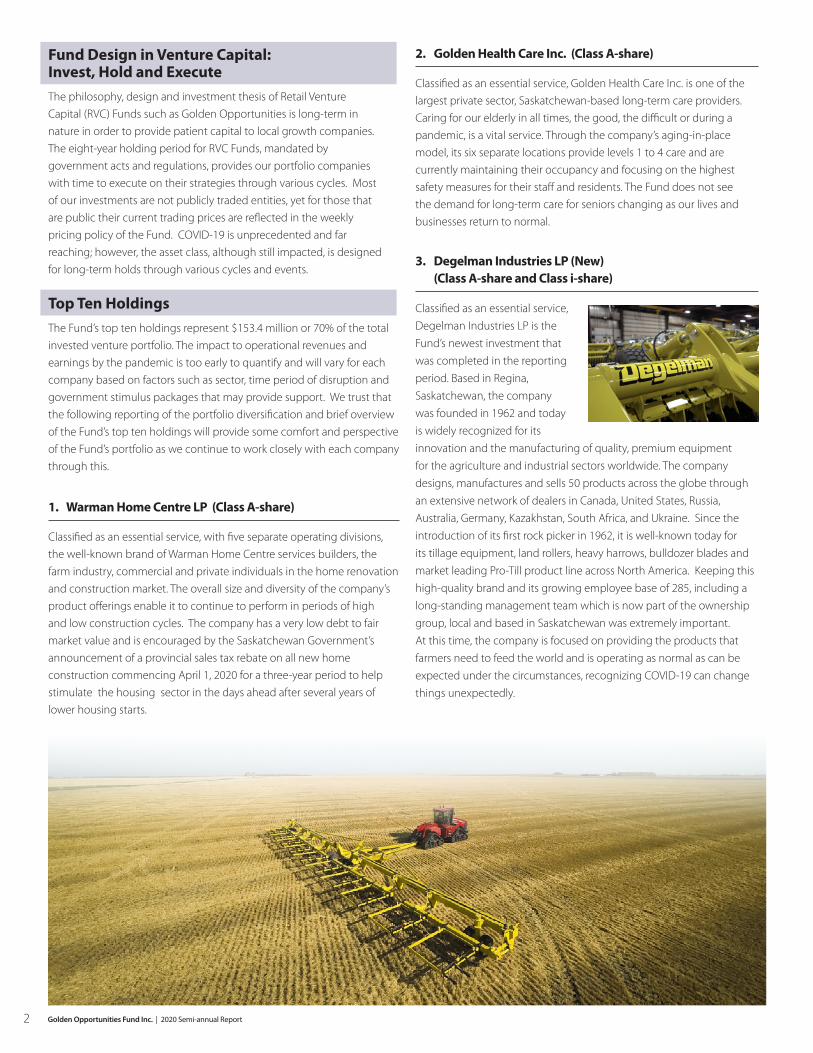
3. Degelman Industries LP (New) (Class A-share and Class i-share)
Classified as an essential service,
Degelman Industries LP is the
Fund’s newest investment that
was completed in the reporting
period. Based in Regina,
Saskatchewan, the company
was founded in 1962 and today
is widely recognized for its
innovation and the manufacturing of quality, premium equipment
for the agriculture and industrial sectors worldwide. The company
designs, manufactures and sells 50 products across the globe through
an extensive network of dealers in Canada, United States, Russia,
Australia, Germany, Kazakhstan, South Africa, and Ukraine. Since the
introduction of its first rock picker in 1962, it is well-known today for
its tillage equipment, land rollers, heavy harrows, bulldozer blades and
market leading Pro-Till product line across North America. Keeping this
high-quality brand and its growing employee base of 285, including a
long-standing management team which is now part of the ownership
group, local and based in Saskatchewan was extremely important.
At this time, the company is focused on providing the products that
farmers need to feed the world and is operating as normal as can be
expected under the circumstances, recognizing COVID-19 can change
things unexpectedly.
2 Golden Opportunities Fund Inc. | 2020 Semi-annual Report
4. Dyna Holdings LP (Class A-share and Class i-share)
Classified as an essential service, Dyna Holdings LP (Dyna) has four
diversified divisions involved in industrial fabrication and manufacturing,
filtration services, engineering of customized bearings and crane services.
All divisions are important to the supply chain and, as the impact of
COVID-19 and historically low oil prices varies for each company, it is too
early to assess the full year of results at this time. The effort in the past
few years diversifying its offerings to steel and pipe mills, medical, military
aerospace, and forestry industries will be important. The strong capital
structure of each of the companies in the Dyna Group, management
ownership and stimulus programs will help support and position the four
divisions through this near-term disruption and into the long-term.
5. G-Mac’s AgTeam Limited Partnership (Class A-share)
Classified as an essential service, G-Mac’s AgTeam Limited Partnership
(G-Mac’s AgTeam) is one of North America’s largest independently owned
crop input retailers. In this reporting period, the company completed
the acquisition of Cavalier Agrow Ltd., expanding its rural retail locations
from 10 to 14 and employees to 130, providing important supplies to
our farming community with leading edge service, emerging science
and proven technology. Operating in a commodity-driven industry, the
company is expected to see earnings fluctuate, but at this time business
is operating as normal as can be expected, recognizing the impact that
COVID-19 can potentially bring. Our Saskatchewan farmers will continue
to rely on G-Mac’s AgTeam’s product mix of fertilizers (dry and liquid),
crop protection herbicides and pesticides, seed care and agronomy to
maximize profitability while working to feed the world’s population.
6. H.J.R. Asphalt LP (Class A-share)
Classified as an essential service, H.J.R. Asphalt LP is one of Saskatchewan’s
largest highway infrastructure companies which hauls, grades and
compacts road bases, mills and resurfaces existing roads and paves
new asphalt concrete. The company is commencing the upcoming
paving season with no leverage other than standard operating line and
equipment leases, as well as several key projects, including Highway #5
widening project and the Candle Lake access road project.
7. Avalon Oil & Gas Ltd. (Class A-share and Class R-share)
Avalon Oil & Gas Ltd. (Avalon) has a land base of over 45,000 acres with a
range of conventional and thermal heavy oil assets in the Lloydminster
region. Avalon has plans to develop a Steam Assisted Gravity Drainage
(SAGD) facility north of Lloydminster which would produce 5,500
barrels per day. The project has received regulatory approval from the
Government of Saskatchewan and demonstrates high quality reservoir,
superior oil quality, convenient water planning and superior economics
similar to several of its peers in the region. The development of the
project is currently on hold due to unsustainable commodity pricing
for the North American energy sector. Important factors in quantifying
the long-term outlook of the company and its SAGD project will be
the Federal and/or Provincial Government’s future support programs
anticipated for the oil and gas sector, and any potential resolution
between Russia and Saudi Arabia on oil production cutbacks to achieve
an overall rebalancing of supply and demand for oil that is sustainable for
global markets.
8. Maxie’s Excavating LP (New) (Class A-share)
Classified as an essential service,
and new transaction completed by
the Fund in the reporting period,
Maxie’s Excavating LP (Maxie’s)
is a long-standing infrastructure
earthworks company. Its broad
services include commercial,
industrial and heavy civil earthwork
construction, demolition and land development, aggregate processing and
supply, rail services, emergency responses to environmental spills and snow
removal. Maxie’s’ services and focus across multiple industries, including
agriculture, potash, infrastructure, railways, cannabis, asphalt and oil and
gas, positions it well for operating results in all cycles of our Saskatchewan
economy.
Maxie’s has a fleet of iron that includes over 350 pieces of owned
equipment ranging from fleet vehicles to excavators, compactors, loaders
and rock trucks and a team of more than 60 long-standing employees
who will commence its bidding and contracting season in the months
ahead unleveraged other than normal operating line and equipment
leases as debt on the balance sheet.
9. Can Pro Ingredients Ltd. (Class A-share)
Classified as an essential service, Can Pro Ingredients Ltd. (Can Pro) is in
the agriculture business of growing alfalfa for the purpose of processing
it into dehydrated and sun-cured alfalfa pellets for the global animal feed
market. The alfalfa pellets are sold directly to multi-national animal feed
customers and marketed through international brokerage businesses
with a large customer base for Can Pro Ingredients’ alfalfa pellets being
exported to Japan. At this time, the company does not anticipate work
interruptions with the caveat that COVID-19 can change things.
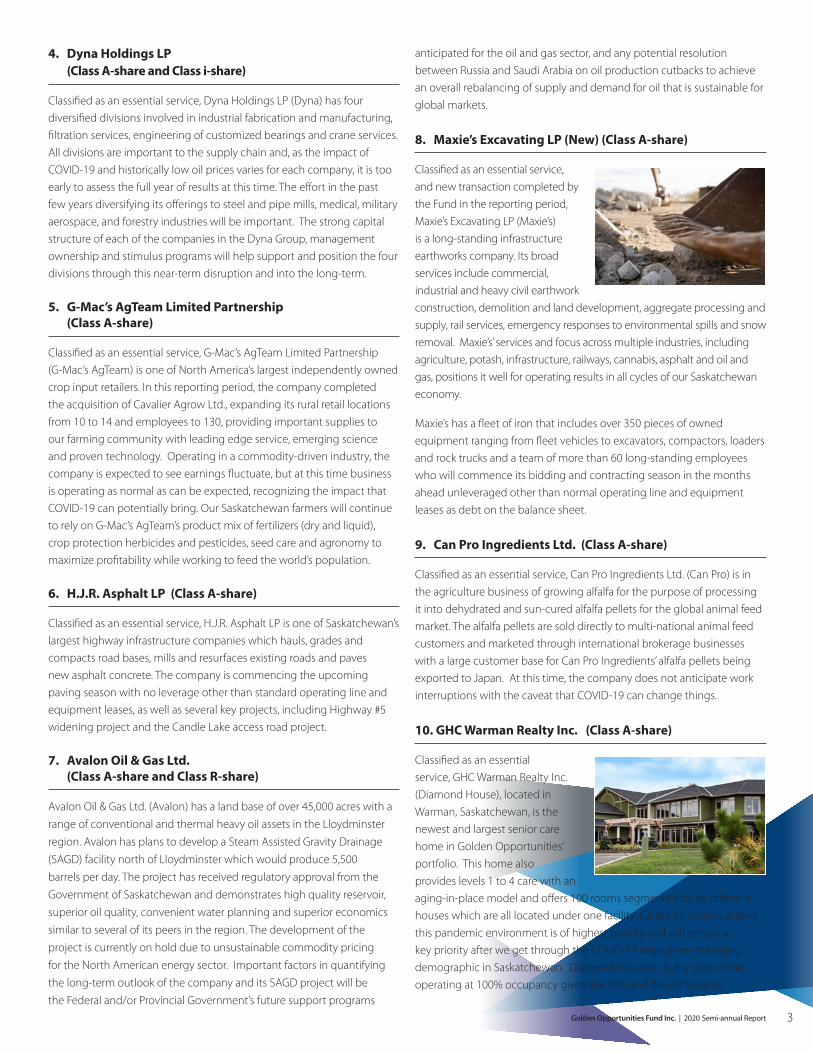
10. GHC Warman Realty Inc. (Class A-share)
Classified as an essential
service, GHC Warman Realty Inc.
(Diamond House), located in
Warman, Saskatchewan, is the
newest and largest senior care
home in Golden Opportunities’
portfolio. This home also
provides levels 1 to 4 care with an
aging-in-place model and offers 100 rooms segmented by six different
houses which are all located under one facility. Caring for seniors during
this pandemic environment is of highest priority and will remain a
key priority after we get through the COVID-19 crisis given our aging
demographic in Saskatchewan. Diamond House is, at any given time,
operating at 100% occupancy given the ebb and flow of tenants.
3
Golden Opportunities Fund Inc. | 2020 Semi-annual Report
Innovation Class i-share
The Fund’s top ten holdings are diversified across essential service
businesses, and represented in the Diversified Class A-share, the
Innovation Class i-share and the Resource Class R-share, as applicable.
To complement the overview of holdings, three additional top holdings
in the Innovation Class i-share portfolio that are not identified in
the top ten described include: Paradigm Consulting Group Limited
Partnership (Information Technology sector), Retail Innovation Labs Inc.
(Software sector) and Med-Life Discoveries LP (Life Sciences sector).
These companies continue to develop and deliver their technologies
and services, unabated from remote locations, being part of Canada’s
innovation economy.
The Class i-share also has very strong liquidity, due to recent successful
exits, which can be used to continue to support the companies in this
portfolio so their momentum and the development of their product
offerings and unique processes continues. In addition, the Innovation
Class i-share includes the continued backing of the loan loss agreement
with Western Economic Diversification Canada providing loss support
for investors of this share class.
Resource Class R-share
The Resource Class R-share portfolio was designed and launched in
2013 with a concentrated investment focus on the energy and resource
sector that has been impacted the hardest due to the historically low
oil prices as a result of the price wars between Russia and Saudi Arabia.
This crisis occurred amidst slowing economies from COVID-19, and a
backdrop of years of pipeline challenges to move oil to port, as well as
the recent rail blockades. Portfolio holdings in this share class have and
will continue to be under pressure in the near term while Federal and
Provincial Government stimulus and support programs are identified
and implemented, and more importantly Russia and Saudi Arabia
continue future discussions to achieve an overall rebalancing of supply
and demand for oil.
In 2016, Golden Opportunities made a strategic decision to reduce
the amount of new capital deployed in the oil and gas sector, across
all share classes, unless it was very opportunistic. Saudi Arabia led the
Organization of the Petroleum Exporting Countries (OPEC) out on a
mission to destroy long-term competition and preserve market share.
The move toward alternative energy was fortified with the signing of
the United Nations Agreement in Paris to avoid climate change, and
Former President Obama announced the cancellation of the Keystone
XL pipeline. Since fiscal end 2016, approximately four years ago, Golden
Opportunities’ new capital investments in the sector across all share
classes was $7.6 million in aggregate to support our existing oil and gas
portfolio companies.
Summary
As a nation, province, local business, family and Golden Opportunities
shareholder we all find ourselves living in unprecedented times that
we would have never considered occurring in our lifetime. We will
get through this, by any of these classifications, because of the actions
being taken from all of us to flatten the curve. The Chinese word for
crisis carries two elements, difficulty and opportunity. No matter how
difficult the situation, at the heart of each crisis lies a tremendous
opportunity. The opportunity already surfacing is the humanitarian
effort and kindness shown to those less fortunate and vulnerable, and
this already has made our society better going forward.
The Fund’s recent focus to engage the leading management teams of
your portfolio companies to enact pandemic planning has brought
the best out in them and reconfirmed our confidence in the people
of this province and those leading Golden Opportunities’ portfolio
companies. The diversification of a portfolio of essential service
businesses, backed by the Fund’s strong liquidity and anticipated
Federal and Provincial Government support programs, will help us
navigate through this uncharted environment we now live in.
In the past two decades, your Fund has impacted over 15,000 jobs
in Saskatchewan, according to an independent study completed
by Saskatoon Regional Economic Development Authority (SREDA).
After we defeat COVID-19, the work of Golden Opportunities will be
more important than ever to help rebuild our local economy and to
continue to support and drive the growth of businesses and jobs. We
look forward to doing our part on behalf of our shareholders.
We would like to thank you, our valued shareholders. Together, we
will weather this storm and it will turn to brighter days and new
opportunities in the future.
Safe Harbors,
Brian L. Barber Chair
Grant J. Kook, C.Dir., S.O.M. President & CEO
Lorraine A. Sali Vice Chair
4 Golden Opportunities Fund Inc. | 2020 Semi-annual Report

INTERIM MANAGEMENT REPORT OF FUND PERFORMANCEThis interim management report of fund performance contains financial highlights but does not contain either annual or interim financial statements of Golden Opportunities Fund Inc. (the “Fund” or “Golden”). You can get a copy of interim financial report or annual financial statements at your request, at no cost, by calling 1-866-261-5686, by writing to us at Suite 830, 410 – 22nd Street East Saskatoon, SK, S7K 5T6 or by visiting our website at www goldenopportunities ca or SEDAR at www sedar com. Securityholders may also contact us at one of these methods to request a copy of the Fund’s proxy voting policies and procedures, proxy voting disclosure record, or quarterly portfolio disclosure.
Unless otherwise specified, all references to “net assets” or “net assets per share” in this report are references to net assets attributable to holders of redeemable shares determined in accordance with International Financial Reporting Standards (“IFRS”) as presented in the financial statements of the Fund. All references to “net asset value” or “net asset value per share” in this report are references to net asset value determined for purposes of purchase and redemption of Class A shares, Class A-F shares, Class I shares, Class I-F shares, Class R shares, and Class R-F shares. An explanation of the differences can be found in Note 6 to the financial statements.
For this report, the “Class A Fund” refers to the Class A shares and Class A-F shares, collectively; the “Class I Fund” refers to the Class I shares and the Class I-F shares, collectively; and the “Class R Fund” refers to the Class R shares and the Class R-F shares, collectively. The Class A-F shares, Class I-F shares and Class R-F shares are collectively referred to as the “F Series”.
MANAGEMENT DISCUSSION OF FUND PERFORMANCE
Investment Objective and StrategiesThe general investment objective of the Fund is to make investments in small and medium-sized businesses authorized, or as may be permitted, by The Labour-sponsored Venture Capital Corporations Act (Saskatchewan) (the “Saskatchewan Act”) and The Labour-Sponsored Venture Capital Corporations Act (Manitoba) (the “Manitoba Act”), respectively, with the objective of achieving long-term capital appreciation.
Golden issues two share classes in both Saskatchewan and Manitoba, a diversified share class, the Class A and Class A-F, and an innovation share class, the Class I and Class I-F, and issues a resource share class in Saskatchewan only, the Class R and Class R-F. For the Class A Fund, Golden intends to provide diversification for its shareholders by investing in a wide range of industry sectors in both Saskatchewan and Manitoba. Golden further seeks to diversify its investments according to stage of development and will invest in businesses that are in the start-up, growth, and mature stages of the business development cycle. The Class I Fund invests in companies in the innovation sector of the Saskatchewan and Manitoba economies. These sectors include, but are not limited to, information and communication technology, life sciences, industrial biotechnology, clean technology, value-added agriculture, and advanced manufacturing. The Class R Fund will invest in companies in the energy, mining and/or related resource services sectors of the Saskatchewan economy. For all shares, Golden generally makes investments with the expectation that the holding period will be five to eight years.
Golden’s manager, Westcap Mgt. Ltd. (the “Fund Manager”), performs a fundamental analysis of each investment opportunity including, but not limited to, an analysis of:
• the experience of management personnel,
• the industry and the competitive position of the company within its market,
• the past performance and business plan of the company,
• the financial statements, projections and forecasts of the company,
• the expected return on investment,
• exit strategies,
• and the risks of the company.
The form of Golden’s investments is selected and negotiated after considering the investment objectives and criteria of Golden. Golden has diversified its investment portfolio in all share classes using instruments such as common shares, preferred shares, convertible preferred shares, partnership units, debentures, convertible debentures, term loans, participating loans, warrants, and options. When possible, where Golden makes an investment by way of a debt instrument, Golden will secure its investment by a charge over the business’ assets. This charge may be subordinated to other lenders’ security. Golden takes the security with the goal of limiting the downside risk of the investment.
5
Golden Opportunities Fund Inc. | 2020 Semi-annual Report
RiskThe risks of investing in Golden remain as discussed in Golden’s prospectus dated December 19, 2019. The Fund makes and holds certain investments that are considered speculative and involve a longer investment commitment than that typical for other types of investments made by mutual funds. Many such investments require between five to eight years to mature and generate the returns expected by the Fund. As a result, the shares of Golden are suitable only for investors able to make a long-term investment.
There may be changes introduced to the Income Tax Act (Canada), the Saskatchewan Act, or the Manitoba Act that may be unfavourable to Golden’s ability to attract further investment. In addition, the legislation in Saskatchewan requires labour-sponsored venture capital corporations to invest 18.75% of its annual net capital (being annual capital raised less annual capital required to satisfy redemption obligations) in eligible innovation activities. Eligible innovation activities include: (i) activities carried out by an eligible business whose principal business is directly related to one or more of the following sectors: clean or environmental technology, health and life sciences, crop and animal sciences, industrial biotechnology or information and communication technology; or (ii) activities carried out by an eligible business that involves technical risk, productivity improvement or the application of a technology, process or innovation that is new to Saskatchewan and facilitates growth, supports trade or exports, or enhances Saskatchewan’s competitiveness.
Golden has made the innovation sector a key pillar of its Class A Fund and the Class I Fund is focused exclusively on investment in innovation. Golden has a loss support agreement (the “WD Agreement”) with Western Economic Diversification Canada for qualified investment transactions made in respect of the Class I Fund. While eligible innovation sector investments for the purposes of the WD Agreement and the legislation in Saskatchewan are similar, they are not identical.
Under the Saskatchewan Act, Golden is required to invest and maintain at least 75% of its equity capital raised in Saskatchewan in investments in eligible Saskatchewan companies within two years from the fiscal year end of raising the equity capital. For share capital raised in Saskatchewan, as at February 29, 2020, Golden has met its Saskatchewan investment requirements.
Under the Manitoba Act, Golden is required to invest at least 70% of its equity capital raised in Manitoba in investments in eligible Manitoba companies within two years from the fiscal year end of raising the equity capital, and 14% of the equity capital so invested must be in eligible investments for which the total cost of the eligible investments held by Golden in such entity and any related entities does not exceed $2 million. For share capital raised in Manitoba, as at February 29, 2020, Golden is in compliance with its Manitoba investment requirements.
The business of Golden is to invest its eligible capital in Saskatchewan and Manitoba eligible businesses and in proportion to the jurisdiction where it was raised. There is a risk Golden will not be able to find suitable investments that meet its investment criteria. Valuing venture investments is inevitably based on inherent uncertainties and the resulting values may differ from values that would have been used had a ready market existed for the investments. Please see Note 10 to the financial statements for disclosure about the nature and extent of risks relative to financial instruments and how Golden manages those risks.
Class A FundFor the Class A Fund, the Fund attempts to mitigate the risk of its investment portfolio by investing in a diverse range of industries and investing in companies at different stages of the business cycle. As at February 29, 2020, the Class A Fund’s top four sectors based on cost were manufacturing, health care, oil & gas, and building supplies. For diversification, as at February 29, 2020, the Class A Fund is invested in 11 different industry sectors. Golden continues to hold investments in companies at each stage of the business development cycle. During the time Golden holds an investment, a portfolio company will move through the different stages of the business development cycle. As at February 29, 2020, the Class A Fund’s venture investment portfolio, based on investment cost, was 34.64% mature, 53.02% growth, and 12.34% start-up. The total cost base of the Class A Fund’s venture investment portfolio represents 106.08% of the Class A Fund’s net asset value.
Class I FundThe Class I Fund invests in companies in the innovation segment of the Saskatchewan and Manitoba economies, which may include, but are not limited to, information and communication technology, life sciences, industrial biotechnology, clean technology, value-added agriculture, and advanced manufacturing. As at February 29, 2020, the Class I Fund was invested in 17 entities within five different industry sectors. Within the different stages of the business development cycle, as at February 29, 2020, the Class I Fund’s venture investment portfolio, based on investment cost, was 32.03% mature, 61.96% growth and 6.01% start-up. The total cost base of the Class I Fund venture investments represents 43.87% of the Class I Fund’s net asset value.
For qualified investments made by the Class I Fund, the WD Agreement will provide loss protection support to Class I and Class I-F shareholders. Details of the loss support program are contained in Golden’s prospectus.
Class R FundThe Class R Fund invests in companies in the energy, mining and/or related resource services sectors of the Saskatchewan economy. As at February 29, 2020, the Class R Fund was invested in eight companies within the oil & gas sector. Within the different stages of the business development cycle, as at February 29, 2020, the Class R Fund’s venture investment portfolio, based on investment cost, was 14.32% mature, 50.06% growth and 35.62% start-up. The total cost base of the Class R Fund’s venture investments represents 49.76% of the Class R Fund’s net asset value.
6 Golden Opportunities Fund Inc. | 2020 Semi-annual Report

Results of Operations
Net AssetsClass A Fund
Class A Fund net assets decreased from $279.3 million at August 31, 2019 to $261.6 million at February 29, 2020, a decrease of $17.7 million. The net asset value per Class A share decreased from $16.53 at August 31, 2019 to $15.67 at February 29, 2020, a decrease of 5.20%. The net asset value per Class A-F share decreased $18.76 at August 31, 2019 to $17.76 at February 29, 2020, a decrease of 5.33%.
For the Class A Fund, the decrease in net assets from operations was $14.6 million for the six months ended February 29, 2020. The Class A Fund raised proceeds of $23 million from the issue of Class A and Class A-F shares during the six months ended February 29, 2020 and incurred $26.1 million of redemptions, representing 10.42% of the outstanding share capital. During the six months ended February 29, 2020, the number of Class A shares outstanding decreased from 16,518,133 to 16,174,431, and the number of Class A-F shares outstanding increased from 332,335 to 463,023.
Class A Fund cash and short-term investments decreased from $102 million at August 31, 2019 to $57.4 million at February 29, 2020 largely due to venture investment purchases of $42.1 million and net share capital redemptions of $4.4 million.
Class I Fund
Class I Fund net assets increased from $46.9 million at August 31, 2019 to $48.1 million at February 29, 2020, an increase of $1.2 million. The net asset value per Class I share decreased from $15.04 at August 31, 2019 to $14.30 at February 29, 2020, a decrease of 4.92%. The net asset value per Class I-F share decreased from $17.87 at August 31, 2019 to $16.96 at February 29, 2020, a decrease of 5.09%.
For the Class I Fund, the decrease net assets from operations was $2.3 million for the six months ended February 29, 2020. The Class I Fund raised proceeds of $5.9 million from the issue of Class I and Class I-F shares during the six months ended February 29, 2020 and incurred $2.3 million of redemptions, representing 5.76% of the outstanding share capital. During the six months ended February 29, 2020, the number of Class I shares outstanding increased from 3,073,400 to 3,297,848, and the number of Class I-F shares outstanding increased from 36,964 to 54,115.
Class I Fund cash and short-term investments decreased from $38.1 million at August 31, 2019 to $35.9 million at February 29, 2020, largely due to venture investment purchases of $4.8 million, partially offset by net share capital raised of $3 million.
Class R Fund
Class R Fund net assets decreased from $8.7 million at August 31, 2019 to $8.4 million at February 29, 2020, a decrease of $340 thousand. The net asset value per Class R share decreased from $7.65 at August 31, 2019 to $7.16 at February 29, 2020, a decrease of 6.41%. The net asset value per Class R-F share decreased from $8.83 at August 31, 2019 to $8.37 at February 29, 2020, a decrease of 5.21%.
For the Class R Fund, the decrease in net assets from operations was $570 thousand for the six months ended February 29, 2020. The Class R Fund raised proceeds of $271 thousand from the issue of Class R and Class R-F shares during the six months ended February 29, 2020 and incurred $41 thousand of redemptions, representing 0.37% of the outstanding share capital. During the six months ended February 29, 2020, the number of Class R shares outstanding increased from 1,136,928 to 1,167,086, and the number of Class R-F shares outstanding increased from 920 to 1,491.
Class R Fund cash and short-term investments are $5 million at February 29, 2020, an increase of $6 thousand from August 31, 2019.
Statement of Comprehensive IncomeClass A Fund
Class A Fund income, excluding net realized and unrealized losses, was $4.5 million for the six months ended February 29, 2020 compared to $11.5 million for the six months ended February 28, 2019. Partnership income decreased by $7.0 million from the comparative period due to lower income allocated from operating partnerships.
Class A Fund expenses for the six months ended February 29, 2020, excluding the incentive participation amount (“IPA”) and the change in the contingent IPA, were $6.9 million, which is unchanged from the six months ended February 28, 2019. The average net asset value of the Class A Fund was $269.1 million for the six months ended February 29, 2020, compared to $297 million for the six months ended February 28, 2019.
The Class A Fund had a net increase of $15.5 million in the unrealized depreciation of venture investments for the six months ended February 29, 2020, and had net realized losses of $458 thousand during the period. During the six months ended February 29, 2020, net unrealized losses of $670 thousand were reclassified to realized losses upon the disposition of G5 Energy Partners LP. Net unrealized losses of $19.6 million on investments in public companies, and net unrealized gains of $3.4 million on investments in privately held investees, were recognized in the six months ended February 29, 2020. During the six months ended February 29, 2020, there was a decrease of $3.8 million in the contingent IPA on the Class A Fund, which is not payable until a full exit from the applicable investments is realized and cash is received.
7
Golden Opportunities Fund Inc. | 2020 Semi-annual Report
Class I Fund
Class I Fund income, excluding net realized and unrealized gains, was $572 thousand for the six months ended February 29, 2020 compared to $1.3 million for the six months ended February 28, 2019. Partnership income decreased by $738 thousand from the comparative period due to lower income allocated from operating partnerships.
Class I Fund expenses for the six months ended February 29, 2020, excluding the IPA and the change in contingent IPA, were $1.1 million, an increase of $58 thousand from the six months ended February 28, 2019. The average net asset value of the Class I Fund was $45.9 million for the six months ended February 29, 2020, compared to $43.9 million for the six months ended February 28, 2019.
The Class I Fund had a net increase of $2.3 million in the unrealized depreciation of venture investments for the six months ended February 29, 2020, and had net realized gains of $24 thousand during the period. During the six months ended February 29, 2020, net unrealized losses of $2.9 million were recognized on public company investments and net unrealized gains of $623 were recognized on privately held companies in the Class I Fund portfolio. A decrease of $12 thousand in the amount of the loss support program contributions considered repayable to Western Economic Diversification Canada was recognized in the six months ended February 29, 2020, as per the terms of the WD Agreement. The $12 thousand has been recognized as an increase in unrealized loss recovery during the period. During the six months ended February 29, 2020, there was a decrease of $480 thousand in the contingent IPA on the Class I Fund, which is not payable until a full exit from the applicable investment is realized and cash is received.
Class R Fund
Class R Fund income, excluding net unrealized losses, was $56 thousand for the six months ended February 29, 2020 compared to $44 for the six months ended February 28, 2019. The increase is due to an increase in rates earned on short-term investments from the comparative period.
Class R Fund expenses for the six months ended February 29, 2020 were $236 thousand, which is unchanged from the six months ended February 28, 2019. The average net asset value for the Class R Fund was $8.6 million for the six months ended February 29, 2020, compared to $8.2 million for the six months ended February 28, 2019.
The Class R Fund had a net increase in the unrealized depreciation of venture investments of $390 thousand for the six months ended February 29, 2020. Net unrealized losses of $110 thousand on investments in public companies, and net unrealized losses of $280 thousand on privately held investees, were recognized in the six months ended February 29, 2020. There is no contingent IPA attributable to the Class R Fund at February 29, 2020.
8 Golden Opportunities Fund Inc. | 2020 Semi-annual Report

Investment PortfolioClass A Fund
The Class A Fund investment portfolio increased from a cost base of $241.4 million at August 31, 2019 to $277.5 million at February 29, 2020. The increase of $36.1 million is attributable to investment purchases of $42.1 million and capitalized partnership income of $3.2 million, offset by partnership distributions of $8.0 million, and repayments and disposals of investments with a cost base totaling $1.2 million.
Investments in the six months ended February 29, 2020 were as follows:
• new investments totaling $27 million in Degelman Industries LP and DIL Ventures LP, which design and manufacture premium equipment for the agricultural and industrial sectors, and are headquartered in Regina, SK;
• a new investment of $8.8 million in Maxie’s Excavating LP, an infrastructure earthworks company headquartered in Saskatoon, SK;
• a follow-on investment of $4.9 million in G-Mac’s AgTeam LP, a Saskatchewan-based crop input retailer;
• a follow-on investment of $700 thousand in SuperiorFarms Solutions LP, a farming equipment manufacturer that operates in Imperial, SK; and
• a follow-on investment of $687 thousand in Retail Innovation Labs Inc., a Saskatchewan-based company offering cloud-based solutions for the cannabis dispensary industry.
The accompanying charts illustrate the diversification of the Class A Fund’s investments across different industry sectors based on the cost of the investments.
The Class A Fund’s investment in the Manufacturing sector increased from 8% to 17% during the six months ended February 29, 2020 due to the investments in Degelman Industries LP, DIL Ventures LP and SuperiorFarms Solutions LP. The Infrastructure sector increased from 4% to 6% during the period due to the new investment in Maxie’s Excavating LP, and the Agriculture sector increased from 4% to 5% due to the follow-on investment in G-Mac’s AgTeam LP. The increases in these sectors due to new investments has decreased the weighting of other sectors in the portfolio accordingly.
The regulations to the Saskatchewan Act require Golden to divest existing investments in companies with a capitalization of $500 million or more before the date that is 60 months after the last day of the fiscal year in which the capitalization of the eligible business first exceeded $500 million. The Class A Fund investment portfolio includes two publicly traded investments with an aggregate fair value of $7.5 million and representing 2.86% of the Class A Fund net asset value, that must be disposed of in the fiscal year ending August 31, 2023 in accordance with this legislation. Golden will divest the investments in these publicly traded companies in an orderly manner by the required date.
Class A Fund Investment Sectors (AUGUST 31, 2019)
Biotechnology 2%
Consumer Discretionary 2%
Technology 5%Agriculture 4%
Energy 4%
Health Care 27%
Infrastructure 4%
Oil & Gas 22%
Manufacturing 8%
Building Supplies 14%
Value Added Processing 8%
Class A Fund Investment Sectors (FEBRUARY 29, 2020)
Technology 5%
Biotechnology 1%
Energy 3%Consumer Discretionary 1%
Agriculture 5%
Health Care 23%
Infrastructure 6%
Oil & Gas 19%Value Added Processing 7%
Manufacturing 17%
Building Supplies 13%
9
Golden Opportunities Fund Inc. | 2020 Semi-annual Report

Class I Fund
The Class I Fund venture investment portfolio increased from a cost base of $16.5 million at August 31, 2019 to $21.1 million at February 29, 2020. The increase of $4.6 million is attributable to investment purchases of $4.8 million and capitalized partnership income of $180 thousand, offset by partnership distributions of $431 thousand.
Investments in the six months ended February 29, 2020 were as follows:
• new investments totaling $4.6 million in Degelman Industries LP and DIL Ventures LP;
• a follow-on investment of $119 thousand in SuperiorFarms Solutions LP;
• a new investment of $100 thousand in Three Farmers Foods Inc., a Saskatchewan-based company producing sustainable, quality food with production innovation; and
• a new investment of $20 thousand in TAIV Inc., a Manitoba-based software company utilizing artificial intelligence to detect the start of a television commercial break.
The diversification of the Class I Fund investment portfolio based on cost is presented in the accompanying charts.
The Class I Fund’s investment in the Manufacturing sector increased from 21% to 38% during the six months ended February 29, 2020 due to the investments in Degelman Industries LP, DIL Ventures LP and SuperiorFarms Solutions LP. The significant investments in this sector decreased the weighting of all other sectors in the portfolio accordingly. The new investment in Three Farmers Foods Inc. is the Class I Fund’s first investment in the Value Added Processing sector, which now comprises 0.47% of the total cost base of the Class I Fund portfolio.
The Class I Fund portfolio includes one investment in a publicly traded entity with a fair value of $895 thousand and representing 1.86% of the Class I Fund net asset value, that must be disposed of in the fiscal year ending August 31, 2023 in accordance with the regulations to the Saskatchewan Act. Golden will divest the investment in this publicly traded company in an orderly manner by the required date.
Class R Fund
The Class R Fund venture investment portfolio has a cost base of $4.2 million, which is unchanged from August 31, 2019. All Class R Fund venture investments are in the Oil & Gas sector.
The Class R Fund portfolio includes one investment in a publicly traded entity with a fair value of $252 thousand and representing 3.01% of the Class R Fund net asset value, that must be disposed of in the fiscal year ending August 31, 2023 in accordance with the regulations to the Saskatchewan Act. Golden will divest the investment in this publicly traded company in an orderly manner by the required date.
Recent DevelopmentsThe recent outbreak of the novel strain of coronavirus, specifically identified as “COVID-19”, has resulted in governments worldwide enacting emergency measures to combat the spread of the virus. These measures, which include the implementation of travel bans, self-imposed quarantine periods and social distancing, have caused material disruption to businesses globally resulting in an economic slowdown. Global equity markets have experienced significant volatility and weakness. Governments and central banks have reacted with significant monetary and fiscal interventions designed to stabilize economic conditions. The duration and impact of the COVID-19 outbreak is unknown at this time, as is the efficacy of the government and central bank interventions. While the Manager continues to monitor these developments generally, and particularly in connection with the Fund’s portfolio investments, it is not yet possible to reliably estimate the length and severity of these developments and the impact on the financial results and condition of the Fund in future periods.
Class I Fund Investment Sectors (FEBRUARY 29, 2020)
Class I Fund Investment Sectors (AUGUST 31, 2019)
Oil & Gas 7% Oil & Gas 10%
Technology 23% Manufacturing 21%
Health Care 32% Technology 28%
Manufacturing 38%
Value Added Processing < 0.5% Health Care 41%
10 Golden Opportunities Fund Inc. | 2020 Semi-annual Report

Related Party TransactionsThe Fund Manager is a company controlled by the President & Chief Executive Officer of Golden and was engaged by an agreement dated December 31, 2008. Please refer to the “Management Fees” section for a description of services provided by the Fund Manager.
For the Class A Fund, management fees of $3.7 million (six months ended February 28, 2019 - $3.8 million) and office costs totaling $4 thousand (six months ended February 28, 2019 - $4 thousand) were paid or payable to the Manager during the six months ended February 29, 2020, and management fees of $nil (six months ended February 28, 2019 - $169 thousand) were waived during the period. During the six months ended February 29, 2020, the Manager earned an IPA of $41 thousand (six months ended February 28, 2019 - $6.9 million) on realized gains in the Class A Fund that have been received in cash.
For the Class A Fund, management fees of $594 thousand (August 31, 2019 - $635 thousand) are included in accounts payable and accrued liabilities, there is an IPA payable of $19.2 million (August 31, 2019 - $19.2 million) and an accrued contingent IPA of $13.3 million (August 31, 2019 - $17.1 million) at February 29, 2020.
For the Class I Fund, management fees of $601 thousand (six months ended February 28, 2019 - $566 thousand) and office costs totaling $1 thousand (six months ended February 28, 2019 - $1 thousand) were paid or payable during the six months ended February 29, 2020 and management fees of $nil (six months ended February 28, 2019 - $13 thousand) were waived during the period. During the six months ended February 29, 2020, the Manager earned an IPA of $5 thousand (six months ended February 28, 2019 - $991 thousand) on realized gains in the Class I Fund that have been received in cash.
For the Class I Fund, management fees of $98 thousand (August 31, 2019 - $105 thousand) are included in accounts payable and accrued liabilities, there is an IPA payable of $2.5 million (August 31, 2019 - $2.5 million) and an accrued contingent IPA of $686 thousand (August 31, 2019 - $1.2 million) at February 29, 2020.
For the Class R Fund, management fees of $115 thousand (six months ended February 28, 2019 – $107 thousand) and office costs totaling less than $1 thousand (six months ended February 28, 2019 – less than $1 thousand) were paid or payable for the Class R Fund during the six months ended February 29, 2020 and management fees of $nil (six months ended February 28, 2019 – less than $1 thousand) were waived during the period.
The above-mentioned transactions were in the normal course of operations, are non-interest bearing, and are measured at the exchange amount, which is the amount of consideration established and agreed to by the related parties.
FINANCIAL HIGHLIGHTSThe following tables show selected key financial information about Golden and are intended to help you understand Golden’s financial performance for the past five years.
Class A Fund
Net Assets per Class A Share (1)
Six months ended
February 29, 2020
Year ended August 31
2019 2018 2017 2016 2015
Net assets, beginning of period $ 16.53 $ 17.08 $ 14.24 $ 13.83 $ 15.38 $ 15.05
Increase (decrease) from operations:
Total revenue $ 0.27 $ 0.74 $ 0.66 $ 0.50 $ 0.74 $ 0.72
Total expenses (0.42) (0.80) (0.77) (0.68) (0.71) (0.72)
Realized (losses) gains (0.03) (0.28) 6.88 (0.21) (0.55) 0.30
Unrealized (losses) gains (0.69) (0.20) (3.88) 0.81 (1.03) 0.05
Total (decrease) increase from operations (2) $ (0.87) $ (0.54) $ 2.89 $ 0.42 $ (1.55) $ 0.35
Net assets at end of period shown $ 15.67 $ 16.53 $ 17.08 $ 14.24 $ 13.83 $ 15.38
(1) The information for the years ended August 31, 2015 – 2019 is derived from Golden’s audited annual financial statements. The information for the six months ended February 29, 2020 is derived from Golden’s unaudited condensed interim financial statements. The net assets per security presented in the financial statements differs from the net asset value calculated for fund pricing purposes. An explanation of these differences can be found in Note 6 to Golden’s financial statements.
(2) Net assets are based on the actual number of shares outstanding at the relevant time. The increase/decrease from operations is based on the weighted average number of shares outstanding over the financial period.
11
Golden Opportunities Fund Inc. | 2020 Semi-annual Report
Net Assets per Class A-F Share (1)
Six months ended
February 29, 2020
Period ended August 31
2019 2018 2017 2016
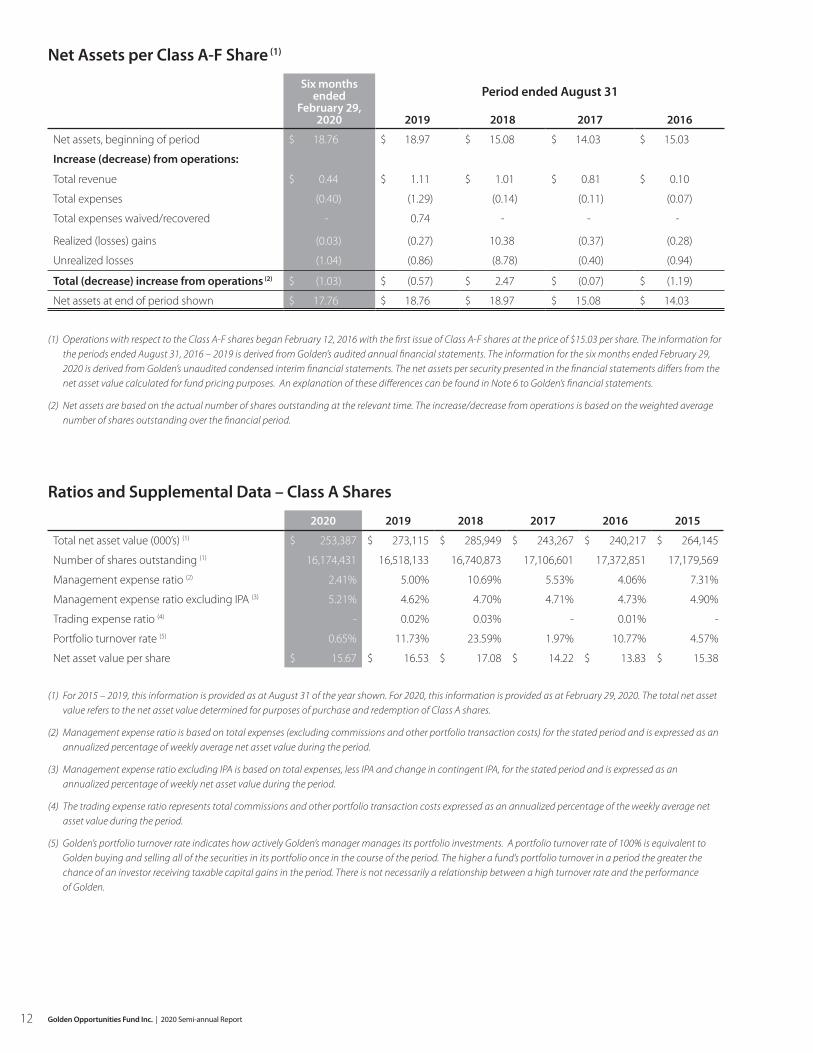
Net assets, beginning of period $ 18.76 $ 18.97 $ 15.08 $ 14.03 $ 15.03
Increase (decrease) from operations:
Total revenue $ 0.44 $ 1.11 $ 1.01 $ 0.81 $ 0.10
Total expenses (0.40) (1.29) (0.14) (0.11) (0.07)
Total expenses waived/recovered - 0.74 - - -
Realized (losses) gains (0.03) (0.27) 10.38 (0.37) (0.28)
Unrealized losses (1.04) (0.86) (8.78) (0.40) (0.94)
Total (decrease) increase from operations (2) $ (1.03) $ (0.57) $ 2.47 $ (0.07) $ (1.19)
Net assets at end of period shown $ 17.76 $ 18.76 $ 18.97 $ 15.08 $ 14.03
(1) Operations with respect to the Class A-F shares began February 12, 2016 with the first issue of Class A-F shares at the price of $15.03 per share. The information for
the periods ended August 31, 2016 – 2019 is derived from Golden’s audited annual financial statements. The information for the six months ended February 29, 2020 is derived from Golden’s unaudited condensed interim financial statements. The net assets per security presented in the financial statements differs from the net asset value calculated for fund pricing purposes. An explanation of these differences can be found in Note 6 to Golden’s financial statements.
(2) Net assets are based on the actual number of shares outstanding at the relevant time. The increase/decrease from operations is based on the weighted average number of shares outstanding over the financial period.
Ratios and Supplemental Data – Class A Shares
2020 2019 2018 2017 2016 2015
Total net asset value (000’s) (1) $ 253,387 $ 273,115 $ 285,949 $ 243,267 $ 240,217 $ 264,145
Number of shares outstanding (1) 16,174,431 16,518,133 16,740,873 17,106,601 17,372,851 17,179,569
Management expense ratio (2) 2.41% 5.00% 10.69% 5.53% 4.06% 7.31%
Management expense ratio excluding IPA (3) 5.21% 4.62% 4.70% 4.71% 4.73% 4.90%
Trading expense ratio (4) - 0.02% 0.03% - 0.01% -
Portfolio turnover rate (5) 0.65% 11.73% 23.59% 1.97% 10.77% 4.57%
Net asset value per share $ 15.67 $ 16.53 $ 17.08 $ 14.22 $ 13.83 $ 15.38
(1) For 2015 – 2019, this information is provided as at August 31 of the year shown. For 2020, this information is provided as at February 29, 2020. The total net asset
value refers to the net asset value determined for purposes of purchase and redemption of Class A shares.
(2) Management expense ratio is based on total expenses (excluding commissions and other portfolio transaction costs) for the stated period and is expressed as an annualized percentage of weekly average net asset value during the period.
(3) Management expense ratio excluding IPA is based on total expenses, less IPA and change in contingent IPA, for the stated period and is expressed as an annualized percentage of weekly net asset value during the period.
(4) The trading expense ratio represents total commissions and other portfolio transaction costs expressed as an annualized percentage of the weekly average net asset value during the period.
(5) Golden’s portfolio turnover rate indicates how actively Golden’s manager manages its portfolio investments. A portfolio turnover rate of 100% is equivalent to Golden buying and selling all of the securities in its portfolio once in the course of the period. The higher a fund’s portfolio turnover in a period the greater the chance of an investor receiving taxable capital gains in the period. There is not necessarily a relationship between a high turnover rate and the performance of Golden.
12 Golden Opportunities Fund Inc. | 2020 Semi-annual Report
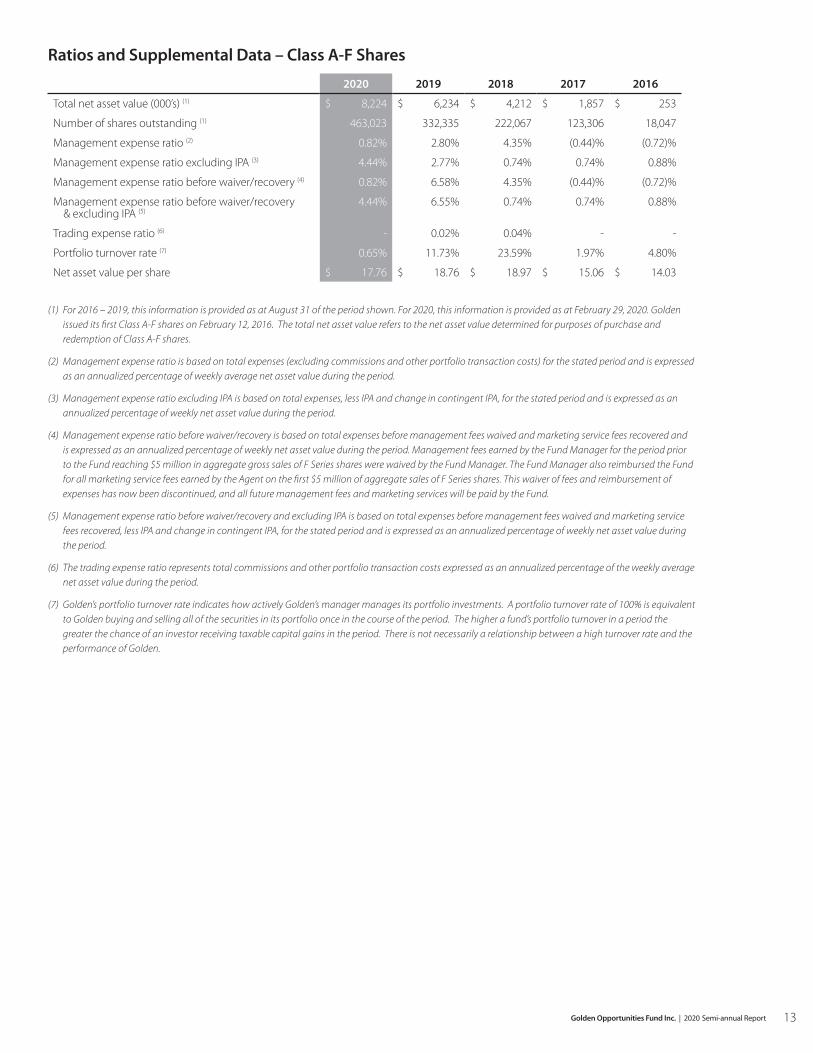
Ratios and Supplemental Data – Class A-F Shares
2020 2019 2018 2017 2016
Total net asset value (000’s) (1) $ 8,224 $ 6,234 $ 4,212 $ 1,857 $ 253
Number of shares outstanding (1) 463,023 332,335 222,067 123,306 18,047
Management expense ratio (2) 0.82% 2.80% 4.35% (0.44)% (0.72)%
Management expense ratio excluding IPA (3) 4.44% 2.77% 0.74% 0.74% 0.88%
Management expense ratio before waiver/recovery (4) 0.82% 6.58% 4.35% (0.44)% (0.72)%
Management expense ratio before waiver/recovery & excluding IPA (5)
4.44% 6.55% 0.74% 0.74% 0.88%
Trading expense ratio (6) - 0.02% 0.04% - -
Portfolio turnover rate (7) 0.65% 11.73% 23.59% 1.97% 4.80%
Net asset value per share $ 17.76 $ 18.76 $ 18.97 $ 15.06 $ 14.03
(1) For 2016 – 2019, this information is provided as at August 31 of the period shown. For 2020, this information is provided as at February 29, 2020. Golden
issued its first Class A-F shares on February 12, 2016. The total net asset value refers to the net asset value determined for purposes of purchase and redemption of Class A-F shares.
(2) Management expense ratio is based on total expenses (excluding commissions and other portfolio transaction costs) for the stated period and is expressed as an annualized percentage of weekly average net asset value during the period.
(3) Management expense ratio excluding IPA is based on total expenses, less IPA and change in contingent IPA, for the stated period and is expressed as an annualized percentage of weekly net asset value during the period.
(4) Management expense ratio before waiver/recovery is based on total expenses before management fees waived and marketing service fees recovered and is expressed as an annualized percentage of weekly net asset value during the period. Management fees earned by the Fund Manager for the period prior to the Fund reaching $5 million in aggregate gross sales of F Series shares were waived by the Fund Manager. The Fund Manager also reimbursed the Fund for all marketing service fees earned by the Agent on the first $5 million of aggregate sales of F Series shares. This waiver of fees and reimbursement of expenses has now been discontinued, and all future management fees and marketing services will be paid by the Fund.
(5) Management expense ratio before waiver/recovery and excluding IPA is based on total expenses before management fees waived and marketing service fees recovered, less IPA and change in contingent IPA, for the stated period and is expressed as an annualized percentage of weekly net asset value during the period.
(6) The trading expense ratio represents total commissions and other portfolio transaction costs expressed as an annualized percentage of the weekly average net asset value during the period.
(7) Golden’s portfolio turnover rate indicates how actively Golden’s manager manages its portfolio investments. A portfolio turnover rate of 100% is equivalent to Golden buying and selling all of the securities in its portfolio once in the course of the period. The higher a fund’s portfolio turnover in a period the greater the chance of an investor receiving taxable capital gains in the period. There is not necessarily a relationship between a high turnover rate and the performance of Golden.
13
Golden Opportunities Fund Inc. | 2020 Semi-annual Report
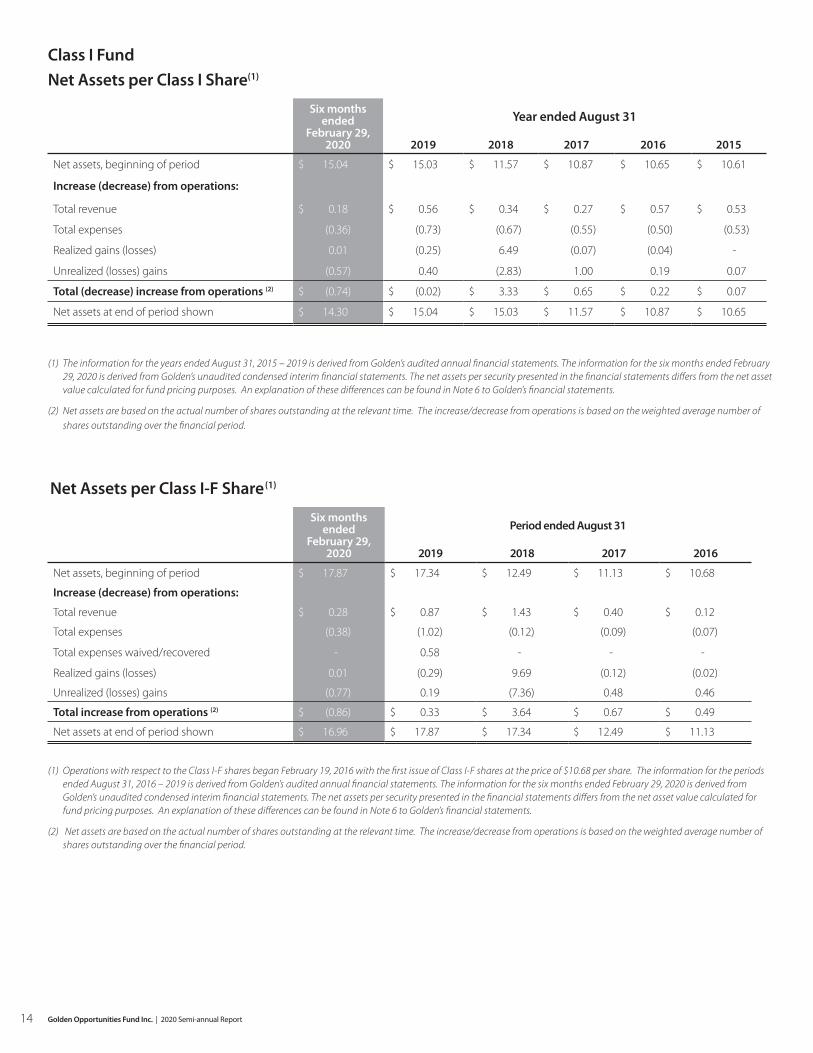
Class I FundNet Assets per Class I Share(1)
Six months ended
February 29, 2020
Year ended August 31
2019 2018 2017 2016 2015
Net assets, beginning of period $ 15.04 $ 15.03 $ 11.57 $ 10.87 $ 10.65 $ 10.61
Increase (decrease) from operations:
Total revenue $ 0.18 $ 0.56 $ 0.34 $ 0.27 $ 0.57 $ 0.53
Total expenses (0.36) (0.73) (0.67) (0.55) (0.50) (0.53)
Realized gains (losses) 0.01 (0.25) 6.49 (0.07) (0.04) -
Unrealized (losses) gains (0.57) 0.40 (2.83) 1.00 0.19 0.07
Total (decrease) increase from operations (2) $ (0.74) $ (0.02) $ 3.33 $ 0.65 $ 0.22 $ 0.07
Net assets at end of period shown $ 14.30 $ 15.04 $ 15.03 $ 11.57 $ 10.87 $ 10.65
(1) The information for the years ended August 31, 2015 – 2019 is derived from Golden’s audited annual financial statements. The information for the six months ended February 29, 2020 is derived from Golden’s unaudited condensed interim financial statements. The net assets per security presented in the financial statements differs from the net asset value calculated for fund pricing purposes. An explanation of these differences can be found in Note 6 to Golden’s financial statements.
(2) Net assets are based on the actual number of shares outstanding at the relevant time. The increase/decrease from operations is based on the weighted average number of shares outstanding over the financial period.
Net Assets per Class I-F Share(1)
Six months ended
February 29, 2020
Period ended August 31
2019 2018 2017 2016
Net assets, beginning of period $ 17.87 $ 17.34 $ 12.49 $ 11.13 $ 10.68
Increase (decrease) from operations:
Total revenue $ 0.28 $ 0.87 $ 1.43 $ 0.40 $ 0.12
Total expenses (0.38) (1.02) (0.12) (0.09) (0.07)
Total expenses waived/recovered - 0.58 - - -
Realized gains (losses) 0.01 (0.29) 9.69 (0.12) (0.02)
Unrealized (losses) gains (0.77) 0.19 (7.36) 0.48 0.46
Total increase from operations (2) $ (0.86) $ 0.33 $ 3.64 $ 0.67 $ 0.49
Net assets at end of period shown $ 16.96 $ 17.87 $ 17.34 $ 12.49 $ 11.13
(1) Operations with respect to the Class I-F shares began February 19, 2016 with the first issue of Class I-F shares at the price of $10.68 per share. The information for the periods
ended August 31, 2016 – 2019 is derived from Golden’s audited annual financial statements. The information for the six months ended February 29, 2020 is derived from Golden’s unaudited condensed interim financial statements. The net assets per security presented in the financial statements differs from the net asset value calculated for fund pricing purposes. An explanation of these differences can be found in Note 6 to Golden’s financial statements.
(2) Net assets are based on the actual number of shares outstanding at the relevant time. The increase/decrease from operations is based on the weighted average number of shares outstanding over the financial period.
14 Golden Opportunities Fund Inc. | 2020 Semi-annual Report

Ratios and Supplemental Data – Class I Shares
2020 2019 2018 2017 2016 2015
Total net asset value (000’s) (1) $ 47,143 $ 46,211 $ 41,983 $ 29,858 $ 24,644 $ 20,835
Number of shares outstanding (1) 3,297,848 3,073,400 2,797,201 2,583,726 2,267,259 1,955,588
Management expense ratio (2) 2.89% 4.96% 11.76% 7.26% 5.71% 6.00%
Management expense ratio excluding IPA (3) 4.97% 4.72% 4.73% 4.80% 4.70% 5.05%
Trading expense ratio (4) - 0.02% 0.03% - - -
Portfolio turnover rate (5) 0.34% 13.32% 54.98% - 31.98% 11.83%
Net asset value per share $ 14.30 $ 15.04 $ 15.01 $ 11.55 $ 10.87 $ 10.65
(1) For 2015 – 2019, this information is provided as at August 31 of the year shown. For 2020, this information is provided as at February 29, 2020. The total net asset value
refers to the net asset value determined for purposes of purchase and redemption of Class I shares.
(2) Management expense ratio is based on total expenses (excluding commissions and other portfolio transaction costs) for the stated period and is expressed as an annualized percentage of weekly average net asset value during the period.
(3) Management expense ratio excluding IPA is based on total expenses, less IPA and change in contingent IPA, for the stated period and is expressed as an annualized percentage of weekly net asset value during the period.
(4) The trading expense ratio represents total commissions and other portfolio transaction costs expressed as an annualized percentage of the weekly average net asset value during the period.
(5) Golden’s portfolio turnover rate indicates how actively Golden’s manager manages its portfolio investments. A portfolio turnover rate of 100% is equivalent to Golden buying and selling all of the securities in its portfolio once in the course of the period. The higher a fund’s portfolio turnover in a period the greater the chance of an investor receiving taxable capital gains in the period. There is not necessarily a relationship between a high turnover rate and the performance of Golden.
Ratios and Supplemental Data – Class I-F Shares
2020 2019 2018 2017 2016
Total net asset value (000’s) (1) $ 918 $ 661 $ 387 $ 104 $ 2
Number of shares outstanding (1) 54,115 36,964 22,326 8,319 187
Management expense ratio (2) 1.95% 2.62% 4.49% 1.86% 2.96%
Management expense ratio excluding IPA (3) 4.43% 2.40% 0.70% 0.73% 1.29%
Management expense ratio before waiver/recovery (4) 1.95% 5.84% 4.49% 1.86% 2.96%
Management expense ratio before waiver/recovery & excluding IPA (5)
4.43% 5.62% 0.70% 0.73% 1.29%
Trading expense ratio (6) - 0.01% 0.05% - -
Portfolio turnover rate (7) 0.34% 13.32% 54.98% - 58.46%
Net asset value per share $ 16.96 $ 17.87 $ 17.32 $ 12.47 $ 11.13
(1) For 2016 – 2019, this information is provided as at August 31 of the period shown. For 2020, this information is provided as at February 29, 2020. The total net asset value
refers to the net asset value determined for purposes of purchase and redemption of Class I-F shares.
(2) Management expense ratio is based on total expenses (excluding commissions and other portfolio transaction costs) for the stated period and is expressed as an annualized percentage of weekly average net asset value during the period.
(3) Management expense ratio excluding IPA is based on total expenses, less IPA and change in contingent IPA, for the stated period and is expressed as an annualized percentage of weekly net asset value during the period.
(4) Management expense ratio before waiver/recovery is based on total expenses before management fees waived and marketing service fees recovered and is expressed as an annualized percentage of weekly net asset value during the period. Management fees earned by the Fund Manager for the period prior to the Fund reaching $5 million in aggregate gross sales of F Series shares were waived by the Fund Manager. The Fund Manager also reimbursed the Fund for all marketing service fees earned by the Agent on the first $5 million of aggregate sales of F Series shares. This waiver of fees and reimbursement of expenses has now been discontinued, and all future management fees and marketing service fees will be paid by the Fund.
(5) Management expense ratio before waiver/recovery and excluding IPA is based on total expenses before management fees waived and marketing service fees recovered, less IPA and change in contingent IPA, for the stated period and is expressed as an annualized percentage of weekly net asset value during the period.
(6) The trading expense ratio represents total commissions and other portfolio transaction costs expressed as an annualized percentage of the weekly average net asset value during the period.
(7) Golden’s portfolio turnover rate indicates how actively Golden’s manager manages its portfolio investments. A portfolio turnover rate of 100% is equivalent to Golden buying and selling all of the securities in its portfolio once in the course of the period. The higher a fund’s portfolio turnover in a period the greater the chance of an investor receiving taxable capital gains in the period. There is not necessarily a relationship between a high turnover rate and the performance of Golden.
15
Golden Opportunities Fund Inc. | 2020 Semi-annual Report
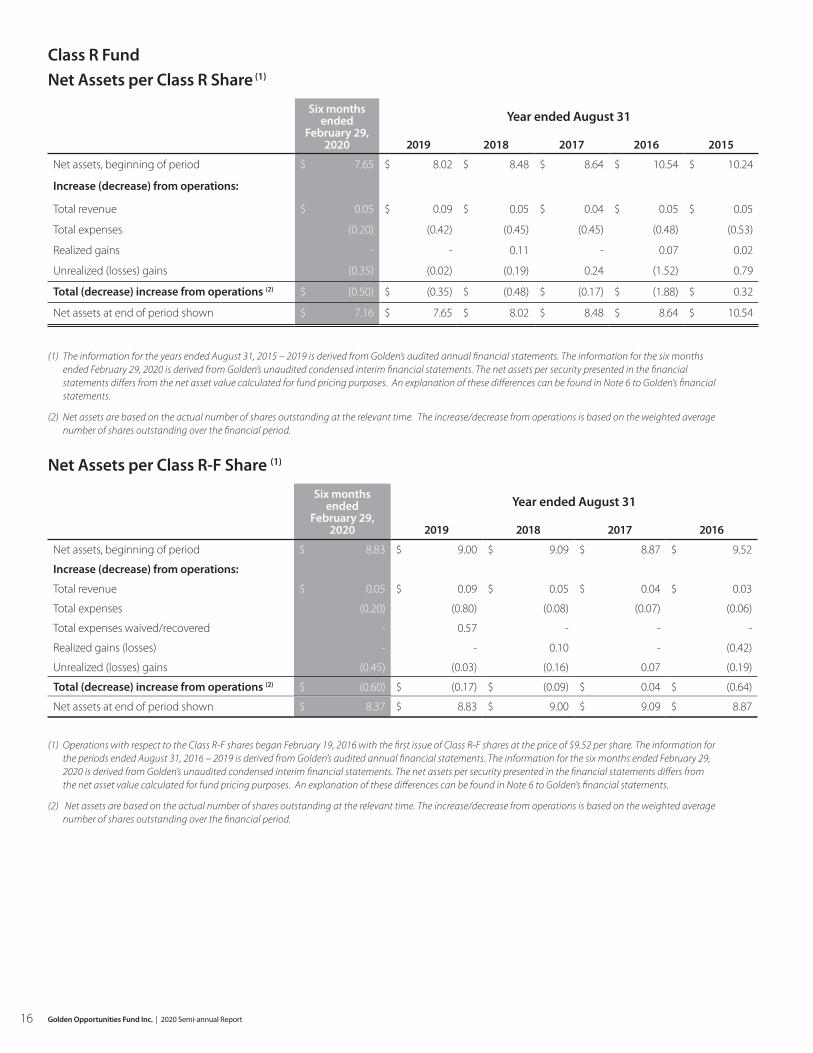
Class R FundNet Assets per Class R Share (1)
Six months ended
February 29, 2020
Year ended August 31
2019 2018 2017 2016 2015
Net assets, beginning of period $ 7.65 $ 8.02 $ 8.48 $ 8.64 $ 10.54 $ 10.24
Increase (decrease) from operations:
Total revenue $ 0.05 $ 0.09 $ 0.05 $ 0.04 $ 0.05 $ 0.05
Total expenses (0.20) (0.42) (0.45) (0.45) (0.48) (0.53)
Realized gains - - 0.11 - 0.07 0.02
Unrealized (losses) gains (0.35) (0.02) (0.19) 0.24 (1.52) 0.79
Total (decrease) increase from operations (2) $ (0.50) $ (0.35) $ (0.48) $ (0.17) $ (1.88) $ 0.32
Net assets at end of period shown $ 7.16 $ 7.65 $ 8.02 $ 8.48 $ 8.64 $ 10.54
(1) The information for the years ended August 31, 2015 – 2019 is derived from Golden’s audited annual financial statements. The information for the six months
ended February 29, 2020 is derived from Golden’s unaudited condensed interim financial statements. The net assets per security presented in the financial statements differs from the net asset value calculated for fund pricing purposes. An explanation of these differences can be found in Note 6 to Golden’s financial statements.
(2) Net assets are based on the actual number of shares outstanding at the relevant time. The increase/decrease from operations is based on the weighted average number of shares outstanding over the financial period.
Net Assets per Class R-F Share (1)
Six months ended
February 29, 2020
Year ended August 31
2019 2018 2017 2016
Net assets, beginning of period $ 8.83 $ 9.00 $ 9.09 $ 8.87 $ 9.52
Increase (decrease) from operations:
Total revenue $ 0.05 $ 0.09 $ 0.05 $ 0.04 $ 0.03
Total expenses (0.20) (0.80) (0.08) (0.07) (0.06)
Total expenses waived/recovered - 0.57 - - -
Realized gains (losses) - - 0.10 - (0.42)
Unrealized (losses) gains (0.45) (0.03) (0.16) 0.07 (0.19)
Total (decrease) increase from operations (2) $ (0.60) $ (0.17) $ (0.09) $ 0.04 $ (0.64)
Net assets at end of period shown $ 8.37 $ 8.83 $ 9.00 $ 9.09 $ 8.87
(1) Operations with respect to the Class R-F shares began February 19, 2016 with the first issue of Class R-F shares at the price of $9.52 per share. The information for
the periods ended August 31, 2016 – 2019 is derived from Golden’s audited annual financial statements. The information for the six months ended February 29, 2020 is derived from Golden’s unaudited condensed interim financial statements. The net assets per security presented in the financial statements differs from the net asset value calculated for fund pricing purposes. An explanation of these differences can be found in Note 6 to Golden’s financial statements.
(2) Net assets are based on the actual number of shares outstanding at the relevant time. The increase/decrease from operations is based on the weighted average number of shares outstanding over the financial period.
16 Golden Opportunities Fund Inc. | 2020 Semi-annual Report

Ratios and Supplemental Data – Class R Shares
2020 2019 2018 2017 2016 2015
Total net asset value (000’s) (1) $ 8,353 $ 8,697 $ 8,519 $ 8,315 $ 7,417 $ 7,400
Number of shares outstanding (1) 1,167,086 1,136,928 1,064,656 980,641 858,747 702,193
Management expense ratio (2) 5.52% 5.66% 5.45% 5.24% 2.78% 7.72%
Management expense ratio excluding IPA (3) 5.52% 5.66% 5.45% 5.24% 5.11% 5.23%
Trading expense ratio (4) - - - - 0.03% -
Portfolio turnover rate (5) - - 24.10% - 32.27% 4.25%
Net asset value per share $ 7.16 $ 7.65 $ 8.00 $ 8.48 $ 8.64 $ 10.54
(1) For 2015 – 2019, this information is provided as at August 31 of the year shown. For 2020, this information is provided as at February 29, 2020. The total net asset value refers
to the net asset value determined for purposes of purchase and redemption of Class R shares.
(2) Management expense ratio is based on total expenses (excluding commissions and other portfolio transaction costs) for the stated period and is expressed as an annualized percentage of weekly average net asset value during the period.
(3) Management expense ratio excluding IPA is based on total expenses, less IPA and change in contingent IPA, for the stated period and is expressed as an annualized percentage of weekly net asset value during the period.
(4) The trading expense ratio represents total commissions and other portfolio transaction costs expressed as an annualized percentage of the weekly average net asset value during the period.
(5) Golden’s portfolio turnover rate indicates how actively Golden’s manager manages its portfolio investments. A portfolio turnover rate of 100% is equivalent to Golden buying and selling all of the securities in its portfolio once in the course of the period. The higher a fund’s portfolio turnover in a year the greater the chance of an investor receiving taxable capital gains in the period. There is not necessarily a relationship between a high turnover rate and the performance of Golden.
Ratios and Supplemental Data – Class R-F Shares
2020 2019 2018 2017 2016
Total net asset value (000’s) (1) $ 13 $ 9 $ 8 $ 9 $ 2
Number of shares outstanding (1) 1,491 920 920 920 175
Management expense ratio (2) 4.53% 2.66% 0.90% 0.79% (0.40)%
Management expense ratio excluding IPA (3) 4.53% 2.66% 0.90% 0.79% 1.21%
Management expense ratio before waiver/recovery (4) 4.53% 9.19% 0.90% 0.79% (0.40)%
Management expense ratio before waiver/recovery & excluding IPA (5) 4.53% 9.19% 0.90% 0.79% 1.21%
Trading expense ratio (6) - - - - -
Portfolio turnover rate (7) - - 24.10% - -
Net asset value per share $ 8.37 $ 8.83 $ 8.98 $ 9.09 $ 8.87
(1) For 2016 – 2019, this information is provided as at August 31 of the period shown. For 2020, this information is provided as at February 29, 2020. The total net asset value refers to the
net asset value determined for purposes of purchase and redemption of Class R-F shares.
(2) Management expense ratio is based on total expenses (excluding commissions and other portfolio transaction costs) for the stated period and is expressed as an annualized percentage of weekly average net asset value during the period.
(3) Management expense ratio excluding IPA is based on total expenses, less IPA and change in contingent IPA, for the stated period and is expressed as an annualized percentage of weekly net asset value during the period.
(4) Management expense ratio before waiver/recovery is based on total expenses before management fees waived and marketing service fees recovered and is expressed as an annualized percentage of weekly net asset value during the period. Management fees earned by the Fund Manager for the period prior to the Fund reaching $5 million in aggregate gross sales of F Series shares were waived by the Fund Manager. The Fund Manager also reimbursed the Fund for all marketing service fees earned by the Agent on the first $5 million of aggregate sales of F Series shares. This waiver of fees and reimbursement of expenses has now been discontinued, and all future management fees and marketing services will be paid by the Fund.
(5) Management expense ratio before waiver/recovery and excluding IPA is based on total expenses before management fees waived and marketing service fees recovered, less IPA and change in contingent IPA, for the stated period and is expressed as an annualized percentage of weekly net asset value during the period.
(6) The trading expense ratio represents total commissions and other portfolio transaction costs expressed as an annualized percentage of the average weekly net asset value during the period.
(7) Golden’s portfolio turnover rate indicates how actively Golden’s manager manages its portfolio investments. A portfolio turnover rate of 100% is equivalent to Golden buying and selling all of the securities in its portfolio once in the course of the period. The higher a fund’s portfolio turnover in a period the greater the chance of an investor receiving taxable capital gains in the period. There is not necessarily a relationship between a high turnover rate and the performance of Golden.
17
Golden Opportunities Fund Inc. | 2020 Semi-annual Report
Management FeesThe annual management fee, which is calculated and payable monthly, is equal to 2.5% of the aggregate net asset value of Golden, on a class by class basis, as at each valuation date. The Fund Manager has been retained to manage and administer the business affairs of Golden, including the management of Golden’s investments in eligible businesses and its marketable securities investments, and maintain all required books and records of Golden. The Manager is also responsible for seeking out and identifying investment opportunities and undertaking operational due diligence of the investment opportunities. The Manager develops investment recommendations to the Board, monitors all investments, provides performance reports to the Board and makes disposition recommendations to the Board. For these services, the Manager is compensated with the management fees. A 20% IPA is also payable to the Manager, provided certain criteria have been met. The IPA is only earned on realized gains that the Fund has received in cash and the realized investment performance of Golden. The criteria are fully described in Golden’s prospectus.
PAST PERFORMANCEThe performance data provided does not consider sales, redemption, or other optional charges payable by any shareholder that would have reduced returns. Past performance does not necessarily indicate how a fund will perform in the future.
Year-by-Year ReturnsClass A SharesThe bar chart below shows the annual performance for each of the last ten completed fiscal year ends for Class A shares. The bar chart shows, in percentage terms, how much an investment made on the first day of each financial year would have grown or decreased by the last day of each financial year. The date of Golden’s financial year end is August 31. The 2020 percentage indicates Golden’s performance from September 1, 2019 to February 29, 2020.
Class A-F SharesThe bar chart below shows the performance for the Class A-F shares for the periods presented. The bar chart shows, in percentage terms, how much an investment made on the first day of each financial year would have grown or decreased by the last day of each financial year. The 2016 percentage indicates the performance from February 12, 2016, the first day on which the Class A-F shares were issued, to August 31, 2016. The 2020 percentage indicates Golden’s performance from September 1, 2019 to February 29, 2020.
-5.20%
Year-by-Year Returns for Class A Shares30.00%
20.00%
10.00%
0.00%
-10.00%
-20.00%
2010 2011 2012 2013 2014 2015 2016 2018 2019 2020 (YTD)
2017
Year-by-Year Returns for Class A-F Shares
-5.33%
2016 2017 2018 2019 2020 (YTD)
30.00%
20.00%
10.00%
0.00%
-10.00%
18 Golden Opportunities Fund Inc. | 2020 Semi-annual Report

5.00%
0.00%
-5.00%
-10.00%
Year-by-Year Returns for Class R-F Shares
2016 2017 2018 2019 2020 (YTD)
-5.21%
Class I SharesThe bar chart below shows the performance for each of the last ten completed fiscal year ends for Class I shares. The bar chart shows, in percentage terms, how much an investment made on the first day of each financial year would have grown or decreased by the last day of each financial year. The 2020 percentage indicates Golden’s performance from September 1, 2019 to February 29, 2020.
Class I-F SharesThe bar chart below shows the performance for the Class I-F shares for the periods presented. The bar chart shows, in percentage terms, how much an investment made on the first day of each financial year would have grown by the last day of each financial year. The 2016 percentage indicates the performance from February 19, 2016, the first day on which the Class I-F shares were issued, to August 31, 2016. The 2020 percentage indicates Golden’s performance from September 1, 2019 to February 29, 2020.
Class R SharesThe bar chart below shows the performance for the Class R shares for the periods presented. The bar chart shows, in percentage terms, how much an investment made on the first day of each financial year would have grown by the last day of each financial year. The 2013 fiscal year end consists of the period from January 4, 2013, the first day on which the Class R shares were issued, to August 31, 2013. The 2020 percentage indicates Golden’s performance from September 1, 2019 to February 29, 2020.
Class R-F SharesThe bar chart below shows the performance for the Class R-F shares for the periods presented. The bar chart shows, in percentage terms, how much an investment made on the first day of each financial year would have grown by the last day of each financial year. The 2016 percentage indicates the performance from February 19, 2016, the first day on which the Class R-F shares were issued, to August 31, 2016. The 2020 percentage indicates Golden’s performance from September 1, 2019 to February 29, 2020.
Year-by-Year Returns for Class I Shares40.00%30.00%20.00%10.00%
0.00%-10.00%
2010 2011 2020 (YTD)
2012 2013 2014 2015 2016 2017 2018 2019
-4.92%
Year-by-Year Returns for Class I-F Shares
-5.09%
2016 2017 2018 2019 2020 (YTD)
50.00%
40.00%
30.00%
20.00%
10.00%
0.00%
-10.00%
5.00%
0.00%
-5.00%
-10.00%
-15.00%
-20.00%
Year-by-Year Returns for Class R Shares
2013 2014 2015 2016 2017 2018 2019 2020 (YTD)
-6.41%
19
Golden Opportunities Fund Inc. | 2020 Semi-annual Report
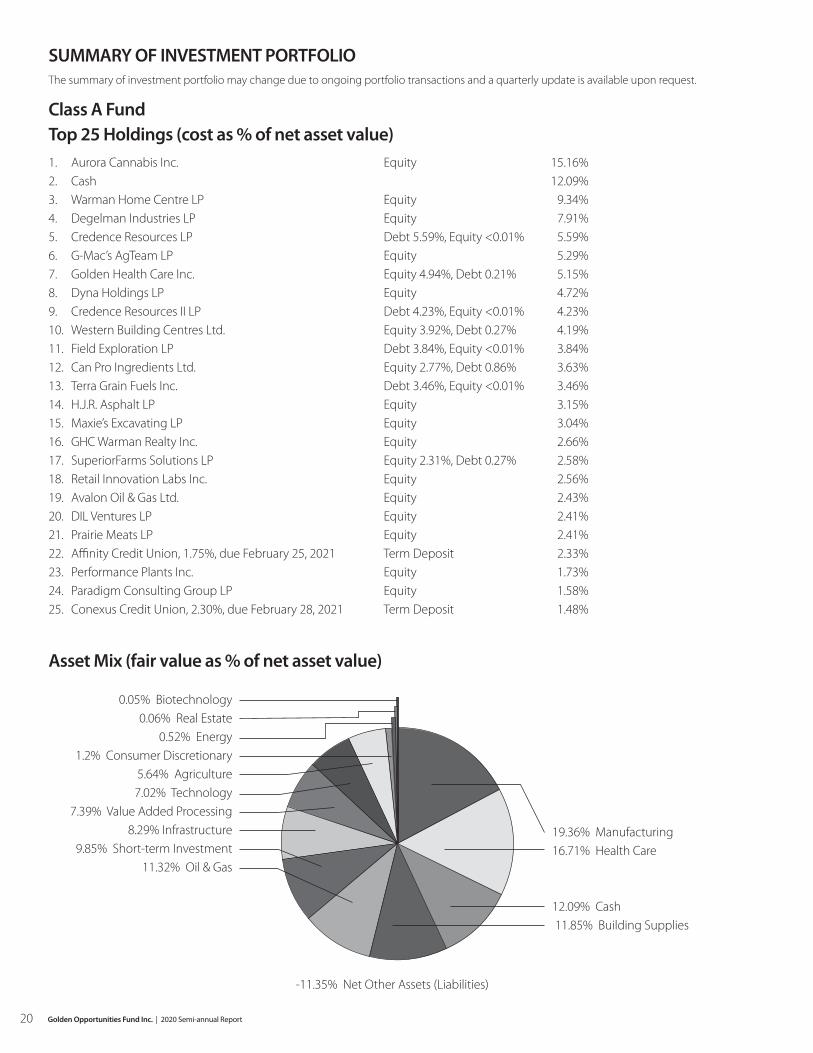
SUMMARY OF INVESTMENT PORTFOLIOThe summary of investment portfolio may change due to ongoing portfolio transactions and a quarterly update is available upon request.
Class A FundTop 25 Holdings (cost as % of net asset value)1. Aurora Cannabis Inc. Equity 15.16%2. Cash 12.09%3. Warman Home Centre LP Equity 9.34%4. Degelman Industries LP Equity 7.91%5. Credence Resources LP Debt 5.59%, Equity <0.01% 5.59%6. G-Mac’s AgTeam LP Equity 5.29%7. Golden Health Care Inc. Equity 4.94%, Debt 0.21% 5.15%8. Dyna Holdings LP Equity 4.72%9. Credence Resources II LP Debt 4.23%, Equity <0.01% 4.23%10. Western Building Centres Ltd. Equity 3.92%, Debt 0.27% 4.19%11. Field Exploration LP Debt 3.84%, Equity <0.01% 3.84%12. Can Pro Ingredients Ltd. Equity 2.77%, Debt 0.86% 3.63%13. Terra Grain Fuels Inc. Debt 3.46%, Equity <0.01% 3.46%14. H.J.R. Asphalt LP Equity 3.15%15. Maxie’s Excavating LP Equity 3.04%16. GHC Warman Realty Inc. Equity 2.66%17. SuperiorFarms Solutions LP Equity 2.31%, Debt 0.27% 2.58%18. Retail Innovation Labs Inc. Equity 2.56%19. Avalon Oil & Gas Ltd. Equity 2.43%20. DIL Ventures LP Equity 2.41%21. Prairie Meats LP Equity 2.41%22. Affinity Credit Union, 1.75%, due February 25, 2021 Term Deposit 2.33%23. Performance Plants Inc. Equity 1.73%24. Paradigm Consulting Group LP Equity 1.58%25. Conexus Credit Union, 2.30%, due February 28, 2021 Term Deposit 1.48%
Asset Mix (fair value as % of net asset value)
19.36% Manufacturing 16.71% Health Care
12.09% Cash 11.85% Building Supplies
0.05% Biotechnology 0.06% Real Estate
0.52% Energy1.2% Consumer Discretionary
5.64% Agriculture7.02% Technology
7.39% Value Added Processing8.29% Infrastructure
9.85% Short-term Investment11.32% Oil & Gas
-11.35% Net Other Assets (Liabilities)
20 Golden Opportunities Fund Inc. | 2020 Semi-annual Report
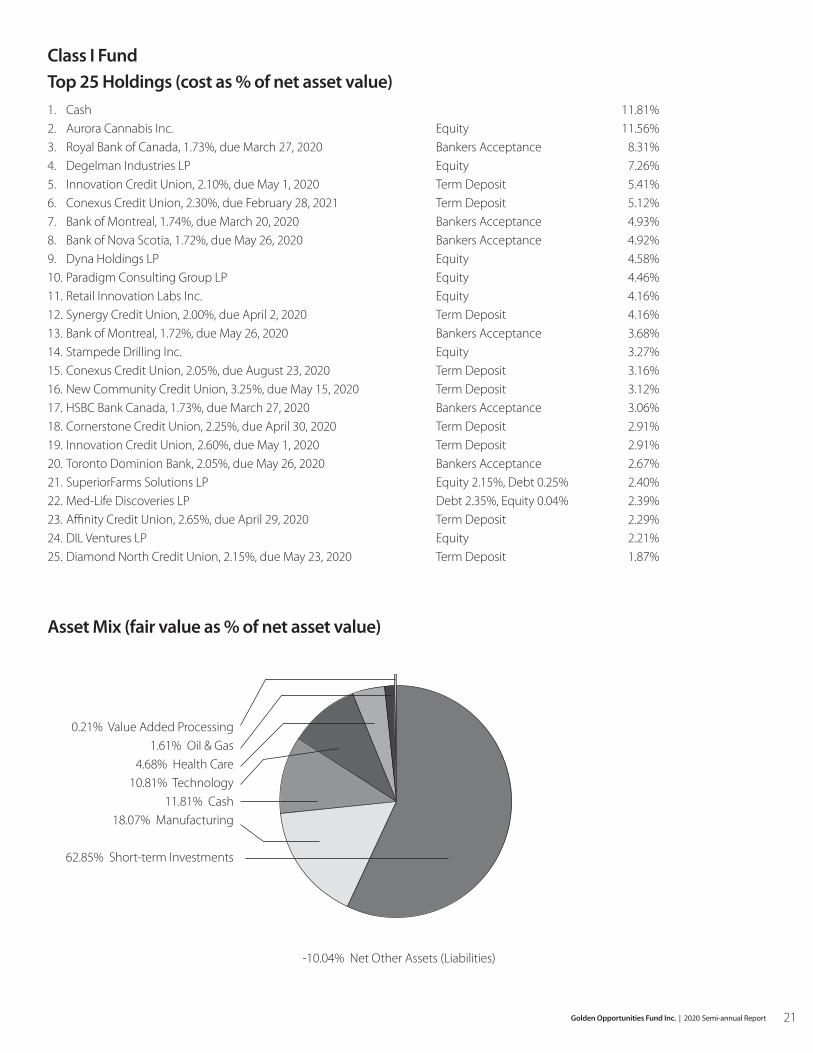
Class I FundTop 25 Holdings (cost as % of net asset value)1. Cash 11.81%2. Aurora Cannabis Inc. Equity 11.56%3. Royal Bank of Canada, 1.73%, due March 27, 2020 Bankers Acceptance 8.31%4. Degelman Industries LP Equity 7.26%5. Innovation Credit Union, 2.10%, due May 1, 2020 Term Deposit 5.41%6. Conexus Credit Union, 2.30%, due February 28, 2021 Term Deposit 5.12%7. Bank of Montreal, 1.74%, due March 20, 2020 Bankers Acceptance 4.93%8. Bank of Nova Scotia, 1.72%, due May 26, 2020 Bankers Acceptance 4.92%9. Dyna Holdings LP Equity 4.58%10. Paradigm Consulting Group LP Equity 4.46%11. Retail Innovation Labs Inc. Equity 4.16%12. Synergy Credit Union, 2.00%, due April 2, 2020 Term Deposit 4.16%13. Bank of Montreal, 1.72%, due May 26, 2020 Bankers Acceptance 3.68%14. Stampede Drilling Inc. Equity 3.27%15. Conexus Credit Union, 2.05%, due August 23, 2020 Term Deposit 3.16%16. New Community Credit Union, 3.25%, due May 15, 2020 Term Deposit 3.12%17. HSBC Bank Canada, 1.73%, due March 27, 2020 Bankers Acceptance 3.06%18. Cornerstone Credit Union, 2.25%, due April 30, 2020 Term Deposit 2.91%19. Innovation Credit Union, 2.60%, due May 1, 2020 Term Deposit 2.91%20. Toronto Dominion Bank, 2.05%, due May 26, 2020 Bankers Acceptance 2.67%21. SuperiorFarms Solutions LP Equity 2.15%, Debt 0.25% 2.40%22. Med-Life Discoveries LP Debt 2.35%, Equity 0.04% 2.39%23. Affinity Credit Union, 2.65%, due April 29, 2020 Term Deposit 2.29%24. DIL Ventures LP Equity 2.21%25. Diamond North Credit Union, 2.15%, due May 23, 2020 Term Deposit 1.87%
Asset Mix (fair value as % of net asset value)
0.21% Value Added Processing1.61% Oil & Gas
4.68% Health Care 10.81% Technology
11.81% Cash 18.07% Manufacturing
62.85% Short-term Investments
-10.04% Net Other Assets (Liabilities)
21
Golden Opportunities Fund Inc. | 2020 Semi-annual Report
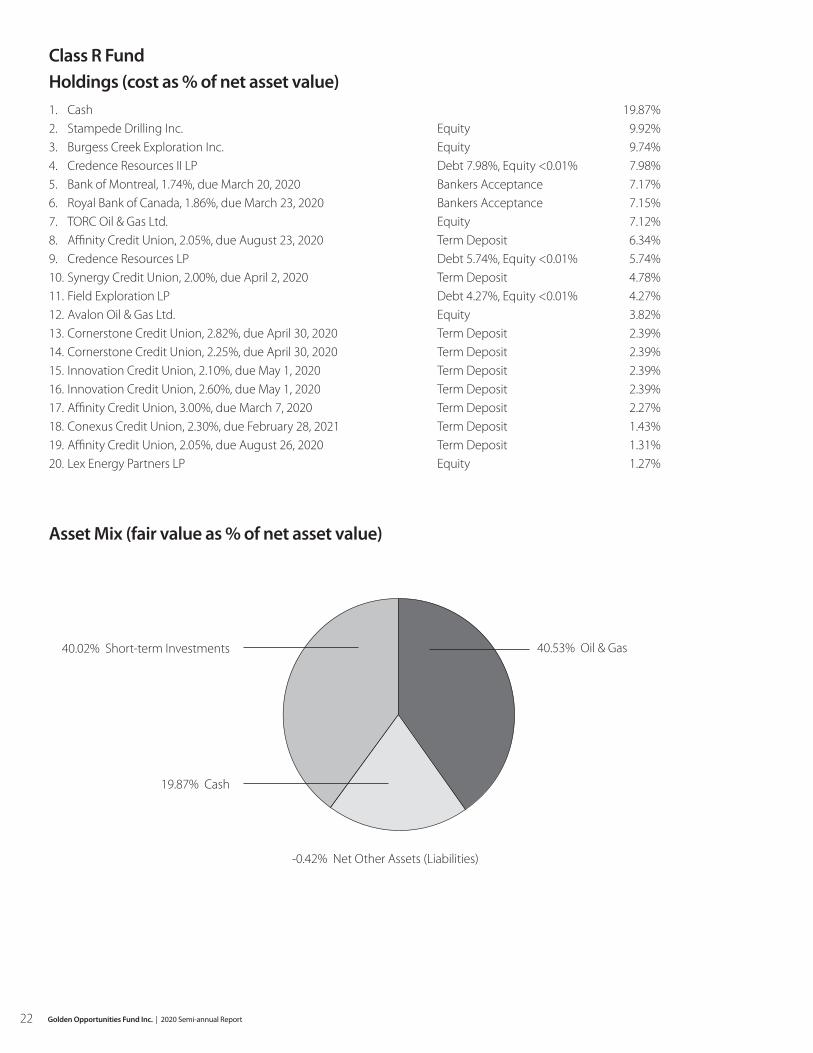
Class R FundHoldings (cost as % of net asset value)1. Cash 19.87%2. Stampede Drilling Inc. Equity 9.92%3. Burgess Creek Exploration Inc. Equity 9.74%4. Credence Resources II LP Debt 7.98%, Equity <0.01% 7.98%5. Bank of Montreal, 1.74%, due March 20, 2020 Bankers Acceptance 7.17%6. Royal Bank of Canada, 1.86%, due March 23, 2020 Bankers Acceptance 7.15%7. TORC Oil & Gas Ltd. Equity 7.12%8. Affinity Credit Union, 2.05%, due August 23, 2020 Term Deposit 6.34%9. Credence Resources LP Debt 5.74%, Equity <0.01% 5.74%10. Synergy Credit Union, 2.00%, due April 2, 2020 Term Deposit 4.78%11. Field Exploration LP Debt 4.27%, Equity <0.01% 4.27%12. Avalon Oil & Gas Ltd. Equity 3.82%13. Cornerstone Credit Union, 2.82%, due April 30, 2020 Term Deposit 2.39%14. Cornerstone Credit Union, 2.25%, due April 30, 2020 Term Deposit 2.39%15. Innovation Credit Union, 2.10%, due May 1, 2020 Term Deposit 2.39%16. Innovation Credit Union, 2.60%, due May 1, 2020 Term Deposit 2.39%17. Affinity Credit Union, 3.00%, due March 7, 2020 Term Deposit 2.27%18. Conexus Credit Union, 2.30%, due February 28, 2021 Term Deposit 1.43%19. Affinity Credit Union, 2.05%, due August 26, 2020 Term Deposit 1.31%20. Lex Energy Partners LP Equity 1.27%
Asset Mix (fair value as % of net asset value)
40.53% Oil & Gas
19.87% Cash
40.02% Short-term Investments
-0.42% Net Other Assets (Liabilities)
22 Golden Opportunities Fund Inc. | 2020 Semi-annual Report
Golden Opportunities Fund Inc.Condensed Interim Financial Statements For the six months ended February 29, 2020 (Unaudited)
23
Golden Opportunities Fund Inc. | 2020 Semi-annual Report

CONDENSED INTERIM STATEMENTS OF FINANCIAL POSITION (UNAUDITED)(in thousands of Canadian dollars except number of shares and per share amounts)
February 29, 2020 August 31, 2019Class A Class I Class R Total Class A Class I Class R Total
ASSETSCash $ 31,616 $ 5,674 $ 1,662 $38,952 $ 24,476 $ 6,126 $ 1,456 $ 32,058 Short-term investments 25,777 30,206 3,348 59,331 77,539 31,954 3,548 113,041 Subscriptions receivable 2,753 608 26 3,387 184 34 9 227 Interest and other receivables 3,075 793 34 3,902 2,874 610 25 3,509 Venture investments 233,895 17,003 3,391 254,289 213,315 14,741 3,781 231,837
297,116 54,284 8,461 359,861 318,388 53,465 8,819 380,672 LIABILITIESAccounts payable and accrued liabilities 1,488 450 93 2,031 2,577 417 113 3,107 Redemptions payable 1,543 106 2 1,651 217 21 - 238 Loss support program contributions and advances - 2,435 - 2,435 - 2,448 - 2,448 Incentive participation amount payable (Note 7(g)) 19,171 2,546 - 21,717 19,130 2,541 - 21,671 Contingent incentive participation amount (Note 7(g)) 13,303 686 - 13,989 17,115 1,166 - 18,281
35,505 6,223 95 41,823 39,039 6,593 113 45,745 Total net assets attributable to holders of redeemable shares $ 261,611 $ 48,061 $ 8,366 $ 318,038 $ 279,349 $ 46,872 $ 8,706 $ 334,927
Net assets attributable to holders of redeemable shares Class A $ 253,387 $ 273,115 Class A-F 8,224 6,234 Class I $ 47,143 $ 46,211 Class I-F 918 661 Class R $ 8,353 $ 8,697 Class R-F 13 9
$261,611 $48,061 $8,366 $ 279,349 $ 46,872 $ 8,706
Number of redeemable shares outstanding (Note 5)
Class A 16,174,431 16,518,133 Class A-F 463,023 332,335 Class I 3,297,848 3,073,400 Class I-F 54,115 36,964 Class R 1,167,086 1,136,928 Class R-F 1,491 920
Net assets attributable to holders of redeemable shares per share (Note 6) Class A $ 15.67 $ 16.53 Class A-F 17.76 18.76 Class I $ 14.30 $ 15.04 Class I-F 16.96 17.87 Class R $ 7.16 $ 7.65 Class R-F 8.37 8.83
Approved by the Board
_________________________________ Chair _____________________________ Director
Brian L. Barber Douglas W. Banzet
See accompanying notes.
24 Golden Opportunities Fund Inc. | 2020 Semi-annual Report

CONDENSED INTERIM STATEMENTS OF COMPREHENSIVE INCOME (UNAUDITED)(in thousands of Canadian dollars except per share amounts)
Six months ended February 29, 2020 Six months ended February 28, 2019Class A Class I Class R Total Class A Class I Class R Total
IncomePartnership income $ 3,150 $ 180 $ - $ 3,330 $ 10,182 $ 918 $ - $ 11,100 Interest income for distribution purposes 1,318 392 44 1,754 1,278 355 34 1,667 Dividend income 51 - 12 63 85 - 10 95 Increase in unrealized loss recovery - 12 - 12 - 301 - 301 Other changes in fair value of venture investments Net realized (loss) gain (458) 24 - (434) 2,183 240 - 2,423 Net (increase) decrease in unrealized depreciation of venture investments (15,522) (2,277) (390) (18,189) (475) 788 (200) 113
(11,461) (1,669) (334) (13,464) 13,253 2,602 (156) 15,699 ExpensesAdministration fees 342 42 13 397 328 49 16 393 Audit fees 49 11 3 63 45 13 4 62 Custodian fees 65 12 6 83 63 11 6 80 Directors' fees and expenses 7 3 1 11 5 3 1 9 Incentive participation amount (Note 7(g)) 41 5 - 46 6,890 991 - 7,881 (Decrease) increase in contingent incentive participation amount (Note 7(g)) (3,812) (480) - (4,292) (3,843) (574) - (4,417)Legal fees 404 54 1 459 122 31 1 154 Management fees (Note 7(a)) 3,718 601 115 4,434 3,989 579 107 4,675 Marketing service fees (Note 7(f )) 230 59 3 292 230 47 4 281 Office expenses 14 3 2 19 20 6 - 26 Other expenses 99 26 8 133 40 17 8 65 Percentage based payments and amortized commissions (Notes 7(c) and 7(d)) 1,045 175 53 1,273 1,061 152 51 1,264 Share issue costs 208 17 5 230 182 38 13 233 Shareholder reporting costs 84 15 5 104 61 14 5 80 Trailing commissions (Note 7(b)) 661 113 21 795 721 106 20 847 Transaction costs - - - - 53 7 - 60
3,155 656 236 4,047 9,967 1,490 236 11,693 Total (decrease) increase in net assets attributable to holders of redeemable shares before undernoted items (14,616) (2,325) (570) (17,511) 3,286 1,112 (392) 4,006
Management fees waived (Note 7(a)) - - - - 169 13 - 182 Marketing service fees recovered (Note 7(f )) - - - - 41 4 - 45 Total (decrease) increase in net assets attributable to holders of redeemable shares from operations $ (14,616) $ (2,325) $ (570) $ (17,511) $ 3,496 $ 1,129 $ (392) $ 4,233 (Decrease) increase in net assets attributable to holders of redeemable shares from operations Class A $ (14,253) $ 3,385 Class A-F (363) 111 Class I $ (2,290) $ 1,105 Class I-F (35) 24 Class R $ (569) $ (392) Class R-F (1) -
$ (14,616) $ (2,325) $ (570) $ 3,496 $ 1,129 $ (392)
(Decrease) increase in net assets attributable to holders of redeemable shares from operations per share Class A $ (0.87) $ 0.20 Class A-F (1.03) 0.47 Class I $ (0.74) $ 0.39 Class I-F (0.86) 0.94 Class R $ (0.50) $ (0.36) Class R-F (0.60) (0.21)
See accompanying notes.
25
Golden Opportunities Fund Inc. | 2020 Semi-annual Report
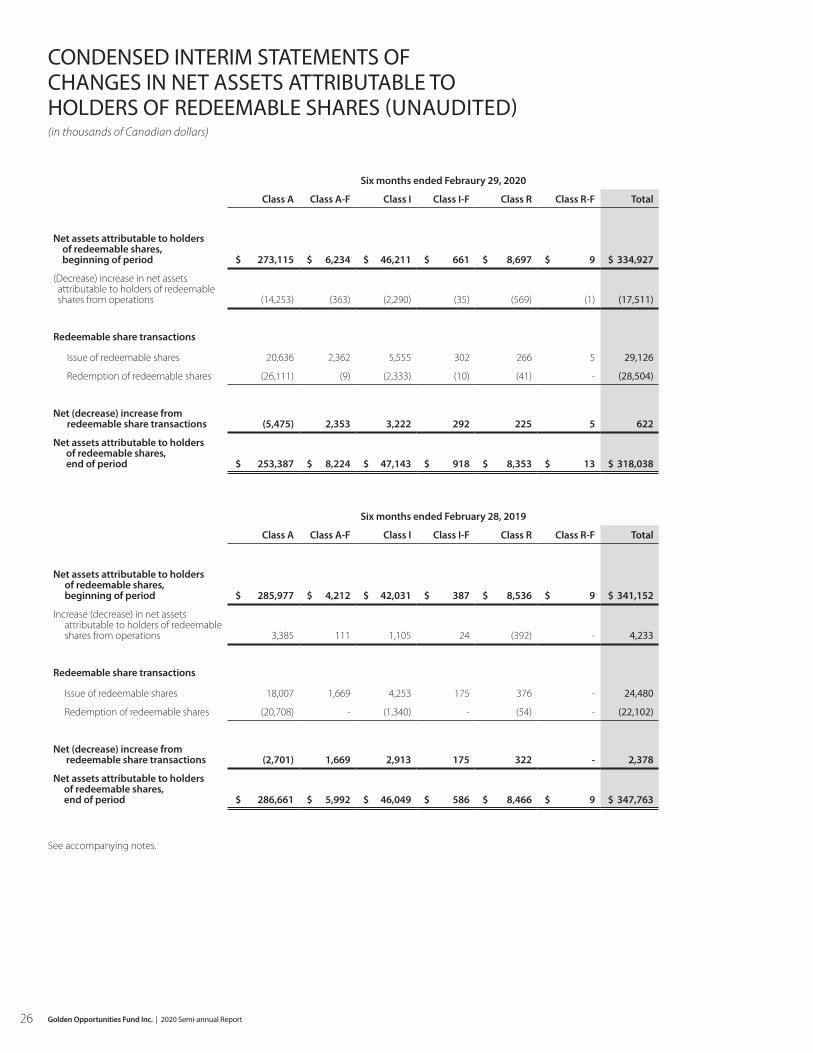
CONDENSED INTERIM STATEMENTS OF CHANGES IN NET ASSETS ATTRIBUTABLE TO HOLDERS OF REDEEMABLE SHARES (UNAUDITED)(in thousands of Canadian dollars)
Six months ended Febraury 29, 2020
Class A Class A-F Class I Class I-F Class R Class R-F Total
Net assets attributable to holders of redeemable shares, beginning of period $ 273,115 $ 6,234 $ 46,211 $ 661 $ 8,697 $ 9 $ 334,927
(Decrease) increase in net assets attributable to holders of redeemable shares from operations (14,253) (363) (2,290) (35) (569) (1) (17,511)
Redeemable share transactions
Issue of redeemable shares 20,636 2,362 5,555 302 266 5 29,126
Redemption of redeemable shares (26,111) (9) (2,333) (10) (41) - (28,504)
Net (decrease) increase from redeemable share transactions (5,475) 2,353 3,222 292 225 5 622
Net assets attributable to holders of redeemable shares, end of period $ 253,387 $ 8,224 $ 47,143 $ 918 $ 8,353 $ 13 $ 318,038
Six months ended February 28, 2019
Class A Class A-F Class I Class I-F Class R Class R-F Total
Net assets attributable to holders of redeemable shares, beginning of period $ 285,977 $ 4,212 $ 42,031 $ 387 $ 8,536 $ 9 $ 341,152
Increase (decrease) in net assets attributable to holders of redeemable shares from operations 3,385 111 1,105 24 (392) - 4,233
Redeemable share transactions
Issue of redeemable shares 18,007 1,669 4,253 175 376 - 24,480
Redemption of redeemable shares (20,708) - (1,340) - (54) - (22,102)
Net (decrease) increase from redeemable share transactions (2,701) 1,669 2,913 175 322 - 2,378
Net assets attributable to holders of redeemable shares, end of period $ 286,661 $ 5,992 $ 46,049 $ 586 $ 8,466 $ 9 $ 347,763
See accompanying notes.
26 Golden Opportunities Fund Inc. | 2020 Semi-annual Report

CONDENSED INTERIM STATEMENTS OF CASH FLOWS (UNAUDITED)(in thousands of Canadian dollars)
Six months ended February 29, 2020 Six months ended February 28, 2019
Class A Class I Class R Total Class A Class I Class R Total
Cash flows from (used in) operating activities
(Decrease) increase in net assets attributable to holders of redeemable shares from operations $ (14,616) $ (2,325) $ (570) $ (17,511) $ 3,496 $ 1,129 $(392) $ 4,233
Adjustments for non-cash items:
Partnership income (3,150) (180) - (3,330) (10,182) (918) - (11,100)
Net realized loss (gain) on disposition of venture investments 458 (24) - 434 (2,183) (240) - (2,423)
Net increase (decrease) in unrealized depreciation of venture investments 15,522 2,277 390 18,189 475 (788) 200 (113)
Venture investments purchased (42,125) (4,790) - (46,915) (16,877) (2,033) - (18,910)
Venture investments repaid 262 - - 262 - - - -
Partnership distributions 8,016 431 - 8,447 9,605 802 - 10,407
Proceeds on disposition of venture investments 437 24 - 461 33,766 4,649 - 38,415
Purchase of short-term investments (48,152) (56,728) (5,752) (110,632) (185,743) (47,935) (3,656) (237,334)
Maturity of short-term investments 99,914 58,476 5,952 164,342 166,238 41,498 3,511 211,247
Net change in non-cash balances (5,061) (638) (29) (5,728) 1,874 45 (35) 1,884
11,505 (3,477) (9) 8,019 469 (3,791) (372) (3,694)
Cash flows (used in) from financing activities
Proceeds from issue of redeemable shares 20,429 5,283 254 25,966 19,831 4,477 385 24,693
Amounts paid on redemption of redeemable shares (24,794) (2,258) (39) (27,091) (20,872) (1,352) (54) (22,278)
(4,365) 3,025 215 (1,125) (1,041) 3,125 331 2,415
Net increase (decrease) in cash 7,140 (452) 206 6,894 (572) (666) (41) (1,279)
Cash, beginning of year 24,476 6,126 1,456 32,058 32,130 7,304 1,674 41,108
Cash, end of period $ 31,616 $ 5,674 $ 1,662 $ 38,952 $ 31,558 $ 6,638 $ 1,633 $ 39,829
Supplemental cash flow information
Interest received $ 1,100 $ 208 $ 34 $ 1,342 $ 782 $ 152 $ 23 $ 957
Dividends received 89 - 12 101 85 - 10 95
See accompanying notes.
27
Golden Opportunities Fund Inc. | 2020 Semi-annual Report
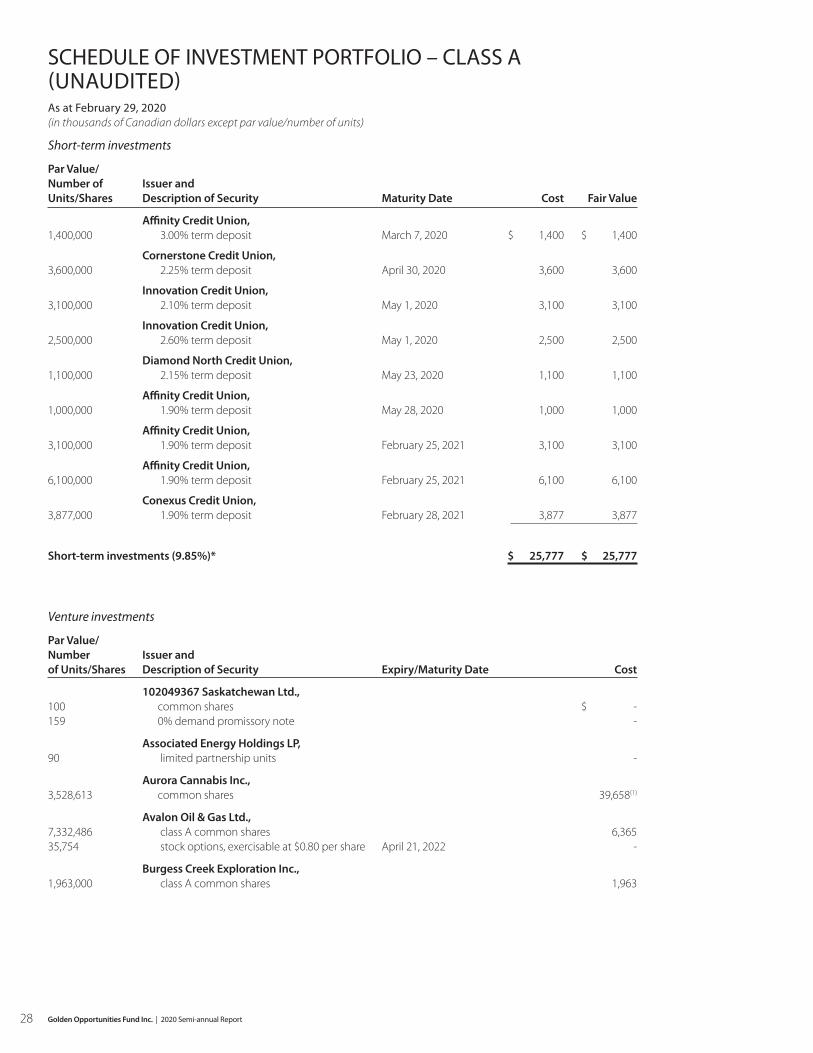
SCHEDULE OF INVESTMENT PORTFOLIO – CLASS A (UNAUDITED) As at February 29, 2020(in thousands of Canadian dollars except par value/number of units)
Short-term investments
Par Value/ Number of Issuer and Units/Shares Description of Security Maturity Date Cost Fair Value
Affinity Credit Union, 1,400,000 3.00% term deposit March 7, 2020 $ 1,400 $ 1,400
Cornerstone Credit Union, 3,600,000 2.25% term deposit April 30, 2020 3,600 3,600
Innovation Credit Union, 3,100,000 2.10% term deposit May 1, 2020 3,100 3,100
Innovation Credit Union, 2,500,000 2.60% term deposit May 1, 2020 2,500 2,500
Diamond North Credit Union, 1,100,000 2.15% term deposit May 23, 2020 1,100 1,100
Affinity Credit Union, 1,000,000 1.90% term deposit May 28, 2020 1,000 1,000
Affinity Credit Union, 3,100,000 1.90% term deposit February 25, 2021 3,100 3,100
Affinity Credit Union, 6,100,000 1.90% term deposit February 25, 2021 6,100 6,100
Conexus Credit Union, 3,877,000 1.90% term deposit February 28, 2021 3,877 3,877
Short-term investments (9.85%)* $ 25,777 $ 25,777
Venture investments
Par Value/ Number Issuer and of Units/Shares Description of Security Expiry/Maturity Date Cost
102049367 Saskatchewan Ltd., 100 common shares $ - 159 0% demand promissory note -
Associated Energy Holdings LP, 90 limited partnership units -
Aurora Cannabis Inc., 3,528,613 common shares 39,658(1)
Avalon Oil & Gas Ltd., 7,332,486 class A common shares 6,365 35,754 stock options, exercisable at $0.80 per share April 21, 2022 -
Burgess Creek Exploration Inc., 1,963,000 class A common shares 1,963
28 Golden Opportunities Fund Inc. | 2020 Semi-annual Report

SCHEDULE OF INVESTMENT PORTFOLIO – CLASS A (UNAUDITED) As at February 29, 2020(in thousands of Canadian dollars except par value/number of units)
Venture investments (continued)
Par Value/ Number Issuer and of Units/Shares Description of Security Expiry/Maturity Date Cost
Can Pro Capital Corp., 3,800 class A common shares $ 4 3,329,838 0% demand debenture 3,330
Can Pro Ingredients Ltd., 19,117,629,955 class A common shares 7,257 2,250,000 15% demand debenture 2,250
Credence Resources Inc., 1 class A common share - 100,000 class B common shares 100
Credence Resources LP, 1 series 2A limited partnership unit - 1 series 2B limited partnership unit - 1 series 4A limited partnership unit - 1 series 5A limited partnership unit - 1 series 5B limited partnership unit - 1 series 5D limited partnership unit - 1 series 6A limited partnership unit - 1 series 7A limited partnership unit - 14,633,169 variable rate participating loan 14,633
Credence Resources II Inc., 1 class A common share - 100,000 class B common shares 100
Credence Resources II LP, 1 series 2A limited partnership unit - 1 series 4A limited partnership unit - 1 series 5A limited partnership unit - 11,059,843 variable rate participating loan 11,060
Degelman Industries LP, 20,693,902 limited partnership units 20,694
Diamond House Inc., 46 class A common shares -
DIL Ventures LP, 6,306,098 limited partnership units 6,306
Dyna Holdings GP Inc., 50 class A common shares -
Dyna Holdings LP, 10,675,971 limited partnership units 12,343
29
Golden Opportunities Fund Inc. | 2020 Semi-annual Report
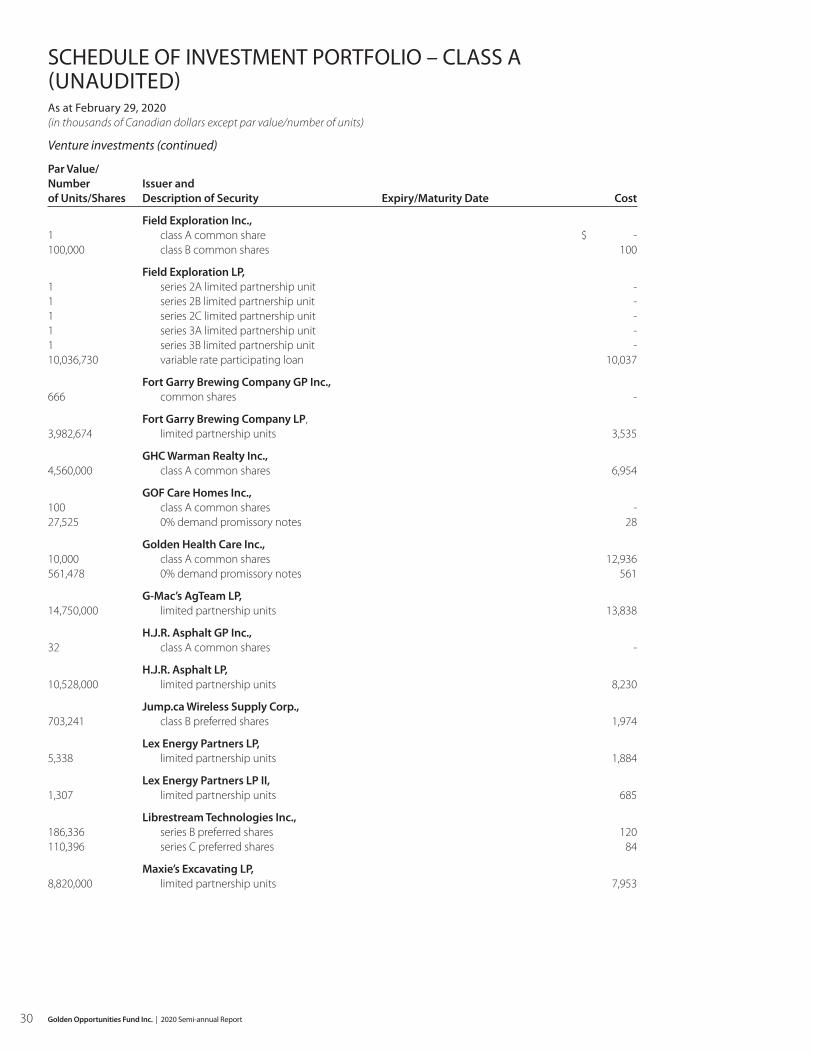
SCHEDULE OF INVESTMENT PORTFOLIO – CLASS A (UNAUDITED) As at February 29, 2020(in thousands of Canadian dollars except par value/number of units)
Venture investments (continued)
Par Value/ Number Issuer and of Units/Shares Description of Security Expiry/Maturity Date Cost
Field Exploration Inc., 1 class A common share $ - 100,000 class B common shares 100
Field Exploration LP, 1 series 2A limited partnership unit - 1 series 2B limited partnership unit - 1 series 2C limited partnership unit - 1 series 3A limited partnership unit - 1 series 3B limited partnership unit - 10,036,730 variable rate participating loan 10,037
Fort Garry Brewing Company GP Inc., 666 common shares -
Fort Garry Brewing Company LP, 3,982,674 limited partnership units 3,535
GHC Warman Realty Inc., 4,560,000 class A common shares 6,954
GOF Care Homes Inc., 100 class A common shares - 27,525 0% demand promissory notes 28
Golden Health Care Inc., 10,000 class A common shares 12,936 561,478 0% demand promissory notes 561
G-Mac’s AgTeam LP, 14,750,000 limited partnership units 13,838
H.J.R. Asphalt GP Inc., 32 class A common shares -
H.J.R. Asphalt LP, 10,528,000 limited partnership units 8,230
Jump.ca Wireless Supply Corp., 703,241 class B preferred shares 1,974
Lex Energy Partners LP, 5,338 limited partnership units 1,884
Lex Energy Partners LP II, 1,307 limited partnership units 685
Librestream Technologies Inc., 186,336 series B preferred shares 120 110,396 series C preferred shares 84
Maxie’s Excavating LP, 8,820,000 limited partnership units 7,953
30 Golden Opportunities Fund Inc. | 2020 Semi-annual Report
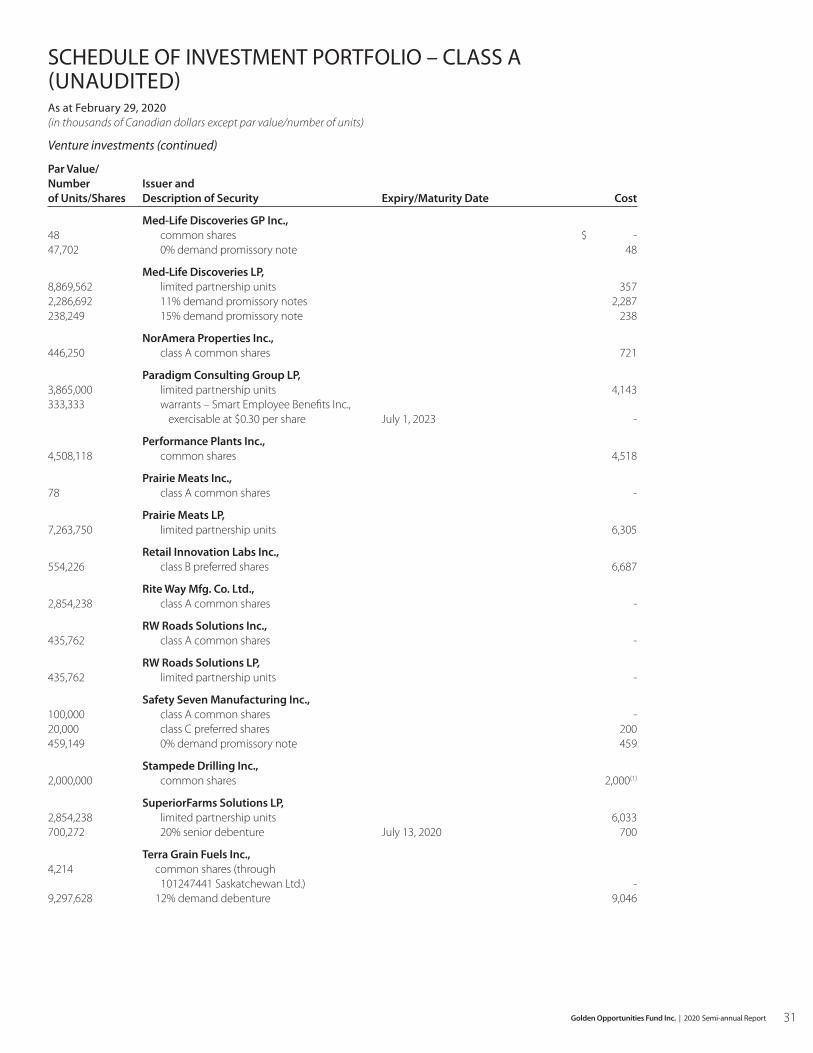
SCHEDULE OF INVESTMENT PORTFOLIO – CLASS A (UNAUDITED) As at February 29, 2020(in thousands of Canadian dollars except par value/number of units)
Venture investments (continued)
Par Value/ Number Issuer and of Units/Shares Description of Security Expiry/Maturity Date Cost
Med-Life Discoveries GP Inc., 48 common shares $ - 47,702 0% demand promissory note 48
Med-Life Discoveries LP, 8,869,562 limited partnership units 357 2,286,692 11% demand promissory notes 2,287 238,249 15% demand promissory note 238
NorAmera Properties Inc., 446,250 class A common shares 721
Paradigm Consulting Group LP, 3,865,000 limited partnership units 4,143 333,333 warrants – Smart Employee Benefits Inc., exercisable at $0.30 per share July 1, 2023 -
Performance Plants Inc., 4,508,118 common shares 4,518
Prairie Meats Inc., 78 class A common shares -
Prairie Meats LP, 7,263,750 limited partnership units 6,305
Retail Innovation Labs Inc., 554,226 class B preferred shares 6,687
Rite Way Mfg. Co. Ltd., 2,854,238 class A common shares -
RW Roads Solutions Inc., 435,762 class A common shares -
RW Roads Solutions LP, 435,762 limited partnership units -
Safety Seven Manufacturing Inc., 100,000 class A common shares - 20,000 class C preferred shares 200 459,149 0% demand promissory note 459
Stampede Drilling Inc., 2,000,000 common shares 2,000(1)
SuperiorFarms Solutions LP, 2,854,238 limited partnership units 6,033 700,272 20% senior debenture July 13, 2020 700
Terra Grain Fuels Inc., 4,214 common shares (through 101247441 Saskatchewan Ltd.) - 9,297,628 12% demand debenture 9,046
31
Golden Opportunities Fund Inc. | 2020 Semi-annual Report

SCHEDULE OF INVESTMENT PORTFOLIO – CLASS A (UNAUDITED) As at February 29, 2020(in thousands of Canadian dollars except par value/number of units)
Venture investments (continued)
Par Value/ Number of Issuer and Units/Shares Description of Security Expiry/Maturity Date Cost
TORC Oil & Gas Ltd., 336,819 common shares $ 2,607(1)
Warman Home Centre Inc., 41 class A common shares -
Warman Home Centre LP, 13,785,429 class A limited partnership units 24,422
Western Building Centres Limited, 7,462,285 class A common shares 47 5,451,383 class F preferred shares 5,451 4,750,000 class G preferred shares 4,750 713,070 15% demand promissory note 713
WestMan Exploration Ltd., 800,000 common shares 800
Venture investments at cost (106.08%)* $ 277,514 Unrealized depreciation of venture investments (43,619)
Venture investments at fair value (89.41%)* $ 233,895
* Percentages shown relate amounts to total net assets attributable to holders of redeemable shares of the Class A Fund.
(1)Supplemental disclosure of fair value of public investments listed above Issuer Fair value
Aurora Cannabis Inc. $ 6,387
Stampede Drilling Inc. 370
TORC Oil & Gas Ltd. 1,101
$ 7,858
32 Golden Opportunities Fund Inc. | 2020 Semi-annual Report
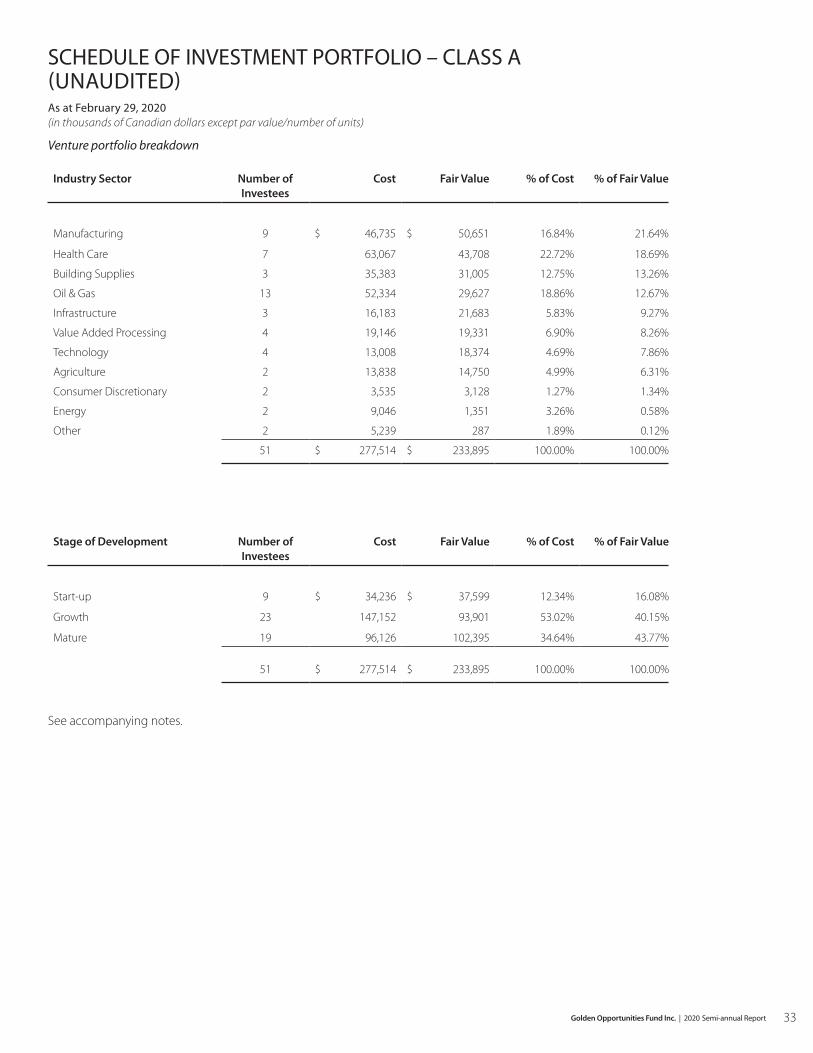
SCHEDULE OF INVESTMENT PORTFOLIO – CLASS A (UNAUDITED) As at February 29, 2020(in thousands of Canadian dollars except par value/number of units)
Venture portfolio breakdown
Industry Sector Number of Investees
Cost Fair Value % of Cost % of Fair Value
Manufacturing 9 $ 46,735 $ 50,651 16.84% 21.64%
Health Care 7 63,067 43,708 22.72% 18.69%
Building Supplies 3 35,383 31,005 12.75% 13.26%
Oil & Gas 13 52,334 29,627 18.86% 12.67%
Infrastructure 3 16,183 21,683 5.83% 9.27%
Value Added Processing 4 19,146 19,331 6.90% 8.26%
Technology 4 13,008 18,374 4.69% 7.86%
Agriculture 2 13,838 14,750 4.99% 6.31%
Consumer Discretionary 2 3,535 3,128 1.27% 1.34%
Energy 2 9,046 1,351 3.26% 0.58%
Other 2 5,239 287 1.89% 0.12%
51 $ 277,514 $ 233,895 100.00% 100.00%
Stage of Development Number of Investees
Cost Fair Value % of Cost % of Fair Value
Start-up 9 $ 34,236 $ 37,599 12.34% 16.08%
Growth 23 147,152 93,901 53.02% 40.15%
Mature 19 96,126 102,395 34.64% 43.77%
51 $ 277,514 $ 233,895 100.00% 100.00%
See accompanying notes.
33
Golden Opportunities Fund Inc. | 2020 Semi-annual Report

SCHEDULE OF INVESTMENT PORTFOLIO – CLASS I (UNAUDITED) As at February 29, 2020(in thousands of Canadian dollars except par value/number of units)
Short-term investments
Par Value/ Number of Issuer and Units/Shares Description of Security Maturity Date Cost Fair Value
Conexus Credit Union, 425,000 2.30% term deposit March 15, 2020 $ 425 $ 425
Bank of Montreal, 2,370,509 bankers acceptance March 20, 2020 2,370 2,370
Royal Bank of Canada, 3,994,520 bankers acceptance March 27, 2020 3,995 3,995
HSBC Bank Canada, 1,472,979 bankers acceptance March 27, 2020 1,473 1,473
Synergy Credit Union, 2,000,000 2.00% term deposit April 2, 2020 2,000 2,000
Affinity Credit Union, 1,100,000 2.65% term deposit April 29, 2020 1,100 1,100
Cornerstone Credit Union, 600,000 2.82% term deposit April 30, 2020 600 600
Cornerstone Credit Union, 1,400,000 2.25% term deposit April 30, 2020 1,400 1,400
Innovation Credit Union, 2,600,000 2.10% term deposit May 1, 2020 2,600 2,600
Innovation Credit Union, 1,400,000 2.60% term deposit May 1, 2020 1,400 1,400
Diamond North Credit Union, 900,000 2.15% term deposit May 23, 2020 900 900
New Community Credit Union, 1,500,00 3.25% term deposit May 15, 2020 1,500 1,500
Bank of Nova Scotia, 2,367,064 bankers acceptance May 26, 2020 2,367 2,367
Toronto Dominion Bank, 1,283,463 bankers acceptance May 26, 2020 1,283 1,283
Bank of Montreal, 1,769,572 bankers acceptance May 26, 2020 1,770 1,770
Conexus Credit Union, 1,520,000 2.05% term deposit August 23, 2020 1,520 1,520
Affinity Credit Union, 670,000 2.05% term deposit August 26, 2020 670 670
Conexus Credit Union, 2,460,000 2.30% term deposit February 28, 2021 2,460 2,460
Affinity Credit Union, 373,550 2.05% term deposit February 28, 2021 373 373
Short-term investments (62.92%)** $ 30,206 $ 30,206
34 Golden Opportunities Fund Inc. | 2020 Semi-annual Report
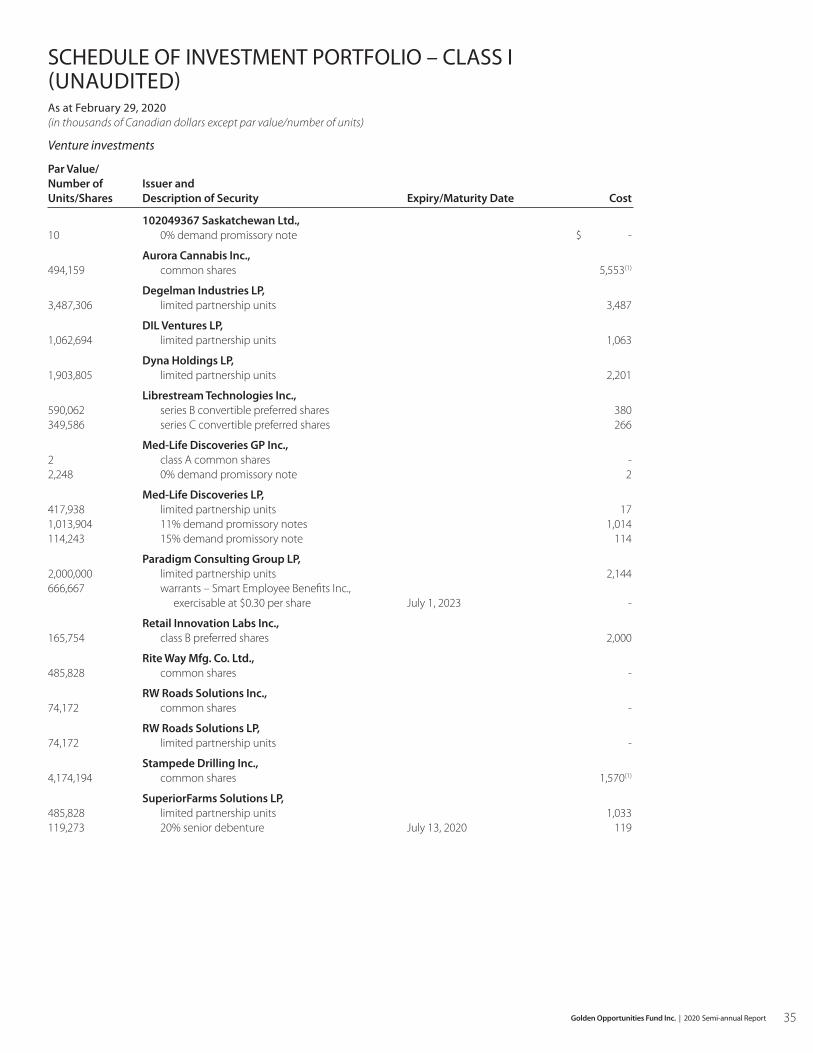
SCHEDULE OF INVESTMENT PORTFOLIO – CLASS I (UNAUDITED) As at February 29, 2020(in thousands of Canadian dollars except par value/number of units)
Venture investments
Par Value/ Number of Issuer and Units/Shares Description of Security Expiry/Maturity Date Cost
102049367 Saskatchewan Ltd., 10 0% demand promissory note $ -
Aurora Cannabis Inc., 494,159 common shares 5,553(1)
Degelman Industries LP, 3,487,306 limited partnership units 3,487
DIL Ventures LP, 1,062,694 limited partnership units 1,063
Dyna Holdings LP, 1,903,805 limited partnership units 2,201
Librestream Technologies Inc., 590,062 series B convertible preferred shares 380 349,586 series C convertible preferred shares 266
Med-Life Discoveries GP Inc., 2 class A common shares - 2,248 0% demand promissory note 2
Med-Life Discoveries LP, 417,938 limited partnership units 17 1,013,904 11% demand promissory notes 1,014 114,243 15% demand promissory note 114
Paradigm Consulting Group LP, 2,000,000 limited partnership units 2,144 666,667 warrants – Smart Employee Benefits Inc., exercisable at $0.30 per share July 1, 2023 -
Retail Innovation Labs Inc., 165,754 class B preferred shares 2,000
Rite Way Mfg. Co. Ltd., 485,828 common shares -
RW Roads Solutions Inc., 74,172 common shares -
RW Roads Solutions LP, 74,172 limited partnership units -
Stampede Drilling Inc., 4,174,194 common shares 1,570(1)
SuperiorFarms Solutions LP, 485,828 limited partnership units 1,033 119,273 20% senior debenture July 13, 2020 119
35
Golden Opportunities Fund Inc. | 2020 Semi-annual Report

SCHEDULE OF INVESTMENT PORTFOLIO – CLASS I (UNAUDITED) As at February 29, 2020(in thousands of Canadian dollars except par value/number of units)
Venture investments (continued)
Par Value/ Number of Issuer and Units/Shares Description of Security Expiry/Maturity Date Cost
TAIV Inc., 20,000 convertible note $ 20
Three Farmers Foods Inc., 100,000 convertible note 100
Venture investments at cost (43.87%)** $ 21,083 Unrealized depreciation of venture investments (4,080)
Venture investments at fair value (35.38%)** $ 17,003
**Percentages shown relate amounts to total net assets attributable to holders of redeemable shares of the Class I Fund.
(1)Supplemental disclosure of fair value of public investments listed above Issuer Fair value
Aurora Cannabis Inc. $ 895
Stampede Drilling Inc. 772 $ 1,667
Venture portfolio breakdown
Industry Sector Number of Investees
Cost Fair Value % of Cost % of Fair Value
Manufacturing 8 $ 7,902 $ 8,684 37.49% 51.07%
Technology 4 4,810 5,196 22.81% 30.56%
Health Care 3 6,701 2,251 31.78% 13.24%
Oil & Gas 1 1,570 772 7.45% 4.54%
Value Added Processing 1 100 100 0.47% 0.59%
17 $ 21,083 $ 17,003 100.00% 100.00%
Stage of Development Number of Investees
Cost Fair Value % of Cost % of Fair Value
Start-up 5 $ 1,267 $ 1,476 6.01% 8.68%
Growth 8 13,064 8,095 61.96% 47.61%
Mature 4 6,752 7,432 32.03% 43.71%
17 $ 21,083 $ 17,003 100.00% 100.00%
See accompanying notes.
36 Golden Opportunities Fund Inc. | 2020 Semi-annual Report

SCHEDULE OF INVESTMENT PORTFOLIO – CLASS R (UNAUDITED) As at February 29, 2020(in thousands of Canadian dollars except par value/number of units)
Short-term investments
Par Value/ Number of Issuer and Units/Shares Description of Security Maturity Date Cost Fair Value
Affinity Credit Union, 190,000 3.00% term deposit March 7, 2020 $ 190 $ 190
Bank of Montreal, 599,370 bankers acceptance March 20, 2020 600 600
Royal Bank of Canada, 598,140 bankers acceptance March 23, 2020 598 598
Synergy Credit Union, 400,000 2.00% term deposit April 2, 2020 400 400
Cornerstone Credit Union, 200,000 2.82% term deposit April 30, 2020 200 200
Cornerstone Credit Union, 200,000 2.25% term deposit April 30, 2020 200 200
Innovation Credit Union, 200,000 2.10% term deposit May 1, 2020 200 200
Innovation Credit Union, 200,000 2.60% term deposit May 1, 2020 200 200
Affinity Credit Union, 530,000 2.05% term deposit August 23, 2020 530 530
Affinity Credit Union, 110,000 2.05% term deposit August 26, 2020 110 110
Conexus Credit Union, 120,000 2.30% term deposit February 28, 2021 120 120
Short-term investments (40.02%)*** $ 3,348 $ 3,348
37
Golden Opportunities Fund Inc. | 2020 Semi-annual Report
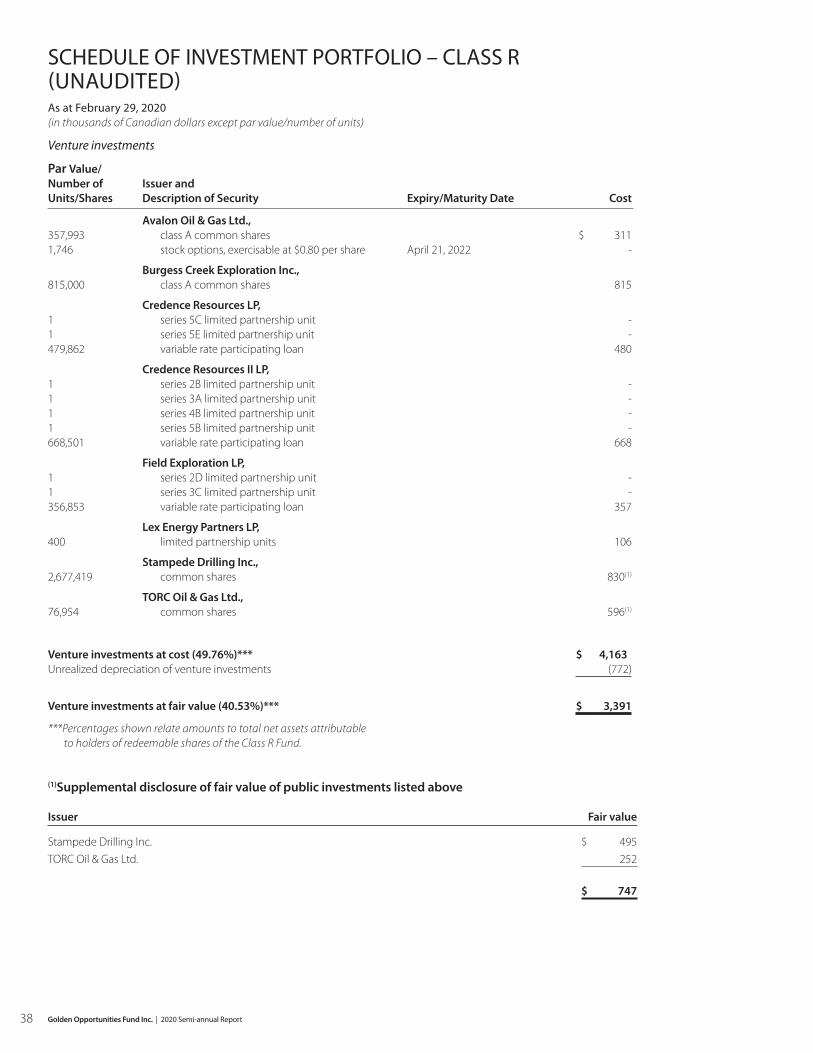
SCHEDULE OF INVESTMENT PORTFOLIO – CLASS R (UNAUDITED) As at February 29, 2020(in thousands of Canadian dollars except par value/number of units)
Venture investments
Par Value/ Number of Issuer and Units/Shares Description of Security Expiry/Maturity Date Cost
Avalon Oil & Gas Ltd., 357,993 class A common shares $ 311 1,746 stock options, exercisable at $0.80 per share April 21, 2022 -
Burgess Creek Exploration Inc., 815,000 class A common shares 815
Credence Resources LP, 1 series 5C limited partnership unit - 1 series 5E limited partnership unit - 479,862 variable rate participating loan 480
Credence Resources II LP, 1 series 2B limited partnership unit - 1 series 3A limited partnership unit - 1 series 4B limited partnership unit - 1 series 5B limited partnership unit - 668,501 variable rate participating loan 668
Field Exploration LP, 1 series 2D limited partnership unit - 1 series 3C limited partnership unit - 356,853 variable rate participating loan 357
Lex Energy Partners LP, 400 limited partnership units 106
Stampede Drilling Inc., 2,677,419 common shares 830(1)
TORC Oil & Gas Ltd., 76,954 common shares 596(1)
Venture investments at cost (49.76%)*** $ 4,163 Unrealized depreciation of venture investments (772)
Venture investments at fair value (40.53%)*** $ 3,391
***Percentages shown relate amounts to total net assets attributable to holders of redeemable shares of the Class R Fund.
(1)Supplemental disclosure of fair value of public investments listed above Issuer Fair value
Stampede Drilling Inc. $ 495
TORC Oil & Gas Ltd. 252 $ 747
38 Golden Opportunities Fund Inc. | 2020 Semi-annual Report

SCHEDULE OF INVESTMENT PORTFOLIO – CLASS R (UNAUDITED) As at February 29, 2020(in thousands of Canadian dollars except par value/number of units)
Venture portfolio breakdown (1)
Stage of Development Number of Investees
Cost Fair Value % of Cost % of Fair Value
Start-up 3 $ 1,483 $ 1,806 35.62% 53.26%
Growth 4 2,084 1,333 50.06% 39.31%
Mature 1 596 252 14.32% 7.43%
8 $ 4,163 $ 3,391 100.00% 100.00%
(1) All Class R Fund venture investments are in the oil & gas industry sector.
See accompanying notes.
39
Golden Opportunities Fund Inc. | 2020 Semi-annual Report

Notes to the Condensed Interim Financial StatementsFebruary 29, 2020
1. General informationGolden Opportunities Fund Inc. (the “Fund”) was incorporated under the laws of Saskatchewan by Articles of Incorporation dated December 8, 1997. The Fund was registered as an extra-provincial corporation to carry on business under the laws of Manitoba on September 30, 2008. The principal place of business of the Fund is Suite 830, 410 - 22nd Street East, Saskatoon, Saskatchewan.
The Fund is registered as a labour sponsored venture capital corporation under The Labour-sponsored Venture Capital Corporations Act (Saskatchewan) (the “Saskatchewan Act”) and The Labour-Sponsored Venture Capital Corporations Act (Manitoba) (the “Manitoba Act”). The Fund is taxable as a mutual fund corporation and is a prescribed Labour sponsored Venture Capital Corporation under the Income Tax Act (Canada) (the “Federal Act”).
The Fund’s redeemable shares include Class A (SK) shares, Class A-F (SK) shares, Class A (MB) shares, Class A-F (MB) shares, Class I (SK) shares, Class I-F (SK) shares, Class I (MB) shares, Class I-F (MB) shares, Class R (SK) shares, and Class R-F (SK) shares which are issued and redeemed at a continuous offering price equal to the pricing net asset value (“Pricing NAV”) per share for the applicable series. The Fund also has Class R (MB) shares and Class R-F (MB) shares, which have not yet been made available for issue. The separation of shares by province is for legal purposes only but does not affect the net assets attributable to holders of redeemable shares as each class of share has the same rights regardless of the province they are issued in.
The Federal Act and the Saskatchewan Act allow a Saskatchewan resident individual to invest in Class A (SK) shares, Class A-F (SK) shares, Class I (SK) shares, Class I-F (SK) shares, Class R (SK) shares, or Class R-F (SK) shares of the Fund and obtain a personal income tax credit. The Federal Act and the Manitoba Act allow a Manitoba resident individual to invest in Class A (MB) shares, Class A-F (MB) shares, Class I (MB) shares, or Class I-F (MB) shares of the Fund and obtain a personal income tax credit. Investors who request a redemption of shares within the eight-year period following their purchase will, subject to certain exceptions, be subject to a withholding fee equal to the tax credits received on the purchase of such shares.
In these financial statements, the “Class A Fund” includes the Class A (SK) and Class A (MB) shares (together, the “Class A Shares”), and the Class A-F (SK) and Class A-F (MB) shares (together, the “Class A-F Shares”). The “Class I Fund” includes the Class I (SK) and Class I (MB) shares (together, the “Class I Shares”), and the Class I-F (SK) and Class I-F (MB) shares (together, the “Class I-F Shares”). The “Class R Fund” includes the Class R (SK) shares (the “Class R Shares”), and the Class R-F (SK) shares (the “Class R-F Shares”). The Class A-F Shares, Class I-F Shares and Class R-F Shares are collectively referred to as the “F Series”. All the Fund’s shares have, in all material respects, identical rights, redemption features, tax credit eligibility and other attributes, except that the F Series shares have no sales commissions or trailer fees.
The investment objective of the Fund is to maximize shareholder returns through the long-term appreciation of the Fund’s Pricing NAV. The Fund makes investments in small and medium sized eligible Saskatchewan businesses and Manitoba business entities, as defined in the Saskatchewan Act and the Manitoba Act, respectively, with the objective of achieving long term capital appreciation. The Class I Fund is invested in innovation companies, and the Class R Fund in resource companies, rather than a broad cross-section of the economy as is the case with the Class A Fund.
The Fund has retained Westcap Mgt. Ltd., a related party, as the fund manager (the “Manager”) to manage all aspects of the Fund. The sponsor of the Fund is the Construction and General Workers’ Union Local 180.
2. Basis of presentationThese condensed interim financial statements are based on International Financial Reporting Standards, as published by the International Accounting Standards Board, and have been prepared in accordance with International Accounting Standard 34, “Interim Financial Reporting”. These condensed interim financial statements follow the same significant accounting policies as described and used in the most recent annual financial statements of the Fund for the year ended August 31, 2019 and should be read in conjunction with those annual financial statements. The Fund has not early adopted any accounting standard, interpretation or amendment that has been issued but is not yet effective.
The condensed interim financial statements have been prepared on a going concern basis using the historic cost convention, except for investments at fair value through profit or loss (“FVTPL”) which are measured at fair value. The condensed interim financial statements were authorized for issue by the Fund’s Board of Directors on April 21, 2020.
3. Investments in associates and subsidiariesSubsidiaries are all entities, including investments in other investment entities, over which the Fund has control. The Fund controls an entity when it is exposed to, or has rights to, variable returns from its involvement with the entity and can affect those returns through its power over the entity.
The Fund has determined that it is an investment entity and, as such, it accounts for subsidiaries at fair value except for any subsidiaries which provide services related to the Fund’s investment activities, which are consolidated. The Fund currently does not have any subsidiaries that are consolidated. Associates are investments over which the Fund has significant influence or joint control, all of which have been designated at FVTPL.
40 Golden Opportunities Fund Inc. | 2020 Semi-annual Report

4. Critical accounting estimates and judgmentsThe preparation of financial statements requires management to use judgment in applying its accounting policies and to make estimates and assumptions about the future. The following discusses the most significant accounting judgments and estimates that the Fund has made in preparing the financial statements:
a) Qualification as an investment entity
The Fund has determined that it meets the definition of ‘investment entity’ and, as a result, it measures subsidiaries, other than those which provide services to the Fund, at FVTPL. Subsidiaries which provide services to the Fund are consolidated, however the Fund currently does not have any subsidiaries that are consolidated. An investment entity is an entity that: obtains funds from one or more investors for the purpose of providing them with investment management services, commits to its investors that its business purpose is to invest funds solely for returns from capital appreciation, investment income, or both, and measures and evaluates the performance for substantially all of its investments on a fair value basis. The most significant judgment that the Fund has made in determining that it meets this definition is that fair value is used as the primary measurement attribute to measure and evaluate the performance of substantially all its investments.
b) Fair value measurement of securities not quoted in an active market
The Fund holds financial instruments that are not quoted in active markets. The methods used to determine the fair values of such instruments incorporate various assumptions that are based on market conditions and for which observable inputs are not generally available. Significant areas requiring the use of estimates include assessments of the financial condition of investees that might indicate a change in value of an investment. Changes in assumptions about these factors could affect the reported fair value of financial instruments. Refer to Note 9 for further information about the Fund’s fair value measurements.
5. Redeemable sharesThe Fund’s redeemable shares are issuable at the applicable Pricing NAV to eligible investors and certain registered retirement savings plans and are subject to restrictions on transfer and redemption in accordance with legislation governing labour sponsored venture capital corporations and the Fund’s articles. Collectively, the shares are voting, entitled to elect a minority of the Directors of the Fund, entitled to receive dividends at the discretion of the Board of Directors and may be transferred to certain registered retirement income funds. Under certain circumstances, the shares are redeemable at the Pricing NAV.
The Fund also has 10 Class B shares outstanding, which were issued to the Fund’s sponsor for a nominal amount. The Class B shares are non participating, voting and entitled to elect a simple majority of the Board of Directors of the Fund. The shares are redeemable at the option of the Fund at the subscription price. There were no transactions affecting the Fund’s Class B shares during the six months ended February 29, 2020 or February 28, 2019.
During the period, the number of shares issued, redeemed and outstanding was as follows:
Six months ended February 29, 2020
Beginning of period
Shares issued
Shares redeemed
End of period
Class A Shares
Class A (SK) shares 16,126,660 1,265,046 (1,594,700) 15,797,006
Class A (MB) shares 391,473 34,963 (49,011) 377,425
16,518,133 1,300,009 (1,643,711) 16,174,431
Class A-F Shares
Class A-F (SK) shares 313,698 125,607 (513) 438,792
Class A-F (MB) shares 18,637 5,594 - 24,231
332,335 131,201 (513) 463,023
Class I Shares
Class I (SK) shares 3,007,541 380,670 (157,576) 3,230,635
Class I (MB) shares 65,859 5,885 (4,531) 67,213
3,073,400 386,555 (162,107) 3,297,848
41
Golden Opportunities Fund Inc. | 2020 Semi-annual Report
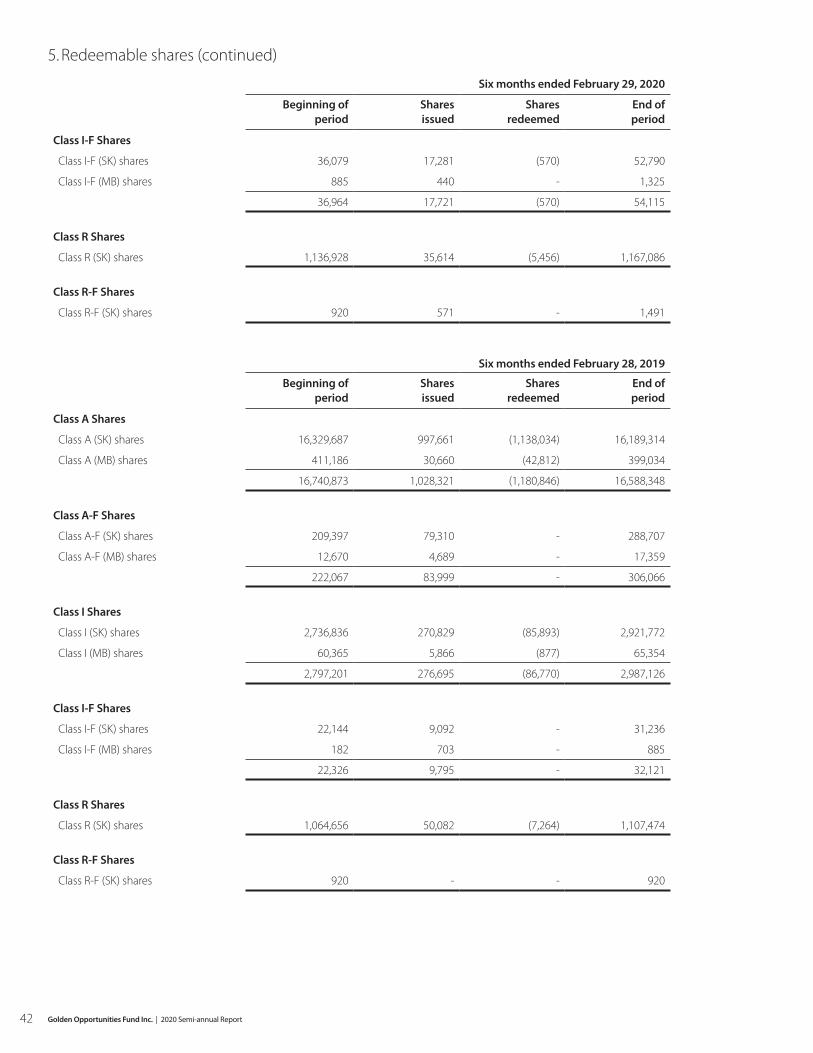
5. Redeemable shares (continued)
Six months ended February 29, 2020
Beginning of period
Shares issued
Shares redeemed
End of period
Class I-F Shares
Class I-F (SK) shares 36,079 17,281 (570) 52,790
Class I-F (MB) shares 885 440 - 1,325
36,964 17,721 (570) 54,115
Class R Shares
Class R (SK) shares 1,136,928 35,614 (5,456) 1,167,086
Class R-F Shares
Class R-F (SK) shares 920 571 - 1,491
Six months ended February 28, 2019
Beginning of period
Shares issued
Shares redeemed
End of period
Class A Shares
Class A (SK) shares 16,329,687 997,661 (1,138,034) 16,189,314
Class A (MB) shares 411,186 30,660 (42,812) 399,034
16,740,873 1,028,321 (1,180,846) 16,588,348
Class A-F Shares
Class A-F (SK) shares 209,397 79,310 - 288,707
Class A-F (MB) shares 12,670 4,689 - 17,359
222,067 83,999 - 306,066
Class I Shares
Class I (SK) shares 2,736,836 270,829 (85,893) 2,921,772
Class I (MB) shares 60,365 5,866 (877) 65,354
2,797,201 276,695 (86,770) 2,987,126
Class I-F Shares
Class I-F (SK) shares 22,144 9,092 - 31,236
Class I-F (MB) shares 182 703 - 885
22,326 9,795 - 32,121
Class R Shares
Class R (SK) shares 1,064,656 50,082 (7,264) 1,107,474
Class R-F Shares
Class R-F (SK) shares 920 - - 920
42 Golden Opportunities Fund Inc. | 2020 Semi-annual Report

6. Reconciliation of net asset valuesThe Fund’s accounting policy is to measure the fair value of publicly traded securities using the last traded market price, provided that the last traded price falls within that day’s bid-ask spread. In circumstances where the last traded price is not within the bid-ask spread, or where no sales in a security have been transacted on the reporting date, the Manager determines the point within the bid-ask spread that is most representative of fair value based on specific facts and circumstances.
For the determination of the Fund’s Pricing NAV, the value of publicly traded securities is determined on the basis of the previous day’s closing price, or, if no sales of a security have been transacted on that date, then on the basis of that day’s closing bid price, or, if there is no closing bid price, then on the basis of the most recent closing price. As a result, there may be a difference between the Pricing NAV and the net assets attributable to holders of redeemable shares as shown on the statement of financial position.
There was no difference between the Pricing NAV per share and the net assets attributable to holders of redeemable shares per share for any share class at February 29, 2020 or August 31, 2019.
7. Fees and expensesa) Management fees
In consideration of the performance by the Manager of its duties, the Manager receives an annual management fee equal to 2.5% of the aggregate Pricing NAV for each of the Class A Fund, Class I Fund and Class R Fund. The management fee is calculated and payable monthly in arrears based on the Pricing NAVs as at each weekly valuation date. The Manager waived the management fee for the period prior to the Fund reaching $5 million in gross F Series subscriptions and, as a result, management fees of $169 thousand on Class A-F Shares, $13 thousand on Class I-F Shares and less than $1 thousand on Class R-F Shares were waived during the six months ended February 28, 2019.
The Manager currently acts as manager of the Fund’s liquid portfolio, which includes cash and short-term investments. The Fund is responsible for any fees and expenses paid to any third party for liquid portfolio management services should the Manager no longer provide these services to the Fund.
b) Trailing commissions
An annual service fee equal to 0.5% of the aggregate Pricing NAV of the Class A Shares, Class I Shares and Class R Shares is paid quarterly to selling agents of the Fund. No trailing commissions are paid with respect to the F Series.
c) Percentage based payments
The Fund has engaged an arm’s length party (the “Party”) to pay sales commissions on the sale of its shares, excluding the F Series for which no sales commissions are payable. As remuneration for managing the payment of the commissions, the Fund has agreed to pay an annual percentage based payment to the Party of 0.95% of the gross proceeds (net of redemptions) raised in any calendar year on the sale of Class A Shares, Class I Shares and Class R Shares over eight consecutive years.
d) Amortized commissions
For investors that select the Fund’s alternative sales commission structure, an amortized sales commission is paid by the Fund in 96 monthly instalments, each in the amount of 0.75% of the investor’s cost of the purchase of Class A Shares, Class I Shares and Class R Shares (excluding the F Series for which no sales commissions are payable).
e) Administration fees
Pursuant to a transfer agency agreement, the Fund has retained Prometa Fund Support Services Inc. to provide certain services to the Fund, including processing of sales orders and maintaining shareholder records. The Fund has retained Concentra Trust as the Fund’s Custodian and Bare Trustee.
f) Marketing service fees
As remuneration for distribution services being provided by the principal distributor of the Fund (the “Agent”), the Fund has agreed to pay the Agent an aggregate annual marketing service fee of 1.00% of gross proceeds raised from the issue of redeemable shares.
During the six months ended February 28, 2019, the Fund reached $5 million in gross F Series subscriptions and, as a result, the Agent earned marketing service fees of $41 thousand on the Class A-F Shares, $4 thousand on the Class I-F Shares and less than $1 thousand on the Class R-F Shares at that time. The Manager reimbursed the Fund for these marketing service fees paid on the first $5 million of F Series subscriptions.
g) Incentive participation amount
The Manager is entitled to an incentive participation amount (“IPA”) equal to 20% of any return derived from an eligible investment of the Fund (excluding the first 10% of interest and dividend income earned and any commitment or work fees paid to the Fund in connection with the investment) in any fiscal year provided that: (i) the Class A Fund, Class I Fund or Class R Fund, as applicable, has earned sufficient income to generate a rate of return on all venture investments which is greater than the five year average guaranteed investment certificate rate of Concentra Financial plus 1.5% on an annualized basis; (ii) has earned sufficient income from the particular investment to provide a cumulative investment return at an average annual rate in excess of 10% since investment; and, (iii) has recouped an amount from the venture investment, through income earned, liquidation of the investment, or otherwise, equal to all the principal invested in the particular venture investment.
43
Golden Opportunities Fund Inc. | 2020 Semi-annual Report

7. Fees and expenses (continued)g) Incentive participation amount (continued)
For the Class A Fund, an IPA of $41 thousand was paid or payable to the Manager during the six months ended February 29, 2020 (six months ended February 28, 2019 - $6.9 million) on the portion of realized gains from the disposition of venture investments that have been received in cash. On an annualized basis, the IPA was 0.03% (six months ended February 28, 2019 – 4.64%) expressed as a percentage of average net asset value for the Class A Fund for the period.
For the Class A Fund, an estimated contingent IPA of $13.3 million (August 31, 2019 - $17.1 million) has been reflected in the financial statements in respect of unrealized gains and excess returns as at February 29, 2020. The decrease in the estimated contingent IPA of $3.8 million during the six months ended February 29, 2020 (six months ended February 28, 2019 – $3.8 million) represents an annualized increase of 2.83% (six months ended February 28, 2019 – 2.59%) in average Pricing NAV of the Class A Fund for the period.
For the Class I Fund, an IPA of $5 thousand was paid or payable to the Manager during the six months ended February 29, 2020 (six months ended February 28, 2019 - $991 thousand) on the portion of realized gains from the disposition of venture investments that have been received in cash. On an annualized basis, the IPA was 0.02% (six months ended February 28, 2019 – 4.52%) expressed as a percentage of average net asset value for the Class I Fund for the period.
For the Class I Fund, an estimated contingent IPA of $686 thousand (August 31, 2019 - $1.2 million) has been reflected in the financial statements in respect of unrealized gains and excess returns as at February 29, 2020. The decrease in the estimated contingent IPA of $480 thousand during the six months ended February 29, 2020 (six months ended February 28, 2019 – $574 thousand) represents an annualized increase of 2.09% (six months ended February 28, 2019 – 2.62%) in average Pricing NAV of the Class I Fund for the period.
For the Class R Fund, there was no IPA paid or payable for the six months ended February 29, 2020 or February 28, 2019. No contingent IPA is accrued for the Class R Fund at February 29, 2020 or August 31, 2019, and there were no changes in the contingent IPA for the Class R Fund for the six months ended February 29, 2020 or February 28, 2019.
h) Direct expenses
The Fund pays all direct costs and expenses incurred in the operation of the Fund, such as directors’ fees, custodian fees, insurance, legal, audit, and valuation expenses.
8. Financial instruments by category (thousands of dollars)
The following tables present the carrying amounts of the Fund’s financial assets by category. All the Fund’s financial liabilities, other than its net assets attributable to holders of redeemable shares, were carried at amortized cost as at the end of each respective period.
February 29, 2020
Category Class A Fund Class I Fund Class R Fund
Cash FVTPL $ 31,616 $ 5,674 $ 1,662
Short-term investments FVTPL 25,777 30,206 3,348
Subscriptions receivable Amortized cost 2,753 608 26
Interest and other receivables Amortized cost 3,075 793 34
Venture investments FVTPL 233,895 17,003 3,391
$ 297,116 $ 54,284 $ 8,461
August 31, 2019
Category Class A Fund Class I Fund Class R Fund
Cash FVTPL $ 24,476 $ 6,126 $ 1,456
Short-term investments FVTPL 77,539 31,954 3,548
Subscriptions receivable Amortized cost 184 34 9
Interest and other receivables Amortized cost 2,874 610 25
Venture investments FVTPL 213,315 14,741 3,781
$ 318,388 $ 53,465 $ 8,819
44 Golden Opportunities Fund Inc. | 2020 Semi-annual Report
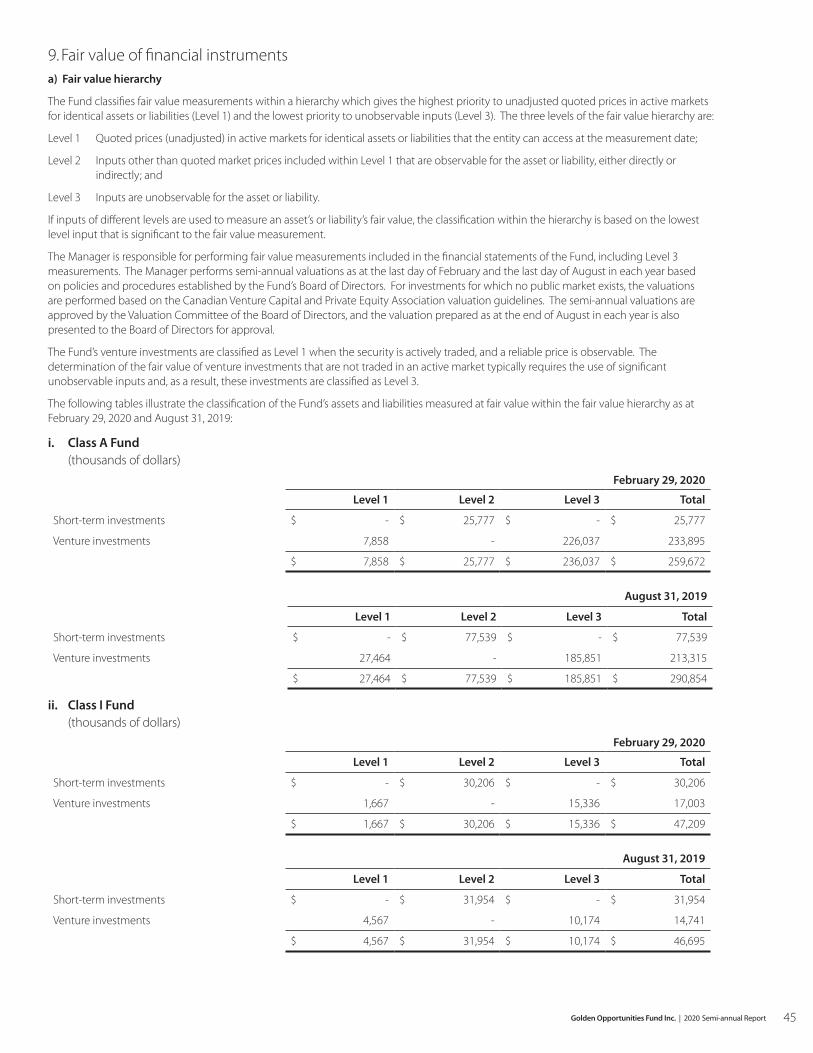
9. Fair value of financial instrumentsa) Fair value hierarchy
The Fund classifies fair value measurements within a hierarchy which gives the highest priority to unadjusted quoted prices in active markets for identical assets or liabilities (Level 1) and the lowest priority to unobservable inputs (Level 3). The three levels of the fair value hierarchy are:
Level 1 Quoted prices (unadjusted) in active markets for identical assets or liabilities that the entity can access at the measurement date;
Level 2 Inputs other than quoted market prices included within Level 1 that are observable for the asset or liability, either directly or indirectly; and
Level 3 Inputs are unobservable for the asset or liability.
If inputs of different levels are used to measure an asset’s or liability’s fair value, the classification within the hierarchy is based on the lowest level input that is significant to the fair value measurement.
The Manager is responsible for performing fair value measurements included in the financial statements of the Fund, including Level 3 measurements. The Manager performs semi-annual valuations as at the last day of February and the last day of August in each year based on policies and procedures established by the Fund’s Board of Directors. For investments for which no public market exists, the valuations are performed based on the Canadian Venture Capital and Private Equity Association valuation guidelines. The semi-annual valuations are approved by the Valuation Committee of the Board of Directors, and the valuation prepared as at the end of August in each year is also presented to the Board of Directors for approval.
The Fund’s venture investments are classified as Level 1 when the security is actively traded, and a reliable price is observable. The determination of the fair value of venture investments that are not traded in an active market typically requires the use of significant unobservable inputs and, as a result, these investments are classified as Level 3.
The following tables illustrate the classification of the Fund’s assets and liabilities measured at fair value within the fair value hierarchy as at February 29, 2020 and August 31, 2019:
i. Class A Fund (thousands of dollars)
February 29, 2020
Level 1 Level 2 Level 3 Total
Short-term investments $ - $ 25,777 $ - $ 25,777
Venture investments 7,858 - 226,037 233,895
$ 7,858 $ 25,777 $ 236,037 $ 259,672
August 31, 2019
Level 1 Level 2 Level 3 Total
Short-term investments $ - $ 77,539 $ - $ 77,539
Venture investments 27,464 - 185,851 213,315
$ 27,464 $ 77,539 $ 185,851 $ 290,854
ii. Class I Fund (thousands of dollars)
February 29, 2020
Level 1 Level 2 Level 3 Total
Short-term investments $ - $ 30,206 $ - $ 30,206
Venture investments 1,667 - 15,336 17,003
$ 1,667 $ 30,206 $ 15,336 $ 47,209
August 31, 2019
Level 1 Level 2 Level 3 Total
Short-term investments $ - $ 31,954 $ - $ 31,954
Venture investments 4,567 - 10,174 14,741
$ 4,567 $ 31,954 $ 10,174 $ 46,695
45
Golden Opportunities Fund Inc. | 2020 Semi-annual Report
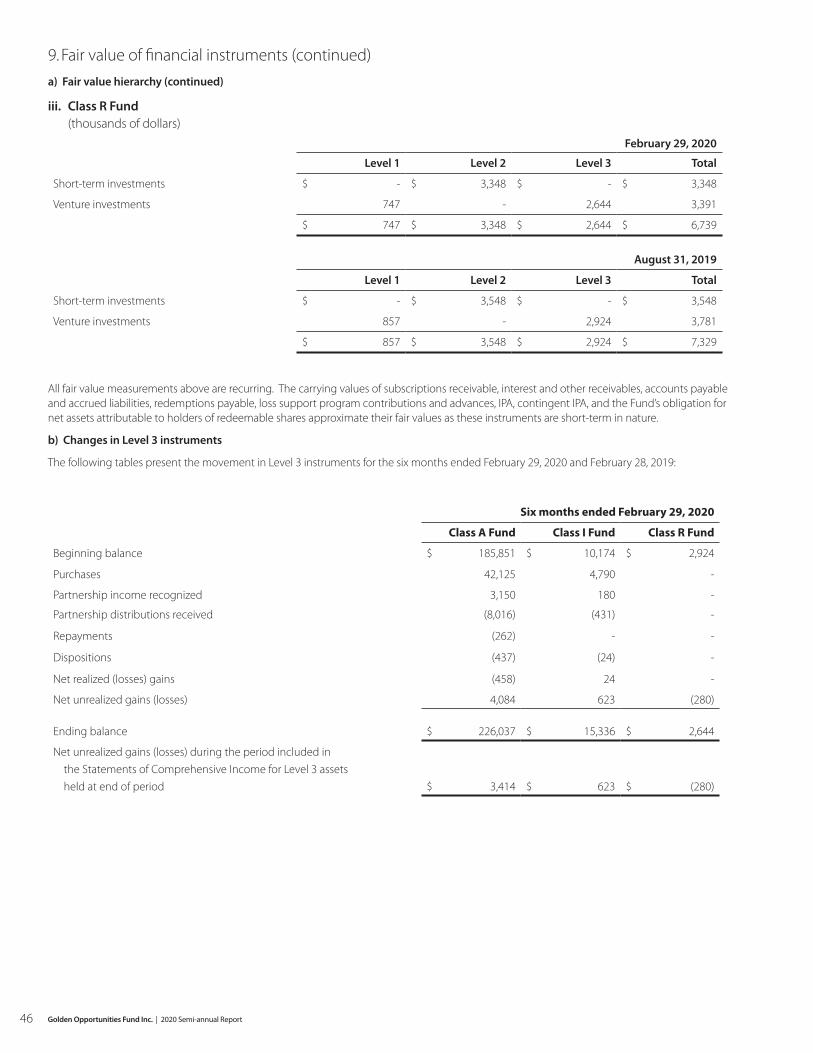
9. Fair value of financial instruments (continued)
a) Fair value hierarchy (continued)
iii. Class R Fund (thousands of dollars)
February 29, 2020
Level 1 Level 2 Level 3 Total
Short-term investments $ - $ 3,348 $ - $ 3,348
Venture investments 747 - 2,644 3,391
$ 747 $ 3,348 $ 2,644 $ 6,739
August 31, 2019
Level 1 Level 2 Level 3 Total
Short-term investments $ - $ 3,548 $ - $ 3,548
Venture investments 857 - 2,924 3,781
$ 857 $ 3,548 $ 2,924 $ 7,329
All fair value measurements above are recurring. The carrying values of subscriptions receivable, interest and other receivables, accounts payable and accrued liabilities, redemptions payable, loss support program contributions and advances, IPA, contingent IPA, and the Fund’s obligation for net assets attributable to holders of redeemable shares approximate their fair values as these instruments are short-term in nature.
b) Changes in Level 3 instruments
The following tables present the movement in Level 3 instruments for the six months ended February 29, 2020 and February 28, 2019:
Six months ended February 29, 2020
Class A Fund Class I Fund Class R Fund
Beginning balance $ 185,851 $ 10,174 $ 2,924
Purchases 42,125 4,790 -
Partnership income recognized 3,150 180 -
Partnership distributions received (8,016) (431) -
Repayments (262) - -
Dispositions (437) (24) -
Net realized (losses) gains (458) 24 -
Net unrealized gains (losses) 4,084 623 (280)
Ending balance $ 226,037 $ 15,336 $ 2,644
Net unrealized gains (losses) during the period included in
the Statements of Comprehensive Income for Level 3 assets
held at end of period $ 3,414 $ 623 $ (280)
46 Golden Opportunities Fund Inc. | 2020 Semi-annual Report
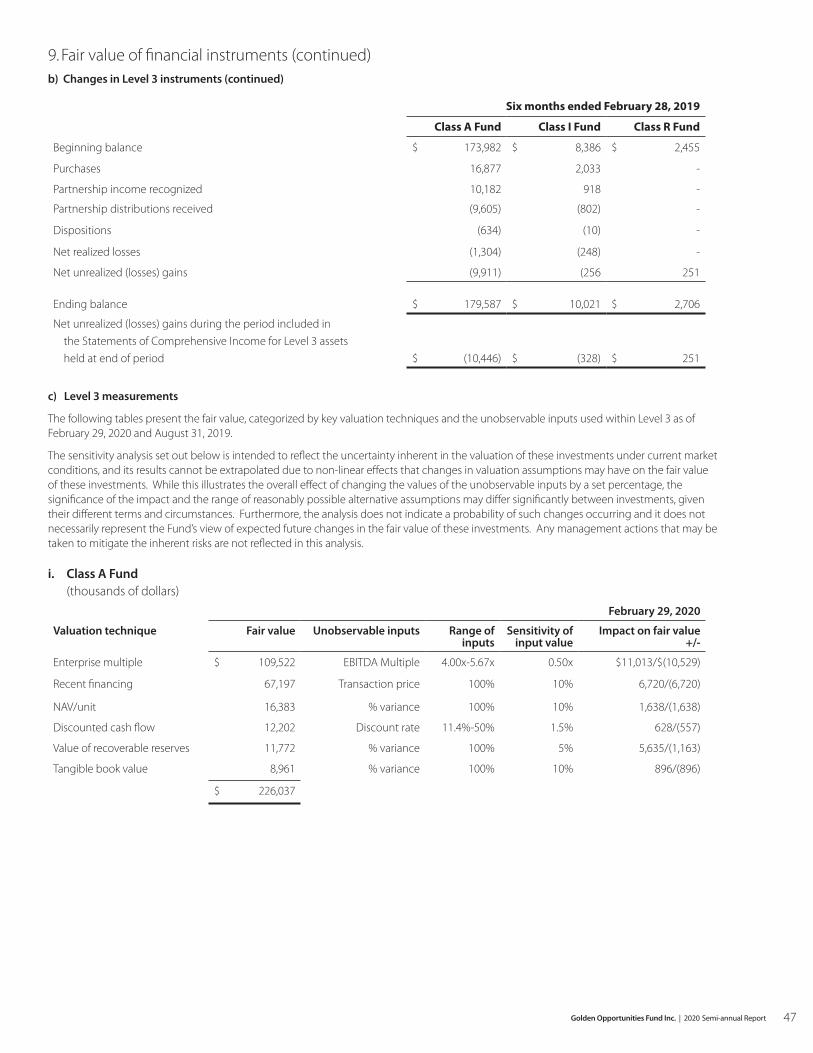
9. Fair value of financial instruments (continued)b) Changes in Level 3 instruments (continued)
Six months ended February 28, 2019
Class A Fund Class I Fund Class R Fund
Beginning balance $ 173,982 $ 8,386 $ 2,455
Purchases 16,877 2,033 -
Partnership income recognized 10,182 918 -
Partnership distributions received (9,605) (802) -
Dispositions (634) (10) -
Net realized losses (1,304) (248) -
Net unrealized (losses) gains (9,911) (256 251
Ending balance $ 179,587 $ 10,021 $ 2,706
Net unrealized (losses) gains during the period included in
the Statements of Comprehensive Income for Level 3 assets
held at end of period $ (10,446) $ (328) $ 251
c) Level 3 measurements
The following tables present the fair value, categorized by key valuation techniques and the unobservable inputs used within Level 3 as of February 29, 2020 and August 31, 2019.
The sensitivity analysis set out below is intended to reflect the uncertainty inherent in the valuation of these investments under current market conditions, and its results cannot be extrapolated due to non-linear effects that changes in valuation assumptions may have on the fair value of these investments. While this illustrates the overall effect of changing the values of the unobservable inputs by a set percentage, the significance of the impact and the range of reasonably possible alternative assumptions may differ significantly between investments, given their different terms and circumstances. Furthermore, the analysis does not indicate a probability of such changes occurring and it does not necessarily represent the Fund’s view of expected future changes in the fair value of these investments. Any management actions that may be taken to mitigate the inherent risks are not reflected in this analysis.
i. Class A Fund (thousands of dollars)
February 29, 2020
Valuation technique Fair value Unobservable inputs Range of inputs
Sensitivity of input value
Impact on fair value +/-
Enterprise multiple $ 109,522 EBITDA Multiple 4.00x-5.67x 0.50x $11,013/$(10,529)
Recent financing 67,197 Transaction price 100% 10% 6,720/(6,720)
NAV/unit 16,383 % variance 100% 10% 1,638/(1,638)
Discounted cash flow 12,202 Discount rate 11.4%-50% 1.5% 628/(557)
Value of recoverable reserves 11,772 % variance 100% 5% 5,635/(1,163)
Tangible book value 8,961 % variance 100% 10% 896/(896)
$ 226,037
47
Golden Opportunities Fund Inc. | 2020 Semi-annual Report

9. Fair value of financial instruments (continued)c) Level 3 measurements (continued)
i. Class A Fund (continued) (thousands of dollars)
August 31, 2019
Valuation technique Fair value Unobservable inputs Range of inputs
Sensitivity of input value
Impact on fair value +/-
Enterprise multiple $ 103,300 EBITDA Multiple 4.00x-5.67x 0.50x $8,273/$(10,360)
Recent financing 32,275 Transaction price 100% 10% 3,227/(3,227)
NAV/unit 16,813 % variance 100% 10% 1,681/(1,681)
Discounted cash flow 12,064 Discount rate 11.4%-50% 1.5% 619/(694)
Value of recoverable reserves 12,366 % variance 100% 5% 5,189/(936)
Tangible book value 9,033 % variance 100% 10% 903/(903)
$ 185,851
ii. Class I Fund (thousands of dollars)
February 29, 2020
Valuation technique Fair value Unobservable inputs Range of inputs
Sensitivity of input value
Impact on fair value +/-
Recent financing $ 9,953 Transaction price 100% 10% $995/$(995)
Enterprise multiple 4,133 EBITDA multiple 4.00x-5.50x 0.50x 319/(319)
Discounted cash flow 1,250 Discount rate 7.7%-15.4% 1.5% 52/(49)
$ 15,336
August 31, 2019
Valuation technique Fair value Unobservable inputs Range of inputs
Sensitivity of input value
Impact on fair value +/-
Recent financing $ 5,024 Transaction price 100% 10% $502/$(502)
Enterprise multiple 4,020 EBITDA multiple 4.00x-5.00x 0.50x 74/(489)
Discounted cash flow 1,130 Discount rate 11.4% 1.5% 47/(44)
$ 10,174
iii. Class R Fund (thousands of dollars)
February 29, 2020
Valuation technique Fair value Unobservable inputs Range of inputs
Sensitivity of input value
Impact on fair value +/-
Value of recoverable
reserves $ 1,611 % variance 100% 5% $379/$(160)
NAV/unit 1,033 % variance 100% 10% 103/(103)
$ 2,644
August 31, 2019
Valuation technique Fair value Unobservable inputs Range of inputs
Sensitivity of input value
Impact on fair value +/-
Value of recoverable
reserves $ 1,884 % variance 100% 5% $104/$(104)
NAV/unit 1,040 % variance 100% 10% 381/(174)
$ 2,924
48 Golden Opportunities Fund Inc. | 2020 Semi-annual Report

10. Risks associated with financial instrumentsThe Fund’s activities expose it to a variety of risks associated with financial instruments, including credit risk, liquidity risk and market risk (including price risk and interest rate risk). The Fund has no exposure to currency risk as all financial instruments of the Fund are denominated in Canadian currency. The objective of the Fund is to manage these risks while maintaining a risk/return balance that is consistent with the Fund’s investment objectives. The Manager seeks to mitigate these risks by monitoring the Fund’s investment holdings and by diversifying the investment portfolio within the constraints of governing legislation. There is a risk of loss of capital for all investments made by the Fund.
a) Credit risk
Credit risk is the risk that one party to a financial instrument will cause a financial loss for the other party by failing to discharge an obligation. Concentration of credit risk relates to groups of counterparties that have similar economic or industry characteristics that cause their ability to meet contractual obligations to be similarly affected by changes in economic or other conditions. Most of the credit risk to which the Fund is exposed arises from its short-term investments, venture investments in debt securities, and accrued interest receivable.
The Fund analyzes credit concentration based on the counterparty, industry and geographic location. To mitigate counterparty risk associated with its debt venture investments, the Fund has, where possible, secured its debt investments with first or subordinated charges of the assets of the investee company and imposed certain financial covenants on the investee companies. The Fund seeks to mitigate risks associated with a particular industry by investing its venture investment portfolios in a diverse range of industries. The Fund seeks to mitigate credit risk in its short-term investment portfolios by investing in instruments with a minimum Dominion Bond Service rating of A or in instruments that are guaranteed by the Credit Union Deposit Guarantee Corporation.
For the Class A Fund, the maximum credit risk exposure as at February 29, 2020 is $83.3 million (August 31, 2019 is $134.4 million). The diversification of the Class A Fund venture investments by industry sector is outlined in the Schedule of Investment Portfolio. Although the Class A Fund’s venture investment portfolio consists primarily of Saskatchewan and Manitoba companies, the markets for those companies are worldwide. To mitigate the geographic risk, the Class A Fund has been invested in companies with a diverse range of end markets.
For the Class I Fund, the maximum credit risk exposure as at February 29, 2020 is $32.4 million (August 31, 2019 is $33.7 million). The Class I Fund’s venture investment portfolio includes investments in seven (August 31, 2019 - three) debt instruments at February 29, 2020. The credit risk on these investments is mitigated by the Western Economic Diversification Canada loss support program outlined in the Fund’s prospectus.
For the Class R Fund, the maximum credit risk exposure as at February 29, 2020 is $4.9 million (August 31, 2019 is $5.1 million). At February 29, 2020, the Class R Fund’s venture investment portfolio includes investments in three (August 31, 2019 – three) debt instruments.
b) Liquidity risk
Liquidity risk is the risk that the Fund will encounter difficulty in meeting obligations associated with financial liabilities. The Fund is exposed to weekly cash redemptions of its redeemable shares and has instituted a liquid reserve policy for each of the Class A Fund, Class I Fund and Class R Fund for managing its liquidity risk. Under the liquid reserve policy, each of the Class A Fund, Class I Fund and Class R Fund will maintain reserves equal to the lesser of 20% of retained earnings or 50% of net earnings after taxes for the previous fiscal year. In addition, an amount equal to 25% of all guarantees issued will be maintained on reserve. At February 29, 2020 there are no guarantees issued.
The Fund invests in debt securities and equity investments that are not traded in an active market. As a result, the Fund may not be able to quickly liquidate its investments in these instruments at amounts which approximate their fair values or be able to respond to specific events such as deterioration in the creditworthiness of any issuer.
The financial liabilities of the Fund mature in less than three months except for the contingent IPA. The contingent IPA is an estimate, based on unrealized gains and excess returns, that would have been payable had the Fund disposed of its entire venture investment portfolio at fair value at February 29, 2020. The maturity of the contingent IPA is uncertain and is only payable to the Manager if specific criteria are met, as outlined in Note 7(g).
Although the redeemable shares are redeemable on demand at the holder’s option, shares redeemed within the eight-year period following their purchase are generally subject to a withholding fee equal to the tax credits received by the investor. As a result, holders of the Fund’s shares typically retain them for an extended period. Furthermore, subject to certain restrictions, the Fund is not obligated to redeem its shares under certain circumstances as outlined in the Fund’s prospectus. Based on the redemption history of the Fund, the Manager expects that the redeemable shares outstanding at February 29, 2020 will be redeemed over a period of several years.
49
Golden Opportunities Fund Inc. | 2020 Semi-annual Report
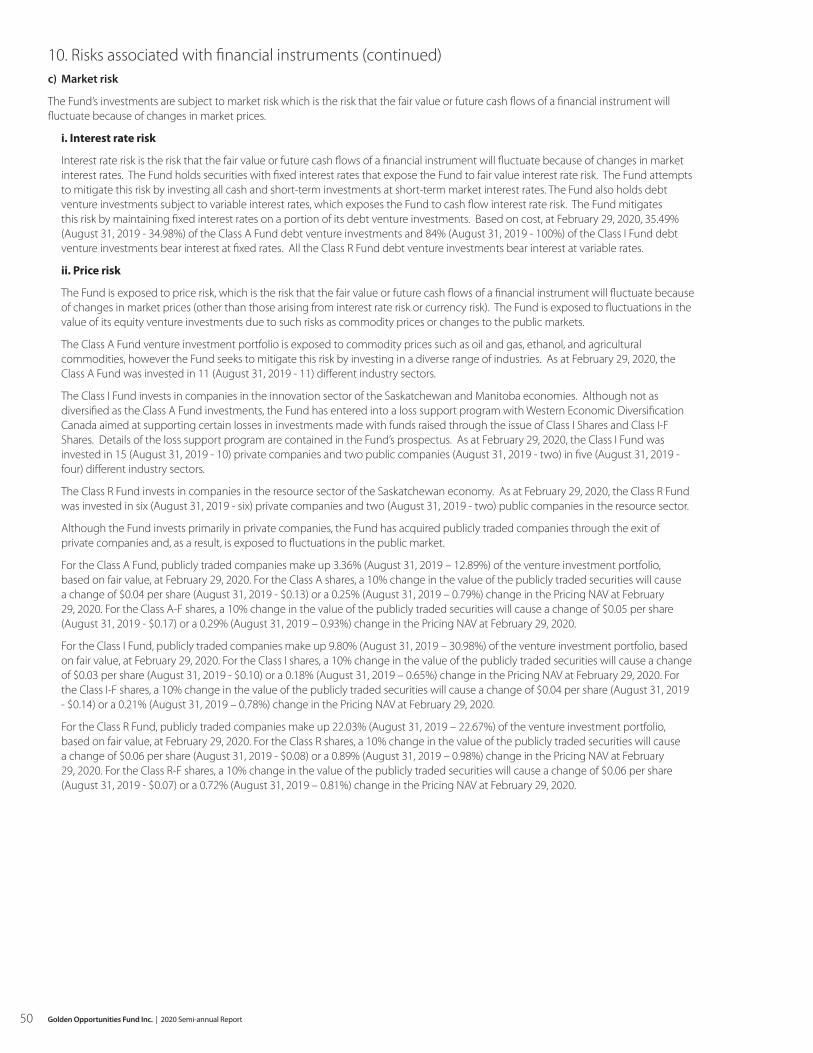
10. Risks associated with financial instruments (continued) c) Market risk
The Fund’s investments are subject to market risk which is the risk that the fair value or future cash flows of a financial instrument will fluctuate because of changes in market prices.
i. Interest rate risk
Interest rate risk is the risk that the fair value or future cash flows of a financial instrument will fluctuate because of changes in market interest rates. The Fund holds securities with fixed interest rates that expose the Fund to fair value interest rate risk. The Fund attempts to mitigate this risk by investing all cash and short-term investments at short-term market interest rates. The Fund also holds debt venture investments subject to variable interest rates, which exposes the Fund to cash flow interest rate risk. The Fund mitigates this risk by maintaining fixed interest rates on a portion of its debt venture investments. Based on cost, at February 29, 2020, 35.49% (August 31, 2019 - 34.98%) of the Class A Fund debt venture investments and 84% (August 31, 2019 - 100%) of the Class I Fund debt venture investments bear interest at fixed rates. All the Class R Fund debt venture investments bear interest at variable rates.
ii. Price risk
The Fund is exposed to price risk, which is the risk that the fair value or future cash flows of a financial instrument will fluctuate because of changes in market prices (other than those arising from interest rate risk or currency risk). The Fund is exposed to fluctuations in the value of its equity venture investments due to such risks as commodity prices or changes to the public markets.
The Class A Fund venture investment portfolio is exposed to commodity prices such as oil and gas, ethanol, and agricultural commodities, however the Fund seeks to mitigate this risk by investing in a diverse range of industries. As at February 29, 2020, the Class A Fund was invested in 11 (August 31, 2019 - 11) different industry sectors.
The Class I Fund invests in companies in the innovation sector of the Saskatchewan and Manitoba economies. Although not as diversified as the Class A Fund investments, the Fund has entered into a loss support program with Western Economic Diversification Canada aimed at supporting certain losses in investments made with funds raised through the issue of Class I Shares and Class I-F Shares. Details of the loss support program are contained in the Fund’s prospectus. As at February 29, 2020, the Class I Fund was invested in 15 (August 31, 2019 - 10) private companies and two public companies (August 31, 2019 - two) in five (August 31, 2019 - four) different industry sectors.
The Class R Fund invests in companies in the resource sector of the Saskatchewan economy. As at February 29, 2020, the Class R Fund was invested in six (August 31, 2019 - six) private companies and two (August 31, 2019 - two) public companies in the resource sector.
Although the Fund invests primarily in private companies, the Fund has acquired publicly traded companies through the exit of private companies and, as a result, is exposed to fluctuations in the public market.
For the Class A Fund, publicly traded companies make up 3.36% (August 31, 2019 – 12.89%) of the venture investment portfolio, based on fair value, at February 29, 2020. For the Class A shares, a 10% change in the value of the publicly traded securities will cause a change of $0.04 per share (August 31, 2019 - $0.13) or a 0.25% (August 31, 2019 – 0.79%) change in the Pricing NAV at February 29, 2020. For the Class A-F shares, a 10% change in the value of the publicly traded securities will cause a change of $0.05 per share (August 31, 2019 - $0.17) or a 0.29% (August 31, 2019 – 0.93%) change in the Pricing NAV at February 29, 2020.
For the Class I Fund, publicly traded companies make up 9.80% (August 31, 2019 – 30.98%) of the venture investment portfolio, based on fair value, at February 29, 2020. For the Class I shares, a 10% change in the value of the publicly traded securities will cause a change of $0.03 per share (August 31, 2019 - $0.10) or a 0.18% (August 31, 2019 – 0.65%) change in the Pricing NAV at February 29, 2020. For the Class I-F shares, a 10% change in the value of the publicly traded securities will cause a change of $0.04 per share (August 31, 2019 - $0.14) or a 0.21% (August 31, 2019 – 0.78%) change in the Pricing NAV at February 29, 2020.
For the Class R Fund, publicly traded companies make up 22.03% (August 31, 2019 – 22.67%) of the venture investment portfolio, based on fair value, at February 29, 2020. For the Class R shares, a 10% change in the value of the publicly traded securities will cause a change of $0.06 per share (August 31, 2019 - $0.08) or a 0.89% (August 31, 2019 – 0.98%) change in the Pricing NAV at February 29, 2020. For the Class R-F shares, a 10% change in the value of the publicly traded securities will cause a change of $0.06 per share (August 31, 2019 - $0.07) or a 0.72% (August 31, 2019 – 0.81%) change in the Pricing NAV at February 29, 2020.
50 Golden Opportunities Fund Inc. | 2020 Semi-annual Report
10. Risks associated with financial instruments (continued) d) Concentration risk
Concentration risk arises because of the concentration of exposures within the same category, whether it is geographic location, product type, industry sector or counterparty type. A summary of the venture portfolio concentration by industry sector and stage of development is provided in the Schedule of Investment Portfolio for each of the Class A Fund, Class I Fund and Class R Fund. The Class R Fund is a resource focused portfolio with a strategy to invest in companies in the energy, mining and/or related resource sectors of the Saskatchewan economy. Accordingly, all the Class R Fund venture investments are in the oil & gas sector as at February 29, 2020 and August 31, 2019.
e) Capital risk management
Redeemable shares issued and outstanding are the capital of the Fund. The Manager manages the capital of the Fund in accordance with the Fund’s investment objectives, policies, and restrictions as outlined in the Fund’s prospectus, while attempting to maintain sufficient liquidity to meet shareholder redemptions, operational requirements, and future venture investments.
Pursuant to the Saskatchewan Act, the Fund is obligated, during the 24-month period following the end of the fiscal year in which the Saskatchewan share capital is raised, to invest and maintain at least 75% of the equity capital raised in Saskatchewan in investment instruments issued by eligible businesses or in any other type of investment authorized by the Saskatchewan Act. Under the Saskatchewan Act, an amount equal to 20% of the capital raised in Saskatchewan must be set aside in a trust fund until the Fund has met the investment requirements as set forth in the Saskatchewan Act. Pending release, the trust monies will be invested in investments permitted by the Saskatchewan Act. As at February 29, 2020, the Fund was in compliance with the investment pacing requirements under the Saskatchewan Act.
For the Class A Fund, cash and short-term investments of $17.9 million (August 31, 2019 - $14.9 million) are held within the trust fund required under the Saskatchewan Act at February 29, 2020. For the Class I Fund, cash and short-term investments of $4.8 million (August 31, 2019 - $3.8 million) are held within the trust fund at February 29, 2020. For the Class R Fund, cash and short-term investments of $1.1 million (August 31, 2019 - $1.1 million) are held within the trust fund at February 29, 2020.
The regulations to the Saskatchewan Act require the Fund to invest 18.75% of its annual net capital (being annual capital raised less annual capital required to satisfy redemption obligations) in eligible innovation activities. Eligible innovation activities include: (i) activities carried out by an eligible business whose principal business is directly related to one or more of the following sectors: clean or environmental technology, health and life sciences, crop and animal sciences, industrial biotechnology, information and communication technology; or (ii) activities carried out by an eligible business that involves technical risk, productivity improvement or the application of a technology, process or innovation that is new to Saskatchewan and facilitates growth, supports trade or exports or enhances Saskatchewan’s competitiveness.
Pursuant to the Manitoba Act, the Fund is obligated, during the 24-month period following the end of the fiscal year in which the Manitoba share capital is raised, to invest at least 70% of the equity capital raised in Manitoba in eligible investments issued by eligible business entities or in any other type of investment authorized by the Manitoba Act, and 14% of the Manitoba share capital so invested must be in eligible investments for which the total cost of the eligible investments held by the Fund in such entity and any related entities does not exceed $2 million. As at February 29, 2020, the Fund was in compliance with the investment pacing requirements under the Manitoba Act.
51
Golden Opportunities Fund Inc. | 2020 Semi-annual Report
11. Related party transactions The Manager is a company controlled by the President & Chief Executive Officer of the Fund.
For the Class A Fund, management fees of $3.7 million (six months ended February 28, 2019 - $3.8 million) and office costs totaling $4 thousand (six months ended February 28, 2019 - $4 thousand) were paid or payable to the Manager during the six months ended February 29, 2020, and management fees of $nil (six months ended February 28, 2019 - $169 thousand) were waived during the period. During the six months ended February 29, 2020, the Manager earned an IPA of $41 thousand (six months ended February 28, 2019 - $6.9 million) on realized gains in the Class A Fund that have been received in cash.
For the Class A Fund, management fees of $594 thousand (August 31, 2019 - $635 thousand) are included in accounts payable and accrued liabilities, there is an IPA payable of $19.2 million (August 31, 2019 - $19.2 million) and an accrued contingent IPA of $13.3 million (August 31, 2019 - $17.1 million) at February 29, 2020.
For the Class I Fund, management fees of $601 thousand (six months ended February 28, 2019 - $566 thousand) and office costs totaling $1 thousand (six months ended February 28, 2019 - $1 thousand) were paid or payable during the six months ended February 29, 2020 and management fees of $nil (six months ended February 28, 2019 - $13 thousand) were waived during the period. During the six months ended February 29, 2020, the Manager earned an IPA of $5 thousand (six months ended February 28, 2019 - $991 thousand) on realized gains in the Class I Fund that have been received in cash.
For the Class I Fund, management fees of $98 thousand (August 31, 2019 - $105 thousand) are included in accounts payable and accrued liabilities, there is an IPA payable of $2.5 million (August 31, 2019 - $2.5 million) and an accrued contingent IPA of $686 thousand (August 31, 2019 - $1.2 million) at February 29, 2020.
For the Class R Fund, management fees of $115 thousand (six months ended February 28, 2019 – $107 thousand) and office costs totaling less than $1 thousand (six months ended February 28, 2019 – less than $1 thousand) were paid or payable for the Class R Fund during the six months ended February 29, 2020 and management fees of $nil (six months ended February 28, 2019 – less than $1 thousand) were waived during the period.
The above-mentioned transactions were in the normal course of operations, are non-interest bearing, and are measured at the exchange amount, which is the amount of consideration established and agreed to by the related parties.
12. Subsequent event Since February 29, 2020, the outbreak of the novel strain of coronavirus, specifically identified as “COVID-19”, has resulted in governments worldwide enacting emergency measures to combat the spread of the virus. These measures, which include the implementation of travel bans, self-imposed quarantine periods and social distancing, have caused material disruption to businesses globally resulting in an economic slowdown. Global equity markets have experienced significant volatility and weakness. Governments and central banks have reacted with significant monetary and fiscal interventions designed to stabilize economic conditions. The duration and impact of the COVID-19 outbreak is unknown at this time, as is the efficacy of the government and central bank interventions. While the Manager continues to monitor these developments generally, and particularly in connection with the Fund’s portfolio investments, it is not yet possible to reliably estimate the length and severity of these developments and the impact on the financial results and condition of the Fund in future periods.
52 Golden Opportunities Fund Inc. | 2020 Semi-annual Report

Brian Barber1,3 Chair Senior Vice-President, Saskatchewan, Ledcor Construction
Limited
Lorraine Sali3,4 Vice Chair Business Manager for the Sponsor, Construction and General
Workers’ Union, Local 180
Thomas Shepherd1,3 Director Retired Businessman (Formerly Senior Vice-President,
Dundee Realty Corporation)
James Salamon1 Director Managing Partner, SRG Chartered Professional Accountants
Ronald Waldman2 Director President /Chief Executive Officer, Keystone Consulting Inc.
Golden Opportunities’ Governance
1 Audit Committee 2 Valuation Committee 3 Investment Committee 4 Governance and Nominations Committee
Board of DirectorsMurad Al-Katib Director President /Chief Executive Officer, AGT Food and Ingredients Inc.
Blair Davidson2,4 Director President/Chief Executive Officer, Blair Davidson CPA Prof. Corp.
Grant Kook2,4 President/Chief Executive Officer/Director President/Chief Executive Officer, Westcap Mgt. Ltd.
Douglas Banzet1 Chief Financial Officer/Director Chief Operating Officer, Westcap Mgt. Ltd.
Corporate InformationAUDITORS Ernst & Young LLP
Suite 900, 409 3rd Avenue South, Saskatoon, SK S7K 5R5
CORPORATE COUNSEL MLT Aikins LLP
Suite 1500, 410 - 22nd St. East, Saskatoon, SK S7K 5T6
CUSTODIAN Concentra Trust
333, 3rd Avenue North, Saskatoon, SK S7K 2M2
AGENT AND PRINCIPAL DISTRIBUTOR
Wellington-Altus Private Wealth Inc. Suite 1360, 410 - 22nd St. East, Saskatoon, SK S7K 5T6
TRANSFER AGENT Prometa Fund Support Services Inc. 220 - 155 Carlton Street, Winnipeg, MB R3C 3H8
PROUD SPONSOR Construction and General Workers’ Union, Local 180
2206 E Emmett Hall Road, Regina, SK S4N 3M3
Fund Manager:
Suite 830, 410 - 22nd St. East, Saskatoon, SK S7K 5T6
Fund Codes: GOF501 (Class A SK), GOF502 (Class A MB), GOF503 (Class i SK), GOF504 (Class i MB), GOF505 (Class R SK), GOF507 (Class A-F SK), GOF508 (Class A-F MB), GOF509 (Class i-F SK), GOF510 (Class i-F MB), GOF511 (Class R-F SK), GOF601 (Class A (SK)-A), GOF602 (Class A (MB)-A), GOF603 (Class i (SK)-A), GOF604 (Class i (MB)-A), GOF605 (Class R (SK)-A)
53
Golden Opportunities Fund Inc. | 2020 Semi-annual Report

CORPORATE HEAD OFFICE
Suite 830, 410 - 22nd St. East, Saskatoon, SK S7K 5T6 Tel: 306.652.5557 | Fax: 306.652.8186