2020 regional snapshot: 100 metros · key takeaways rapid growth: metro atlanta ranks fourth in...
TRANSCRIPT
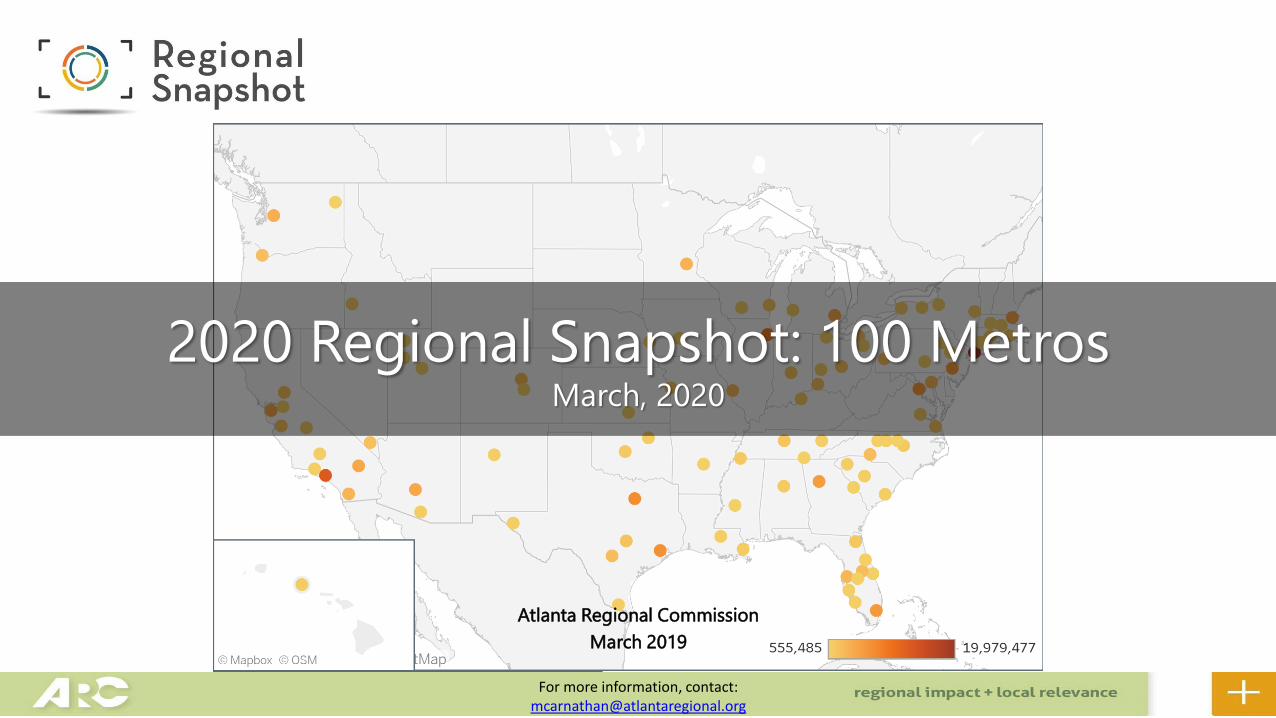
Atlanta Regional Commission
March 2019
2020 Regional Snapshot: 100 MetrosMarch, 2020
For more information, contact:[email protected]

Source: Population Estimates (2018), Census Bureau
Top 10 Most Populous MSAs
• Demographic
• Housing
• Education
• Health
• Employment
• Economic development
• Commuting

Key Takeaways
Rapid growth: Metro Atlanta ranks fourth in total population growth since 2010, and has added the 3rd most building permits since 2014.
Young and diverse place: Metro Atlanta ranks 77th in the share of population identified as White. Also, the region ranks 6th in the total population of those under age 19.
Income and housing characteristics muddling in the middle: Metro Atlanta generally ranks around the middle (of the 100 metros) for most indicators of income and housing characteristics.
Low fertility rates: Metro Atlanta ranks 87th in the birth rate of women aged 15 to 50 last year.
Low rates of those with health insurance: Metro Atlanta ranks 92nd in the percentage of adults who have health insurance.

Keyword 1:
Growth

Source: Population Estimates (2018), Census Bureau
Top 10 Most Populous MSAs
0 5 10 15 20 25
Boston-Cambridge-Newton
Atlanta-Sandy Springs-Roswell
Philadelphia-Camden-Wilmington
Miami-Fort Lauderdale-West Palm Beach
Washington-Arlington-Alexandria
Houston-The Woodlands-Sugar Land
Dallas-Fort Worth-Arlington
Chicago-Naperville-Elgin
Los Angeles-Long Beach-Anaheim
New York-Newark-Jersey City
Millions
# Total Population, July 1, 2018
5.95 M #9
19.98 M
13.29 M
9.50 M
7.54 M
7.00 M
6.25 M
6.20 M
6.10 M
4.88 M
Change in Population, 2010-2018
+647,248 #4

Source: Population Estimates (2018), Census Bureau
Population Increase in the Atlanta MSA
0 5 10 15 20 25
Boston-Cambridge-Newton
Atlanta-Sandy Springs-Roswell
Philadelphia-Camden-Wilmington
Miami-Fort Lauderdale-West Palm Beach
Washington-Arlington-Alexandria
Houston-The Woodlands-Sugar Land
Dallas-Fort Worth-Arlington
Chicago-Naperville-Elgin
Los Angeles-Long Beach-Anaheim
New York-Newark-Jersey City
Millions
# Total Population, July 1, 2018
5.95 M #9
Change in Population, 2010-2018
+647,248 #4
19.98 M
13.29 M
9.50 M
7.54 M
7.00 M
6.25 M
6.20 M
6.10 M
4.88 M
#1 + 1,087,683
Dallas-Fort Worth-Arlington, TX
#2 + 1,049,975
Houston-The Woodlands-Sugar Land, TX
#3 + 653,224
Phoenix-Mesa-Scottsdale, AZ

Source: Building Permits (2018), Census Bureau
Ranking of Atlanta MSA by
Increase in Building Permits
# Single-Family Building Permits
#3
#8
26,691
# All Building Permits, 2018
39,441 #4
# Multi-Family Building Permits
12,750
Change # of Building Permits, 2014-18
+12,758 #3

Source: Building Permits (2018), Census Bureau
Ranking of Atlanta MSA by
Increase in Building Permits
# Single-Family Building Permits
#3
#8
26,691
# All Building Permits, 2018
39,441 #4
# Multi-Family Building Permits
12,750
Change # of Building Permits, 2014-18
+12,758 #3
#1: Dallas-Fort Worth-
Arlington, TX
#2: Houston-The Woodlands-
Sugar Land, TX
#3: New York-Newark-Jersey
City, NY-NJ-PA

Source: Building Permits (2018), Census Bureau
Ranking of Atlanta MSA by
Increase in Building Permits
# Single-Family Building Permits
#3
#8
26,691
# All Building Permits, 2018
39,441 #4
# Multi-Family Building Permits
12,750
Change # of Building Permits, 2014-18
+12,758 #3
#1: Houston-The Woodlands-
Sugar Land, TX
#2: Dallas-Fort Worth-Arlington,
TX

Source: Building Permits (2018), Census Bureau
Ranking of Atlanta MSA by
Increase in Building Permits
# Single-Family Building Permits
#3
#8
26,691
# All Building Permits, 2018
39,441 #4
# Multi-Family Building Permits
12,750
Change # of Building Permits, 2014-18
+12,758 #3
#1: Dallas-Fort Worth-
Arlington, TX
#2: Orlando-Kissimmee-
Sanford, RL

Source: Bureau of Labor Statistics
Ranking of Atlanta MSA by
the Number of Employees
2282K 2312K 2360K 2409K2501K
2584K2663K
2729K 2789K 2842K
0
500
1000
1500
2000
2500
3000
2010 2011 2012 2013 2014 2015 2016 2017 2018 2019
Non-Farm Employees (Thousands)
#8% Change Non-farm Employees, 2010-19
+ 24.5% #25#9
#1: + 51.3% Provo-Orem, UT
#25: +24.5% Miami-Fort Lauderdale-West Palm Beach, FL
#100: +4.0% Scranton—Wilkes-Barre—Hazleton, PA

Source: American Community Survey, Census Bureau
Ranking of Atlanta MSA by
the Percent Share of Occupations, 2018
Management,
business, science, and
arts occupations41.6%
Employment by
Occupation
Natural resources, construction,
and maintenance occupations
7.7%Production,
transportation, and
material moving
occupations
13.0%
Sales and office
occupations
22.3%
Service
occupations
15.3%
#89 #25
#61
#38
#38
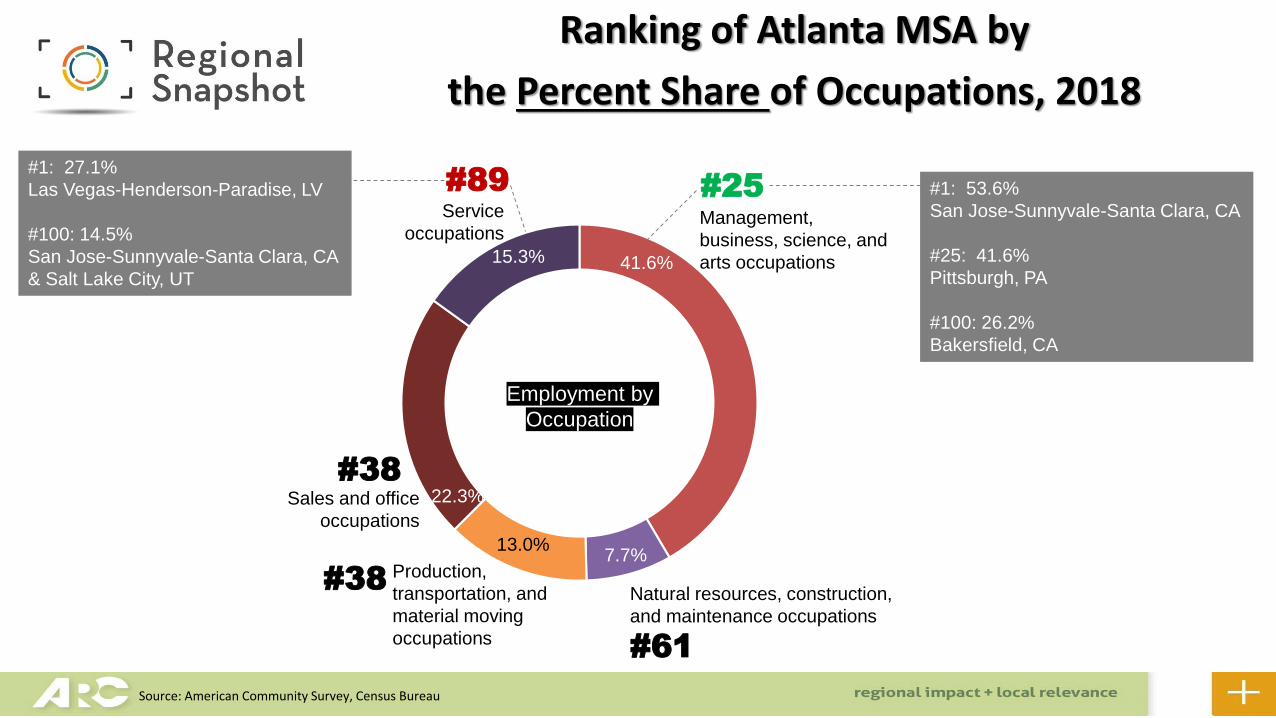
#1: 53.6%
San Jose-Sunnyvale-Santa Clara, CA
#25: 41.6%
Pittsburgh, PA
#100: 26.2%
Bakersfield, CA
#1: 27.1%
Las Vegas-Henderson-Paradise, LV
#100: 14.5%
San Jose-Sunnyvale-Santa Clara, CA
& Salt Lake City, UT

Source: American Community Survey, Census Bureau
Ranking of Atlanta MSA by
the Percent Share of Employment Class, 2018
Private wage and
salary workers
82.7%
Employment by
Type
Self-employed in
own not incorporated
business workers
5.4% Government
workers11.8%#57
#39
#38

Keyword 2:
Diversity

Source: Population Estimates by Race and Ethnicity (2018), Census Bureau
Ranking of Atlanta MSA
by Population by Race, 2018
Non-Hispanic White Non-Hispanic Black
Non-Hispanic
Asian/Pacific Islander
Hispanic
or Latino
Other
2,775,228 2,030,179
370,156
127,193
647,195
#14
#9 #2
#12
#19

Source: Population Estimates by Race and Ethnicity (2018), Census Bureau
Ranking of Atlanta MSA
by Population by Race, 2018
Non-Hispanic White Non-Hispanic Black Hispanic
or Latino
Other
2,775,228 2,030,179
127,193
647,195
#12
#19
#1: 3,158,193
New York-Newark-Jersey,
NY-NJ-PA
#3: 1,567,107
Washington-Arlington-
Alexandria, DC-VA-MD-WV
Non-Hispanic
Asian/Pacific Islander
370,156#14
#9 #2

Source: Population Estimates by Race and Ethnicity (2018), Census Bureau
Ranking of Atlanta MSA by
the Percent Share of Population by Race, 2018
Non-Hispanic White Non-Hispanic Black Hispanic
or Latino
Other
46.6% 34.1%
2.1%
10.9%
#12
#19#77 #6 #49
#22
#65
Non-Hispanic
Asian/Pacific Islander
6.2%#14
#2#9
#1: 49%
Jackson, MS
#2: 47.3%
Memphis,
TN-MS-AR
#1: 86.6% Knoxville, TN
#75: 51.4% New Orleans-Metairie, LA
Tuscan, AZ
#78: 46.3% New York-Newark-Jersey,
NY-NJ-PA
#100: 6.0% McAllen-Edinburg-Mission, TX
Keyword 3:
Young and Educated

Source: Population Estimates by Age (2018), Census Bureau
Ranking of Atlanta MSA
by Population by Age Group, 2018
Under 19 35-64 65 +
1,609,241 2,378,500 729,589
#6 #9 #12
20-34
1,232,621
#8
Remember that
Atlanta MSA ranked the 9th
in the total population
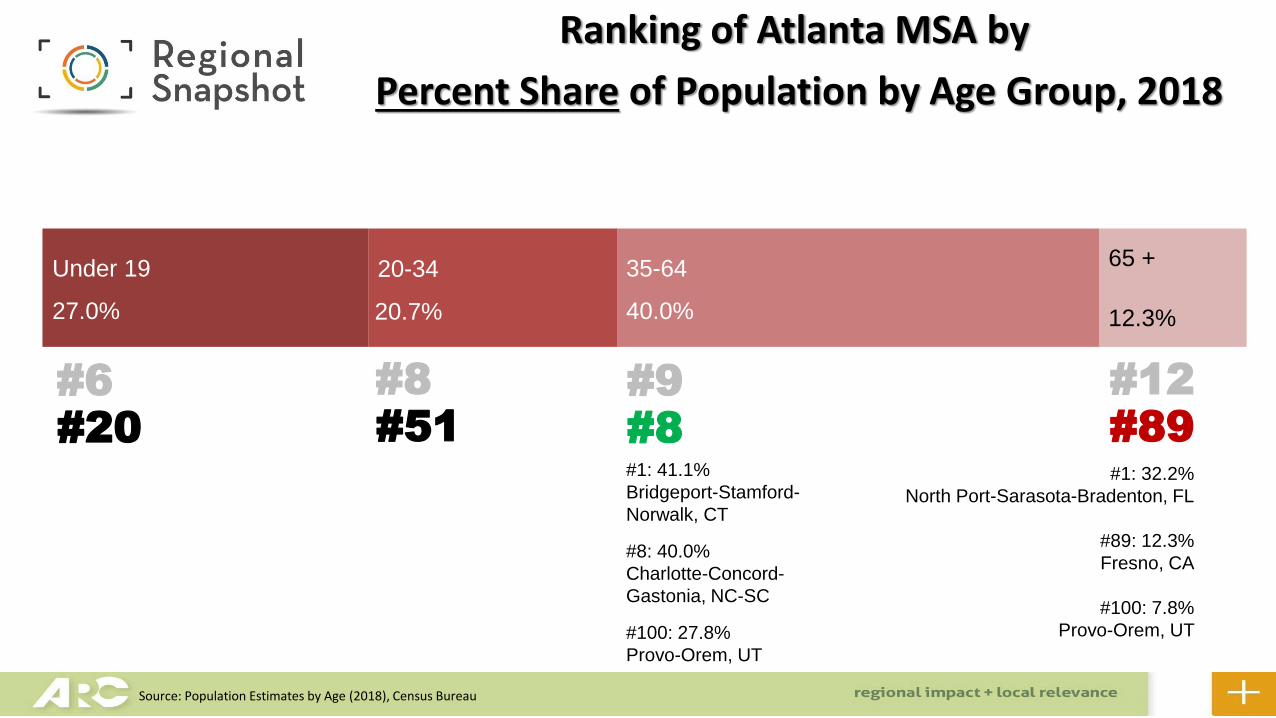
Source: Population Estimates by Age (2018), Census Bureau
Ranking of Atlanta MSA by
Percent Share of Population by Age Group, 2018
Under 19 35-64 65 +
27.0% 40.0% 12.3%
#6 #9 #12
20-34
20.7%
#8#20 #8 #89#51
#1: 32.2%
North Port-Sarasota-Bradenton, FL
#89: 12.3%
Fresno, CA
#100: 7.8%
Provo-Orem, UT
#1: 41.1%
Bridgeport-Stamford-
Norwalk, CT
#8: 40.0%
Charlotte-Concord-
Gastonia, NC-SC
#100: 27.8%
Provo-Orem, UT

Source: American Community Survey, Census Bureau
Ranking of Atlanta MSA by the Percent Share of
Population 25 Years and Over by Education Attainment, 2018
With only or less than a high school degree Bachelor’s degree Graduate or
professional
degree45.6% 39.4% 15%
#82 #18 #23#1: 78.0% Bakersfield, CA
#81: 45.8% Colorado Springs, CO
#83: 45.5% Provo-Orem, UT
#100: 22.3% San Jose-Sunnyvale-Santa Clara, CA
#1: 52.9% San Jose-Sunnyvale-
Santa Clara, CA
#17: 40.0% Portland-Vancouver-
Hillsboro, OR-WA
#19: 38.9% Des Moines-
West Des Moines, IA
#100: 16.2% Bakersfield, CA

Source: American Community Survey, Census Bureau
Ranking of Atlanta MSA by the Percent Share of the Population 25 Years and Over by Education Attainment, 2018
With only or less than a high school degree Bachelor’s degree Graduate or
professional
degree45.6% 39.4% 15%
#82 #18 #23#1: 25.4%
Washington-Arlington-Alexandria, DC-VA-MD-WV
#22: 15.1%
Portland-Vancouver-Hillsboro, OR-WA
#24: 14.9%
Buffalo-Cheektowaga-Niagara Falls, NY
#99: 5.5%
McAllen-Edinburg-Mission, TX & Stockton-Lodi, CA

Keyword 4:
Housing
Characteristics

Source: American Community Survey, Census Bureau
Ranking of Atlanta MSA by
Percent Share of Housing Units by Year Built, 2018
# Total housing units
2,331,002 #9 31.6%
38.2%
30.2%
Units built 2000 or later
#15
Units built 1980 to 1999
Units built 1979 or earlier
#5
#93

Source: American Community Survey, Census Bureau
Ranking of Atlanta MSA by
Percent Share of Housing Units by Year Built, 2018
# Total housing units
2,331,002 #9 31.6%
38.2%
30.2%
Units built 2000 or later
#15
Units built 1980 to 1999
Units built 1979 or earlier
#5
#93
#1: 80%
Buffalo-Cheektowaga-Niagara Falls, NY
#100: 19.4%
Las Vegas-Henderson-Paradise, LV
#1: 42.8%
Palm Bay-Melbourne-Titusville, FL
#100: 12.9%
Buffalo-Cheektowaga-Niagara Falls, NY
#1: 43.6%
Austin-Round Rock, TX
#100: 9.5%
Buffalo-Cheektowaga-Niagara Falls, NY

Source: American Community Survey, Census Bureau
Ranking of Atlanta MSA
by Housing Tenure and Occupancy Rate
# Total housing units, 2018
2,331,002 #9
% Vacant
Housing Units
8.3 %
#64
91.7% Occupied Units #34
Owner-Occupied64%
Renter36%
#58 #43

Source: American Community Survey, Census Bureau
Ranking of Atlanta MSA by
Housing Value and Cost Burden by Tenure
Owner-Occupied64%
Renter36%
#58 #43
Median Value of Owner-Occupied Housing, 2018
$233,700 #48
#1: San Jose-Sunnyvale-Santa Clara, CA
…
#47: Cape Coral-Fort Myers, FL
#49: Bakersfield, CA
…
#100: McAllen-Edinburg-Mission, TX
Renter-occupied units for which gross rents are
equal to or greater than 30% of income, 2018
50% #40
#1: 62.7 %
Miami-Fort Lauderdale-
West Palm Beach, FL
…
#100: 39.9%
Ogden-Clearfield, UT

Keyword 5:
Income

Source: American Community Survey, Census Bureau
Ranking of Atlanta MSA by Percent Share of Households by Income Range, 2018
37.1%
30.1%
23.7%
% Household income $200,000 or more, 2018 #25
% Household income $75,000 to $199,999, 2018
% Household income less than $35,000, 2018
#35
#79
9.1%
% Household income $35,000 to $74,999, 2018 #61
Median Household Income
$69,464 #29

Source: American Community Survey, Census Bureau
Ranking of Atlanta MSA by Percent Share of Population by Household Income, 2018
37.1%
30.1%
23.7%
% Household income $200,000 or more, 2018 #25
% Household income $75,000 to $199,999, 2018
% Household income less than $35,000, 2018
#35
#79
9.1%
% Household income $35,000 to $74,999, 2018 #61
Median Household Income
$69,464 #29#1: $ 124,696
San Jose-Sunnyvale-Santa Clara, CA
#28: $ 70,463
Madison, WI
#30: $ 69,445
Dallas-Fort Worth-Arlington, TX
#100: $ 39,165
McAllen-Edinburg-Mission, TX
Source: American Community Survey, Census Bureau
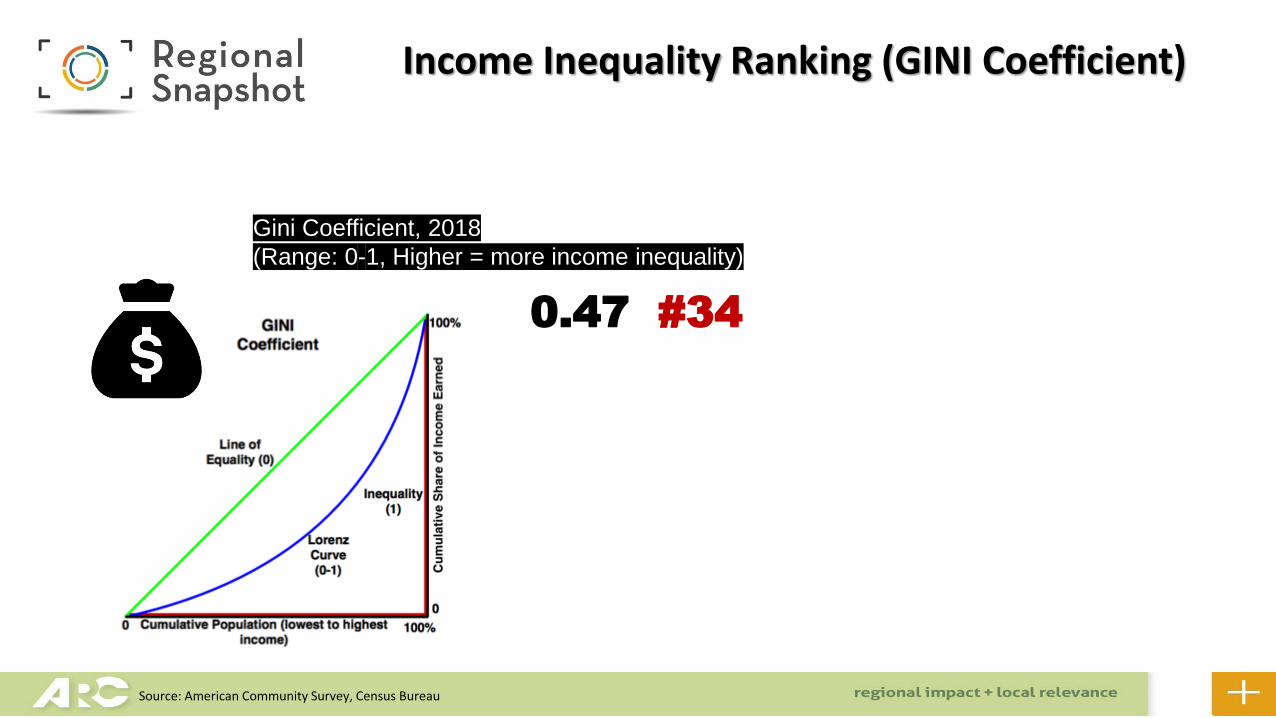
Income Inequality Ranking (GINI Coefficient)
Gini Coefficient, 2018
(Range: 0-1, Higher = more income inequality)
0.47 #34

Source: American Community Survey, Census Bureau
Income Inequality Ranking (GINI Coefficient)
Gini Index, 2018
(Range: 0-1, Higher = more income inequality)
0.47 #34
#1: 0.55
Bridgeport-Stamford-Norwalk, CT
#34: 0.47
Dallas-Fort Worth-Arlington, St. Louis, Orlando-Kissimmee-Sanford, San Antonio-New
Braunfels, Pittsburgh, Cincinnati, Indianapolis-Carmel-Anderson, San Jose-Sunnyvale-
Santa Clara, Providence-Warwick, Oklahoma City, Louisville/Jefferson County, Hartford-
West Hartford-East Hartford, Tucson, Fresno, Tulsa, Greenville-Anderson-Mauldin,
Bakersfield, Knoxville, Augusta-Richmond County
#100: 0.38
Ogden-Clearfield, UT

Keyword 6:
Poverty and Health

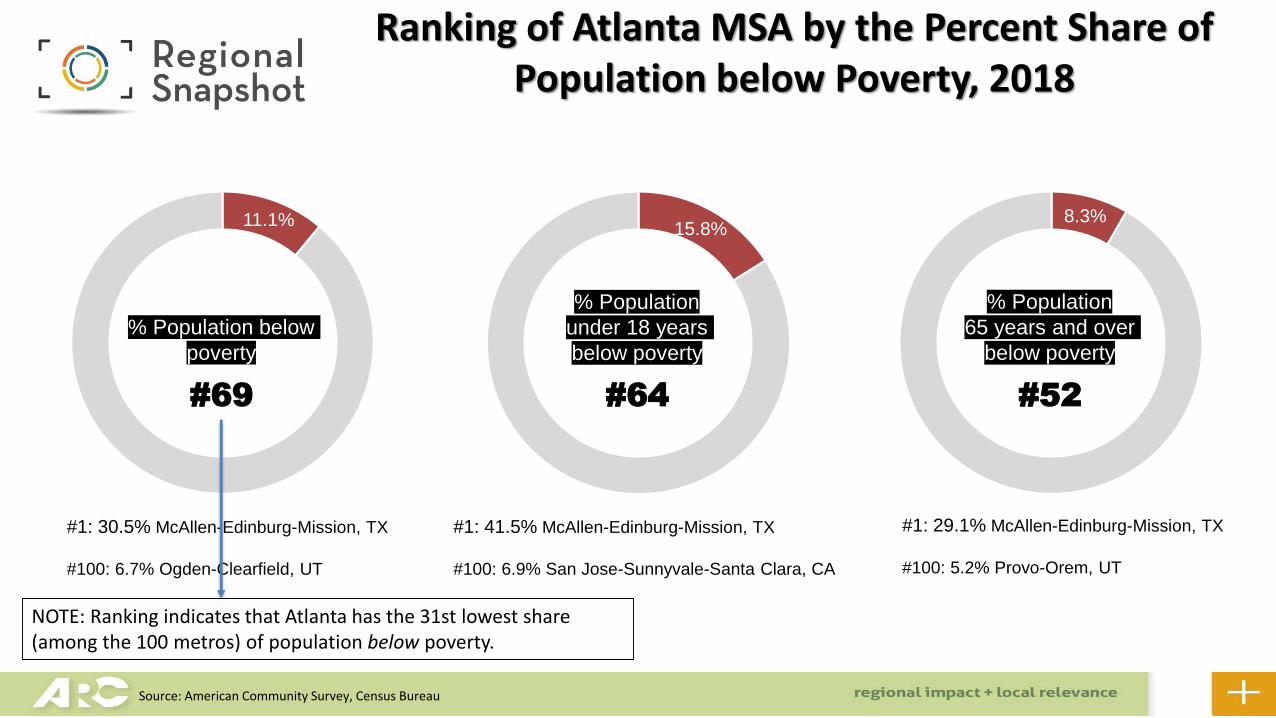
Source: American Community Survey, Census Bureau
Ranking of Atlanta MSA by Percent Share of Population below Poverty, 2018
% Population below
poverty
11.1%
#69
% Population
under 18 years
below poverty
15.8%
#64
% Population
65 years and over
below poverty
8.3%
#52
NOTE: Ranking indicates that Atlanta has the 31st lowest share (among the 100 metros) of population below poverty.
Source: American Community Survey, Census Bureau
Ranking of Atlanta MSA by the Percent Share of Population below Poverty, 2018
% Population below
poverty
11.1%
#69
% Population
under 18 years
below poverty
15.8%
#64
% Population
65 years and over
below poverty
8.3%
#52
#1: 30.5% McAllen-Edinburg-Mission, TX
#100: 6.7% Ogden-Clearfield, UT
#1: 41.5% McAllen-Edinburg-Mission, TX
#100: 6.9% San Jose-Sunnyvale-Santa Clara, CA
#1: 29.1% McAllen-Edinburg-Mission, TX
#100: 5.2% Provo-Orem, UT
NOTE: Ranking indicates that Atlanta has the 31st lowest share (among the 100 metros) of population below poverty.

Source: American Community Survey, Census Bureau
Birth Rate Ranking and Percent Share of the Population with Health Insurance, 2018
Birth Rate per 1,000 Women
15 to 50 Years Old
4.2 #87
Population with Health Insurance
86.8% #92
Population under 19 with Health
Insurance
91.3% #93
NOTE: Ranking indicates Atlanta has the 8th highest share (among the 100 metros) of population without health insurance.
NOTE: Ranking indicates Atlanta has the 7th highest share (among the 100 metros) of population without health insurance.

Source: American Community Survey, Census Bureau
Birth Rate Ranking and Percent Share of the Population with Health Insurance, 2018
Birth Rate per 1,000 Women
15 to 50 Years Old
4.2 #87
Population with Health Insurance
86.8% #92
Population under 19 with Health
Insurance
91.3% #93
#1: 8.0
Wichita, KS
#87: 4.2
Los Angeles-Long Beach-Anaheim, CA
#100: 3.0
Deltona-Daytona Beach-Ormond Beach, FL
NOTE: Ranking indicates Atlanta has the 8th highest share (among the 100 metros) of population without health insurance.
NOTE: Ranking indicates Atlanta has the 7th highest share (among the 100 metros) of population without health insurance.