2020 nationwide cybersecurity review
TRANSCRIPT

2020Nationwide Cybersecurity ReviewSummary Report

AcknowledgmentsThe Multi-State Information Sharing and Analysis Center® (MS-ISAC®) and Elections Infrastructure Information Sharing and Analysis Center® (EI-ISAC®) would like to thank everyone who has previously participated and continues to participate in the Nationwide Cybersecurity Review (NCSR). Your continued support helps us work towards our mission of improving the overall cybersecurity posture of the nation’s state, local, tribal, and territorial (SLTT) governments.
The MS-ISAC and EI-ISAC would also like to strongly thank all of our partners. With partner support and increased participation, we can continue to improve cybersecurity maturity across the nation.
The MS-ISAC and EI-ISAC would like to acknowledge the Department of Homeland Security (DHS) Cybersecurity and Infrastructure Security Agency (CISA) for their continued partnership. DHS CISA provides funding for MS-ISAC and EI-ISAC services through a Cooperative Agreement, making progress toward the mission a reality.
We would also like to acknowledge and thank the members of the MS-ISAC Metrics Workgroup for their continued support. Their knowledge, expertise, and dedication assist in the continued success of the NCSR. Finally, we would like to highlight the individuals who created this report: Eugene Kipniss, Tyler Scarlotta, and Emily Sochia.
This material is based upon work supported by the U.S. Department of Homeland Security under Grant Award Number 19PDMSI00002-02-00.
The views and conclusions contained in this document are those of the authors and should not be interpreted as necessarily representing the official policies, either expressed or implied, of the U.S. Department of Homeland Security.

2020 Nationwide Cybersecurity Review Summary Report i
ContentsAcronyms ii
Preface iii
Executive Summary 1
2020 Summary Report 5
High Score Highlights 6
Low Score Areas of Interest and Key Deficiencies 7
General Resources and Recommendations 9
Current SLTT Cybersecurity Maturity at a Glance 10
NCSR Participation 16
NCSR Demographic Analyses 20
NCSR and CIS Controls Implementation Group Scoring 24
Automation Questions 25
Analysis by Function 28
Subsector Peer Groups 42
Partners 45

2020 Nationwide Cybersecurity Review Summary Reportii
AcronymsCISA Cybersecurity and Infrastructure Security Agency
DHS U.S. Department of Homeland Security
EI-ISAC Elections Infrastructure Information Sharing and Analysis Center
MS-ISAC Multi-State Information Sharing and Analysis Center
NACo National Association of Counties
NASCIO National Association of State Chief Information Officers
NCSR Nationwide Cybersecurity Review
NIST National Institute of Standards and Technology
NIST CSF National Institute of Standards and Technology Cybersecurity Framework
SLTT State, Local, Tribal, and Territorial

2020 Nationwide Cybersecurity Review Summary Report iii
PrefaceIn June of 2009, the United States Congress directed the U.S. Department of Homeland Security (DHS) to develop a cyber-network security assessment that would measure gaps and capabilities of state, local, tribal, and territorial (SLTT) governments’ cybersecurity programs. The first Nationwide Cybersecurity Review (NCSR) was conducted in 2011 by DHS. In 2013, DHS partnered with the Multi-State Information Sharing and Analysis Center® (MS-ISAC®), the National Association of State Chief Information Officers (NASCIO), and the National Association of Counties (NACo) to develop and conduct the second NCSR. Since 2013, the NCSR has been conducted on an annual basis, and 2020 marks the ninth year the self-assessment has been conducted.
A major change occurred in 2019, when FEMA made the NCSR a requirement for recipients and sub-recipients of the two major programs under the Homeland Security Grant Program (HSGP)—the State Homeland Security Program (SHSP) and the Urban Area Security Initiative (UASI).
The NCSR measures maturity according to the National Institute of Standards and Technology (NIST) Cybersecurity Framework’s (CSF) Function areas and Categories (Version 1.1), in order to provide insight on the level of maturity and risk awareness of SLTT governments’ information security programs. This allows decision-makers to understand how their risk tolerance and maturity compare with similar organizations and how they facilitate self-comparison from year-to-year. The NCSR is scored on a seven-point scale, with seven being the highest possible score and one being the lowest. The minimum recommended maturity level for SLTT governments is a score of five on the NCSR scale.
FIguRE 1 Figure 1 provides a full breakdown of the NCSR Maturity Level response scale along with the scores associated with each maturity level.
1 2 3 4 5 6 7Not
PerformedInformally Performed
Documented Policy
Partially Documented
Standards and/or
Procedures
Implementation in Process
Tested and Verified
Optimized

Executive Summary

2020 Nationwide Cybersecurity Review Summary Report2
The NCSR continued to have high participation from the SLTT community in 2020. NCSR results represent 2,934 organizations from across the entire SLTT community. Figures 2 and 3 below depict the State, Local, Tribal, Territorial, State – Elections, and Local – Elections peer groups’ overall maturity averages across all NIST CSF functions.
FIguRE 2 Figure 2 displays the average across all NIST CSF functions for the State, Local, Tribal, and Territorial peer groups. The vertical red line on this graph and other graphs in this report represents the recommended minimum maturity level of Implementation in Process, represented by an average score of 5.
State 4.88
Local 3.80
Tribal 3.94
Territorial 3.05
1 2 3 4 5 6 7
FIguRE 3 Figure 3 displays the average across all NIST CSF functions for the “State – Elections” and “Local – Elections” peer group subsectors. The “State – Elections” subsector includes entities such as state Board of Elections offices and Secretary of State offices. The “Local – Elections” subsector includes entities such as local Board of Elections offices and local Registrar offices.
State–Elections 4.04
Local–Elections 4.12
1 2 3 4 5 6 7
→ All SLTT organization peer groups continued to score below the overall minimum recommended maturity level of 5 (Implementation in Process) on the NCSR’s seven-point scale.
The States increased in maturity and are currently at a level of 4, “Partially Documented Standards and/or Procedures”, but are not at the recommended minimum maturity level of 5.
The Local and Tribal groups lag behind the States, and both score at a maturity level of 3, though both did increase in maturity.
The Territorial group improved by reporting a maturity level of 3. The State – Elections subsector scored significantly lower than the non-elections State
counterparts.
→ States scored at the recommended minimum maturity level of 5 for the prioritized basic cybersecurity controls represented by the areas of the NIST CSF that map to CIS Controls Implementation Group 1 (IG1). This indicates that while States need to increase in maturity in some areas of the entire NIST CSF, key basic cybersecurity functions are being performed at the recommended level of maturity and formalization.
The Local and Tribal peer groups both scored at the level of 4 in maturity in the areas of the NIST CSF that map to IG1, while Territories scored at a level of 3 in these areas on average.
→ The scores of all peer groups (State, Local, Tribal, and Territorial) improved over the past year.
Progress toward higher maturity has continued, though no peer group has on average reached the recommended minimum maturity level.
→ Adoption and implementation of a security framework has a significant correlation with increased organizational cyber maturity.

2020 Nationwide Cybersecurity Review Summary Report 3
Entities that employed a security framework, such as the NIST CSF, ISO 27000 series, or the CIS Controls, scored 52% higher than organizations that did not. This is significant, as adopting a framework enables organizations to assess themselves regularly against an accepted standard, plan a strategy to address their weaknesses, and continually improve their maturity. Organizations should adopt a framework to gain these benefits.
→ Continuous engagement is correlated with higher cybersecurity maturity of SLTTs.
Organizations that have taken the NCSR three or more times since 2015 scored 20% higher than those organizations that took the NCSR two or less times in the same period. Measuring cybersecurity maturity can assist with determining areas for future investment and effort to increase capabilities.
Membership in the MS-ISAC also correlates to improved organizational engagement and higher maturity scores. Longer-term members exhibited 7% higher scores, on average, than newer members. Adoption of MS-ISAC services was associated with increased maturity in the relevant NIST CSF function or category. Services that provide monitoring or cybersecurity countermeasures directly provide capabilities. Adoption of these services, combined with policy and procedure development by the member, ultimately results in increases in maturity.
→ These top five security concerns remained the same for the sixth consecutive year:
Lack of sufficient funding Increasing sophistication of threats Emerging technologies Lack of documented processes Inadequate availability of cybersecurity professionals
Recognizing the security concerns of SLTT organizations, it has become an MS-ISAC priority to investigate and deliver low-cost and high-impact cybersecurity services and resources, including those that can be delivered to SLTT organizations at no cost by leveraging federal funding.
No-cost services, such as the MS-ISAC’s Malicious Domain Blocking and Reporting (MDBR), a protective DNS service, offer tremendous value and capability to organizations at all maturity levels with minimal impact to organizational resources. Organizations that were utilizing MDBR scored 4% higher on average across all NIST CSF functions compared to organizations that were not.
→ There was, on average, a positive correlation between increased staffing and increased scoring in maturity.
Organizations that had at least one security staff member scored 22% higher, on average, than those that had no full-time security staff. However, more than 12% of participants reported their organization had no full-time security employees.
The MS-ISAC recommends that increased emphasis be placed on augmenting or developing the cybersecurity capabilities of Local, Tribal and Territorial organizations. Regional grant-funded cybersecurity coordinators have been effective in augmenting staff, as have professional development programs such as FedVTE.
→ Two of the highest-scoring categories in the NCSR include identity management and continuous monitoring activities.
→ The lowest-scoring categories measured in the NCSR include risk management and supply chain risk management. Cybersecurity organizations, such as CISA and MS-ISAC, have published best practice materials specific to supply chain and third-party vendor processes. Efforts to create resources and educational materials for SLTTs on cyber risk management and supply chain risk management should continue to be a priority.

2020 Nationwide Cybersecurity Review Summary Report4
→ The State, Local, Tribal, and Territorial peer groups of participants reported a low rate of full implementation for two-factor authentication. This is a critical capability that provides significant risk reduction value. Prioritizing implementation of this capability, especially on internet-facing assets, greatly increases the potential time and cost investment of an adversary to compromise a network or asset. SLTT organizations should prioritize investment in two- and multi-factor authentication solutions moving forward.
The NCSR provides critical cyber maturity information about the SLTT community as a whole, as well as specific information about each of the SLTT subsectors. While this assessment provides significant areas of recommendation for each subsector, future iterations of this survey will include an increased emphasis on individualized feedback for each organization based on their specific answers and maturity levels. The relative importance and accuracy of the NCSR has been enhanced by the dramatic increase in participation of SLTT organizations; therefore, the organizations that participate in the NCSR can expect increasing levels of relevant feedback from year to year.

2020 Summary Report

2020 Nationwide Cybersecurity Review Summary Report6
High Score Highlights
The 2020 State peer group scores continued to increase slightly across the NIST CSF functions and are either at the minimum recommended maturity level of Implementation in Process (5) or are very close. For the first time since the NCSR aligned to the NIST CSF, the State peer group scored at the level of 5 in two NIST CSF function areas. This indicates the State peer group has been focused on policy and procedure development to formalize cybersecurity activity and is on the verge of having all policies and procedures in implementation across the five NIST CSF functions.
The 2020 Local peer group experienced a year-over-year increase in all functions, indicating cybersecurity maturity is increasing. For the first time since 2017, the Local peer group reached the maturity level of Partially Documented Standards and/or Procedures (4) in one function: Protect.
The 2020 Tribal peer group had a significant year-over-year increase of 11% across all NIST CSF functions. Additionally, on average, the returning Tribal participants that took the NCSR in 2019 and 2020 reported an increase of 21% across all NIST CSF functions.
In 2019, a total of 2,495 organizations took the NCSR for the first time. Out of that group, 1,610 of them returned to participate in the 2020 NCSR and saw an improvement in maturity of 6% across all functions on average. In general, organizations that participated more than one year in the NCSR scored higher than those that only responded once.
“Protect – Identity Management and Access Control” was either the highest scoring or second-highest scoring category in the Protect function for the State, Local, Tribal, and Territorial peer groups, as well as the “State – Elections” and “Local – Elections” subsectors. Each peer group or subsector reached Implementation in Process (5) or Partially Documented Standards and/or Procedures (4). This indicates these entities understand the importance of authenticating users and managing access to sensitive information.
“Detect – Security Continuous Monitoring” was the highest scoring category within the Detect function for the Local, Tribal, and Territorial peer groups, as well as the “State – Elections” and “Local – Elections” subsectors. This indicates these entities are actively monitoring for cybersecurity events and remaining vigilant to threats.
State Year-to-Year Improvement
Local Year-to-Year Improvement
Tribal Year-to-Year Improvement
Repeated Participation in the NCSR Correlates With Higher Scores
Protect – Identity Management and Access Control (PR.AC)
Detect – Security Continuous Monitoring (DE.CM)

2020 Nationwide Cybersecurity Review Summary Report 7
Low Score Areas of Interest and Key Deficiencies
“Identify – Risk Management Strategy” and “Identify – Supply Chain Risk Management” continue to be the lowest scoring categories within the Identify function. For each of the State, Local, Tribal, and Territorial peer groups, the Supply Chain Risk Management category was the lowest scoring category of all within the NIST CSF. The supply chain category was first introduced in the 2018 NCSR, which contributed to a decrease in participant scores within the Identify function that year. This is a relatively new topic, and the lack of guidelines for implementation and resources to assist with these functions may have contributed to lower scores. Entities expressed they did not have the resources to begin implementing formalized supply chain security practices in their organization. Guidance regarding language to be included in contracts or processes may be helpful and contribute to increased maturity within this category. In the past year, the MS-ISAC Metrics Workgroup issued a “Supply Chain Risk Management Guide” that provides general recommendations and resources for organizations looking to formalize such activity. Additionally, CIS published a guide titled, Managing Cybersecurity Supply Chain Risks in Election Technology: A Guide for Election Technology Providers. Though created for the elections community, this guide provides risk mitigation approaches specific to supply chain activities that can be utilized by any SLTT organization. The MS-ISAC recommends that further resources be created or existing ones be expanded to assist SLTT entities with this cybersecurity activity. Since numerous cyber-attacks have leveraged exploitation of vendors in SLTT supply chains, this is an area of increasing concern and need for the community. The SolarWinds intrusion is a recent example of a third-party provider compromise that affected the community and allowed for unauthorized access to systems through malware distributed by threat actors via what appeared to be legitimate software updates.
The MS- and EI-ISACs provide no-cost IP and domain monitoring, which acts as a form of threat intelligence sharing and can be implemented and formalized to increase maturity in the “Risk Assessment” category within the Identify function. Respondents to the 2020 NCSR that utilize these services scored on average 8% higher in the “Identify – Risk Assessment” category than those that did not. In addition, longer-term members of the MS-ISAC exhibit 7% higher scores, on average, than newer members. The longer-term members are defined as those holding MS-ISAC membership prior to the start of 2019. By becoming a member and utilizing these services, participants see higher scores in maturity.
The MS- and EI-ISAC’s Vulnerability Management Program, a component of the IP and domain monitoring service, can be leveraged by SLTT organizations to increase maturity in the “Risk Assessment” category within the Identify function, as well as in the Detect function’s “Security Continuous Monitoring” category. This service’s Web Profiler reports monthly on out-of-date software, while the Port Profiler reports quarterly on open ports on SLTT governments’ internet facing devices so that they can mitigate these risks. The MS-ISAC observed that organizations leveraging the Web Profiler scored on average 6% higher in maturity in the “Identify – Risk Assessment” category, and 1% higher in the “Detect – Security Continuous Monitoring” category. 2020 was the last year in which the MS-ISAC operated the Vulnerability Management Program including the Web and Port Profilers. As of late 2020, these services have been replaced by the CISA Cyber Hygiene: Vulnerability Scanning Program, which is a no-cost external vulnerability scanning service that can also bolster capability within these categories mentioned. SLTT organizations that begin using these services and formalize their use with policy and procedures can improve their maturity and their NCSR scores.
Identify – Risk Management Strategy and Supply Chain Risk Management (ID.RM, ID.SC)
2020 Nationwide Cybersecurity Review Summary Report8
“Respond – Improvements” was the lowest scoring category within the Respond function for the State, Local, and Territorial peer groups as well as the “State – Elections” and “Local – Elections” subsectors. This indicates there is a common weakness within these peer groups where policies and procedures have not been implemented consistently. This important category covers how an organization assesses lessons learned and after-action reporting following an incident, as well as how they update strategies, policies, or procedures accordingly.
For the Local peer group, the “Recover – Communications” category was the lowest scoring within the Recover function. This category pertains to coordinating recovery activities with the necessary parties, internal and external. This includes activity centered on managing public relations and repairing reputation as part of the recovery effort. As part of incident response and recovery planning, organizations should create and formalize processes to ensure these activities occur.
The lowest scoring category within the Detect function for the Local and Tribal peer groups was “Detect – Detection Processes.” This category covers how an organization maintains and manages detection processes to identify anomalous events. Both peer groups are scoring at the level of Documented Policy (3) and will need to develop standards and procedures around this category’s activities in order to advance in maturity.
Overall, the Protect function is either the highest scoring or one of the highest scoring functions for the State, Local, Tribal, and Territorial peer groups. However, all four peer groups score relatively low in two specific sub-categories under the “Protect – Data Security” category. These two activities involve integrity checking mechanisms used to verify the integrity of software, firmware, and hardware. All groups are under an average score of 4 (Partially Documented Standards and/or Procedures). It is recommended that organizations utilize a process to formalize policy and procedure activity in these areas. There are also open-source tools available specific to these activities that may be able to assist, or funding and services could be made available to bolster capability in this area. Organizations should also prioritize investment in capabilities that enable integrity checking of software, firmware, and hardware.
More than 12% of participants reported their organization had no full-time security employees. The majority of these respondents with no full-time security employees stated they have 1 to 49 total employees. Organizations that have one security employee or more scored at least 22% higher in maturity than organizations with no security staff. With a lack in security staffing, it is difficult to begin assessing and implementing an appropriate cybersecurity program.
The Federal Virtual Training Environment (FedVTE) can assist entities in increasing their scores within many functions, including “Protect – Awareness and Training (PR. AT)” through staff training and professional development. This is a no-cost repository of online, on-demand cybersecurity coursework for professionals who are federal employees, SLTT employees, or veterans. An organization can utilize FedVTE to expand their existing staff’s capabilities and knowledge base by reviewing cybersecurity labs and training courses. This can allow for non-security staff to possibly specialize in security as a job function, which may help to offset the challenge reported by SLTTs stating there is a lack of available cybersecurity professionals in the workforce.
There are positive examples of regional cybersecurity coordinator positions established within states with the capacity to provide shared services to SLTT partners. This approach could be expanded and furthered through federal, state, or regional level financial and organizational support.
Respond – Improvements (RS.IM)
Recover – Communications (RC.CO)
Detect – Detection Processes (DE.DP)
Protect – Data Security (PR.DS): Integrity Checking Mechanisms
Lack of Security Staffing

2020 Nationwide Cybersecurity Review Summary Report 9
General Resources and Recommendations
No-cost open-source resources and software can be utilized for the activities described within the NIST CSF. The publicly available MS-ISAC Cybersecurity Resources Guide provides alignment of risk management resources to the NIST CSF. By utilizing the resources mapped to the NIST CSF activities, an organization can outline its yearly strategic plan and identify areas for improvement and potentially train current employees to be subject matter experts.
The MS-ISAC published a Policy Template Guide that aligns publicly available SANS policy templates to 35 NIST CSF sub-categories. These policies can be modified or adopted by organizations to formalize their cybersecurity processes for every NCSR question and all NIST CSF sub-categories. This can be leveraged to improve maturity in the applicable areas and achieve at least a score of 3 (Documented Policy) and in some cases a 5 (Implementation in Process), which is the recommended minimum maturity level.
A general practice that can assist organizations in increasing maturity scores is to take a cybersecurity assessment, like the NCSR, and adopt a cybersecurity framework as a guiding set of practices or standards. With these two pieces in place, an organization can plan out which improvements to target for funding and effort, and then repeatedly assess themselves to compare maturity over time. Participants who adopted at least one cybersecurity framework scored 52% higher on average than organizations that did not select a security framework. 25% of all respondents stated they currently do not utilize a formal security framework. Framework examples include NIST 800-53, the NIST CSF, the CIS Controls, and ISO 27000 Series.
All Functions
general Recommendation: Identify Necessary Improvements and Assess to Measure Changes in Maturity Over Time
2020 Nationwide Cybersecurity Review Summary Report10
Current SLTT Cybersecurity Maturity at a Glance
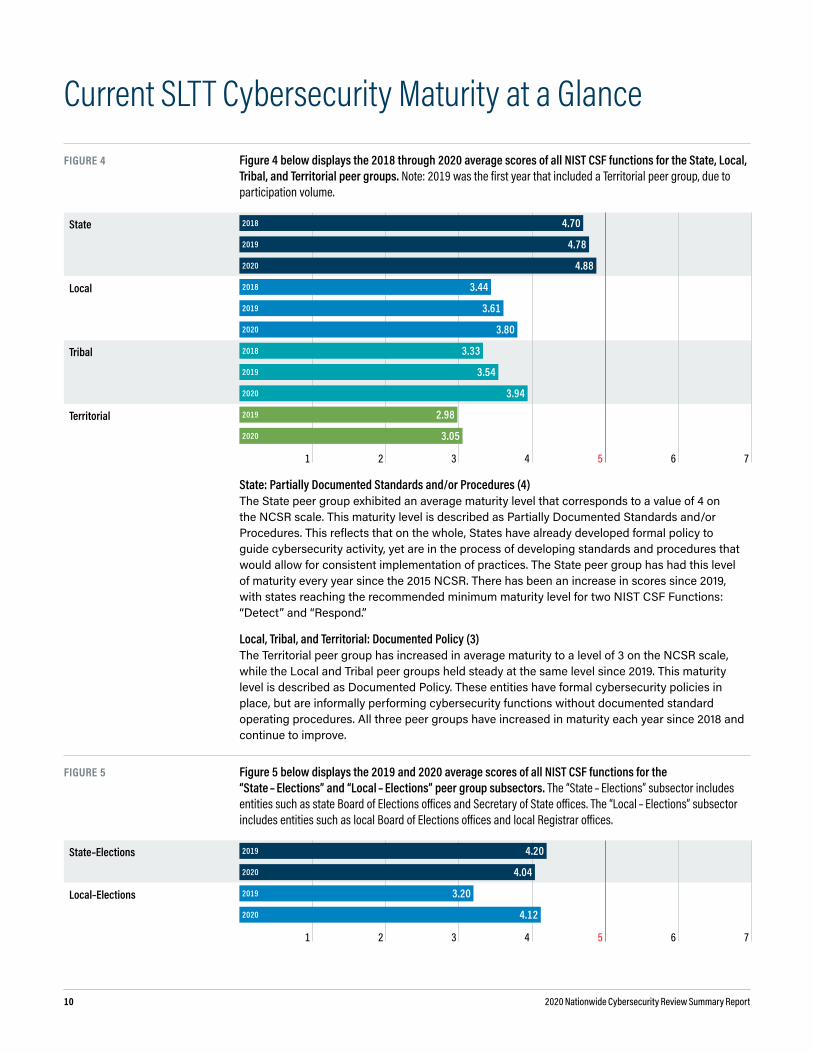
FIguRE 4 Figure 4 below displays the 2018 through 2020 average scores of all NIST CSF functions for the State, Local, Tribal, and Territorial peer groups. Note: 2019 was the first year that included a Territorial peer group, due to participation volume.
State 2018 4.70
2019 4.78
2020 4.88
Local 2018 3.44
2019 3.61
2020 3.80
Tribal 2018 3.33
2019 3.54
2020 3.94
Territorial 2019 2.98
2020 3.05
1 2 3 4 5 6 7
State: Partially Documented Standards and/or Procedures (4)The State peer group exhibited an average maturity level that corresponds to a value of 4 on the NCSR scale. This maturity level is described as Partially Documented Standards and/or Procedures. This reflects that on the whole, States have already developed formal policy to guide cybersecurity activity, yet are in the process of developing standards and procedures that would allow for consistent implementation of practices. The State peer group has had this level of maturity every year since the 2015 NCSR. There has been an increase in scores since 2019, with states reaching the recommended minimum maturity level for two NIST CSF Functions: “Detect” and “Respond.”
Local, Tribal, and Territorial: Documented Policy (3)The Territorial peer group has increased in average maturity to a level of 3 on the NCSR scale, while the Local and Tribal peer groups held steady at the same level since 2019. This maturity level is described as Documented Policy. These entities have formal cybersecurity policies in place, but are informally performing cybersecurity functions without documented standard operating procedures. All three peer groups have increased in maturity each year since 2018 and continue to improve.
FIguRE 5 Figure 5 below displays the 2019 and 2020 average scores of all NIST CSF functions for the “State – Elections” and “Local – Elections” peer group subsectors. The “State – Elections” subsector includes entities such as state Board of Elections offices and Secretary of State offices. The “Local – Elections” subsector includes entities such as local Board of Elections offices and local Registrar offices.
State–Elections 2019 4.20
2020 4.04
Local–Elections 2019 3.20
2020 4.12
1 2 3 4 5 6 7

2020 Nationwide Cybersecurity Review Summary Report 11
State – Elections: Partially Documented Standards and/or Procedures (4)State elections organizations, such as State Boards of Elections or Offices of the Secretary of State, exhibited an average maturity level that corresponds to a value of 4 (Partially Documented Standards and/or Procedures) on the NCSR scale. They lagged behind their non-elections state government counterparts, which scored a 4.88, compared to the state elections’ 4.04 average. This score level reflects that, overall, state elections organizations have already developed formal policy to guide cybersecurity activity, yet are in the process of developing standards and procedures that would allow for consistent implementation of cybersecurity practices. State elections organizations did experience a decrease in maturity measured from 2019 to 2020, but the group changed in participation with 32% of 2020 (6 of 19 total) participants being first-time participants in this group. Membership in the MS-ISAC and EI-ISAC provides access to federally funded services, such as cybersecurity assessments that evaluate their current resiliency, in addition to a portal to connect with other elections entities and partners to collaborate and share information. Elections offices have only been engaged with the MS-ISAC and EI-ISAC as a specifically segmented group of the SLTT community for a few years, with the EI-ISAC itself having been founded in 2018. Due to the recent availability of these EI-ISAC resources, the community may require further years of participation to see meaningful growth in cybersecurity maturity. To get a better understanding of how the multiple-year participants in this group performed, see the section further in the report (page 13) on returning NCSR participants for both elections and non-elections entities. This additional section shows that the returning state level participants displayed a year to year increase in their scoring.
Local – Elections: Partially Documented Standards and/or Procedures (4)Local elections organizations, such as local Boards of Elections and local Registrar offices, exhibited an average maturity level that corresponds to a value of 4 (Partially Documented Standards and/or Procedures) on the NCSR scale. This was a significant increase compared to the year prior, however, the group dramatically changed with 23 of the 39 participants being first-time respondents to the NCSR. Local elections organizations scored higher this year than non-elections local organizations with a 4.12 compared to 3.80, respectively. These entities have already developed formal policy to guide cybersecurity activity, yet are in the process of developing standards and procedures that would allow for consistent implementation of cybersecurity practices. To get a better understanding of how the multiple-year participants in this group performed, which is a more accurate indicator of the maturity growth of the community, see the section further in the report (page 13) on returning NCSR participants for both elections and non-elections entities. This additional section shows that the returning local level participants displayed a year to year increase in their scoring.

2020 Nationwide Cybersecurity Review Summary Report12
FIguRE 6 2020 Highlights: Strengths and Deficiencies. Within each NIST CSF function below, the coloring is based on the seven-point maturity scale mirroring the figure at the bottom of this page.
State Local Tribal Territorial State – Elections Local – Elections
Organization Total 50 2,321 17 6 19 39
IDENTIFY 4.36 3.55 3.33 3.07 3.77 3.95
Asset Management 4.22 3.82 3.26 2.72 3.93 4.00
Business Environment 4.58 3.86 3.67 4.47 3.88 4.54
Governance 5.03 3.76 3.62 3.33 4.20 4.35
Risk Assessment 4.87 3.78 3.94 3.11 4.30 4.18
Risk Management Strategy 3.79 3.18 3.02 2.56 3.42 3.46
Supply Chain Risk Management 3.68 2.90 2.49 2.20 2.87 3.17
PROTECT 4.98 4.16 4.18 3.36 4.09 4.41
Identity Mgmt. and Access Control 5.25 4.81 4.91 4.38 4.66 5.07
Awareness and Training 5.29 4.29 4.08 3.63 4.69 4.67
Data Security 4.72 4.06 3.86 3.02 4.11 4.26
Info. Protection Proc. and Procedures 5.00 3.84 3.83 2.83 4.02 4.11
Maintenance 4.88 4.04 4.41 3.00 3.29 4.04
Protective Technology 4.73 3.93 3.98 3.27 3.74 4.29
DETECT 5.12 3.89 4.03 3.12 4.21 4.09
Anomalies and Events 5.20 3.78 3.94 2.97 4.28 4.10
Security Continuous Monitoring 5.03 4.14 4.24 3.38 4.30 4.16
Detection Processes 5.12 3.75 3.91 3.00 4.06 4.02
RESPOND 5.26 3.79 4.37 2.95 4.18 4.13
Response Planning 5.26 3.72 4.71 3.00 3.95 4.15
Communications 5.22 3.71 4.34 2.93 4.29 4.19
Analysis 5.30 3.81 4.08 3.00 4.19 4.11
Mitigation 5.49 4.10 4.61 3.00 4.58 4.51
Improvements 5.03 3.60 4.09 2.83 3.87 3.68
RECOVER 4.69 3.61 3.79 2.73 3.93 4.04
Recovery Planning 4.80 3.70 3.94 2.67 3.95 4.18
Improvements 4.60 3.57 3.62 2.42 3.53 3.92
Communications 4.67 3.56 3.82 3.11 4.32 4.03
ALL FuNCTION AVERAgE 4.88 3.80 3.94 3.05 4.04 4.12
1 2 3 4 5 6 7
Not Performed
Informally Performed
Documented Policy
Partially Documented
Standards and/or Procedures
Implementation in Process
Tested and Verified
Optimized

2020 Nationwide Cybersecurity Review Summary Report 13
Returning Participant Analysis
In total, 2,183 organizations participated in the 2019 NCSR and returned to participate in the 2020 NCSR. In order to adequately measure the improvements year-over-year for those that participated in the past, we will explore how those who took the assessment in 2019 fared in 2020.
There is also an analysis of results for a subset of 1,610 returning organizations who participated in the NCSR for the first time in 2019 and returned in 2020.
All Returning ParticipantsThis group includes 2,183 SLTT participants that completed the NCSR in 2019 and returned to complete the 2020 NCSR. This graph shows the scoring comparison between 2019 and 2020 for those organizations.
FIguRE 7 Figure 7 below shows the scoring comparison between 2019 and 2020 for the 2,183 SLTT participants that completed the NCSR in 2019 and returned to complete the 2020 NCSR.
State – All Function Average 2019 4.78
2020 4.88
Local – All Function Average 2019 3.66
2020 3.89
Tribal – All Function Average 2019 3.33
2020 4.02
Territorial – All Function Average 2019 2.98
2020 3.05
1 2 3 4 5 6 7
Notable Findings Each SLTT peer group of returning participants increased their maturity scores on average
from 2019 to 2020. The Tribal peer group reported the largest increase in maturity among the returning
participants, with returning Tribal participants advancing to a maturity level of 4 (Partially Documented Standards and/or Procedures), which indicates they are in the process of creating and implementing standards and procedures for cybersecurity activity.

2020 Nationwide Cybersecurity Review Summary Report14
State – Elections Returning Participant Progress 2019 – 2020
FIguRE 8 Figure 8 below shows the year-to-year comparison for the “State – Elections” participants that completed the NCSR in 2019 and returned to complete the 2020 NCSR.
Identify 2019 3.67
2020 3.90
Protect 2019 4.15
2020 4.23
Detect 2019 3.99
2020 4.35
Respond 2019 4.07
2020 4.47
Recover 2019 3.70
2020 4.09
1 2 3 4 5 6 7
Notable Findings Of the 19 “State – Elections” participants, 13 were returning participants in 2020. Returning “State – Elections” participants that completed the 2020 NCSR improved their
maturity on average across each NIST CSF function. The greater State – Elections peer group that includes 6 new respondents for 2020 decreased in maturity from 2019 to 2020 due to the overall lower scores of the new participants.
Local – Elections Returning Participant Progress 2019 – 2020
FIguRE 9 Figure 9 below shows the year-to-year comparison for the “Local – Elections” participants that completed the NCSR in 2019 and returned to complete the 2020 NCSR.
Identify 2019 3.72
2020 4.11
Protect 2019 4.03
2020 4.50
Detect 2019 3.47
2020 4.18
Respond 2019 3.64
2020 4.07
Recover 2019 3.60
2020 4.11
1 2 3 4 5 6 7
Notable Findings Of the 39 “Local – Elections” participants, 16 were returning participants in 2020. Returning “Local – Elections” participants increased their scores in all NIST CSF functions and
advanced to the next level of maturity, which indicates they are in the process of creating and implementing standards and procedures for cybersecurity activity.

2020 Nationwide Cybersecurity Review Summary Report 15
2019 First-Time Participant Progression
This group includes the 1,610 SLTT participants that completed the NCSR in 2019 for the first time and returned to complete the 2020 NCSR. This graph shows the scoring year-to-year between 2019 and 2020 for those organizations. Note: Figure 10 below displays the five NIST CSF function averages for all SLTT peer groups combined, rather than the SLTT peer groups individually. The majority of first-time participants in 2019 were within the Local peer group.
FIguRE 10 Figure 10 below shows the scoring comparison between 2019 and 2020 for the organizations that participated in the NCSR for the first time in 2019, and returned to participate in the 2020 NCSR.
Identify 2019 3.48
2020 3.68
Protect 2019 4.05
2020 4.26
Detect 2019 3.71
2020 3.98
Respond 2019 3.68
2020 3.91
Recover 2019 3.52
2020 3.72
1 2 3 4 5 6 7
Notable Findings Organizations that were first-time participants in 2019 and completed the NCSR again in 2020
reported 6% higher maturity levels. Returning first-time participants increased the most in maturity in the Detect function, with an
increase of 7% in maturity year-over-year.

2020 Nationwide Cybersecurity Review Summary Report16
NCSR Participation
All NCSR participants have access to custom reports that are specific to their organization. All individual self-assessments and scores are kept confidential and anonymous. The reports allow participants to develop a benchmark to gauge year-to-year progress and continuously compare themselves against their peers.
For the purposes of continuous data analysis and trending, respondents are grouped into one of four main peer groups: state, local, tribal, and territorial. The state peer group involves participation among the 50 state governments. The local peer group consists of any local government entity. This includes cities, counties, parishes, boroughs, K-12 public school districts, Fire/EMS/911, associations, authorities, and many more entity types at the local level. The tribal peer group includes participation by tribal governments and tribal government agencies. The territorial peer group includes participation among the six territorial governments.
The MS-ISAC was able to break the state, local, tribal, and territorial peer groups down into subsets represented by 38 additional subsector peer groups. These subsectors are discussed in further detail on page 42. To maintain anonymity, each subsector peer group must include participation from a minimum of five organizations per group. An organization can be a part of multiple subsectors, if applicable.
As outlined in the FY 2020 Notice of Funding Opportunity (NOFO), State Homeland Security Program (SHSP) and Urban Area Security Initiative (UASI) recipients and sub-recipients were required to complete the NCSR by the end of Calendar Year 2020. Of the total 2,934 NCSR participants, 70% of participants identified their organization as taking the NCSR as part of the grant requirement.
In addition, participants completing the NCSR for the first time in 2020 scored significantly lower, on average, compared to all others. Participants who had taken the NCSR at least one time previously scored 12% higher on average compared to those first-time participants. These lower scoring first-time participants had a large impact on the overall function scores of the NCSR. Figure 11 represents year-to-year SLTT participation in the NCSR.
FIguRE 11 Year-to-Year SLTT Participation
2017 2018 2019 2020
State 45 43 50 50
State Agency 297 343 524 522
Local 129 277 2,523 2,321
Tribal 5 6 19 17
Territorial 0 2 6 6
NCSR Individual Reports
Peer groups Defined
2020 Homeland Security grant Program
2020 Nationwide Cybersecurity Review Summary Report 17
Participation Highlights
Percentage Change in ParticipationThe 2020 NCSR saw a year-over-year participation decrease of 6.4%. This may have been due to the fact that organizations taking the NCSR for the grant requirement are only required to complete it once during a multi-year grant.
Repeat AssessmentsEntities that have participated for six years consecutively since 2015 scored 34% higher than entities that participated for the first time. A total of 232 organizations have participated for six consecutive years.
State Peer Group Fully RepresentedFor the second year in a row, the 2020 NCSR had full representation from all 50 states.
State Aggregate Roll-UpOf the 50 state participants, six states aggregate their scores. This means all participating state agencies complete the NCSR and their scores are averaged to compile the overall state score. A total of 522 state agencies participated in the 2020 NCSR as part of a roll-up, or independently. This represented a very slight decrease from 2019’s participation of 524 state agencies.
Local Peer Group ParticipationThe local peer group saw an overall decrease of 202 participant entities compared to 2019, with 80% of local participants identifying their entity as completing the assessment as part of the HSGP requirement.
County ParticipationThe county/parish peer group subsector was the largest subsector that completed the NCSR in 2020 with a total of 725 organizations completing the assessment.
Tribal Peer Group ParticipationThe 2020 NCSR was completed by 17 tribal organizations. This is a decrease of two participants from 2019. This group has changed in composition from the prior year, however, with six organizations being new participants.
Territorial Peer Group ParticipationThe 2020 NCSR saw full representation of all six territories for the second consecutive year. This is the second year since the NCSR began that territorial participation has been high enough for multiple years to be able to create a separate peer group that includes analysis of year-to-year results.
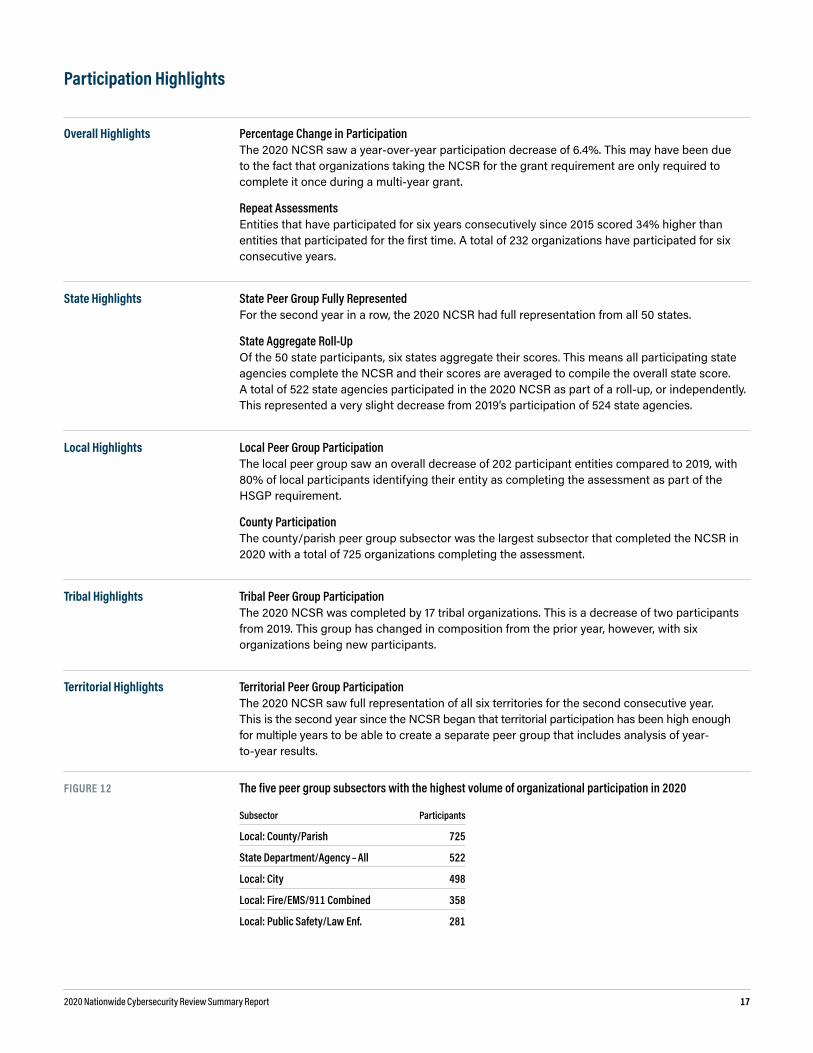
FIguRE 12 The five peer group subsectors with the highest volume of organizational participation in 2020
Subsector Participants
Local: County/Parish 725
State Department/Agency – All 522
Local: City 498
Local: Fire/EMS/911 Combined 358
Local: Public Safety/Law Enf. 281
Overall Highlights
State Highlights
Local Highlights
Tribal Highlights
Territorial Highlights
2020 Nationwide Cybersecurity Review Summary Report18
Distribution of State Overall Maturity Scores
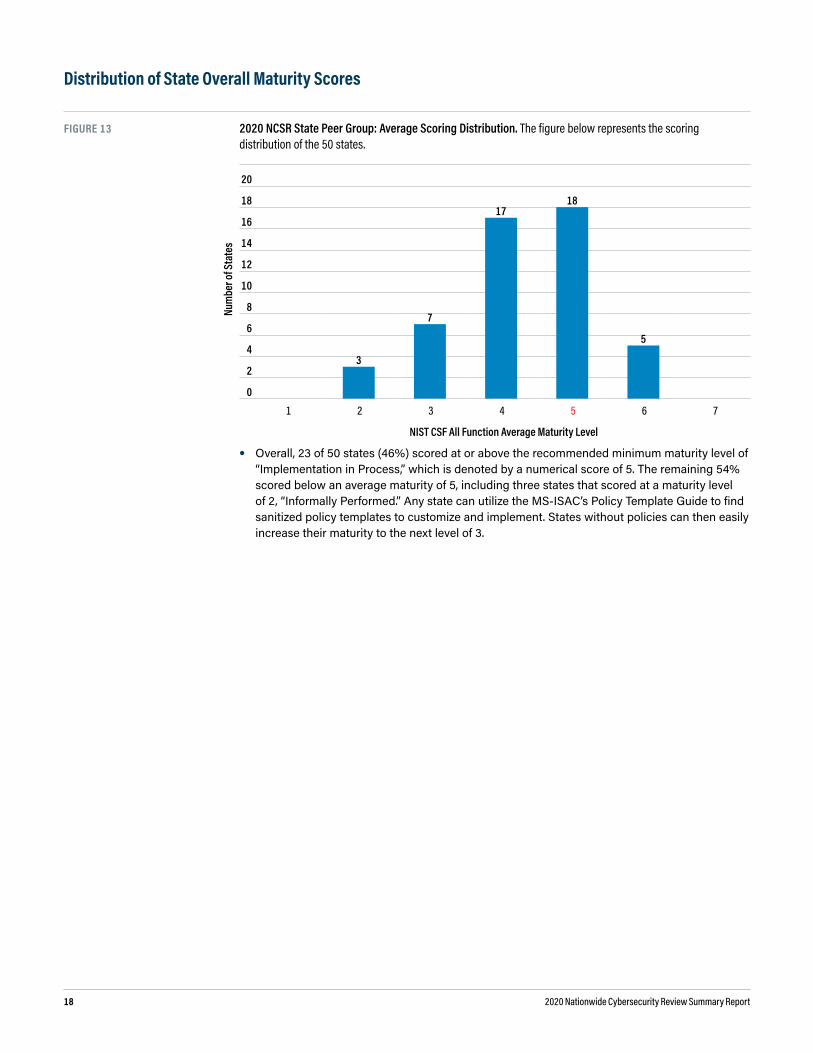
FIguRE 13 2020 NCSR State Peer Group: Average Scoring Distribution. The figure below represents the scoring distribution of the 50 states.
Num
ber o
f Sta
tes
20
18
16
14
12
10
8
6
4
2
0
3
7
1718
5
1 2 3 4 5 6 7
NIST CSF All Function Average Maturity Level
Overall, 23 of 50 states (46%) scored at or above the recommended minimum maturity level of “Implementation in Process,” which is denoted by a numerical score of 5. The remaining 54% scored below an average maturity of 5, including three states that scored at a maturity level of 2, “Informally Performed.” Any state can utilize the MS-ISAC’s Policy Template Guide to find sanitized policy templates to customize and implement. States without policies can then easily increase their maturity to the next level of 3.

2020 Nationwide Cybersecurity Review Summary Report 19
Distribution of Local Overall Maturity Scores
FIguRE 14 2020 NCSR Local Peer Group: Average Scoring Distribution. The figure below represents the scoring distribution of participating locals.
Num
ber o
f Loc
al O
rgan
izatio
ns
600
550
500
450
400
350
300
250
200
150
100
50
0
359
511
387
438
391
224
11
1 2 3 4 5 6 7
NIST CSF All Function Average Maturity Level
Overall, on average, 626 of the 2,321 local participants (27%) scored at or above the recommended minimum maturity level of “Implementation in Process,” which is denoted by a numerical score of 5. However, a total of 870 locals (37%), do not have any documented policies. These organizations are informally performing the cybersecurity activities in the NIST CSF, but do not have any formal policy or procedures to govern how those activities are performed and/or managed. The MS-ISAC Policy Template Guide could be utilized as a short-term solution for reaching a score of at least a 3, “Documented Policy.” This policy catalog provides over 50 policy templates that can be completely customized by an organization.
Cybersecurity improvements do take time, and a score of 5-7 should not be expected immediately after participating in the NCSR. A realistic expectation is that an organization will reach a higher maturity level of 5 or 6 after years of incremental security improvements. The MS-ISAC and CISA have resources available that can assist with increasing maturity.
2020 Nationwide Cybersecurity Review Summary Report20
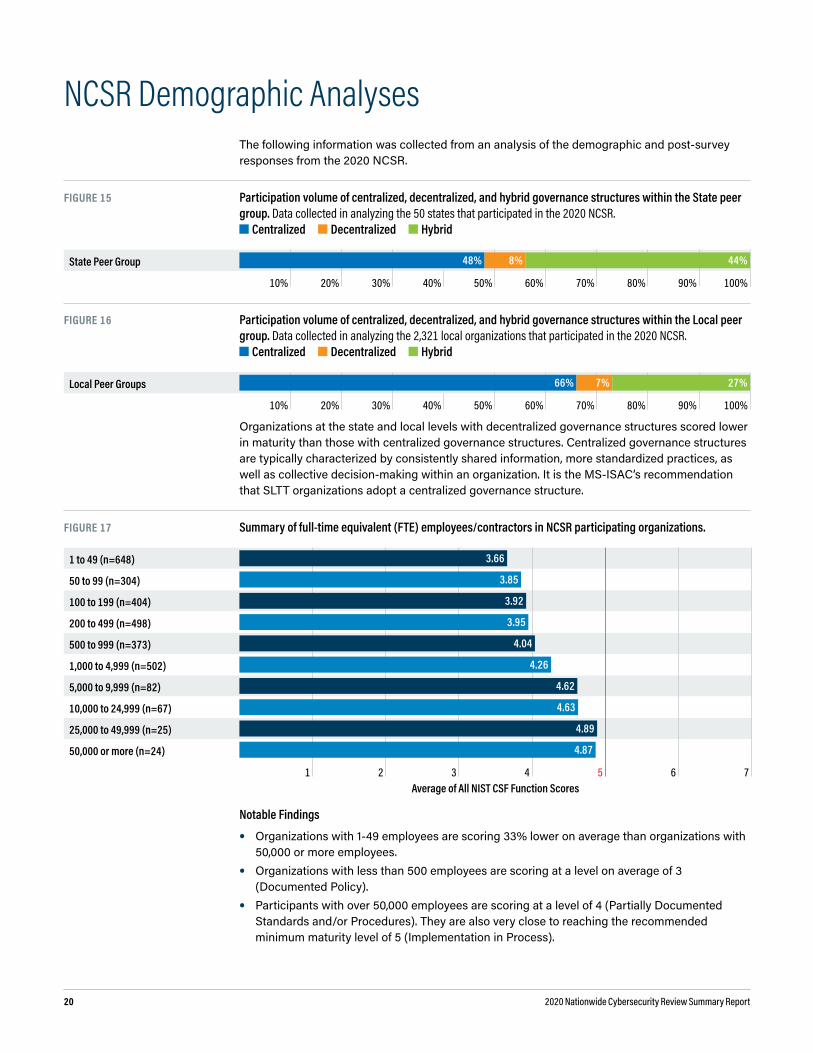
NCSR Demographic AnalysesThe following information was collected from an analysis of the demographic and post-survey responses from the 2020 NCSR.
FIguRE 15 Participation volume of centralized, decentralized, and hybrid governance structures within the State peer group. Data collected in analyzing the 50 states that participated in the 2020 NCSR.
Centralized Decentralized Hybrid
State Peer Group 48% 8% 44%
10% 20% 30% 40% 50% 60% 70% 80% 90% 100%
FIguRE 16 Participation volume of centralized, decentralized, and hybrid governance structures within the Local peer group. Data collected in analyzing the 2,321 local organizations that participated in the 2020 NCSR.
Centralized Decentralized Hybrid
Local Peer Groups 66% 7% 27%
10% 20% 30% 40% 50% 60% 70% 80% 90% 100%
Organizations at the state and local levels with decentralized governance structures scored lower in maturity than those with centralized governance structures. Centralized governance structures are typically characterized by consistently shared information, more standardized practices, as well as collective decision-making within an organization. It is the MS-ISAC’s recommendation that SLTT organizations adopt a centralized governance structure.
FIguRE 17 Summary of full-time equivalent (FTE) employees/contractors in NCSR participating organizations.
1 to 49 (n=648) 3.66
50 to 99 (n=304) 3.85
100 to 199 (n=404) 3.92
200 to 499 (n=498) 3.95
500 to 999 (n=373) 4.04
1,000 to 4,999 (n=502) 4.26
5,000 to 9,999 (n=82) 4.62
10,000 to 24,999 (n=67) 4.63
25,000 to 49,999 (n=25) 4.89
50,000 or more (n=24) 4.87
1 2 3 4 5 6 7Average of All NIST CSF Function Scores
Notable Findings Organizations with 1-49 employees are scoring 33% lower on average than organizations with
50,000 or more employees. Organizations with less than 500 employees are scoring at a level on average of 3
(Documented Policy). Participants with over 50,000 employees are scoring at a level of 4 (Partially Documented
Standards and/or Procedures). They are also very close to reaching the recommended minimum maturity level of 5 (Implementation in Process).

2020 Nationwide Cybersecurity Review Summary Report 21
FIguRE 18 Summary of IT employees/contractors in NCSR participating organizations.
0 or Managed by Contractor (n=509) 3.40
1 (n=283) 3.59
2 to 5 (n=703) 3.93
6 to 9 (n=281) 3.92
10 to 24 (n=444) 4.15
25 to 49 (n=236) 4.25
50 to 99 (n=169) 4.46
100 to 199 (n=141) 4.72
200 to 499 (n=81) 4.76
500 to 999 (n=39) 4.98
1,000 to 4,999 (n=31) 4.96
5,000 or more (n=10) 5.08
1 2 3 4 5 6 7Average of All NIST CSF Function Scores
Notable Findings Organizations with either no (0) IT employees or that have an IT contractor scored at 3.40
(Documented Policy) on the NCSR maturity scale. Those with 5,000 or more IT staff scored 49% higher than the organizations with no IT staff.
Organizations with more than 10 employees (but less than 5,000) scored on average a 4 (Partially Documented Standards and/or Procedures) on the maturity scale.
Participants with 5,000 or more IT employees have reached the recommended minimum maturity level of a 5 (Implementation in Process).
Participants with 500 – 999 and 1,000 – 4,999 IT employees are on the verge of reaching the recommended minimum maturity level of 5.
FIguRE 19 Summary of full-time security employee staffing for NCSR participating organizations.
0 (n=361) 3.02
1 (n=531) 3.69
2 to 4 (n=1,333) 4.11
5 to 9 (n=371) 4.34
10 to 14 (n=113) 4.30
15 to 19 (n=41) 4.55
20 or more (n=177) 4.86
1 2 3 4 5 6 7Average of All NIST CSF Function Scores
Notable Findings Organizations with at least one security employee scored 22% higher than organizations with
no (0) security-focused employees.
FTE, IT, and Security Staffing Analysis Smaller IT and security organizations are scoring lower than their larger-staffed counterparts.
This indicates that smaller organizations typically have fewer resources to deal with the increasingly complex IT systems and attendant cybersecurity threats.

2020 Nationwide Cybersecurity Review Summary Report22
While “lack of sufficient funding” continues to be the top security concern reported by NCSR participants, there may be limitations to hiring additional IT and security staff. Available FedVTE trainings available to any state, local, tribal, or territorial government can assist with training current employees to be subject matter experts.
Organizations with 0 security staff scored at an average of 3 (Documented Policy). NCSR data indicates that leaders of these organizations can likely improve the cybersecurity maturity of their organizations by hiring at least one qualified employee with a security position description. By documenting and adopting standards and procedures to formalize their cybersecurity activities, they can also progress toward the next level of cybersecurity maturity.
Organizations with lower staffing totals should consider taking advantage of opportunities like the Federal Government’s CyberCorps: Scholarship for Service program that would allow them to augment their security staff with qualified, entry-level interns and full-time personnel. Additionally, they can take advantage of resources from the MS-ISAC, EI-ISAC, and DHS to provide capability that they may not have, or capabilities that have a low impact on staff time utilized for cybersecurity activity.
Organizations with lower staffing totals should utilize no-cost resources from MS-ISAC, EI-ISAC, DHS, and open sources to assist with IT and cybersecurity activities.
FIguRE 20 Summary of framework and/or security methodology usage by NCSR participating organizations. SLTT participant results for the following 2020 NCSR question: “Which control frameworks and/or security methodologies are your organization’s information security controls based on?”
No Security Framework Selected 2.87
At Least 1 Security Framework 4.35
1 2 3 4 5 6 7
Notable Findings Entities that currently employ a security framework, such as the NIST CSF, ISO 27000 series,
or the CIS Controls, scored 52% higher than those organizations that do not. Adopting a framework enables organizations to assess themselves regularly against an accepted standard, plan a strategy to address their weaknesses, and continuously improve their maturity.
Based on the data, the MS-ISAC recommends that SLTT organizations select and use a security framework to guide their security maturation efforts. The NCSR itself is based on the NIST CSF, which could be used as a starting point for organizations to assess areas of low maturity and guide their efforts moving forward against that framework.
FIguRE 21 Summary of cyber executive reporting by NCSR participating organizations. SLTT participant results for the following 2020 NCSR question: “Is executive cyber reporting mandated, optional, or nonexistent within your organization?”
Non-existent 2.75
Optional 3.91
Mandated 4.63
1 2 3 4 5 6 7
Notable Findings Organizations that have mandated cybersecurity reporting to executives score significantly
higher than those that do not. Executive cybersecurity reporting educates leaders on an organization’s cybersecurity
challenges, needs, and priorities. Without this type of communication, organizations likely will struggle to get cybersecurity activity, and consequently funding, prioritized.

2020 Nationwide Cybersecurity Review Summary Report 23
Even organizations that have optional cybersecurity reporting to executives perform better than those that do not perform such reporting.
Based on the data, the MS-ISAC recommends that organizations report on cybersecurity needs, priorities, challenges, and other topics to executives to ensure that these activities become organizational priorities. The NCSR and other cybersecurity assessments serve as a mechanism for organizations to generate reporting on their cybersecurity activities that may help inform leadership of needs and future direction. An end-user data reporting template is available that allows NCSR respondents to display the data from their own NCSR results in an organized and easy-to-present manner.
Top Security Concerns Participants have continually identified the same top five security concerns since 2015. Their
concerns below are presented in rank order from highest to lowest as identified in 2020.
FIguRE 22 Top 5 Security Concerns
1 Lack of sufficient funding
2 Increasing sophistication of threats
3 Emerging technologies
4 Lack of documented processes
5 Inadequate availability of cybersecurity professionals

2020 Nationwide Cybersecurity Review Summary Report24
NCSR and CIS Controls Implementation Group ScoringAn analysis was performed to evaluate the alignment of the NIST Cybersecurity Framework (CSF), to CIS Controls Version 8. The NCSR question set utilizes all subcategories from the NIST CSF directly, which totals 108 subcategories. The overall average NCSR scoring for the State, Local, Tribal, and Territorial peer groups were aligned to the applicable activities within each of the three Implementation Groups of the CIS Controls to perform the analytics below. The Implementation Groups are subsets of CIS Controls and Sub-Controls (Safeguards) that constitute different levels of security actions, starting with the most basic activities that make up Implementation Group 1 (IG1). Implementation Group 2 (IG2) includes additional activities to build off IG1, and Implementation Group 3 (IG3) is the most advanced category, with additional practices building on those from IG2.
IG1 of the CIS Controls is defined as basic cyber hygiene, or a collection of high-priority security actions which have been shown to assist organizations with mitigating common threats. This highlights the importance of an organization or peer group’s performance when it comes to measuring maturity in this group. This group of the CIS Controls includes 49 activities that align to the subcategories of the NIST Cybersecurity Framework (CSF), making IG1 a subset of the 108 NIST CSF activities addressed by each NCSR respondent.
IG1 includes at least one activity from the following NIST CSF categories: Anomalies and Events, Asset Management, Awareness and Training, Data Security, Detection Processes, Governance, Identity Management and Access Control, Information Protection Processes and Procedures, Protective Technology, Respond Communications, Risk Assessment, Security Continuous Monitoring, and Supply Chain Risk Management.
Below are some key points of interest related to how the SLTT groups scored in relation to the subset of the NCSR related to those basic cybersecurity activities outlined in IG1. Further consideration of SLTT maturity scoring in relation to the CIS Controls Implementation Groups will be included in future reports as a means to provide another lens on the data set.
Based on an analysis of all peer group NCSR results in the categories that are relevant to IG1, the SLTT community has displayed greater maturity specific to basic cybersecurity practices.
The State peer group as a whole reaches the recommended minimum maturity level of 5, or “Implementation in Process,” when evaluating NCSR scoring aligned to the basic cybersecurity activities outlined by IG1.
The Local and Tribal peer groups are just above an average score of 4, or “Partially Documented Standards and/or Procedures,” when evaluating NCSR scoring aligned to IG1. This is 11% and 7% higher, respectively, compared to the same peer group's average of all NIST CSF functions.
The Territorial peer group is above a level of 3, or “Documented Policy,” when evaluating NCSR scoring aligned to IG1. The average score is 15% higher, compared to the Territorial peer group's average of all NIST CSF functions.
2020 Nationwide Cybersecurity Review Summary Report 25
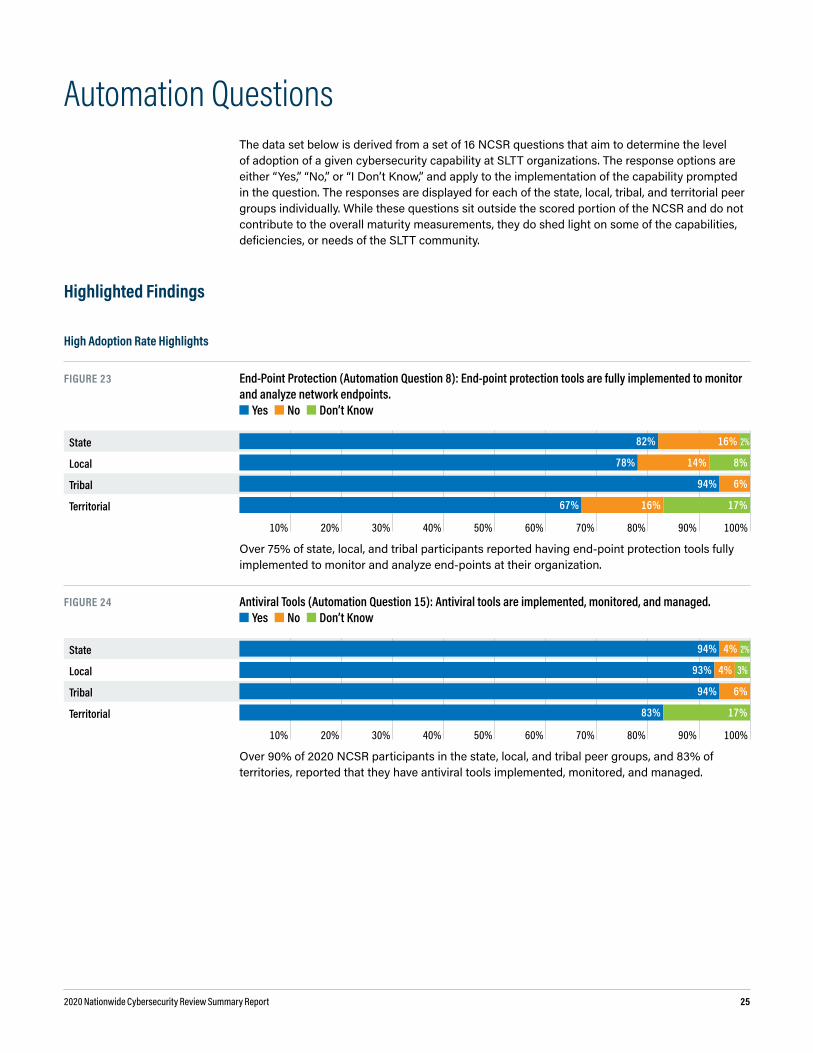
Automation QuestionsThe data set below is derived from a set of 16 NCSR questions that aim to determine the level of adoption of a given cybersecurity capability at SLTT organizations. The response options are either “Yes,” “No,” or “I Don’t Know,” and apply to the implementation of the capability prompted in the question. The responses are displayed for each of the state, local, tribal, and territorial peer groups individually. While these questions sit outside the scored portion of the NCSR and do not contribute to the overall maturity measurements, they do shed light on some of the capabilities, deficiencies, or needs of the SLTT community.
Highlighted Findings
High Adoption Rate Highlights
FIguRE 23 End-Point Protection (Automation Question 8): End-point protection tools are fully implemented to monitor and analyze network endpoints.
Yes No Don’t Know
State 82% 16% 2%
Local 78% 14% 8%
Tribal 94% 6%
Territorial 67% 16% 17%
10% 20% 30% 40% 50% 60% 70% 80% 90% 100%
Over 75% of state, local, and tribal participants reported having end-point protection tools fully implemented to monitor and analyze end-points at their organization.
FIguRE 24 Antiviral Tools (Automation Question 15): Antiviral tools are implemented, monitored, and managed. Yes No Don’t Know
State 94% 4% 2%
Local 93% 4% 3%
Tribal 94% 6%
Territorial 83% 17%
10% 20% 30% 40% 50% 60% 70% 80% 90% 100%
Over 90% of 2020 NCSR participants in the state, local, and tribal peer groups, and 83% of territories, reported that they have antiviral tools implemented, monitored, and managed.

2020 Nationwide Cybersecurity Review Summary Report26
Low Adoption Rate Highlights
FIguRE 25 Two-Factor Authentication (Automation Question 3): Two-factor authentication has been fully implemented. Yes No Don’t Know
State 42% 56% 2%
Local 27% 69% 4%
Tribal 53% 47%
Territorial 17% 83%
10% 20% 30% 40% 50% 60% 70% 80% 90% 100%
All participating SLTT peer groups have a low rate of full implementation for two-factor authentication. This is a critical capability that provides significant risk reduction value as passwords, on their own, are an insecure and inadequate form of authentication. Implementing two-or multi-factor authentication decreases the risk related to exploitation of weak, stolen or compromised credentials that could lead to full network compromise. Prioritizing implementation of this capability, especially on internet-facing assets, greatly increases the potential time and cost investment of an adversary to compromise a network. SLTT organizations should prioritize investment in two- and multi-factor authentication solutions moving forward.
FIguRE 26 Management and Control of Removable Media (Automation Question 10): Automated tools are used to manage and control removable media.
Yes No Don’t Know
State 16% 78% 6%
Local 27% 67% 6%
Tribal 35% 65%
Territorial 16% 67% 17%
10% 20% 30% 40% 50% 60% 70% 80% 90% 100%
The vast majority of SLTT participants reported not having automated tools in place to manage and control removable media, though they may have manual methods of doing so. Automated methods would provide a greater capability with a lower staff burden to control this possible vector for malware. Funding for service delivery or group-purchase programs for SLTTs could make automated removable media management and control capability offerings more attainable for the organizations that as of yet have not implemented those capabilities.

2020 Nationwide Cybersecurity Review Summary Report 27
FIguRE 27 Baseline Configuration/Change Control (Automation Question 12): Automated tools are used to create and maintain baseline configuration/change control information.
Yes No Don’t Know
State 48% 48% 4%
Local 39% 52% 9%
Tribal 41% 53% 6%
Territorial 33% 50% 17%
10% 20% 30% 40% 50% 60% 70% 80% 90% 100%
Less than 50% of all state, local, tribal, and territorial participants reported using automated tools to create and maintain baseline configuration/change control information. Managing secure configurations to prevent unsanctioned or undesirable change is a practice that greatly contributes to an organization’s security posture. Currently, all SLTT governments are given no-cost access to the CIS SecureSuite® membership, which includes tools that allow an organization to assess their configurations against community consensus-built secure configuration benchmarks. Additionally, there are tools available with this offering that assist organizations in implementing a baseline secure configuration based on these benchmarks.
2020 Nationwide Cybersecurity Review Summary Report28
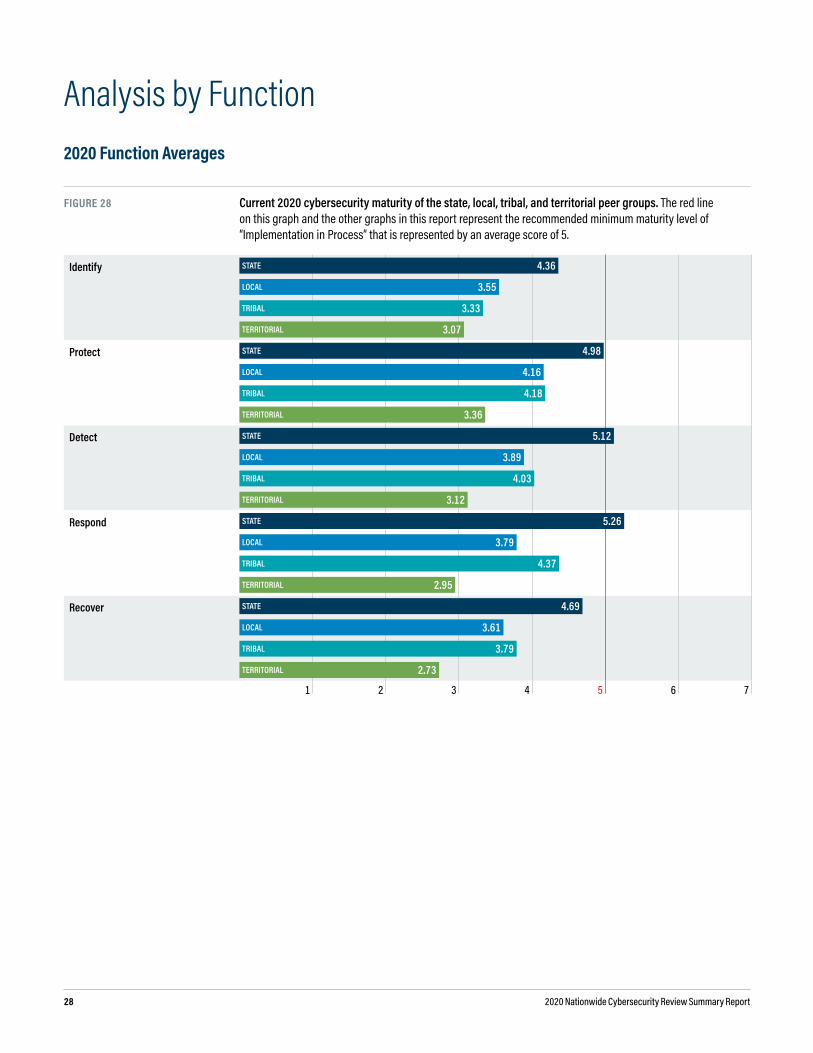
Analysis by Function2020 Function Averages
FIguRE 28 Current 2020 cybersecurity maturity of the state, local, tribal, and territorial peer groups. The red line on this graph and the other graphs in this report represent the recommended minimum maturity level of “Implementation in Process” that is represented by an average score of 5.
Identify STATE 4.36
LOCAL 3.55
TRIBAL 3.33
TERRITORIAL 3.07
Protect STATE 4.98
LOCAL 4.16
TRIBAL 4.18
TERRITORIAL 3.36
Detect STATE 5.12
LOCAL 3.89
TRIBAL 4.03
TERRITORIAL 3.12
Respond STATE 5.26
LOCAL 3.79
TRIBAL 4.37
TERRITORIAL 2.95
Recover STATE 4.69
LOCAL 3.61
TRIBAL 3.79
TERRITORIAL 2.73
1 2 3 4 5 6 7
2020 Nationwide Cybersecurity Review Summary Report 29
Identify FunctionThe activities under this functional area are key for an organization’s understanding of their current internal culture, infrastructure, and risk tolerance. This functional area tends to be one of the lowest-rated functions for many organizations. Immature capabilities in the Identify function may hinder an organization’s ability to effectively apply risk management principles for cybersecurity. By incorporating sound risk management principles into cybersecurity programs, organizations will be able to continuously align their efforts towards protecting their most valuable assets against the most relevant risks.
Identify Categories
Asset ManagementThe data, personnel, devices, system, and facilities that enable the organization to achieve business purposes are identified and managed consistent with their relative importance to business objectives and the organization’s risk strategy.
Business EnvironmentThe organization’s mission, objectives, stakeholders, and activities are understood and prioritized. This information is used to inform cybersecurity roles, responsibilities, and risk management decisions.
governanceThe policies, procedures, and processes to manage and monitor the organization’s regulatory, legal, risk, environmental, and operational requirements are understood and inform the management of cybersecurity risk.
Risk AssessmentThe organization understands the cybersecurity risks to organizational operations (including mission, functions, image, or reputation), organizational assets, and individuals.
Risk Management StrategyThe organization’s priorities, constraints, risk tolerances, and assumptions are established and used to support operational risk decisions.
Supply Chain Risk ManagementThe organization’s priorities, constraints, risk tolerances, and assumptions are established and used to support supply chain decisions.
DE TECT
PROTEC
T
IDENTIFYRECOVER
RESPOND
SecurityFramework

2020 Nationwide Cybersecurity Review Summary Report30
Identify Function Analysis
FIguRE 29 Year-to-year average for the Identify function across the peer groups.
State 2018 4.30
2019 4.32
2020 4.36
Local 2018 3.17
2019 3.38
2020 3.55
Tribal 2018 2.66
2019 2.91
2020 3.33
Territorial 2019 2.94
2020 3.07
1 2 3 4 5 6 7
OverallIdentify continues to be the lowest scoring function for the state, local, and tribal peer groups. This has been a consistent trend since 2015. Each peer group made some improvement within the Identify function in 2020, which indicates they are actively developing policy and procedures for their organization in efforts to formalize their cybersecurity activities.
TribalTribal entities scored lowest within the Supply Chain Risk Management category of Identify for the third year.
FIguRE 30 Year-to-year averages for the Identify categories across the peer groups.
Asset Management
Business Environment Governance
Risk Assessment
Risk Manage-ment Strategy
Supply Chain Risk
ManagementIdentify
Function
State Peer Profile 2018 4.21 4.60 4.90 4.70 3.96 3.45 4.30
2019 4.26 4.56 4.98 4.82 3.77 3.56 4.32
2020 4.22 4.58 5.03 4.87 3.79 3.68 4.36
Local Peer Profile 2018 3.36 3.60 3.57 3.48 2.68 2.32 3.17
2019 3.66 3.69 3.56 3.59 3.02 2.78 3.38
2020 3.82 3.86 3.76 3.78 3.18 2.90 3.55
Tribal Peer Profile 2018 2.78 2.87 2.96 3.08 1.94 2.30 2.66
2019 2.91 3.28 2.92 3.56 2.58 2.23 2.91
2020 3.26 3.67 3.62 3.94 3.02 2.49 3.34
Territorial Peer Profile 2019 2.44 4.57 2.67 3.33 2.44 2.17 2.94
2020 2.72 4.47 3.33 3.11 2.56 2.20 3.07

2020 Nationwide Cybersecurity Review Summary Report 31
Supply Chain Risk ManagementThe supply chain category was added in 2018 and continues to be the lowest scoring category in the Identify function. The MS-ISAC and CIS recently published the “Supply Chain Cybersecurity Resources Guide” and Managing Cybersecurity Supply Chain Risks in Election Technology: A Guide for Election Technology Providers. These resources can be utilized as a starting point for improving scores within the supply chain category.
Risk Management StrategyScores increased significantly for the tribal peer group again in 2020 in the “Risk Management Strategy” category. They are now scoring at a 3 (Documented Policy), which indicates they are documenting policies in this function area.
2020 Identify Sub-Category Highlights
→ The lowest scoring sub-category for the 2020 state peer group (3.40) was ID.SC–2: Suppliers and third-party partners of information systems, components, and services are identified, prioritized, and assessed using a cyber supply chain risk assessment process.
→ The lowest scoring sub-category for the 2020 local (2.62) and tribal (2.12) peer groups was ID.SC–5: Response and recovery planning and testing are conducted with suppliers and third-party providers.
→ The sub-category ID.AM–4: External information systems are catalogued was the lowest scoring sub-category for the territorial (1.50) peer group. This asset management activity ties in with supply chain issues, as the activity addresses external assets and data.

2020 Nationwide Cybersecurity Review Summary Report32
Protect FunctionThe activities under the Protect function pertain to different methods and activities that reduce the likelihood of cybersecurity events from happening and ensure that the appropriate controls are in place to deliver critical services. These controls are focused on preventing cybersecurity events from occurring through common attack vectors, including attacks targeting users and attacks leveraging inherent weakness in applications and network communication.
Protect Categories
Identity Management and Access ControlAccess to assets and associated facilities is limited to authorized users, processes, or devices, and to authorized activities and transactions.
Awareness and TrainingThe organization’s personnel and partners are provided cybersecurity awareness education and are adequately trained to perform their information security related duties and responsibilities consistent with related policies, procedures, and agreements.
Data SecurityInformation and records (data) are managed consistent with the organization’s risk strategy to protect the confidentiality, integrity, and availability of information.
Information Protection Processes and ProceduresSecurity policies (that address purpose, scope, roles, responsibilities, management commitment, and coordination among organizational entities), processes, and procedures are maintained and used to manage protection of information systems and assets.
MaintenanceMaintenance and repairs of industrial control and information system components are performed consistent with policies and procedures.
Protective TechnologyTechnical security solutions are managed to ensure the security and resilience of systems and assets, consistent with related policies, procedures, and agreements.
DE TECT
PROTEC
T
IDENTIFYRECOVER
RESPOND
SecurityFramework

2020 Nationwide Cybersecurity Review Summary Report 33
FIguRE 31 Year-to-year average for the Protect function across the peer groups.
State 2018 4.80
2019 4.90
2020 4.98
Local 2018 3.85
2019 3.98
2020 4.16
Tribal 2018 3.51
2019 3.91
2020 4.18
Territorial 2019 3.39
2020 3.36
1 2 3 4 5 6 7
TerritorialThe 2020 territorial peer group scored highest within the Protect function for the second year, indicating they have documented policies around this function and are beginning to develop additional procedures to support the policies.
LocalThe 2020 local peer group also scored highest within the Protect function, reaching a 4 (Partially Documented Standards and/or Procedures), indicating they have fully documented policies around protecting the critical services they handle and are in the process of formalizing procedures.
StateThere was an increase in all categories within the Protect function for the state peer group with an overall function average of 4.98. The state peer group is very close to reaching a 5 (Implementation in Process) within this function.

2020 Nationwide Cybersecurity Review Summary Report34
Category Highlights
FIguRE 32 Year-to-year averages for the Protect categories across the peer groups.
Identity Management
and Access Control
Awareness and Training Data Security
Information Protection
Processes and Procedures Maintenance
Protective Technology
Protect Function
State Peer Profile 2018 5.02 5.14 4.54 4.89 4.60 4.62 4.80
2019 5.15 5.19 4.66 4.95 4.78 4.64 4.90
2020 5.25 5.29 4.72 5.00 4.88 4.73 4.98
Local Peer Profile 2018 4.46 4.03 3.67 3.57 3.72 3.63 3.85
2019 4.66 4.06 3.89 3.65 3.85 3.76 3.98
2020 4.81 4.29 4.06 3.84 4.04 3.93 4.16
Tribal Peer Profile 2018 4.07 3.93 3.31 3.52 3.42 2.83 3.51
2019 4.75 3.64 3.89 3.54 4.18 3.46 3.91
2020 4.91 4.08 3.86 3.83 4.41 3.98 4.18
Territorial Peer Profile 2019 4.50 3.53 2.98 2.82 3.25 3.27 3.39
2020 4.38 3.63 3.02 2.83 3.00 3.27 3.36
2020 Protect Sub-Category Highlights
→ PR.AC–1: Identities and credentials are issued, managed, verified, revoked, and audited for authorized devices, users and processes is the highest scoring sub-category for the 2020 territorial (5.17) peer group.
→ PR.DS–7: Integrity checking mechanisms are used to verify hardware integrity was the lowest scoring sub-category within the Protect function for the tribal (2.76) peer group.
→ PR.IP–4: Backups of information are conducted, maintained, and tested sub-category is relatively high for the 2020 local (5.03), tribal (5.53), and territorial (4.67) peer groups. The local and tribal groups both are at the minimum recommended maturity level in this sub-category.

2020 Nationwide Cybersecurity Review Summary Report 35
Detect FunctionThe quicker an organization can detect a cybersecurity incident, the better positioned it is to be able to remediate the problem and reduce the consequences of the event. Activities found within the Detect function pertain to an organization’s ability to identify incidents. These controls are becoming more important as the quantity of logs and events occurring within an environment can be overwhelming to handle and can make it difficult to identify the key concerns.
Detect Categories
Anomalies and EventsAnomalous activity is detected in a timely manner and the potential impact of events is understood.
Security Continuous MonitoringThe information system and assets are monitored at discrete intervals to identify cybersecurity events and verify the effectiveness of protective measures.
Detection ProcessesDetection processes and procedures are maintained and tested to ensure timely and adequate awareness of anomalous events.
FIguRE 33 Year-to-year average for the Detect function across the peer groups.
State 2018 4.87
2019 4.97
2020 5.12
Local 2018 3.42
2019 3.64
2020 3.89
Tribal 2018 3.14
2019 3.76
2020 4.03
Territorial 2019 2.96
2020 3.12
1 2 3 4 5 6 7
State
The state peer group reached the recommended minimum maturity level of Implementation in Process (5) in the Detect function for the first time in 2020. This indicates they have implemented policies and procedures.
DE TECT
PROTEC
T
IDENTIFYRECOVER
RESPOND
SecurityFramework

2020 Nationwide Cybersecurity Review Summary Report36
Category Highlights
FIguRE 34 Year-to-year averages for the Detect categories across the peer groups.
Anomalies and Events
Security Continuous Monitoring
Detection Processes
Detect Function
State Peer Profile 2018 4.95 4.79 4.87 4.87
2019 5.06 4.93 4.92 4.97
2020 5.20 5.03 5.12 5.12
Local Peer Profile 2018 3.30 3.59 3.38 3.42
2019 3.49 3.92 3.52 3.64
2020 3.78 4.14 3.75 3.89
Tribal Peer Profile 2018 3.03 3.63 2.77 3.14
2019 3.65 3.88 3.76 3.76
2020 3.94 4.24 3.91 4.03
Territorial Peer Profile 2019 2.67 3.29 2.93 2.96
2020 2.97 3.38 3.00 3.12
Local, Tribal, and TerritorialThe 2020 local, tribal, and territorial peer groups scored highest in the “Security Continuous Monitoring” category. They all reached either a 3 (Documented Policy) or 4 (Partially Documented Standards and/or Procedures), and are continuing work in reaching the recommended minimum maturity of 5.
StateThe 2020 state peer group has reached a 5 (Implementation in Process) in all Detect function categories.
2020 Detect Sub-Category Highlights
→ The following sub-category is one of the lower scoring sub-categories within the 2020 state (3.96), local (3.51), and territorial (2.33) peer groups: DE.CM–5: Unauthorized mobile code is detected.
→ The following sub-category is the lowest for the 2020 tribal peer group (3.41): DE.AE–1: A baseline of network operations and expected data flows for users and systems is established and managed.
→ The following sub-category is one of the higher scoring for the 2020 state (5.76), local (4.60), tribal (4.65), and territorial peer groups (4.67): DE.CM–1: The network is monitored to detect potential cybersecurity events.

2020 Nationwide Cybersecurity Review Summary Report 37
Respond FunctionAn organization’s ability to quickly and appropriately respond to an incident plays a large role in reducing the incident’s consequences. As such, the activities within the Respond function examine how an organization plans, analyzes, communicates, mitigates, and improves its response capabilities. For many organizations, integration and cooperation with other entities is key. Many organizations do not have the internal resources to handle all components of incident response. One example is the ability to conduct forensics after an incident, which helps organizations identify and remediate the original attack vector. This gap can be addressed through resource sharing within the SLTT community and leveraging organizations such as MS-ISAC and CISA, which have dedicated resources to provide incident response at no cost to the victim.
Respond Categories
Response PlanningResponse processes and procedures are executed and maintained, to ensure timely response to detected cybersecurity events.
CommunicationsResponse activities are coordinated with internal and external stakeholders, as appropriate, to include external support from law enforcement agencies.
AnalysisAnalysis is conducted to ensure adequate response and support recovery activities.
MitigationActivities are performed to prevent expansion of an event, mitigate its effects, and eradicate the incident.
ImprovementsOrganizational response activities are improved by incorporating lessons learned from current and previous detection/response activities.
DE TECT
PROTEC
T
IDENTIFYRECOVER
RESPOND
SecurityFramework
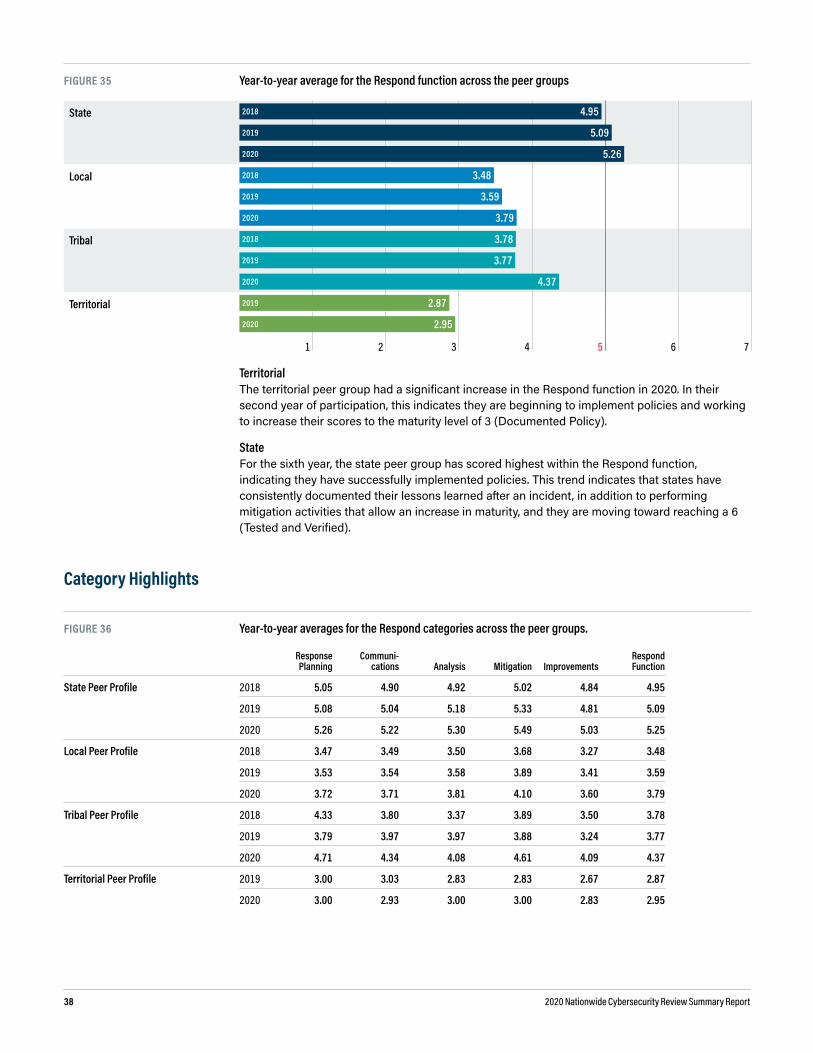
2020 Nationwide Cybersecurity Review Summary Report38
FIguRE 35 Year-to-year average for the Respond function across the peer groups
State 2018 4.95
2019 5.09
2020 5.26
Local 2018 3.48
2019 3.59
2020 3.79
Tribal 2018 3.78
2019 3.77
2020 4.37
Territorial 2019 2.87
2020 2.95
1 2 3 4 5 6 7
TerritorialThe territorial peer group had a significant increase in the Respond function in 2020. In their second year of participation, this indicates they are beginning to implement policies and working to increase their scores to the maturity level of 3 (Documented Policy).
StateFor the sixth year, the state peer group has scored highest within the Respond function, indicating they have successfully implemented policies. This trend indicates that states have consistently documented their lessons learned after an incident, in addition to performing mitigation activities that allow an increase in maturity, and they are moving toward reaching a 6 (Tested and Verified).
Category Highlights
FIguRE 36 Year-to-year averages for the Respond categories across the peer groups.
Response Planning
Communi-cations Analysis Mitigation Improvements
Respond Function
State Peer Profile 2018 5.05 4.90 4.92 5.02 4.84 4.95
2019 5.08 5.04 5.18 5.33 4.81 5.09
2020 5.26 5.22 5.30 5.49 5.03 5.25
Local Peer Profile 2018 3.47 3.49 3.50 3.68 3.27 3.48
2019 3.53 3.54 3.58 3.89 3.41 3.59
2020 3.72 3.71 3.81 4.10 3.60 3.79
Tribal Peer Profile 2018 4.33 3.80 3.37 3.89 3.50 3.78
2019 3.79 3.97 3.97 3.88 3.24 3.77
2020 4.71 4.34 4.08 4.61 4.09 4.37
Territorial Peer Profile 2019 3.00 3.03 2.83 2.83 2.67 2.87
2020 3.00 2.93 3.00 3.00 2.83 2.95

2020 Nationwide Cybersecurity Review Summary Report 39
State and Local2020 state and local participants scored the lowest within the “Improvements” category in the Respond function.
LocalThe 2020 local peer group scored highest within the “Mitigation” category. Continuous improvements within this category will allow incidents to be efficiently contained and help resolve an incident.
2020 Respond Sub-Category Highlights
→ The following sub-category is one of the lower scoring sub-categories within the 2020 local peer group (3.44): RS.AN–4: Incidents are categorized consistent with response plans.
→ The following sub-category is also relatively low for the 2020 local peer group (3.47): RS.AN–3: Forensics are performed. No-cost forensic resources, such as MS-ISAC forensic analysis services, could be incorporated as part of their response plans and included in policy to increase maturity.

2020 Nationwide Cybersecurity Review Summary Report40
Recover FunctionActivities within the Recover function pertain to an organization’s ability to return to its baseline after an incident has occurred. Such controls are focused not only on activities to recover from the incident, but also on many of the components dedicated to managing response plans throughout their lifecycle.
Recover Categories
Recovery PlanningRecovery processes and procedures are executed and maintained to ensure timely restoration of systems or assets affected by cybersecurity events.
ImprovementsRecovery planning and processes are improved by incorporating lessons learned into future activities.
CommunicationsRestoration activities are coordinated with internal and external parties, such as coordinating centers, Internet Service Providers, owners of attacking systems, victims, other Computer Security Incident Response Teams (CSIRT), and vendors.
FIguRE 37 Year-to-year average for the Recover function across the peer groups
State 2018 4.60
2019 4.62
2020 4.69
Local 2018 3.27
2019 3.46
2020 3.61
Tribal 2018 3.56
2019 3.36
2020 3.79
Territorial 2019 2.75
2020 2.73
1 2 3 4 5 6 7
TerritorialThe territorial peer group scored lowest in the Recover function for the second consecutive year. This indicates that activities and processes are informally performed but they are not documented. To assist with increasing maturity within Recover, there are free resources such as SANS policy templates and FedVTE training that these entities can take advantage of to build policies and develop professional staff. By consulting the MS-ISAC’s Cybersecurity Resources Guide, these organizations can easily find links to these templates and training opportunities relevant to this NIST CSF function, as this guide is organized in accordance with the framework.
DE TECT
PROTEC
T
IDENTIFYRECOVER
RESPOND
SecurityFramework

2020 Nationwide Cybersecurity Review Summary Report 41
Category Highlights
FIguRE 38 Year-to-year averages for the Recover categories across the peer groups.
Recovery Planning Improvements
Communi-cations
Recover Function
State Peer Profile 2018 4.53 4.64 4.62 4.60
2019 4.64 4.58 4.65 4.62
2020 4.80 4.60 4.67 4.68
Local Peer Profile 2018 3.34 3.16 3.30 3.27
2019 3.59 3.40 3.40 3.46
2020 3.70 3.57 3.56 3.61
Tribal Peer Profile 2018 3.33 3.17 4.17 3.56
2019 3.53 3.26 3.28 3.36
2020 3.94 3.62 3.82 3.79
Territorial Peer Profile 2019 3.33 2.25 2.67 2.75
2020 2.67 2.42 3.11 2.73
StateThe 2020 state peer group scored lowest in the “Improvements” category. States are 9% away from reaching the maturity level of Implementation in Process (5) within this category, which would outline a specific process for updating and improving recovery activities based on lessons learned after an incident.
2020 Recover Sub-Category Highlights
→ The following sub-category is one of the lower scoring sub-categories for the 2020 state (4.42), local (3.39), tribal (3.41), and territorial (2.00) peer groups: RC.CO–2: Reputation after an event is repaired.

2020 Nationwide Cybersecurity Review Summary Report42
Subsector Peer Groups
FIguRE 39 Average scores across the NIST CSF functions for State level peer group subsectors, as well as the “Fusion Center” peer group subsector. The 2020 “State – Elections” group was referenced previously in Figure 5 on page 10. Within each NIST CSF function below, the color code used is based on the seven-point maturity scale mirroring the figure at the bottom of the page.
Peer Group Subsector NameOrganization
Quantity Identify Protect Detect Respond RecoverAll Function
Average
2020 State – Information Tech. 8 5.38 5.83 5.65 5.76 5.37 5.60
2020 State – Finance/Revenue 61 4.87 5.36 5.10 5.23 5.05 5.12
2020 State – Recreational 10 4.70 5.37 5.27 4.98 4.83 5.03
2020 State – Fire/EMS/911 17 4.60 5.18 4.95 4.91 4.83 4.89
2020 State – Overall (50 States) 50 4.36 4.98 5.12 5.26 4.69 4.88
2020 State – Business/Admin. 75 4.60 5.09 4.74 5.05 4.86 4.87
2020 State – Public Safety/Law Enf. 60 4.67 5.04 4.92 4.94 4.55 4.82
2020 State – Transportation 17 4.60 4.82 5.03 5.06 4.53 4.81
2020 State – Education 30 4.59 5.15 4.78 4.72 4.66 4.78
2020 State Agency – All 522 4.48 4.93 4.69 4.84 4.66 4.72
2020 State – Judicial 18 4.43 4.72 4.70 4.78 4.73 4.67
2020 State – Higher Education 31 4.16 4.60 4.49 4.94 4.65 4.57
2020 State – Health & Human Svcs. 127 4.28 4.73 4.42 4.62 4.53 4.52
2020 State – Environmental 49 4.30 4.73 4.27 4.51 4.45 4.45
2020 Fusion Center 11 4.11 4.61 4.55 4.45 3.85 4.32
2020 State – Elections 19 3.77 4.09 4.21 4.18 3.93 4.04
1 2 3 4 5 6 7
Not Performed
Informally Performed
Documented Policy
Partially Documented
Standards and/or Procedures
Implementation in Process
Tested and Verified
Optimized
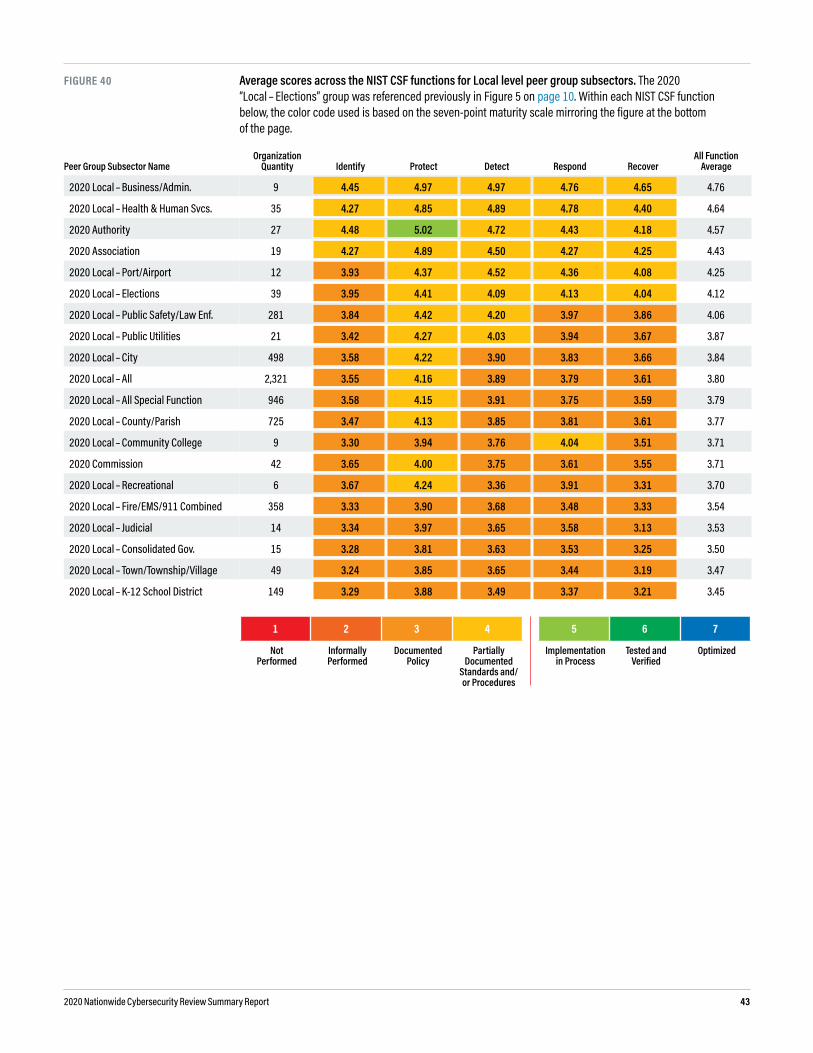
2020 Nationwide Cybersecurity Review Summary Report 43
FIguRE 40 Average scores across the NIST CSF functions for Local level peer group subsectors. The 2020 “Local – Elections” group was referenced previously in Figure 5 on page 10. Within each NIST CSF function below, the color code used is based on the seven-point maturity scale mirroring the figure at the bottom of the page.
Peer Group Subsector NameOrganization
Quantity Identify Protect Detect Respond RecoverAll Function
Average
2020 Local – Business/Admin. 9 4.45 4.97 4.97 4.76 4.65 4.76
2020 Local – Health & Human Svcs. 35 4.27 4.85 4.89 4.78 4.40 4.64
2020 Authority 27 4.48 5.02 4.72 4.43 4.18 4.57
2020 Association 19 4.27 4.89 4.50 4.27 4.25 4.43
2020 Local – Port/Airport 12 3.93 4.37 4.52 4.36 4.08 4.25
2020 Local – Elections 39 3.95 4.41 4.09 4.13 4.04 4.12
2020 Local – Public Safety/Law Enf. 281 3.84 4.42 4.20 3.97 3.86 4.06
2020 Local – Public Utilities 21 3.42 4.27 4.03 3.94 3.67 3.87
2020 Local – City 498 3.58 4.22 3.90 3.83 3.66 3.84
2020 Local – All 2,321 3.55 4.16 3.89 3.79 3.61 3.80
2020 Local – All Special Function 946 3.58 4.15 3.91 3.75 3.59 3.79
2020 Local – County/Parish 725 3.47 4.13 3.85 3.81 3.61 3.77
2020 Local – Community College 9 3.30 3.94 3.76 4.04 3.51 3.71
2020 Commission 42 3.65 4.00 3.75 3.61 3.55 3.71
2020 Local – Recreational 6 3.67 4.24 3.36 3.91 3.31 3.70
2020 Local – Fire/EMS/911 Combined 358 3.33 3.90 3.68 3.48 3.33 3.54
2020 Local – Judicial 14 3.34 3.97 3.65 3.58 3.13 3.53
2020 Local – Consolidated Gov. 15 3.28 3.81 3.63 3.53 3.25 3.50
2020 Local – Town/Township/Village 49 3.24 3.85 3.65 3.44 3.19 3.47
2020 Local – K-12 School District 149 3.29 3.88 3.49 3.37 3.21 3.45
1 2 3 4 5 6 7
Not Performed
Informally Performed
Documented Policy
Partially Documented
Standards and/or Procedures
Implementation in Process
Tested and Verified
Optimized

2020 Nationwide Cybersecurity Review Summary Report44
Noteworthy Subsector Findings1
Overall 12 of the 19 subsectors within the Local peer group scored at a level of 3, demonstrating they
have documented policy in place across all NIST CSF categories, on average. The remaining 7 subsectors scored higher than the overall Local peer group, with an average of 4. This demonstrates they have partially documented standards and/or procedures in place, on average, across all NIST CSF categories.
12 of the 19 subsectors among the Local peer group scored lowest in the Identify function.
Education The “Local – K-12 School District” subsector was the lowest scoring from among those in the
Local peer group.
Health and Human Services The “Local – Health & Human Services” subsector scored one full level of maturity higher on
average than the overall Local peer group and is demonstrating that, on average, they have partially documented standards and procedures in place across all NIST CSF categories.
Public Safety and Law Enforcement The “Local – Public Safety” subsector scored above the overall Local peer group, on average.
Authority The Authority subsector achieved the only function score of 5, the recommended minimum
maturity level, from among the Local peer group subsectors. This score was achieved in the Protect function and indicates they are at the level of maturity defined by implementation of the activity in a formalized manner.
1 The “Local – All Special Function” peer group subsector represents NCSR submissions from any office or department at a local level, rather than the overall local governments themselves such as cities, towns, or counties. Examples include local public health departments, local public safety offices, and local police departments.
The Local – Authority peer group subsector consists of stand-alone authorities created by acts of government or funded by government that may not sit as subordinate agencies under their local government entity.
The Local – Association peer group subsector consists of associations of local level government entities and includes examples like associations of counties or specific departments. These associations may be national or regional in nature, but are focused on local government entities or employees as their constituents.
The Local – Commission peer group subsector consists of multi-person or multi-governmental commissions formed to serve a specific purpose or to provide governmental services or functions. Regional planning commissions are an example of such an entity contained in this subsector.
The Local – Consolidated Gov. peer group subsector consists of participants from organizations made up of a government formed by consolidating one or more individual governments. Common examples include governments formed by the consolidation of a municipal and county government into one entity.

Partners
2020 Nationwide Cybersecurity Review Summary Report46
The MS-ISAC and EI-ISAC are thankful for their partners in developing and conducting the NCSR. They are: the Cybersecurity and Infrastructure Security Agency (CISA), the National Association of State Chief Information Officers (NASCIO), the National Association of Counties (NACo), and GMIS International.
DHS is responsible for safeguarding our nation’s critical infrastructure from physical and cyber threats that can affect national security, public safety, and economic prosperity. CISA is the nation’s risk advisor, working with partners to defend against today’s threats and collaborating to build more secure and resilient infrastructure for the future.
For additional information, please visit https://www.cisa.gov/.
NASCIO’s mission is to foster government excellence through quality business practices, information management, and technology policy.
Founded in 1969, NASCIO is a nonprofit, 501(c)(3) association representing state chief information officers and information technology executives and managers from the states, territories, and the District of Columbia. The primary state members are senior officials from state government who have executive-level and statewide responsibility for information technology leadership. State officials who are involved in agency level information technology management may participate as associate members. Representatives from federal, municipal, international government, and nonprofit organizations may also participate as members. Private-sector firms join as corporate members and participate in the Corporate Leadership Council.
For more information about NASCIO, please visit https://www.nascio.org.
The National Association of Counties (NACo) is the only national organization that represents county governments in the United States.
Founded in 1935, NACo provides essential services to the nation’s 3,069 counties. NACo advances issues with a unified voice before the federal government, improves the public’s understanding of county government, assists counties in finding and sharing innovative solutions through education and research, and provides value-added services to save counties and taxpayers money.
For more information about NACo, please visit http://www.naco.org.
GMIS International is a professional IT association of worldwide government IT leaders dedicated to providing best practice solutions for initiatives by providing its members with enhanced professional development, training, conferences, awards, and networking while offering leadership though advocacy, research, and shared experiences. GMIS International’s primary mission is to leverage the collective knowledge of its members. In 1971, a group of IT professionals, realizing the need to foster the sharing of experiences among all levels of government involved in providing IT services, organized GMIS International. Today, there are members in 36 states, plus 15 state chapter affiliates and six international affiliates. Membership in GMIS is open to public sector agencies at any level of government (federal, state, county, city, etc.) including schools (K-12, community college, and university) and special districts. Corporate memberships are also available.
For more information about GMIS International, please visit https://www.gmis.org/.
The Cybersecurity and Infrastructure Security Agency (CISA)
National Association of State Chief Information Officers
National Association of Counties
gMIS International

2020 Nationwide Cybersecurity Review Summary Report 47
Grant-funded by DHS CISA, the MS-ISAC is the focal point for cyber threat prevention, protection, response, and recovery for the nation’s state, local, tribal, and territorial (SLTT) governments. The MS-ISAC 24/7/365 Security Operations Center provides real-time network monitoring, early cyber threat warnings and advisories, vulnerability identification and mitigation, and incident response.
For more information about the MS-ISAC, please visit https://www.cisecurity.org/ms-isac/.
Grant-funded by DHS CISA, the Elections Infrastructure Information Sharing and Analysis Center® (EI-ISAC®) was established by the EIS-GCC to support the cybersecurity needs of the elections subsector. Through the EI-ISAC, election agencies gain access to an elections-focused cyber defense suite, including sector-specific threat intelligence products, incident response and remediation, threat and vulnerability monitoring, cybersecurity awareness and training products, and tools for implementing security best practices.
For more information about the EI-ISAC, please visit https://www.cisecurity.org/ei-isac/.
Multi-State Information Sharing & Analysis Center
Elections Infrastructure Information Sharing & Analysis Center