2020 fx outlook - ing think · fx outlook 2020 november 2019 3 maybe the dollar does peak in 2019...
TRANSCRIPT

FX Outlook 2020 November 2019
1
FX Strategy Team
27 November 2019
www.ing.com/THINK
Economic & Financial Analysis
2020 FX Outlook: Diamonds in the rough
**Please note that this is the non-investment research version of 2020 FX Outlook and does not include
the investment strategies contained in the Global Markets Research version of this report**
FX Outlook 2020 November 2019
1
Contents
Executive summary 2
2020 FX Outlook: Diamonds in the rough 3
Special Feature - What November 2020 means for USD ........................................................... 5
Three themes for 2020 ........................................................................................................................ 6
USD: A different kind of decline .................................................................................................... 12
Special Feature - Digital currencies: keep an eye on remittances ..........................................15
EUR: The funding currency ............................................................................................................. 16
Special Focus - Eurozone: Let’s get fiscal! .....................................................................................19
JPY: Crowded out .............................................................................................................................. 20
GBP: Light at the end of the tunnel ............................................................................................. 22
CNY: entering a volatile year ......................................................................................................... 25
CHF: Highly valued ............................................................................................................................ 28
Special Feature - 2020 commodities outlook .............................................................................30
$-Bloc: Getting carried away ......................................................................................................... 33
Scandies: Another year of SEK underperformance ................................................................. 39
CEEMEA: Unattractive low yielders, diversity in high yielders ............................................ 42
Special Feature - Balkans: Convergence story goes ahead .....................................................47
LATAM: Reversal of fortunes ......................................................................................................... 49
Asia: Trading on trade ..................................................................................................................... 54
Appendix: What can we learn from FX markets in 2019? 61
ING foreign exchange forecasts 62
Chris Turner Global Head of Strategy
London +44 20 7767 1610
Petr Krpata, CFA Chief EMEA FX and IR Strategist
London +44 20 7767 6561
Francesco Pesole FX Strategist
London +44 20 7767 6405
Carsten Brzeski Chief Economist Germany, Austria
Frankfurt +49 69 27 222 64455
Rob Carnell Chief Economist & Head of Research,
Asia-Pacific
Singapore +65 6232 6020
Carlo Cocuzzo Economist, digital finance
London +44 20 7767 5306
Bert Colijn Senior Economist, Eurozone
Amsterdam +31 20 563 4926
Warren Patterson Commodities Strategist
Singapore +65 6232 6020
Iris Pang Economist, Greater China
Hong Kong +852 2848 8071
Gustavo Rangel Chief Economist, LATAM
New York +1 646 424 6464
Prakash Sakpal Economist, Asia
Singapore +65 6232 6181
James Smith Developed Markets Economist
London +44 20 7767 1038
Valentin Tataru Chief Economist, Romania
Bucharest +40 31 406 8991
Wenyu Yao Senior Commodities Strategist
London +44 20 7767 6909
View all our research on Bloomberg at
ING5<GO>
Cover photograph courtesy of shutterstock
Publication date 27 November 2019

FX Outlook 2020 November 2019
2
Executive summary
• Diamonds in the rough? definition: ‘something with hidden characteristics and
future potential’. In an FX market priced for secular stagnation, we think the call
for 2020 is to identify those undervalued currencies able to hold their own against
the dollar – but which are also backed by both yield and growth.
• Screening for these characteristics we find that commodity currencies should
perform well in 2020. In the G10 space, we like the currencies of Norway, Canada
and New Zealand. In the EM space, BRL may offer one of the best stories in 2020.
• What of the dollar? Unlike many others, we don’t see a clean dollar bear trend in
2020. Continued money printing from G3 central banks mean relatively subdued
ranges for G3 currencies, with the EUR emerging as the funding currency of choice.
Key views
Second-guessing the mutually acceptable deal scenarios for Presidents Trump and Xi
has proved a near impossible task in 2019. And overlaying a 2020 FX outlook on a single
baseline scenario looks dangerous. Instead we are taking the view that: (1) world trade
volumes are unlikely to fall as sharply as they have over the past two years; and (2)
some segments of the FX universe are already priced for a view of secular stagnation.
Developments in core markets will also define the 2020 outlook. G3 economies look set
to slow further, G3 central bank balance sheets could grow by as much as US$1tr and
core bond yields will remain subdued. Renewed liquidity should keep volatility low.
Outperforming in this environment should be those undervalued currencies, with yield,
that can deliver total returns against the dollar. Relative economic strength should help
too. In the G10 space, this favours NOK, CAD and NZD as well.
In this publication we make the case for a different kind of dollar decline. One played out
against selective commodity currencies and high yielders, rather than a broad-based
drop. There are no clear signs of the de-dollarization trend hitting escape velocity yet,
but we have an article on whether Central Bank Digital Currencies (CBDC) can play a role
in the huge cross-border remittance market. This could reduce dollar demand.
We also present a dollar scenario analysis around US Presidential elections in November.
Subdued growth in Europe suggests investors will have to work hard for returns here. We
are edging our EUR/USD forecast lower (1.13 by end-2020) on the view that the EUR is
emerging as a useful funding currency. GBP may enjoy a brief rally should the Tories win
a working majority and start to ‘get Brexit done’, but uncertainty over the transition
period will limit gains. EUR/GBP is thus unlikely to dip much below the 0.82/0.83 area.
In EMEA, the slowdown in Western Europe is starting to weigh on the CEE. However, the
CNB looks set to push ahead with a hike and we favour CZK outperformance amongst
CE4 (mainly versus HUF). Elsewhere the rouble should holds its gains through 1Q20.
The vagaries of the trade war have made Asian FX a particularly difficult story. Asian FX
underperformance has been compounded by the electronic cycle, where high inventory
levels and delays in 5G roll-outs have hit some of the key players hard. However, all
currencies (barring THB) look undervalued and if, it’s a big if, trade tensions do not get
dramatically worse, high beta currencies like CNY and KRW can recover.
In the Latam space, the 2020 story should be one of a reversal of fortunes. The high
yield MXN may stand to lose its armour if Banxico embarks on an independent easing
cycle. And, after a tough year, we’re looking for a recovery in BRL. After worthwhile fiscal
reforms this year and as growth picks up, a re-rating story should see notable BRL gains
– more likely to be seen after Argentina has restructured its debt in March 2020.

FX Outlook 2020 November 2019
3
Maybe the dollar does peak in 2019
This time last year in our 2019 FX Outlook entitled Peak Dollar, we felt we could see some
modest dollar strength against the low yielders through the early part of the year, but
‘as 2019 progresses… a safe descent from the dollar summit should start the great
rotation out of the US and into the undervalued asset markets overseas’.
Nobody is talking about a ‘great rotation’ at the moment, but a few are talking about a
broad dollar decline in 2020 on the back of the end in US exceptionalism. We still have
some sympathy with this story, but do not see the 2020 FX narrative as simply one of a
clean dollar bear trend. And certainly we do not see 2020 delivering many of the bullish
FX outcomes witnessed in 2017.
Let’s take stock of where we are at the moment. Most leading indicators of activity
(mainly industrial) are heading lower and are in contraction territory. These are mainly
the manufacturing PMIs and business confidence surveys, reflecting an industrial sector
already in recession. The big question is whether low unemployment rates can sustain
consumption and buy time for the industrial cycle to turn?
The US economy is a good case in point here. After the fiscal-fuelled boom of 2018, the
US economy has started to slow. Leading that decline has been investment, which has
not contributed to growth since 1Q19 and may not contribute to growth until 3Q20.
That places an inordinate burden on the US consumer.
However, our team still looks for US consumption to offset investment in 2020 and
deliver a full year growth rate of 1.4%. That is slow by US standards, but far from a hard
landing.
Chris Turner Global Head of Strategy
London +44 20 7767 1610
Petr Krpata, CFA Chief EMEA FX and IR Strategist
London +44 20 7767 6561
Francesco Pesole FX Strategist
London +44 20 7767 6405
2020 FX Outlook: Diamonds in the rough • Somewhat surprisingly 2019 produced strong returns in most asset classes. And
many calls, including our own, that the dollar would peak may still prove correct.
Yet the dollar story in 2020 looks far from straightforward. Instead 2020 looks like
it will be a ‘currency-pickers’ market, with our job to identify relative value.
• Making a call on the trade environment looks almost impossible. All we can say is
that with the industrial sector already in recession, we doubt world trade volumes
can fall much further. After all, this is not the global financial crisis, where the
financial plumbing of world trade – trade credit – completely seized up.
• Instead then we see world trade building a base and – after a period of inventory
draw-down – some stabilisation in the industrial sector. Softening growth and
money printing central banks will likely keep G3 currencies relatively range-bound
during this period. The bigger story for 2020 will be total return considerations.
• In an FX market priced for stagnation, we think investors will favour undervalued
currencies, offering both yield and growth. Screening for these criteria, we see
outperformance in many commodity currencies in 2020 – both in the DM and EM
space. Also we expect EUR to increasingly become the funding currency of choice.

FX Outlook 2020 November 2019
4
Fig 1 Order books and confidence: not pretty Fig 2 US GDP profile: Relying on the consumer
95
96
97
98
99
100
101
102
103
-50
-40
-30
-20
-10
0
10
20
IndexIndex
ING global order books index (lhs)*
OECD business tendency surveys, Manufacturing (rhs)
-4
-2
0
2
4
6
1Q17 1Q18 1Q19 1Q20
Consumption Investment
Government Inventories
Net Trade GDP growth (QoQ an)
ING Forecasts
*The index is calculated as the average order books level weighted by GDP
share. The number of countries approximately 70% of world GDP.
Source: OECD, ING
Source: ING, Macrobond
As fears of a 2020 US recession have dissipated, even the much maligned US yield curve
has turned higher on the view that this year’s three Fed rate cuts – plus some
rapprochement between Washington and Beijing – can stave off any hard US landing.
As we have noted frequently this year, we think the US yield curve has been a good
barometer for risk appetite and secular stagnation fears have largely been a dollar
positive.
Fig 3 US dollar and yield curve
-10
0
10
20
30
40
50
60
70
801100
1120
1140
1160
1180
1200
1220
Jan 18 Apr 18 Jul 18 Oct 18 Jan 19 Apr 19 Jul 19 Oct 19
BBDXY US 2-10 year Treasury Curve (RHS bp, inverted)
Flatter curve, stronger dollar
Source: Bloomberg, ING
In theory then, could a steeper US yield curve spark a negative turn in the dollar more
broadly? We have two issues with that:
1) Our rates strategy team see the US 2-10 year curve locked in a zero to 30bp range
for 1H20, largely based on the soft US macro view and the possibility of one or two
more Fed rate cuts expected by our US macro team.
2) Even if the dollar did start to sell off, we doubt European currencies would be major
beneficiaries, largely because this is not 2017 – when pent up European optimism
was unlocked after the French election and the ECB signalled the ‘all-clear’ on the
deflation scare.

FX Outlook 2020 November 2019
5
What November 2020 means for USD Presidential timeline
3 FebIowa caucuses
20 Jan 2021
Inauguration Day
11 FebNew Hampshire primary 29 Feb
South Carolina Democrat primary
Dec (date uncertain)House of Representatives vote on whether to impeach President Trump
22 FebNevada Democrat caucus
Jan (date uncertain) Impeachment trial likely held in the Senate
3 MarSuper Tuesday 15 Democrat primaries and 13 Republican primaries
13-16 JulDemocrat National
Convention (Milwaukee)
24-27 AugRepublican National
Convention (Charlotte)
Mar-Junprimaries continue by state
29 Sep1st Presidential Debate (Notre Dame, Indiana)
15 Oct2nd Presidential
debate (Ann Arbor,
Michigan)
22 Oct3rd Presidential debate (Nashville Tennessee)
3 NovElection Day
Mid Dec Electoral College formally votes for President and vice president
Jan Feb Mar Apr May Jun Jul Aug Sept Oct Nov Dec
7 OctVice presidential debate (Salt Lake City, Utah)
Dec
Source: ING
When examining the presidential election and its implication for economic policy there
are three key areas to focus on. Firstly, there is the stance of fiscal policy. Loose fiscal
policy, either through lower taxes, more spending, or a combination of the two typically
results in the Federal Reserve running tighter monetary policy. Historically this has been
a positive backdrop for the US dollar.
Secondly, there is the regulatory framework. Tighter regulations may be interpreted as
a hindrance to business activity and may lower growth even though, if properly
implemented, it provides safeguards and can create incentives. The perception of
slightly weaker growth may result in lower interest rates and be a mild dollar negative.
Then, thirdly, there is protectionism. The implementation of tariffs as a tool to extract
trade concessions under Trump’s Presidency has hurt business sentiment by creating
uncertainty and raising costs. With China responding in kind, both economies have
experienced headwinds. Amidst weak global growth the US economy has outperformed
and the dollar has stayed firm. If trade tensions were to persist then this could maintain
a safe haven bid for the dollar. Should they ease then this could create an environment
for better global growth and see investment flows start to move out of the US dollar.
Candidate policy preferences Policy preferences and the USD
Trump*
Biden
Warren
Sanders
Buttigieg/Bloomberg
Protectionism Loose FiscalTight
MonetaryRegulatory
Environment Dollar Impact
++
0
--
--
+
Re-election of Donald Trump would likely see
the pursuit of looser fiscal policy (should
Congress allow it), reduced regulations and full-
on protectionism. Despite consistent pressure
on the Fed to cut, this policy mix is USD bullish.
Centrist Biden would pursue looser fiscal policy
through infra-structure, rather than tax cuts.
Stricter regulatory oversight of big tech and
support for green energy. Less protectionism.
Warren & Sanders would probably have similar
impact on the USD – negative. Big re-distributive
tax hikes, much greater regulation and in
Warren’s case, formally targeting weaker US$.
In addition, both favour Modern Monetary
Theory (MMT), where Fed prints trillions to
support ‘Green New Deal’ aiming to make US
carbon neutral. Fed’s mandate to change too.
Buttigieg, or Bloomberg if he runs on the
Democrat ticket, occupy the centre ground, like
Biden. Better relations with the Fed and
infrastructure spending look mildly US$ positive.
*In the scenario of Republicans controlling Congress
Source: ING
Special Feature

FX Outlook 2020 November 2019
6
Three themes for 2020 Theme 1: Bottoming growth
Protectionism has frustrated global growth for a second year and, in the case of Asia,
pressure from the trade war has been compounded by the low-point in the global tech
cycle. Our baseline view sees a marginal pick-up in global trade volumes into 2020,
though our trade team feel that 5-10% YoY growth rates may be a thing of the past –
supply chains having been shortened after the 2018-19 trade shock.
Fig 4 World trade: Finding a base in 2020
-2%
0%
2%
4%
6%
8%
10%
Jan 11 Jan 12 Jan 13 Jan 14 Jan 15 Jan 16 Jan 17 Jan 18 Jan 19 Jan 20
% YoY
ING Scenarios
Up
BaseDown
GDP Growth
Industrial production
Trade volumes
Source: CPB, ING
As highlighted in Figure 4, our trade team’s expectations for trade volume growth in
2020 are very conservative – but importantly their bearish scenario assumes that things
do not get materially worse than we are witnessing currently – ie, a modest contraction.
In all, our macro team see 2020 global growth around or slightly above 2019 levels
although there will be a growing disparity between the DM and EM economies.
Indeed, it will be no surprise that investors will
be looking to EM shores in 2020. In Figure 5, we
highlight ING’s growth forecasts for 2020 and
2021 in both the developed and emerging
markets. The main take-away for 2020 is that aggregate DM growth slows for a third
year in a row, while EM growth finally rises. After all, some of these large EM monetary
easing cycles and big currency declines should be providing some support.
These diverging growth rates will have some significant implications for interest rate
policies and also capital flows as flat or negative yield curves in the G3 space prompt
pension fund managers to search further afield in terms of yield.
Historically, asset and liability matching has been a major challenge for the Japanese
pension fund industry. But into 2020, expect to hear more of European pension funds
with low coverage ratios forced to look further afield (increasingly outside of the G3) in
search for higher-yielding products.
“In 2020 DM growth slows for a third year
in a row, while EM growth finally rises”

FX Outlook 2020 November 2019
7
Fig 5 DM versus EM GDP performance and ING forecasts (% annual)
0.0
1.0
2.0
3.0
4.0
5.0
6.0
7.0
8.0
2010 2011 2012 2013 2014 2015 2016 2017 2018 2019F 2020F 2021F
Developed Markets Emerging Markets EM weighted according Barclay EM Local Currency Bond Index
Source: ING, WEO
Looking within the DM and EM currency blocs, we note the following: G3 economies look
to slow quite steadily. That effectively represents policy paralysis in Europe and Japan at
a time when the US is moving deeper into its late cycle status. For reference, we see the
US slowing down to 1.4% in 2020 versus 2.3% in 2019, and the Eurozone and Japan
dropping to 0.7% (1.1%) and 0.2% (1.2%), respectively.
Fig 6 Within DM, we favour cyclicals over G3 Fig 7 Latam, Asia and some high yield to outperform
0.00
0.50
1.00
1.50
2.00
2.50
G10 Cyclical G3
2019F 2020F 2021F
0
1
2
3
4
5
6
CEE4 CEEMEA high
yie lders*
Asia Latam
2019F 2020F 2021F
Source: Macrobond, ING *Russia, Turkey, South Africa, Ukraine
Source: Macrobond, ING
While we do see a modest slowdown in Chinese growth, we are looking for recoveries in
the likes of Brazil, Russia, Mexico, India and several other Asian countries. Unlike many in
the market, we tend to agree with the IMF that EM growth will be sufficient to offset the
DM slowdown and keep 2020 world growth at similar levels to this year. That’s not bad.
From an FX perspective, the above means the following: (1) the growth outlook favours
EM FX versus DM FX (Figure 5); (2) within the DM/G10 FX space, cyclical currencies should
be better positioned versus the major, low yielding currencies where growth is slowing
(Figure 6). This means that USD, JPY and EUR
should lag AUD, NZD, CAD or NOK; and (3) within
the EM FX space, CEE is the only region that will
not show an improvement in growth next year
(Figure 7). With local CE4 currencies being low
yielders, they should generally underperform the high yielders in the rest of world,
where growth is set to accelerate. The still depressed volatility environment further
supports this case.
“Within the EM FX space, CEE is the only
region that will not show an improvement
in growth next year”

FX Outlook 2020 November 2019
8
Theme 2: Low volatility favours carry
When setting the scene for 2020 it is also worth considering the volatility environment.
Will 2020 be a late cycle, tighter liquidity environment which would typically mean
higher volatility and outperformance of the safe haven currencies? Probably not.
Instead the Fed has prematurely stopped its misnamed quantitative tightening – having
found the biting point in US money markets where liquidity was deemed as scarce. And
our US macro team actually see risk of one or two more Fed cuts in early 2020.
Fig 8 G3 central bank balance sheets expand again Fig 9 G10 volatility adjusted carry
0
5
10
15
20
25
30
0
1
2
3
4
5
6
2014 2015 2016 2017 2018 2019 2020
Total (rhs) Fed ECB BOJ
US$tr equivalent Forecast -->
US$-0.6trUS$+1tr
-0.20
-0.10
0.00
0.10
0.20
0.30
0.40
0.50
CAD USD NOK NZD AUD GBP SEK JPY EUR CHF
Forward implied yield (3m) adjusted for implied volatility (3m) [%]
Source: ING Rates Strategy Team Source: Bloomberg, ING
This comes at a time when the BoJ’s balance sheet is still growing (by around 4% of GDP
per year) and the ECB has re-started asset purchases. After US$600bn of balance sheet
shrinkage since 2018, it looks like G3 central balance sheets could revert to growth of
around US$1trn by the end of 2020.
Thus, the case for a volatility pick up on a late cycle liquidity withdrawal has therefore
evaporated, undermining those bull cases for both JPY and CHF. And low volatility
typically supports carry trade strategies – suggesting continuing demand for the USD
and commodity currencies – largely at the expense of Europe.
Fig 10 EM FX volatility has converged on the low G7 levels Fig 11 EM FX didn’t do too badly in absolute return terms
4.0
6.0
8.0
10.0
12.0
14.0
16.0
18.0
Jan 10 Jan 12 Jan 14 Jan 16 Jan 18 Jan 20
EM FX volatility G7 FX Volatility
%
-10
-5
0
5
10
15
20
RU
B
AR
S*
TR
Y
MX
N
TH
B
IDR
PH
P
PE
N
INR
MY
R
ZA
R
HK
D
SG
D
TW
D
CN
Y
CO
P
CZ
K
PL
N
BR
L
KR
W
RO
N
CL
P
HU
F
Total return
Spot return
%, EM FX returns vs USD in 2019, spot and total (spot + carry) return
*ARS fell 37% vs USD in spot terms in 2019 (not fully shown in the chart) Source: Bloomberg Source: Bloomberg, ING
Bottoming growth, the stabilizing US-China trade conflict and the depressed FX volatility
environment will in our view benefit EM high yielders. As Figure 11 shows, EM FX has not
performed too poorly so far this year in absolute return terms (two-thirds of EM
currencies actually showed positive return versus USD – grey line). This is quite an
achievement in a year where declines in trade volumes and global growth would not be
seen by many as EM FX carry friendly.
FX Outlook 2020 November 2019
9
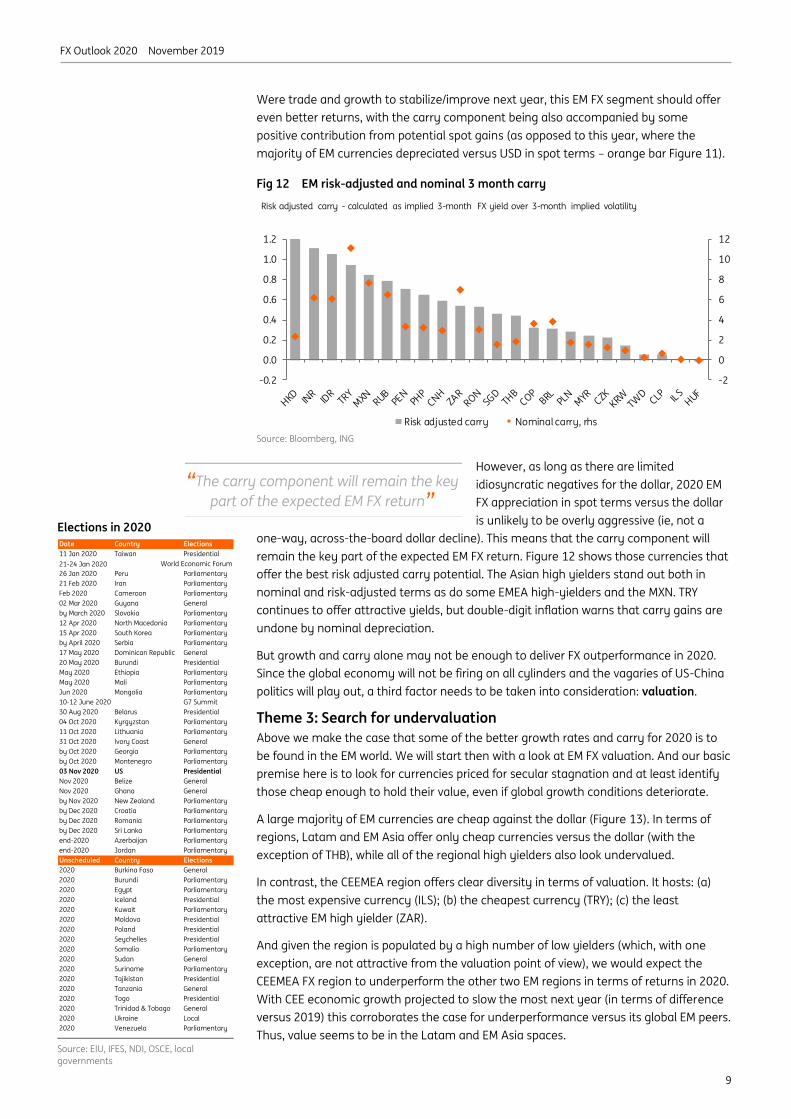
Were trade and growth to stabilize/improve next year, this EM FX segment should offer
even better returns, with the carry component being also accompanied by some
positive contribution from potential spot gains (as opposed to this year, where the
majority of EM currencies depreciated versus USD in spot terms – orange bar Figure 11).
Fig 12 EM risk-adjusted and nominal 3 month carry
-2
0
2
4
6
8
10
12
-0.2
0.0
0.2
0.4
0.6
0.8
1.0
1.2
Risk adjusted carry Nominal carry, rhs
Risk adjusted carry - calculated as implied 3-month FX yield over 3-month implied volatility
Source: Bloomberg, ING
However, as long as there are limited
idiosyncratic negatives for the dollar, 2020 EM
FX appreciation in spot terms versus the dollar
is unlikely to be overly aggressive (ie, not a
one-way, across-the-board dollar decline). This means that the carry component will
remain the key part of the expected EM FX return. Figure 12 shows those currencies that
offer the best risk adjusted carry potential. The Asian high yielders stand out both in
nominal and risk-adjusted terms as do some EMEA high-yielders and the MXN. TRY
continues to offer attractive yields, but double-digit inflation warns that carry gains are
undone by nominal depreciation.
But growth and carry alone may not be enough to deliver FX outperformance in 2020.
Since the global economy will not be firing on all cylinders and the vagaries of US-China
politics will play out, a third factor needs to be taken into consideration: valuation.
Theme 3: Search for undervaluation
Above we make the case that some of the better growth rates and carry for 2020 is to
be found in the EM world. We will start then with a look at EM FX valuation. And our basic
premise here is to look for currencies priced for secular stagnation and at least identify
those cheap enough to hold their value, even if global growth conditions deteriorate.
A large majority of EM currencies are cheap against the dollar (Figure 13). In terms of
regions, Latam and EM Asia offer only cheap currencies versus the dollar (with the
exception of THB), while all of the regional high yielders also look undervalued.
In contrast, the CEEMEA region offers clear diversity in terms of valuation. It hosts: (a)
the most expensive currency (ILS); (b) the cheapest currency (TRY); (c) the least
attractive EM high yielder (ZAR).
And given the region is populated by a high number of low yielders (which, with one
exception, are not attractive from the valuation point of view), we would expect the
CEEMEA FX region to underperform the other two EM regions in terms of returns in 2020.
With CEE economic growth projected to slow the most next year (in terms of difference
versus 2019) this corroborates the case for underperformance versus its global EM peers.
Thus, value seems to be in the Latam and EM Asia spaces.
“The carry component will remain the key
part of the expected EM FX return” Elections in 2020 Date Country Elections
11 Jan 2020 Taiwan Presidential
21-24 Jan 2020
26 Jan 2020 Peru Parliamentary
21 Feb 2020 Iran Parliamentary
Feb 2020 Cameroon Parliamentary
02 Mar 2020 Guyana General
by March 2020 Slovakia Parliamentary
12 Apr 2020 North Macedonia Parliamentary
15 Apr 2020 South Korea Parliamentary
by April 2020 Serbia Parliamentary
17 May 2020 Dominican Republic General
20 May 2020 Burundi Presidential
May 2020 Ethiopia Parliamentary
May 2020 Mali Parliamentary
Jun 2020 Mongolia Parliamentary
10-12 June 2020 G7 Summit
30 Aug 2020 Belarus Presidential
04 Oct 2020 Kyrgyzstan Parliamentary
11 Oct 2020 Lithuania Parliamentary
31 Oct 2020 Ivory Coast General
by Oct 2020 Georgia Parliamentary
by Oct 2020 Montenegro Parliamentary
03 Nov 2020 US Presidential
Nov 2020 Belize General
Nov 2020 Ghana General
by Nov 2020 New Zealand Parliamentary
by Dec 2020 Croatia Parliamentary
by Dec 2020 Romania Parliamentary
by Dec 2020 Sri Lanka Parliamentary
end-2020 Azerbaijan Parliamentary
end-2020 Jordan Parliamentary
Unscheduled Country Elections
2020 Burkina Faso General
2020 Burundi Parliamentary
2020 Egypt Parliamentary
2020 Iceland Presidential
2020 Kuwait Parliamentary
2020 Moldova Presidential
2020 Poland Presidential
2020 Seychelles Presidential
2020 Somalia Parliamentary
2020 Sudan General
2020 Suriname Parliamentary
2020 Tajikistan Presidential
2020 Tanzania General
2020 Togo Presidential
2020 Trinidad & Tobago General
2020 Ukraine Local
2020 Venezuela Parliamentary
World Economic Forum
Source: EIU, IFES, NDI, OSCE, local
governments

FX Outlook 2020 November 2019
10
Fig 13 Most EM currencies are cheap vs USD
-30%
-20%
-10%
0%
10%
20%
30%
BRL MXN CLP COP PEN CNY INR IDR KRW MYR PHP SGD TWD THB CZK HUF PLN ILS ZAR TRY RUB
+ / - 1.5 standard deviation Misalignment
Real exchange rate misalignments (EM FX against USD) vs their BEER fair values
Overvalued against USD
Undervalued against USD
Latam EM Asia CEEMEA
Source: ING
Within the G10 FX segment, there is clear divergence between the dollar valuation
against other low yielding major currencies, such as EUR, JPY or GBP (being close to its
fair values, but undervalued vs CHF) and the pro-cyclical currencies such as NOK or AUD
(where the dollar is in most cases meaningfully overvalued). This is evident in Figure 14.
Fig 14 Divergence in the G10 FX valuation: unattractive majors
-30%
-20%
-10%
0%
10%
20%
30%
EUR JPY GBP CHF SEK NOK CAD AUD NZD
+ / - 1.5 standard deviation Misalignment
Real exchange rate misalignments vs their BEER fair value. Bilateral G10 FX mis-valuation against USD
Overvalued against USD
Undervalued against USD
Source: ING
Bar the SEK, all the cyclical G10 currencies also show a positive or close to neutral output
gap and inflation close to target - as illustrated in Figure 15 (these currencies are in the
desirable top-right quadrant). We say desirable here, since central banks in these
economies may be less prone to more aggressive monetary easing.
Again with the exception of the SEK, the cyclical G10 FX segment offers relatively good
yield (Figure 9). All this makes most of the G10 pro-cyclical currencies an attractive
proposition for 2020, in our view.
Fig 15 Most cyclical G10 FX show close-to-target CPI and non-negative output gap
US
Japan
Eurozone*
UK
Canada
Australia
New Zealand
Switzerland
Sweden
Norway
-1.5
-1.0
-0.5
0.0
0.5
-1.2 -1.0 -0.8 -0.6 -0.4 -0.2 0.0 0.2 0.4
Dis
tan
ce f
rom
CB
in
fla
tio
n t
arg
et
Output gap
Based on 2020 ING and OECD estimates (all in %)
'*Eurozone Potential GDP calculated by a weighted average of 16 EZ countries covered by OECD report
Source: ING, OECD

FX Outlook 2020 November 2019
11
Conclusion: Diamonds in the rough Into 2020 then, it looks a question of wading through the pessimism and trying to dig
out currencies that could shine. The starting point, we believe, is to use the screening
criteria we have outlined above.
Of the G3 currencies, notably the USD only appears under the carry criterion. The EUR
and JPY do not feature anywhere and we particularly like the EUR as a funding currency
in 2020. In this publication we are also revising up our USD/JPY forecasts, looking for a
105-110 trading range through 2020.
In the DM space, we think the NOK meets all three criteria and we forecast close to 7%
total returns in NOK against the USD by the end of 2020. CAD meets two of the criteria
and should deliver 6% total return over the same period. The AUD screens well, although
we are worried by the risk of RBA QE in 2Q20 – which would be very negative for AUD. In
that region we prefer NZD over AUD, especially in 1Q20.
Fig 16 Discovering the diamonds that exhibit carry, growth and valuation characteristics
SEK, CNY, KRW, TWD,
HUF
Pick up in central bank money printing will suppress volatility.
In terms of risk-adjusted carry, USD and commodity FX in the G10
space and in the EM space, it’s the usual suspects
Carry
BRL, PHP
MYR
NOK, AUD, INR, RUB
G3 growth is set to slow, $ bloc & Norway economies look set for some modest growth and have
positive output gaps.
In EM space, Latam, High Yield and parts of Asia favoured for some
recovery
Growth
In the G10 space, we don’t see the USD as exceptionally overvalued,
but do see value in the Australasians and the Scandis
In EM, Latam and Asia offer the most undervalued currencies
Valuation
USD, IDR, ZAR
NZD, MXN
CAD
Source: ING
In the EM space, on a total return basis we highlight BRL, which could deliver 10%+
against the dollar by the end of 2020. The RUB meets all the criteria, but we favour
holding the position only through 1Q20 (and against the EUR to pick up additional yield).
The INR screens well, but twin deficits suggest gains will be seen purely from the carry
rather than nominal INR appreciation. IDR carry also looks interesting in a low yield
environment.
Unlike in 2019, we do not think 2020 is the year to look for MXN out-performance.
Banxico may be cutting more aggressively than the Fed and our forecast total return of
holding MXN against the USD of just 3% in 2020 may prove too thin given the risks.
Of course there are lots of individual stories at play here, which may undermine some of
the recommendations made through the above screening process. That is why we
encourage our readers to look through the individual currency sections for all the local
considerations and the detailed set of forecasts.

FX Outlook 2020 November 2019
12
2019 has generally been a good year for the dollar. Marginal new highs have been seen
in the rally that started in February 2018 – when the White House fired the opening salvos
in the trade war. The dollar rally has largely been concentrated against pro-cyclical
currencies with the occasional exceptions in G10 (CAD, GBP) and in EM (RUB, THB).
A common expectation for 2020 now seems to be one of broad dollar depreciation. Fund
managers are most bearish on the dollar since September 2007 and the familiar
narrative is that the end of US exceptionalism spells trouble for the dollar. Certainly, we
subscribe to the view that the US growth differential against the Rest of the World (RoW)
will shift against the US over the next couple of years.
Fig 17 Dollar has nudged higher this year… Fig 18 …but RoW may start outperforming US in 2020/21
80
90
100
110
120
130
140
Jan 90 Jan 95 Jan 00 Jan 05 Jan 10 Jan 15 Jan 20
US real trade weighted Majors
US real trade weighted Broad
2005 = 100
80
85
90
95
100
105
-5.0
-4.0
-3.0
-2.0
-1.0
0.0
US vs. RoW Growth Differential
(% YoY)
Real Broad Trade Weighted
Dollar (RHS)
Source: Bloomberg Source: Macrobond, ING
The difference is that we expect the growth performance in the RoW to be far from
uniform. Most importantly, 2020 will not be a repeat of 2017 when the world economy
was firing on all cylinders (even Europe participated). Back then synchronised global
growth saw trade volumes growing 5% YoY and the dollar embarking on a broad decline.
Given our view that Europe will not be a particularly attractive investment destination in
2020 and that the popular DXY is 77% weighted towards European currencies, we are
not looking for a major DXY decline next year.
Based on our view of only modest upside for EUR/USD (1.13 end-2020) we expect DXY to
fall just over 2% next year. If EUR/USD is closer to 1.10 rather than 1.13 at the end of
2020, then that DXY decline is under 1%.
USD: A different kind of decline
• The end of US exceptionalism is sparking calls for a weaker dollar into 2020. We
think the dollar decline will be far more differentiated than broad-based.
• Most US Presidential candidates favour a weaker dollar. The best way to achieve
that is to improve trade relations and create attractive alternatives overseas.
• Russia and China are making steps to de-dollarize their economies. Progress has
been slow and the dollar is still by far the most favoured transaction currency.
Chris Turner Global Head of Strategy
London +44 20 7767 1610

FX Outlook 2020 November 2019
13
We also take issue with some views that the
dollar is materially overvalued. Our medium-
term fair value measures have it nowhere near
as overvalued as it was in early 2017, largely
because we have seen a fall in EUR and GBP fair values versus the USD.
In addition, we think that the Fed has to deliver at least three to four independent cuts
(relative to other central banks and in addition the Fed rate cuts already priced in) to
bring rate differentials back into a range that makes a difference for dollar pricing – see
Figure 20. One of the core stories in 2019 has been that, despite three Fed rate cuts,
dollar hedging costs have still been too expensive to make a difference. For example, the
costs for European investors to hedge USD exposure have fallen 100bp this year, but, at
2.5% pa, they are still too high in a low yield world.
Fig 19 The dollar is not particularly overvalued Fig 20 Dollar differentials need to narrow a lot further
-20%
-10%
0%
10%
20%
1999 2001 2003 2005 2007 2009 2011 2013 2015 2017
Real Trade Weighted USD deviation away from the BEER fair value
+ / - 1.5 standard deviation
Very expensive
Cheap
Expensive
Very cheap
USD is overvalued, but not
extremely
-0.2
0
0.2
0.4
0.6
0.8
-3
-2
-1
0
1
2
3
1999 2002 2005 2008 2011 2014 2017
2-year rate differential +/- 1 st. dev (of 2y rate differential)Additional cuts to be priced in12m correl (2y spread vs USD index), rhs
Source: ING Source: ING
The above yield story is probably more important than we think. Looking at the portfolio
flow story both from ECB and US Treasury data suggests hot money – or short-term
financial flows - could be driving exchange rates. For example, we talk about US
exceptionalism and the US sucking in capital, but data does not bear this story out.
Through the twelve months to September 2019, foreigners bought only a net US$41bn
of US securities (Treasuries, corporate bonds and equities) versus US$334bn in the
twelve months to September 2018. Instead then we believe short-term financial flows
are driving dollar strength. Unless the Fed cuts very aggressively in 2020 (eg, three or
more times) we do not see a stampede out of USD deposits.
When it comes to Washington’s FX policy, it is fair to describe this as mercantilist. The
White House occasionally rails against the strong dollar, but its biggest bug-bears are
the cheap currencies of China and Europe that have contributed to the huge US trade
deficit. Should a Phase One Deal with China be signed, look out for any currency clause.
Such a clause may mirror the one suggested in the USMCA deal, which effectively backs
a free-float and transparency on FX intervention. In theory this would prevent massive
FX intervention from the Chinese to support USD/CNY should the dollar trend turn lower.
Interference with an orderly Balance of Payment adjustment is Washington’s concern.
We doubt that President Trump would turn to
physical FX intervention to weaken the dollar –
though he does have the authority. And
occasional bills in Congress to effectively tax
short-term capital inflows are unlikely to gain
much cross-party support – where capital flow measures are more frequently
associated with emerging economies.
“We also take issue with some views that
the dollar is materially over-valued”
“We doubt that President Trump would
turn to physical FX intervention to
weaken the dollar”
FX Outlook 2020 November 2019
14
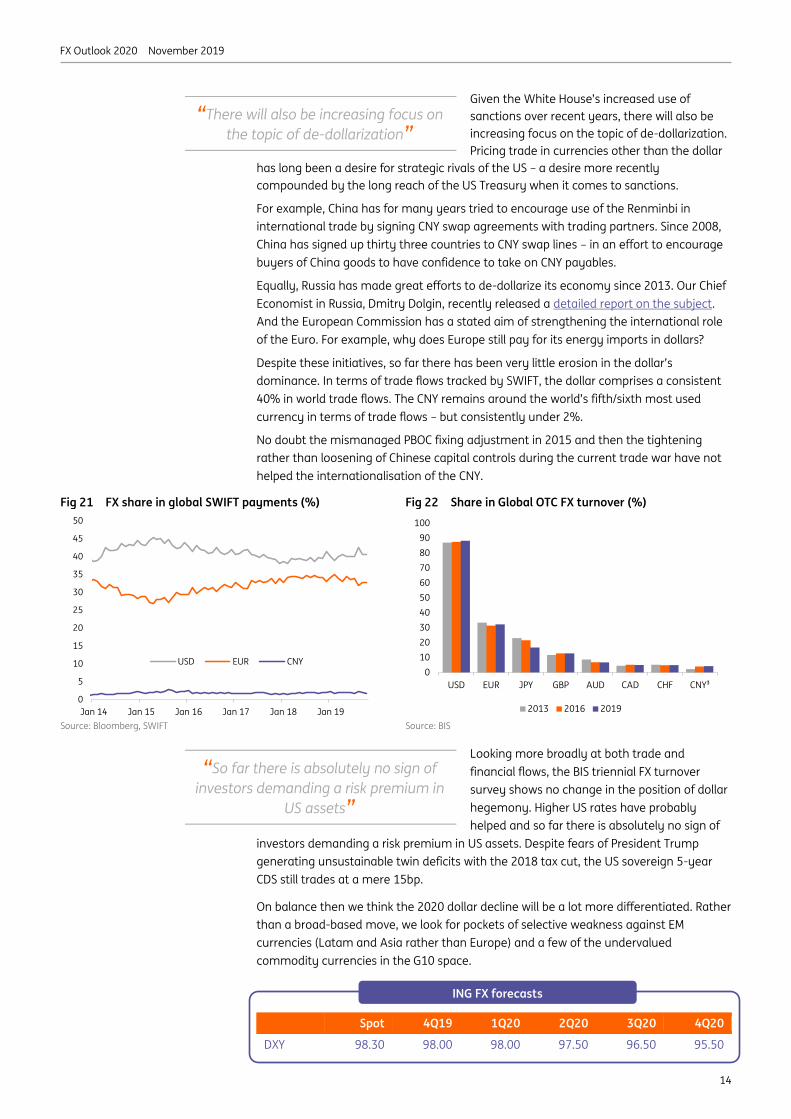
Given the White House’s increased use of
sanctions over recent years, there will also be
increasing focus on the topic of de-dollarization.
Pricing trade in currencies other than the dollar
has long been a desire for strategic rivals of the US – a desire more recently
compounded by the long reach of the US Treasury when it comes to sanctions.
For example, China has for many years tried to encourage use of the Renminbi in
international trade by signing CNY swap agreements with trading partners. Since 2008,
China has signed up thirty three countries to CNY swap lines – in an effort to encourage
buyers of China goods to have confidence to take on CNY payables.
Equally, Russia has made great efforts to de-dollarize its economy since 2013. Our Chief
Economist in Russia, Dmitry Dolgin, recently released a detailed report on the subject.
And the European Commission has a stated aim of strengthening the international role
of the Euro. For example, why does Europe still pay for its energy imports in dollars?
Despite these initiatives, so far there has been very little erosion in the dollar’s
dominance. In terms of trade flows tracked by SWIFT, the dollar comprises a consistent
40% in world trade flows. The CNY remains around the world’s fifth/sixth most used
currency in terms of trade flows – but consistently under 2%.
No doubt the mismanaged PBOC fixing adjustment in 2015 and then the tightening
rather than loosening of Chinese capital controls during the current trade war have not
helped the internationalisation of the CNY.
Fig 21 FX share in global SWIFT payments (%) Fig 22 Share in Global OTC FX turnover (%)
0
5
10
15
20
25
30
35
40
45
50
Jan 14 Jan 15 Jan 16 Jan 17 Jan 18 Jan 19
USD EUR CNY
0
10
20
30
40
50
60
70
80
90
100
USD EUR JPY GBP AUD CAD CHF CNY³
2013 2016 2019
Source: Bloomberg, SWIFT Source: BIS
Looking more broadly at both trade and
financial flows, the BIS triennial FX turnover
survey shows no change in the position of dollar
hegemony. Higher US rates have probably
helped and so far there is absolutely no sign of
investors demanding a risk premium in US assets. Despite fears of President Trump
generating unsustainable twin deficits with the 2018 tax cut, the US sovereign 5-year
CDS still trades at a mere 15bp.
On balance then we think the 2020 dollar decline will be a lot more differentiated. Rather
than a broad-based move, we look for pockets of selective weakness against EM
currencies (Latam and Asia rather than Europe) and a few of the undervalued
commodity currencies in the G10 space.
Spot 4Q19 1Q20 2Q20 3Q20 4Q20
DXY 98.30 98.00 98.00 97.50 96.50 95.50
“There will also be increasing focus on
the topic of de-dollarization”
“So far there is absolutely no sign of
investors demanding a risk premium in
US assets”
ING FX forecasts

FX Outlook 2020 November 2019
15
Digital currencies: keep an eye on remittances
Shortly after Facebook’s announcement regarding the development of its own digital
currency Libra, policymakers around the globe have rushed with comments highlighting
the potential pitfalls and risks of launching such a project on a global scale. Their
immediate concerns relate to the disintermediation of the traditional banking system
and the potential loss of monetary sovereignty. Nonetheless, one unintended
consequence is that it has greatly accelerated the debate on the development of digital
currencies, including the possibility that central banks could launch their first pilot of
Central Bank Digital Currency (CBDC) within the next five years. So what would be an
immediate link between digital currencies and markets and how would it work?
Remittances could be an immediate use case for digital currencies
The global remittances market reached US$689 billion in 2018 and will grow beyond
US$700 billion by the end of this year, according to World Bank estimates. The market is
growing at an exceptional rate: if we exclude China, remittances now outpace foreign
direct investment (FDI) flows. Moreover, the global average cost of sending remittances
currently stands around 6.84 percent, which is relatively high. The rise of digital
currencies could push transaction fees lower and give rise to more frequent and cheaper
transactions.
Fig 23 Top 20 remittance recipient countries in 2019, US$bn (estimates)
0
10
20
30
40
50
60
70
80
90
Source: KNOMAD, World Bank
The end of dollarisation?
So what does this mean for the currency market? Let’s take a look at Ukraine, which is a
highly dollarised economy. The World Bank estimates that Ukrainian workers will send
some US$16 billion (11.8 percent of Ukraine’s GDP) back to their home country this year.
Moreover, the total average cost for sending US$200 of remittances from the United
States to Ukraine stands at around US$9.90 (or 4.95 percent)1. This includes both the
transaction fee and the exchange rate margin cost. The launch of either a privately or a
publicly issued digital currency (eg, the National Bank of Ukraine conducted an e-hryvnia
pilot this year already) could compress both costs, which would offer Ukrainians another
(digital) channel to send their remittances back to their home country.
And if digital currencies are accepted by retailers at point-of-sale and on
e-commerce platforms, this could in theory diminish dollar demand. Surely, regulatory
and policy challenges are unlikely to disappear, nonetheless, markets should start
thinking about these issues and their immediate implications.
1 Source: The World Bank, Remittance Prices Worldwide, available at http://remittanceprices.worldbank.org
Special Focus
Carlo Cocuzzo Economist, digital finance
London +44 (0)20 7767 5306

FX Outlook 2020 November 2019
16
The ECB is presiding over a low growth, low yielding euro environment…
In a nutshell, the ECB’s policy stance and its implications should remain a drag on the
euro. The September ECB easing package (10bp deposit rate cut and the restart of QE)
was not strong enough to meaningfully improve the EZ growth and inflation prospects.
As Figure 24 shows, economic growth will remain lacklustre (growth rate at / below 1.0%
over the next two years) and inflation should remain persistently below the 2% target.
On a comparative basis, EUR screens as one of the least appealing G10 currencies from
an output gap and CPI targeting point of view (Figure 15 on page 12). Indeed, with the
ECB forward guidance conditional on CPI “robustly” converging to the target, this means
one thing. Any ECB policy normalisation remains off the table, with the policy rate
staying negative and the ECB continuing to purchase EZ bonds.
All this suggests that an idiosyncratic, domestically driven EUR rally is unlikely. The
September ECB easing package simply seems insufficient to change the outlook for EZ
growth and CPI but looks sufficient enough to keep EUR low – as EUR interest rates remain
negative and growth uninspiring (and the latter confirming the need for the former).
Fig 24 Uninspiring EZ growth and inflation prospects Fig 25 EZ GDP growth still to lag the growth in the US
0.0
0.2
0.4
0.6
0.8
1.0
1.2
1.4
-0.1
0.1
0.3
0.5
0.7
0.9
1.1
1.3
1.5
2019 2020 2021
EZ GDP YoY EZ CPI Inflation YoY, lhs
%, ING Forecast
-1.5
-1.0
-0.5
0.0
0.5
1.0
1.5
2.0
2.5
3.0
3.5
2016 2017 2018 2019 2020 2021
US EZ EZ-US growth differential
%, YoY GDP
Source: ING Source: ING
…making a 2017-like EUR/USD rally unlikely
The absence of a potential ECB policy normalisation makes us reluctant to call for a
meaningful rise in EUR/USD. A repeat of the significant 2017-like EUR/USD rally is, in our
view, off the table. Back in 2017 it was the market pre-positioning for the ECB QE
tapering that was the key driver behind the EUR rally. As both EZ growth and inflation
outlooks are now meaningfully worse, any hint at ECB policy normalisation is unlikely.
EUR: The funding currency
• We remain unexcited about the EUR. The currency is no longer meaningfully cheap
vs. USD, growth remains sluggish and there are little prospects of ECB tightening.
• With EUR offering deeply negative implied yields, it should be used as the funding
currency of choice for investors searching for yield in the undervalued EM FX world.
• A 2017-like EUR/USD rally is off the table as EZ fundamentals are weak. We look
for a range bound EUR/USD (1.10-1.15) next year, with clear downside risks.
• We revise our EUR/USD forecast lower expecting (a) UR/USD to remain under
pressure in H1 2018 due to the mix of Italian politics and by Qthe still rising US
rates
• but start its recovery in 2H as US rates cycle peaks and the ECB delivers the first
depo rate hike (albeit this won’t be a start of a pronounced tightening cycle).
• We think the EUR/USD in 2019 will be predominantly about the dollar rather than
EUR, as the latter shouldn’t in our view offer a material catalyst for a meaningful
moves in either direction
•
•
•
Petr Krpata, CFA Chief EMEA FX and Rates Strategist
London +44 20 7767 6561

FX Outlook 2020 November 2019
17
Not only is the ECB stance and EUR valuation (see below) different now compared to
2017, but the EZ GDP growth differential vs the US was also more appealing for EUR in 2017.
As per Figure 25, it was marginally positive in 2017 while in 2020 it should stay negative
(albeit modestly less so than this year). This should also limit EUR/USD upside potential.
Fig 26 EUR exerting attractive funding characteristics… Fig 27 …being no longer positively correlated with risk
-3.0%
-2.0%
-1.0%
0.0%
1.0%
CHF EUR JPY SEK GBP AUD NZD CAD NOK
Implied yield on G10 FX crosses vs USD derived form 12-month FX
forwards
-0.5
-0.3
-0.1
0.1
0.3
0.5
0.7
0.9
2008 2010 2012 2014 2016 2018
EUR/USD EUR trade weighted
90-day correlation of EUR/USD and trade weighted euro with MSCI World
equity index
Source: ING, Bloomberg Source: ING, Bloomberg
Appealing characteristics of a funding currency
With EUR offering the second lowest/most negative implied yield in the G10 FX space
(Figure 26) and little prospect for a credible turnaround, EUR should become a funding
currency of choice. On a risk-adjusted basis, EUR funding characteristics look more
appealing vs its peers as it does not exert the same safe-haven properties as USD or JPY.
This means that during the period of risk-off moves, EUR is unlikely to appreciate as much
as the dollar or the yen, in turn reducing the possible loss/probability of a stop loss being
hit on long EM FX positions/high beta FX positions when funded in EUR. In fact, we have
already seen the first signs of EUR attaining funding currency characteristics as EUR/USD
and trade weighted euro correlations with risk turned negative in recent months (Figure
27). This means that EUR no longer benefits much during risk-on days.
Fig 28 EUR/USD is no longer cheap (compared to 2015-17) Fig 29 EUR/USD fair value deteriorated
0.80
1.00
1.20
1.40
1.60
-20%
-10%
0%
10%
20%
1999 2002 2005 2008 2011 2014 2017
Real EUR/USD deviation away from the BEER fair value
+ / - 1.5 standard deviation
EUR/USD spot, rhs
Cheap
Expensive
At 1.10, the EUR/USD is no
longer stretched today...
... compared to the
2015-2017 period
-10%
-8%
-6%
-4%
-2%
0%
2%
4%
Terms of
Trade
Gov.
consum.
Current
Account
Product
ivity
Change in
fair value
Contribution of various factors to the evolution of EUR/USD BEER fair
value since Q1 2017
Source: ING Source: ING
EUR is no longer cheap as its fair value declined
Importantly, as Figure 28 shows EUR/USD no longer
screens as undervalued based on our medium-term BEER
valuation framework. This is a meaningful change from
the period of 2015-17 when at that time EUR/USD around
1.10 screened as heavily cheap. What has changed is the EUR/USD fair value, which has
deteriorated by around 7% since 2017 largely due to the terms of trade dynamics
(Figure 29). The lack of undervaluation also limits the scope for any meaningful EUR/USD
upside (such as the one observed in 2017).
“EUR/USD no longer screens as
undervalued”
FX Outlook 2020 November 2019
18
German stimulus the key hope for the euro – but unlikely
The greatest EUR hopes lie with possible German fiscal stimulus. In an environment in which
the ECB’s monetary policy stance is perceived as largely exhausted, large and credible
enough fiscal stimulus that would improve EZ growth and the inflation outlook would be a
game changer for EUR as it would unleash the euro reflation trade and lead to higher
EUR/USD (with the market upgrading the EZ growth outlook and expecting ECB policy
normalisation). As discussed in detail on the next page, we see odds of fiscal stimulus as
rather low, meaning EUR should remain in the low growth, low yielding currency bucket.
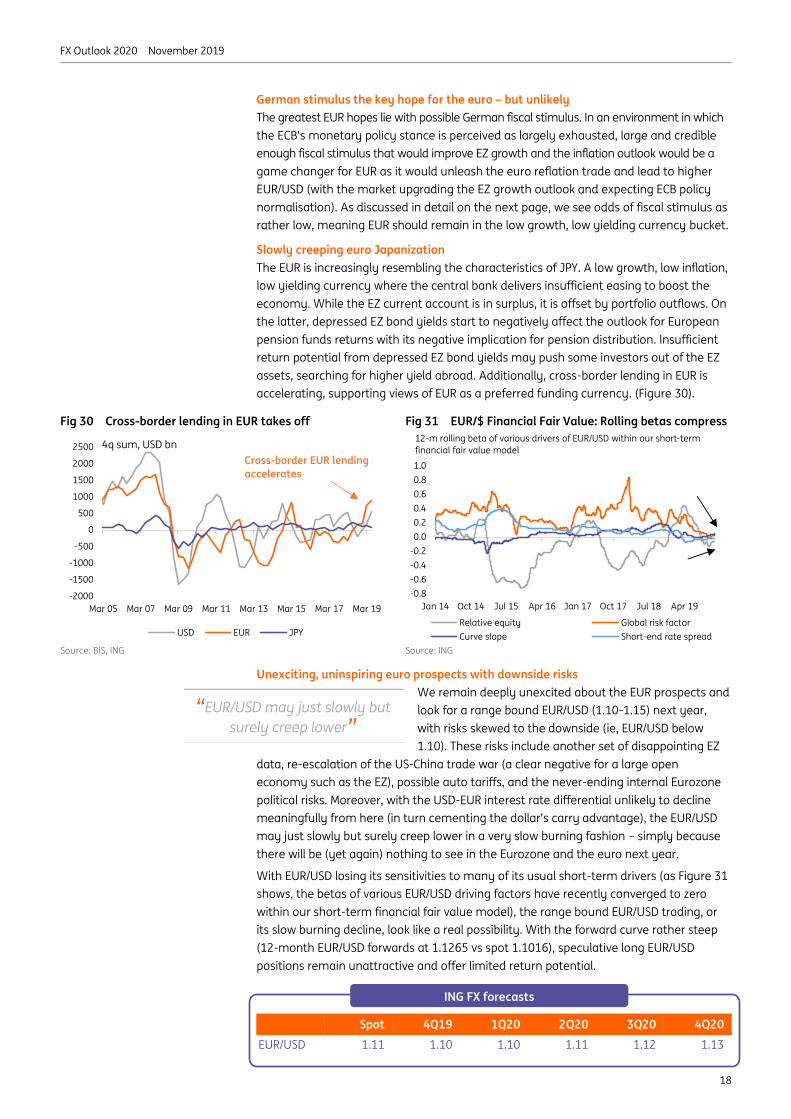
Slowly creeping euro Japanization
The EUR is increasingly resembling the characteristics of JPY. A low growth, low inflation,
low yielding currency where the central bank delivers insufficient easing to boost the
economy. While the EZ current account is in surplus, it is offset by portfolio outflows. On
the latter, depressed EZ bond yields start to negatively affect the outlook for European
pension funds returns with its negative implication for pension distribution. Insufficient
return potential from depressed EZ bond yields may push some investors out of the EZ
assets, searching for higher yield abroad. Additionally, cross-border lending in EUR is
accelerating, supporting views of EUR as a preferred funding currency. (Figure 30).
Fig 30 Cross-border lending in EUR takes off Fig 31 EUR/$ Financial Fair Value: Rolling betas compress
-2000
-1500
-1000
-500
0
500
1000
1500
2000
2500
Mar 05 Mar 07 Mar 09 Mar 11 Mar 13 Mar 15 Mar 17 Mar 19
USD EUR JPY
4q sum, USD bn
Cross-border EUR lending
accelerates
-0.8
-0.6
-0.4
-0.2
0.0
0.2
0.4
0.6
0.8
1.0
Jan 14 Oct 14 Jul 15 Apr 16 Jan 17 Oct 17 Jul 18 Apr 19
Relative equity Global risk factor
Curve slope Short-end rate spread
12-m rolling beta of various drivers of EUR/USD within our short-term
financial fair value model
Source: BIS, ING Source: ING
Unexciting, uninspiring euro prospects with downside risks
We remain deeply unexcited about the EUR prospects and
look for a range bound EUR/USD (1.10-1.15) next year,
with risks skewed to the downside (ie, EUR/USD below
1.10). These risks include another set of disappointing EZ
data, re-escalation of the US-China trade war (a clear negative for a large open
economy such as the EZ), possible auto tariffs, and the never-ending internal Eurozone
political risks. Moreover, with the USD-EUR interest rate differential unlikely to decline
meaningfully from here (in turn cementing the dollar’s carry advantage), the EUR/USD
may just slowly but surely creep lower in a very slow burning fashion – simply because
there will be (yet again) nothing to see in the Eurozone and the euro next year.
With EUR/USD losing its sensitivities to many of its usual short-term drivers (as Figure 31
shows, the betas of various EUR/USD driving factors have recently converged to zero
within our short-term financial fair value model), the range bound EUR/USD trading, or
its slow burning decline, look like a real possibility. With the forward curve rather steep
(12-month EUR/USD forwards at 1.1265 vs spot 1.1016), speculative long EUR/USD
positions remain unattractive and offer limited return potential.
Spot 4Q19 1Q20 2Q20 3Q20 4Q20
EUR/USD 1.11 1.10 1.10 1.11 1.12 1.13
“EUR/USD may just slowly but
surely creep lower”
ING FX forecasts

FX Outlook 2020 November 2019
19
Eurozone: Let’s get fiscal!
The Eurozone ends 2019 with a lot of uncertainty about the economy. Sluggish growth
has persisted over the course of the year as the industrial recession has dragged on.
Even though there are early signs of optimism, concerns about anti-cyclical measures in
a downturn are prominent as the ECB has a relatively empty toolbox and what is left is
worn out. Because of this, and the weak longer-term growth outlook, a key question for
2020 is whether governments are going to step in and invest. With interest rates
negative for the entire curve for the strongest Eurozone countries and even Greece
borrowing at negative rates on the short end of the curve, the time seems right.
Some spending is set to happen next year but the overall fiscal push will be modest. The
most relevant fiscal easing is expected in the Netherlands and Germany with a neutral
stance in France and Spain (Figure 32). Italy is expected to implement very mild
expansionary fiscal policy, as a more conservative budget has been constructed under the
new government.
The medium-term budgetary objective (MTO) is the structural fiscal balance required to
manage debt sustainability in the long run. The difference between current balance and
MTO provides a proxy for the fiscal space that countries have. In 2020, few countries
have extra room to spend (Figure 33). Germany stands out with about 1% of GDP that its
government could use to lower its structural surplus and remain compliant with
Commission rules.
Fig 32 Countries with fiscal space are set to spend
modestly in 2020… (% of GDP)
Fig 33 …but Germany in particular still has a lot of room
for spending left (% of GDP)
-1.5
-1.0
-0.5
0.0
0.5
1.0
-3.0
-2.5
-2.0
-1.5
-1.0
-0.5
0.0
0.5
1.0
1.5
2.0
Source: European Commission, ING Research Source: European Commission, ING Research
Another important question is why extra spending in the Eurozone should happen in the
first place. With economies still growing and labour markets showing only tentative
signs of a weakening, there is little reason to agree on large scale short-term stimulus as
in 2008/9. Any kind of ‘emergency’ fiscal stimulus would probably only be triggered by a
significant weakening of the labour market.
However, the need for investment to increase the longer-term growth potential of the
Eurozone is high given the low potential growth rate and transitions the constituent
economies are going through. Eurozone potential growth could benefit from investment
in (digital) infrastructure, education or energy transition.
In this regard, there is some momentum for investment, both at a European and
national level. The German government just agreed on a €50bn package over the next
few years to tackle climate change, the Dutch government is contemplating a national
investment fund and the new European Commission has not only put the Green New
Deal at the top of the political agenda but has also floated the idea of a European
Sovereign Wealth fund to stimulate global competitiveness for European businesses.
In sum, the big fiscal push that some hope for is probably still more a dream than reality
for 2020. However, governments are gradually willing to step up investment efforts, just
not as quickly or by as much as many financial market participants would like.
Special Focus
Bert Colijn Senior Economist, Eurozone
Amsterdam +31 20 563 4926
Carsten Brzeski Chief Economist, Germany, Austria
Frankfurt +49 69 27 222 64455

FX Outlook 2020 November 2019
20
It has been another relatively quiet year for USD/JPY. One year realised volatility has
dropped back to 6% annualised, while implied volatility is 7% – both very low by the
standards of USD/JPY. Instead of a pick-up in volatility as liquidity became more scarce,
early easing by both the Fed and the ECB has ensured that liquidity is ample.
USD/JPY also retains a strong correlation with equity markets, meaning that this year’s
sea of green in world equity indices has provided little sustained demand for the JPY.
Yes, the occasional Trump tweet and equity drawdown has briefly lifted the JPY – but
these moves have proved the exception.
Of course the equity cycle may well change into 2020 – especially were the US economy
to slow more than expected and open the door for some left-wing Democrats into the
November election – but that scenario is currently parked under ‘alternative’ for now.
More likely, our macro team thinks, is a scenario in which the Fed considers cutting rates
again in 1Q20 – the low point in the US 2020 GDP cycle – before US Treasury yields work
their way back towards 2.00% by the end of 2020. Given that the JPY’s correlation with
US 10-year yields seems only to be strengthening, that scenario could pressure USD/JPY
again in the early part of 2020.
Fig 34 USD/JPY retains tightest correlation with US
10-year yields
Fig 35 ING’s forecast for US 10-year yields vs forwards
-0.6
-0.4
-0.2
0.0
0.2
0.4
0.6
0.8
1.0
JPY CHF EUR SEK NZD GBP NOK AUD CAD
30 day 90 day 180 day
Daily correlation, via USD, with
1.0
1.5
2.0
2.5
3.0
3.5
Dec-17 Dec-18 Dec-19 Dec-20
10Y US Treasury Forwards ING Forecast
% Standard deviation
based on implied
volatility
Source: ING. Correlation with daily changes Source: ING Rates Strategy Team
Our over-riding feeling on USD/JPY, however, is one of continued tight trading ranges
and probably very good demand from Japanese investors for FX when USD/JPY trades
under 105. The narrative for 2020 should be one of Japanese investors crowded out of
domestic bond markets by continued BoJ buying of JGBs and looking for returns in
foreign markets.
JPY: Crowded out
• We look for another year of relatively tight ranges in USD/JPY as Japanese
investors continue to go offshore in search of returns. 105-110 may be the range.
• Despite late cycle fears, the resumption in money printing from the Fed and the
ECB suggests volatility levels remain low and the JPY is soft on the crosses.
• In a low yield world, US rates need to fall a lot further for Japanese investors to
reconsider hedging US assets. The current 3m hedging cost of 2.3% pa is too high.
Chris Turner Global Head of Strategy
London +44 20 7767 1610
FX Outlook 2020 November 2019
21
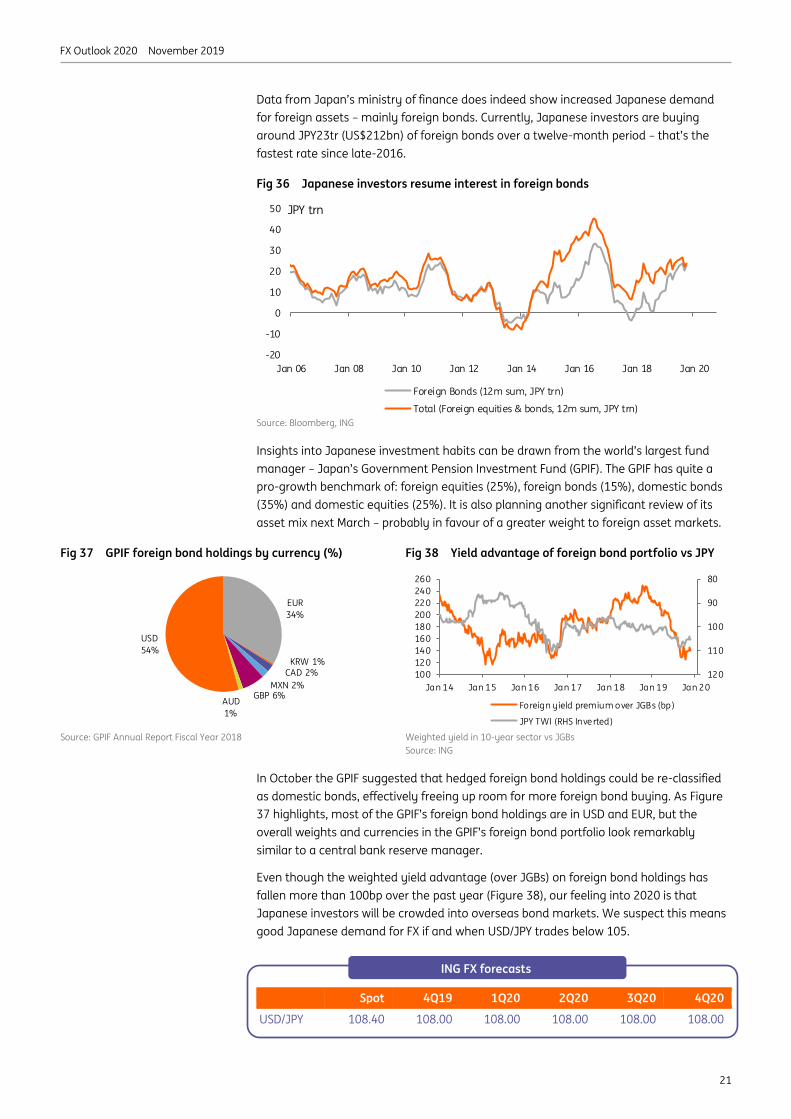
Data from Japan’s ministry of finance does indeed show increased Japanese demand
for foreign assets – mainly foreign bonds. Currently, Japanese investors are buying
around JPY23tr (US$212bn) of foreign bonds over a twelve-month period – that’s the
fastest rate since late-2016.
Fig 36 Japanese investors resume interest in foreign bonds
-20
-10
0
10
20
30
40
50
Jan 06 Jan 08 Jan 10 Jan 12 Jan 14 Jan 16 Jan 18 Jan 20
Foreign Bonds (12m sum, JPY trn)
Total (Foreign equities & bonds, 12m sum, JPY trn)
JPY trn
Source: Bloomberg, ING
Insights into Japanese investment habits can be drawn from the world’s largest fund
manager – Japan’s Government Pension Investment Fund (GPIF). The GPIF has quite a
pro-growth benchmark of: foreign equities (25%), foreign bonds (15%), domestic bonds
(35%) and domestic equities (25%). It is also planning another significant review of its
asset mix next March – probably in favour of a greater weight to foreign asset markets.
Fig 37 GPIF foreign bond holdings by currency (%) Fig 38 Yield advantage of foreign bond portfolio vs JPY
EUR
34%
KRW 1%CAD 2%
MXN 2%GBP 6%
AUD
1%
USD
54%
80
90
100
110
120100
120
140
160
180
200
220
240
260
Jan 14 Jan 15 Jan 16 Jan 17 Jan 18 Jan 19 Jan 20
Foreign yield premium over JGBs (bp)
JPY TWI (RHS Inverted)
Source: GPIF Annual Report Fiscal Year 2018 Weighted yield in 10-year sector vs JGBs
Source: ING
In October the GPIF suggested that hedged foreign bond holdings could be re-classified
as domestic bonds, effectively freeing up room for more foreign bond buying. As Figure
37 highlights, most of the GPIF’s foreign bond holdings are in USD and EUR, but the
overall weights and currencies in the GPIF’s foreign bond portfolio look remarkably
similar to a central bank reserve manager.
Even though the weighted yield advantage (over JGBs) on foreign bond holdings has
fallen more than 100bp over the past year (Figure 38), our feeling into 2020 is that
Japanese investors will be crowded into overseas bond markets. We suspect this means
good Japanese demand for FX if and when USD/JPY trades below 105.
Spot 4Q19 1Q20 2Q20 3Q20 4Q20
USD/JPY 108.40 108.00 108.00 108.00 108.00 108.00
ING FX forecasts ING FX forecasts

FX Outlook 2020 November 2019
22
Current pre-election polls suggest GBP strength over the next 1-2 months
The GBP outlook for the coming 1-3 months primarily hinges on the outcome of the
12 December Parliamentary elections and its implications for the Brexit path. As current
polls are predicting a non-negligible lead of the Conservative Party (and it achieving a
Parliamentary majority) such an outcome should be beneficial for sterling as it would
sharply increase the odds of the Withdrawal Agreement being ratified in Parliament and
thus reduce the Brexit uncertainty. We expect EUR/GBP to reach 0.83 (and GBP/USD to
1.33) over the next two months.
Transition period uncertainty taming GBP upside in 2Q20…
Yet, the Withdrawal Agreement being passed in Parliament and the UK leaving the EU
early next year (by January – albeit still within the transition period parameters) do not
mean GBP firing on all cylinder and a pronounced GBP rally.
First, the market is already partly expecting a GBP positive outcome (as Figure 39 shows,
GBP trades with a modest premium vs EUR based on our short-term financial fair value
model). So while positive, more Brexit clarity should lead to a less pronounced GBP rally
compared to the one observed this October when GBP corrected from stretched (Figure
39) and oversold (Figure 40) levels. As for the speculative positioning, it is now also less
stretched than it was prior to the October GBP rally (Figure 40 again).
Fig 39 GBP currently trades with a modest short-term
premium
Fig 40 Speculative GBP shorts corrected since October
-5%
-3%
-1%
1%
3%
5%
Jan 18 May 18 Sep 18 Jan 19 May 19 Sep 19
+/- 1.5 standard deviation GBP risk premium
The estimate of the EUR/GBP risk premium. Residual between EUR/GBP
short-term financial fair value and the spot.
GBP showing modest
premium vs EUR
-60%
-40%
-20%
0%
20%
40%
60%
Jan-15 Sep-15 May-16 Jan-17 Sep-17 May-18 Jan-19 Sep-19
Long positioning Short positioning Net positioning
GBP/USD speculative positioning, as % of open interest (as of 19th November
2019)
Source: ING Source: ING, CFTC
GBP: Light at the end of the tunnel
• With the Conservative Party leading the polls, GBP is likely to gain over the 1-2
months as we get more clarity on the Brexit path. EUR/GBP to reach 0.83.
• Even if the Withdrawal Agreement is passed by next January, this isn’t the end of
Brexit saga. Uncertainty about extension of the transition period will weigh on GBP
in 2Q20.
• If the transition period is extended, GBP should do well in 2H20 but sluggish
growth and no longer cheap valuation will tame its upside.
Petr Krpata, CFA Chief EMEA FX and Rates Strategist
London +44 20 7767 6561

FX Outlook 2020 November 2019
23
Second, once the UK withdraws from the EU, the hard work of negotiating trade deals
with its international partners begins (including the EU). With the current transition
period set to expire by the end of 2020, this means less than a year (assuming the UK
leaves by end-January 2020) for the UK to conclude the new (and necessary) trade
deals. We see it as highly unlikely for the UK to conclude such complex deals within such
a relatively short period of time. Hence, the extension of the transition period beyond
2020 (likely to 2022 as a starting point) will be necessary, in our view. If the transition
period is not extended and the new trade deals are not in place, this would be equivalent
to a hard Brexit (by end-2020).
…as extension will be necessary but the path towards it won’t be straightforward
The question of the extension and the associated conditions
(as the extension won’t come for free) will, in our view, tame
GBP upside during a significant part of the second quarter of
2020 (and possibly third quarter if the negotiations about the
extension drag on). We expect the EU to be open to prolonging the transition period, but
in return it will likely require the UK to contribute to the EU budget (as enjoying the
access to the EU single market for little longer would not come for free). The EU budget
payments are likely to be fairly unpopular and a contentious issue in the UK Parliament,
very likely to be opposed by the pro-Brexit/anti-EU wing of the Conservative Party.
Some degree of uncertainty about the transition period extension therefore should, in
our view, lead to some reversal of GBP post-election gains. We also note that a thin
Conservative Party majority is likely to lead to a larger reversal of GBP gains in 2Q20
than would be the case under a large Conservative majority outcome as it would
increase the risk of the transition period being not (easily) extended - as hard-line pro-
Brexit MPs (mainly from the ERG) – would have issues with EU budget payments.
While all the above is heavily scenario-conditional and still some time away (we need to
see the election outcome first) the issue of extending the transition period is, in our view,
another risk event for GBP and should therefore tame the potential optimism in the case
of the Parliament successfully ratifying the Withdrawal Agreement and the UK leaving
the EU. That’s why we kink EUR/GBP and GBP/USD profiles, pencilling initial GBP strength
(next 1-3 months) and some reversal in 2Q20.
Fig 41 The partial BoE cut may be priced out of the curve Fig 42 Uninspiring UK growth, not far away from 1%
0.5
0.6
0.7
0.8
Policy Rate 1M 3M 6M 1Y 2Y 3Y
Market implied policy curve for the BoE policy rate
0.0%
0.5%
1.0%
1.5%
2.0%
2019 2020 2021
%, UK GDP growth, ING forecast
Source: ING, Bloomberg Source: ING
2H20 outlook: Less uncertainty but also less mispriced sterling
Assuming the UK will avoid a hard Brexit and achieves the extension of the transition
period by June 2020 (in our view, the EU will want to know by this deadline whether the
UK contribute to the budget in order to be able to plan for the new EU budget) or a little
later, we expect sterling to settle at stronger (yet not too strong) levels later in 2020.
EUR/GBP to reach around 0.82 level and GBP/USD around 1.38 by end 2020.
On the positive side, both the passage of the Withdrawal Agreement and the transition
period extension will take away some degree of Brexit uncertainty. With the transition
“The question of a transition period
will tame GBP upside in mid-2020”

FX Outlook 2020 November 2019
24
period extended to 2022, this can give some breathing room to the economy and should
cause the market to price out the currently pencilled in partial BoE cut (Figure 41 - and
even potentially price in a partial hike) if the new government runs loose fiscal policy.
No spectacular economic growth…
On the less positive side, two factors should prevent a meaningful GBP rally. First, the
economic growth will remain subdued in 2020. Our economists pencil in growth around
1.2% next year (Figure 42), due in part to the constrained investment as 2020 will still
feature plenty of uncertainties (such as the issue of extending the transition period). This
should restrict the BoE from delivering actual hikes next year.
Fig 43 GBP no longer undervalued vs EUR Fig 44 Current account dynamics behind GBP fair value fall
-25%
-15%
-5%
5%
15%
25%
1999 2001 2003 2005 2007 2009 2011 2013 2015 2017
Real EUR/GBP deviation away from the BEER fair value
+ / - 1.5 standard deviation
0%
1%
2%
3%
4%
5%
6%
7%
8%
9%
Productivity Current account Government
consumption
Change in fair
value
Contribution of underlying variables to the change in the EUR/GBP BEER fair
value since 2017. Measured in relative terms: EZ vs UK.
Source: ING Source: ING
…and no spectacular GBP valuation
Second, compared to conventional wisdom, we don’t see GBP as materially undervalued
based on our medium-term BEER valuation framework (Figure 43). Not only has GBP
rallied recently but also its fair value has declined over recent quarters. The latter should
not come as a surprise as Brexit uncertainty has weighed heavily on the UK economy
(translating into sub-optimal growth) and translated into a deterioration of GBP fair
value vs EUR of 8-9% since 2017. As Figure 44 shows, this was primarily driven by the
worsening relative current account position of the UK. Sterling's fair value decline
against the US dollar has been even larger than was the case against the euro as this
has been further exaggerated by the drop in EUR/USD fair value.
EUR/GBP at 0.82 would actually bring the cross into modestly undervalued territory (ie,
modestly expensive GBP). The lack of a meaningful medium-term undervaluation should
limit the scale of GBP upside (compared to early October, when EUR/GBP at 0.93
screened almost 10% overvalued and thus had plenty of potential for a sharp decline).
Better year for sterling ahead, but it won’t be (yet again) a smooth ride
In short, given our assumptions (Conservative Party election victory, Withdrawal
Agreement passed by January 2020, transition period extended), next year should
deliver stronger sterling vs 2019. Yet, it won’t be a smooth ride, bumps in the form of
question marks about the transition period are ahead and GBP is not as cheap as it was
earlier in the year. This suggests contained GBP upside vs EUR, but upside nonetheless.
Against USD, sterling should record more gains due, in part, to our modestly higher
EUR/USD in 2H20 (at 1.13). This means that GBP should be one the best performing European
currencies next year and the best performing low yielder in the G10 FX space in 2020.
Spot 4Q19 1Q20 2Q20 3Q20 4Q20
EUR/GBP 0.86 0.83 0.83 0.85 0.85 0.82
GBP/USD 1.29 1.33 1.33 1.31 1.32 1.38
ING FX forecasts ING FX forecasts

FX Outlook 2020 November 2019
25
The key driver of the yuan remains the uncertainty of the trade war
Year to date 2019, the yuan has weakened 2.4% against the dollar. The USD/CNY has
ranged between 6.6691 and 7.1847, which is a 7.73% difference.
Not only is this range quite large, the change in trend direction has become increasingly
frequent as we approach the final stages in the discussions over the so-called “Phase 1
deal” between China and the US.
Earlier in the year there was optimism in the market that a Phase 1 deal would be
reached, however limited in scope. This positive view pushed the yuan to below 7.0 per
dollar. But this optimism has not lasted in light of the almost daily news describing how
difficult it is for the two sides to reach common ground in these negotiations.
China has requested a rolling back of US tariffs. In early November, it was reported that
China wanted the US to lift the tariffs imposed in September, and to offer assurances
that it would not implement the remaining tariffs planned for December.
The latest version of China’s demands reported in mid-November appears even more
forthright. China apparently is asking for a rollback of tariffs to the situation as it stood in
May. One can imagine that this would create tremendous hurdles in the US from a
political standpoint.
We have not jumped on the optimistic bandwagon, as we believe that even if there were
to be a Phase 1 deal, it may not have much substance, may not include any tariff
rollbacks, but could include clauses to defer the December tariffs.
Based on this view, our USD/CNY forecast for the end of 2019 is 7.00.
We could be wrong. And there could be a meaningful Phase 1 deal, with some rollback
of tariffs signed before year-end. But we assign a small probability to this event.
There will be many similar drivers of the yuan in 2020 compared to 2019
We expect the yuan to continue to be trade-talk-driven in 2020. In our 2020 outlook
report we discuss the risks and opportunities for the Chinese economy and point out
that the trade war is expected to continue into 2020.
It is inevitable that the yuan exchange rate will be very volatile. News on the trade talks,
including tariffs, tension related to technology companies and tension over international
political issues, will impact on any future trade agreements to varying degrees.
Iris Pang Economist, Greater China
Hong Kong +852 2848 8071
CNY: entering a volatile year
• USD/CNY movements will continue to depend on the progress of the trade
agreements, with very little clarity in a US election year.
• It is important to keep in mind that the yuan is not a market-based currency and
the PBOC will continue to exert control.
• Monetary policy will not be relevant for yuan movements.

FX Outlook 2020 November 2019
26
High CNY volatility will continue even if there is a Phase 1 deal because the market will
then start to question the likelihood of Phase 2 or 3 deals. The market is likely to remain
sceptical on progress of the trade talks after the US Presidential election. It seems likely
that trade tensions will persist even if there is a new US president, which is also uncertain.
Fig 45 Trade war timeline
EU and Canada retaliate to steel and aluminium tariffs targeting US$3.2bn (EU) and US$12.8bn (CAN) of imports from the US
China retaliates to steel and aluminium tariffs targeting US$2.8bn of imports from the US
China retaliates with tariffs on US$36bn of imports from the US
China retaliates with tariffs on US$16bn of imports from the US
India retaliates to steel and aluminium tariffs targeting US$500m of imports from the US (retaliation withdrawal preferential treatment)
US raises tariffs again on package of US$200bn list
US lifts steel and aluminiumtariffs on Mexico and Canada worthUS$15.3bn
China retaliates by raising tariffs again on US$36bn list
US raises tariffs on US$110bn
US imposes tariffs on US$8.5bn of solar panel imports and US$1.9bn of imports of washing machines
US imposes steel and aluminium tariffs on US$17.9bn of imports*
US imposes tariffs on US$34bn of imports from China and raises additional tariffs on US$22bn of steel and aluminium tariffs from EU Canada, and Mexico
US Imposes tariffs on US$16bn of imports from China
US imposes tariffs on US$200bn of imports from China
US$430bn
US$170bnUS$30bn
US$720bn
Trade affected in US$
China raises tariffs again on US$75bn of imports from the US, further retaliation may be coming
US raises tariffs again by US$160bn?
0100200300400500600700800900
Jan Feb Mar Apr May Jun Jul Aug Sep Oct Nov Dec Jan Feb Mar Apr May Jun Jul Aug Sep Oct Nov Dec
2018 2019China retaliates with tariffs on US$60bn of imports from China
Source: ING
Daily fixing will still be the determinant of the spot rate
The market generally assumes that all currencies are moved by more-or-less the same
set of factors. China is an outlier.
We have to keep in mind that the yuan is not a purely market-based currency. Reform
of the currency mechanism will be slow for the duration of the trade war in order to
avoid unnecessary uncertainty created by any new mechanism.
We expect the daily fixing to continue to be the main guide for USD/CNY. Though we saw
deviation of the spot rate from the daily fixings in August and September, the experiment
was short-lived. The yuan has returned to a time when fixing is in the driving seat.
Fig 46 PBOC’s USD/CNY fixing, bands and USD/CNY movement
6.5
6.6
6.7
6.8
6.9
7.0
7.1
7.2
7.3
Jan-19 Apr-19 Jul-19 Oct-19
USD/CNY CNY FIXING Upper bound Lower bound
Source: Bloomberg
There has been considerable speculation that any trade deal between the US and China
could include some form of currency manipulation clause. Exactly what this may look
FX Outlook 2020 November 2019
27
like is a subject for the negotiators. But there is a ready-made blue-print in the form of
Chapter 33 of the US Mexico Canada (USMCA) Free Trade deal2.
The main elements of such a clause concern the reporting of official interventions in FX
markets, including data on FX reserves and positions in forward markets.
The parties involved meet annually to discuss the arrangement and any alleged
infringements, and there is scope for parties that believe they have suffered a loss
according to the behaviour of the other signatories, to seek financial redress.
Something similar was also agreed in the revamped Free Trade deal with South Korea.
And it looks like it may become a “boilerplate” inclusion for any US trade deal.
We remain doubtful that China will want to sign up to a clause like this, which may
explain part of the hold up on a Phase 1 deal. China may argue that it already fulfils
these obligations by reporting to the IMF, and might refer to their IMF article IV
assessment which notes that “China’s disclosure of FX intervention data meets
international standards since joining IMF’s SDDS3.” Signing up to a bilateral deal on the
currency with the US might well be seen by China as an unacceptable loss of
sovereignty.
Portfolio flows
In 2019, one of the factors that has occasionally supported the yuan has been inflows
from portfolio investments.
MSCI increased the China A share inclusion factor to 20% in three steps in 2019, with
increments of 5 percent in May, August and November. It is reported that the November
increment will draw another US$35-40 billion of funds into the A-share market. FTSE also
has included A-shares into its index.
In April 2019, the Bloomberg Barclays Global Aggregate Index started the inclusion of
Chinese bonds. As of November data, foreign holdings of yuan bonds reached CNY2tr.
We should read these encouraging numbers with care. There could be outflows if there
are redemptions of investments from these indices when the market is rocky, which
could occur were the trade war to damage the Chinese economy further.
Monetary policy will not be relevant for yuan movements
Monetary policy seldom has a material impact on USD/CNY movements. Take
20 November as an example, where the PBoC cut both the 1Y and 5Y Medium-Lending
Facility interest rates by 5 basis points, but the yuan strengthened during China’s
trading hours from 7.0336 to 7.0309.
We have commented several times that the yuan does not move with interest rate
differentials because arbitraging activities on interest rates are difficult to operate in
China – since China’s capital account is only half open.
Spot 4Q19 1Q20 2Q20 3Q20 4Q20
USD/CNY 7.03 7.00 7.05 7.00 6.95 6.85
EUR/CNY 7.78 7.70 7.76 7.77 7.78 7.74
2 CHAPTER 33 MACROECONOMIC POLICIES AND EXCHANGE RATE MATTERS https://ustr.gov/sites/default/files/files/agreements/FTA/USMCA/Text/33_Macroeconomic_Policies_and_Exchange_Rate_Matters.pdf 3 Page 19 Section 27. https://www.imf.org/en/Publications/CR/Issues/2019/08/08/Peoples-Republic-of-China-2019-Article-IV-Consultation-Press-Release-Staff-Report-Staff-48576
ING FX forecasts
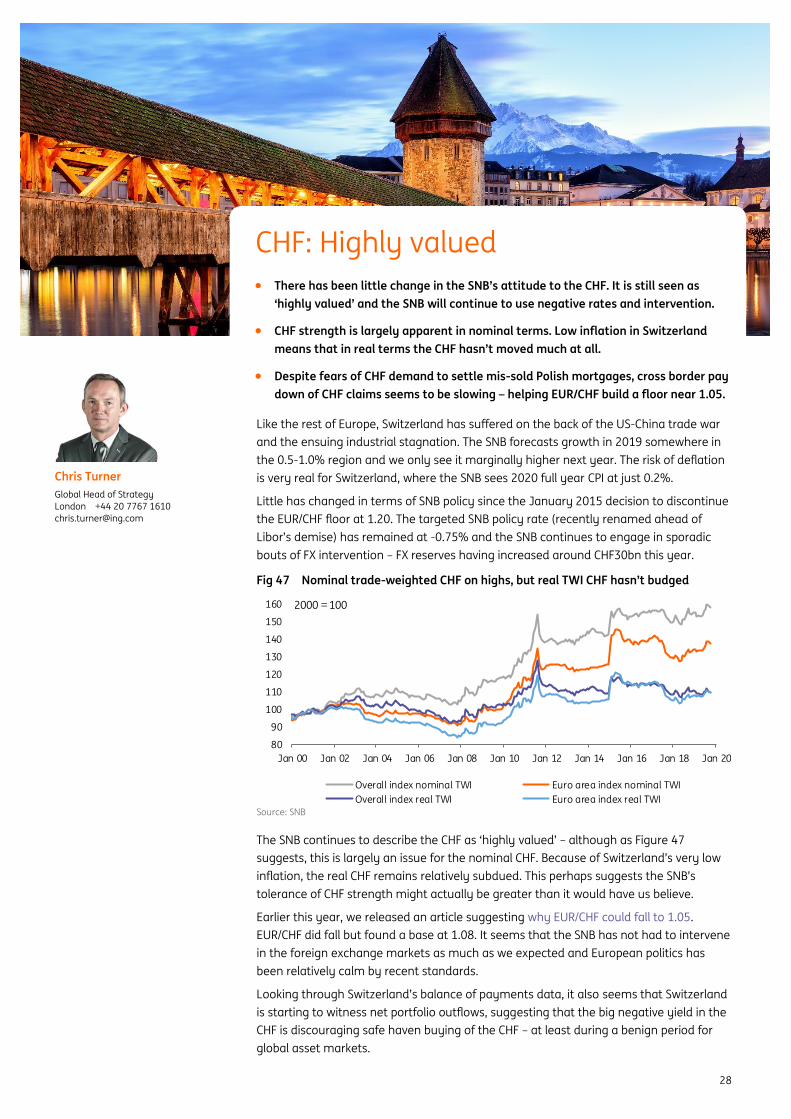
FX Outlook 2020 November 2019
28
Like the rest of Europe, Switzerland has suffered on the back of the US-China trade war
and the ensuing industrial stagnation. The SNB forecasts growth in 2019 somewhere in
the 0.5-1.0% region and we only see it marginally higher next year. The risk of deflation
is very real for Switzerland, where the SNB sees 2020 full year CPI at just 0.2%.
Little has changed in terms of SNB policy since the January 2015 decision to discontinue
the EUR/CHF floor at 1.20. The targeted SNB policy rate (recently renamed ahead of
Libor’s demise) has remained at -0.75% and the SNB continues to engage in sporadic
bouts of FX intervention – FX reserves having increased around CHF30bn this year.
Fig 47 Nominal trade-weighted CHF on highs, but real TWI CHF hasn’t budged
80
90
100
110
120
130
140
150
160
Jan 00 Jan 02 Jan 04 Jan 06 Jan 08 Jan 10 Jan 12 Jan 14 Jan 16 Jan 18 Jan 20
Overall index nominal TWI Euro area index nominal TWI
Overall index real TWI Euro area index real TWI
2000 = 100
Source: SNB
The SNB continues to describe the CHF as ‘highly valued’ – although as Figure 47
suggests, this is largely an issue for the nominal CHF. Because of Switzerland’s very low
inflation, the real CHF remains relatively subdued. This perhaps suggests the SNB’s
tolerance of CHF strength might actually be greater than it would have us believe.
Earlier this year, we released an article suggesting why EUR/CHF could fall to 1.05.
EUR/CHF did fall but found a base at 1.08. It seems that the SNB has not had to intervene
in the foreign exchange markets as much as we expected and European politics has
been relatively calm by recent standards.
Looking through Switzerland’s balance of payments data, it also seems that Switzerland
is starting to witness net portfolio outflows, suggesting that the big negative yield in the
CHF is discouraging safe haven buying of the CHF – at least during a benign period for
global asset markets.
Chris Turner
Global Head of Strategy
London +44 20 7767 1610
CHF: Highly valued
• There has been little change in the SNB’s attitude to the CHF. It is still seen as
‘highly valued’ and the SNB will continue to use negative rates and intervention.
• CHF strength is largely apparent in nominal terms. Low inflation in Switzerland
means that in real terms the CHF hasn’t moved much at all.
• Despite fears of CHF demand to settle mis-sold Polish mortgages, cross border pay
down of CHF claims seems to be slowing – helping EUR/CHF build a floor near 1.05.

FX Outlook 2020 November 2019
29
Is the SNB facing any constraints to its negative interest rate policy? So far, the SNB
seems happy to see off criticism from the banks and the pension fund industry over
negative rates. Economic growth (and portfolio returns) would be much worse, the SNB
argues, were the SNB to pull back from negative rates. In fact, in September the SNB
altered the mechanism for the charges applied to CHF sight deposits, suggesting it was
looking to protect local financial institutions if rates were to be taken any more negative.
Fig 48 12m change in cross border claims in CHF (US$bn) versus EUR/CHF
0.80
1.00
1.20
1.40
1.60
1.80
-150
-100
-50
0
50
100
Mar 01 Mar 06 Mar 11 Mar 16
Changes in cross border CHF claims (12m sum, USD bn) EUR/CHF (RHS)
Source: BIS, ING
In addition to the CHF safe haven and negative rates story, we also think cross border
CHF borrowing dynamics play a role in CHF pricing. As Figure 48 shows, cross border
lending in CHF was very popular ahead of the global financial crisis and its unwinding
(pay-down of CHF lending) was a key driver of the subsequent EUR/CHF decline.
Appetite to borrow in CHF has been very weak since the global financial crisis, although
the first two quarters of 2019 saw the first consecutive period of rising CHF borrowing
since 2014. This comes at a time when cross-border EUR borrowing is popular as well.
This suggests that the SNB might have a better chance of holding EUR/CHF at 1.05.
On the subject of CHF loans, we also need to say a word about the Polish FX mortgage
story. Our Polish economists have covered the issue in detail here. Earlier this year there
had been fears that a ruling by the European Court of Justice (ECJ) could mean that
Polish banks might jump to hedge some of their PLN130bn in FX (largely CHF) mortgage
exposure – were the ECJ to deem clear mis-selling and somehow force the banks to take
back the mortgages at the original CHF/PLN rate.
The subsequent ruling from the ECJ was not the worst outcome for the Polish banks and
our team believe that given the case-by-case nature of this story, there will be no
wholesale buying of CHF as Polish banks seek pre-emptive hedges of what could become
their own, rather than their customers’, short CHF positions.
Elsewhere, the CHF remains overvalued on most
valuation metrics – but it has for a long time.
Unless we see some surprising recovery in trade
and in Europe growth – such that the ECB can
stop printing money – it may well be that
EUR/CHF traces out something like a 1.08-1.12 range for much of 2020.
Spot 4Q19 1Q20 2Q20 3Q20 4Q20
EUR/CHF 1.10 1.10 1.10 1.10 1.12 1.15
“It may well be that EUR/CHF traces out
something like a 1.08-1.12 range for
much of 2020”
ING FX forecasts

FX Outlook 2020 November 2019
30
2020 commodities outlook
2019 has been ‘a year of two tales’ for the commodities complex. The trade talk
optimism has provided some support to the overall market during 1H, while there
has been reduced volatility in 2H and markets remained weighed down by
slowing global activity. Uncertainty around trade talks and global growth are
likely to remain key drivers for the commodities complex over 2020.
Crude oil – OPEC+ action needed
The oil market is set to return to surplus over the first half of 2020, and so expectations
are that prices will weaken over 1H20. We are currently forecasting that ICE Brent will
average US$59/bbl over the first part of the year, whilst averaging US$62/bbl for the
year as a whole. However, this is assuming that we see OPEC+ not only extend the
current output cut deal beyond March 2020, but that it also makes deeper cuts at least
over 1Q20. The magnitude of additional cuts needed to keep the market in balance is up
to 1MMbbls/d, we believe. The issue with deeper cuts though, is who is willing to cut even
more than they currently are. The only real option is that Saudi Arabia takes on more,
but it will clearly push other nations to fully comply with the current deal before doing
so. OPEC+ will be meeting in Vienna on 6 December, where we will likely get more clarity
on what the strategy is for 2020.
For 2019, a key price driver has been the demand story. Clearly oil demand growth over
2019 has disappointed, with estimates revised down from 1.4MMbbls/d at the start of
the year to just 900Mbbls/d currently. Trade war uncertainty and slowing economic
growth has certainly had an impact on oil demand, and whilst demand growth is
expected to pick up in 2020, this will depend on how quickly China and the US come to a
resolution in their ongoing trade war.
4Q19 1Q20 2Q20 3Q20 4Q20
ICE Brent (US$/bbl) 65 60 58 62 67
Copper – Trade concerns and macro still in focus
Copper prices have been weighed down heavily by concerns over the ongoing trade war
and slowing global manufacturing activities. A constructive mine supply side has
provided little support to the prices over the year. On the refined side, both refined
capacities and output are still growing out of China while demand growth has struggled
across major China and major European consumers.
Moving into 2020, copper mine supply growth is set to increase although the outlook still
looked vulnerable to potential disruptions. The benchmark TC/RC for 2020 came in at
US$62 per tonne/US¢6.2/lb compared to US$80.8/US¢8.08 in 2019, a level that is cutting
into some marginal smelters’ margins. Demand in China is hoping for some support
from stimulus measures from the infrastructure sector, but it is still too premature to be
sanguine on the global demand recovery until we see solid signs of stabilisation in global
activity as well as solid developments from China-US trade talks. We are currently
slightly bearish towards prices in 2020 and forecast LME 3M copper to average at
US$5,750/tonne as base case prices but the risks are largely dependent on macro
uncertainties.
4Q19 1Q20 2Q20 3Q20 4Q20
LME Cu (US$/t) 5,610 5,600 5,700 5,800 5,900
Special Feature
Warren Patterson Head of Commodities Strategy
Singapore +65 6232 6020
Wenyu Yao Senior Commodities Strategist
London 20 7767 6909
RUB CAD
NOK RUB
CLP PEN

FX Outlook 2020 November 2019
31
Iron ore – More supply to return
2019 has been a volatile year for the iron ore market. The unfortunate Vale dam
accident in Brazil raised concerns over supply tightness, with Vale forced to take around
90mtpa of capacity off the market. This pushed prices to as high as US$124/t. Although
this move was clearly exaggerated by speculative activity. However, as we have seen a
return of some capacity, along with a recovery in Chinese iron port stocks, prices have
come under pressure once again, with the market trading sub US$80/t recently. To add
to the bearish tone, steel mill margins have come under pressure, leading to some steel
producers cutting operating rates.
For 2020, we continue to hold a fairly bearish outlook for iron ore prices. We expect that
further Brazilian capacity will be brought back to the market over the course of the year,
whilst there is still plenty of uncertainty around the global economy, and so this is likely
to keep some pressure on steel mill margins. We currently forecast that iron ore prices
will average US$81/t over 2020. The risk to this view is that we do not see Vale capacity
continuing to return as quickly as anticipated, which could keep the seaborne market
tighter than expected.
4Q19 1Q20 2Q20 3Q20 4Q20
Iron ore (US$/t) 95 85 85 80 75
Coal – Weakness to persist
Coal prices remain under pressure, with European prices down more than 35% since the
start of the year, leaving them to trade just above US$50/t. For Europe, the outlook for prices
remains weak. This is due to two factors. Firstly, EU carbon prices have been fairly strong.
Secondly, gas prices in Europe have been very weak, with a significant amount of LNG
making its way into the region, as LNG export projects ramp up. These two factors have
supported a coal to gas switch for power generation, which has weighed on coal demand.
4Q19 1Q20 2Q20 3Q20 4Q20
API2 Coal CIF ARA (US$/t) 60 60 58 60 70
Soybeans – Trade war dependent
Soybeans have been the poster child for the trade war between the US and China.
However more recently, as we have seen progress with phase one of the trade deal,
Chinese buyers have returned to the market for US soybeans, with the government
providing tariff free quotas. This has clearly been supportive for CBOT soybeans.
However, we will likely need to see tariffs fully removed rather than just quotas being
provided, in order to turn significantly more bullish on the market. On the supply side,
the US soybean crop is set to be significantly smaller this marketing year. Firstly, given
the ongoing trade war, farmers reduced 2019 soybean plantings. This lower acreage
combined with weaker yields means that US soybean production is expected to fall year
on year, and this smaller crop should help to lower elevated stock levels.
For 2020 US plantings, a lot will depend on how trade talks evolve over 1Q20. However,
right now, the soybean/corn price ratio suggests that farmers should plant more corn at
the expense of soybeans. Overall, we expect the CBOT soybean price to trend higher
moving into 2020, with prices averaging US$9.10/bu over the year, driven by falling global
ending stocks. A quick resolution to the trade war, however, could mean further upside.
While a trade deal would provide upside to CBOT soybeans, it would in fact be bearish for
Brazilian soybean cash values, with Chinese buyers likely to switch back to US soybeans.
4Q19 1Q20 2Q20 3Q20 4Q20
Soybean (US¢/bu) 870 890 920 910 900
BRL
INR CNY
BRL ZAR AUD
ZAR RUB
IDR COP AUD

FX Outlook 2020 November 2019
32
Gold – Safe haven appeal
The gold market has had a strong year, with prices up as much as 21% at one stage,
hitting a multi-year high of US$1,554/oz. This strength shouldn’t come as too much of a
surprise, given the growing uncertainty in the global economy, with slowing growth and
escalating trade tensions. These factors have increased the appeal for safe haven assets
such as gold. Furthermore, more dovish policy from central banks has also provided
support to gold.
Looking to 2020, we believe that prices will be dictated by the same themes as this year.
As a result of trade uncertainty and concerns over global growth we do see upside to
gold prices from current levels. While if the US Fed turns increasingly more dovish, this
only provides further upside. We currently forecast that gold prices will average around
US$1,475/oz over the course of 2020.
4Q19 1Q20 2Q20 3Q20 4Q20
Gold (US$/oz) 1,500 1,500 1,470 1,470 1,480
IDR
CNY CAD
ZAR RUB AUD
PEN

FX Outlook 2020 November 2019
33
We consider the $-bloc as a highly attractive pool of currencies for the coming year. The
main underlying assumption for this view is that no further deterioration in the US-China
trade spat will contribute to a further stabilisation in global risk sentiment that will
ultimately push investors towards high yielding and pro-cyclical currencies in an
attempt to secure attractive returns.
We expect carry trades to be the strategy of choice thanks to low expected volatility and
this should come particularly to the benefit of CAD that, as shown in Figure 9 currently
holds the most attractive risk-adjusted carry. The yield on AUD and NZD appears less
attractive after their respective central banks cut rates in 2019, but both currencies can
leverage on their very attractive undervaluation (as shown in Figure 14).
CAD: Carry to prevail over economic woes
A big chunk of CAD’s resilience to swings in risk sentiment this year is attributable to its
steadily supportive rate advantage, that remained intact as the Bank of Canada kept
rates unchanged against the global easing trends. However, things have changed in the
past couple of months. In its latest policy meeting (30 October 2019), the BoC stressed
the downside risks to the economic outlook and likely opened the door (implicitly) to
monetary easing. At this stage, we think the BoC will cut the rates by 25bp either at the
December meeting (currently only 8% priced in) or in early 2020 (45% priced in for
1Q20). We suspect this will be a one-off ‘insurance’ move, and we expect rates to stay at
1.50% at least through 4Q20. At the same time, we acknowledge a non-negligible risk
that the BoC may move twice even if external or internal conditions don’t materially
deteriorate.
One could conclude that this dovish shift by the
BoC would erode CAD’s rate advantage but, in
reality, it would hardly dent it. Using the ING-
forecast 3m yields for G10 currencies, it is
possible to see (Figure 49) how CAD would still be able to retain a significant carry
advantage in the case of a 25bp BoC cut (which is in our forecast). We acknowledge the
risk of two rate cuts but, also in that case (as shown by the dashed line in Figure 49),
CAD would remain the king in terms of carry advantage within the G10 space.
$-Bloc: Getting carried away • CAD: Even if the BoC delivers one insurance cut, CAD should be a G10 outperformer,
benefiting from superior risk adjusted carry and undemanding valuation.
• AUD: Better China-related sentiment should pair with the end of RBA easing to fuel
a realignment of the very cheap AUD with its medium-term fair value.
• NZD: Valuation, abating risk aversion, stable commodity outlook and the RBNZ’s
neutral stance all point to Kiwi outperformance next year (vs USD and AUD).
Francesco Pesole FX Strategist
London +44 20 7767 6405
“CAD will be able to retain a significant carry
advantage in the case of BoC easing”

FX Outlook 2020 November 2019
34
Fig 49 CAD carry to dominate in G10 even if BoC cuts Fig 50 Pipeline capacity still insufficient
-0.30
-0.20
-0.10
0.00
0.10
0.20
0.30
0.40
0.50
CAD USD NOK NZD AUD GBP SEK JPY EUR CHF
Current 2Q20 (ING F'cast) 4Q20 (ING F'cast)
Risk-adjusted carry - Implied yield (3m)/implied volatility (3m) [%]
Scenario with two BoC cuts
0
150
300
450
600
2010 2011 2012 2013 2014 2015 2016 2017 2018 2019
Enbridge Mainline Express
Trans Mountain Keystone
Rangeland/Milk River Enbridge Expansions
Implied Rail Oil Available for Export
1000's m3 /d
Source: Bloomberg, ING Source: Canada Energy Regulator
We expect such carry attractiveness to sustainably drive CAD strength throughout 2020:
such strength may be more visible versus the low yielders (in line with the carry-trade
logic) but will be evident in the form of an approximate 6% appreciation of the loonie
versus the USD: we see USD/CAD at 1.25 in 4Q20.
The downside risks to the CAD are, however, not absent. The most obvious risk is related
to a breakdown in trade negotiations between the US and China, along with the
implications for the outlook of the very open Canadian economy. Latest GDP reports
already highlighted a sustained downward trend in capital investments, in particular in
the energy sector, which accounts for around 11% of the nominal GDP. The oil industry
is facing a double trouble: low global oil prices and a shortage of pipeline capacity
(Figure 50) that has kept the Western Canada Select/WTI spread quite elevated. Neither
of these two issues are likely to see a resolution in 2020. Our commodities team is
expecting global crude oil prices to stay on the back foot at least through the first half of
2020 and see WTI averaging US$55/bbl in the year. The pipeline expansion projects will
not be completed by 2020, which should keep WCS prices fairly subdued.
Fig 51 Inflation at target limits need for BoC easing Fig 52 Rate differential points at more USD/CAD weakness
-1
0
1
2
3
4
0
1
2
3
4
5
Jul 13 Aug 14 Sep 15 Oct 16 Nov 17 Dec 18 Jan 20
BoC inflation target range Mid-point
CPI YoY Wage growth YoY
%ING
Forecast
-0.4
-0.2
0.0
0.2
0.4
0.6
0.8
1.0
1.2
1.20
1.23
1.26
1.29
1.32
1.35
1.38
Jan 17 Jun 17 Nov 17 Apr 18 Sep 18 Feb 19 Jul 19
USD/CAD US-Canada 2Y yield diff. (%, rhs)
Source: Bloomberg, ING Source: Bloomberg, ING
However, our economics team is expecting Canadian activity to hold up fairly well, with
growth hovering around 1.6% YoY in 2020 and inflation around target (2%). The long-
awaited ratification of the USMCA should also contribute to lift the economic outlook,
especially by supporting investments. In conclusion, the downside risks to the Canadian
economy are unlikely to materialise in 2020 and even when adding one or even two
cuts by the BoC, the rate advantage is likely to prevail in driving CAD higher next year.
Incidentally, it must be noted that the USD/CAD rate has still to fully realign to the
widening rate differential in favour of CAD (as shown in Figure 52).

FX Outlook 2020 November 2019
35
The risk of another downturn in oil prices in the first half of the year suggests that most
of the strength in the loonie will manifest in 2H20. Our end-2020 forecast for USD/CAD at
1.25 embeds not only the inflows to CAD thanks to the rate advantage but also some
weakness in US dollar. Although such a profile may suggest an interesting short
USD/CAD opportunity, we trust the most effective way to cash in on CAD’s strength in
2020 is by entering ‘pure’ carry trades, thereby buying CAD and shorting low-yielders. In
this sense, such as long CAD/SEK (in line with our weak SEK forecast). Also, long CAD/CHF
and CAD/EUR currently offer good value, given that the two positions combine a very
attractive carry return with a low implied volatility (CAD, CHF and EUR have the lowest
3m vols in G10).
AUD: Surfing the ‘gentle turn’
We expect the Aussie $ to follow the commodity bloc upward and to come out as an
outperformer in 2020. With a broadly supportive risk environment in the background,
the undervalued AUD can start to realign with its fair value, also aided by a ‘gentle turn’
(as RBA Governor Lowe likes to put it) in the economy and from the end of the RBA
easing cycle. We expect AUD/USD to reach 0.72 in 4Q20.
Indeed, the RBA has two very ambitious targets: inflation at 2.5% (target range mid-
point) and unemployment at 4.5%. The currently provided stimulus does not appear
sufficient to trigger such required adjustments in the two indicators. In turn, the RBA is
likely facing two options now: go ‘all in’ and deliver another significant amount of easing
(possibly entering QE) or extend the pause and welcome the improvement in price
dynamics. We think the second option is more likely.
Inflation (currently at 1.7%) has inched up in the past two quarters and, while it is
evident that there is still a gap to fill to reach the RBA target, we must consider that
inflation has consistently undershot the target band in the past five years (Figure 53). In
the 2016-18 period, inflation stayed slightly below the 2% target lower-bound and it was
enough to convince the RBA not to cut more: we expect a similar dynamic in 2020.
Fig 53 Inflation outlook suggests the RBA may be done Fig 54 RBA ‘medicine’ has helped a recovery in housing
-1.5
-1
-0.5
0
0.5
1
1.5
2
0.0
0.5
1.0
1.5
2.0
2.5
3.0
3.5
4.0
4.5
5.0
Jan 10 Jul 11 Jan 13 Jul 14 Jan 16 Jul 17 Jan 19 Jul 20
RBA inflation target range CPI YoY
ING forecasts RBA Cash Rate Target
Having inflation close to the 2%
target lower-bound was enough
to keep rates on hold in 2016-18
%
90
100
110
120
130
140
150
Apr 14 Jan 15 Oct 15 Jul 16 Apr 17 Jan 18 Oct 18 Jul 19
Sydney Melbourne Australia - Median
House price index, Apr 14=100
Start of RBA easing
Source: Bloomberg, ING Source: CoreLogic, ING
The latest data indicates a rebound in the national housing market (Figure 54), suggesting
that the RBA “medicine” (rate cuts) seems to have worked to avoid a property crash. This
is allowing the RBA and consumers to see the 2018-early 2019 drop as a physiological
correction rather than the inception of a crisis. Given the importance of real estate for
average household wealth in Australia, this should positively impact consumer spending:
a gauge that the RBA recently said will be monitored very closely.
These two positive developments should be able to offset the less optimistic dynamics in
the labour market (unemployment recently moved back up to 5.3%), and our base-case
is that the RBA will keep rates at 0.75% in 2020. However, we cannot ignore mounting

FX Outlook 2020 November 2019
36
market speculation with regards to another round of monetary easing next year. In this
sense, the main risk is that another cut could revamp expectations that the RBA will
embark in unconventional monetary tools (given that rates are already close to 0%).
Shape and impact of a possible RBA QE
In October, we looked into the possibility of the RBA embarking in quantitative
easing some time in 2020 and tried to forecast the consequent impact on AUD (see
full article here). In our view, three conditions need to be met to push the RBA to
embark in QE: Cash Rate at 0.25% (now at 0.75%), inflation at 1.5% (now at 1.7%)
and unemployment rate at 5.5% (now at 5.3%). We see this scenario as quite
unlikely, especially given the recent uptrend in inflation and the increasingly less
dovish RBA stance. However, should such conditions materialise and the RBA decide
to start QE, we suspect it would be quite limited in size. We think it would consist of
around AU$28bn of purchases per month, that in monetary basis terms equals to
around half of the size of the Fed’s 2009/10 QE. The lack of emergency in Australian
financial conditions (no slump in asset prices, fairly robust growth, no risk of
deflation) suggests that a larger programme would be unwarranted. We estimate
the impact of QE to be around -5% on AUD/USD.
Our BEER model estimates indicate that AUD is
the cheapest currency in the G10 space. Looking
at the historical mis-valuation (Figure 55),
AUD/USD is currently at the most undervalued
point (-12%) since the financial crisis. Among other factors, AUD fair value has remained
supported over the past few quarters thanks to some positive dynamics in the current
account and in the terms of trade (Figure 56). Looking at the next year, there do not
seem to be not enough reasons to expect these two factors to face substantial
headwinds. The two key risks derive from: (1) lingering trade tensions (that dries up
demand for Australian exports); (2) a drop in prices of the main Australian commodities.
Fig 55 AUD outlook helped by current undervaluation Fig 56 Terms of Trade and CA rose despite trade wars
-30%
-20%
-10%
0%
10%
20%
30%
2000 2002 2004 2006 2008 2010 2012 2014 2016 2018
Real AUD/USD deviation away from the BEER fair value
+ / - 1.5 standard deviation
Very expensive
Cheap
Expensive
Very cheap AUD currenlty around
12% undervalued vs USD
-8
-7
-6
-5
-4
-3
-2
-1
0
60
70
80
90
100
110
120
130
140
Jan 05 May 07 Sep 09 Jan 12 May 14 Sep 16 Jan 19
Terms of Trade Current Account (% GDP, rhs)
Source: ING Source: Bloomberg, Australian Bureau of Statistics
Looking at the first eventuality, the dynamics of the current account and the terms of
trade in 2019 (both ascending) indicate no spillover effect of the escalation of trade
tensions. A deeper look into the geographical decomposition of trade flows (Figure 57)
confirms this notion, as exports to China (that were expected to take the hardest hit)
increased in line with exports to the OECD countries.
“We expect the undervalued AUD to
converge to its medium-term fair value”

FX Outlook 2020 November 2019
37
Fig 57 Australian exports on the rise, even those to China
0
2000
4000
6000
8000
10000
12000
14000
16000
Jan 10 Dec 10 Nov 11 Oct 12 Sep 13 Aug 14 Jul 15 Jun 16 May 17 Apr 18 Mar 19
Mill
ion
s
China OECD Countries Japan
United Kingdom EU 28 United States
Australian exports by country of destination, AUD mln
US-China trade war starts
Source: Australian Bureau of Statistics, Macrobond, ING
The commodity picture for Australia is likely going to be a mixed one in 2020, and we
expect it to have a net neutral impact on AUD throughout next year. Iron ore prices are
expected to head down (we expect a 2020 average around US$80/t) as production in
Brazil is gradually restored, but should partly be compensated by supported gold prices
(third-largest Australian export), which we expect to average at US$1,475/oz in 2020.
The outlook for coal is also not looking very encouraging and we see prices hovering
around 60 US$/t during the first three quarters of 2020 before rebounding in 4Q (in line
with most commodities). However, Australia has recently become the largest LNG
producer in the world and seems well positioned ahead of the shift from coal to natural
gas in global demand: it seems reasonable to expect further investments in the booming
LNG industry in the country. Please refer to our commodities section for further detail.
NZD: No longer the black sheep of G10
The Kiwi dollar has been the worst performer in the $-bloc in 2019 (-4.3% vs the USD) as
an early dovish shift by the RBNZ left the currency without any support as trade tensions
escalated. A snapshot of the current situation, however, suggests the woes to the NZD
may be close to an end.
First and foremost, the RBNZ seems to be done cutting rates. The Bank frontloaded the
rest of G10 space twice in 2019 in terms of monetary easing: first, when it lowered the
policy rate in March and then when it delivered a surprising 50bp cut in August. While it
has been pointed out more than once this year how the Fed seemed to be aligning its
policy with markets expectations, the RBNZ has shown to have an opposite approach. In
the latest policy meeting (13 November), the Bank held rates on hold despite markets
pricing in around 70% of a cut and Governor Adrian Orr has hinted that the policy rate
will remain on hold at 1% for an extended period of time.
The RBNZ hopes are that the stimulus already
provided will ultimately feed a recovery in
inflation and support economic activity.
Inflation remains below-target (1.5%), but the unemployment rate is close to its
historical lows (4.3%) and wage growth is robust (3.9%). Our economics team expect
headline CPI to move back to the 2% mid-target and hover around that level for most of
2020, and are also seeing a fairly supportive activity outlook with average GDP growth at
2.5% next year. When adding a less concerning external outlook, the RBNZ should be
able to stick to its recently-adopted neutral stance and keep the rates at 1% (although
market is still pricing around 20bp of easing for next year). In November 2020, New
Zealanders will head to the polls as current PM Jacinda Ardern (Labour Party) seeks a
second term after leading a minority government. Early polls suggest Labour is tied to
the centre-right Nationals, but much will depend on the performance of smaller parties
“We expect no more easing by the RBNZ”

FX Outlook 2020 November 2019
38
(Greens and nationalists NZ First, above all) to determine the chance for Ardern’s re-
election. Either way, we do not see a major market impact of the elections.
Fig 58 Milk price stabilisation is key for NZ economy Fig 59 NZD is the biggest G10 speculative short
1,000
2,000
3,000
4,000
5,000
6,000
7,000
Nov 15 Jul 16 Mar 17 Nov 17 Jul 18 Mar 19 Nov 19
US$
/to
nn
e
All Products Butter
Skim Milk Powder Whole milk powder
-100%
-75%
-50%
-25%
0%
25%
50%
75%
100%
EUR GBP JPY CAD AUD NZD CHF USD*
Min/Max (5y range)
Average +/- 1 s.d.
Latest
Speculative positioning (% of open interest)
As of 19 Nov 2019 - *aggregate USD positioning vs G10 FX Source: AHDB, GlobalDairyTrade Holdings Ltd Source: CFTC, Bloomberg, ING
New Zealand is a highly export-focused economy, with strong ties to Chinese demand,
but – differently to Australia – its export is mostly focused on agricultural alimentary
products. This has two main implications: it makes global demand less reliant on
economic cycles than other commodities (such as industrial metals) but it is also strictly
dependent on weather conditions on the production side, which adds some
unpredictability. That said, the outlook for NZ main commodities appears fairly
constructive. The average auction price of milk and milk-related products (that make
around a quarter of NZ total exports) has been on the rise in 2H19 (Figure 58) and
Fonterra (NZ’s main dairy co-operative) has recently announced an upward review of its
farmgate milk price forecast for the 2019/20 season from NZ$6.25-7.25 to NZ$6.55-7.55
per kgMS. The outlook for the forestry industry (9% of total exports) had worsened
during the summer of 2019 as prices slumped, but latest data suggests the worst is
behind – especially as fears of drying Chinese demand abated - and our expectations for
no further escalations in trade tension also supports a stable outlook for 2020.
As shown in Figure 14 NZD is currently trading below its medium-term fair value. Most of
the negatives that kept the NZD on the back foot in 2019 appear more likely to fade
than re-intensify in 2020 as trade tensions and RBNZ easing have likely peaked. NZD can
also benefit from being the biggest speculative short in the G10 market (Figure 59) at
the moment (CFTC net positioning is at -48% of open interest, at the time of writing),
which should exacerbate rallies in the currency as the tide turns.
All this leads us to expect a solid rebound in the Kiwi dollar across the board in 2020
which, in line with the other commodity currencies, should mostly manifest in the
second half of the year – we see NZD/USD at 0.67 in 4Q20. In the shorter-run, we expect
a continuation of the recent downward-sloping trajectory of AUD/NZD, that should
continue to be pressured by the policy differential. Looking ahead, we expect the pair to
flatten up at around 1.05, although the balance of risks should stay tilted to the
downside as we see another cut by the RBA to be more likely than one by the RBNZ
(despite our forecasts include no easing by either of the two).
Spot 4Q19 1Q20 2Q20 3Q20 4Q20
USD/CAD 1.30 1.32 1.30 1.29 1.26 1.25
AUD/USD 0.70 0.69 0.68 0.70 0.71 0.72
NZD/USD 0.60 0.65 0.65 0.66 0.67 0.68
ING FX forecasts ING FX forecasts
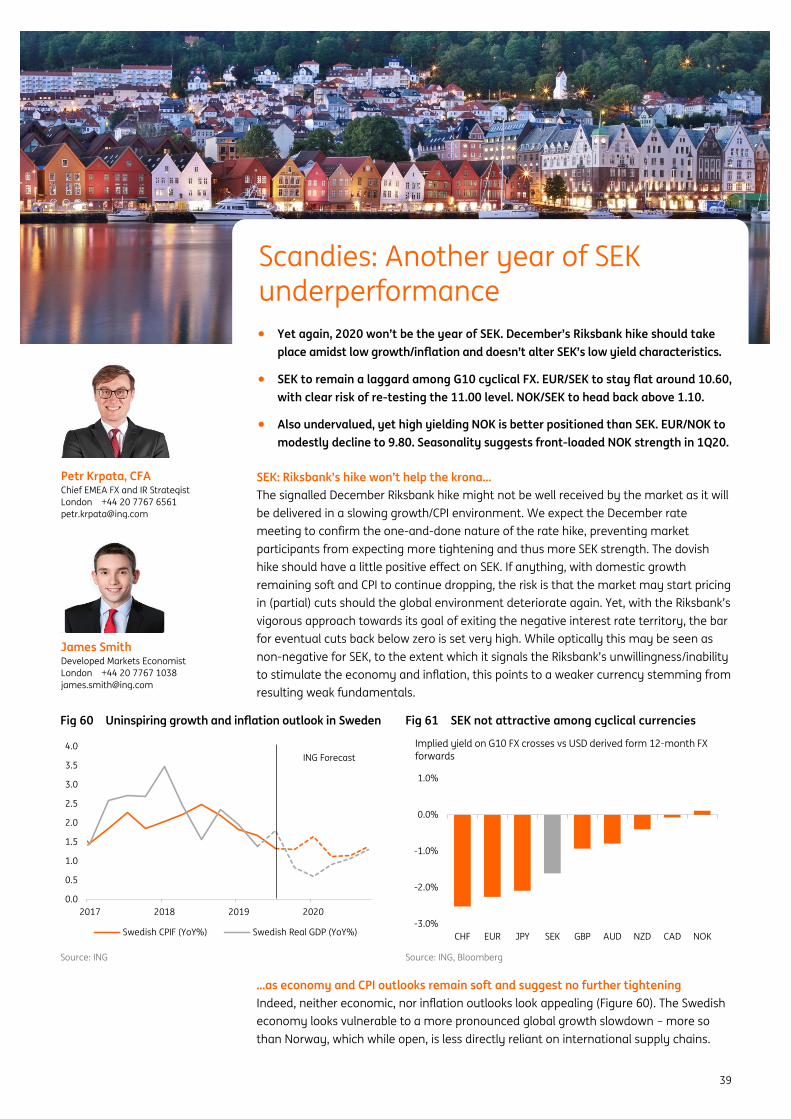
FX Outlook 2020 November 2019
39
SEK: Riksbank’s hike won’t help the krona…
The signalled December Riksbank hike might not be well received by the market as it will
be delivered in a slowing growth/CPI environment. We expect the December rate
meeting to confirm the one-and-done nature of the rate hike, preventing market
participants from expecting more tightening and thus more SEK strength. The dovish
hike should have a little positive effect on SEK. If anything, with domestic growth
remaining soft and CPI to continue dropping, the risk is that the market may start pricing
in (partial) cuts should the global environment deteriorate again. Yet, with the Riksbank’s
vigorous approach towards its goal of exiting the negative interest rate territory, the bar
for eventual cuts back below zero is set very high. While optically this may be seen as
non-negative for SEK, to the extent which it signals the Riksbank’s unwillingness/inability
to stimulate the economy and inflation, this points to a weaker currency stemming from
resulting weak fundamentals.
Fig 60 Uninspiring growth and inflation outlook in Sweden Fig 61 SEK not attractive among cyclical currencies
0.0
0.5
1.0
1.5
2.0
2.5
3.0
3.5
4.0
2017 2018 2019 2020
Swedish CPIF (YoY%) Swedish Real GDP (YoY%)
ING Forecast
-3.0%
-2.0%
-1.0%
0.0%
1.0%
CHF EUR JPY SEK GBP AUD NZD CAD NOK
Implied yield on G10 FX crosses vs USD derived form 12-month FX
forwards
Source: ING Source: ING, Bloomberg
…as economy and CPI outlooks remain soft and suggest no further tightening
Indeed, neither economic, nor inflation outlooks look appealing (Figure 60). The Swedish
economy looks vulnerable to a more pronounced global growth slowdown – more so
than Norway, which while open, is less directly reliant on international supply chains.
Scandies: Another year of SEK underperformance
• Yet again, 2020 won’t be the year of SEK. December’s Riksbank hike should take
place amidst low growth/inflation and doesn’t alter SEK’s low yield characteristics.
• SEK to remain a laggard among G10 cyclical FX. EUR/SEK to stay flat around 10.60,
with clear risk of re-testing the 11.00 level. NOK/SEK to head back above 1.10.
• Also undervalued, yet high yielding NOK is better positioned than SEK. EUR/NOK to
modestly decline to 9.80. Seasonality suggests front-loaded NOK strength in 1Q20.
Petr Krpata, CFA Chief EMEA FX and IR Strategist
London +44 20 7767 6561
James Smith Developed Markets Economist
London +44 20 7767 1038

FX Outlook 2020 November 2019
40
Reduced capacity utilisation and lack of new orders suggest investment could decline in
2020, while export growth could slow further. The inflation outlook looks relatively
benign – a lot depends on the wage negotiations next year. But with the jobs market
faltering and inflation expectations slipping in the labour market, it looks unlikely that
the unions will be able to secure steeper, multi-year rise in wages. This benign inflation
outlook suggests the Riksbank won’t raise rates much beyond the December hike. As
has been the case in 2019, the housing market doesn’t look like a major story for 2020.
Despite the Riksbank’s hike, SEK is still the lowest yielding G10 cyclical currency
Although we expect the global risk environment to stabilise, we don’t see SEK as the
prime beneficiary. Rather the currency should continue to lag its high beta G10 FX peers,
including NOK. This is because the higher yielding FX should be the key beneficiary from
flows into risk assets from the unappealing G10 core low yielders. Even after fully
pencilling in a Riksbank December hike, SEK still does not fit these characteristics. The
currency still screens the least attractive from the yield perspective among cyclical
peers (Figure 61) and retains the lowest real yield in the G10 FX space (Figure 62). With
the economic growth remaining deeply below the potential, and CPI off the target (as
per Figure 15 on page 12), the currency should remain an unattractive outright long and
should still be rather seen as a funding than an asset currency.
Fig 62 Sweden having the lowest real rate in G10 FX space Fig 63 EUR/NOK heavily overshot its short-term fair value
-1.8
-1.6
-1.4
-1.2
-1.0
-0.8
-0.6
-0.4
-0.2
0.0
%, real interest rate (CPI inflation minus policy rate)
-2%
0%
2%
Nov 18 Mar 19 Jul 19 Nov 19
+/- 1.5 standard deviations (12-month rolling) Residual
% Residual between EUR/NOK spot and ING financial fair value. A
measure of a risk premiaMeaningful overshot
in EUR/NOK
Source: ING, Bloomberg Source: ING
SEK to underperform NOK and not to appreciate against EUR
Granted, SEK might look ultra-cheap but so do most of its cyclical peers in the G10 world.
As Figure 14 on page 12 shows, NOK, AUD and NZD are by and large as undervalued as
SEK. Hence, from a perspective of value chasing, these higher yielding currencies with
better idiosyncratic stories offer better value than SEK, in our view. The current stretched
SEK valuation should be beneficial for the currency to the extent to which it may act as a
hurdle for EUR/SEK to breach the 11.00 level. While we look for EUR/SEK stability (around
EUR/SEK 10.60 for most of the year) we view risks as skewed to the weaker SEK should
global growth slip yet again. The year of 2020 will be another déjà vu for SEK – yet again
it will not be the year of the SEK.
NOK: Hard to justify sell-off in late 2019 to be followed by seasonal 1Q20 rebound
The NOK sell-off and its underperformance this October was stunning, with EUR/NOK
aggressively overshooting our short-term financial fair value estimate (Figure 63). As our
model captures factors such as the oil price, general risk environment, domestic equity
market and domestic rates, it is challenging to justify the scale of the sell-off on a
fundamental basis. Rather, it looks like a mix of poor liquidity, positioning and investors
front-running the seasonal year end / 4Q NOK underperformance (Figure 64). This
suggests some reversal, particularly during the first two months of next year (January
especially) in line with the usual seasonality (also depicted in Figure 64).
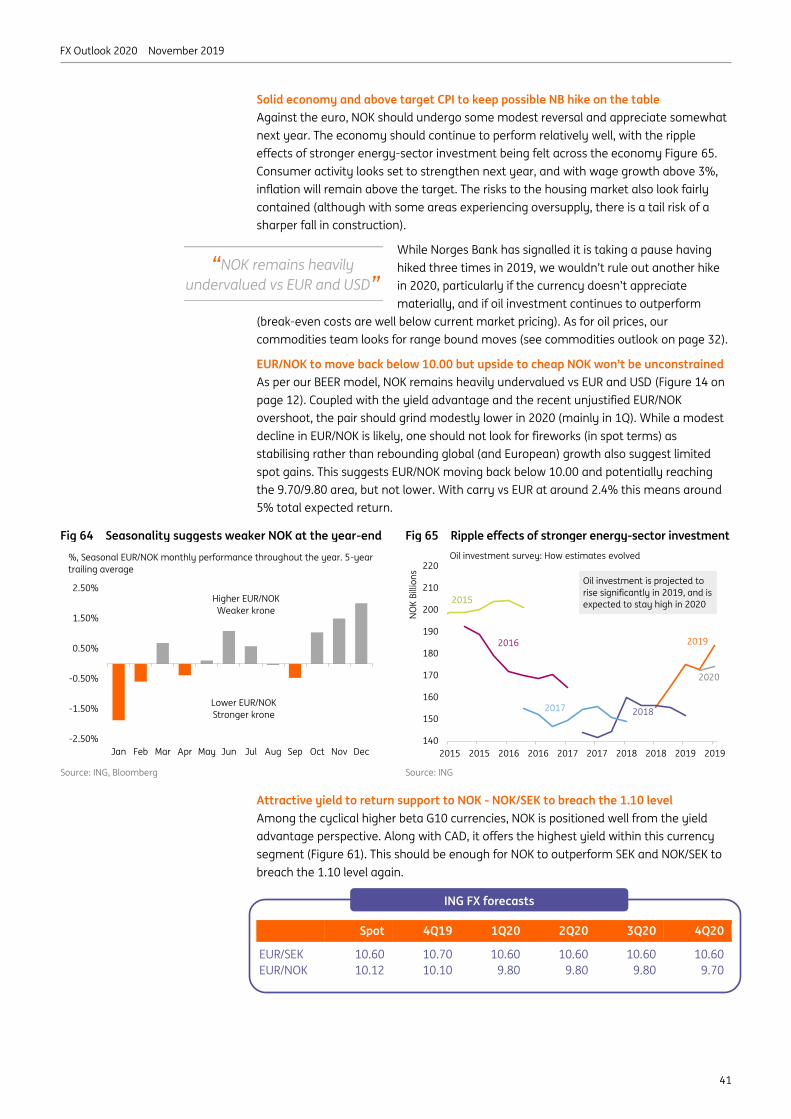
FX Outlook 2020 November 2019
41
Solid economy and above target CPI to keep possible NB hike on the table
Against the euro, NOK should undergo some modest reversal and appreciate somewhat
next year. The economy should continue to perform relatively well, with the ripple
effects of stronger energy-sector investment being felt across the economy Figure 65.
Consumer activity looks set to strengthen next year, and with wage growth above 3%,
inflation will remain above the target. The risks to the housing market also look fairly
contained (although with some areas experiencing oversupply, there is a tail risk of a
sharper fall in construction).
While Norges Bank has signalled it is taking a pause having
hiked three times in 2019, we wouldn’t rule out another hike
in 2020, particularly if the currency doesn’t appreciate
materially, and if oil investment continues to outperform
(break-even costs are well below current market pricing). As for oil prices, our
commodities team looks for range bound moves (see commodities outlook on page 32).
EUR/NOK to move back below 10.00 but upside to cheap NOK won’t be unconstrained
As per our BEER model, NOK remains heavily undervalued vs EUR and USD (Figure 14 on
page 12). Coupled with the yield advantage and the recent unjustified EUR/NOK
overshoot, the pair should grind modestly lower in 2020 (mainly in 1Q). While a modest
decline in EUR/NOK is likely, one should not look for fireworks (in spot terms) as
stabilising rather than rebounding global (and European) growth also suggest limited
spot gains. This suggests EUR/NOK moving back below 10.00 and potentially reaching
the 9.70/9.80 area, but not lower. With carry vs EUR at around 2.4% this means around
5% total expected return.
Fig 64 Seasonality suggests weaker NOK at the year-end Fig 65 Ripple effects of stronger energy-sector investment
-2.50%
-1.50%
-0.50%
0.50%
1.50%
2.50%
Jan Feb Mar Apr May Jun Jul Aug Sep Oct Nov Dec
%, Seasonal EUR/NOK monthly performance throughout the year. 5-year
trailing average
Lower EUR/NOK
Stronger krone
Higher EUR/NOK
Weaker krone
140
150
160
170
180
190
200
210
220
2015 2015 2016 2016 2017 2017 2018 2018 2019 2019
NO
K B
illio
ns
2015
2016
2017 2018
2019
Oil investment survey: How estimates evolved
Oil investment is projected to
rise significantly in 2019, and is
expected to stay high in 2020
2020
Source: ING, Bloomberg Source: ING
Attractive yield to return support to NOK - NOK/SEK to breach the 1.10 level
Among the cyclical higher beta G10 currencies, NOK is positioned well from the yield
advantage perspective. Along with CAD, it offers the highest yield within this currency
segment (Figure 61). This should be enough for NOK to outperform SEK and NOK/SEK to
breach the 1.10 level again.
Spot 4Q19 1Q20 2Q20 3Q20 4Q20
EUR/SEK 10.60 10.70 10.60 10.60 10.60 10.60
EUR/NOK 10.12 10.10 9.80 9.80 9.80 9.70
ING FX forecasts
“NOK remains heavily
undervalued vs EUR and USD”
ING FX forecasts

FX Outlook 2020 November 2019
42
Underweight CEE FX globally, locally overweight CZK vs underweight HUF
It is unlikely to be a stellar year for CEEMEA low yielders. Bar HUF, CZK, PLN and ILS do
not show an appealing valuation (being either around their fair values or overvalued)
while by their virtue of being low yielders, they won’t be seen as overly desirable in what
we anticipate will be a search for higher yields. As Figure 66 shows, the bulk of these
currencies find themselves in the undesirable bottom-right quadrant (offering low risk
adjusted carry and non-appealing valuation).
Adding to it is the non-exciting eurozone
economic growth prospect, slowing CEE growth
(Figure 67) and non-appreciating EUR/USD.
Thus the CEE FX segment won’t find much
appeal among the international investment community next year, likely warranting a
regional underweight, particular from the USD-based investors’ point of view. But against
the euro, the currencies shouldn’t do too badly, with CZK, RON and PLN all exerting a
degree of carry protection – in contrast to HUF. We are no longer CZK negative as the
worst for the koruna seems to be behind us. CEE FX wise, we prefer to be CZK
overweight, HUF underweight and neutral on PLN and RON (the latter purely due to
carry consideration).
More value in CEEMEA high yielders, with RUB yet again standing out
In contrast, the likes of RUB and TRY offer cheap valuation and attractive risk adjusted
carry (the desirable top-left quadrant in Figure 66), a sought-after attribute in what is
likely to be search for higher yield, characterised by stabilising global growth and no
meaningful escalation in the US-China trade conflict. Yet as the dollar won’t be
weakening for idiosyncratic reasons (limited, if no, cuts from the Fed), EM FX spot gains
vs USD won’t be stellar - suggesting carry will be an important factor from a total return
perspective. While TRY looks good on the above matrix, we prefer RUB as the lira is likely
to continue depreciating in nominal terms to avoid real TRY appreciation due to
persistently high inflation. We shy away from ZAR due to its unattractive valuation (the
only high yielding EM currency not undervalued vs USD – Figure 13 on page 12), the risk
of a credit rating downgrade and slowing growth (vs higher growth in Russia and Turkey).
CEEMEA high yielders wise, we prefer RUB overweight, TRY neutral and ZAR underweight.
CEEMEA: Unattractive low yielders, diversity in high yielders
• From a global perspective, the relatively low yielding CEE FX should lag its EM peers
in 2020. CEE growth is slowing, EUR/USD is to stay range-bound, and both CEE FX
valuation and carry are not attractive in USD terms to get overly excited about.
• Yet, most of CEE FX (even RON) should do relatively well vs EUR due to (modest)
carry. Our top pick is CZK as global risks are receding and the CNB may hike. We are
HUF negative as policy is too loose for weakening C/A dynamics.
• 2020 should benefit CEEMEA high yielders. RUB and TRY stand out on valuation -
carry matrix. We prefer RUB. ZAR, the only EM high yielder not cheap vs USD,
remains unattractive, partly due to the downgrade risk.
Petr Krpata, CFA Chief EMEA FX and IR Strategist
London +44 20 7767 6561
And the EMEA Economics Team
“For global investors, the CEE FX segment
won’t find much appeal in 2020”
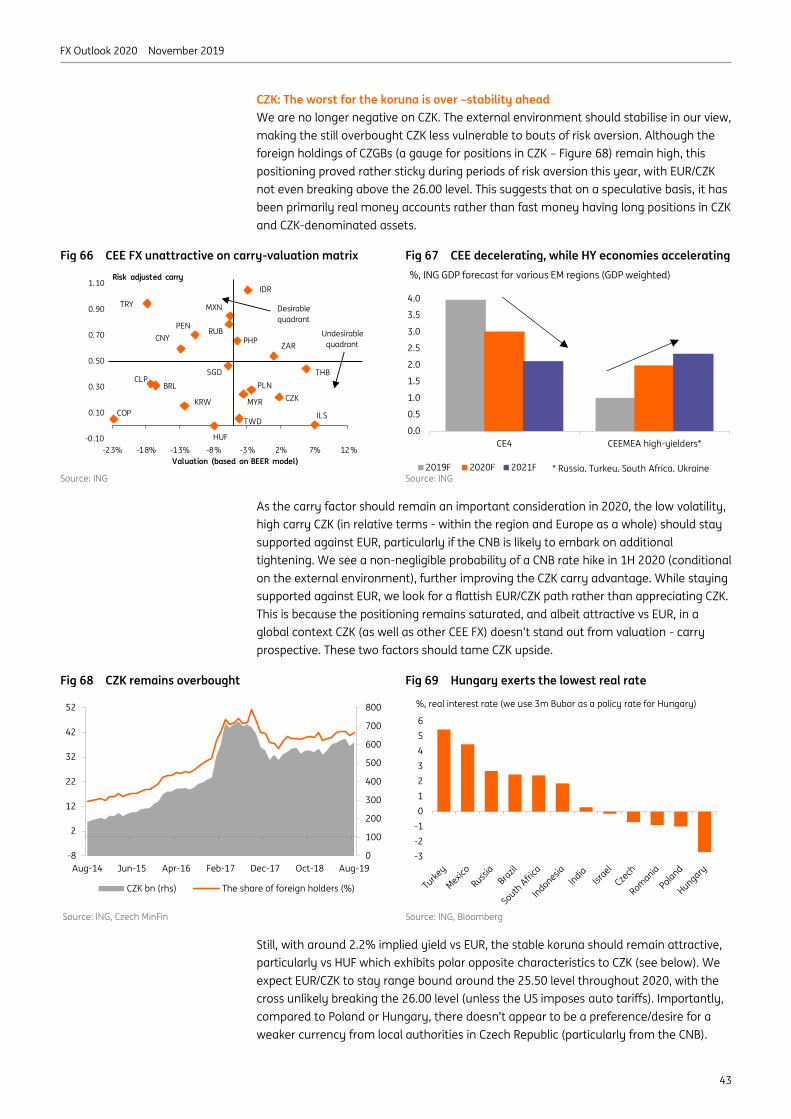
FX Outlook 2020 November 2019
43
CZK: The worst for the koruna is over –stability ahead
We are no longer negative on CZK. The external environment should stabilise in our view,
making the still overbought CZK less vulnerable to bouts of risk aversion. Although the
foreign holdings of CZGBs (a gauge for positions in CZK – Figure 68) remain high, this
positioning proved rather sticky during periods of risk aversion this year, with EUR/CZK
not even breaking above the 26.00 level. This suggests that on a speculative basis, it has
been primarily real money accounts rather than fast money having long positions in CZK
and CZK-denominated assets.
Fig 66 CEE FX unattractive on carry-valuation matrix Fig 67 CEE decelerating, while HY economies accelerating
-0.10
0.10
0.30
0.50
0.70
0.90
1.10
-23% -18% -13% -8% -3% 2% 7% 12%
MXN
CLP
ILS
IDR
PLN
ZARCNY
SGD
BRL
TRY
THB
CZK
PHP
COP
RUBPEN
KRW
TWD
HUF
MYR
Risk adjusted carry
Valuation (based on BEER model)
Desirable
quadrant
Undesirable
quadrant
0.0
0.5
1.0
1.5
2.0
2.5
3.0
3.5
4.0
CE4 CEEMEA high-yielders*
2019F 2020F 2021F
%, ING GDP forecast for various EM regions (GDP weighted)
* Russia, Turkey, South Africa, Ukraine Source: ING Source: ING
As the carry factor should remain an important consideration in 2020, the low volatility,
high carry CZK (in relative terms - within the region and Europe as a whole) should stay
supported against EUR, particularly if the CNB is likely to embark on additional
tightening. We see a non-negligible probability of a CNB rate hike in 1H 2020 (conditional
on the external environment), further improving the CZK carry advantage. While staying
supported against EUR, we look for a flattish EUR/CZK path rather than appreciating CZK.
This is because the positioning remains saturated, and albeit attractive vs EUR, in a
global context CZK (as well as other CEE FX) doesn’t stand out from valuation - carry
prospective. These two factors should tame CZK upside.
Fig 68 CZK remains overbought Fig 69 Hungary exerts the lowest real rate
0
100
200
300
400
500
600
700
800
-8
2
12
22
32
42
52
Aug-14 Jun-15 Apr-16 Feb-17 Dec-17 Oct-18 Aug-19
CZK bn (rhs) The share of foreign holders (%)
-3
-2
-1
0
1
2
3
4
5
6
%, real interest rate (we use 3m Bubor as a policy rate for Hungary)
Source: ING, Czech MinFin Source: ING, Bloomberg
Still, with around 2.2% implied yield vs EUR, the stable koruna should remain attractive,
particularly vs HUF which exhibits polar opposite characteristics to CZK (see below). We
expect EUR/CZK to stay range bound around the 25.50 level throughout 2020, with the
cross unlikely breaking the 26.00 level (unless the US imposes auto tariffs). Importantly,
compared to Poland or Hungary, there doesn’t appear to be a preference/desire for a
weaker currency from local authorities in Czech Republic (particularly from the CNB).

FX Outlook 2020 November 2019
44
HUF: Gradual weakness as the policy is too loose for changed C/A dynamics
HUF remains the least attractive currency in the region. The current account surplus all
but vanished (and is currently in deficit) and the NBH monetary stance is too loose to allow
for stable / sustainably higher HUF. With Bubor at a mere 0.19%, HUF exhibits the most
negative real yield in the EM FX space (Figure 69), with the NBH pushing liquidity into the
system via FX swaps. Unlike back in 2018, we don’t see a specific HUF level as a line in the
sand (i.e., EUR/HUF 330 at the time) as a weaker HUF will be seen as a helping factor to
offset the growth slowdown and the NBH’s perceived disinflationary risk from abroad.
Moreover, with the highest inflation target in the region
(3%) and CPI running close to, yet modestly above the
target, in the absence of around 2% HUF depreciation vs
EUR on a yearly basis, HUF will appreciate in real terms
vs EUR (assuming a 2% inflation differential between the EZ and Hungary). While HUF
currently screens as undervalued vs EUR (Figure 13 on page 12), the higher domestic CPI
pressures suggest that the valuation gap will be closing via the inflation channel, making
the current mis-valuation less of a hurdle against further gradual forint weakness.
While we look for higher EUR/HUF, we don’t expect the 2018-like pace of HUF
depreciation as Bubor remains in check and inflation concerns are less imminent (as the
worst in terms of the CPI rise is behind us, in our view). We believe EUR/HUF will break
340 by 1Q20 with a risk of testing the 345 level (yet at these levels, the valuation should
act as a hurdle against further currency weakness). Just like the euro should be
perceived globally, the forint should be the regional funding currency of choice.
Fig 70 Polish slowdown to be most pronounced over two yrs Fig 71 RON exerts the highest FX pass through in CEE
0
1
2
3
4
5
Czech Republic Hungary Poland Romania
2019F 2020F 2021F
%, GDP growht YoY, ING projections
0.00
0.10
0.20
0.30
Romania Poland Hungary Czech Rep
Pass-through from the exchange rate into inflation
Source: ING Source: ING, Local Central Banks estimates
PLN: Mortgage story overhang still in place and limiting zloty upside potential
The risk of the Polish mortgage story does not appear imminent (following the ECJ ruling
in early October which did not fulfil worst-case fears), yet it is still in place and is likely to
have a slow burning drag on the zloty (as the cases will hit the courts and newsflow, and
banks build FX provisions), preventing the currency from longer lasting gains. Yet
equally, the material downside to the zloty looks unlikely as possible cases will be
dispersed over time, in turn avoiding a one-off, large pressure on the currency. The
possible sale of mBank from a foreign owner to a state governed institution (which would
involve the sale of PLN/purchase of EUR) could also be PLN negative next year. As in
Hungary, a weaker currency should not be seen as negative, but rather as a tool helping to
offset the economic slowdown (which should be apparent across the CEE countries next
year and most pronounced in Poland over the next two years – Figure 70).
On a valuation basis, the zloty does not screen as significantly mis-valued vs the euro
(around 2% cheap based on our BEER model) and like other lower yielding currencies in
the CEEMEA region (ie, CZK and ILS) does not provide a bullish valuation case from the
“HUF exhibits the most negative
real yield in the EM FX space”
%, GDP growth YoY, ING projections

FX Outlook 2020 November 2019
45
wider EM FX perspective. With EUR/USD contained, the repeat of 2017 zloty rally (when
the currency was, along with CZK, the top EM FX performer) is unlikely. Rather EUR/PLN
should be broadly trading around the 4.30 level.
RON: Fundamentally weak, yet tightly managed currency!
Purely from a fundamental point of view, RON is not appealing (twin deficit, an
expensive currency in real terms). Yet, EUR/RON is a managed exchange rate, exerts the
highest FX pass through in the region (Figure 71) and the steepest forward curve. The
curve is, in our view, too steep (3.7% implied yield over a 12-month time horizon vs EUR
– Figure 72) for long EUR positions to make a positive return in absolute terms over the
course of the year. Hence long EUR/RON positions remain unattractive (unless perfectly
timed ahead of the occasional shifts in the EUR/RON trading range higher by NBR).
Fig 72 RON benefits from highest carry in the CEE space Fig 73 The adjustment in Turkish CPI is now behind us
0.0%
1.0%
2.0%
3.0%
4.0%
EUR/RON EUR/PLN EUR/CZK EUR/HUF
%, 12-month FX forward implied yield on (short) EUR/CEE crosses
8
10
12
14
16
18
20
22
4Q18 2Q19 4Q19 2Q20 4Q20 2Q19 4Q19
Turkey CPI (%YoY) ING Forecast Source: ING, Bloomberg Source: ING
With Romanian CPI set to hover around/above the target next year, meaningful RON
depreciation (meaningful enough to outperform the forwards) would likely move CPI
above the tolerance band. Such a situation would not bode well for the inflation
targeting NBR, meaning that the central bank will maintain a tight grip on the currency
and allow only for a limited EUR/RON appreciation, with EUR/RON staying below the
forward curve. If anything, we would see spikes in EUR/RON higher / adjustment in the
EUR/RON trading range higher as a tactical opportunity to go short EUR/RON and pick up
the carry – a theme for early next year.
Indeed, the risks to RON are plentiful. Bar the
persistently weak fundamentals (twin deficit,
expensive currency in real terms), the possible
pension increase planned for September 2020 risks a further deterioration in the already
weak fiscal position. Yet, this is more of a risk to ROMGBs (not managed by the NBR)
rather than to RON (tightly managed by the NBR) in our view.
RUB: The favoured CEEMEA high yielder
Despite its impressive performance in 2019, we see RUB as being best positioned among
CEEMEA high yielders for 2020. Growth should continue to accelerate in 2020, declining
inflation may prompt further CBR cuts (in turn keeping local bonds attractive), the BoP
seasonality is favourable this quarter and next (with only 30-40% of the current account
surplus to be sterilised by FX purchases) and the currency screens attractive on our
valuation – risk adjusted carry matrix (Figure 66). With the overhang of sanctions
moving further into the background and RUB showing a remarkable stability during
bouts of global stress, the currency remains attractive, in our view.
While RUB lags TRY both in valuation and risk adjusted terms, the lower geopolitical risk
factors associated with RUB (vs TRY) makes in our view RUB a better proposition. With
Russian inflation relatively subdued, this will translate into a lower pace of rouble
appreciation in real terms via the inflation channel, allowing for nominal RUB
“Yet again, RON is very expensive to short”

FX Outlook 2020 November 2019
46
appreciation to close some of the mis-valuation gap (as opposed to the Turkish lira,
where still high inflation will close the valuation gap naturally, in real terms).
TRY: Attractive on many measures but caution still warranted
With growth rebounding, prior deceleration in inflation, a still high real rate (Figure 75)
and appealing risk adjusted carry – valuation dynamics, TRY screens attractive. Yet, the
geopolitical risk and the decreasing pace of inflation normalisation from here (CPI
staying above 10% in most of 2020 – Figure 73) suggests some caution. With CPI still
high, TRY depreciation in nominal terms is likely to prevent appreciation of the lira in real
terms. While TRY may outperform the forwards during the first months of 2020 if the
global environment stays benign (characterised by the search for yield), as past years
have shown, caution is warranted. That is why we prefer RUB to TRY.
Fig 74 Worrying debt path an issue for ZAR Fig 75 ZAR real yield not high enough for the level of CDS
53
55.6 56.257.8 58.9 59.7 60.2 60.1 59.9 59.3
56.7
60.8
64.9
68.571.3
73.775.8
77.879.5
80.9
50
55
60
65
70
75
80
85
Gro
ss D
eb
t (%
of
GD
P)
Budget MTBPS
0
50
100
150
200
250
300
350
0
1
2
3
4
5
6
7
Turkey Russia South Africa
Real yield 5-year CDS, rhs
%, real interest rate (policy rate minus CPI inflation)
Source: ING Source: ING, Bloomberg
ZAR: Not undervalued, with carry not compensating for fiscal/rating risks
We view ZAR as the least attractive high yielder in the region. Unlike the case for Russia
and Turkey, growth should continue to slow, there is a clear risk of a rating downgrade
from Moody’s next year (as slowing growth is translating into non-stabilising/increasing
Debt/GDP path – Figure 74) and on a valuation basis, ZAR does not screen cheap vs USD.
While both risk-adjusted carry and real yield don’t look unattractive, they don’t account
for the fiscal risk present in ZAR assets. As evident in Figure 75, ZAR’s real yield does not
compensate for the high levels of CDS (when compared to RUB and ZAR). With 2020
unlikely to be an across-the-board risk-on environment (as global growth will remain
subdued and USD won’t be depreciating for idiosyncratic reasons), there won’t be much
hiding for ZAR. Rather, other high yielding currencies should be preferred in our view
(both within the CEEMEA region and globally).
Spot 4Q19 1Q20 2Q20 3Q20 4Q20
EUR/CZK 25.53 25.60 25.50 25.50 25.50 25.50
EUR/HUF 333.00 338.00 340.00 340.00 335.00 335.00
EUR/PLN 4.29 4.28 4.30 4.34 4.33 4.32
EUR/RON 4.78 4.80 4.82 4.82 4.83 4.85
USD/ILS 3.47 3.51 3.50 3.45 3.40 3.35
USD/RUB 63.99 64.00 64.00 66.00 68.00 66.00
USD/TRY 5.69 5.90 6.15 6.25 6.40 6.50
USD/ZAR 14.82 15.00 15.50 15.20 15.10 15.00
ING FX forecasts ING FX forecasts

FX Outlook 2020 November 2019
47
Balkans: Convergence story goes ahead After facing various headwinds and delays but for different reasons, both Bulgaria
and Croatia are hopeful that they will join the ERM-II in 2020. While Croatia’s
accession looks almost certain, Bulgaria could still face some delays from the ECB,
though some important milestones have been achieved. This should be rating positive
for both countries but will not change anything in Bulgaria’s peg regime or Croatia’s
quasi-pegged FX management. The Serbia dinar, on the other hand, while not being
under a (official or not) peg regime, has come under a tight managed floating regime
lately, with the NBS very active in the currency market. Using a mix of policy
instruments, the NBS loosened its policy, helping the re-dinarisation of the economy
and gaining credibility in its inflation targeting strategy. The EU accession road,
however, doesn’t look as clear nor as rapid as it did in the not so distant past. 17 out
of the total 35 negotiation chapters with the EU have been opened, only 2 being
provisionally closed. Hence, the convergence story goes ahead, but the speed varies.
EUR/BGN: Finally, some hope that ERM-II will become a reality
The longstanding ambition to join the euro area seems to be slowly but steadily turning
into reality. Bulgaria passed most intermediary steps, such as transposing relevant EU
legislation into the national one, obtaining EIOPA’s support and the conclusion of the
Cooperation and Verification Mechanism under which the EU was monitoring Bulgaria’s
judicial reforms. Otherwise, Bulgaria still exceeds the suggested IMF’s ARA metrics
(assessment of reserve adequacy) for EM and the continuous inflow of EU funds are
further improving the situation. The Bulgarian leva is likely to remain expensive in real
terms versus its CEE peers, but this is an issue to which local companies have already
adapted well. However, as natural as the ERM-II entry might look, the convergence
process is still affected by relatively limited productivity gains which, if unaddressed,
could hit back and leave the country exposed to painful internal devaluation in the
future.
EUR/HRK: ERM-II looks a done deal
The likely admission of Croatia into ERM-II in mid-2020 has slightly changed the rules of
the game for the kuna. The Croatian National Bank (CNB) turned a touch more restrictive
in allowing the usual swift summer months appreciation of the kuna. Overall though, the
picture remains broadly unchanged, with the tourism-generated current account
surpluses remaining supportive for the kuna, well contained inflationary pressures and a
loose monetary stance, mimicking the ECB. We continue to see the 7.45 level as a likely
central parity rate once admitted into ERM-II. Otherwise, it should be business as usual
for the CNB, with official bids below 7.40 when seasonal inflows start to pour in and a
return to the 7.45 area when they dry up. ERM-II admission is likely to trigger another
round of rating upgrades, after an already impressive 2019 when the country regained
its investment grade from S&P and Fitch.
EUR/RSD: Strong capital inflows to continue to support the dinar
FX interventions to curb dinar strengthening have become a norm in 2019 and –
alongside subdued inflation – led the National Bank of Serbia (NBS) to resume its
monetary easing. Judging by the current account data and fixed income market
developments, capital inflows have been both FDI and bond related, though the former
are likely to have prevailed. The 118.00 line in the sand turned more into a moving
target throughout the year and we believe that this will continue into 2020 as well. We
see the EUR/RSD inching lower towards 117.00 in a controlled manner throughout 2020.
EU integration and the general convergence story might slow down as major EU
Special Feature
Valentin Tataru Chief Economist, Romania
Bucharest +40 31 406 8991

FX Outlook 2020 November 2019
48
member countries are reluctant to see swift EU enlargement. On the rating side, as the
country approaches the investment grade area, qualitative factors such as the
institutional framework, rule of law and judicial independence will start to weigh on
more than just the fiscal and economic developments which have prevailed so far.
Hence, obtaining an investment grade might not come earlier than 2021 in our view.
Fig 76 C/A+FDI as a percentage of GDP Fig 77 Debt metrics improving across the board (% of GDP)
-10
-8
-6
-4
-2
0
2
4
6
8
10
2012 2013 2014 2015 2016 2017 2018 2019F 2020F 2021F
Serbia Croatia Bulgaria
ING estimates
40
50
60
70
80
90
100
110
120
2012 2013 2014 2015 2016 2017 2018 2019F 2020F 2021F
Serbia Croatia Bulgaria
ING estimates
Source: National sources, ING estimates Source: National sources, ING estimates
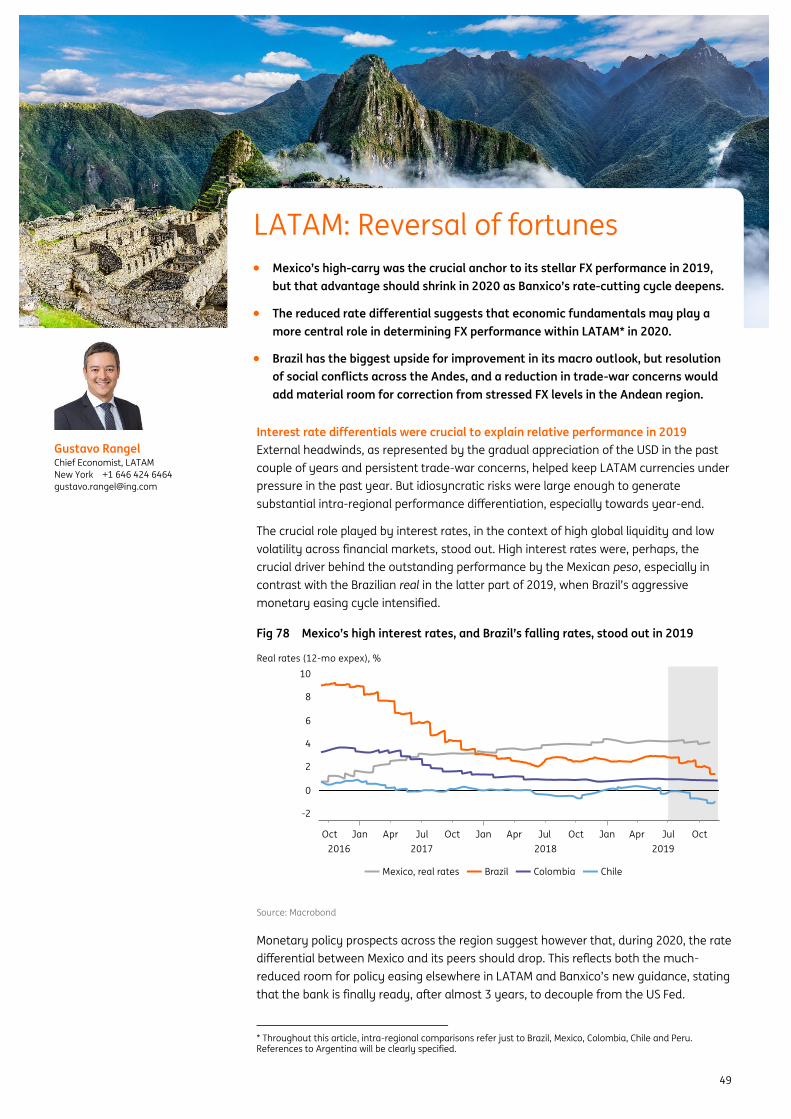
FX Outlook 2020 November 2019
49
Interest rate differentials were crucial to explain relative performance in 2019
External headwinds, as represented by the gradual appreciation of the USD in the past
couple of years and persistent trade-war concerns, helped keep LATAM currencies under
pressure in the past year. But idiosyncratic risks were large enough to generate4
substantial intra-regional performance differentiation, especially towards year-end.
The crucial role played by interest rates, in the context of high global liquidity and low
volatility across financial markets, stood out. High interest rates were, perhaps, the
crucial driver behind the outstanding performance by the Mexican peso, especially in
contrast with the Brazilian real in the latter part of 2019, when Brazil’s aggressive
monetary easing cycle intensified.
Fig 78 Mexico’s high interest rates, and Brazil’s falling rates, stood out in 2019
Source: Macrobond
Monetary policy prospects across the region suggest however that, during 2020, the rate
differential between Mexico and its peers should drop. This reflects both the much-
reduced room for policy easing elsewhere in LATAM and Banxico’s new guidance, stating
that the bank is finally ready, after almost 3 years, to decouple from the US Fed.
* Throughout this article, intra-regional comparisons refer just to Brazil, Mexico, Colombia, Chile and Peru. References to Argentina will be clearly specified.
LATAM: Reversal of fortunes
• Mexico’s high-carry was the crucial anchor to its stellar FX performance in 2019,
but that advantage should shrink in 2020 as Banxico’s rate-cutting cycle deepens.
• The reduced rate differential suggests that economic fundamentals may play a
more central role in determining FX performance within LATAM* in 2020.
• Brazil has the biggest upside for improvement in its macro outlook, but resolution
of social conflicts across the Andes, and a reduction in trade-war concerns would
add material room for correction from stressed FX levels in the Andean region.
Gustavo Rangel Chief Economist, LATAM
New York +1 646 424 6464

FX Outlook 2020 November 2019
50
As a result, Mexico’s far-superior ability to conduct monetary easing should reduce its
carry advantage and translate into a relatively less resilient MXN in 2020.
Fig 79 High rates helped solidify the MXN’s outperformance in recent months
Source: Macrobond
For 2020, idiosyncratic risks seem more favourable to 2019’s FX underperformers
As Mexico’s monetary policy becomes less of an outlier, interest rate differentials should
play a reduced role in driving intra-regional FX performance. This should allow for other
catalysts, better aligned with the evolution of economic fundamentals, to determine
relative performance in the coming quarters.
Among those catalysts, Mexico’s relative weakness in terms of economic activity stands
out. In particular, judging by 2020 consensus estimates, Mexico is on track to print two
consecutive years with the lowest GDP growth in LATAM.
That poor growth performance helps explain why Mexico, which is the only sovereign
with a negative credit rating outlook by two agencies in the region, is the most likely
credit to suffer a rating’s downgrade next year.
Brazil, meanwhile, stands apart as the credit most likely to be considered for a rating’s
upgrade. This would be consistent with the recent approval of the social security reform
but, in order for that to happen, we suspect GDP growth needs to accelerate and,
possibly, surprise market expectations in the coming quarters.
Social unrest should remain an important driver for the region’s FX outlook
Episodes of social unrest was another important catalyst for relative value performance
in recent quarters. And given that the political environment remains unsettled across
much of the Andean region, political risk should remain an important driver for the
region’s FX outlook.
No major presidential election is scheduled for 2020, but off-schedule elections in Peru
and Bolivia are possible, and the renewed energy seen in recent social protests calls for
caution throughout the region. In particular, recent episodes demonstrated that, once
started, their impact on local financial markets was deeper than initially expected, often
demanding a heavy cost in terms of fiscal accounts and loss in economic activity.
The eventual resolution of social conflicts across the Andes, together with reduced
trade-war concerns suggest however that there is material room for correction from
stressed FX levels in the Andean region.
Even though FX correlation with commodity prices has reduced materially in recent
months, especially where those correlations were strongest, ie, in Chile and in Colombia,

FX Outlook 2020 November 2019
51
the outlook for commodity prices should remain an important driver for relative
currency performance among the Andean countries.
ING’s commodity team expects copper prices, ie, the chief driver for Chile’s terms-of-
trade, to rise gradually from current levels, while the outlook for oil prices, the crucial
driver for Colombia’s COP, is more balanced. This suggests greater room for a catch-up
correction in the CLP, when compared to the COP.
The PEN should, meanwhile, continue to outperform during market sell-offs and to
underperform during rallies, which suggests that the currency should underperform its
peers in a scenario of relatively benign outlook for risk appetite. Such a relatively benign
market environment would benefit especially the currencies that are more sensitive to
external drivers and risk aversion generally, such as the COP and the BRL.
Some caution is warranted, however, when considering the unpredictability of social
conflicts and the fact that they have also triggered intra-region contagion. Financial
market contagion should be relatively short-lived, as intra-regional trade is relatively
small in LATAM. Having said that, the possibility of a disorderly default in Argentina late
in 1Q should be monitored as a potential catalyst for (temporary) FX weakness,
especially in Brazil.
Apart from a stated desire to restructure government debt by the end of 1Q, the policy
priorities of the upcoming Alberto Fernandez administration remain far from clear. The
continued use of strict FX controls together with the much-improved external trade
balance should help moderate FX volatility. However, the expected preference for a deep
monetary easing program, together with prospects for difficult negotiations with debt-
holders, as Argentina aims to return its debt metrics to a sustainable trajectory,
suggests that FX dynamics should remain hard to predict.
As in the past, an eventual FX policy preference for keeping the ARS at “competitive”
levels, as some have suggested as a means to strengthen external trade and growth,
would eventually conflict with the need to use FX as a price anchor. And as policy
priorities fluctuate between the need to boost exports or, alternatively, to control
inflation, the ARS should experience faster or slower depreciation relative to inflation.
Brazil’s BRL has been under pressure as local markets adjust to a new low-rate reality
The approval of the social security reform helped re-anchor Brazil’s fiscal accounts and
paved the way for the central bank to re-launch a deep monetary easing cycle. As the
SELIC rate, which should end the year at 4.5%, has reached new lows, FX outflows have
intensified, resulting in a sustained weakening pressure on the BRL.
Fig 80 FX outflows surged throughout 2019
Fig 81 BRL could catch-up with other local assets in 2020
Source: Macrobond Source: Macrobond
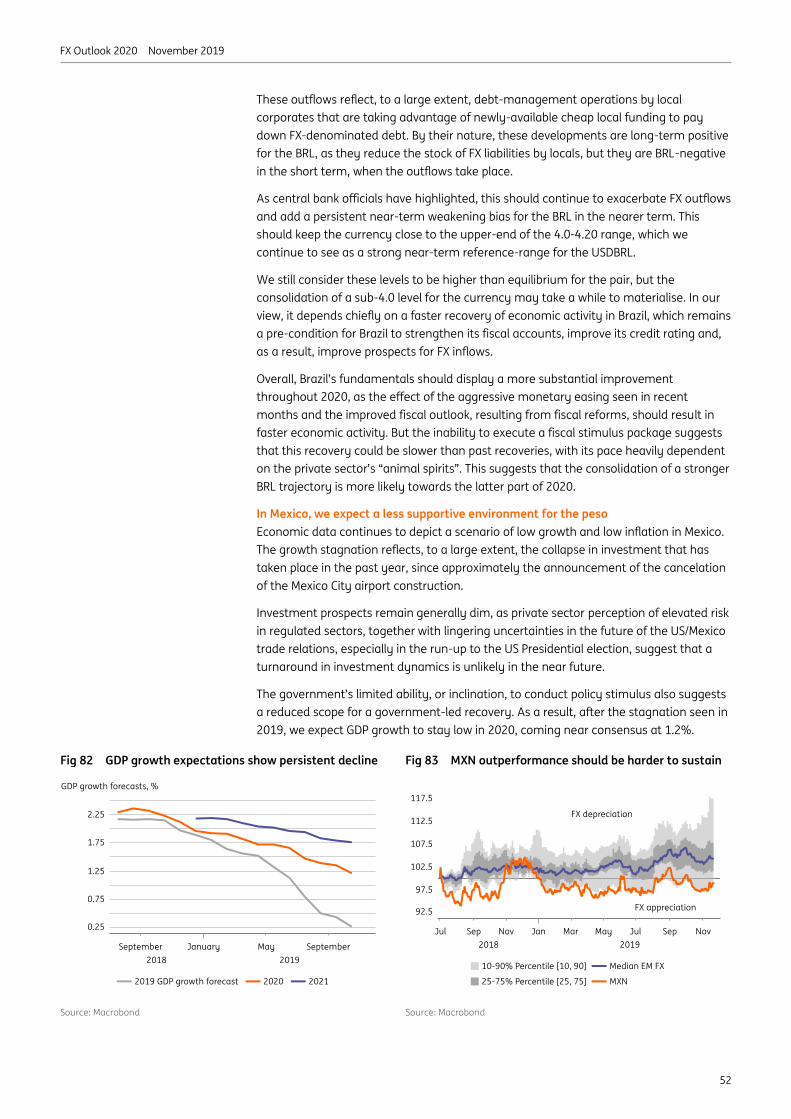
FX Outlook 2020 November 2019
52
These outflows reflect, to a large extent, debt-management operations by local
corporates that are taking advantage of newly-available cheap local funding to pay
down FX-denominated debt. By their nature, these developments are long-term positive
for the BRL, as they reduce the stock of FX liabilities by locals, but they are BRL-negative
in the short term, when the outflows take place.
As central bank officials have highlighted, this should continue to exacerbate FX outflows
and add a persistent near-term weakening bias for the BRL in the nearer term. This
should keep the currency close to the upper-end of the 4.0-4.20 range, which we
continue to see as a strong near-term reference-range for the USDBRL.
We still consider these levels to be higher than equilibrium for the pair, but the
consolidation of a sub-4.0 level for the currency may take a while to materialise. In our
view, it depends chiefly on a faster recovery of economic activity in Brazil, which remains
a pre-condition for Brazil to strengthen its fiscal accounts, improve its credit rating and,
as a result, improve prospects for FX inflows.
Overall, Brazil’s fundamentals should display a more substantial improvement
throughout 2020, as the effect of the aggressive monetary easing seen in recent
months and the improved fiscal outlook, resulting from fiscal reforms, should result in
faster economic activity. But the inability to execute a fiscal stimulus package suggests
that this recovery could be slower than past recoveries, with its pace heavily dependent
on the private sector’s “animal spirits”. This suggests that the consolidation of a stronger
BRL trajectory is more likely towards the latter part of 2020.
In Mexico, we expect a less supportive environment for the peso
Economic data continues to depict a scenario of low growth and low inflation in Mexico.
The growth stagnation reflects, to a large extent, the collapse in investment that has
taken place in the past year, since approximately the announcement of the cancelation
of the Mexico City airport construction.
Investment prospects remain generally dim, as private sector perception of elevated risk
in regulated sectors, together with lingering uncertainties in the future of the US/Mexico
trade relations, especially in the run-up to the US Presidential election, suggest that a
turnaround in investment dynamics is unlikely in the near future.
The government’s limited ability, or inclination, to conduct policy stimulus also suggests
a reduced scope for a government-led recovery. As a result, after the stagnation seen in
2019, we expect GDP growth to stay low in 2020, coming near consensus at 1.2%.
Fig 82 GDP growth expectations show persistent decline
Fig 83 MXN outperformance should be harder to sustain
Source: Macrobond Source: Macrobond

FX Outlook 2020 November 2019
53
In the very near term, high interest rates should remain an effective stabilising factor for
the MXN, which should keep the USDMXN trading close to 19.5. A steady pace of 25bp
cuts suggests, however, that high rates should gradually become a less effective FX
anchor, while the risk of a more frontloaded monetary easing cycle has increased,
adding greater uncertainty to the outlook for the currency in the longer-term.
Our base case is for Banxico to cut the policy rate an additional 150bp, with the policy
rate ending 2020 at 6.0%. But poor activity data could increase pressure on the bank to
bring monetary policy more firmly into neutral territory (possibly closer to 5.5%), while a
change in the board’s composition at the end of 2020 could set the stage for a more
substantial change in policy bias.
Javier Guzmán, often seen as the most hawkish board-member, concludes his term at
the end of 2020, providing President Lopez Obrador with the opportunity to appoint a
majority at the monetary policy board. This could weigh on the peso late in 2020.
Overall, our view is that Mexico’s inferior GDP growth outlook, lingering risk of credit
rating downgrades, among other factors, suggest that the scope for MXN
outperformance should become increasingly challenging throughout 2020. In fact, our
expectation is that the USD/MXN gradually depreciates towards 20.0 by the end of 2020.
Spot 4Q19 1Q20 2Q20 3Q20 4Q20
USD/MXN 19.42 19.30 19.20 19.50 19.80 20.00
USD/BRL 4.20 4.20 4.15 4.05 3.90 3.80
USD/CLP 795 780 755 740 735 730
USD/ARS 60.00 61.00 64.00 70.00 77.00 84.00
USD/COP 3,440 3,400 3,350 3,300 3,260 3,240
USD/PEN 3.38 3.37 3.36 3.35 3.34 3.33
ING FX forecasts ING FX forecasts

FX Outlook 2020 November 2019
54
Trade wars, which way next?
2019 has been a tough year for Asia. The US-China trade war, which had been largely
verbal in 2018 turned increasingly real, with tariffs flung about by both sides, though
predominantly by the US on China.
The effect on the Chinese economy has been profound – but it has also hit global trade
hard and, as a result, delivered a degree of collateral damage elsewhere in the region,
particularly to the region’s small and very open economies.
There have been some well documented “winners” from the trade war, such as Vietnam.
They have picked up some of China’s manufacturing from the trade battlefield. Malaysia
and Thailand have also been named in this diversification trade story. But we would still
rate their victories as “relative” rather than “absolute”.
It is no exaggeration to say that the direction taken by the trade war in 2020 will largely
determine the direction of currencies in the region. At the time of writing, a phase one
deal is believed to be close, though we would caution against taking it for granted.
Our base assumption is that we will see some form of
constrained deal struck either late-2019 or early-
2020 (see also China section). Market sentiment and,
consequently, Asian FX strength would benefit from
this. But there may also be some excessive optimism
building up after a year of fairly relentless misery.
The peak in Asian FX strength is likely to coincide with any public signing of a phase 1
trade deal. There was talk of this happening in November, and then suggestions that it
would not happen until December. But the timing is less important than the content.
Our base case assumes any such phase 1 deal is followed by a broader deal, which if
true could see a removal of existing tariffs (not just postponement or deferral of pending
ones), improvement in Asian growth prospects and trade flows (supporting Asian FX). US
growth prospects would also likely improve and, ultimately, thoughts of a reversal of the
mid-cycle adjustment may return, and be priced into 2021 futures contracts, which
could be bad news in particular for Asia’s current account deficit currencies (INR, IDR).
Asia: Trading on trade
• The single biggest determinant of Asian FX in 2020 is likely to be the US-China trade
war and investor appetite for Asia’s open economies’ currencies. But the outlook
here is incredibly uncertain and could change imminently, for better or worse
• Overlaying the trade war, a potential cyclical recovery for the big electronics
producers in the region may be a further differentiator for some currencies…
• …but with most central banks running out of room to ease, and no tightening
expected, local policy is unlikely to play a big role
•
Rob Carnell Chief Economist & Head of Research,
Asia-Pacific
Singapore +65 6232 6020
Prakash Sakpal Economist, Asia
Singapore +65 6232 6181
“…the direction taken by the trade war in
2020 will largely determine the direction
of currencies in the region”

FX Outlook 2020 November 2019
55
But there are many big risks attached to these assumptions. Even if a deal is agreed,
which is by no means a given, a phase one deal may lack real substance, and a broader
deal still looks a difficult bridge to cross for both sides.
So in our consideration of where Asian FX goes, we also consider possible a post-phase
one deal period of calm or further slight gains quickly giving way if the “deal” is picked
apart and markets start to turn more bearish again. Any Asian currency weakness
following this might be limited by expectations of Fed easing returning on a gloomier
trade and domestic US prognosis. Then again, there could also be signs of a trade
détente nearer the US Presidential election which could also help underpin Asian FX later
in 2020. Or as plausible, there may be no deal at all, in which case, Asian FX will fall more
sharply.
Such stylised outcomes are reflected in Figure 84. The lines could reflect any currency
index (up equals stronger, down weaker). The low conviction of our base case on trade
means that we don’t have a strong preference between these three stylised outcomes,
or indeed, any one of an almost infinite permutation of other alternatives.
Fig 84 Stylised view of FX scenario alternatives
Source: ING
For example, the hypothesis that the US will soften its position on trade as the
Presidential election race unfolds could provide an excuse for some Asian currency
appreciation later in 2020. But there are good reasons not to bank on this. Easing up on
China by the current US administration could well be a vote loser – depending on how
the US domestic economy looks at that time – and that is also highly uncertain.
To sum up then, the single biggest driver of FX in the region is also the most uncertain in
both timing and direction. Later on, we consider how different currencies are likely to
fare under different scenarios. Indeed, as there is a very good chance that this note is
overtaken by events soon after publication, this seems a far more sensible way to
proceed.
If not trade, then what else?
While the trade war has received most of the press coverage in Asia this year, another
event has been far more damaging to some of the region’s economies and, by
extension, to their currencies.
Double-digit declines in Asian exports in 2019 have typically been dominated by
extreme weakness in the electronics sector. There is a degree of overlap here with the
trade war, but little causation. This was happening anyway.
A deal of some sort does look
possible, but it is not a certainty
Trade war is not the only game
in town for Asian FX

FX Outlook 2020 November 2019
56
Over-investment meeting headlong with plunging demand created a toxic cocktail of
falling export volumes and prices (see also “The Chips are Down – Asia and the global
technology slump”5).
It is not for nothing that the Korean won has been one of the worst performing
currencies in 2019, the dire performance of its hugely important electronics sector has
been a big contributor to KRW weakness.
Fig 85 Currency performance: Asia vs USD (%YTD)
-6 -4 -2 0 2 4 6 8
KRW
INR
CNY
CNH
MYR
HKD
SGD
JPY
TWD
IDR
PHP
THB%Ytd
Source: Bloomberg
Singapore has also suffered under this electronics slump, though its managed currency
regime has shielded the SGD from as much damage as the KRW.
Very few economies in Asia are particularly insulated from the electronics slump. To
some degree or other, electronics is a big factor for most economies, though a huge
electronics export percentage does not necessarily mean it is a big contributor to
economic strength.
Fig 86 Asian electronics as percentage of total exports and GDP
0 10 20 30 40 50 60
Indonesia
India
Vietnam
Japan
Thailand
Singapore (NODX)
China
South Korea
Malaysia
Taiwan
Philippines
% of exports % of GDP
Source: SITC, CEIC
At the extreme end of this industry as well as Korea and Singapore, lies Taiwan, another
electronics giant. TWD weakness in 2019 has been managed. And recently, the currency
has benefited from investment flows as Taiwanese technology companies operating in
Mainland China have returned to Taiwan, lifting the economy and the currency.
5 https://think.ing.com/uploads/reports/Asia_and_the_global_tech_slump_301019.pdf
Almost all of Asia is exposed to
the electronics sector

FX Outlook 2020 November 2019
57
The Philippines seems like an unlikely electronics giant, but 55% of all of its exports are
electronics. Saying that, the low value added nature of this industry in the Philippines,
(testing and packaging as well as commodity diode component production) has
ironically provided some shielding for the Philippines and the PHP against the technology
slump. This, plus a very favourable starting point in early 2019 and return to surplus for
the current account has meant that the PHP has been one of Asia’s outperformers in
2019. Though that may also limit any upside in 2020.
Thailand and Malaysia also have significant
electronics industries. Malaysia has dodged
much of the weakness that has hit its smaller
neighbour to the south (Singapore), and we
suspect it has also been picking up market share from other economies in the region.
Thailand too may have been a relative trade war winner, but the THB story is dominated
by its large current account surplus, so it too has emerged largely unscathed. That also
suggests any further upside for the THB in 2020 may be more limited than more beaten
up currencies such as the KRW.
The future of this sector is definitely looking less bleak. Inventories of key electronics
components have fallen so far that production and exports are beginning to stabilise, as
too are prices. There still isn’t much evidence of a recovery, though, and we don’t really
expect much of one in 2020. This may be more of a story for 2021.
Fig 87 Korean semiconductor inventory ratio and PPI
75
80
85
90
95
100
105
110
115-60
-40
-20
0
20
40
60
80
100
120
140
2011 2012 2013 2014 2015 2016 2017 2018 2019 2020
Inv/shipments ratio, +6m PPI electronics, inv (rhs)
(YoY%) index Jan 2015 = 100
Source: CEIC, ING
5G development and rollout is likely to be the main catalysts for this sector. Huge
investments are estimated as being necessary for 5G to become the new standard for
electronics. An end to the trade war will significantly hasten recovery of the 5G rollout,
boosting electronics sensitive currencies.
So the trade war and the electronics cycle are definitely linked and reinforce each other.
But they have independent origins and shouldn’t be confused.
The electronics industry in 2020 will probably be all about stabilisation, not acceleration.
That might not be a good reason to get too excited about Asian FX, but it at least
removes one of the main negatives from currencies such as the KRW. But by 2021, when
electronics demand may really start to find its feet again, the electronics giants and
their currencies, KRW, TWD, SGD, could fly as 5G demand takes off. This could result in a
multi-year boost. Until then, broad stability is not a bad outcome.
“The future for the electronics industry is
looking less bleak”
The biggest electronics
exporters are not always the
most exposed to this sector
There is some evidence that
electronics is no longer falling,
or that the decline has slowed
The rollout of 5G will be
enormously positive for Asia’s
economies and FX

FX Outlook 2020 November 2019
58
Domestic policies – monetary policy constrained
The amount of monetary easing in 2019 has not been substantial. India takes the medal
for the most easing, with a cumulative 135bp of policy interest rate cuts as the RBI has
switched to a much more growth centric
stance under Governor Das. That, though, is
probably only a small part of the explanation
for the underperformance of the INR this year,
second only to the battered KRW. Electronics
isn’t the culprit for INR weakness. Instead, rising twin deficits, disappointing growth and a
suspicion that low inflation rates won’t last, have been the main sources, despite a
relatively benign risk sentiment and commodity (low oil price) backdrop.
Room for additional monetary easing in the rest of Asia is also limited. Figure 88 shows
the difference between nominal policy rates and inflation rates. Very crudely, the gap
shows a decomposed version of the real (inflation expectations adjusted) interest rate.
For developing Asia, not only is a zero real interest rate probably close to a lower bound,
below which the currency would begin to weaken significantly, but there probably also
needs to be a small positive buffer, depending on the credibility of the respective central
bank, the degree of overseas financing required (current account deficit) and the
economic outlook (growth and inflation).
Consequently, the only economies where there
currently looks room for some significant
additional monetary easing are Indonesia,
Malaysia, the Philippines, and Vietnam. In all of
these economies, inflation is low relative to
where we think it will go in 2020.
Current inflation in Asia is flattered by comparison with 2018, where in many cases, food
prices spiked higher on bad weather. More seasonal weather in 2019 coupled with
improved import supply in the case of the Philippines, has brought food prices down. But
this beneficial comparison won’t last. Asian swine fever is pushing up meat prices around
the region, especially in China. This also won’t last, but for 2019/2020, it helps speed up
the unwinding of favourable base effects.
Fig 88 Real policy rates de-constructed (%)
0
1
2
3
4
5
6
Latest CPI inflation Policy rate
Market 3m rates for Singapore
Source: Bloomberg, ING
“Room for additional policy easing is
probably limited”
“The only economies where there
currently looks room for some significant
additional easing are Indonesia, Malaysia,
the Philippines, and Vietnam”

FX Outlook 2020 November 2019
59
Indian inflation is also pushing higher on rising onion and tomato prices. There is an
element of seasonality to this, which will also drop away in time, allowing for one more
Reserve Bank of India (RBI) rate cut in 4Q19. But the ex-food inflation trajectory for India
is also rising, and there is unlikely to be any room for more easing after this.
For the region as a whole, inflation is likely to rise during 2020. This will close the real
interest rate gap for many central banks in the region. So not only is the absolute scope
for easing shrinking, but the window of opportunity to move is also shutting. Those
central banks that have been slow to move (Bank of Korea, Bank of Thailand) may find
that there is neither room nor time for them to ease further in 2020.
Consequently, we don’t see much room for
local monetary policy to play a role in the
region as a differentiator between different
currencies.
On the fiscal side, policy room is also limited.
India has already used up a lot of its fiscal
degrees of freedom in the re-election stimulus for President Modi. That hasn’t yet
delivered the growth dividend that was expected, nor have subsequent budget
measures and cuts to the corporate tax rate. At 5%, 3Q19 GDP growth was India’s
weakest since 1Q13. That should improve in 2020, but probably by less than the
government and markets hope. We don’t see growth returning to 7% in 2020, which we
view as a pre-requisite for the RBI to remove any of its recent easing. All of which should
constrain any INR appreciation (ING forecast for 4Q20 USD/INR is 71.0).
Korea implemented a more expansionary budget in 2020, and this could support any
cyclical turnaround in the electronics sector. We are also beginning to see some positive
growth responses where fiscal policy has already been turned up to stimulate
infrastructure spending, for example, in the Philippines, Indonesia and Thailand. But on
the whole, we don’t see fiscal policy doing much more than taking the rough edges off
the prevailing cyclical picture, so it probably will not play strongly into the FX picture.
Summary
Putting these often-competing elements together to form a single unified FX forecast for
the region is next to impossible. The outlook for Asian currencies depends critically not
just on the highly uncertain outlook for the trade war and the global electronics cycle,
but on related, but separate questions of global risk sentiment and domestic policy
responses in these environments.
Perhaps a better operating framework is to
consider how different Asian currencies
perform under different scenarios for trade,
electronics, and global stability/policy and
continually try to assess where we are headed
as we forge deeper into 2020.
In Figure 89, we highlight what we anticipate to be the winners in each extreme of the
various theatres of concern we need to follow, though it is also fair to note that we have
picked the currencies we would expect to outperform at the extremes, and what we
might get instead, is a much blander version of one or many of the scenarios assessed
below.
“The CNY and KRW would outperform in
an environment of trade war progress and
electronics cycle upturn”
Asia’s inflation rates will not be
as low in 2020, making further
easing harder
“Consequently, we don’t see much room
for local monetary policy to play a role in
the region as a differentiator between
different currencies”
Fiscal policy unlikely to change
the outlook, merely moderate
the existing one

FX Outlook 2020 November 2019
60
Fig 89 Currency outperformers under different scenarios
CNYKRW
THB
KRWCNY
PHPIDR
IDRINRPHP
THB
Strong trade(trade deal done)
Electronics recovery
Strong global sentiment
Weak trade(escalation of trade war)
Electronics stagnant
Weak global sentiment
Source: ING
A couple of currencies, SGD, MYR, and TWD tend to be less cyclical, more managed and
less volatile than some of the others. And for that reason, they may be good choices in a
world of significant uncertainty, though returns probably won’t be spectacular.
Otherwise, we suggest that both the CNY and KRW would outperform in an upbeat
environment of trade war progress and electronics cycle upturn. Both would clearly be
rank underperformers in a worsening trade environment. In contrast, the THB would
likely continue to provide some upside in the event of a trade war escalation.
In a renewed electronics downturn, the low electronics content of Indonesia and low
value added environment of the Philippines electronics industry could see IDR and PHP
outperform the rest of the Asian FX pack. But not if this were accompanied by a
worsening global risk sentiment, as both currencies and the IDR would likely do poorly,
as they have in the past. In such an environment, again, the THB would likely be the
safest option.
Spot 4Q19 1Q20 2Q20 3Q20 4Q20
USD/CNY 7.03 7.00 7.05 7.00 6.95 6.85
USD/HKD 7.83 7.84 7.84 7.84 7.84 7.82
USD/IDR 14,095 14,100 14,200 14,250 14,222 14,100
USD/INR 71.80 72.00 72.50 71.80 71.30 71.00
USD/KRW 1,170 1,150 1,180 1,150 1,140 1,120
USD/MYR 4.17 4.15 4.16 4.14 4.13 4.12
USD/PHP 50.87 51.62 52.41 52.68 53.07 53.25
USD/SGD 1.36 1.36 1.36 1.36 1.35 1.34
USD/TWD 30.49 30.50 30.30 30.00 29.70 30.00
USD/THB 30.19 30.40 30.50 30.60 30.50 30.50
CNY and KRW likely to
outperform in an environment
of trade war progress
ING FX forecasts

FX Outlook 2020 November 2019
61
Appendix
What can we learn from FX markets in 2019? If, a year ago, one had perfect foresight of a continuing slump in world trade and the Fed
responding with three rate cuts, what would one have expected of FX performance in
2019? A weaker dollar against safe havens and broad underperformance of activity
currencies? Well, year-to-date 2019 performance has actually been a lot more mixed
and we can perhaps take some of those themes into 2020.
In Figure 90 we take a stylised look at the key factors which have driven FX performance
against the dollar this year. Of course idiosyncratic factors will always play a role – eg,
Argentina and Chile – and here we are not looking for social unrest spreading to the likes
of Brazil and Mexico.
In fact a core story linking Brazil and the best
performing currency of the year, the Russian
rouble, has been massive disinflation and
monetary easing. These easing cycles
generated very different outcomes for the RUB
and the BRL. Huge portfolio flows into the local
currency bond market (OFZ) supported the RUB, but in Brazil local corporates took
advantage of historically low local interest rates to pay down hard currency debt.
Another important theme in a low volatility world was the available carry. Here, CAD,
MXN and IDR all performed well (the former two helped by proximity to the US and the
prospect of the USMCA being signed). Equally we felt the negative yield held many
European currencies back. This underperformance was compounded by the slump in
European industrial activity (partially auto-related) which is now spreading to CE4.
Fig 90 FX performance against USD year-to-date 2019 and stylised ING rationale
-40
-35
-30
-25
-20
-15
-10
-5
0
5
10
Local factors Yield European Industrial slump BoP Sensitivity to China
Source: Bloomberg, ING
And of course the ongoing slowdown in China weighed on those Asian regional and
commodity currencies most closely linked to its activity path. Here the gyrations of the
renminbi as trade tensions blow hot and cold dragged blocs of currencies with it.
Mostly highly correlated to the CNH in the G10 space this year were AUD, NZD, NOK, SEK
and CAD and, in the EM space, ZAR, followed by RUB, BRL, MXN and COP. Bucking the
trend of Asian FX correlation with the renminbi was the THB, where a surprisingly
resilient trade story managed to deliver outsize returns. Even though 2019 was largely a
story of trade, the performance of the THB suggested that Balance of Payments should
not be neglected.
“A core story linking Brazil and the best
performing currency of the year, the
Russian Rouble, has been massive
disinflation and monetary easing”

FX Outlook 2020 November 2019
62
ING foreign exchange forecasts
EUR cross rates Spot 4Q19 1Q20 2Q20 3Q20 4Q20 USD cross rates Spot 4Q19 1Q20 2Q20 3Q20 4Q20
Developed FX
EUR/USD 1.11 1.10 1.10 1.11 1.12 1.13 DXY 98.30 98.00 98.00 97.50 96.50 95.50
EUR/JPY 120.00 119.00 119.00 120.00 121.00 122.00 USD/JPY 108.40 108.00 108.00 108.00 108.00 108.00
EUR/GBP 0.86 0.83 0.83 0.85 0.85 0.82 GBP/USD 1.29 1.33 1.33 1.31 1.32 1.38
EUR/CHF 1.10 1.10 1.10 1.10 1.12 1.15 USD/CHF 0.99 1.00 1.00 0.99 1.00 1.02
EUR/NOK 10.17 10.10 9.80 9.80 9.80 9.70 USD/NOK 9.19 9.18 8.91 8.83 8.75 8.58
EUR/SEK 10.72 10.70 10.60 10.60 10.60 10.60 USD/SEK 9.69 9.73 9.64 9.55 9.46 9.38
EUR/DKK 7.47 7.47 7.47 7.47 7.47 7.47 USD/DKK 6.76 6.79 6.79 6.73 6.67 6.61
EUR/CAD 1.47 1.45 1.43 1.43 1.41 1.41 USD/CAD 1.30 1.32 1.30 1.29 1.26 1.25
EUR/AUD 1.62 1.59 1.62 1.59 1.58 1.57 AUD/USD 0.70 0.69 0.68 0.70 0.71 0.72
EUR/NZD 1.72 1.69 1.69 1.68 1.67 1.66 NZD/USD 0.60 0.65 0.65 0.66 0.67 0.68
EMEA
EUR/PLN 4.29 4.28 4.30 4.34 4.33 4.32 USD/PLN 3.88 3.89 3.91 3.91 3.87 3.82
EUR/HUF 333.00 338.00 340.00 340.00 335.00 335.00 USD/HUF 301.00 307.00 309.00 306.00 299.00 296.00
EUR/CZK 25.53 25.60 25.50 25.50 25.50 25.50 USD/CZK 23.08 23.27 23.18 22.97 22.77 22.57
EUR/RON 4.78 4.80 4.82 4.82 4.83 4.85 USD/RON 4.32 4.36 4.38 4.34 4.31 4.29
EUR/HRK 7.44 7.45 7.43 7.40 7.43 7.45 USD/HRK 6.73 6.77 6.75 6.67 6.63 6.59
EUR/RSD 117.60 117.50 117.50 117.40 117.20 117.00 USD/RSD 106.00 107.00 107.00 106.00 105.00 104.00
EUR/RUB 70.77 70.40 70.40 73.26 76.16 74.58 USD/RUB 63.99 64.00 64.00 66.00 68.00 66.00
EUR/UAH 26.72 28.60 29.15 29.97 30.80 31.64 USD/UAH 24.16 26.00 26.50 27.00 27.50 28.00
EUR/KZT 428.30 423.50 424.60 430.10 435.70 440.70 USD/KZT 387.00 385.00 386.00 388.00 389.00 390.00
EUR/TRY 6.29 6.49 6.77 6.94 7.17 7.35 USD/TRY 5.69 5.90 6.15 6.25 6.40 6.50
EUR/ZAR 16.40 16.50 17.05 16.87 16.91 16.95 USD/ZAR 14.82 15.00 15.50 15.20 15.10 15.00
EUR/ILS 3.84 3.86 3.85 3.83 3.81 3.79 USD/ILS 3.47 3.51 3.50 3.45 3.40 3.35
EUR/AZN 1.87 1.87 1.87 1.89 1.90 1.92 USD/AZN 1.70 1.70 1.70 1.70 1.70 1.70
LATAM
EUR/BRL 4.65 4.62 4.57 4.50 4.37 4.29 USD/BRL 4.20 4.20 4.15 4.05 3.90 3.80
EUR/MXN 21.48 21.23 21.12 21.65 22.18 22.60 USD/MXN 19.42 19.30 19.20 19.50 19.80 20.00
EUR/CLP 880 858 831 821 823 825 USD/CLP 795 780 755 740 735 730
EUR/ARS 66.10 67.10 70.40 77.70 86.20 94.90 USD/ARS 60.00 61.00 64.00 70.00 77.00 84.00
EUR/COP 3,811 3,740 3,685 3,663 3,651 3,661 USD/COP 3,440 3,400 3,350 3,300 3,260 3,240
EUR/PEN 3.74 3.71 3.70 3.72 3.74 3.76 USD/PEN 3.38 3.37 3.36 3.35 3.34 3.33
Asia
EUR/CNY 7.78 7.70 7.76 7.77 7.78 7.74 USD/CNY 7.03 7.00 7.05 7.00 6.95 6.85
EUR/HKD 8.66 8.62 8.62 8.70 8.78 8.84 USD/HKD 7.83 7.84 7.84 7.84 7.84 7.82
EUR/IDR 15,590 15,510 15,620 15,818 15,929 15,933 USD/IDR 14,095 14,100 14,200 14,250 14,222 14,100
EUR/INR 79.44 79.20 79.75 79.70 79.86 80.23 USD/INR 71.80 72.00 72.50 71.80 71.30 71.00
EUR/KRW 1,295 1,265 1,298 1,277 1,277 1,266 USD/KRW 1,170 1,150 1,180 1,150 1,140 1,120
EUR/MYR 4.61 4.57 4.58 4.60 4.63 4.66 USD/MYR 4.17 4.15 4.16 4.14 4.13 4.12
EUR/PHP 56.35 56.78 57.65 58.47 59.44 60.17 USD/PHP 50.87 51.62 52.41 52.68 53.07 53.25
EUR/SGD 1.51 1.50 1.50 1.51 1.51 1.51 USD/SGD 1.36 1.36 1.36 1.36 1.35 1.34
EUR/TWD 33.74 33.55 33.33 33.30 33.26 33.90 USD/TWD 30.49 30.50 30.30 30.00 29.70 30.00
EUR/THB 33.38 33.44 33.55 33.97 34.16 34.47 USD/THB 30.19 30.40 30.50 30.60 30.50 30.50
Source: Bloomberg, ING

FX Outlook 2020 November 2019
63
Disclaimer This publication has been prepared by the Economic and Financial Analysis Division of ING Bank N.V. (“ING”) solely for
information purposes without regard to any particular user's investment objectives, financial situation, or means. ING forms
part of ING Group (being for this purpose ING Group N.V. and its subsidiary and affiliated companies). The information in the
publication is not an investment recommendation and it is not investment, legal or tax advice or an offer or solicitation to
purchase or sell any financial instrument. Reasonable care has been taken to ensure that this publication is not untrue or
misleading when published, but ING does not represent that it is accurate or complete. ING does not accept any liability for
any direct, indirect or consequential loss arising from any use of this publication. Unless otherwise stated, any views,
forecasts, or estimates are solely those of the author(s), as of the date of the publication and are subject to change without
notice.
The distribution of this publication may be restricted by law or regulation in different jurisdictions and persons into whose
possession this publication comes should inform themselves about, and observe, such restrictions.
Copyright and database rights protection exists in this report and it may not be reproduced, distributed or published by any
person for any purpose without the prior express consent of ING. All rights are reserved. ING Bank N.V. is authorised by the
Dutch Central Bank and supervised by the European Central Bank (ECB), the Dutch Central Bank (DNB) and the Dutch
Authority for the Financial Markets (AFM). ING Bank N.V. is incorporated in the Netherlands (Trade Register no. 33031431
Amsterdam). In the United Kingdom this information is approved and/or communicated by ING Bank N.V., London Branch.
ING Bank N.V., London Branch is subject to limited regulation by the Financial Conduct Authority (FCA). ING Bank N.V., London
branch is registered in England (Registration number BR000341) at 8-10 Moorgate, London EC2 6DA. For US Investors: Any
person wishing to discuss this report or effect transactions in any security discussed herein should contact ING Financial
Markets LLC, which is a member of the NYSE, FINRA and SIPC and part of ING, and which has accepted responsibility for the
distribution of this report in the United States under applicable requirements.
Additional information is available on request. For more information about ING Group, please visit https://www.ing.com.