2020 cost of recruiting enrollment an undergraduate
TRANSCRIPT
© 2020 RNL | 2020 Cost of Recruiting an Undergraduate Student Report 1
ENROLLMENT2020 Cost of Recruiting an Undergraduate
Student ReportBenchmarking data for four-year colleges
and universities
ENROLLMENT
© 2020 RNL | 2020 Cost of Recruiting an Undergraduate Student Report 2
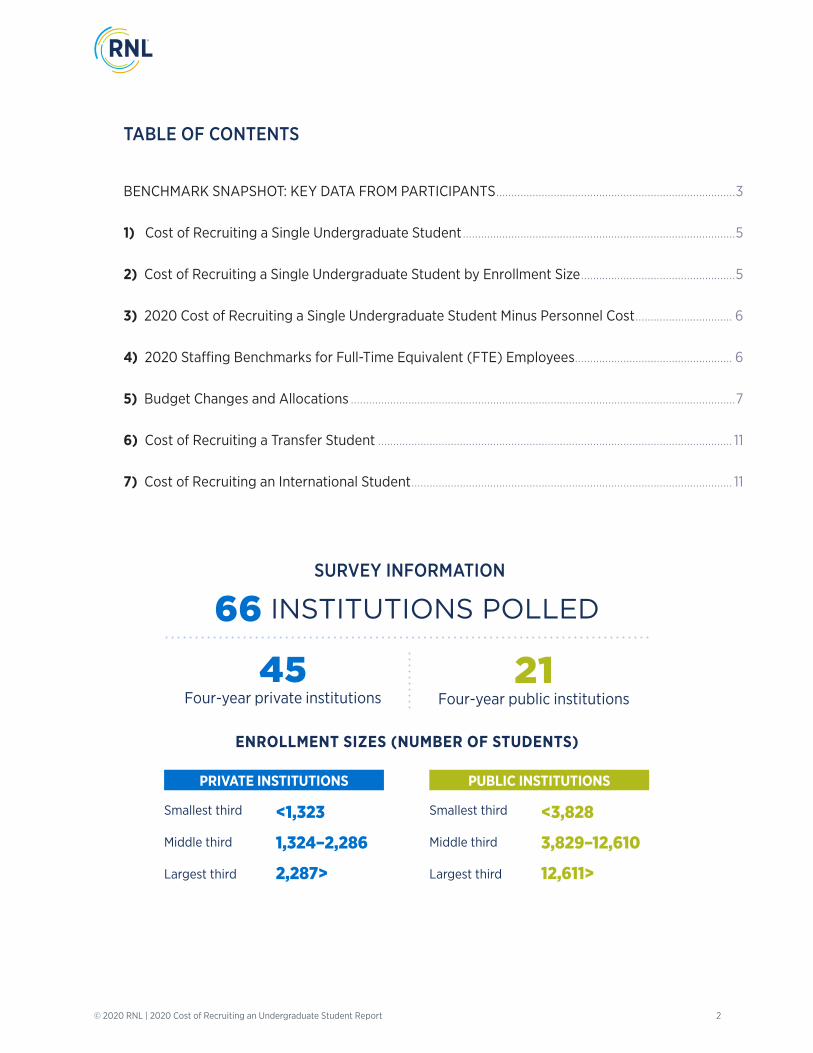
TABLE OF CONTENTS
BENCHMARK SNAPSHOT: KEY DATA FROM PARTICIPANTS ...............................................................................3
1) Cost of Recruiting a Single Undergraduate Student ..........................................................................................5
2) Cost of Recruiting a Single Undergraduate Student by Enrollment Size ...................................................5
3) 2020 Cost of Recruiting a Single Undergraduate Student Minus Personnel Cost ................................ 6
4) 2020 Staffing Benchmarks for Full-Time Equivalent (FTE) Employees .................................................... 6
5) Budget Changes and Allocations ...............................................................................................................................7
6) Cost of Recruiting a Transfer Student ..................................................................................................................... 11
7) Cost of Recruiting an International Student .......................................................................................................... 11
SURVEY INFORMATION
66 INSTITUTIONS POLLED
45 Four-year private institutions
21 Four-year public institutions
ENROLLMENT SIZES (NUMBER OF STUDENTS)
Smallest third
Middle third
Largest third
<1,323
1,324–2,286
2,287>
PRIVATE INSTITUTIONS
Smallest third
Middle third
Largest third
<3,828
3,829–12,610
12,611>
PUBLIC INSTITUTIONS
© 2020 RNL | 2020 Cost of Recruiting an Undergraduate Student Report 3
ENROLLMENT
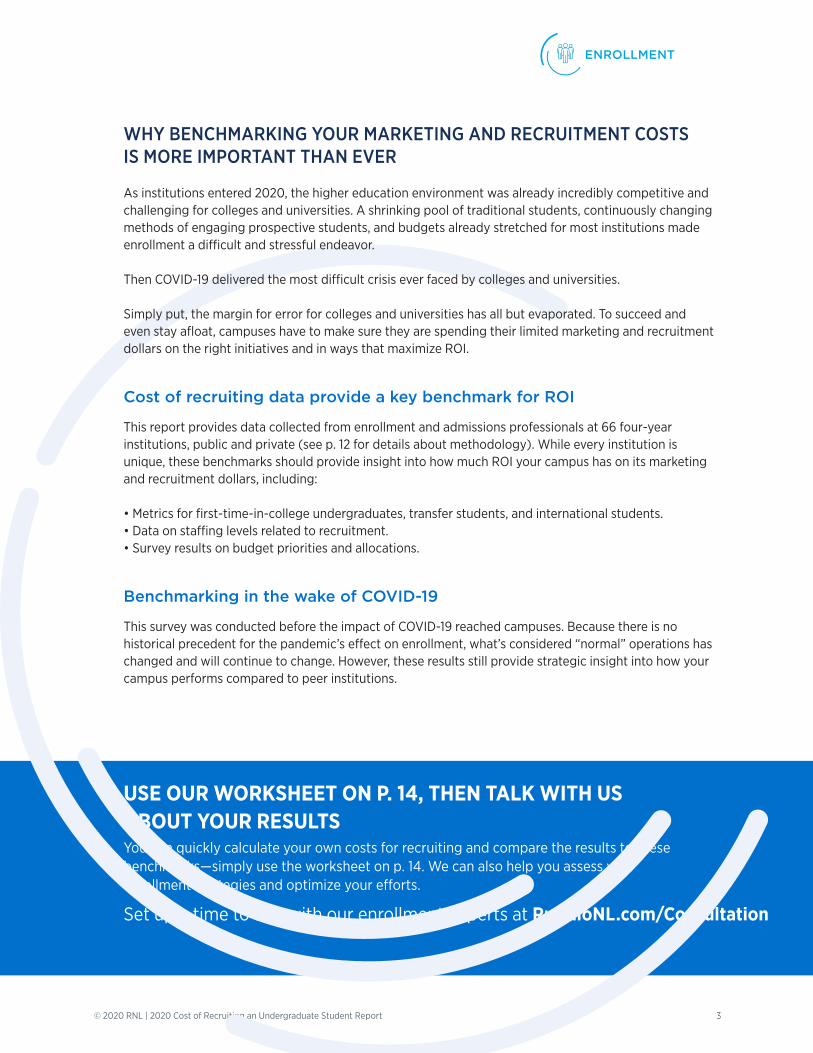
USE OUR WORKSHEET ON P. 14, THEN TALK WITH US ABOUT YOUR RESULTSYou can quickly calculate your own costs for recruiting and compare the results to these benchmarks—simply use the worksheet on p. 14. We can also help you assess your enrollment strategies and optimize your efforts.
Set up a time to talk with our enrollment experts at RuffaloNL.com/Consultation
WHY BENCHMARKING YOUR MARKETING AND RECRUITMENT COSTS IS MORE IMPORTANT THAN EVER
As institutions entered 2020, the higher education environment was already incredibly competitive and challenging for colleges and universities. A shrinking pool of traditional students, continuously changing methods of engaging prospective students, and budgets already stretched for most institutions made enrollment a difficult and stressful endeavor.
Then COVID-19 delivered the most difficult crisis ever faced by colleges and universities.
Simply put, the margin for error for colleges and universities has all but evaporated. To succeed and even stay afloat, campuses have to make sure they are spending their limited marketing and recruitment dollars on the right initiatives and in ways that maximize ROI.
Cost of recruiting data provide a key benchmark for ROI
This report provides data collected from enrollment and admissions professionals at 66 four-year institutions, public and private (see p. 12 for details about methodology). While every institution is unique, these benchmarks should provide insight into how much ROI your campus has on its marketing and recruitment dollars, including:
• Metrics for first-time-in-college undergraduates, transfer students, and international students.• Data on staffing levels related to recruitment.• Survey results on budget priorities and allocations.
Benchmarking in the wake of COVID-19
This survey was conducted before the impact of COVID-19 reached campuses. Because there is no historical precedent for the pandemic’s effect on enrollment, what’s considered “normal” operations has changed and will continue to change. However, these results still provide strategic insight into how your campus performs compared to peer institutions.
© 2020 RNL | 2020 Cost of Recruiting an Undergraduate Student Report 4
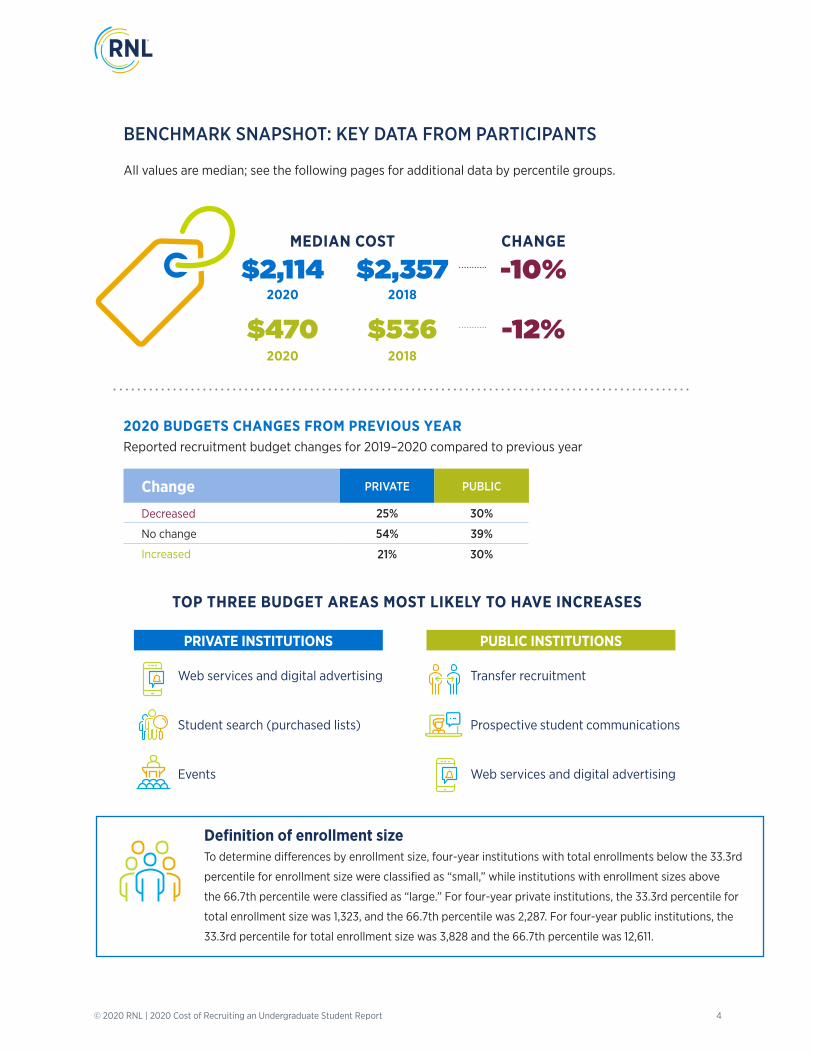
BENCHMARK SNAPSHOT: KEY DATA FROM PARTICIPANTS
All values are median; see the following pages for additional data by percentile groups.
2020 BUDGETS CHANGES FROM PREVIOUS YEARReported recruitment budget changes for 2019–2020 compared to previous year
Change PRIVATE PUBLIC
Decreased 25% 30%
No change 54% 39%
Increased 21% 30%
TOP THREE BUDGET AREAS MOST LIKELY TO HAVE INCREASES
Web services and digital advertising
Student search (purchased lists)
Events
PRIVATE INSTITUTIONS
Transfer recruitment
Prospective student communications
Web services and digital advertising
PUBLIC INSTITUTIONS
Definition of enrollment size To determine differences by enrollment size, four-year institutions with total enrollments below the 33.3rd
percentile for enrollment size were classified as “small,” while institutions with enrollment sizes above
the 66.7th percentile were classified as “large.” For four-year private institutions, the 33.3rd percentile for
total enrollment size was 1,323, and the 66.7th percentile was 2,287. For four-year public institutions, the
33.3rd percentile for total enrollment size was 3,828 and the 66.7th percentile was 12,611.
$2,1142020
$2,3572018
$4702020
$5362018
MEDIAN COST
-10%CHANGE
-12%
© 2020 RNL | 2020 Cost of Recruiting an Undergraduate Student Report 5
ENROLLMENT
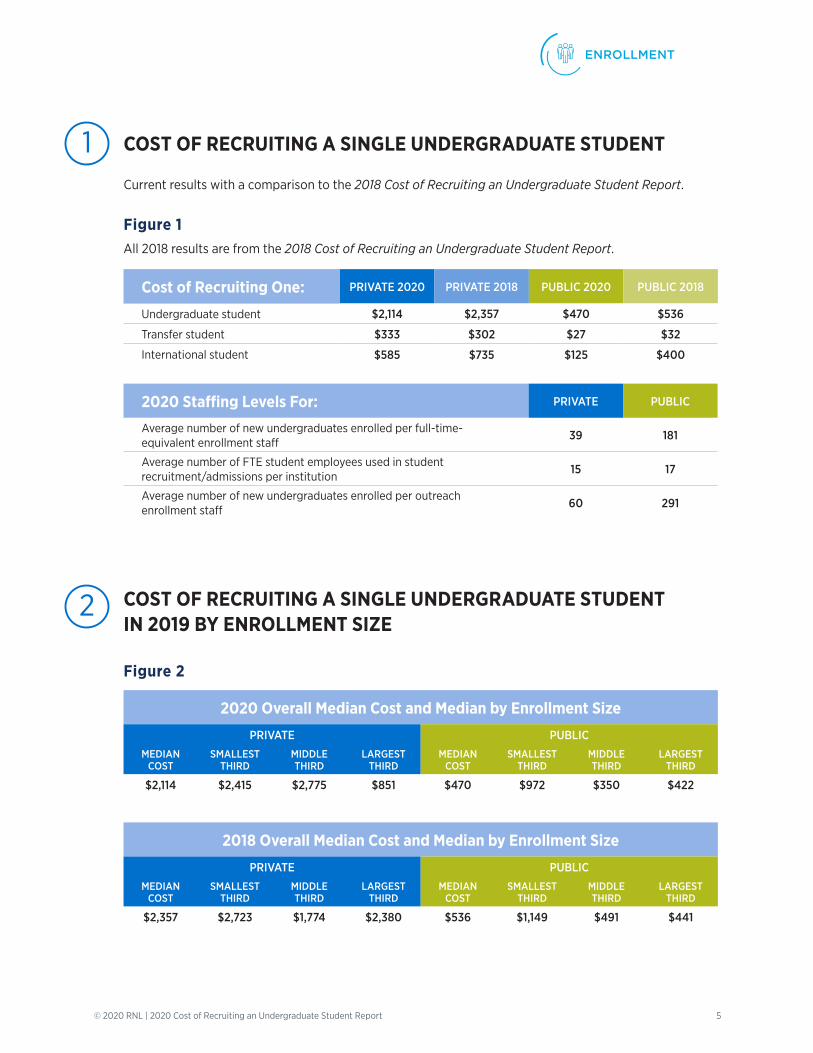
COST OF RECRUITING A SINGLE UNDERGRADUATE STUDENT
Current results with a comparison to the 2018 Cost of Recruiting an Undergraduate Student Report.
1
COST OF RECRUITING A SINGLE UNDERGRADUATE STUDENT IN 2019 BY ENROLLMENT SIZE
2
Figure 2
2018 Overall Median Cost and Median by Enrollment Size
PRIVATE PUBLICMEDIAN
COSTSMALLEST
THIRDMIDDLE THIRD
LARGEST THIRD
MEDIAN COST
SMALLEST THIRD
MIDDLE THIRD
LARGEST THIRD
$2,357 $2,723 $1,774 $2,380 $536 $1,149 $491 $441
Cost of Recruiting One: PRIVATE 2020 PRIVATE 2018 PUBLIC 2020 PUBLIC 2018
Undergraduate student $2,114 $2,357 $470 $536
Transfer student $333 $302 $27 $32
International student $585 $735 $125 $400
All 2018 results are from the 2018 Cost of Recruiting an Undergraduate Student Report.
2020 Staffing Levels For: PRIVATE PUBLIC
Average number of new undergraduates enrolled per full-time-equivalent enrollment staff
39 181
Average number of FTE student employees used in student recruitment/admissions per institution
15 17
Average number of new undergraduates enrolled per outreach enrollment staff 60 291
Figure 1
2020 Overall Median Cost and Median by Enrollment Size
PRIVATE PUBLICMEDIAN
COSTSMALLEST
THIRDMIDDLE THIRD
LARGEST THIRD
MEDIAN COST
SMALLEST THIRD
MIDDLE THIRD
LARGEST THIRD
$2,114 $2,415 $2,775 $851 $470 $972 $350 $422
© 2020 RNL | 2020 Cost of Recruiting an Undergraduate Student Report 6
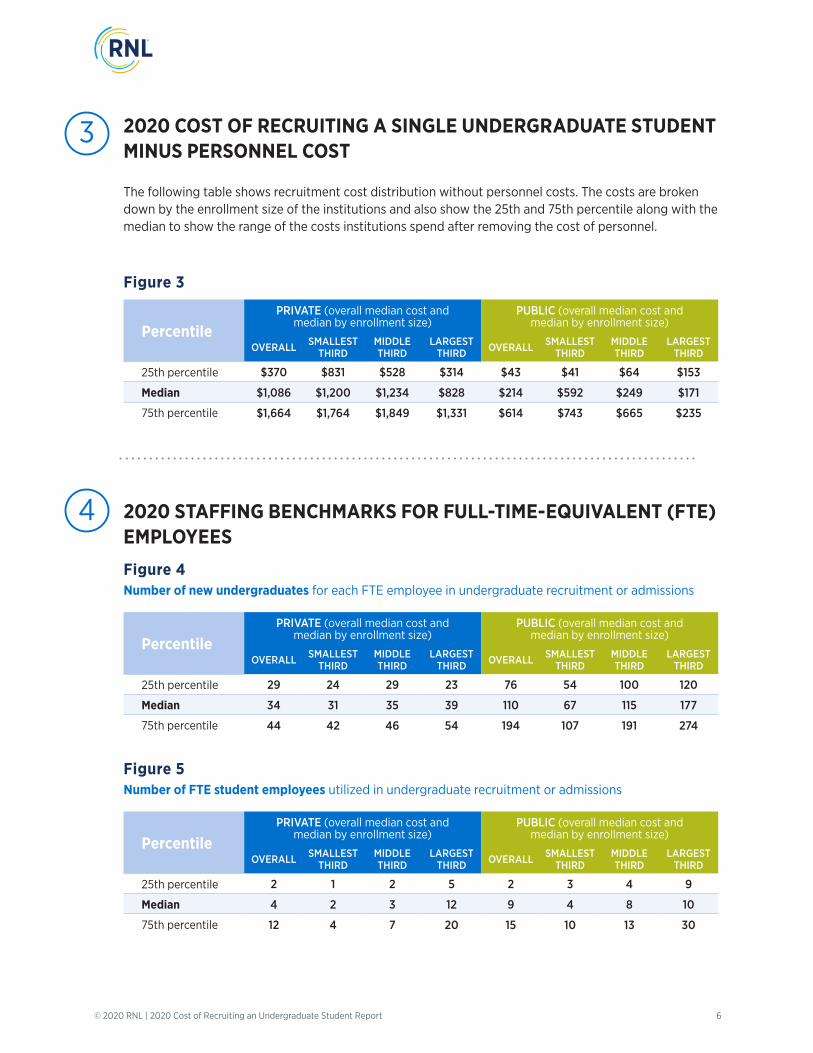
2020 COST OF RECRUITING A SINGLE UNDERGRADUATE STUDENT MINUS PERSONNEL COST
The following table shows recruitment cost distribution without personnel costs. The costs are broken down by the enrollment size of the institutions and also show the 25th and 75th percentile along with the median to show the range of the costs institutions spend after removing the cost of personnel.
3
PercentilePRIVATE (overall median cost and
median by enrollment size)PUBLIC (overall median cost and
median by enrollment size)
OVERALL SMALLEST THIRD
MIDDLE THIRD
LARGEST THIRD OVERALL SMALLEST
THIRDMIDDLE THIRD
LARGEST THIRD
25th percentile $370 $831 $528 $314 $43 $41 $64 $153
Median $1,086 $1,200 $1,234 $828 $214 $592 $249 $171
75th percentile $1,664 $1,764 $1,849 $1,331 $614 $743 $665 $235
Figure 3
2020 STAFFING BENCHMARKS FOR FULL-TIME-EQUIVALENT (FTE) EMPLOYEES
4
PercentilePRIVATE (overall median cost and
median by enrollment size)PUBLIC (overall median cost and
median by enrollment size)
OVERALL SMALLEST THIRD
MIDDLE THIRD
LARGEST THIRD OVERALL SMALLEST
THIRDMIDDLE THIRD
LARGEST THIRD
25th percentile 29 24 29 23 76 54 100 120
Median 34 31 35 39 110 67 115 177
75th percentile 44 42 46 54 194 107 191 274
Figure 4 Number of new undergraduates for each FTE employee in undergraduate recruitment or admissions
PercentilePRIVATE (overall median cost and
median by enrollment size)PUBLIC (overall median cost and
median by enrollment size)
OVERALL SMALLEST THIRD
MIDDLE THIRD
LARGEST THIRD OVERALL SMALLEST
THIRDMIDDLE THIRD
LARGEST THIRD
25th percentile 2 1 2 5 2 3 4 9
Median 4 2 3 12 9 4 8 10
75th percentile 12 4 7 20 15 10 13 30
Figure 5 Number of FTE student employees utilized in undergraduate recruitment or admissions
© 2020 RNL | 2020 Cost of Recruiting an Undergraduate Student Report 7
ENROLLMENT
PercentilePRIVATE (overall median cost and
median by enrollment size)PUBLIC (overall median cost and
median by enrollment size)
OVERALL SMALLEST THIRD
MIDDLE THIRD
LARGEST THIRD OVERALL SMALLEST
THIRDMIDDLE THIRD
LARGEST THIRD
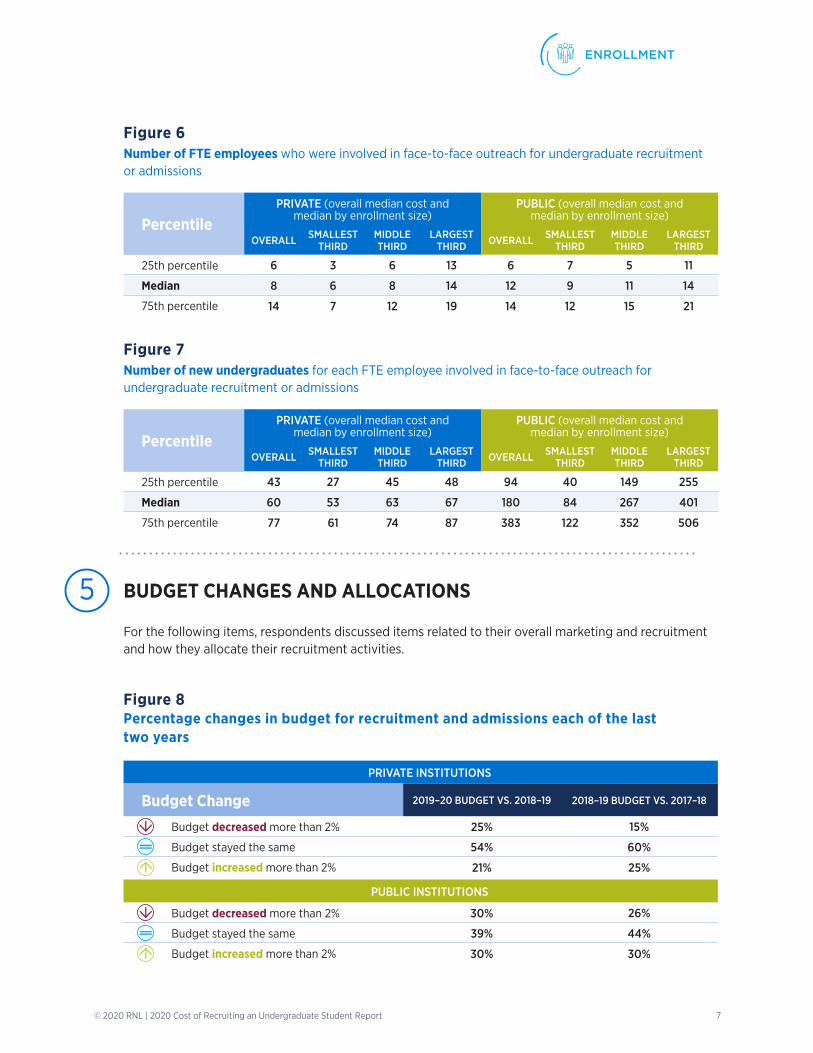
25th percentile 6 3 6 13 6 7 5 11
Median 8 6 8 14 12 9 11 14
75th percentile 14 7 12 19 14 12 15 21
Figure 6 Number of FTE employees who were involved in face-to-face outreach for undergraduate recruitment or admissions
PercentilePRIVATE (overall median cost and
median by enrollment size)PUBLIC (overall median cost and
median by enrollment size)
OVERALL SMALLEST THIRD
MIDDLE THIRD
LARGEST THIRD OVERALL SMALLEST
THIRDMIDDLE THIRD
LARGEST THIRD
25th percentile 43 27 45 48 94 40 149 255
Median 60 53 63 67 180 84 267 401
75th percentile 77 61 74 87 383 122 352 506
Figure 7 Number of new undergraduates for each FTE employee involved in face-to-face outreach for undergraduate recruitment or admissions
BUDGET CHANGES AND ALLOCATIONS
For the following items, respondents discussed items related to their overall marketing and recruitment and how they allocate their recruitment activities.
5
Figure 8 Percentage changes in budget for recruitment and admissions each of the last two years
PRIVATE INSTITUTIONS
Budget Change 2019–20 BUDGET VS. 2018–19 2018–19 BUDGET VS. 2017–18
Budget decreased more than 2% 25% 15%
Budget stayed the same 54% 60%
Budget increased more than 2% 21% 25%
PUBLIC INSTITUTIONS
Budget decreased more than 2% 30% 26%
Budget stayed the same 39% 44%
Budget increased more than 2% 30% 30%
© 2020 RNL | 2020 Cost of Recruiting an Undergraduate Student Report 8
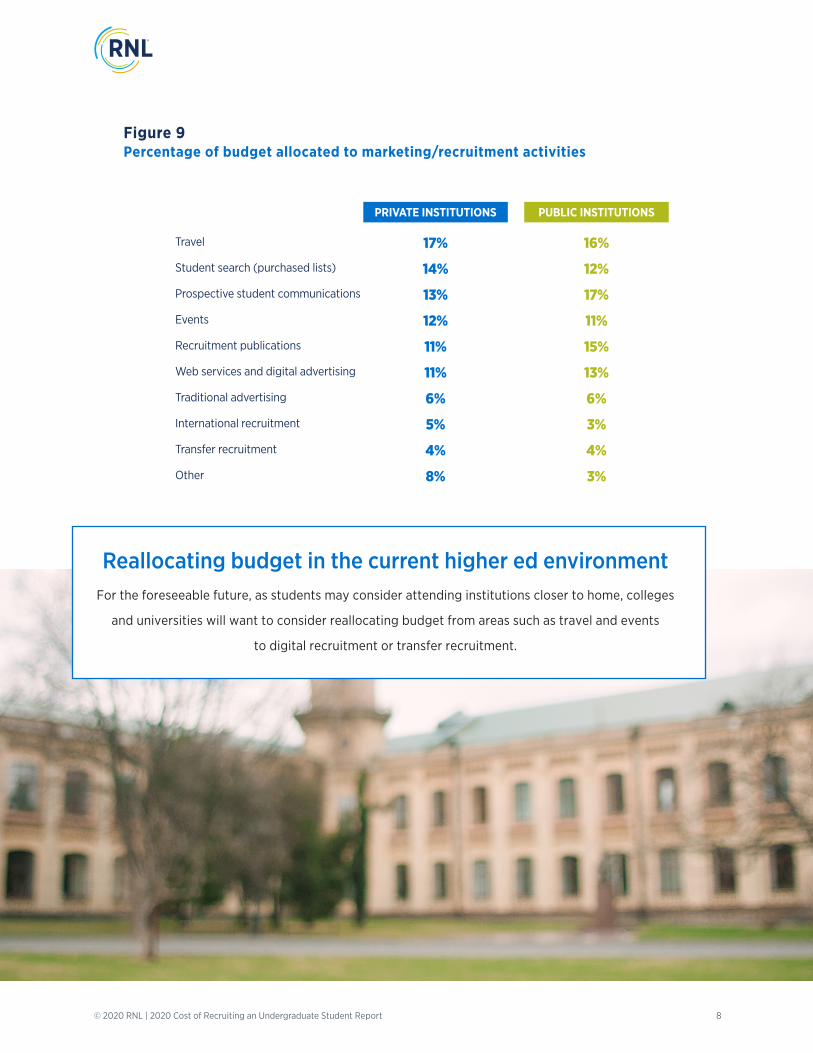
Travel
Student search (purchased lists)
Prospective student communications
Events
Recruitment publications
Web services and digital advertising
Traditional advertising
International recruitment
Transfer recruitment
Other
17%
14%
13%
12%
11%
11%
6%
5%
4%
8%
PRIVATE INSTITUTIONS
Figure 9 Percentage of budget allocated to marketing/recruitment activities
16%
12%
17%
11%
15%
13%
6%
3%
4%
3%
PUBLIC INSTITUTIONS
Reallocating budget in the current higher ed environmentFor the foreseeable future, as students may consider attending institutions closer to home, colleges
and universities will want to consider reallocating budget from areas such as travel and events
to digital recruitment or transfer recruitment.
© 2020 RNL | 2020 Cost of Recruiting an Undergraduate Student Report 9
ENROLLMENT
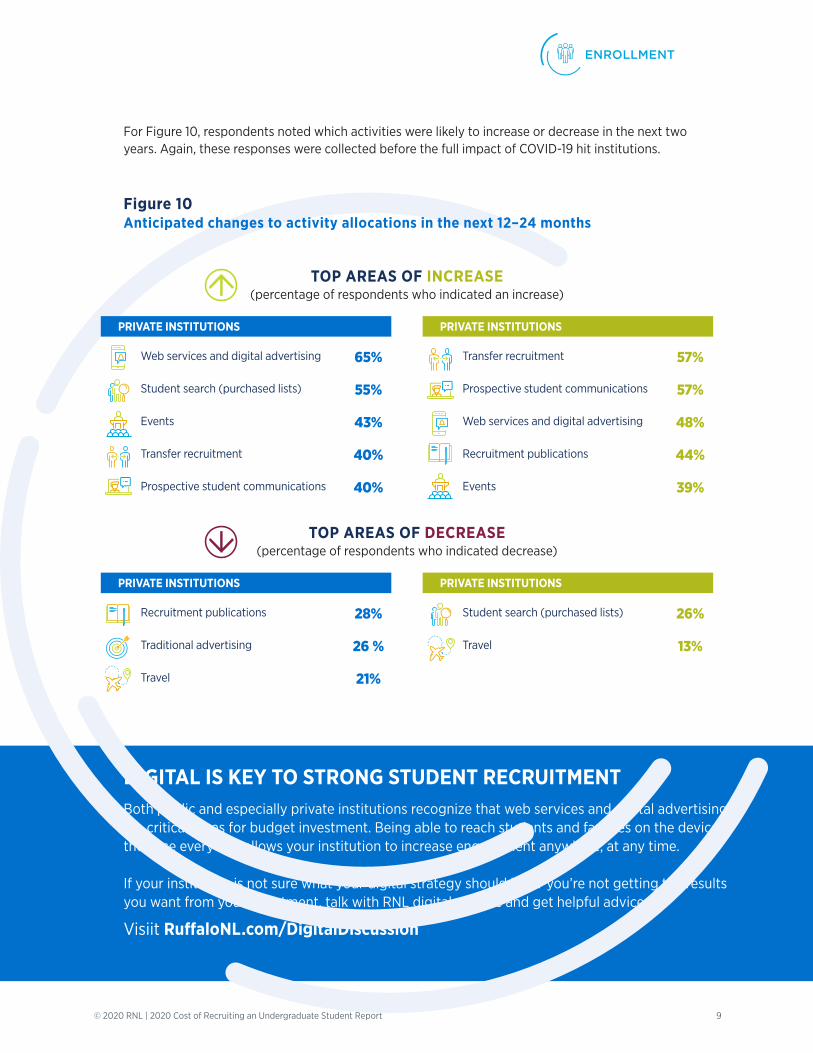
DIGITAL IS KEY TO STRONG STUDENT RECRUITMENT Both public and especially private institutions recognize that web services and digital advertising are critical areas for budget investment. Being able to reach students and families on the devices they use every day allows your institution to increase engagement anywhere, at any time.
If your institution is not sure what your digital strategy should be or you’re not getting the results you want from your investment, talk with RNL digital experts and get helpful advice.
Visiit RuffaloNL.com/DigitalDiscussion
PRIVATE INSTITUTIONS
For Figure 10, respondents noted which activities were likely to increase or decrease in the next two years. Again, these responses were collected before the full impact of COVID-19 hit institutions.
Figure 10 Anticipated changes to activity allocations in the next 12–24 months
TOP AREAS OF INCREASE (percentage of respondents who indicated an increase)
57%
57%
48%
44%
39%
PRIVATE INSTITUTIONS
26%
13%
Web services and digital advertising
Student search (purchased lists)
Events
Transfer recruitment
Prospective student communications
65%
55%
43%
40%
40%
Transfer recruitment
Prospective student communications
Web services and digital advertising
Recruitment publications
Events
Recruitment publications
Traditional advertising
Travel
28%
26 %
21%
PRIVATE INSTITUTIONS
TOP AREAS OF DECREASE (percentage of respondents who indicated decrease)
Student search (purchased lists)
Travel
PRIVATE INSTITUTIONS
© 2020 RNL | 2020 Cost of Recruiting an Undergraduate Student Report 10
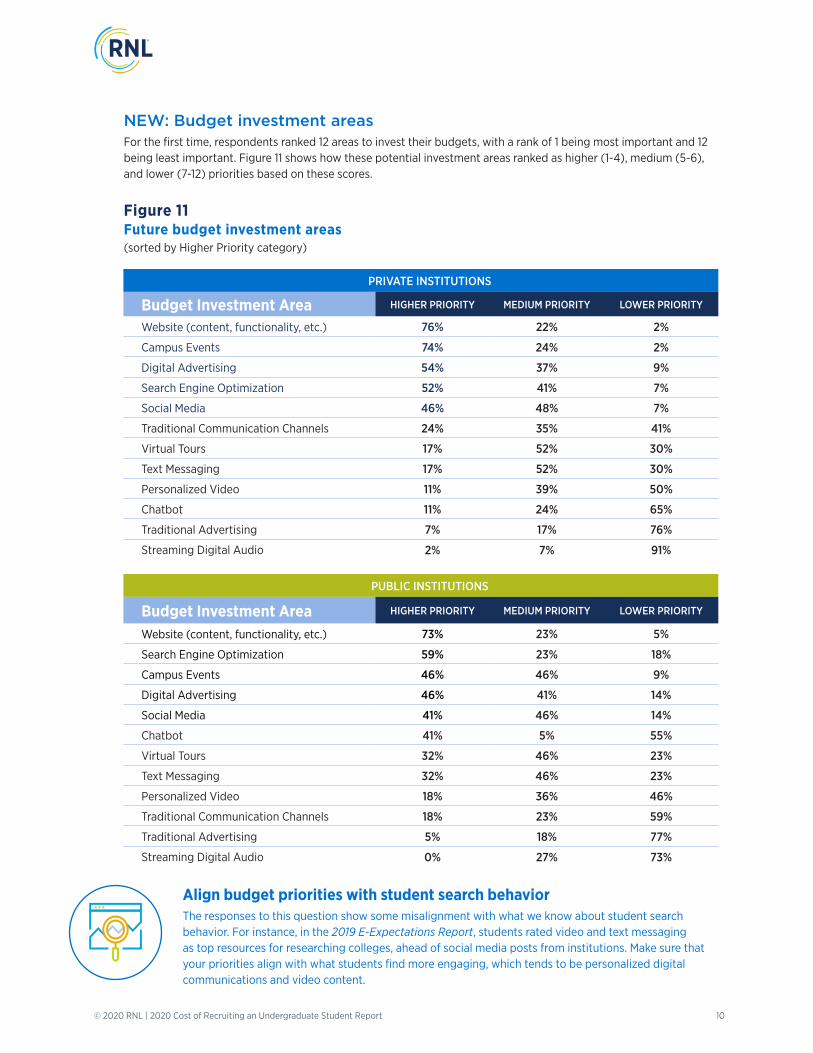
NEW: Budget investment areas For the first time, respondents ranked 12 areas to invest their budgets, with a rank of 1 being most important and 12 being least important. Figure 11 shows how these potential investment areas ranked as higher (1-4), medium (5-6), and lower (7-12) priorities based on these scores.
Figure 11 Future budget investment areas (sorted by Higher Priority category)
PRIVATE INSTITUTIONS
Budget Investment Area HIGHER PRIORITY MEDIUM PRIORITY LOWER PRIORITY
Website (content, functionality, etc.) 76% 22% 2%
Campus Events 74% 24% 2%
Digital Advertising 54% 37% 9%
Search Engine Optimization 52% 41% 7%
Social Media 46% 48% 7%
Traditional Communication Channels 24% 35% 41%
Virtual Tours 17% 52% 30%
Text Messaging 17% 52% 30%
Personalized Video 11% 39% 50%
Chatbot 11% 24% 65%
Traditional Advertising 7% 17% 76%
Streaming Digital Audio 2% 7% 91%
PUBLIC INSTITUTIONS
Budget Investment Area HIGHER PRIORITY MEDIUM PRIORITY LOWER PRIORITY
Website (content, functionality, etc.) 73% 23% 5%
Search Engine Optimization 59% 23% 18%
Campus Events 46% 46% 9%
Digital Advertising 46% 41% 14%
Social Media 41% 46% 14%
Chatbot 41% 5% 55%
Virtual Tours 32% 46% 23%
Text Messaging 32% 46% 23%
Personalized Video 18% 36% 46%
Traditional Communication Channels 18% 23% 59%
Traditional Advertising 5% 18% 77%
Streaming Digital Audio 0% 27% 73%
Align budget priorities with student search behavior The responses to this question show some misalignment with what we know about student search behavior. For instance, in the 2019 E-Expectations Report, students rated video and text messaging as top resources for researching colleges, ahead of social media posts from institutions. Make sure that your priorities align with what students find more engaging, which tends to be personalized digital communications and video content.
© 2020 RNL | 2020 Cost of Recruiting an Undergraduate Student Report 11
ENROLLMENT
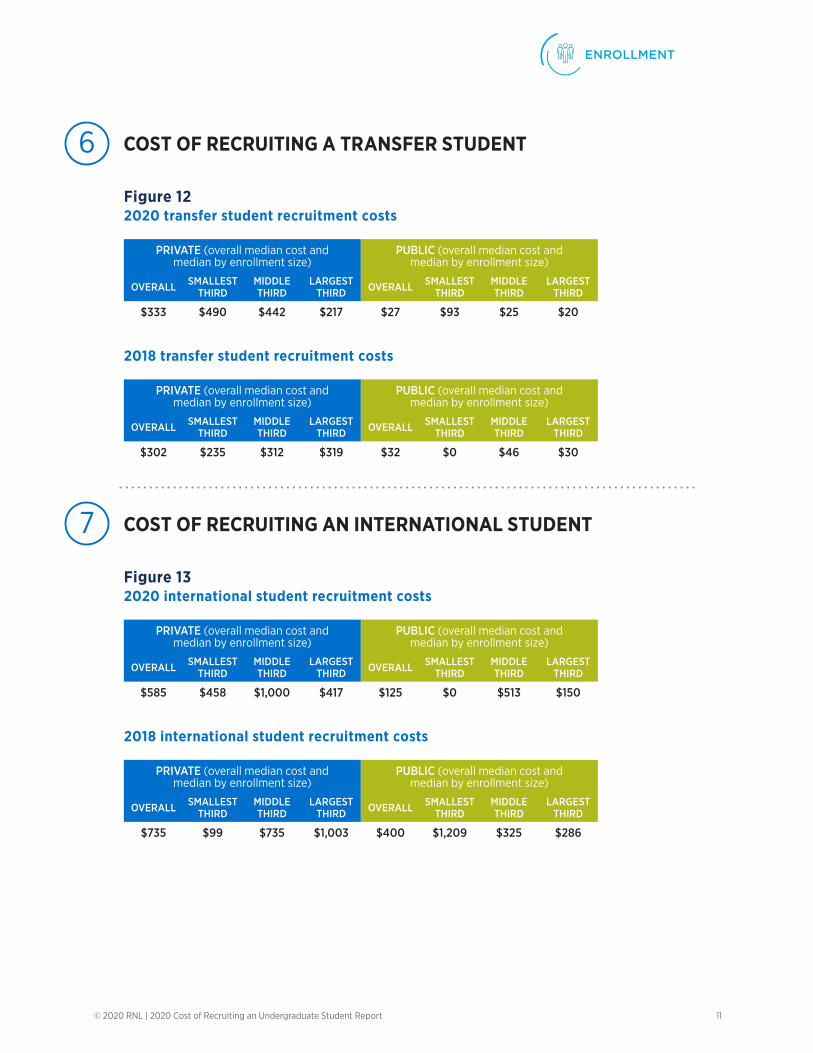
COST OF RECRUITING A TRANSFER STUDENT 6
PRIVATE (overall median cost and median by enrollment size)
PUBLIC (overall median cost and median by enrollment size)
OVERALL SMALLEST THIRD
MIDDLE THIRD
LARGEST THIRD OVERALL SMALLEST
THIRDMIDDLE THIRD
LARGEST THIRD
$333 $490 $442 $217 $27 $93 $25 $20
Figure 12 2020 transfer student recruitment costs
PRIVATE (overall median cost and median by enrollment size)
PUBLIC (overall median cost and median by enrollment size)
OVERALL SMALLEST THIRD
MIDDLE THIRD
LARGEST THIRD OVERALL SMALLEST
THIRDMIDDLE THIRD
LARGEST THIRD
$302 $235 $312 $319 $32 $0 $46 $30
2018 transfer student recruitment costs
COST OF RECRUITING AN INTERNATIONAL STUDENT 7
PRIVATE (overall median cost and median by enrollment size)
PUBLIC (overall median cost and median by enrollment size)
OVERALL SMALLEST THIRD
MIDDLE THIRD
LARGEST THIRD OVERALL SMALLEST
THIRDMIDDLE THIRD
LARGEST THIRD
$585 $458 $1,000 $417 $125 $0 $513 $150
Figure 13 2020 international student recruitment costs
PRIVATE (overall median cost and median by enrollment size)
PUBLIC (overall median cost and median by enrollment size)
OVERALL SMALLEST THIRD
MIDDLE THIRD
LARGEST THIRD OVERALL SMALLEST
THIRDMIDDLE THIRD
LARGEST THIRD
$735 $99 $735 $1,003 $400 $1,209 $325 $286
2018 international student recruitment costs
© 2020 RNL | 2020 Cost of Recruiting an Undergraduate Student Report 12
KEY TAKEAWAYS AND OBSERVATIONS
These benchmarks provide useful comparisons between your institution and your peers. They are especially useful for identifying areas where your institution could be more efficient or cost-effective.
Look for greater increases in efficiency if your costs or staff levels are at higher levels. If you trend significantly above the median with recruiting costs or staffing levels, look for ways to increase ROI: more targeted list purchases, better applicant cultivation, and especially increasing yield rates.
Make sure you are not underfunded or understaffed. If you are struggling to meet enrollment goals and are in the bottom quartile for costs or staffing, you may need to invest more resources to compete effectively and manage your recruitment efforts.
Align your budgeting with the way students search today. The participants in this poll prioritized web, SEO, and digital advertising, which is where campuses should prioritize their efforts. But they gave less importance to video, texting, and other digital communications students use every day—communications that are also easily tracked, measured, and optimized.
Strengthen transfer student recruitment efforts. With domestic enrollment flattening, international recruitment disrupted, and more students considering transferring for a variety of reasons, it’s more important than ever to step up your strategies and spending if you’re going to compete for transfer students.
Be prepared to pivot in a post-pandemic environment. With the massive disruption from COVID-19, make sure your institution can pivot on recruitment efforts (from in-person to digital) and learning continuity (in-person, hybrid, and online only) so you can keep engaging students and deliver the academic experience they expect.
METHODOLOGY
Data in this report reflect responses from enrollment and admissions officers at 66 nonprofit four-year colleges and and universities. Respondents participated in the RNL national electronic poll of undergraduate recruiting costs at the end of 2019.
To save time completing the poll, respondents were given the option to estimate all outlays and to calculate approximate employee benefits as a percentage of salary. Respondents were also given this hint: The total budget figure requested is usually the sum of the admissions/recruitment office budget, including events and any costs associated with recruiting and admissions that are covered by departments outside the admissions office such as marketing and communications.
Standard descriptive statistics (such as sample means) were used to analyze the results of the poll for central tendency and variation. Due to the relatively small sample size, the results should read as indicators.
1
2
3
4
5
© 2020 RNL | 2020 Cost of Recruiting an Undergraduate Student Report 13
ENROLLMENT
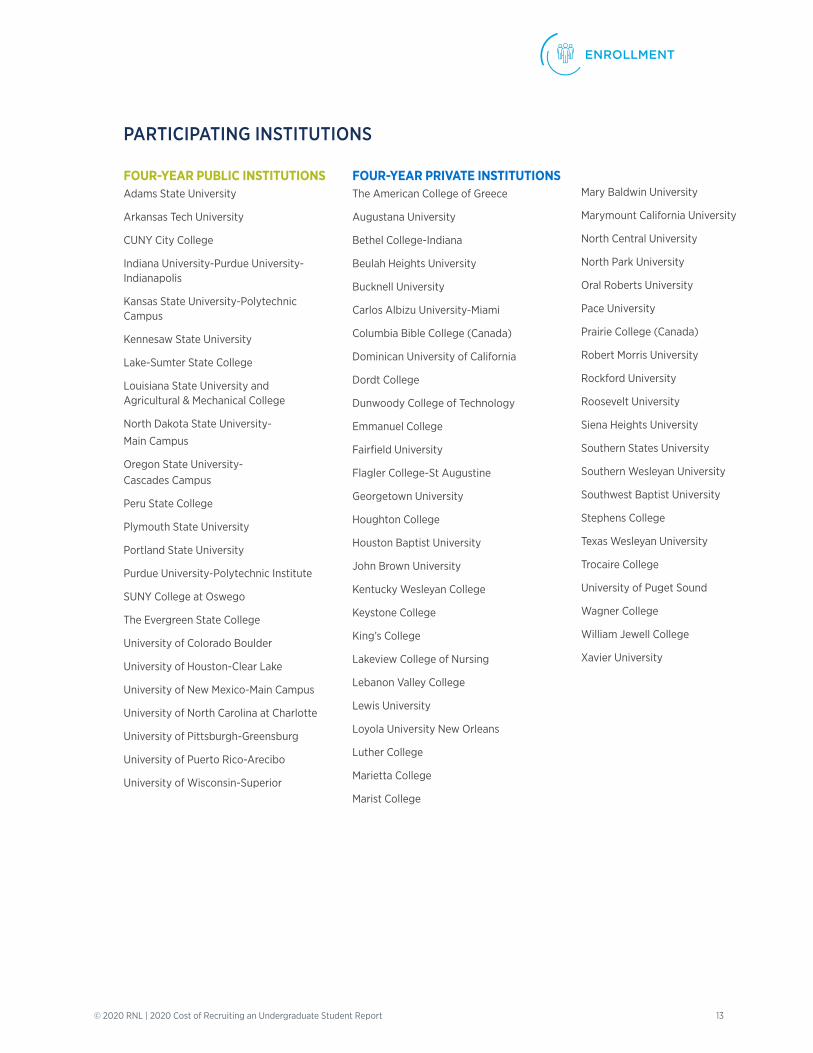
PARTICIPATING INSTITUTIONS
FOUR-YEAR PUBLIC INSTITUTIONS
Adams State University
Arkansas Tech University
CUNY City College
Indiana University-Purdue University- Indianapolis
Kansas State University-Polytechnic Campus
Kennesaw State University
Lake-Sumter State College
Louisiana State University and Agricultural & Mechanical College
North Dakota State University-
Main Campus
Oregon State University- Cascades Campus
Peru State College
Plymouth State University
Portland State University
Purdue University-Polytechnic Institute
SUNY College at Oswego
The Evergreen State College
University of Colorado Boulder
University of Houston-Clear Lake
University of New Mexico-Main Campus
University of North Carolina at Charlotte
University of Pittsburgh-Greensburg
University of Puerto Rico-Arecibo
University of Wisconsin-Superior
FOUR-YEAR PRIVATE INSTITUTIONS
The American College of Greece
Augustana University
Bethel College-Indiana
Beulah Heights University
Bucknell University
Carlos Albizu University-Miami
Columbia Bible College (Canada)
Dominican University of California
Dordt College
Dunwoody College of Technology
Emmanuel College
Fairfield University
Flagler College-St Augustine
Georgetown University
Houghton College
Houston Baptist University
John Brown University
Kentucky Wesleyan College
Keystone College
King’s College
Lakeview College of Nursing
Lebanon Valley College
Lewis University
Loyola University New Orleans
Luther College
Marietta College
Marist College
Mary Baldwin University
Marymount California University
North Central University
North Park University
Oral Roberts University
Pace University
Prairie College (Canada)
Robert Morris University
Rockford University
Roosevelt University
Siena Heights University
Southern States University
Southern Wesleyan University
Southwest Baptist University
Stephens College
Texas Wesleyan University
Trocaire College
University of Puget Sound
Wagner College
William Jewell College
Xavier University
© 2020 RNL | 2020 Cost of Recruiting an Undergraduate Student Report 14
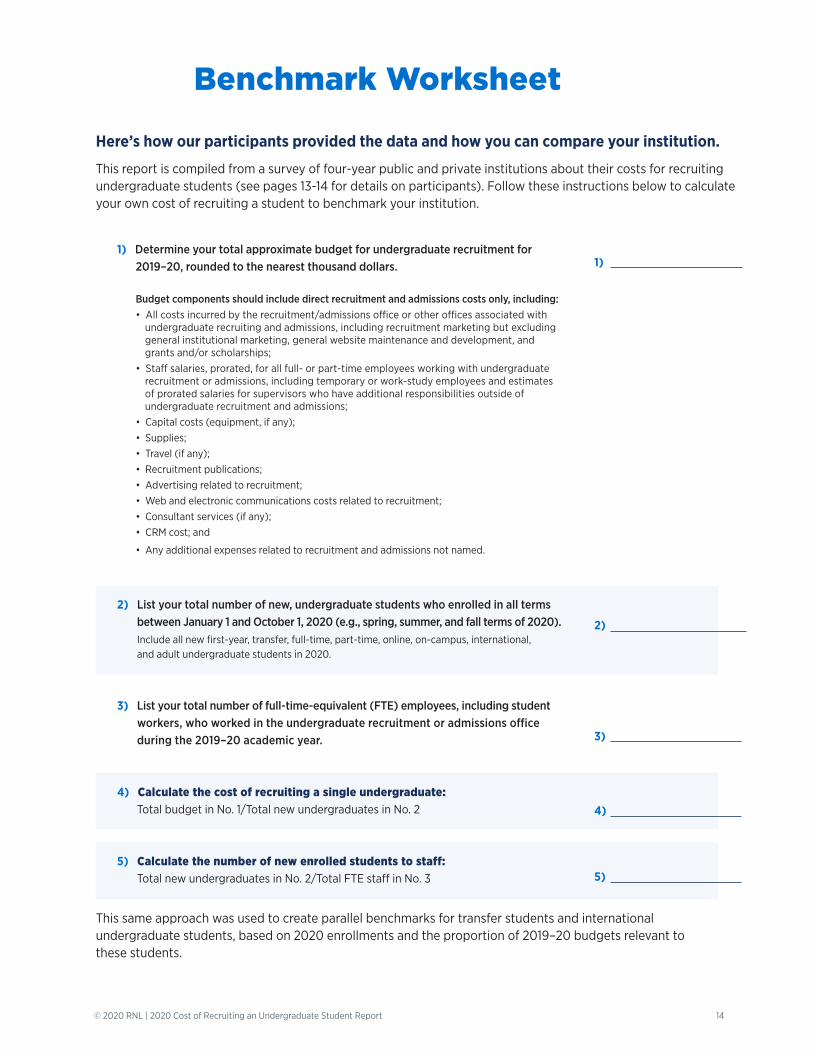
Here’s how our participants provided the data and how you can compare your institution.
This report is compiled from a survey of four-year public and private institutions about their costs for recruiting undergraduate students (see pages 13-14 for details on participants). Follow these instructions below to calculate your own cost of recruiting a student to benchmark your institution.
1) Determine your total approximate budget for undergraduate recruitment for 2019–20, rounded to the nearest thousand dollars.
Budget components should include direct recruitment and admissions costs only, including:• All costs incurred by the recruitment/admissions office or other offices associated with
undergraduate recruiting and admissions, including recruitment marketing but excluding general institutional marketing, general website maintenance and development, and grants and/or scholarships;
• Staff salaries, prorated, for all full- or part-time employees working with undergraduate recruitment or admissions, including temporary or work-study employees and estimates of prorated salaries for supervisors who have additional responsibilities outside of undergraduate recruitment and admissions;
• Capital costs (equipment, if any);• Supplies;• Travel (if any);• Recruitment publications;• Advertising related to recruitment;• Web and electronic communications costs related to recruitment;• Consultant services (if any);• CRM cost; and
• Any additional expenses related to recruitment and admissions not named.
2) List your total number of new, undergraduate students who enrolled in all terms between January 1 and October 1, 2020 (e.g., spring, summer, and fall terms of 2020). Include all new first-year, transfer, full-time, part-time, online, on-campus, international, and adult undergraduate students in 2020.
3) List your total number of full-time-equivalent (FTE) employees, including student workers, who worked in the undergraduate recruitment or admissions office during the 2019–20 academic year.
4) Calculate the cost of recruiting a single undergraduate: Total budget in No. 1/Total new undergraduates in No. 2
5) Calculate the number of new enrolled students to staff: Total new undergraduates in No. 2/Total FTE staff in No. 3
1)
2)
3)
4)
5)
This same approach was used to create parallel benchmarks for transfer students and international undergraduate students, based on 2020 enrollments and the proportion of 2019–20 budgets relevant to these students.
Benchmark Worksheet
© 2020 RNL | 2020 Cost of Recruiting an Undergraduate Student Report 15
ENROLLMENT
Visit RuffaloNL.com/Enrollment
Email [email protected]
Call 800.876.1117
How to cite this report RNL (2020). 2020 Cost of Recruiting an Undergraduate Student Report. Cedar Rapids, Iowa: Ruffalo Noel Levitz. Available at RuffaloNL.com/Recruiting2020.
All material in this document is copyright © 2020 by Ruffalo Noel Levitz. Permission is required to redistribute information from Ruffalo Noel Levitz either in print or electronically.
ABOUT RNL
RNL is the leading provider of higher education enrollment, student success, and fundraising solutions. The firm serves more than 1,900 colleges and universities through data-driven solutions focused on the entire lifecycle of enrollment and fundraising, assuring students find the right program, graduate on time, secure their first job in their chosen field, and give back to support the next generation. With a deep knowledge of the industry, RNL provides institutions the ability to scale their efforts by tapping into a community of support and resources.
TAKE THE NEXT STEP TOWARD A STRONGER ENROLLMENT STRATEGY. TALK WITH RNL’S ENROLLMENT EXPERTS.
More than 3,000 colleges and universities have partnered with RNL over the
last 50 years. They turn to us to help assess their enrollment strategies, optimize their
outreach, and bring in the classes they want.
Let’s talk about how you can reach your objectives and keep your campus on a path to success. Visit RuffaloNL.com/Consulation