2020 caqh index
TRANSCRIPT

© 2018 CAQH, All Rights Reserved.
2020 CAQH
Index
Closing the Gap: The
Industry Continues to
Improve, But Opportunities
for Automation Remain
February 10, 2021
April Todd, SVP CORE and
Explorations
Kristine Burnaska, Director
Research and Measurement

© 2018 CAQH, All Rights Reserved.
▪ Today’s session is being recorded.
− All attendees will receive a link to the recording after the
webinar.
▪ Your phones will be muted during the webinar.
▪ Throughout the session, you may communicate a
question via the questions panel.
Questions about CAQH tools and applications can be
directed to CAQH via the questions panel on the right
side of the GoToWebinar desktop
Logistics: How to Participate in Today’s Session
2

© 2018 CAQH, All Rights Reserved.
▪ 2020 CAQH Index Overview
▪ High-Level Findings
▪ Detailed Findings
▪ Call to Action
Agenda
3

© 2018 CAQH, All Rights Reserved.
2020 CAQH Index Overview
4

© 2018 CAQH, All Rights Reserved.
What Is the CAQH Index?
A national benchmarking survey.
▪ Measures adoption of fully electronic administrative transactions.
▪ Estimates cost and time savings opportunities.
▪ Estimates partially electronic portal use.
▪ Estimates costs avoided and spend.
Tool to track and monitor industry progress.
▪ Tracks industry progress in the ongoing transition from manual to electronic administrative transactions.
▪ Eighth annual report.
▪ Monitoring progress makes it possible to identify successes and to make course corrections when necessary.
A collaborative initiative.
▪ The CAQH Index Advisory Council.
▪ Experts in administrative transactions, data analysis and healthcare management.
▪ Represents providers, health plans, vendors and other industry partners.
5

© 2018 CAQH, All Rights Reserved.
Which Transactions Are Tracked?
6

© 2018 CAQH, All Rights Reserved.
▪ Transaction Costs - Cost and saving estimates only account for labor time required to conduct the transaction. Systems
costs as well as pre- and follow-up work are not included.
▪ Electronic Transaction- Automated transaction conducted using the adopted HIPAA standard.
▪ Manual Transaction- Transaction requiring end-to-end human interaction, such as telephone, fax, and/or mail.
▪ Partially Electronic Transaction- Transaction includes web portals and interactive voice response (IVR) systems.
Index Definitions
7

© 2018 CAQH, All Rights Reserved.
▪ Potential Savings- The savings associated with switching from manual/partially electronic transactions to fully electronic
transactions.
▪ Estimated Spend- The amount of money medical and dental plans and providers spend on conducting a transaction by
modality (electronically, partially electronic, manually).
▪ Electronic Spend- Costs necessary to conduct the transaction.
▪ Cost Avoided- The amount of money that was saved by conducting an automated/electronic transaction instead of a
manual or partially electronic transaction.
Financial Metrics
8

© 2018 CAQH, All Rights Reserved.
2020 Transactions Reported
9

© 2018 CAQH, All Rights Reserved.
▪ Timeframe: End of June to the middle of September
▪ Covered Lives- 51% Medical
- 43% Dental
▪ Provider response increased by 37%
▪ Number of Transactions Reported by 2020 Participants- Medical: 10 B
- Dental: 740 M
▪ Reportable Transactions- 9 Medical
- 6 Dental
▪ Enhancements- Recruiting
- Content
- Analyses
2020 Data Collection Effort
10
Reporting Period:
Calendar year 2019
Does not include data
from COVID-19.

© 2018 CAQH, All Rights Reserved.
High-Level Findings
11

© 2018 CAQH, All Rights Reserved.
▪ Adoption of electronic transactions improved or remained stable for all medical and dental
transactions.
▪ Overall volume increased for the medical and dental industries led by strong gains in electronic
transaction volume.
▪ Industry spending on administrative transactions decreased as the cost of electronic transactions
declined.
▪ Savings opportunities increased for the medical industry as the gap in costs for electronic vs
partially electronic and manual transactions increased. Electronic costs decreased and manual and
partially electronic costs increased
▪ Savings opportunities decreased for the dental industry as electronic adoption increased.
▪ The annual costs avoided by the healthcare industry through automation increased.
2020 High-Level Findings
12

© 2018 CAQH, All Rights Reserved.
Medical Plan Adoption Increased or Remained Relatively Stable
13

© 2018 CAQH, All Rights Reserved.
Dental Plan Adoption Increased or Remained Stable for all Transactions
14

© 2018 CAQH, All Rights Reserved.
Overall Industry Volume Increased; Dental Savings Opportunity Decreased
15

© 2018 CAQH, All Rights Reserved.
Overall Industry Savings Opportunities Increased
16

© 2018 CAQH, All Rights Reserved.
Medical Average Cost per Transaction and Savings Opportunity
17
▪ Biggest savings opportunities:- Claim status inquiry ($11.71)
- Prior authorization ($9.64)
- Eligibility and benefits ($8.64)
▪ On average, each manual transaction costs the
industry $5.42 more than each electronic transaction.
▪ Medical industry could save as much as $43.39 for a
single patient encounter by conducting all
transactions electronically.- $29.84 for providers
- $13.55 for plans
▪ Savings associated with moving from partially
electronic portals to fully electronic transactions:- Prior authorization ($3.43)
- Claim status inquiry ($2.19)
- Eligibility and benefits ($1.60)

© 2018 CAQH, All Rights Reserved.
Dental Average Cost per Transaction and Savings Opportunity
18
▪ Biggest savings opportunities:- Claim status inquiry ($10.92)
- Eligibility and benefits ($8.75)
▪ On average, each manual transaction costs
the industry $5.47 more than each electronic
transaction.
▪ Medical industry could save as much as
$27.35 for a single patient encounter by
conducting all transactions electronically.- $20.30 for providers
- $7.05 for plans
▪ Savings associated with moving from
partially electronic portals to fully electronic
transactions:- Claim status inquiry ($2.51)
- Eligibility and benefits ($2.38)
© 2018 CAQH, All Rights Reserved.
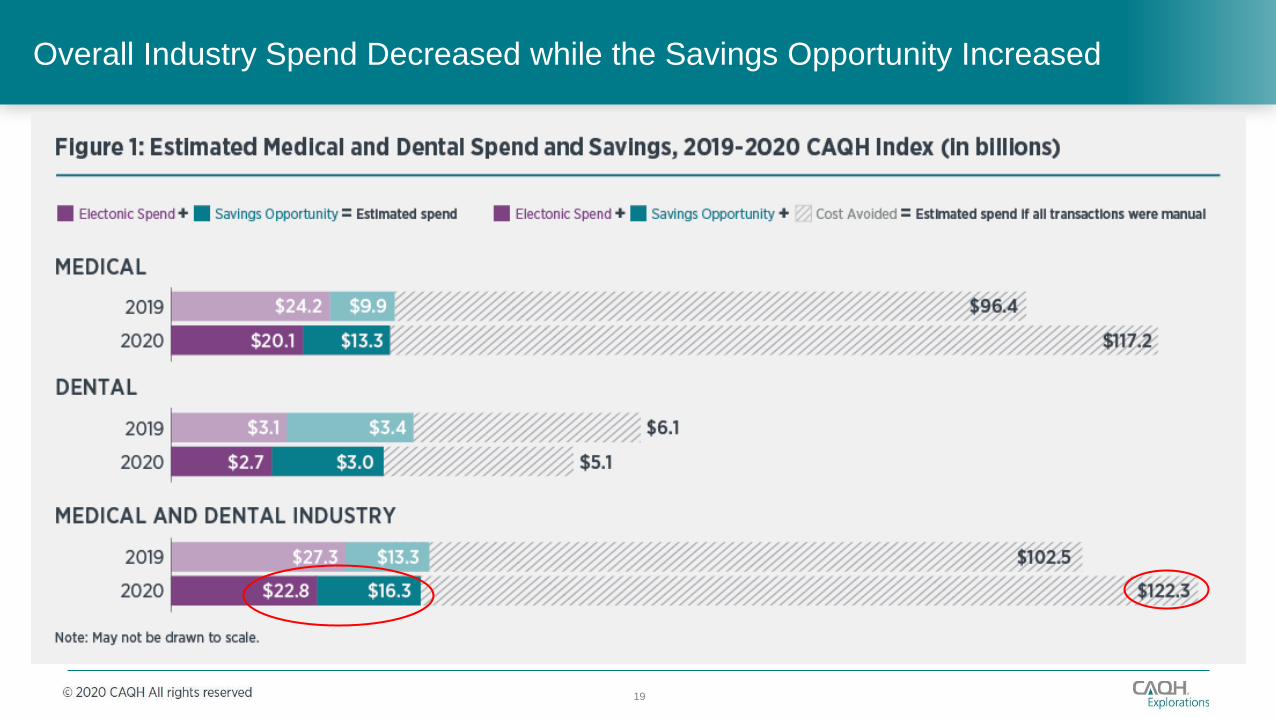
Overall Industry Spend Decreased while the Savings Opportunity Increased
19

© 2018 CAQH, All Rights Reserved.
Medical Spend Decreased and Cost Avoided Increased Through Automation
20
$33.4 B annual estimated spend
▪ Eligibility and Benefit Verification
spend represents 47% of total
annual spend
▪ Claim Submission spend
represents 17% of total annual
spend
▪ Remittance Advice spend
represents 17% of total annual
spend

© 2018 CAQH, All Rights Reserved.
Dental Spend and Costs Avoided Decreased Through Automation
21
$5.7 B annual estimated
spend
▪ Eligibility and Benefit
Verification spend
represents 24% of total
annual spend
▪ Remittance Advice spend
represents 24% of total
annual spend
▪ Claim Status Inquiry spend
represents 19% of total
annual spend
© 2018 CAQH, All Rights Reserved.
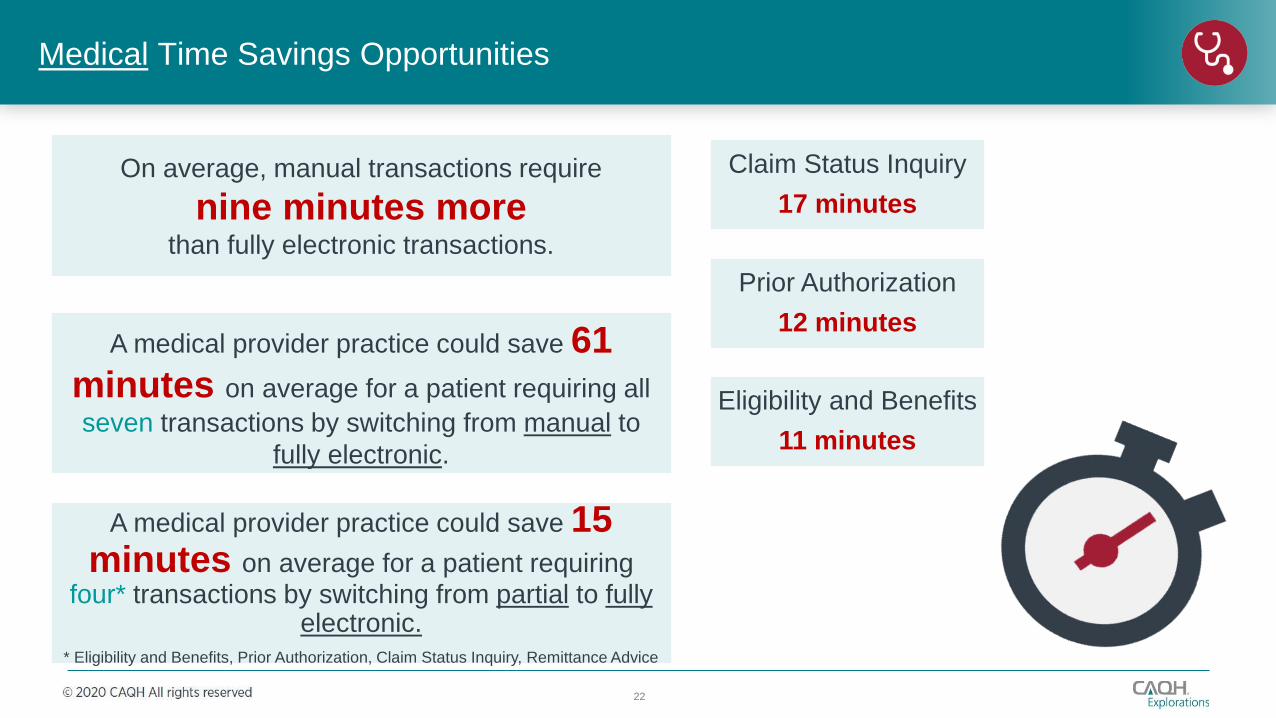
Medical Time Savings Opportunities
On average, manual transactions require
nine minutes more than fully electronic transactions.
A medical provider practice could save 61
minutes on average for a patient requiring all
seven transactions by switching from manual to
fully electronic.
Prior Authorization
12 minutes
22
Eligibility and Benefits
11 minutes
Claim Status Inquiry
17 minutes
A medical provider practice could save 15 minutes on average for a patient requiring
four* transactions by switching from partial to fully electronic.
* Eligibility and Benefits, Prior Authorization, Claim Status Inquiry, Remittance Advice

© 2018 CAQH, All Rights Reserved.
Dental Time Savings Opportunities
On average, manual transactions require
seven minutes more than fully electronic transactions.
A dental provider practice could save 37 minutes on average for a patient requiring all five transactions by switching from manual to fully
electronic.
Claim Status Inquiry
14 minutes
23
Remittance Advice
6 minutes
Eligibility and Benefits
10 minutes
A dental provider practice could save 11 minutes on average for a patient requiring
three* transactions by switching from partial to fully electronic.
* Eligibility and Benefits, Claim Status Inquiry, Remittance Advice

© 2018 CAQH, All Rights Reserved.
Detailed Findings
24

© 2018 CAQH, All Rights Reserved.
Eligibility and Benefit Verification
25

© 2018 CAQH, All Rights Reserved.
Eligibility and Benefits: Medical and Dental Plan Adoption by Mode
26

© 2018 CAQH, All Rights Reserved.
Eligibility and Benefits: Medical and Dental Industry Estimated Volume by Mode
27

© 2018 CAQH, All Rights Reserved.
Prior Authorization
28

© 2018 CAQH, All Rights Reserved.
Prior Authorization: Medical Plan Adoption by Mode
29

© 2018 CAQH, All Rights Reserved.
Prior Authorization: Medical Industry Estimated Volume by Mode
30

© 2018 CAQH, All Rights Reserved.
Claim Submission
31

© 2018 CAQH, All Rights Reserved.
Claim Submission: Medical and Dental Plan Adoption by Mode
32

© 2018 CAQH, All Rights Reserved.
Claim Submission: Medical and Dental Industry Estimated Volume by Mode
33

© 2018 CAQH, All Rights Reserved.
Attachments
34

© 2018 CAQH, All Rights Reserved.
Attachments: Medical Plan Adoption by Mode
35

© 2018 CAQH, All Rights Reserved.
Attachments: Medical Industry Estimated Volume by Mode
36

© 2018 CAQH, All Rights Reserved.
Acknowledgements
37

© 2018 CAQH, All Rights Reserved.
Acknowledgements: Medical Plan Adoption by Mode
38

© 2018 CAQH, All Rights Reserved.
Coordination of Benefits (COB)
39

© 2018 CAQH, All Rights Reserved.
Coordination of Benefits (COB): Medical Plan Adoption by Mode
40

© 2018 CAQH, All Rights Reserved.
Coordination of Benefits (COB): Medical Industry Estimated Volume by Mode
41
© 2018 CAQH, All Rights Reserved.
Claim Status Inquiry
42

© 2018 CAQH, All Rights Reserved.
Claim Status Inquiry: Medical and Dental Plan Adoption by Mode
43

© 2018 CAQH, All Rights Reserved.
Claim Status Inquiry: Medical and Dental Industry Estimated Volume by Mode
44

© 2018 CAQH, All Rights Reserved.
Claim Payment
45

© 2018 CAQH, All Rights Reserved.
Claim Payment: Medical and Dental Plan Adoption by Mode
46

© 2018 CAQH, All Rights Reserved.
Claim Payment: Medical and Dental Industry Estimated Volume by Mode
47

© 2018 CAQH, All Rights Reserved.
Remittance Advice
48

© 2018 CAQH, All Rights Reserved.
Remittance Advice: Medical and Dental Plan Adoption by Mode
49

© 2018 CAQH, All Rights Reserved.
Remittance Advice: Medical and Dental Industry Estimated Volume by Mode
50

© 2018 CAQH, All Rights Reserved.
▪ Focus efforts to address cost-savings opportunities- Medical savings opportunity increased due to increased manual and web portal costs
- Eligibility and benefits largest cost savings opportunity overall
- Prior authorization highest per web portal transaction cost savings opportunity
▪ Accelerate standards and operating rule development to address emerging market needs- Government and industry efforts
- Standards and operating rules need to address emerging more complex business needs
- Incorporating value-based care needs into the administrative workflow
▪ Capitalize and expand progress made to date- Expand on progress made by the dental industry
- Build on the burgeoning improvement on prior authorization
Call to Action
51

© 2018 CAQH, All Rights Reserved.
Questions
52

© 2018 CAQH, All Rights Reserved.
The 2020 CAQH Index report is available now at
www.caqhindex.org.
A recording of this webinar will also be available at
this location within a week of the webinar.
53