2020 annual report - investor relations | brown & brown, inc
TRANSCRIPT

2021 Annual Report
CHARGE ONCHARGE ONTO $4 BILLION AND BEYONDTO $4 BILLION AND BEYOND
Brow
n & B
rown, Inc. | 2021 A
nnual Report
Brown & Brown Insurance is one of the
industry’s most powerful and influential
leaders. We provide risk management
solutions to help protect and preserve
what our customers value most. Our four
business segments offer a wide range
of insurance solutions and services for
businesses, government institutions,
professional organizations, trade
associations, families and individuals.
We have a deeply rooted culture that is built on honesty, integrity, innovation, superior capabilities, discipline and a commitment to always doing what is best for our customers, teammates and communities.
With more than 80 years of proven success, we consistently provide high-quality solutions and services to our customers, which deliver strong results for our shareholders. Our team continues to demonstrate grit, hustle and an entrepreneurial spirit as we grow and thrive in the extremely competitive and constantly changing insurance industry.
We are A Forever Company.
Key Facts
B U I L T T O L A S T
Headquartered in Daytona Beach, Florida
D O G G E D D I S C I P L I N E
Founded in 1939—82 Years of Dedication
T E A M M A T E -D R I V E N S U C C E S S
12,000+ Teammates
L O C A L P E O P L E , P O W E R F U L S O L U T I O N S
350+ Locations
O W N E R S H I P M I N D S E T
60+% of Teammates are Shareholders
Key Differentiators
D E C E N T R A L I Z E D S A L E S A N D S E R V I C E M O D E L
Local teams empowered to make decisions that best support their customers, backed by the powerful solutions, capabilities and carrier relationships of a top-five brokerage.
F I N A N C I A L P E R F O R M A N C E
Consistent, industry-leading financial metrics and corresponding performance.
C U L T U R E
Strong, performance-based culture grounded in grit and integrity.
Entrepreneurial meritocracy: providing long-term opportunities for talented leaders and teammates.
C O M M U N I T Y S E R V I C E
Long-standing history of service to the communities in which our teams live and work.
Committed to Results
2 0 1 7
HistoricalRevenue
2 0 1 8 2 0 1 9 2 0 2 0 2 0 2 1
$1.9B $2.0B $2.4B $2.6B $3.1B
EBITDAC Margin(1)
32.2% 30.6% 30.0% 31.1% 33.5%
(1) EBITDAC Margin is a non-GAAP financial measure and is referenced to provide an additional meaningful method of evaluating our operating performance from period to period on a basis that may not be otherwise apparent on a GAAP basis. For other information concerning EBITDAC Margin and a reconciliation to the most closely comparable GAAP measure, refer to pages 16 and 33 of this Annual Report.
Dear Shareholders,
At Brown & Brown, we believe
putting our talented teammates
first enables us to deliver innovative
solutions for our customers. We focus
on “getting stuff done” (GSD), and
the results follow. Collaboration is at
the heart of the solutions we offer. 2021 was
an outstanding year for Brown & Brown.
We crossed the $3 billion annual revenue
threshold, growing our annual revenues
10.4% organically(1) and 16.8% overall.
This was accomplished while materially
improving our margins, and we are on our
way to our next intermediate goal of $4
billion—all made possible by our 12,000+
teammates’ commitment to our customers.
We have a strong, decentralized sales and
service model and a performance-based
culture grounded in honesty, integrity and
The Power of WE. We also have a deep
commitment to the communities where we
live and work—our Culture of Caring.
We focus on “getting stuff done” (GSD), and the results follow. Collaboration is at the heart of the solutions we offer.J. POWELL BROWN
A Message From Our CEO
1
20
21
AN
NU
AL
RE
PO
RT
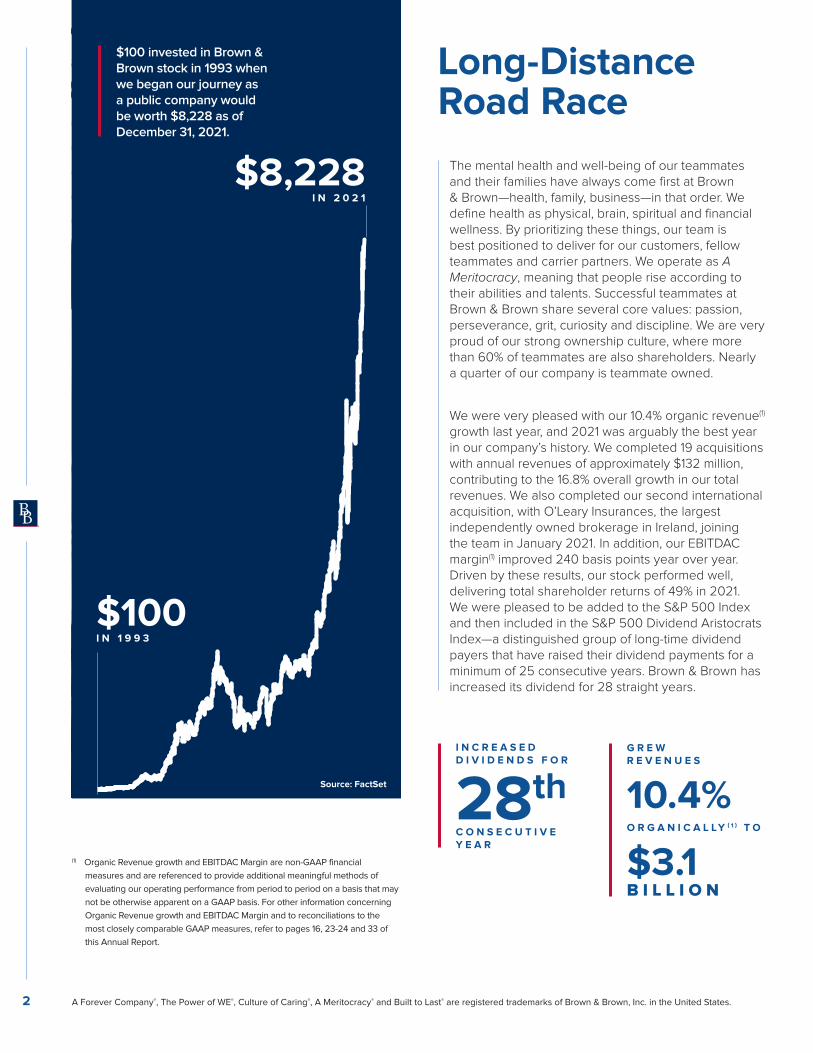
The mental health and well-being of our teammates and their families have always come first at Brown & Brown—health, family, business—in that order. We define health as physical, brain, spiritual and financial wellness. By prioritizing these things, our team is best positioned to deliver for our customers, fellow teammates and carrier partners. We operate as A Meritocracy, meaning that people rise according to their abilities and talents. Successful teammates at Brown & Brown share several core values: passion, perseverance, grit, curiosity and discipline. We are very proud of our strong ownership culture, where more than 60% of teammates are also shareholders. Nearly a quarter of our company is teammate owned.
We were very pleased with our 10.4% organic revenue(1) growth last year, and 2021 was arguably the best year in our company’s history. We completed 19 acquisitions with annual revenues of approximately $132 million, contributing to the 16.8% overall growth in our total revenues. We also completed our second international acquisition, with O’Leary Insurances, the largest independently owned brokerage in Ireland, joining the team in January 2021. In addition, our EBITDAC margin(1) improved 240 basis points year over year. Driven by these results, our stock performed well, delivering total shareholder returns of 49% in 2021. We were pleased to be added to the S&P 500 Index and then included in the S&P 500 Dividend Aristocrats Index—a distinguished group of long-time dividend payers that have raised their dividend payments for a minimum of 25 consecutive years. Brown & Brown has increased its dividend for 28 straight years.
(1) Organic Revenue growth and EBITDAC Margin are non-GAAP financial
measures and are referenced to provide additional meaningful methods of
evaluating our operating performance from period to period on a basis that may
not be otherwise apparent on a GAAP basis. For other information concerning
Organic Revenue growth and EBITDAC Margin and to reconciliations to the
most closely comparable GAAP measures, refer to pages 16, 23-24 and 33 of
this Annual Report.
I N C R E A S E D D I V I D E N D S F O R
28thC O N S E C U T I V E Y E A R
$100 invested in Brown & Brown stock in 1993 when we began our journey as a public company would be worth $8,228 as of December 31, 2021.
$8,228I N 2 0 2 1
$100I N 1 9 9 3
Source: FactSet
Long-Distance Road Race
A Forever Company®, The Power of WE®, Culture of Caring®, A Meritocracy® and Built to Last® are registered trademarks of Brown & Brown, Inc. in the United States.
G R E W R E V E N U E S
10.4%O R G A N I C A L LY ( 1 ) T O
$3.1 B I L L I O N
2
Finally, I want to acknowledge the loss of Brad Currey, a long-time friend, director and mentor to the entire Brown & Brown team. If I were to write a book like Tom Brokaw’s “The Greatest Generation,” Chapter One would be about Brad. Upon my appointment as CEO in July 2009, Brad sent me a handwritten note of congratulations with a message similar to this: “You are the right person for the job. Don’t get a big head.” And that is the way we try to do things at Brown & Brown—with honesty, integrity, humility, accountability, perseverance and grit.
If you are a shareholder, thank you
for your confidence in our team. If
you are a teammate, thank you for
everything you do for our customers
and your fellow teammates. To Brad
Currey, thank you for everything you
did to make us better and for always
reminding us that the price of honesty
is eternal vigilance. We will continue to
live up to your expectations. Onward
and upward.
Cheers!
We grow our business organically and through the acquisition of like-minded companies. Our focus on growth and profitability enables us to self-finance many of these transactions. Cultural fit remains the most important ingredient to a successful acquisition, followed by favorable financial terms. Through our acquisition activity and the hard work of our team, we enhanced our existing capabilities and added a number of new ones to our solution set. We have invested significantly in our company and team over the past five years. These investments include the addition of talented new teammates, the enhancement of social recognition tools and performance management processes and equity compensation that ties our teammates and our goals together. Three dynamic teammates were also added to our senior leadership team: Anurag Batta (Wholesale Brokerage segment), Tom Kussurelis (National Programs segment) and Mary Raveling (Retail segment). In addition, we continued to invest in technology that will help us execute more efficiently, improve the customer experience and drive innovation through data and analytics.
We learned a great deal about the human psyche in 2020 and 2021. In response, we narrowed our focus on brain health, prioritizing the creation and implementation of a Mental Health Guidebook—a robust suite of resources to support teammates and their families. We also executed an extensive mental health awareness campaign in May of 2021 and identified a group teammates from across the organization trained to support emotional health and well-being needs, known as Mental Health Allies.
Our Diversity, Inclusion and Belonging (DIB) task force continued to make strides to achieve our goal of further cultivating an inclusive place to work. In addition, our first Teammate Resource Groups (African American, Women, LGBTQ+ and Mental Health) were formed to help our workforce continue to evolve and reflect the communities in which we live. We also launched a dedicated DIB page on our website to clearly state our commitment to fostering a more inclusive environment where people from all backgrounds with a variety of experiences and perspectives can be their true, authentic selves and be recognized for their unique contributions and talents. We believe a culture that embraces diversity, inclusion and belonging helps deliver better outcomes for our customers and communities. Visit bbinsurance.com/about-us/diversity-inclusion-belonging/ to learn more.
T O T A L S H A R E H O L D E R R E T U R N S F O R 2 0 2 1
49%
J . P O W E L L B R O W N , C P C U P R E S I D E N T & C H I E F E X E C U T I V E O F F I C E R
Life Is Not a Sprint; It’s a Marathon
T H I S A N N U A L R E P O R T A N D I T S T H E M E
A R E D E D I C A T E D T O O U R F R I E N D A N D
M E N T O R , B R A D C U R R E Y .
3
20
21
AN
NU
AL
RE
PO
RT
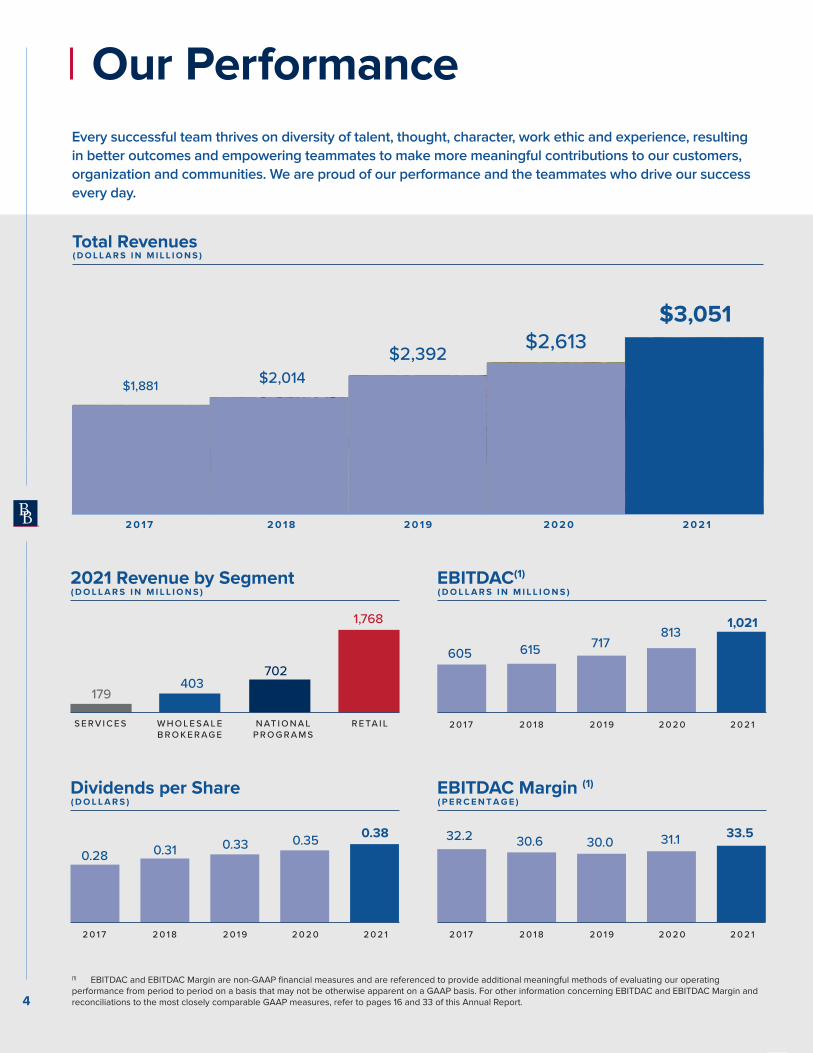
(1) EBITDAC and EBITDAC Margin are non-GAAP financial measures and are referenced to provide additional meaningful methods of evaluating our operating performance from period to period on a basis that may not be otherwise apparent on a GAAP basis. For other information concerning EBITDAC and EBITDAC Margin and reconciliations to the most closely comparable GAAP measures, refer to pages 16 and 33 of this Annual Report.
Our Performance
2021 Revenue by Segment( D O L L A R S I N M I L L I O N S )
R E TA I LW H O L E S A L E B R O K E R AG E
S E R V I C E SP R O G R A M SN AT I O N A L
1,768
403179
702
2 0 1 7 2 0 1 8 2 0 1 9
EBITDAC(1)
2 0 2 0 2 0 2 1
( D O L L A R S I N M I L L I O N S )
1,021813
615605717
2 0 1 7 2 0 1 8 2 0 1 9
Dividends per Share
2 0 2 0 2 0 2 1
( D O L L A R S )
0.380.350.310.28
0.33
2 0 1 7 2 0 1 8 2 0 1 9
EBITDAC Margin (1)
2 0 2 0 2 0 2 1
( P E R C E N T A G E )
33.531.130.632.2 30.0
Every successful team thrives on diversity of talent, thought, character, work ethic and experience, resulting
in better outcomes and empowering teammates to make more meaningful contributions to our customers,
organization and communities. We are proud of our performance and the teammates who drive our success
every day.
0
3500
2 0 1 7 2 0 1 8 2 0 1 9 2 0 2 0 2 0 2 1
$1,881 $2,014$2,392 $2,613
$3,051
Total Revenues( D O L L A R S I N M I L L I O N S )
4
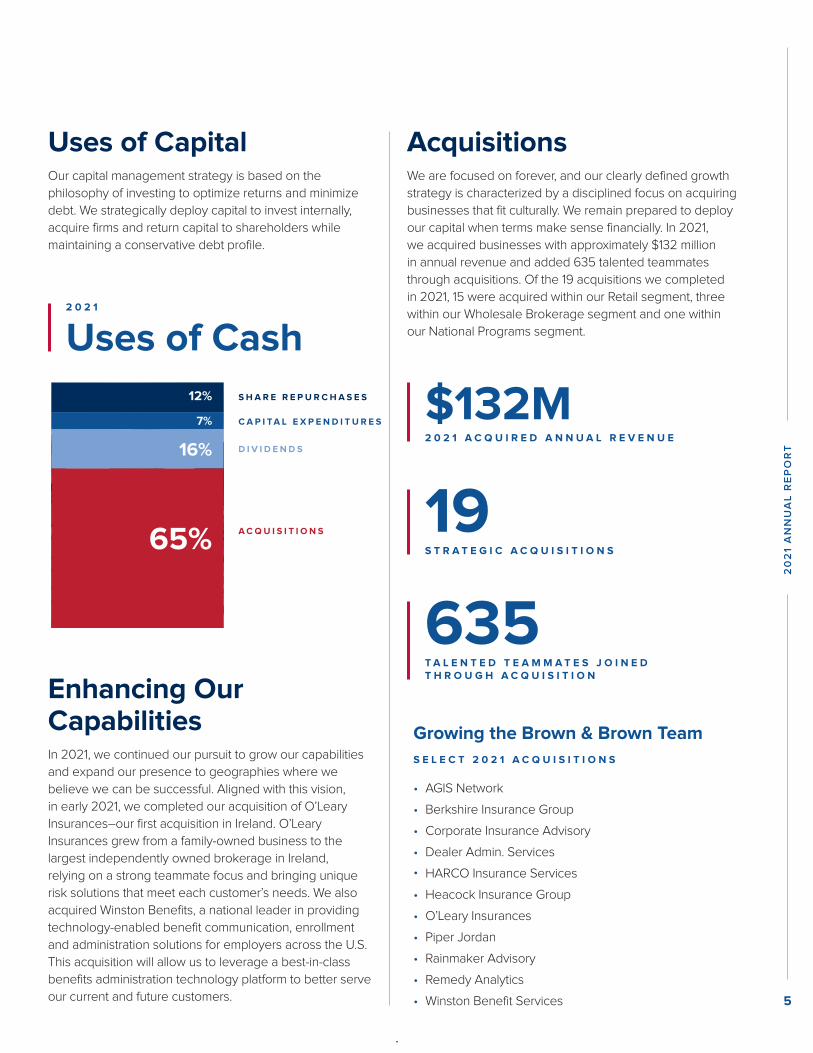
Uses of CapitalOur capital management strategy is based on the
philosophy of investing to optimize returns and minimize
debt. We strategically deploy capital to invest internally,
acquire firms and return capital to shareholders while
maintaining a conservative debt profile.
AcquisitionsWe are focused on forever, and our clearly defined growth
strategy is characterized by a disciplined focus on acquiring
businesses that fit culturally. We remain prepared to deploy
our capital when terms make sense financially. In 2021,
we acquired businesses with approximately $132 million
in annual revenue and added 635 talented teammates
through acquisitions. Of the 19 acquisitions we completed
in 2021, 15 were acquired within our Retail segment, three
within our Wholesale Brokerage segment and one within
our National Programs segment.
Enhancing Our CapabilitiesIn 2021, we continued our pursuit to grow our capabilities
and expand our presence to geographies where we
believe we can be successful. Aligned with this vision,
in early 2021, we completed our acquisition of O’Leary
Insurances–our first acquisition in Ireland. O’Leary
Insurances grew from a family-owned business to the
largest independently owned brokerage in Ireland,
relying on a strong teammate focus and bringing unique
risk solutions that meet each customer’s needs. We also
acquired Winston Benefits, a national leader in providing
technology-enabled benefit communication, enrollment
and administration solutions for employers across the U.S.
This acquisition will allow us to leverage a best-in-class
benefits administration technology platform to better serve
our current and future customers.
19 S T R A T E G I C A C Q U I S I T I O N S
2 0 2 1
Uses of Cash
$132M2 0 2 1 A C Q U I R E D A N N U A L R E V E N U E
635 T A L E N T E D T E A M M A T E S J O I N E D T H R O U G H A C Q U I S I T I O N
Growing the Brown & Brown Team
S E L E C T 2 0 2 1 A C Q U I S I T I O N S
• AGIS Network
• Berkshire Insurance Group
• Corporate Insurance Advisory
• Dealer Admin. Services
• HARCO Insurance Services
• Heacock Insurance Group
• O’Leary Insurances
• Piper Jordan
• Rainmaker Advisory
• Remedy Analytics
• Winston Benefit Services
A C Q U I S I T I O N S
12%
7%
S H A R E R E P U R C H A S E S
C A P I T A L E X P E N D I T U R E S
D I V I D E N D S16%
65%
5
20
21
AN
NU
AL
RE
PO
RT
(1) EBITDAC and EBITDAC Margin are non-GAAP financial measures and are referenced to provide additional meaningful methods of evaluating our operating performance from period to period on a basis that may not be otherwise apparent on a GAAP basis. For other information concerning EBITDAC and EBITDAC Margin and reconciliations to the most closely comparable GAAP measures, refer to pages 16 and 33 of this Annual Report.
Our Performance
2021 Revenue by Segment( D O L L A R S I N M I L L I O N S )
R E TA I LW H O L E S A L E B R O K E R AG E
S E R V I C E SP R O G R A M SN AT I O N A L
1,768
403179
702
2 0 1 7 2 0 1 8 2 0 1 9
EBITDAC(1)
2 0 2 0 2 0 2 1
( D O L L A R S I N M I L L I O N S )
1,021813
615605717
2 0 1 7 2 0 1 8 2 0 1 9
Dividends per Share
2 0 2 0 2 0 2 1
( D O L L A R S )
0.380.350.310.28
0.33
2 0 1 7 2 0 1 8 2 0 1 9
EBITDAC Margin (1)
2 0 2 0 2 0 2 1
( P E R C E N T A G E )
33.531.130.632.2 30.0
Every successful team thrives on diversity of talent, thought, character, work ethic and experience, resulting
in better outcomes and empowering teammates to make more meaningful contributions to our customers,
organization and communities. We are proud of our performance and the teammates who drive our success
every day.
0
3500
2 0 1 7 2 0 1 8 2 0 1 9 2 0 2 0 2 0 2 1
$1,881 $2,014$2,392 $2,613
$3,051
Total Revenues( D O L L A R S I N M I L L I O N S )
4
Uses of CapitalOur capital management strategy is based on the
philosophy of investing to optimize returns and minimize
debt. We strategically deploy capital to invest internally,
acquire firms and return capital to shareholders while
maintaining a conservative debt profile.
AcquisitionsWe are focused on forever, and our clearly defined growth
strategy is characterized by a disciplined focus on acquiring
businesses that fit culturally. We remain prepared to deploy
our capital when terms make sense financially. In 2021,
we acquired businesses with approximately $132 million
in annual revenue and added 635 talented teammates
through acquisitions. Of the 19 acquisitions we completed
in 2021, 15 were acquired within our Retail segment, three
within our Wholesale Brokerage segment and one within
our National Programs segment.
Enhancing Our CapabilitiesIn 2021, we continued our pursuit to grow our capabilities
and expand our presence to geographies where we
believe we can be successful. Aligned with this vision,
in early 2021, we completed our acquisition of O’Leary
Insurances–our first acquisition in Ireland. O’Leary
Insurances grew from a family-owned business to the
largest independently owned brokerage in Ireland,
relying on a strong teammate focus and bringing unique
risk solutions that meet each customer’s needs. We also
acquired Winston Benefits, a national leader in providing
technology-enabled benefit communication, enrollment
and administration solutions for employers across the U.S.
This acquisition will allow us to leverage a best-in-class
benefits administration technology platform to better serve
our current and future customers.
19 S T R A T E G I C A C Q U I S I T I O N S
2 0 2 1
Uses of Cash
$132M2 0 2 1 A C Q U I R E D A N N U A L R E V E N U E
635 T A L E N T E D T E A M M A T E S J O I N E D T H R O U G H A C Q U I S I T I O N
Growing the Brown & Brown Team
S E L E C T 2 0 2 1 A C Q U I S I T I O N S
• AGIS Network
• Berkshire Insurance Group
• Corporate Insurance Advisory
• Dealer Admin. Services
• HARCO Insurance Services
• Heacock Insurance Group
• O’Leary Insurances
• Piper Jordan
• Rainmaker Advisory
• Remedy Analytics
• Winston Benefit Services
A C Q U I S I T I O N S
12%
7%
S H A R E R E P U R C H A S E S
C A P I T A L E X P E N D I T U R E S
D I V I D E N D S16%
65%
5
20
21
AN
NU
AL
RE
PO
RT

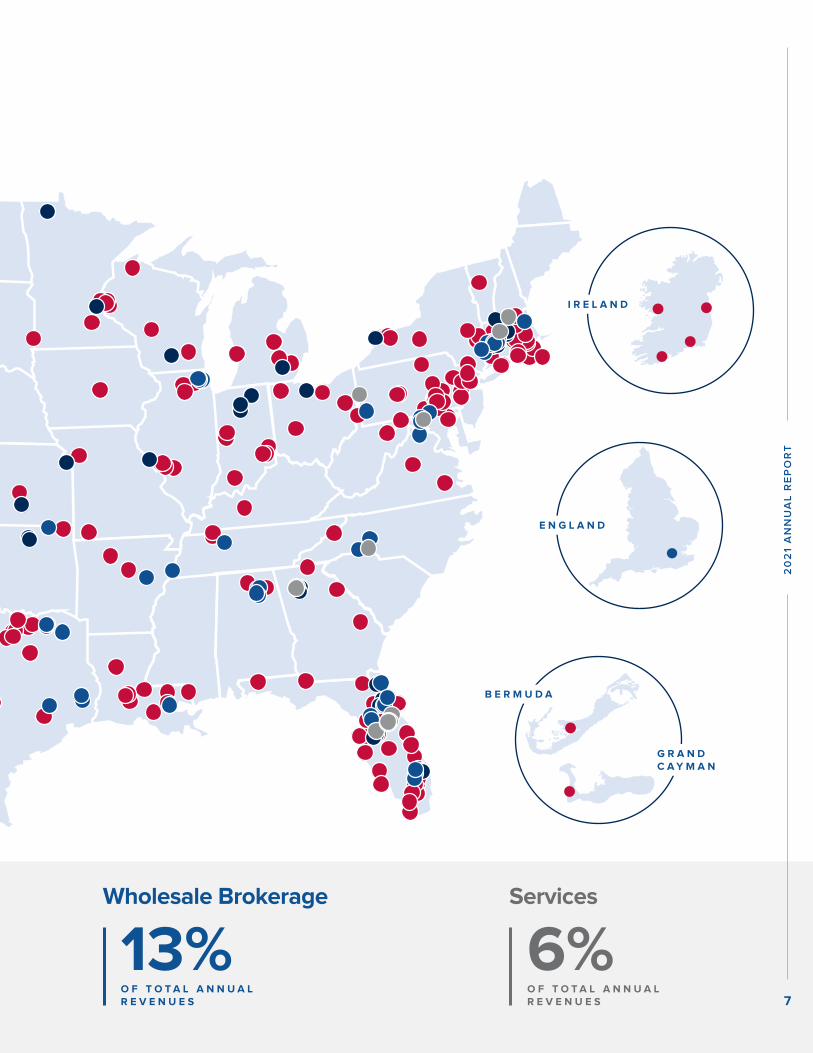
Our Footprint
C A N A D A
H A W A I I
Retail
58%O F T O T A L A N N U A LR E V E N U E S
National Programs
23%O F T O T A L A N N U A LR E V E N U E S6
B E R M U D A
G R A N D C A Y M A N
E N G L A N D
I R E L A N D
Wholesale Brokerage
13%O F T O T A L A N N U A LR E V E N U E S
Services
6%O F T O T A L A N N U A LR E V E N U E S 7
20
21
AN
NU
AL
RE
PO
RT
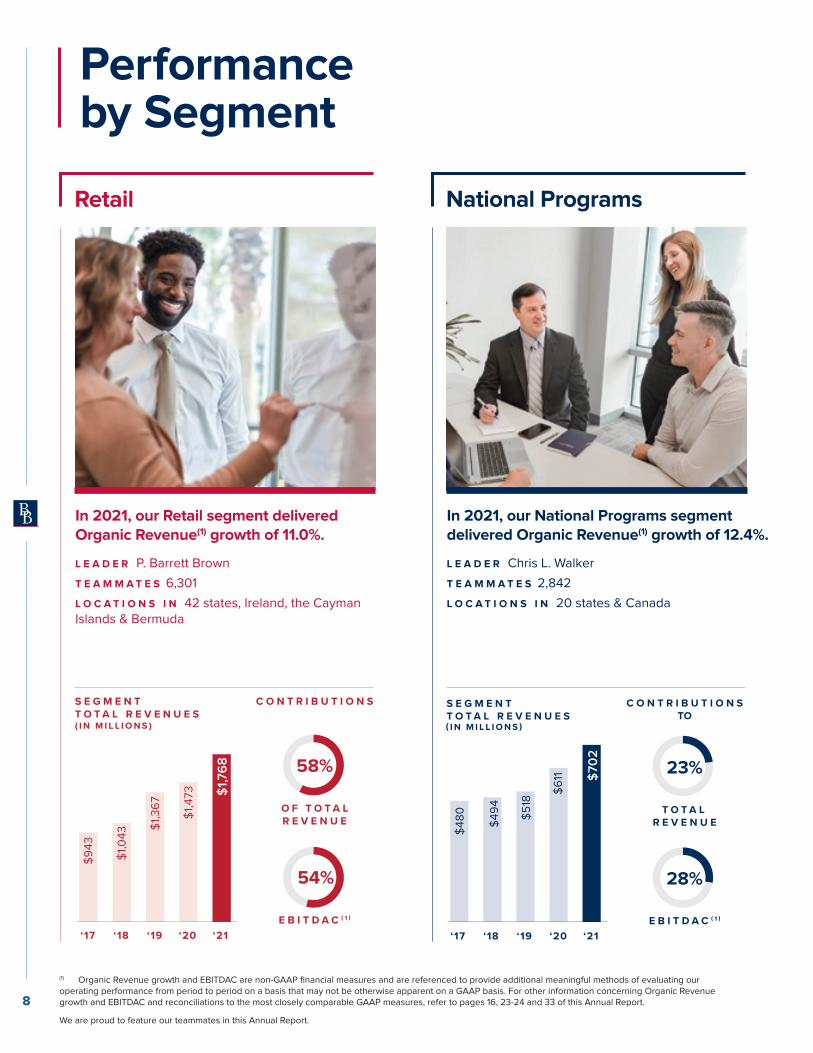
In 2021, our National Programs segment delivered Organic Revenue(1) growth of 12.4%.
L E A D E R Chris L. Walker
T E A M M A T E S 2,842
L O C A T I O N S I N 20 states & Canada
National Programs
( I N M I L L I O N S )
C O N T R I B U T I O N STO
S E G M E N T T O T A L R E V E N U E S
R E V E N U ET O T A L
28%
23%
E B I T D A C‘17 ‘18 ‘19 ‘20 ‘21
$702
$611
$518
$494
$480
(1) Organic Revenue growth and EBITDAC are non-GAAP financial measures and are referenced to provide additional meaningful methods of evaluating our operating performance from period to period on a basis that may not be otherwise apparent on a GAAP basis. For other information concerning Organic Revenue growth and EBITDAC and reconciliations to the most closely comparable GAAP measures, refer to pages 16, 23-24 and 33 of this Annual Report.
In 2021, our Retail segment delivered Organic Revenue(1) growth of 11.0%.
L E A D E R P. Barrett Brown
T E A M M A T E S 6,301
L O C A T I O N S I N 42 states, Ireland, the Cayman Islands & Bermuda
Retail
S E G M E N T T O T A L R E V E N U E S
C O N T R I B U T I O N S
R E V E N U EO F T O T A L
E B I T D A C
54%
58%
‘17 ‘18 ‘19 ‘20 ‘21
$1,473 $1
,768
$1,367
$943
$1,043
( I N M I L L I O N S )
We are proud to feature our teammates in this Annual Report.
Performance by Segment
8
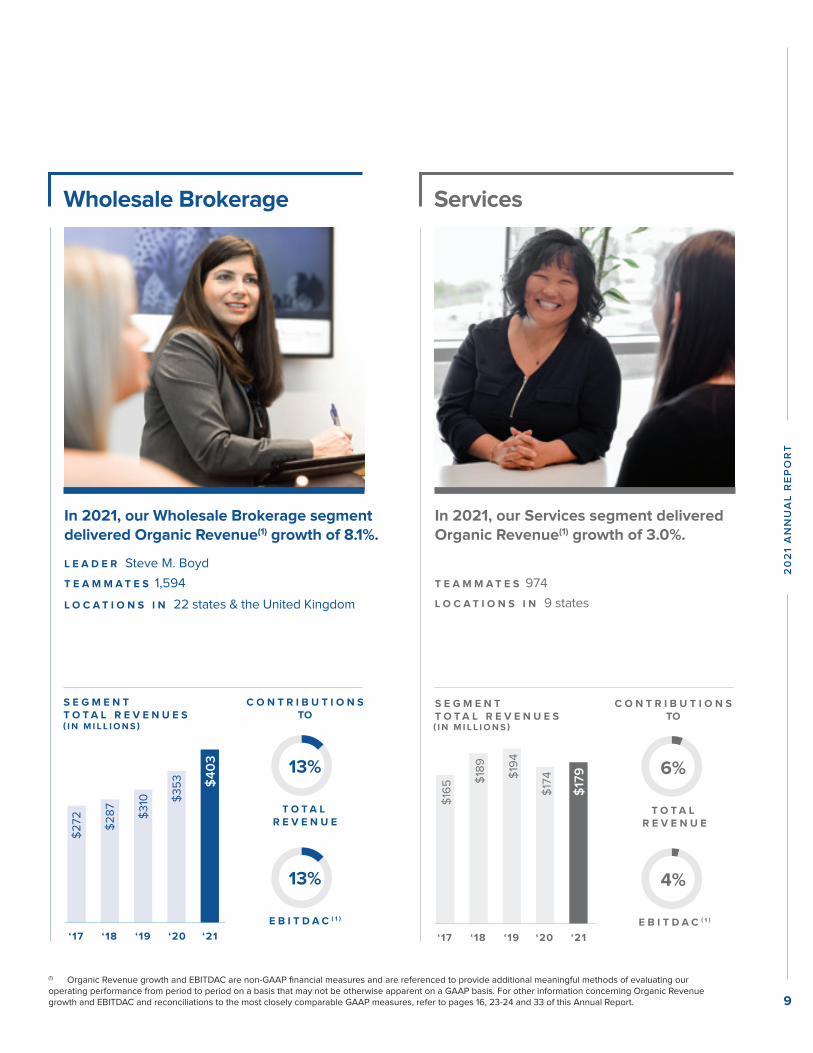
In 2021, our Wholesale Brokerage segment delivered Organic Revenue(1) growth of 8.1%.
L E A D E R Steve M. Boyd
T E A M M A T E S 1,594
L O C A T I O N S I N 22 states & the United Kingdom
Wholesale Brokerage
( I N M I L L I O N S )
S E G M E N T T O T A L R E V E N U E S
C O N T R I B U T I O N STO
R E V E N U E
13%
13%
T O T A L
E B I T D A C‘17 ‘18 ‘19 ‘20 ‘21
$403
$353
$310
$287
$272
(1) Organic Revenue growth and EBITDAC are non-GAAP financial measures and are referenced to provide additional meaningful methods of evaluating our operating performance from period to period on a basis that may not be otherwise apparent on a GAAP basis. For other information concerning Organic Revenue growth and EBITDAC and reconciliations to the most closely comparable GAAP measures, refer to pages 16, 23-24 and 33 of this Annual Report.
In 2021, our Services segment delivered Organic Revenue(1) growth of 3.0%.
T E A M M A T E S 974
L O C A T I O N S I N 9 states
Services
( I N M I L L I O N S )
S E G M E N T T O T A L R E V E N U E S
C O N T R I B U T I O N STO
R E V E N U E
4%
6%
T O T A L
E B I T D A C‘17 ‘18 ‘19 ‘20 ‘21
$179
$174$1
94
$189
$165
9
20
21
AN
NU
AL
RE
PO
RT
In 2021, our National Programs segment delivered Organic Revenue(1) growth of 12.4%.
L E A D E R Chris L. Walker
T E A M M A T E S 2,842
L O C A T I O N S I N 20 states & Canada
National Programs
( I N M I L L I O N S )
C O N T R I B U T I O N STO
S E G M E N T T O T A L R E V E N U E S
R E V E N U ET O T A L
28%
23%
E B I T D A C‘17 ‘18 ‘19 ‘20 ‘21
$702
$611
$518
$494
$480
(1) Organic Revenue growth and EBITDAC are non-GAAP financial measures and are referenced to provide additional meaningful methods of evaluating our operating performance from period to period on a basis that may not be otherwise apparent on a GAAP basis. For other information concerning Organic Revenue growth and EBITDAC and reconciliations to the most closely comparable GAAP measures, refer to pages 16, 23-24 and 33 of this Annual Report.
In 2021, our Retail segment delivered Organic Revenue(1) growth of 11.0%.
L E A D E R P. Barrett Brown
T E A M M A T E S 6,301
L O C A T I O N S I N 42 states, Ireland, the Cayman Islands & Bermuda
Retail
S E G M E N T T O T A L R E V E N U E S
C O N T R I B U T I O N S
R E V E N U EO F T O T A L
E B I T D A C
54%
58%
‘17 ‘18 ‘19 ‘20 ‘21
$1,473 $1
,768
$1,367
$943
$1,043
( I N M I L L I O N S )
We are proud to feature our teammates in this Annual Report.
Performance by Segment
8
In 2021, our Wholesale Brokerage segment delivered Organic Revenue(1) growth of 8.1%.
L E A D E R Steve M. Boyd
T E A M M A T E S 1,594
L O C A T I O N S I N 22 states & the United Kingdom
Wholesale Brokerage
( I N M I L L I O N S )
S E G M E N T T O T A L R E V E N U E S
C O N T R I B U T I O N STO
R E V E N U E
13%
13%
T O T A L
E B I T D A C‘17 ‘18 ‘19 ‘20 ‘21
$403
$353
$310
$287
$272
(1) Organic Revenue growth and EBITDAC are non-GAAP financial measures and are referenced to provide additional meaningful methods of evaluating our operating performance from period to period on a basis that may not be otherwise apparent on a GAAP basis. For other information concerning Organic Revenue growth and EBITDAC and reconciliations to the most closely comparable GAAP measures, refer to pages 16, 23-24 and 33 of this Annual Report.
In 2021, our Services segment delivered Organic Revenue(1) growth of 3.0%.
T E A M M A T E S 974
L O C A T I O N S I N 9 states
Services
( I N M I L L I O N S )
S E G M E N T T O T A L R E V E N U E S
C O N T R I B U T I O N STO
R E V E N U E
4%
6%
T O T A L
E B I T D A C‘17 ‘18 ‘19 ‘20 ‘21
$179
$174$1
94
$189
$165
9
20
21
AN
NU
AL
RE
PO
RT

Julie L. Turpin Executive Vice President & Chief People Officer
T E N U R E 9 years
Our Leadership Team
Chris L. Walker Executive Vice President & President – National Programs Segment
T E N U R E 18 years*
J. Powell Brown, CPCUPresident & Chief Executive Officer
T E N U R E 26 years
R. Andrew Watts Executive Vice President, Chief Financial Officer & Treasurer
T E N U R E 7 years
Steve M. Boyd Executive Vice President & President – Wholesale Brokerage Segment
T E N U R E 26 years*
P. Barrett Brown Executive Vice President & President – Retail Segment
T E N U R E 18 years
J. Scott Penny, CIC Executive Vice President & Chief Acquisitions Officer
T E N U R E 32 years
Robert W. Lloyd, Esq., CPCU, CIC Executive Vice President, General Counsel & Secretary
T E N U R E 22 years
Anthony T. StrianeseExecutive Vice President & Chairman – Wholesale Brokerage Segment
T E N U R E 22 years
K. Gray Nester, II Executive Vice President & Chief Information Officer
T E N U R E 2 years
We thrive under the guidance of our talented, long-tenured leadership team and value their dedication to our Brown & Brown team.
Tenure calculated as of December 31, 2021. *Tenure includes service with Arrowhead General Insurance Agency, Inc., which we acquired in 2012. 10
J. Hyatt Brown, CPCU, CLU Chairman, Brown & Brown, Inc.
Hugh M. Brown Founder and former President & Chief Executive Officer, BAMSI, Inc.
AC CO
J. Powell Brown, CPCU President & Chief Executive Officer, Brown & Brown, Inc.
Lawrence L. Gellerstedt III Former Chairman of the Board and CEO, Cousins Properties Incorporated
AC AU
James C. Hays Vice Chairman, Brown & Brown, Inc.
AC
Theodore J. Hoepner Former Vice Chairman, SunTrust Bank Holding Company
AU
NC
James S. Hunt Former Executive Vice President & Chief Financial Officer, Walt Disney Parks and Resorts Worldwide
AC AU
Toni Jennings Chairman, Jack Jennings & Sons; Former Lieutenant Governor, State of Florida
CO NC
Timothy R. M. Main Global Head of Financial Institutions Group, Barclays Plc
AC
H. Palmer Proctor, Jr. Lead Independent Director Chief Executive Officer/ Director, Ameris Bancorp and Chief Executive Officer, Ameris Bank
NC
Wendell S. Reilly Managing Partner, Grapevine Partners, LLC
CO
NC
Chilton D. Varner, Esq. Senior Counsel, King & Spalding LLP
CO NC
Samuel P. Bell, III, Esq. Director Emeritus Former Of Counsel to the law firm of Buchanan Ingersoll & Rooney PC
Our Board of Directors
C O M M I T T E E S
AU Audit
CO Compensation
AC Acquisition
NCNominating/ Corporate Governance
Chair
Anurag Batta
Senior Vice President
Kathy H. Colangelo, CIC, ASLI
Senior Vice President
John M. Esposito, CIC
Senior Vice President & Regional President – Retail Segment
Joseph S. Failla
Senior Vice President
James C. Hays
Vice Chairman
Thomas K. Huval, CIC
Senior Vice President & Regional President – Retail Segment
Michael L. Keeby
Senior Vice President & Regional President – Retail Segment
Richard A. Knudson, CIC
Senior Vice President & Regional President – Retail Segment
Tom Kussurelis, AAI, CPCU, CLU
Senior Vice President
Donald M. McGowan, Jr.
Senior Vice President & Regional President – Retail Segment
Mary G. Raveling, CPCU
Senior Vice President
Paul F. Rogers
Senior Vice President & Regional President – Retail Segment
H. Vaughn Stoll
Senior Vice President & Director of Acquisitions
11
20
21
AN
NU
AL
RE
PO
RT
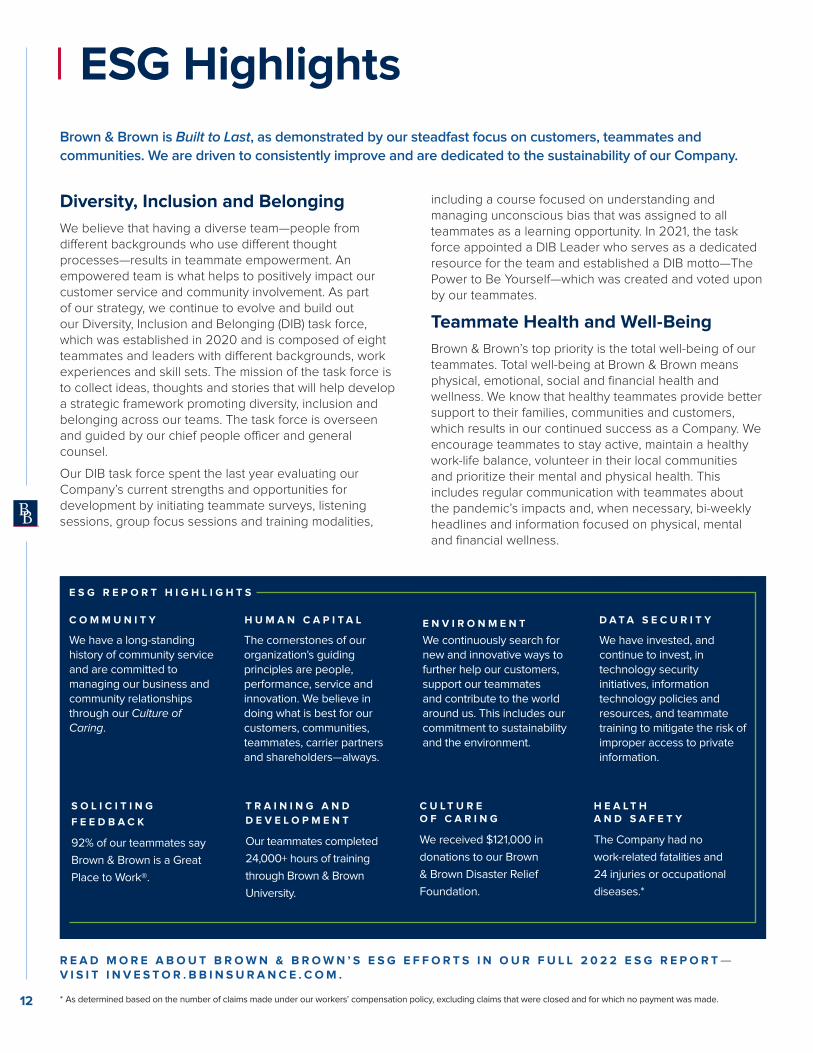
ESG Highlights
Brown & Brown is Built to Last, as demonstrated by our steadfast focus on customers, teammates and
communities. We are driven to consistently improve and are dedicated to the sustainability of our Company.
Diversity, Inclusion and Belonging
We believe that having a diverse team—people from different backgrounds who use different thought processes—results in teammate empowerment. An empowered team is what helps to positively impact our customer service and community involvement. As part of our strategy, we continue to evolve and build out our Diversity, Inclusion and Belonging (DIB) task force, which was established in 2020 and is composed of eight teammates and leaders with different backgrounds, work experiences and skill sets. The mission of the task force is to collect ideas, thoughts and stories that will help develop a strategic framework promoting diversity, inclusion and belonging across our teams. The task force is overseen and guided by our chief people officer and general counsel.
Our DIB task force spent the last year evaluating our Company’s current strengths and opportunities for development by initiating teammate surveys, listening sessions, group focus sessions and training modalities,
* As determined based on the number of claims made under our workers’ compensation policy, excluding claims that were closed and for which no payment was made.
including a course focused on understanding and managing unconscious bias that was assigned to all teammates as a learning opportunity. In 2021, the task force appointed a DIB Leader who serves as a dedicated resource for the team and established a DIB motto—The Power to Be Yourself—which was created and voted upon by our teammates.
Teammate Health and Well-Being
Brown & Brown’s top priority is the total well-being of our teammates. Total well-being at Brown & Brown means physical, emotional, social and financial health and wellness. We know that healthy teammates provide better support to their families, communities and customers, which results in our continued success as a Company. We encourage teammates to stay active, maintain a healthy work-life balance, volunteer in their local communities and prioritize their mental and physical health. This includes regular communication with teammates about the pandemic’s impacts and, when necessary, bi-weekly headlines and information focused on physical, mental and financial wellness.
S O L I C I T I N G
F E E D B A C K
92% of our teammates say
Brown & Brown is a Great
Place to Work®.
T R A I N I N G A N D
D E V E L O P M E N T
Our teammates completed
24,000+ hours of training
through Brown & Brown
University.
C U L T U R E O F C A R I N G
We received $121,000 in
donations to our Brown
& Brown Disaster Relief
Foundation.
H E A L T H A N D S A F E T Y
The Company had no
work-related fatalities and
24 injuries or occupational
diseases.*
We have invested, and continue to invest, in technology security initiatives, information technology policies and resources, and teammate training to mitigate the risk of improper access to private information.
We continuously search for new and innovative ways to further help our customers, support our teammates and contribute to the world around us. This includes our commitment to sustainability and the environment.
The cornerstones of our organization's guiding principles are people, performance, service and innovation. We believe in doing what is best for our customers, communities, teammates, carrier partners and shareholders—always.
We have a long-standing history of community service and are committed to managing our business and community relationships through our Culture of Caring.
C O M M U N I T Y H U M A N C A P I T A L E N V I R O N M E N T D A T A S E C U R I T Y
E S G R E P O R T H I G H L I G H T S
R E A D M O R E A B O U T B R O W N & B R O W N ’ S E S G E F F O R T S I N O U R F U L L 2 0 2 2 E S G R E P O R T — V I S I T I N V E S T O R . B B I N S U R A N C E . C O M .
12
Disclosure Regarding Forward-Looking Statements
Brown & Brown, Inc., together with its subsidiaries (collectively, “we,” “Brown & Brown” or the “Company”), makes “forward-looking statements” within the “safe harbor” provision of the Private Securities Litigation Reform Act of 1995, as amended, throughout this report and in the documents we incorporate by reference into this report, including those relating to the potential effects of the COVID-19 pandemic (“COVID-19”) on the Company’s business, operations, financial performance and prospects. You can identify these statements by forward-looking words such as “may,” “will,” “should,” “expect,” “anticipate,” “believe,” “intend,” “estimate,” “plan” and “continue” or similar words. We have based these statements on our current expectations about potential future events. Although we believe the expectations expressed in the forward-looking statements included in this Annual Report and the reports, statements, information and announcements incorporated by reference into this report are based upon reasonable assumptions within the bounds of our knowledge of our business, a number of factors could cause actual results to differ materially from those expressed in any forward-looking statements, whether oral or written, made by us or on our behalf. Many of these factors have previously been identified in filings or statements made by us or on our behalf. Important factors which could cause our actual results to differ, possibly materially from the forward-looking statements in this report include but are not limited to the following items, in addition to those matters described in “Management’s Discussion and Analysis of Financial Condition and Results of Operations”:
• COVID-19 and the resulting governmental and societal responses, the severity and duration of COVID-19 (including through any new variant strains of the underlying virus), the effectiveness of and accessibility to vaccines, the pace and rate at which vaccines are administered, actions taken by governmental authorities in response to COVID-19 and the direct and indirect impact of COVID-19 on the U.S. economy, the global economy and the Company’s business, liquidity, customers, insurance carriers and third parties;
• The effects of inflation; • The inability to retain or hire qualified employees, as well as the loss of
any of our executive officers or other key employees; • Acquisition-related risks that could negatively affect the success of
our growth strategy, including the possibility that we may not be able to successfully identify suitable acquisition candidates, complete acquisitions, integrate acquired businesses into our operations, and expand into new markets;
• A cybersecurity attack or any other interruption in information technology and/or data security and/or outsourcing relationships;
• The requirement for additional resources and time to adequately respond to dynamics resulting from rapid technological change;
• The loss of or significant change to any of our insurance company relationships, which could result in additional expense, loss of market share or material decrease in our profit-sharing contingent commissions, guaranteed supplemental commissions or incentive commissions;
• Adverse economic conditions, natural disasters, or regulatory changes in states where we have a concentration of our business;
• The inability to maintain our culture or a change in management, management philosophy or our business strategy;
• Risks facing us in our Services segment, including our third-party claims administration operations, that are distinct from hose we face in our insurance intermediary operations;
• The limitations of our system of disclosure and internal controls and procedures in preventing errors or fraud, or in informing management of all material information in a timely manner;
• The significant control certain existing shareholders have over the Company;
• Risks related to our international operations, which result in additional risks and require more management time and expense than our domestic operations to achieve or maintain profitability;
• Changes in data privacy and protection laws and regulations or any failure to comply with such laws and regulations;
• Improper disclosure of confidential information;
• The potential adverse effect of certain actual or potential claims, regulatory actions or proceedings on our businesses, results of operations, financial condition or liquidity;
• Uncertainty in our business practices and compensation arrangements due to potential changes in regulations;
• Regulatory changes that could reduce our profitability or growth by increasing compliance costs, technology compliance, restricting the products or services we may sell, the markets we may enter, the methods by which we may sell our products and services, or the prices we may charge for our services and the form of compensation we may accept from our customers, carriers and third-parties;
• A decrease in demand for liability insurance as a result of tort reform legislation;
• Our failure to comply with any covenants contained in our debt agreements;
• The possibility that covenants in our debt agreements could prevent us from engaging in certain potentially beneficial activities;
• Changes in the U.S.-based credit markets that might adversely affect our business, results of operations and financial condition;
• Risks associated with the current interest rate environment, and to the extent we use debt to finance our investments, changes in interest rates will affect our cost of capital and net investment income;
• Disintermediation within the insurance industry, including increased competition from insurance companies, technology companies and the financial services industry, as well as the shift away from traditional insurance markets;
• Changes in current U.S. or global economic conditions; • Effects related to pandemics, epidemics or outbreaks of infectious
diseases; • Conditions that result in reduced insurer capacity; • Quarterly and annual variations in our commissions that result from the
timing of policy renewals and the net effect of new and lost business production;
• Intangible asset risk, including the possibility that our goodwill may become impaired in the future;
• Other risks and uncertainties as may be detailed from time to time in our public announcements and Securities and Exchange Commission (“SEC”) filings; and
• Other factors that the Company may not have currently identified or quantified.
Assumptions as to any of the foregoing, and all statements, are not based upon historical fact, but rather reflect our current expectations concerning future results and events. Forward-looking statements that we make or that are made by others on our behalf are based upon a knowledge of our business and the environment in which we operate, but because of the factors listed above, among others, actual results may differ from those in the forward-looking statements. Consequently, these cautionary statements qualify all of the forward-looking statements we make herein. We cannot assure you that the results or developments anticipated by us will be realized or, even if substantially realized, will result in the expected consequences for us or affect us, our business or our operations in the way we expect. We caution readers not to place undue reliance on these forward-looking statements. All forward-looking statements made herein are made only as of the date of this filing, the Company does not undertake any obligation to publicly update or correct any forward-looking statements to reflect events or circumstances that subsequently occur or of which the Company hereafter becomes aware.
13
20
21
AN
NU
AL
RE
PO
RT
15 Management’s Discussion and
Analysis of Financial Condition and
Results of Operations
33 Non-GAAP Reconciliation—Income
Before Income Taxes to EBITDAC and
Income Before Income Taxes Margin
to EBITDAC Margin
35 Consolidated Statements of Income
36 Consolidated Statements of
Comprehensive Income
37 Consolidated Balance Sheets
38 Consolidated Statements of
Shareholders’ Equity
39 Consolidated Statements of
Cash Flows
40 Notes to Consolidated
Financial Statements
70 Report of Independent Registered
Public Accounting Firm
73 Management’s Report on Internal
Control Over Financial Reporting
74 Performance Graph
2021 Financial Review
14
Management’s Discussion and Analysis of Financial Condition and Results of Operations
General
Company OverviewThe following discussion should be read in conjunction with our Consolidated Financial Statements and the related Notes to those
Financial Statements included elsewhere in this Annual Report. In addition, please see “Information Regarding Non-GAAP Measures”
below, regarding important information on non-GAAP financial measures contained in our discussion and analysis.
We are a diversified insurance agency, wholesale brokerage, insurance programs and services organization headquartered in Daytona
Beach, Florida. As an insurance intermediary, our principal sources of revenue are commissions paid by insurance companies and, to
a lesser extent, fees paid directly by customers. Commission revenues generally represent a percentage of the premium paid by an
insured and are affected by fluctuations in both premium rate levels charged by insurance companies and the insureds’ underlying
“insurable exposure units,” which are units that insurance companies use to measure or express insurance exposed to risk (such as
property values, sales or payroll levels) to determine what premium to charge the insured. Insurance companies establish these premium
rates based upon many factors, including loss experience, risk profile and reinsurance rates paid by such insurance companies, none
of which we control. We also operate a capitalized captive insurance facility (the “Captive”) for the purpose of having additional capacity
to sell property insurance for earthquake and wind exposed properties. The Captive buys reinsurance, limiting, but not eliminating the
Company’s exposure to underwriting losses and revenues are recognized as net retained earned premiums over the associated policy
periods.
We have increased revenues every year from 1993 to 2021, with the exception of 2009, when our revenues declined 1.0%. Our revenues
grew from $95.6 million in 1993 to $3.1 billion in 2021, reflecting a compound annual growth rate of 13.2%. In the same 28-year period, we
increased net income from $8.1 million to $587.1 million in 2021, a compound annual growth rate of 16.5%.
The volume of business from new and existing customers, fluctuations in insurable exposure units, changes in premium rate levels,
changes in general economic and competitive conditions, a health pandemic, and the occurrence of catastrophic weather events all
affect our revenues. For example, level rates of inflation or a general decline in economic activity could limit increases in the values of
insurable exposure units. Conversely, increasing costs of litigation settlements and awards could cause some customers to seek higher
levels of insurance coverage. Historically, we have grown our revenues as a result of our focus on net new business and acquisitions.
We foster a strong, decentralized sales and service culture which enables responsiveness to changing business conditions and drives
accountability for results.
The term “Organic Revenue,” a non-GAAP measure, is our core commissions and fees less: (i) the core commissions and fees earned
for the first 12 months by newly-acquired operations; (ii) divested business (core commissions and fees generated from offices, books
of business or niches sold or terminated during the comparable period); and (iii) the period over period impact of foreign currency
translation, which is calculated by applying current year foreign exchange rates to the same period in the prior year. The term “core
commissions and fees” excludes profit-sharing contingent commissions and guaranteed supplemental commissions, and therefore
represents the revenues earned directly from specific insurance policies sold, and specific fee-based services rendered. “Organic
Revenue” is reported in this manner in order to express the current year’s core commissions and fees on a comparable basis with the
prior year’s core commissions and fees. The resulting net change reflects the aggregate changes attributable to: (i) net new and lost
accounts; (ii) net changes in our customers’ exposure units; (iii) net changes in insurance premium rates or the commission rate paid
to us by our carrier partners; and (iv) the net change in fees paid to us by our customers. Organic Revenue is reported in “Results of
Operations” and in “Results of Operations - Segment Information” of this Annual Report. In connection with the Captive, we will recognize
revenue starting in 2022 on a net retained earned premiums basis in a manner consistent with core commissions and fees. Beginning
in 2022 we will no longer exclude guaranteed supplemental commissions from core commissions and fees and therefore they will be a
component of Organic Revenue. We anticipate presenting certain prior periods accordingly so that the calculation of Organic Revenue
compares both periods on the same basis. Guaranteed supplemental commissions are a small and increasingly more stable source of
revenue that are highly correlated to core commissions, so excluding them provides no meaningful incremental value in evaluating our
revenue performance. 15
20
21
AN
NU
AL
RE
PO
RT
We also earn “profit-sharing contingent commissions,” which are commissions based primarily on underwriting results, but which may
also reflect considerations for volume, growth and/or retention. These commissions, which are included in our commissions and fees in
the Consolidated Statement of Income, are accrued throughout the year based on actual premiums written and are primarily received
in the first and second quarters of each subsequent year, based upon the aforementioned considerations for the prior year(s). Over the
last three years, profit-sharing contingent commissions have averaged approximately 3.0% of commissions and fees revenue.
Certain insurance companies offer guaranteed fixed-base agreements, referred to as “Guaranteed Supplemental Commissions”
(“GSCs”) in lieu of profit-sharing contingent commissions. GSCs are accrued throughout the year based on actual premiums written.
Over the last three years, GSCs have averaged less than 1.0% of commissions and fees revenue.
Combined, our profit-sharing contingent commissions and GSCs for the year ended December 31, 2021 increased by $14.1 million over
2020. This increase was the result of recent acquisitions and qualifying for certain profit-sharing contingent commissions and GSCs in
2021 that we did not qualify for in the prior year.
Fee revenues primarily relate to services other than securing coverage for our customers, as well as fees negotiated in lieu of
commissions, and are recognized as performance obligations are satisfied. Fee revenues are generated by: (i) our Services segment,
which provides insurance-related services, including third-party claims administration and comprehensive medical utilization
management services in both the workers’ compensation and all-lines liability arenas, as well as Medicare Set-aside services, Social
Security disability and Medicare benefits advocacy services, and claims adjusting services; (ii) our National Programs and Wholesale
Brokerage segments, which earn fees primarily for the issuance of insurance policies on behalf of insurance companies; and (iii) our
Retail segment in our large-account customer base, where we primarily earn fees for securing insurance for our customers, and in
our automobile dealer services (“F&I”) businesses where we primarily earn fees for assisting our customers with creating and selling
warranty and service risk management programs. Fee revenues as a percentage of our total commissions and fees, represented 27.4%
in 2021 and 26.1% in 2020.
For the years ended December 31, 2021 and 2020, our commissions and fees growth rate was 16.9% and 9.3%, respectively, and our
consolidated Organic Revenue growth rate was 10.4% and 3.8%, respectively.
Investment income consists primarily of interest earnings on operating cash, and where permitted, on premiums and advance
premiums collected and held in a fiduciary capacity before being remitted to insurance companies. Our policy is to invest available
funds in high-quality, short-term fixed income investment securities. Investment income also includes gains and losses realized from
the sale of investments. Other income primarily reflects legal settlements and other miscellaneous revenues.
Income before income taxes for the year ended December 31, 2021 increased by $138.7 million over 2020, as a result of net new
business, acquisitions we completed since 2020, and management of our expense base, partially offset by an increase in the change
in estimated acquisition earn-out payables.
Information Regarding Non-GAAP MeasuresIn the discussion and analysis of our results of operations, in addition to reporting financial results in accordance with generally
accepted accounting principles (“GAAP”), we provide references to the following non-GAAP financial measures as defined in
Regulation G of SEC rules: Organic Revenue, Organic Revenue growth, EBITDAC and EBITDAC Margin. EBITDAC is defined as income
before interest, income taxes, depreciation, amortization, and the change in estimated acquisition earn-out payables (“EBITDAC”).
EBITDAC Margin is defined as EBITDAC divided by total revenues. We view these non-GAAP financial measures as important indicators
when assessing and evaluating our performance on a consolidated basis and for each of our segments because they allow us to
determine a more comparable, but non-GAAP, measurement of revenue growth and operating performance that is associated with
the revenue sources that were a part of our business in both the current and prior year. We believe that Organic Revenue provides a
meaningful representation of our operating performance and view Organic Revenue growth as an important indicator when assessing
and evaluating the performance of our four segments. Organic Revenue can be expressed as a dollar amount or a percentage rate
when describing Organic Revenue growth. We use Organic Revenue growth in determining incentive cash compensation and as a
performance measure in our equity incentive grants for our executive officers and other key employees. We use EBITDAC Margin for
incentive cash compensation determinations for our executive officers. We view EBITDAC and EBITDAC Margin as important indicators
of operating performance, because they allow us to determine more comparable, but non-GAAP, measurements of our operating
margins in a meaningful and consistent manner by removing the significant non-cash items of depreciation, amortization, and the
change in estimated acquisition earn-out payables, as well as interest expense and taxes, which are reflective of investment and
financing activities, not operating performance.
These measures are not in accordance with, or an alternative to the GAAP information provided in this Annual Report. We present
such non-GAAP supplemental financial information because we believe such information is of interest to the investment community
and because we believe they provide additional meaningful methods of evaluating certain aspects of our operating performance
from period to period on a basis that may not be otherwise apparent on a GAAP basis. We believe these non-GAAP financial 16
measures improve the comparability of results between periods by eliminating the impact of certain items that have a high degree of
variability. Our industry peers may provide similar supplemental non-GAAP information with respect to one or more of these measures,
although they may not use the same or comparable terminology and may not make identical adjustments. This supplemental financial
information should be considered in addition to, not in lieu of, our Consolidated Financial Statements.
Tabular reconciliations of this supplemental non-GAAP financial information to our most comparable GAAP information are contained in
this Annual Report under “Results of Operation - Segment Information.”
AcquisitionsPart of our business strategy is to attract high-quality insurance intermediaries and service organizations to join our operations. From
1993 through the fourth quarter of 2021, we acquired 580 insurance intermediary operations.
Critical Accounting PoliciesOur Consolidated Financial Statements are prepared in accordance with GAAP. The preparation of these financial statements requires
us to make estimates and judgments that affect the reported amounts of assets, liabilities, revenues and expenses. We continually
evaluate our estimates, which are based upon a combination of historical experience and assumptions that we believe to be
reasonable under the circumstances. These estimates form the basis for our judgments about the recognition of revenues, expenses,
carrying values of our assets and liabilities, of which values are not readily apparent from other sources. Actual results may differ from
these estimates.
We believe that of our significant accounting and reporting policies, the more critical policies include our accounting for revenue
recognition, business combinations and purchase price allocations, intangible asset impairments, non-cash stock-based compensation
and reserves for litigation. In particular, the accounting for these areas requires significant use of judgment to be made by
management. Different assumptions in the application of these policies could result in material changes in our consolidated financial
position or consolidated results of operations.
Revenue RecognitionThe majority of our revenue is commissions derived from our performance as agents and brokers, acting on behalf of insurance
carriers to sell products to customers that are seeking to transfer risk, and conversely, acting on behalf of those customers in
negotiating with insurance carriers seeking to acquire risk in exchange for premiums. In the majority of these arrangements, our
performance obligation is complete upon the effective date of the bound policy, as such, that is when the associated revenue is
recognized. In some arrangements, where we are compensated through commissions, we also perform other services for our
customer beyond binding of coverage. In those arrangements we apportion the commission between binding of coverage and other
services based on their relative fair value and recognize the associated revenue as those performance obligations are satisfied. Where
the Company’s performance obligations have been completed, but the final amount of compensation is unknown due to variable
factors, we estimate the amount of such compensation. We refine those estimates upon our receipt of additional information or final
settlement, whichever occurs first.
To a lesser extent, the Company earns revenues in the form of fees. Like commissions, fees paid to us in lieu of commission, are
recognized upon the effective date of the bound policy. When we are paid a fee for service, however, the associated revenue is
recognized over a period of time that coincides with when the customer simultaneously receives and consumes the benefit of our
work, which characterizes most of our claims processing arrangements and various services performed in our property and casualty,
and employee benefits practices. Other fees are typically recognized upon the completion of the delivery of the agreed-upon services
to the customer.
To a much lesser extent, the Company will earn revenues starting in 2022 in the form of net retained earned premiums in connection
with the Captive, in which the majority of underwriting risk is reinsured and a small portion is retained by the Company. These
premiums are reported net of the ceded premiums for reinsurance and recognized evenly over the associated policy periods.
Management determines a policy cancellation reserve based upon historical cancellation experience adjusted in accordance with
known circumstances.
Please see Note 2 “Revenues” in the “Notes to Consolidated Financial Statements” for additional information regarding the nature and
timing of our revenues.
17
20
21
AN
NU
AL
RE
PO
RT
Business Combinations and Purchase Price AllocationsWe have acquired significant intangible assets through acquisitions of businesses. These assets generally consist of purchased
customer accounts, non-compete agreements, and the excess of purchase prices over the fair value of identifiable net assets acquired
(goodwill). The determination of estimated useful lives and the allocation of purchase price to intangible assets requires significant
judgment and affects the amount of future amortization and possible impairment charges.
In connection with acquisitions, we record the estimated value of the net tangible assets purchased and the value of the identifiable
intangible assets purchased, which typically consist of purchased customer accounts and non-compete agreements. Purchased
customer accounts include the right to represent insureds or claimants supported by the physical records and files obtained from
acquired businesses that contain information about insurance policies, customers and other matters essential to policy renewals of
delivery of services. Their value primarily represents the present value of the underlying cash flows expected to be received over the
estimated future duration of the acquired customer relationships. The valuation of purchased customer accounts involves significant
estimates and assumptions concerning matters such as cancellation frequency, expenses and discount rates. Any change in these
assumptions could affect the carrying value of purchased customer accounts. Non-compete agreements are valued based upon
their duration and any unique features of the particular agreements. Purchased customer accounts and non-compete agreements
are amortized on a straight-line basis over the related estimated lives and contract periods, which typically range from 3 to 15 years.
The excess of the purchase price of an acquisition over the fair value of the identifiable tangible and intangible assets is assigned to
goodwill and is not amortized.
The recorded purchase prices for all acquisitions include an estimation of the fair value of liabilities associated with any potential earn-
out provisions, where an earn-out is part of the negotiated transaction. Subsequent changes in the fair value of earn-out obligations are
recorded in the Consolidated Statement of Income as a result of updated expectations for the performance of the associated business.
The fair value of earn-out obligations is based upon the present value of the expected future payments to be made to the sellers
of the acquired businesses in accordance with the provisions contained in the respective purchase agreements. In determining fair
value, the acquired business’s future performance is estimated using financial projections developed by management for the acquired
business, and this estimate reflects market participant assumptions regarding revenue growth and/or profitability. The expected future
payments are estimated based on the earn-out formula and performance targets specified in each purchase agreement compared to
the associated financial projections. These estimates are then discounted to a present value using a risk-adjusted rate that takes into
consideration the likelihood that the forecast earn-out payments will be made.
Intangible Assets ImpairmentGoodwill is subject to at least an annual assessment for impairment, measured by a fair-value-based test. Amortizable intangible assets
are amortized over their useful lives and are subject to an impairment review based upon an estimate of the undiscounted future cash
flows resulting from the use of the assets. To determine if there is potential impairment of goodwill, we compare the fair value of each
reporting unit with its carrying value. The Company may elect to first perform a qualitative assessment to determine whether it is more
likely than not that a reporting unit is impaired. If the Company does not perform a qualitative assessment, or if it is determined that it is
more likely than not that the fair value of a reporting unit exceeds its carrying amount, the Company will calculate the fair value of the
reporting unit. If the fair value of the reporting unit is less than its carrying value, an impairment loss would be recorded to the extent
that the fair value of the goodwill within the reporting unit is less than its carrying value. Fair value is estimated based upon multiples of
EBITDAC, or on a discounted cash flow basis.
Management assesses the recoverability of our goodwill and our amortizable intangibles and other long-lived assets annually and
whenever events or changes in circumstances indicate that the carrying value of such assets may not be recoverable. Any of the
following factors, if present, may trigger an impairment review: (i) a significant underperformance relative to historical or projected
future operating results, (ii) a significant negative industry or economic trend, and (iii) a significant decline in our market capitalization. If
the recoverability of these assets is unlikely because of the existence of one or more of the above-referenced factors, an impairment
analysis is performed. Management must make assumptions regarding estimated future cash flows and other factors to determine the
fair value of these assets. If these estimates or related assumptions change in the future, we may be required to revise the assessment
and, if appropriate, record an impairment charge. We completed our most recent evaluation of impairment for goodwill as of November
30, 2021 and determined that the fair value of goodwill exceeded the carrying value of such assets. Additionally, there have been no
impairments recorded for amortizable intangible assets for the years ended December 31, 2021 and 2020.
18
Non-Cash Stock-Based CompensationWe grant non-vested stock awards to our employees, with the related compensation expense recognized in the financial statements
over the associated service period based upon the grant-date fair value of those awards. During the performance measurement
period, we review the probable outcome of the performance conditions associated with our performance awards and align the
expense accruals with the expected performance outcome.
During the first quarter of 2021, the performance conditions for approximately 1.2 million shares of the Company’s common stock
granted under the Company’s 2010 SIP and approximately 22,000 shares of the Company’s common stock granted under the
Company’s 2019 SIP were determined by the Compensation Committee to have been satisfied relative to performance-based grants
issued in 2018 and 2020. These grants had a performance measurement period that concluded on December 31, 2020. The vesting
condition for these grants requires continuous employment for a period of up to five years from the 2018 grant date and four years
from the 2020 grant date in order for the awarded shares to become fully vested and nonforfeitable. As a result of the awarding of
these shares, the grantees will be eligible to receive payments of dividends and exercise voting privileges after the awarding date,
and the awarded shares will be included as issued and outstanding common stock shares and included in the calculation of basic and
diluted net income per share.
During the first quarter of 2022, the performance conditions for approximately 1.3 million shares of the Company’s common stock
granted under the Company’s 2010 SIP and approximately 22,000 shares of the Company’s common stock granted under the
Company’s 2019 SIP were determined by the Compensation Committee to have been satisfied relative to performance-based grants
issued in 2019 and 2021. These grants had a performance measurement period that concluded on December 31, 2021. The vesting
condition for these grants requires continuous employment for a period of up to five years from the 2019 grant date and four years
from the 2021 grant date in order for the awarded shares to become fully vested and nonforfeitable. As a result of the awarding of
these shares, the grantees will be eligible to receive payments of dividends and exercise voting privileges after the awarding date,
and the awarded shares will be included as issued and outstanding common stock shares and included in the calculation of basic and
diluted net income per share.
Litigation and ClaimsWe are subject to numerous litigation claims that arise in the ordinary course of business. If it is probable that a liability has been
incurred at the date of the financial statements and the amount of the loss is estimable, an accrual for the costs to resolve these claims
is recorded in accrued expenses in the accompanying Consolidated Financial Statements. Professional fees related to these claims
are included in other operating expenses in the accompanying Consolidated Statement of Income as incurred. Management, with
the assistance of in-house and outside counsel, determines whether it is probable that a liability has been incurred and estimates the
amount of loss based upon analysis of individual issues. New developments or changes in settlement strategy in dealing with these
matters may significantly affect the required reserves and affect our net income.
19
20
21
AN
NU
AL
RE
PO
RT
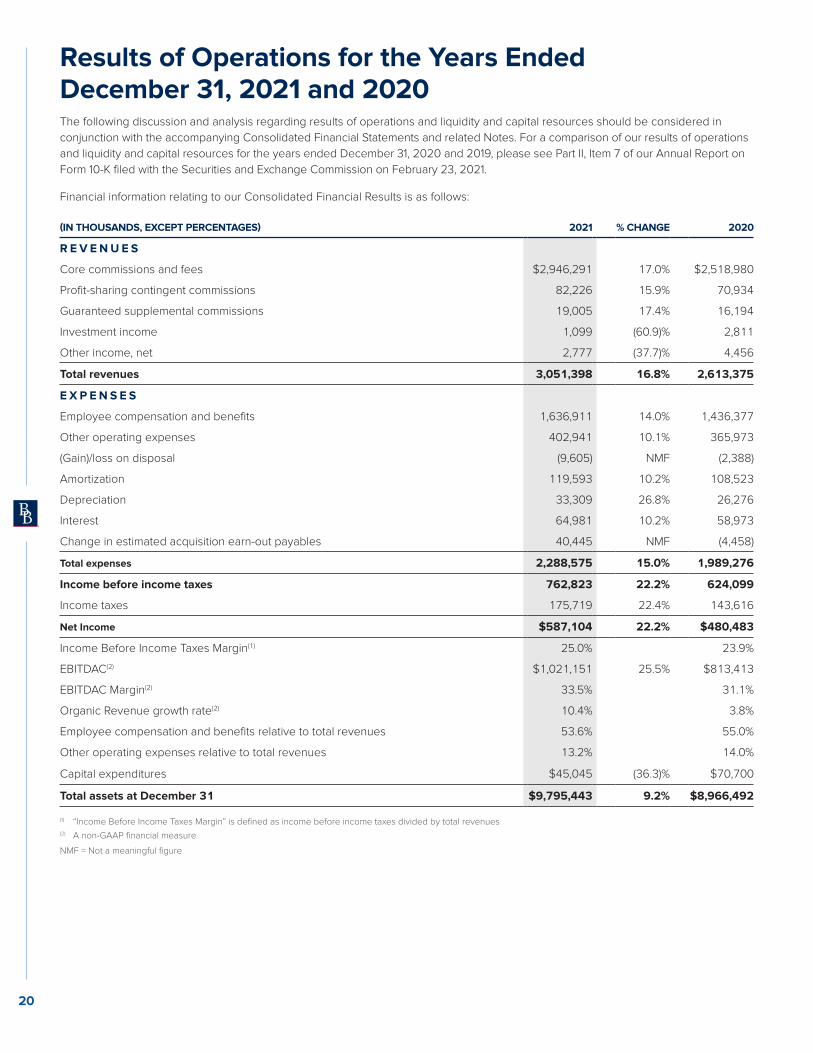
Results of Operations for the Years Ended December 31, 2021 and 2020The following discussion and analysis regarding results of operations and liquidity and capital resources should be considered in
conjunction with the accompanying Consolidated Financial Statements and related Notes. For a comparison of our results of operations
and liquidity and capital resources for the years ended December 31, 2020 and 2019, please see Part II, Item 7 of our Annual Report on
Form 10-K filed with the Securities and Exchange Commission on February 23, 2021.
Financial information relating to our Consolidated Financial Results is as follows:
(IN THOUSANDS, EXCEPT PERCENTAGES) 2021 % CHANGE 2020
R E V E N U E S
Core commissions and fees $2,946,291 17.0% $2,518,980
Profit-sharing contingent commissions 82,226 15.9% 70,934
Guaranteed supplemental commissions 19,005 17.4% 16,194
Investment income 1,099 (60.9)% 2,811
Other income, net 2,777 (37.7)% 4,456
Total revenues 3,051,398 16.8% 2,613,375
E X P E N S E S
Employee compensation and benefits 1,636,911 14.0% 1,436,377
Other operating expenses 402,941 10.1% 365,973
(Gain)/loss on disposal (9,605) NMF (2,388)
Amortization 119,593 10.2% 108,523
Depreciation 33,309 26.8% 26,276
Interest 64,981 10.2% 58,973
Change in estimated acquisition earn-out payables 40,445 NMF (4,458)
Total expenses 2,288,575 15.0% 1,989,276
Income before income taxes 762,823 22.2% 624,099
Income taxes 175,719 22.4% 143,616
Net Income $587,104 22.2% $480,483
Income Before Income Taxes Margin(1) 25.0% 23.9%
EBITDAC(2) $1,021,151 25.5% $813,413
EBITDAC Margin(2) 33.5% 31.1%
Organic Revenue growth rate(2) 10.4% 3.8%
Employee compensation and benefits relative to total revenues 53.6% 55.0%
Other operating expenses relative to total revenues 13.2% 14.0%
Capital expenditures $45,045 (36.3)% $70,700
Total assets at December 31 $9,795,443 9.2% $8,966,492
(1) “Income Before Income Taxes Margin” is defined as income before income taxes divided by total revenues(2) A non-GAAP financial measure
NMF = Not a meaningful figure
20
Commissions and FeesCommissions and fees, including profit-sharing contingent commissions and GSCs for 2021, increased $441.4 million to $3,047.5 million,
or 16.9% over 2020. Core commissions and fees in 2021 increased $427.3 million, composed of (i) $261.3 million of net new and renewal
business, which reflects an Organic Revenue growth rate of 10.4%; (ii) $170.1 million from acquisitions that had no comparable revenues in the
same period of 2020; (iii) a positive impact from foreign currency translation of $1.2 million; and
(iv) an offsetting decrease of $5.3 million related to commissions and fees revenue from business divested in the preceding 12 months.
Profit-sharing contingent commissions and GSCs for 2021 increased by $14.1 million, or 16.2%, compared to the same period in 2020. This
increase was the result of recent acquisitions and qualifying for certain profit-sharing contingent commissions and GSCs in 2021 that we did
not qualify for in the prior year.
Investment IncomeInvestment income decreased to $1.1 million in 2021, compared with $2.8 million in 2020. The decrease was primarily due to lower
interest rates as compared to the prior year.
Other Income, NetOther income for 2021 was $2.7 million, compared with $4.5 million in 2020. Other income consists primarily of legal settlements and
other miscellaneous income.
Employee Compensation and BenefitsEmployee compensation and benefits expense as a percentage of total revenues was 53.6% for the year ended December 31, 2021
as compared to 55.0% for the year ended December 31, 2020, and increased 14.0%, or $200.5 million. This increase included $70.7
million of compensation costs related to stand-alone acquisitions that had no comparable costs in the same period of 2020. Therefore,
employee compensation and benefits expense attributable to those offices that existed in the same time periods of 2021 and 2020
increased by $129.8 million or 9.2%. This underlying employee compensation and benefits expense increase was primarily related to:
(i) an increase in staff salaries attributable to salary inflation; (ii) an increase in accrued performance bonuses; and (iii) an increase in
producer compensation associated with revenue growth.
Other Operating ExpensesOther operating expenses represented 13.2% of total revenues for 2021 as compared to 14.0% for the year ended December 31, 2020.
Other operating expenses for 2021 increased $37.0 million, or 10.1%, from the same period of 2020 growing slower than revenues. The
net increase included: (i) $40.2 million of other operating expenses related to stand-alone acquisitions that had no comparable costs
in the same period of 2020; (ii) increased data processing costs as we invest in our business to drive future growth; (iii) slightly higher
variable operating expenses, including travel and entertainment and meeting-related expenses; partially offset by (iv) non-recurring legal
costs and the write-off recorded in 2020 of certain receivables in one of our programs where it was determined the collectability was in
doubt and which did not recur in 2021.
Gain or Loss on DisposalThe Company recognized net gains on disposals of $9.6 million in 2021 and $2.4 million in 2020. The change in the net gain on disposal
was due to activity associated with sales of businesses or portions of businesses. Although we are not in the business of selling customer
accounts, we periodically sell an office or a book of business (one or more customer accounts) that we believe does not produce
reasonable margins or demonstrate a potential for growth, or because doing so is in the Company’s best interest.
AmortizationAmortization expense for 2021 increased $11.1 million to $119.6 million, or 10.2% over 2020. This increase reflects the amortization of new
intangibles from businesses acquired within the past 12 months, partially offset by certain intangible assets becoming fully amortized.
21
20
21
AN
NU
AL
RE
PO
RT

DepreciationDepreciation expense for 2021 increased $7.0 million to $33.3 million, or 26.8% over 2020. Changes in depreciation expense reflect
the addition of fixed assets resulting from business initiatives, net additions of fixed assets resulting from businesses acquired in the
past 12 months, partially offset by fixed assets which became fully depreciated.
Interest ExpenseInterest expense for 2021 increased $6.0 million to $65.0 million, or 10.2%, from 2020. The increase is due to higher average debt
balances from increased borrowings associated with the issuance of bonds in September 2020, partially offset by the decrease in
interest rates associated with our floating rate debt balances.
Change in Estimated Acquisition Earn-Out PayablesAccounting Standards Codification (“ASC”) Topic 805-Business Combinations is the authoritative guidance requiring an acquirer to
recognize 100% of the fair value of acquired assets, including goodwill and assumed liabilities (with only limited exceptions) upon
initially obtaining control of an acquired entity. Additionally, the fair value of contingent consideration arrangements (such as earn-out
purchase price arrangements) at the acquisition date must be included in the purchase price consideration. The recorded purchase
price for acquisitions includes an estimation of the fair value of liabilities associated with any potential earn-out provisions. Subsequent
changes in these earn-out obligations are required to be recorded in the Consolidated Statement of Income when incurred or
reasonably estimated. Estimations of potential earn-out obligations are typically based upon future earnings of the acquired operations
or entities, usually for periods ranging from one to three years.
The net charge or credit to the Consolidated Statement of Income for the period is the combination of the net change in the estimated
acquisition earn-out payables balance, and the interest expense imputed on the outstanding balance of the estimated acquisition earn-
out payables.
As of December 31, 2021, the fair values of the estimated acquisition earn-out payables were reevaluated and measured at fair
value on a recurring basis using unobservable inputs (Level 3) as defined in ASC 820-Fair Value Measurement. The resulting
net changes, as well as the interest expense accretion on the estimated acquisition earn-out payables, for the years ended
December 31, 2021 and 2020 were as follows:
(IN THOUSANDS) 2021 2020
Change in fair value of estimated acquisition earn-out payables $34,209 $(11,814)
Interest expense accretion 6,236 7,356
Net change in earnings from estimated acquisition earn-out payables $40,445 $(4,458)
For the years ended December 31, 2021 and 2020, the fair value of estimated earn-out payables was reevaluated and increased by
$34.2 million for 2021 and decreased by $11.8 million for 2020, which are charges and credits respectively, net of interest expense
accretion, to the Consolidated Statement of Income for 2021 and 2020.
As of December 31, 2021, the estimated acquisition earn-out payables equaled $291.0 million, of which $78.4 million was recorded as
accounts payable and $212.6 million was recorded as other non-current liabilities. As of December 31, 2020, the estimated acquisition
earn-out payables equaled $258.9 million, of which $79.2 million was recorded as accounts payable and $179.7 million was recorded
as other non-current liabilities.
Income Taxes
The effective tax rate on income from operations was 23.0% in 2021 and 2020.
Results of Operations — Segment InformationAs discussed in Note 16 “Segment Information” of the Notes to Consolidated Financial Statements, we operate four reportable
segments: Retail, National Programs, Wholesale Brokerage and Services. On a segmented basis, changes in amortization, depreciation
and interest expenses generally result from activity associated with acquisitions. Likewise, other revenues in each segment reflects
net gains primarily from legal settlements and miscellaneous income. As such, in evaluating the operational efficiency of a segment,
management focuses on the Organic Revenue growth rate and EBITDAC margin.
22
The reconciliation of total commissions and fees included in the Consolidated Statements of Income to Organic Revenue, a non-
GAAP financial measure, including by segment, and the growth rates for Organic Revenue for the year ended December 31, 2021
are as follows:
2021 RETAIL(1)
NATIONAL PROGRAMS
WHOLESALE BROKERAGE SERVICES TOTAL
(IN THOUSANDS, EXCEPT PERCENTAGES) 2021 2020 2021 2020 2021 2020 2021 2020 2021 2020
Commissions and fees $1,764,922 $1,470,093 $701,108 $609,842 $402,635 $352,161 $178,857 $174,012 $3,047,522 $2,606,108
Total change $294,829 $91,266 $50,474 $4,845 $ 441,414
Total growth % 20.1 % 15.0% 14.3% 2.8% 16.9%
Profit-sharing contingent commissions (38,895) (35,785) (35,259) (27,278) (8,072) (7,871) — — (82,226) (70,934)
GSCs (16,452) (15,128) (1,619) 238 (934) (1,304) — — (19,005) (16,194)
Core commissions and fees $1,709,575 $1,419,180 $664,230 $582,802 $393,629 $342,986 $178,857 $174,012 $2,946,291 $2,518,980
Acquisitions (138,968) — (8,151) — (22,998) — — — (170,117) —
Dispositions — (4,403) — (478) — — — (364) — (5,245)
Foreign currency translation — — — 1,161 — — — — — 1,161
Organic Revenue(2) $1,570,607 $1,414,777 $656,079 $583,485 $370,631 $342,986 $178,857 $173,648 $2,776,174 $2,514,896
Organic Revenue growth(2) $155,830 $72,594 $27,645 $5,209 $261,278
Organic Revenue growth rate(2) 11.0% 12.4% 8.1% 3.0% 10.4%
(1) The Retail segment includes commissions and fees reported in the “Other” column of the Segment Information table in Note 16 of the Notes to the Consolidated Financial
Statements, which includes corporate and consolidation items.
(2) A non-GAAP financial measure.
The reconciliation of total commissions and fees included in the Consolidated Statements of Income to Organic Revenue, a non-
GAAP financial measure, including by segment, and the growth rates for Organic Revenue for the year ended December 31, 2020, by
segment, are as follows:
2020 RETAIL(1)
NATIONAL PROGRAMS
WHOLESALE BROKERAGE SERVICES TOTAL
(IN THOUSANDS, EXCEPT PERCENTAGES) 2020 2019 2020 2019 2020 2019 2020 2019 2020 2019
Commissions and fees $1,470,093 $1,364,755 $609,842 $516,915 $352,161 $309,426 $174,012 $193,641 $2,606,108 $2,384,737
Total change $105,338 $92,927 $42,735 $(19,629) $221,371
Total growth % 7.7% 18.0% 13.8% (10.1)% 9.3%
Profit-sharing contingent commissions (35,785) (34,150) (27,278) (17,517) (7,871) (7,499) — — (70,934) (59,166)
GSCs (15,128) (11,056) 238 (10,566) (1,304) (1,443) — — (16,194) (23,065)
Core commissions and fees $1,419,180 $1,319,549 $582,802 $488,832 $342,986 $300,484 $174,012 $193,641 $2,518,980 $2,302,506
Acquisitions (79,580) — (34,173) — (25,861) — (1,484) — (141,098) —
Dispositions — (11,772) — (377) — — — — — (12,149)
Foreign currency translation — — — — — — — — — —
Organic Revenue(2) $1,339,600 $1,307,777 $548,629 $488,455 $317,125 $300,484 $172,528 $193,641 $2,377,882 $2,290,357
Organic Revenue growth(2) $31,823 $60,174 $16,641 $(21,113) $87,525
Organic Revenue growth rate(2) 2.4% 12.3 % 5.5% (10.9)% 3.8%
(1) The Retail segment includes commissions and fees reported in the “Other” column of the Segment Information table in Note 16 of the Notes to the Consolidated Financial
Statements, which includes corporate and consolidation items.
(2) A non-GAAP financial measure.
23
20
21
AN
NU
AL
RE
PO
RT
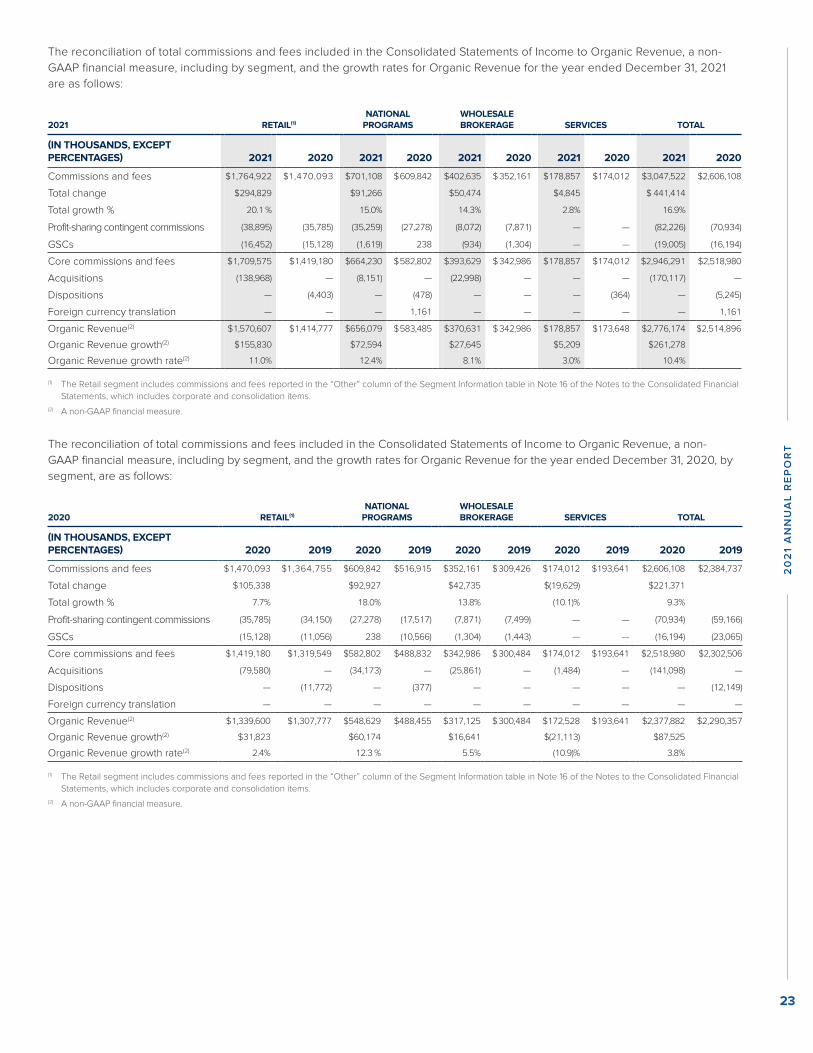
DepreciationDepreciation expense for 2021 increased $7.0 million to $33.3 million, or 26.8% over 2020. Changes in depreciation expense reflect
the addition of fixed assets resulting from business initiatives, net additions of fixed assets resulting from businesses acquired in the
past 12 months, partially offset by fixed assets which became fully depreciated.
Interest ExpenseInterest expense for 2021 increased $6.0 million to $65.0 million, or 10.2%, from 2020. The increase is due to higher average debt
balances from increased borrowings associated with the issuance of bonds in September 2020, partially offset by the decrease in
interest rates associated with our floating rate debt balances.
Change in Estimated Acquisition Earn-Out PayablesAccounting Standards Codification (“ASC”) Topic 805-Business Combinations is the authoritative guidance requiring an acquirer to
recognize 100% of the fair value of acquired assets, including goodwill and assumed liabilities (with only limited exceptions) upon
initially obtaining control of an acquired entity. Additionally, the fair value of contingent consideration arrangements (such as earn-out
purchase price arrangements) at the acquisition date must be included in the purchase price consideration. The recorded purchase
price for acquisitions includes an estimation of the fair value of liabilities associated with any potential earn-out provisions. Subsequent
changes in these earn-out obligations are required to be recorded in the Consolidated Statement of Income when incurred or
reasonably estimated. Estimations of potential earn-out obligations are typically based upon future earnings of the acquired operations
or entities, usually for periods ranging from one to three years.
The net charge or credit to the Consolidated Statement of Income for the period is the combination of the net change in the estimated
acquisition earn-out payables balance, and the interest expense imputed on the outstanding balance of the estimated acquisition earn-
out payables.
As of December 31, 2021, the fair values of the estimated acquisition earn-out payables were reevaluated and measured at fair
value on a recurring basis using unobservable inputs (Level 3) as defined in ASC 820-Fair Value Measurement. The resulting
net changes, as well as the interest expense accretion on the estimated acquisition earn-out payables, for the years ended
December 31, 2021 and 2020 were as follows:
(IN THOUSANDS) 2021 2020
Change in fair value of estimated acquisition earn-out payables $34,209 $(11,814)
Interest expense accretion 6,236 7,356
Net change in earnings from estimated acquisition earn-out payables $40,445 $(4,458)
For the years ended December 31, 2021 and 2020, the fair value of estimated earn-out payables was reevaluated and increased by
$34.2 million for 2021 and decreased by $11.8 million for 2020, which are charges and credits respectively, net of interest expense
accretion, to the Consolidated Statement of Income for 2021 and 2020.
As of December 31, 2021, the estimated acquisition earn-out payables equaled $291.0 million, of which $78.4 million was recorded as
accounts payable and $212.6 million was recorded as other non-current liabilities. As of December 31, 2020, the estimated acquisition
earn-out payables equaled $258.9 million, of which $79.2 million was recorded as accounts payable and $179.7 million was recorded
as other non-current liabilities.
Income Taxes
The effective tax rate on income from operations was 23.0% in 2021 and 2020.
Results of Operations — Segment InformationAs discussed in Note 16 “Segment Information” of the Notes to Consolidated Financial Statements, we operate four reportable
segments: Retail, National Programs, Wholesale Brokerage and Services. On a segmented basis, changes in amortization, depreciation
and interest expenses generally result from activity associated with acquisitions. Likewise, other revenues in each segment reflects
net gains primarily from legal settlements and miscellaneous income. As such, in evaluating the operational efficiency of a segment,
management focuses on the Organic Revenue growth rate and EBITDAC margin.
22
The reconciliation of total commissions and fees included in the Consolidated Statements of Income to Organic Revenue, a non-
GAAP financial measure, including by segment, and the growth rates for Organic Revenue for the year ended December 31, 2021
are as follows:
2021 RETAIL(1)
NATIONAL PROGRAMS
WHOLESALE BROKERAGE SERVICES TOTAL
(IN THOUSANDS, EXCEPT PERCENTAGES) 2021 2020 2021 2020 2021 2020 2021 2020 2021 2020
Commissions and fees $1,764,922 $1,470,093 $701,108 $609,842 $402,635 $352,161 $178,857 $174,012 $3,047,522 $2,606,108
Total change $294,829 $91,266 $50,474 $4,845 $ 441,414
Total growth % 20.1 % 15.0% 14.3% 2.8% 16.9%
Profit-sharing contingent commissions (38,895) (35,785) (35,259) (27,278) (8,072) (7,871) — — (82,226) (70,934)
GSCs (16,452) (15,128) (1,619) 238 (934) (1,304) — — (19,005) (16,194)
Core commissions and fees $1,709,575 $1,419,180 $664,230 $582,802 $393,629 $342,986 $178,857 $174,012 $2,946,291 $2,518,980
Acquisitions (138,968) — (8,151) — (22,998) — — — (170,117) —
Dispositions — (4,403) — (478) — — — (364) — (5,245)
Foreign currency translation — — — 1,161 — — — — — 1,161
Organic Revenue(2) $1,570,607 $1,414,777 $656,079 $583,485 $370,631 $342,986 $178,857 $173,648 $2,776,174 $2,514,896
Organic Revenue growth(2) $155,830 $72,594 $27,645 $5,209 $261,278
Organic Revenue growth rate(2) 11.0% 12.4% 8.1% 3.0% 10.4%
(1) The Retail segment includes commissions and fees reported in the “Other” column of the Segment Information table in Note 16 of the Notes to the Consolidated Financial
Statements, which includes corporate and consolidation items.
(2) A non-GAAP financial measure.
The reconciliation of total commissions and fees included in the Consolidated Statements of Income to Organic Revenue, a non-
GAAP financial measure, including by segment, and the growth rates for Organic Revenue for the year ended December 31, 2020, by
segment, are as follows:
2020 RETAIL(1)
NATIONAL PROGRAMS
WHOLESALE BROKERAGE SERVICES TOTAL
(IN THOUSANDS, EXCEPT PERCENTAGES) 2020 2019 2020 2019 2020 2019 2020 2019 2020 2019
Commissions and fees $1,470,093 $1,364,755 $609,842 $516,915 $352,161 $309,426 $174,012 $193,641 $2,606,108 $2,384,737
Total change $105,338 $92,927 $42,735 $(19,629) $221,371
Total growth % 7.7% 18.0% 13.8% (10.1)% 9.3%
Profit-sharing contingent commissions (35,785) (34,150) (27,278) (17,517) (7,871) (7,499) — — (70,934) (59,166)
GSCs (15,128) (11,056) 238 (10,566) (1,304) (1,443) — — (16,194) (23,065)
Core commissions and fees $1,419,180 $1,319,549 $582,802 $488,832 $342,986 $300,484 $174,012 $193,641 $2,518,980 $2,302,506
Acquisitions (79,580) — (34,173) — (25,861) — (1,484) — (141,098) —
Dispositions — (11,772) — (377) — — — — — (12,149)
Foreign currency translation — — — — — — — — — —
Organic Revenue(2) $1,339,600 $1,307,777 $548,629 $488,455 $317,125 $300,484 $172,528 $193,641 $2,377,882 $2,290,357
Organic Revenue growth(2) $31,823 $60,174 $16,641 $(21,113) $87,525
Organic Revenue growth rate(2) 2.4% 12.3 % 5.5% (10.9)% 3.8%
(1) The Retail segment includes commissions and fees reported in the “Other” column of the Segment Information table in Note 16 of the Notes to the Consolidated Financial
Statements, which includes corporate and consolidation items.
(2) A non-GAAP financial measure.
23
20
21
AN
NU
AL
RE
PO
RT
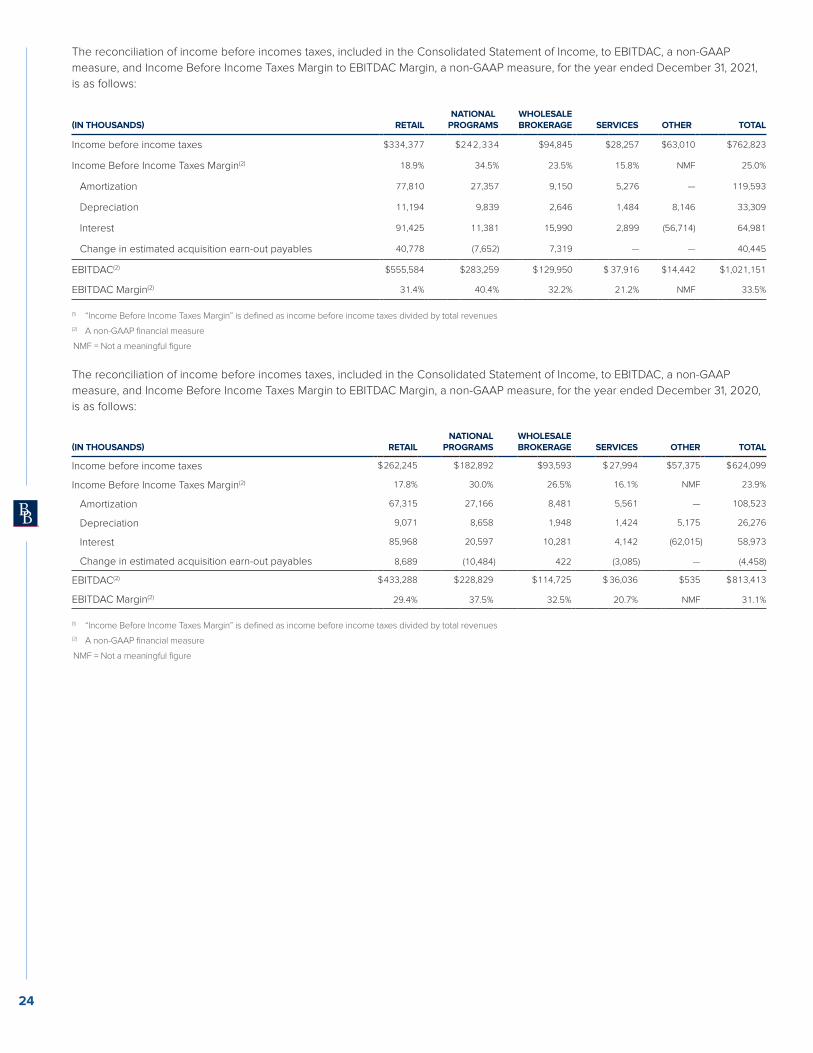
The reconciliation of income before incomes taxes, included in the Consolidated Statement of Income, to EBITDAC, a non-GAAP
measure, and Income Before Income Taxes Margin to EBITDAC Margin, a non-GAAP measure, for the year ended December 31, 2021,
is as follows:
(IN THOUSANDS) RETAILNATIONAL
PROGRAMSWHOLESALE BROKERAGE SERVICES OTHER TOTAL
Income before income taxes $334,377 $242,334 $94,845 $28,257 $63,010 $762,823
Income Before Income Taxes Margin(2) 18.9% 34.5% 23.5% 15.8% NMF 25.0%
Amortization 77,810 27,357 9,150 5,276 — 119,593
Depreciation 11,194 9,839 2,646 1,484 8,146 33,309
Interest 91,425 11,381 15,990 2,899 (56,714) 64,981
Change in estimated acquisition earn-out payables 40,778 (7,652) 7,319 — — 40,445
EBITDAC(2) $555,584 $283,259 $129,950 $ 37,916 $14,442 $1,021,151
EBITDAC Margin(2) 31.4% 40.4% 32.2% 21.2% NMF 33.5%
(1) “Income Before Income Taxes Margin” is defined as income before income taxes divided by total revenues
(2) A non-GAAP financial measure
NMF = Not a meaningful figure
The reconciliation of income before incomes taxes, included in the Consolidated Statement of Income, to EBITDAC, a non-GAAP
measure, and Income Before Income Taxes Margin to EBITDAC Margin, a non-GAAP measure, for the year ended December 31, 2020,
is as follows:
(IN THOUSANDS) RETAILNATIONAL
PROGRAMSWHOLESALEBROKERAGE SERVICES OTHER TOTAL
Income before income taxes $262,245 $182,892 $93,593 $27,994 $57,375 $624,099
Income Before Income Taxes Margin(2) 17.8% 30.0% 26.5% 16.1% NMF 23.9%
Amortization 67,315 27,166 8,481 5,561 — 108,523
Depreciation 9,071 8,658 1,948 1,424 5,175 26,276
Interest 85,968 20,597 10,281 4,142 (62,015) 58,973
Change in estimated acquisition earn-out payables 8,689 (10,484) 422 (3,085) — (4,458)
EBITDAC(2) $433,288 $228,829 $114,725 $36,036 $535 $813,413
EBITDAC Margin(2) 29.4% 37.5% 32.5% 20.7% NMF 31.1%
(1) “Income Before Income Taxes Margin” is defined as income before income taxes divided by total revenues
(2) A non-GAAP financial measure
NMF = Not a meaningful figure
24
Retail SegmentThe Retail segment provides a broad range of insurance products and services to commercial, public and quasi-public, professional
and individual insured customers, and non-insurance risk-mitigating products through our automobile dealer services (“F&I”)
businesses. Approximately 76.4% of the Retail segment’s commissions and fees revenue is commission based.
Financial information relating to our Retail segment for the 12 months ended December 31, 2021 and 2020 is as follows:
(IN THOUSANDS, EXCEPT PERCENTAGES) 2021 % CHANGE 2020
R E V E N U E S
Core commissions and fees $1,711,320 20.5% $1,420,439
Profit-sharing contingent commissions 38,895 8.7% 35,785
Guaranteed supplemental commissions 16,452 8.8% 15,128
Investment income 278 70.6% 163
Other income, net 993 (20.6)% 1,251
Total revenues 1,767,938 20.0% 1,472,766
E X P E N S E S
Employee compensation and benefits 949,351 15.7% 820,368
Other operating expenses 268,126 21.1% 221,496
(Gain)/loss on disposal (5,123) 114.7% (2,386)
Amortization 77,810 15.6% 67,315
Depreciation 11,194 23.4% 9,071
Interest 91,425 6.3% 85,968
Change in estimated acquisition earn-out payables 40,778 NMF 8,689
Total expenses 1,433,561 18.4% 1,210,521
Income before income taxes $334,377 27.5% $262,245
Income Before Income Taxes Margin(1) 18.9% 17.8%
EBITDAC(2) 555,584 28.2% 433,288
EBITDAC Margin(2) 31.4% 29.4%
Organic Revenue growth rate(2) 11.0% 2.4%
Employee compensation and benefits relative to total revenues 53.7% 55.7%
Other operating expenses relative to total revenues 15.2% 15.0%
Capital expenditures $8,093 (38.6)% $13,175
Total assets at December 31(3) $5,040,706 (28.9)% $7,093,627
(1) “Income Before Income Taxes Margin” is defined as income before income taxes divided by total revenues
(2) A non-GAAP financial measure
(3) As of December 31, 2021, the Company settled the historical accumulation of the cash outlays paid by Corporate reducing the total assets at the segment level with no effect on
the consolidated company
NMF = Not a meaningful figure
The Retail segment’s total revenues in 2021 increased 20.0%, or $295.2 million, over the same period in 2020, to $1,767.9 million. The
$290.9 million increase in core commissions and fees was driven by the following: (i) $156.3 million related to net new and renewal
business; (ii) approximately $139.0 million related to the core commissions and fees from acquisitions that had no comparable revenues
in the same period of 2020; offset by (iii) a decrease of $4.4 million related to commissions and fees from businesses or books of
business divested in 2020 and 2021. Profit-sharing contingent commissions and GSCs in 2021 increased 8.7%, or $4.4 million, over
2020, to $55.3 million primarily from acquisitions completed in 2020 and 2021. The Retail segment’s growth rate for total commissions
and fees was 20.1% and the Organic Revenue growth rate was 11.0% for 2021. The Organic Revenue growth rate was driven by net new
business written during the preceding 12 months and growth on renewals of existing customers. Renewal business was impacted by
rate increases in most lines of business and some modest expansion of exposure units.
25
20
21
AN
NU
AL
RE
PO
RT
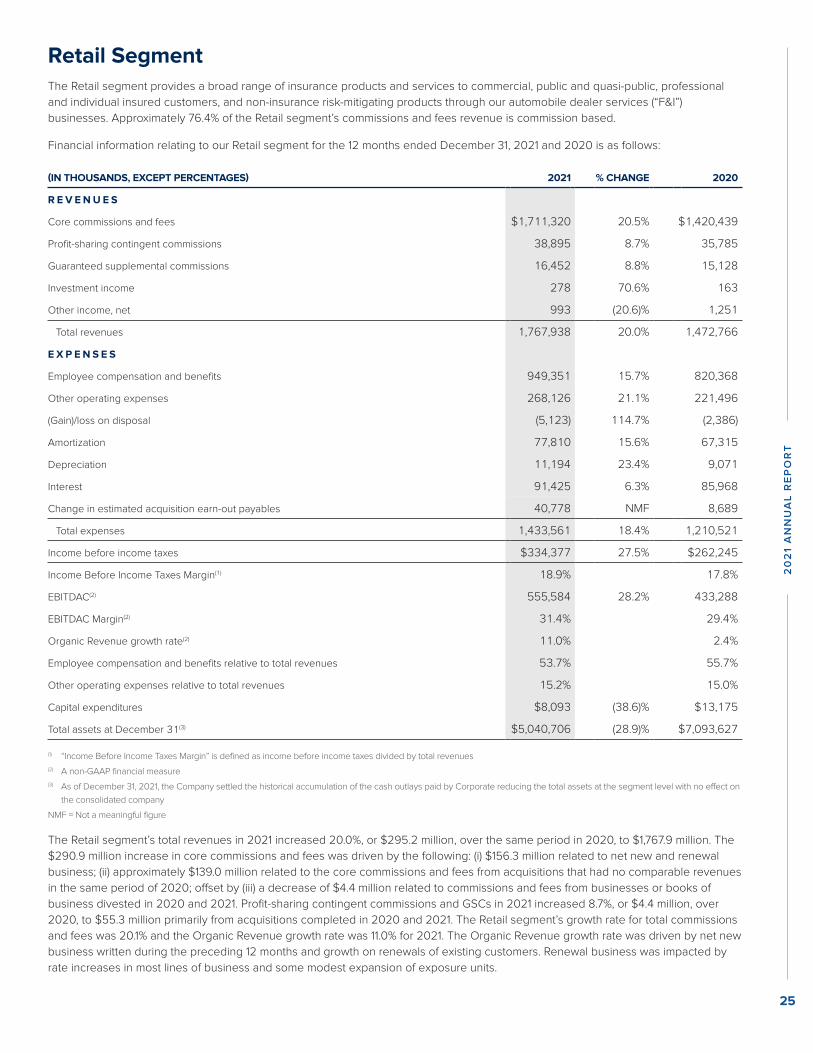
The reconciliation of income before incomes taxes, included in the Consolidated Statement of Income, to EBITDAC, a non-GAAP
measure, and Income Before Income Taxes Margin to EBITDAC Margin, a non-GAAP measure, for the year ended December 31, 2021,
is as follows:
(IN THOUSANDS) RETAILNATIONAL
PROGRAMSWHOLESALE BROKERAGE SERVICES OTHER TOTAL
Income before income taxes $334,377 $242,334 $94,845 $28,257 $63,010 $762,823
Income Before Income Taxes Margin(2) 18.9% 34.5% 23.5% 15.8% NMF 25.0%
Amortization 77,810 27,357 9,150 5,276 — 119,593
Depreciation 11,194 9,839 2,646 1,484 8,146 33,309
Interest 91,425 11,381 15,990 2,899 (56,714) 64,981
Change in estimated acquisition earn-out payables 40,778 (7,652) 7,319 — — 40,445
EBITDAC(2) $555,584 $283,259 $129,950 $ 37,916 $14,442 $1,021,151
EBITDAC Margin(2) 31.4% 40.4% 32.2% 21.2% NMF 33.5%
(1) “Income Before Income Taxes Margin” is defined as income before income taxes divided by total revenues
(2) A non-GAAP financial measure
NMF = Not a meaningful figure
The reconciliation of income before incomes taxes, included in the Consolidated Statement of Income, to EBITDAC, a non-GAAP
measure, and Income Before Income Taxes Margin to EBITDAC Margin, a non-GAAP measure, for the year ended December 31, 2020,
is as follows:
(IN THOUSANDS) RETAILNATIONAL
PROGRAMSWHOLESALEBROKERAGE SERVICES OTHER TOTAL
Income before income taxes $262,245 $182,892 $93,593 $27,994 $57,375 $624,099
Income Before Income Taxes Margin(2) 17.8% 30.0% 26.5% 16.1% NMF 23.9%
Amortization 67,315 27,166 8,481 5,561 — 108,523
Depreciation 9,071 8,658 1,948 1,424 5,175 26,276
Interest 85,968 20,597 10,281 4,142 (62,015) 58,973
Change in estimated acquisition earn-out payables 8,689 (10,484) 422 (3,085) — (4,458)
EBITDAC(2) $433,288 $228,829 $114,725 $36,036 $535 $813,413
EBITDAC Margin(2) 29.4% 37.5% 32.5% 20.7% NMF 31.1%
(1) “Income Before Income Taxes Margin” is defined as income before income taxes divided by total revenues
(2) A non-GAAP financial measure
NMF = Not a meaningful figure
24
Retail SegmentThe Retail segment provides a broad range of insurance products and services to commercial, public and quasi-public, professional
and individual insured customers, and non-insurance risk-mitigating products through our automobile dealer services (“F&I”)
businesses. Approximately 76.4% of the Retail segment’s commissions and fees revenue is commission based.
Financial information relating to our Retail segment for the 12 months ended December 31, 2021 and 2020 is as follows:
(IN THOUSANDS, EXCEPT PERCENTAGES) 2021 % CHANGE 2020
R E V E N U E S
Core commissions and fees $1,711,320 20.5% $1,420,439
Profit-sharing contingent commissions 38,895 8.7% 35,785
Guaranteed supplemental commissions 16,452 8.8% 15,128
Investment income 278 70.6% 163
Other income, net 993 (20.6)% 1,251
Total revenues 1,767,938 20.0% 1,472,766
E X P E N S E S
Employee compensation and benefits 949,351 15.7% 820,368
Other operating expenses 268,126 21.1% 221,496
(Gain)/loss on disposal (5,123) 114.7% (2,386)
Amortization 77,810 15.6% 67,315
Depreciation 11,194 23.4% 9,071
Interest 91,425 6.3% 85,968
Change in estimated acquisition earn-out payables 40,778 NMF 8,689
Total expenses 1,433,561 18.4% 1,210,521
Income before income taxes $334,377 27.5% $262,245
Income Before Income Taxes Margin(1) 18.9% 17.8%
EBITDAC(2) 555,584 28.2% 433,288
EBITDAC Margin(2) 31.4% 29.4%
Organic Revenue growth rate(2) 11.0% 2.4%
Employee compensation and benefits relative to total revenues 53.7% 55.7%
Other operating expenses relative to total revenues 15.2% 15.0%
Capital expenditures $8,093 (38.6)% $13,175
Total assets at December 31(3) $5,040,706 (28.9)% $7,093,627
(1) “Income Before Income Taxes Margin” is defined as income before income taxes divided by total revenues
(2) A non-GAAP financial measure
(3) As of December 31, 2021, the Company settled the historical accumulation of the cash outlays paid by Corporate reducing the total assets at the segment level with no effect on
the consolidated company
NMF = Not a meaningful figure
The Retail segment’s total revenues in 2021 increased 20.0%, or $295.2 million, over the same period in 2020, to $1,767.9 million. The
$290.9 million increase in core commissions and fees was driven by the following: (i) $156.3 million related to net new and renewal
business; (ii) approximately $139.0 million related to the core commissions and fees from acquisitions that had no comparable revenues
in the same period of 2020; offset by (iii) a decrease of $4.4 million related to commissions and fees from businesses or books of
business divested in 2020 and 2021. Profit-sharing contingent commissions and GSCs in 2021 increased 8.7%, or $4.4 million, over
2020, to $55.3 million primarily from acquisitions completed in 2020 and 2021. The Retail segment’s growth rate for total commissions
and fees was 20.1% and the Organic Revenue growth rate was 11.0% for 2021. The Organic Revenue growth rate was driven by net new
business written during the preceding 12 months and growth on renewals of existing customers. Renewal business was impacted by
rate increases in most lines of business and some modest expansion of exposure units.
25
20
21
AN
NU
AL
RE
PO
RT
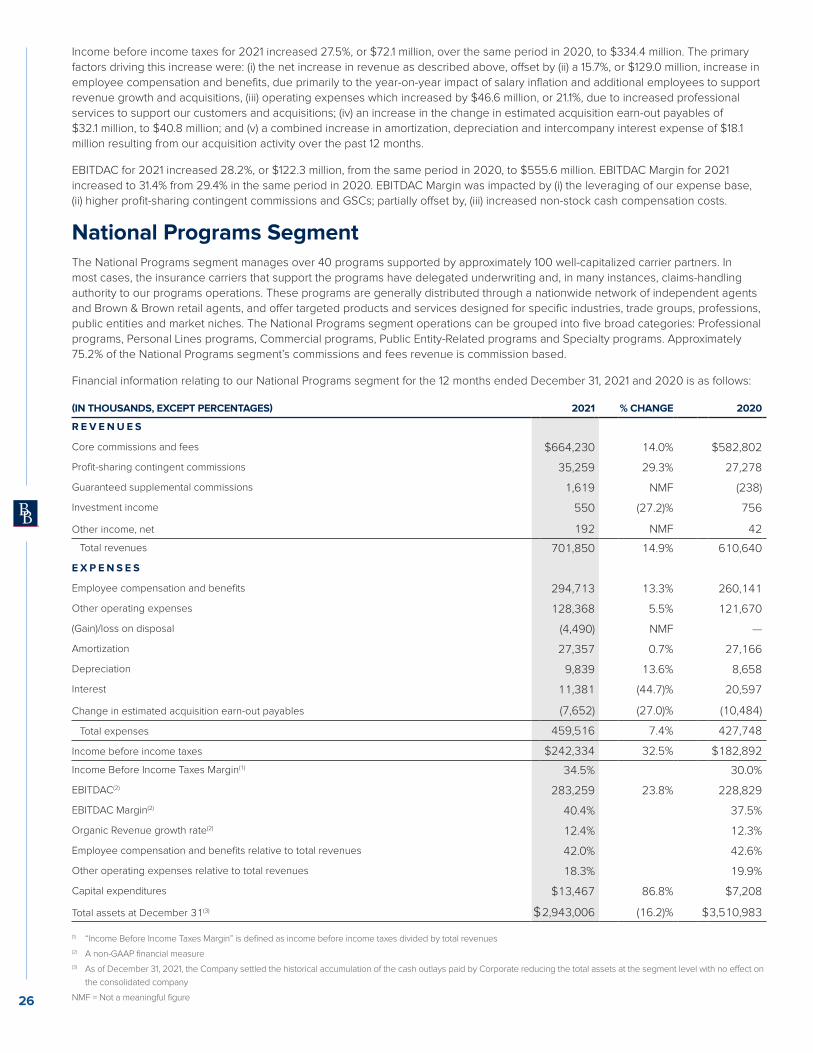
Income before income taxes for 2021 increased 27.5%, or $72.1 million, over the same period in 2020, to $334.4 million. The primary
factors driving this increase were: (i) the net increase in revenue as described above, offset by (ii) a 15.7%, or $129.0 million, increase in
employee compensation and benefits, due primarily to the year-on-year impact of salary inflation and additional employees to support
revenue growth and acquisitions, (iii) operating expenses which increased by $46.6 million, or 21.1%, due to increased professional
services to support our customers and acquisitions; (iv) an increase in the change in estimated acquisition earn-out payables of
$32.1 million, to $40.8 million; and (v) a combined increase in amortization, depreciation and intercompany interest expense of $18.1
million resulting from our acquisition activity over the past 12 months.
EBITDAC for 2021 increased 28.2%, or $122.3 million, from the same period in 2020, to $555.6 million. EBITDAC Margin for 2021
increased to 31.4% from 29.4% in the same period in 2020. EBITDAC Margin was impacted by (i) the leveraging of our expense base,
(ii) higher profit-sharing contingent commissions and GSCs; partially offset by, (iii) increased non-stock cash compensation costs.
National Programs SegmentThe National Programs segment manages over 40 programs supported by approximately 100 well-capitalized carrier partners. In
most cases, the insurance carriers that support the programs have delegated underwriting and, in many instances, claims-handling
authority to our programs operations. These programs are generally distributed through a nationwide network of independent agents
and Brown & Brown retail agents, and offer targeted products and services designed for specific industries, trade groups, professions,
public entities and market niches. The National Programs segment operations can be grouped into five broad categories: Professional
programs, Personal Lines programs, Commercial programs, Public Entity-Related programs and Specialty programs. Approximately
75.2% of the National Programs segment’s commissions and fees revenue is commission based.
Financial information relating to our National Programs segment for the 12 months ended December 31, 2021 and 2020 is as follows:
(IN THOUSANDS, EXCEPT PERCENTAGES) 2021 % CHANGE 2020
R E V E N U E S
Core commissions and fees $664,230 14.0% $582,802
Profit-sharing contingent commissions 35,259 29.3% 27,278
Guaranteed supplemental commissions 1,619 NMF (238)
Investment income 550 (27.2)% 756
Other income, net 192 NMF 42
Total revenues 701,850 14.9% 610,640
E X P E N S E S
Employee compensation and benefits 294,713 13.3% 260,141
Other operating expenses 128,368 5.5% 121,670
(Gain)/loss on disposal (4,490) NMF —
Amortization 27,357 0.7% 27,166
Depreciation 9,839 13.6% 8,658
Interest 11,381 (44.7)% 20,597
Change in estimated acquisition earn-out payables (7,652) (27.0)% (10,484)
Total expenses 459,516 7.4% 427,748
Income before income taxes $242,334 32.5% $182,892
Income Before Income Taxes Margin(1) 34.5% 30.0%
EBITDAC(2) 283,259 23.8% 228,829
EBITDAC Margin(2) 40.4% 37.5%
Organic Revenue growth rate(2) 12.4% 12.3%
Employee compensation and benefits relative to total revenues 42.0% 42.6%
Other operating expenses relative to total revenues 18.3% 19.9%
Capital expenditures $13,467 86.8% $7,208
Total assets at December 31(3) $2,943,006 (16.2)% $3,510,983
(1) “Income Before Income Taxes Margin” is defined as income before income taxes divided by total revenues
(2) A non-GAAP financial measure
(3) As of December 31, 2021, the Company settled the historical accumulation of the cash outlays paid by Corporate reducing the total assets at the segment level with no effect on
the consolidated company
NMF = Not a meaningful figure26
The National Programs segment’s total revenue for 2021 increased 14.9%, or $91.2 million, as compared to the same period in 2020,
to $701.9 million. The $81.4 million increase in core commissions and fees revenue was driven by: (i) $72.6 million related to net new
and renewal business; (ii) approximately $8.2 million related to the core commissions and fees revenue from acquisitions that had no
comparable revenues in 2020; (iii) a positive impact from foreign currency translation of $1.2 million; offset by (iv) a decrease of $0.5
million related to commissions and fees revenue from business divested in the preceding 12 months.
The National Programs segment’s growth rate for total commissions and fees was 15.0% and the Organic Revenue growth rate was
12.4% for 2021. The total commissions and fees growth was due to strong Organic Revenue growth across many of our programs along
with new acquisitions. The Organic Revenue growth was driven by new business, good retention, exposure unit expansion and rate
increases across many programs.
Income before income taxes for 2021 increased 32.5%, or $59.4 million, from the same period in 2020, to $242.3 million. The increase
was the result of: (i) strong total revenue growth; (ii) lower intercompany interest expense; (iii) a gain on sale of one of our businesses;
partially offset by; (iv) an increase in estimated acquisition earn-out payables.
EBITDAC for 2021 increased 23.8%, or $54.4 million, from the same period in 2020, to $283.3 million. EBITDAC Margin for 2021
increased to 40.4% due to (i) Organic Revenue growth and scaling of a number of our programs; (ii) higher contingent commissions,
and (iii) a gain on the sale of one of our businesses.
Wholesale Brokerage SegmentThe Wholesale Brokerage segment markets and sells excess and surplus commercial and personal lines insurance, primarily through
independent agents and brokers, including Brown & Brown retail agents. Approximately 83.3% of the Wholesale Brokerage segment’s
commissions and fees revenue is commission based.
Financial information relating to our Wholesale Brokerage segment for the 12 months ended December 31, 2021 and 2020 is as follows:
(IN THOUSANDS, EXCEPT PERCENTAGES) 2021 % CHANGE 2020
R E V E N U E S
Core commissions and fees $393,629 14.8% $342,986
Profit-sharing contingent commissions 8,072 2.6% 7,871
Guaranteed supplemental commissions 934 (28.4)% 1,304
Investment income 155 (15.8)% 184
Other income, net 627 38.7% 452
Total revenues 403,417 14.3% 352,797
E X P E N S E S
Employee compensation and benefits 212,781 15.4% 184,429
Other operating expenses 60,686 13.1% 53,643
(Gain)/loss on disposal — — —
Amortization 9,150 7.9% 8,481
Depreciation 2,646 35.8% 1,948
Interest 15,990 55.5% 10,281
Change in estimated acquisition earn-out payables 7,319 NMF 422
Total expenses 308,572 19.0% 259,204
Income before income taxes $94,845 1.3% $93,593
Income Before Income Taxes Margin(1) 23.5% 26.5%
EBITDAC(2) 129,950 13.3% 114,725
EBITDAC Margin(2) 32.2% 32.5%
Organic Revenue growth rate(2) 8.1% 5.5%
Employee compensation and benefits relative to total revenues 52.7% 52.3%
Other operating expenses relative to total revenues 15.0% 15.2%
Capital expenditures $1,612 (51.5)% $3,324
Total assets at December 31(3) $1,154,373 (35.6)% $1,791,717
(1) “Income Before Income Taxes Margin” is defined as income before income taxes divided by total revenues
(2) A non-GAAP financial measure
(3) As of December 31, 2021, the Company settled the historical accumulation of the cash outlays paid by Corporate reducing the total assets at the segment level with no effect on
the consolidated company
NMF = Not a meaningful figure
27
20
21
AN
NU
AL
RE
PO
RT
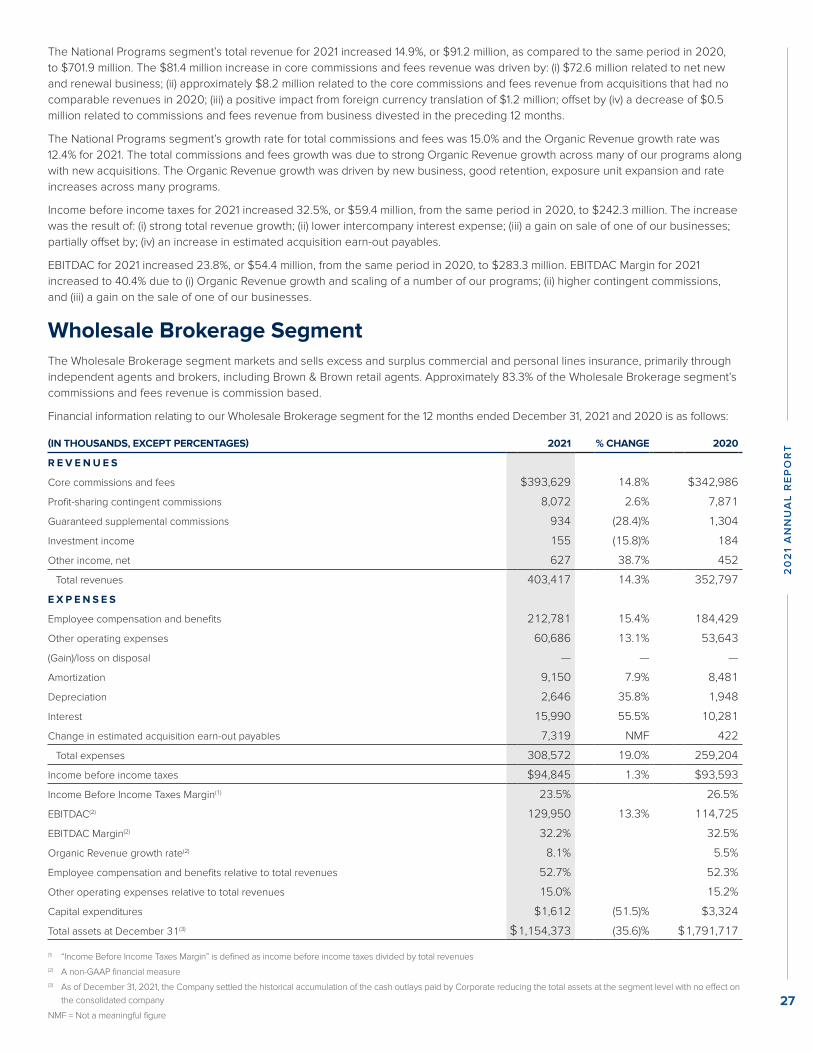
Income before income taxes for 2021 increased 27.5%, or $72.1 million, over the same period in 2020, to $334.4 million. The primary
factors driving this increase were: (i) the net increase in revenue as described above, offset by (ii) a 15.7%, or $129.0 million, increase in
employee compensation and benefits, due primarily to the year-on-year impact of salary inflation and additional employees to support
revenue growth and acquisitions, (iii) operating expenses which increased by $46.6 million, or 21.1%, due to increased professional
services to support our customers and acquisitions; (iv) an increase in the change in estimated acquisition earn-out payables of
$32.1 million, to $40.8 million; and (v) a combined increase in amortization, depreciation and intercompany interest expense of $18.1
million resulting from our acquisition activity over the past 12 months.
EBITDAC for 2021 increased 28.2%, or $122.3 million, from the same period in 2020, to $555.6 million. EBITDAC Margin for 2021
increased to 31.4% from 29.4% in the same period in 2020. EBITDAC Margin was impacted by (i) the leveraging of our expense base,
(ii) higher profit-sharing contingent commissions and GSCs; partially offset by, (iii) increased non-stock cash compensation costs.
National Programs SegmentThe National Programs segment manages over 40 programs supported by approximately 100 well-capitalized carrier partners. In
most cases, the insurance carriers that support the programs have delegated underwriting and, in many instances, claims-handling
authority to our programs operations. These programs are generally distributed through a nationwide network of independent agents
and Brown & Brown retail agents, and offer targeted products and services designed for specific industries, trade groups, professions,
public entities and market niches. The National Programs segment operations can be grouped into five broad categories: Professional
programs, Personal Lines programs, Commercial programs, Public Entity-Related programs and Specialty programs. Approximately
75.2% of the National Programs segment’s commissions and fees revenue is commission based.
Financial information relating to our National Programs segment for the 12 months ended December 31, 2021 and 2020 is as follows:
(IN THOUSANDS, EXCEPT PERCENTAGES) 2021 % CHANGE 2020
R E V E N U E S
Core commissions and fees $664,230 14.0% $582,802
Profit-sharing contingent commissions 35,259 29.3% 27,278
Guaranteed supplemental commissions 1,619 NMF (238)
Investment income 550 (27.2)% 756
Other income, net 192 NMF 42
Total revenues 701,850 14.9% 610,640
E X P E N S E S
Employee compensation and benefits 294,713 13.3% 260,141
Other operating expenses 128,368 5.5% 121,670
(Gain)/loss on disposal (4,490) NMF —
Amortization 27,357 0.7% 27,166
Depreciation 9,839 13.6% 8,658
Interest 11,381 (44.7)% 20,597
Change in estimated acquisition earn-out payables (7,652) (27.0)% (10,484)
Total expenses 459,516 7.4% 427,748
Income before income taxes $242,334 32.5% $182,892
Income Before Income Taxes Margin(1) 34.5% 30.0%
EBITDAC(2) 283,259 23.8% 228,829
EBITDAC Margin(2) 40.4% 37.5%
Organic Revenue growth rate(2) 12.4% 12.3%
Employee compensation and benefits relative to total revenues 42.0% 42.6%
Other operating expenses relative to total revenues 18.3% 19.9%
Capital expenditures $13,467 86.8% $7,208
Total assets at December 31(3) $2,943,006 (16.2)% $3,510,983
(1) “Income Before Income Taxes Margin” is defined as income before income taxes divided by total revenues
(2) A non-GAAP financial measure
(3) As of December 31, 2021, the Company settled the historical accumulation of the cash outlays paid by Corporate reducing the total assets at the segment level with no effect on
the consolidated company
NMF = Not a meaningful figure26
The National Programs segment’s total revenue for 2021 increased 14.9%, or $91.2 million, as compared to the same period in 2020,
to $701.9 million. The $81.4 million increase in core commissions and fees revenue was driven by: (i) $72.6 million related to net new
and renewal business; (ii) approximately $8.2 million related to the core commissions and fees revenue from acquisitions that had no
comparable revenues in 2020; (iii) a positive impact from foreign currency translation of $1.2 million; offset by (iv) a decrease of $0.5
million related to commissions and fees revenue from business divested in the preceding 12 months.
The National Programs segment’s growth rate for total commissions and fees was 15.0% and the Organic Revenue growth rate was
12.4% for 2021. The total commissions and fees growth was due to strong Organic Revenue growth across many of our programs along
with new acquisitions. The Organic Revenue growth was driven by new business, good retention, exposure unit expansion and rate
increases across many programs.
Income before income taxes for 2021 increased 32.5%, or $59.4 million, from the same period in 2020, to $242.3 million. The increase
was the result of: (i) strong total revenue growth; (ii) lower intercompany interest expense; (iii) a gain on sale of one of our businesses;
partially offset by; (iv) an increase in estimated acquisition earn-out payables.
EBITDAC for 2021 increased 23.8%, or $54.4 million, from the same period in 2020, to $283.3 million. EBITDAC Margin for 2021
increased to 40.4% due to (i) Organic Revenue growth and scaling of a number of our programs; (ii) higher contingent commissions,
and (iii) a gain on the sale of one of our businesses.
Wholesale Brokerage SegmentThe Wholesale Brokerage segment markets and sells excess and surplus commercial and personal lines insurance, primarily through
independent agents and brokers, including Brown & Brown retail agents. Approximately 83.3% of the Wholesale Brokerage segment’s
commissions and fees revenue is commission based.
Financial information relating to our Wholesale Brokerage segment for the 12 months ended December 31, 2021 and 2020 is as follows:
(IN THOUSANDS, EXCEPT PERCENTAGES) 2021 % CHANGE 2020
R E V E N U E S
Core commissions and fees $393,629 14.8% $342,986
Profit-sharing contingent commissions 8,072 2.6% 7,871
Guaranteed supplemental commissions 934 (28.4)% 1,304
Investment income 155 (15.8)% 184
Other income, net 627 38.7% 452
Total revenues 403,417 14.3% 352,797
E X P E N S E S
Employee compensation and benefits 212,781 15.4% 184,429
Other operating expenses 60,686 13.1% 53,643
(Gain)/loss on disposal — — —
Amortization 9,150 7.9% 8,481
Depreciation 2,646 35.8% 1,948
Interest 15,990 55.5% 10,281
Change in estimated acquisition earn-out payables 7,319 NMF 422
Total expenses 308,572 19.0% 259,204
Income before income taxes $94,845 1.3% $93,593
Income Before Income Taxes Margin(1) 23.5% 26.5%
EBITDAC(2) 129,950 13.3% 114,725
EBITDAC Margin(2) 32.2% 32.5%
Organic Revenue growth rate(2) 8.1% 5.5%
Employee compensation and benefits relative to total revenues 52.7% 52.3%
Other operating expenses relative to total revenues 15.0% 15.2%
Capital expenditures $1,612 (51.5)% $3,324
Total assets at December 31(3) $1,154,373 (35.6)% $1,791,717
(1) “Income Before Income Taxes Margin” is defined as income before income taxes divided by total revenues
(2) A non-GAAP financial measure
(3) As of December 31, 2021, the Company settled the historical accumulation of the cash outlays paid by Corporate reducing the total assets at the segment level with no effect on
the consolidated company
NMF = Not a meaningful figure
27
20
21
AN
NU
AL
RE
PO
RT
The Wholesale Brokerage segment’s total revenues for 2021 increased 14.3%, or $50.6 million, over 2020, to $403.4 million. The
$50.6 million increase in core commissions and fees was driven by the following: (i) $27.6 million related to net new and renewal
business and; (ii) $23.0 million related to the core commissions and fees from acquisitions that had no comparable revenues in 2020.
Profit-sharing contingent commissions and GSCs for 2021 decreased $0.2 million compared to 2020, to $9.0 million. The Wholesale
Brokerage segment’s growth rate for total commissions and fees was 14.3%, and the Organic Revenue growth rate was 8.1% for 2021.
The Organic Revenue growth rate was driven by net new business, as well as increased rates seen across most lines of business,
which was partially offset by shrinking capacity in the catastrophe exposed personal lines market.
Income before income taxes for 2021 increased 1.3%, or $1.3 million, over 2020, to $94.8 million, primarily due to the following: (i)
the net increase in total revenues as described above, which was offset by; (ii) an increase in amortization expense; (iii) an increase
in intercompany interest expense; (iv) an increase in employee compensation and benefits of $28.3 million, related to additional
employees from acquisitions completed in the past 12 months and net additions to support increased transaction volumes,
compensation increases for existing employees, and additional non-cash stock-based compensation expense; and (v) a net $7.0 million
increase in other operating expenses, primarily acquisition related.
EBITDAC for 2021 increased 13.3%, or $15.2 million, from the same period in 2020, to $129.9 million. EBITDAC Margin for 2021
decreased to 32.2% from 32.5% in the same period in 2020. The decrease in EBITDAC Margin was primarily driven by; (i) increased
employee compensation based on the composition of revenue growth and non-cash stock-based compensation costs, in addition to;
(ii) a variable expense normalization which was partially offset by; (iii) revenue growth as described above.
Services SegmentThe Services segment provides insurance-related services, including third-party claims administration and comprehensive medical
utilization management services in both the workers’ compensation and all-lines liability arenas. The Services segment also provides
Medicare Set-aside account services, Social Security disability and Medicare benefits advocacy services, and claims adjusting services.
Unlike the other segments, nearly all of the Services segment’s revenue is generated from fees which are not significantly affected by
fluctuations in general insurance premiums.
28
Financial information relating to our Services segment for the 12 months ended December 31, 2021 and 2020 is as follows:
(IN THOUSANDS, EXCEPT PERCENTAGES) 2021 % CHANGE 2020
R E V E N U E S
Core commissions and fees $178,857 2.8% $174,012
Profit-sharing contingent commissions — — —
Guaranteed supplemental commissions — — —
Investment income 3 — —
Other income, net — — —
Total revenues 178,860 2.8% 174,012
E X P E N S E S
Employee compensation and benefits 89,723 1.1% 88,787
Other operating expenses 51,212 4.1% 49,191
(Gain)/loss on disposal 9 — (2)
Amortization 5,276 (5.1)% 5,561
Depreciation 1,484 4.2% 1,424
Interest 2,899 (30.0)% 4,142
Change in estimated acquisition earn-out payables — (100.0)% (3,085)
Total expenses 150,603 3.1% 146,018
Income before income taxes $28,257 0.9% $27,994
Income Before Income Taxes Margin(1) 15.8% 16.1%
EBITDAC(2) 37,916 5.2% 36,036
EBITDAC Margin(2) 21.2% 20.7%
Organic Revenue growth rate(2) 3.0% (10.9)%
Employee compensation and benefits relative to total revenues 50.2% 51.0%
Other operating expenses relative to total revenues 28.6% 28.3%
Capital expenditures $1,609 13.0% $1,424
Total assets at December 31(3) $299,185 (37.7)% $480,440
(1) “Income Before Income Taxes Margin” is defined as income before income taxes divided by total revenues
(2) A non-GAAP financial measure
(3) As of December 31, 2021, the Company settled the historical accumulation of the cash outlays paid by Corporate reducing the total assets at the segment level with no effect on
the consolidated company
NMF = Not a meaningful figure
The Services segment’s total revenues for 2021 increased 2.8%, or $4.8 million, from 2020, to $178.9 million. The $4.8 million increase
in core commissions and fees, was driven by; (i) specialized claims handling in our advisory business; (ii) expansion of existing
programs; (iii) partially offset by continued pressure in our advocacy space (iii) and reduction in workers’ compensation severity claims.
Total commissions and fees increased 2.8%, and Organic Revenue increased 3.0% in 2021, both as compared to 2020.
Income before income taxes for 2021 increased 0.9%, or $0.3 million, from 2020, to $28.3 million due to a combination of: (i) lower
intercompany interest; (ii) drivers of EBITDAC described below and; (iii) partially offset by the earn-out liability credit recorded in prior
year.
EBITDAC for 2021 increased 5.2%, or $1.9 million, from the same period in 2020, to $37.9 million. EBITDAC Margin for 2021 increased
to 21.2% from 20.7% in the same period in 2020. The increase in EBITDAC and EBITDAC Margin were driven primarily by leveraging
our expense base with higher Organic Revenue growth and lower variable expenses in response to COVID-19.
OtherAs discussed in Note 16 of the Notes to Consolidated Financial Statements, the “Other” column in the Segment Information table
includes any income and expenses not allocated to reportable segments, and corporate-related items, including the intercompany
interest expense charges to reporting segments.29
20
21
AN
NU
AL
RE
PO
RT
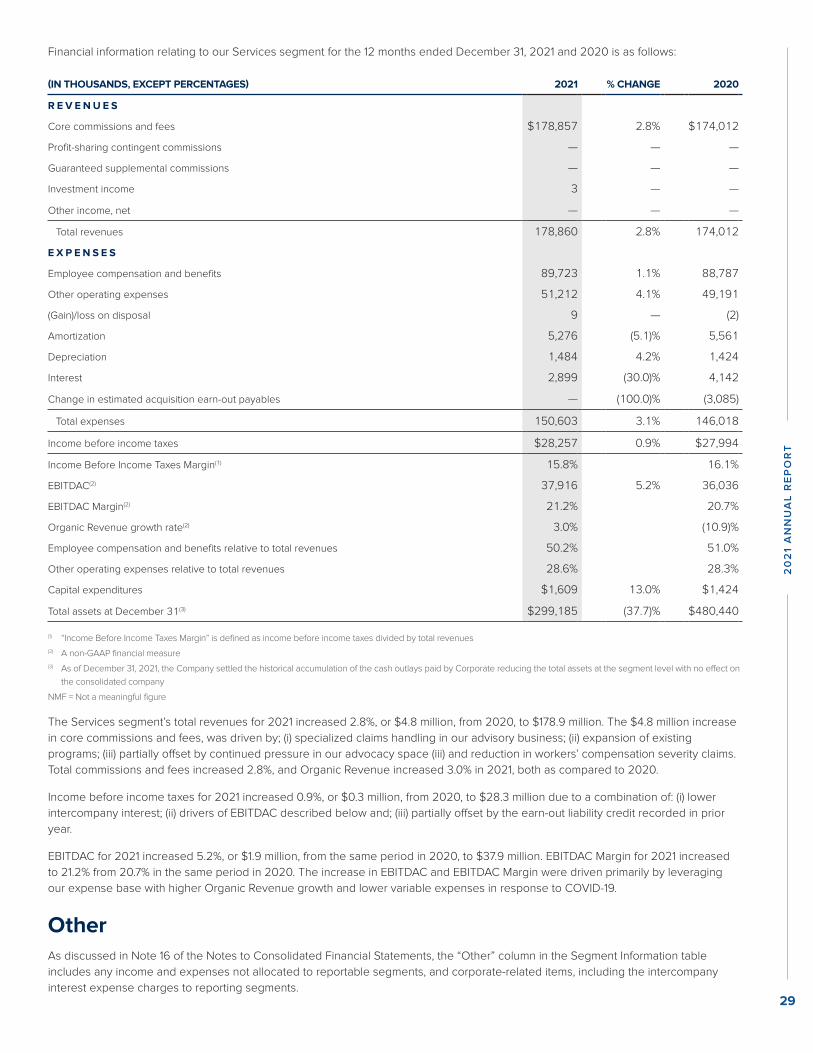
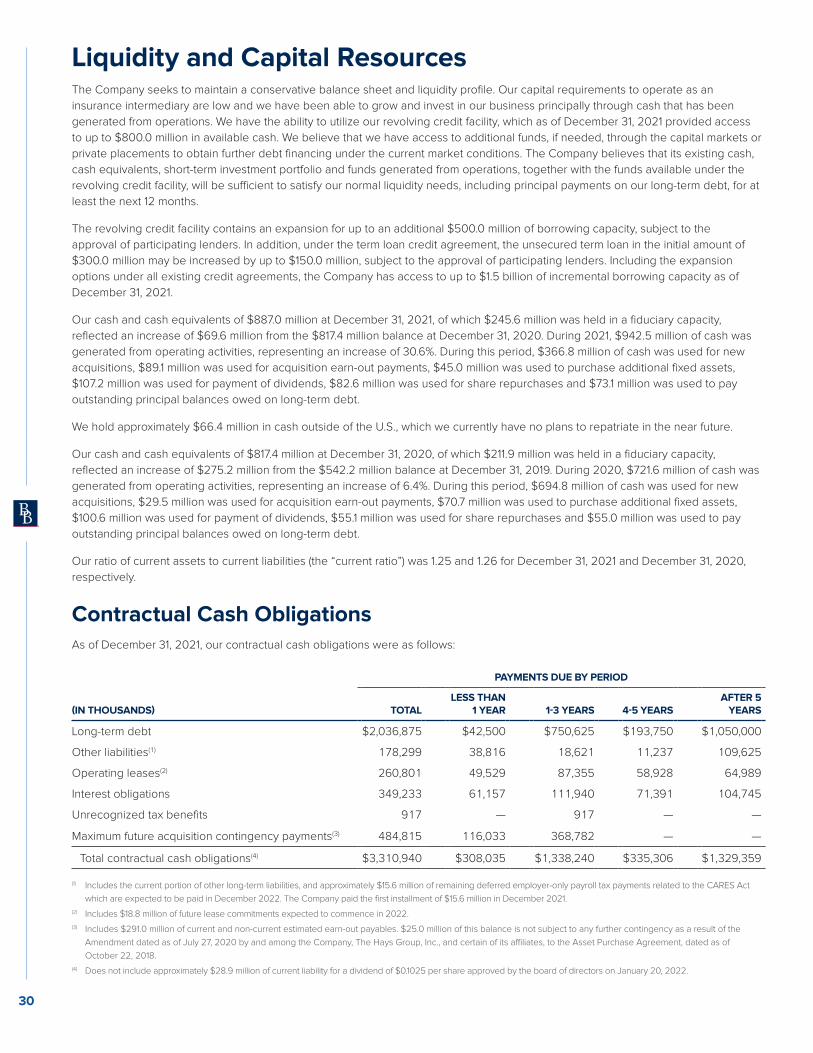
Liquidity and Capital ResourcesThe Company seeks to maintain a conservative balance sheet and liquidity profile. Our capital requirements to operate as an
insurance intermediary are low and we have been able to grow and invest in our business principally through cash that has been
generated from operations. We have the ability to utilize our revolving credit facility, which as of December 31, 2021 provided access
to up to $800.0 million in available cash. We believe that we have access to additional funds, if needed, through the capital markets or
private placements to obtain further debt financing under the current market conditions. The Company believes that its existing cash,
cash equivalents, short-term investment portfolio and funds generated from operations, together with the funds available under the
revolving credit facility, will be sufficient to satisfy our normal liquidity needs, including principal payments on our long-term debt, for at
least the next 12 months.
The revolving credit facility contains an expansion for up to an additional $500.0 million of borrowing capacity, subject to the
approval of participating lenders. In addition, under the term loan credit agreement, the unsecured term loan in the initial amount of
$300.0 million may be increased by up to $150.0 million, subject to the approval of participating lenders. Including the expansion
options under all existing credit agreements, the Company has access to up to $1.5 billion of incremental borrowing capacity as of
December 31, 2021.
Our cash and cash equivalents of $887.0 million at December 31, 2021, of which $245.6 million was held in a fiduciary capacity,
reflected an increase of $69.6 million from the $817.4 million balance at December 31, 2020. During 2021, $942.5 million of cash was
generated from operating activities, representing an increase of 30.6%. During this period, $366.8 million of cash was used for new
acquisitions, $89.1 million was used for acquisition earn-out payments, $45.0 million was used to purchase additional fixed assets,
$107.2 million was used for payment of dividends, $82.6 million was used for share repurchases and $73.1 million was used to pay
outstanding principal balances owed on long-term debt.
We hold approximately $66.4 million in cash outside of the U.S., which we currently have no plans to repatriate in the near future.
Our cash and cash equivalents of $817.4 million at December 31, 2020, of which $211.9 million was held in a fiduciary capacity,
reflected an increase of $275.2 million from the $542.2 million balance at December 31, 2019. During 2020, $721.6 million of cash was
generated from operating activities, representing an increase of 6.4%. During this period, $694.8 million of cash was used for new
acquisitions, $29.5 million was used for acquisition earn-out payments, $70.7 million was used to purchase additional fixed assets,
$100.6 million was used for payment of dividends, $55.1 million was used for share repurchases and $55.0 million was used to pay
outstanding principal balances owed on long-term debt.
Our ratio of current assets to current liabilities (the “current ratio”) was 1.25 and 1.26 for December 31, 2021 and December 31, 2020,
respectively.
Contractual Cash ObligationsAs of December 31, 2021, our contractual cash obligations were as follows:
PAYMENTS DUE BY PERIOD
(IN THOUSANDS) TOTALLESS THAN
1 YEAR 1-3 YEARS 4-5 YEARSAFTER 5
YEARS
Long-term debt $2,036,875 $42,500 $750,625 $193,750 $1,050,000
Other liabilities(1) 178,299 38,816 18,621 11,237 109,625
Operating leases(2) 260,801 49,529 87,355 58,928 64,989
Interest obligations 349,233 61,157 111,940 71,391 104,745
Unrecognized tax benefits 917 — 917 — —
Maximum future acquisition contingency payments(3) 484,815 116,033 368,782 — —
Total contractual cash obligations(4) $3,310,940 $308,035 $1,338,240 $335,306 $1,329,359
(1) Includes the current portion of other long-term liabilities, and approximately $15.6 million of remaining deferred employer-only payroll tax payments related to the CARES Act
which are expected to be paid in December 2022. The Company paid the first installment of $15.6 million in December 2021.
(2) Includes $18.8 million of future lease commitments expected to commence in 2022.
(3) Includes $291.0 million of current and non-current estimated earn-out payables. $25.0 million of this balance is not subject to any further contingency as a result of the
Amendment dated as of July 27, 2020 by and among the Company, The Hays Group, Inc., and certain of its affiliates, to the Asset Purchase Agreement, dated as of
October 22, 2018.
(4) Does not include approximately $28.9 million of current liability for a dividend of $0.1025 per share approved by the board of directors on January 20, 2022.
30
Debt
Total debt at December 31, 2021 was $2,022.9 million net of unamortized discount and debt issuance costs, which was an decrease
of $73.0 million compared to December 31, 2020. The decrease includes: (i) the repayment of the principal balance of $73.1 million
for scheduled principal amortization balances related to our various existing floating rate debt term notes; (ii) an additional $2.7
million including debt issuance costs related to the Company’s refinanced credit facility, the Second Amended and Restated Credit
Agreement (as defined below), on October 27, 2021; offset by (iii) net of the amortization of discounted debt related to our various
unsecured Senior Notes, and debt issuance cost amortization of $2.8 million.
On October 27, 2021, the Company entered into an amended and restated credit agreement (the “Second Amended and Restated
Credit Agreement”) with the lenders named therein, JPMorgan Chase Bank, N.A. as administrative agent, Bank of America, N.A., Truist
Bank and BMO Harris Bank N.A. as co-syndication agents, and U.S. Bank National Association, Fifth Third Bank, National Association,
Wells Fargo Bank, National Association, PNC Bank, National Association, Morgan Stanley Senior Funding, Inc. and Citizens Bank, N.A.
as co-documentation agents. The Second Amended and Restated Credit Agreement amended and restated the credit agreement
dated April 17, 2014, among certain of such parties, as amended by that certain amended and restated credit agreement dated June
28, 2017 (the “Original Credit Agreement”). The Second Amended and Restated Credit Agreement, among other certain terms,
extended the maturity of the revolving credit facility of $800.0 million and unsecured term loans associated with the agreement of
$250.0 million to October 27, 2026. At the time of the renewal, the Company added an additional $2.7 million in debt issuance costs
related to the transaction. The Company carried forward $0.6 million of existing debt issuance costs related to the previous credit
facility agreements while expensing $0.1 million in debt issuance costs due to certain lenders exiting the renewed facility agreement.
During the 12 months ended December 31, 2021, the Company has repaid $30.0 million of principal related to the amended and
restated credit agreement term loan through quarterly scheduled amortized principal payments each equaling $10.0 million on March
31, 2021, June 30, 2021, September 30, 2021 and on October 27, 2021 in conjunction with the closing of the Second Amended and
Restated Credit Agreement, the Company repaid an additional $10.0 million of outstanding principal related to the term loan under
the amended and restated credit agreement. On December 31, 2021, the Company repaid $3.1 million under the Second Amended
and Restated Credit Agreement as part of a scheduled amortized principal payment/ The Second Amended and Restated Credit
Agreement term loan had an outstanding balance of $246.9 million as of December 31, 2021. The Company’s next scheduled
amortized principal payment is due March 31, 2022 and is equal to $3.1 million.
During the 12 months ended December 31, 2021, the Company has repaid $30.0 million of principal related to the term loan credit
agreement through quarterly scheduled amortized principal payments each equaling $7.5 million on March 31, 2021, June 30, 2021,
September 30, 2021 and December 31, 2021. The term loan credit agreement had an outstanding balance of $240.0 million as of
December 31, 2021. The Company’s next scheduled amortized principal payment is due March 31, 2021 and is equal to $7.5 million.
Total debt at December 31, 2020 was $2,095.9 million net of unamortized discount and debt issuance costs, which was an increase
of $540.6 million compared to December 31, 2019. The increase includes: (i) incremental borrowings of $700.0 million related to the
Company’s 2.375% Senior Notes due 2031 issued on September 24, 2020; (ii) net of the amortization of discounted debt related to
our various unsecured Senior Notes, and debt issuance cost amortization of $2.3 million; offset by (iii) the repayment of the principal
balance of $55.0 million for scheduled principal amortization balances related to our various existing floating rate debt term notes; (iv)
the net repayment of $100.0 million under the revolving credit facility; and (v) an additional $6.7 million including debt issuance costs
and the portion of discount applied to the proceeds issued under the incremental borrowings related to the Company’s 2.375% Senior
Notes due 2031 issued on September 24, 2020.
On September 24, 2020, the Company completed the issuance of $700.0 million aggregate principal amount of the Company’s
2.375% Senior Notes due 2031. The Senior Notes were given investment grade ratings of BBB- stable outlook and Baa3 positive
outlook. The notes are subject to certain covenant restrictions, which are customary for credit rated obligations. At the time of funding,
the proceeds were offered at a discount of the original note amount, which also excluded an underwriting fee discount. The net
proceeds received from the issuance were used to repay a portion of the outstanding balance of $200.0 million on the revolving credit
facility, to pay a portion of the purchase price in connection with the acquisitions of LP Insurance Services, LLP and CKP Insurance,
LLC and for other general corporate purposes. As of December 31, 2020, there was an outstanding debt balance of $700.0 million
exclusive of the associated discount balance.
During the 12 months ended December 31, 2020, the Company has repaid $40.0 million of principal related to the amended and
restated credit agreement term loan through quarterly scheduled amortized principal payments each equaling $10.0 million on March
31, 2020, June 30, 2020, September 30, 2020 and December 31, 2020. The amended and restated credit agreement term loan had
an outstanding balance of $290.0 million as of December 31, 2020. The Company’s next scheduled amortized principal payment is
due March 31, 2021 and is equal to $10.0 million.
During the 12 months ended December 31, 2020, the Company has repaid $15.0 million of principal related to the term loan credit
agreement through quarterly scheduled amortized principal payments each equaling $3.8 million on March 31, 2020, June 30, 2020,
31
20
21
AN
NU
AL
RE
PO
RT

September 30, 2020 and December 31, 2020. The term loan credit agreement had an outstanding balance of $270.0 million as of
December 31, 2020. The Company’s next scheduled amortized principal payment is due March 31, 2021 and is equal to $7.5 million.
On April 30, 2020, the Company borrowed $250.0 million under the revolving credit facility. The proceeds were used in conjunction
with the payment of the purchase price for the previously announced acquisition of LP Insurance Services LLC and for additional
liquidity to further strengthen the Company’s financial position and balance sheet in the event cash receipts from customers or carrier
partners are delayed due to the COVID-19 pandemic. On June 30, 2020, the Company repaid $150.0 million on the revolving credit
facility. On September 24, 2020, the Company repaid the total outstanding borrowings under the revolving credit facility of $200.0
million using the proceeds received from the borrowings under the Company’s 2.375% Senior Notes due 2031.
Quantitative and Qualitative Disclosures About Market RiskMarket risk is the potential loss arising from adverse changes in market rates and prices, such as interest rates, foreign exchange
rates and equity prices. We are exposed to market risk through our investments, revolving credit line, term loan agreements and
international operations.
Our invested assets are held primarily as cash and cash equivalents, restricted cash, available-for-sale marketable debt securities,
non-marketable debt securities, certificates of deposit, U.S. treasury securities, and professionally managed short duration fixed
income funds. These investments are subject to interest rate risk. The fair values of our invested assets at December 31, 2021 and
December 31, 2020, approximated their respective carrying values due to their short-term duration and therefore, such market risk is
not considered to be material.
We do not actively invest or trade in equity securities. In addition, we generally dispose of any significant equity securities received in
conjunction with an acquisition shortly after the acquisition date.
As of December 31, 2021, we had $486.9 million of borrowings outstanding under our various credit agreements, all of which bear
interest on a floating basis tied to London Inter-bank Offered Rate (“LIBOR”) and is therefore subject to changes in the associated
interest expense. The effect of an immediate hypothetical 10% change in interest rates would not have a material effect on our
Consolidated Financial Statements. As of July 2017, the UK Financial Conduct Authority (“FCA”) has urged banks and institutions to
discontinue their use of the LIBOR benchmark rate for floating rate debt, and other financial instruments tied to the rate after 2021.
The Alternative Reference Rates Committee (“ARRC”) have recommended the Secured Overnight Financing Rate (“SOFR”) as the best
alternative rate to LIBOR post discontinuance and has proposed a transition plan and timeline designed to encourage the adoption of
SOFR from LIBOR. On March 5, 2021 the ICE Benchmark Administration, which administrators LIBOR, and the FCA announced that all
LIBOR settings will either cease to be provided by any administrator or no longer be represented immediately after December 31, 2021
for all non-U.S. dollar LIBOR settings and one-week and two-month U.S. dollar LIBOR settings and immediately after June 30, 2023 for
the remaining U.S. dollar LIBOR settings.
On October 27, 2021 the Company entered into the Second Amended and Restated Credit Agreement. The Second Amended and
Restated Credit Agreement includes provisions regarding transition from LIBOR to SOFR in preparation of the LIBOR cessation.
Management will continue to actively assess the related opportunities and risks associated with the transition as well as monitor
related proposals, guidance and other alternative-rate initiatives, with an expectation that the Company will be prepared for a
termination of LIBOR benchmarks prior to June 30, 2023 when typical rate settings will no longer be available.
We are subject to operational exchange rate risk primarily in our U.K.-based wholesale brokerage business that has a cost base
principally denominated in British pounds and a revenue base in several other currencies, but principally in U.S. dollars, and in our
Canadian MGA business that has substantially all of its revenues and cost base denominated in Canadian dollars. As of January 14,
2021, the Company announced the completion of the acquisition of O’Leary Insurances, an Ireland based retail brokerage business
which has substantially all of its revenue and cost base in euros.
Based upon our foreign currency rate exposure as of December 31, 2021, an immediate 10% hypothetical change of foreign currency
exchange rates would not have a material effect on our Consolidated Financial Statements.
32
Non-GAAP ReconciliationINCOME BEFORE INCOME TAXES TO EBITDAC(1) AND INCOME BEFORE INCOME TAXES MARGIN(2) TO EBITDAC MARGIN(3)
TOTAL 2021 2020 2019 2018 2017
Total Revenues 3,051,398 $2,613,375 $2,392,171 $2,014,246 $1,881,347
Income before income taxes 762,823 624,099 525,929 462,462 449,722
Income before income taxes margin 25.0% 23.9% 22.0% 23.0% 23.9%
Amortization 119,593 108,523 105,298 86,544 85,446
Depreciation 33,309 26,276 23,417 22,834 22,698
Interest 64,981 58,973 63,660 40,580 38,316
Change in estimated acquisition earn-out payables 40,445 (4,458) (1,366) 2,969 9,200
EBITDAC 1,021,151 $813,413 $716,938 $615,389 $605,382
EBITDAC Margin 33.5% 31.1% 30.0% 30.6% 32.2%
(1) “EBITDAC,” a non-GAAP measure, is defined as income before interest, income taxes, depreciation, amortization and the change in estimated acquisition earn-out payables.
(2) “Income before income taxes margin” is defined as income before income taxes divided by total revenues.
(3) “EBITDAC Margin,” a non-GAAP measure, is defined as EBITDAC divided by total revenues.
33
20
21
AN
NU
AL
RE
PO
RT
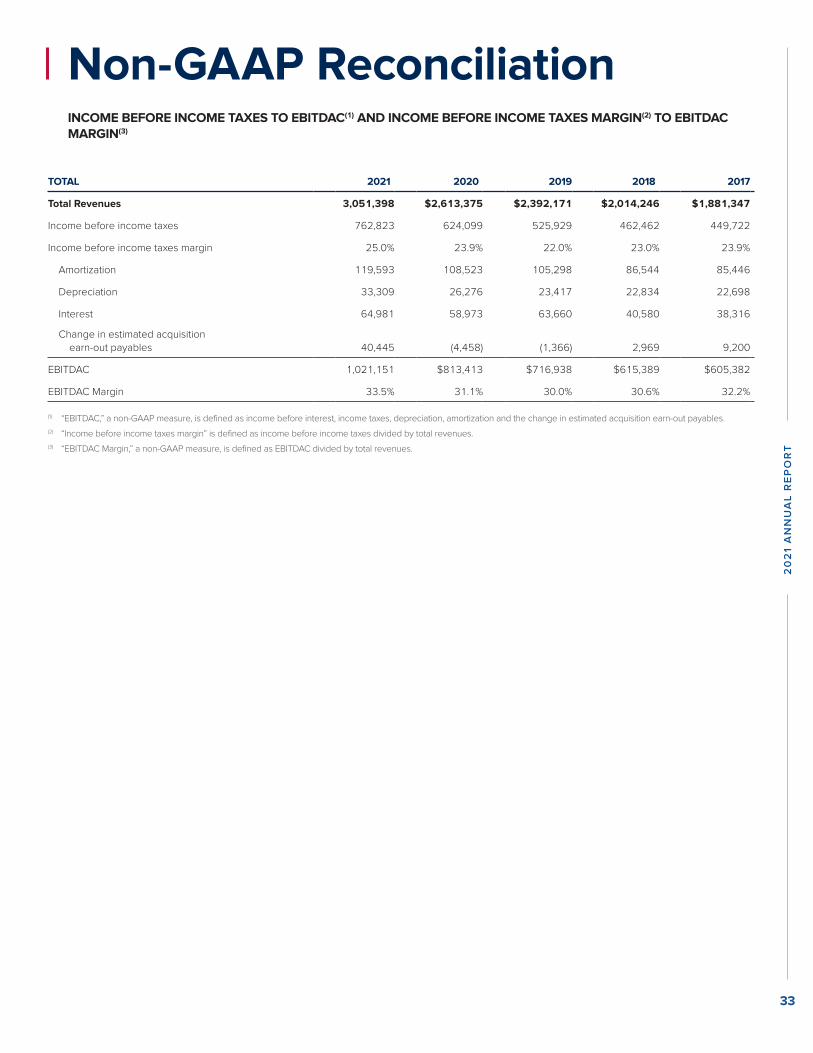
September 30, 2020 and December 31, 2020. The term loan credit agreement had an outstanding balance of $270.0 million as of
December 31, 2020. The Company’s next scheduled amortized principal payment is due March 31, 2021 and is equal to $7.5 million.
On April 30, 2020, the Company borrowed $250.0 million under the revolving credit facility. The proceeds were used in conjunction
with the payment of the purchase price for the previously announced acquisition of LP Insurance Services LLC and for additional
liquidity to further strengthen the Company’s financial position and balance sheet in the event cash receipts from customers or carrier
partners are delayed due to the COVID-19 pandemic. On June 30, 2020, the Company repaid $150.0 million on the revolving credit
facility. On September 24, 2020, the Company repaid the total outstanding borrowings under the revolving credit facility of $200.0
million using the proceeds received from the borrowings under the Company’s 2.375% Senior Notes due 2031.
Quantitative and Qualitative Disclosures About Market RiskMarket risk is the potential loss arising from adverse changes in market rates and prices, such as interest rates, foreign exchange
rates and equity prices. We are exposed to market risk through our investments, revolving credit line, term loan agreements and
international operations.
Our invested assets are held primarily as cash and cash equivalents, restricted cash, available-for-sale marketable debt securities,
non-marketable debt securities, certificates of deposit, U.S. treasury securities, and professionally managed short duration fixed
income funds. These investments are subject to interest rate risk. The fair values of our invested assets at December 31, 2021 and
December 31, 2020, approximated their respective carrying values due to their short-term duration and therefore, such market risk is
not considered to be material.
We do not actively invest or trade in equity securities. In addition, we generally dispose of any significant equity securities received in
conjunction with an acquisition shortly after the acquisition date.
As of December 31, 2021, we had $486.9 million of borrowings outstanding under our various credit agreements, all of which bear
interest on a floating basis tied to London Inter-bank Offered Rate (“LIBOR”) and is therefore subject to changes in the associated
interest expense. The effect of an immediate hypothetical 10% change in interest rates would not have a material effect on our
Consolidated Financial Statements. As of July 2017, the UK Financial Conduct Authority (“FCA”) has urged banks and institutions to
discontinue their use of the LIBOR benchmark rate for floating rate debt, and other financial instruments tied to the rate after 2021.
The Alternative Reference Rates Committee (“ARRC”) have recommended the Secured Overnight Financing Rate (“SOFR”) as the best
alternative rate to LIBOR post discontinuance and has proposed a transition plan and timeline designed to encourage the adoption of
SOFR from LIBOR. On March 5, 2021 the ICE Benchmark Administration, which administrators LIBOR, and the FCA announced that all
LIBOR settings will either cease to be provided by any administrator or no longer be represented immediately after December 31, 2021
for all non-U.S. dollar LIBOR settings and one-week and two-month U.S. dollar LIBOR settings and immediately after June 30, 2023 for
the remaining U.S. dollar LIBOR settings.
On October 27, 2021 the Company entered into the Second Amended and Restated Credit Agreement. The Second Amended and
Restated Credit Agreement includes provisions regarding transition from LIBOR to SOFR in preparation of the LIBOR cessation.
Management will continue to actively assess the related opportunities and risks associated with the transition as well as monitor
related proposals, guidance and other alternative-rate initiatives, with an expectation that the Company will be prepared for a
termination of LIBOR benchmarks prior to June 30, 2023 when typical rate settings will no longer be available.
We are subject to operational exchange rate risk primarily in our U.K.-based wholesale brokerage business that has a cost base
principally denominated in British pounds and a revenue base in several other currencies, but principally in U.S. dollars, and in our
Canadian MGA business that has substantially all of its revenues and cost base denominated in Canadian dollars. As of January 14,
2021, the Company announced the completion of the acquisition of O’Leary Insurances, an Ireland based retail brokerage business
which has substantially all of its revenue and cost base in euros.
Based upon our foreign currency rate exposure as of December 31, 2021, an immediate 10% hypothetical change of foreign currency
exchange rates would not have a material effect on our Consolidated Financial Statements.
32
Non-GAAP ReconciliationINCOME BEFORE INCOME TAXES TO EBITDAC(1) AND INCOME BEFORE INCOME TAXES MARGIN(2) TO EBITDAC MARGIN(3)
TOTAL 2021 2020 2019 2018 2017
Total Revenues 3,051,398 $2,613,375 $2,392,171 $2,014,246 $1,881,347
Income before income taxes 762,823 624,099 525,929 462,462 449,722
Income before income taxes margin 25.0% 23.9% 22.0% 23.0% 23.9%
Amortization 119,593 108,523 105,298 86,544 85,446
Depreciation 33,309 26,276 23,417 22,834 22,698
Interest 64,981 58,973 63,660 40,580 38,316
Change in estimated acquisition earn-out payables 40,445 (4,458) (1,366) 2,969 9,200
EBITDAC 1,021,151 $813,413 $716,938 $615,389 $605,382
EBITDAC Margin 33.5% 31.1% 30.0% 30.6% 32.2%
(1) “EBITDAC,” a non-GAAP measure, is defined as income before interest, income taxes, depreciation, amortization and the change in estimated acquisition earn-out payables.
(2) “Income before income taxes margin” is defined as income before income taxes divided by total revenues.
(3) “EBITDAC Margin,” a non-GAAP measure, is defined as EBITDAC divided by total revenues.
33
20
21
AN
NU
AL
RE
PO
RT
Financial Statements and Supplementary DataIndex to Consolidated Financial Statements
Page No.
Consolidated Statements of Income for the years ended December 31, 2021, 2020 and 2019 35
Consolidated Statements of Comprehensive Income for the years ended December 31, 2021, 2020 and 2019 36
Consolidated Balance Sheets as of December 31, 2021 and 2020 37
Consolidated Statements of Shareholders’ Equity for the years ended December 31, 2021, 2020 and 2019 38
Consolidated Statements of Cash Flows for the years ended December 31, 2021, 2020 and 2019 39
Notes to Consolidated Financial Statements for the years ended December 31, 2021, 2020 and 2019 40
Note 1: Summary of Significant Accounting Policies 40
Note 2: Revenues 45
Note 3: Business Combinations 46
Note 4: Goodwill 55
Note 5: Amortizable Intangible Assets 55
Note 6: Investments 55
Note 7: Fixed Assets 57
Note 8: Accrued Expenses and Other Liabilities 58
Note 9: Long-Term Debt 58
Note 10: Income Taxes 60
Note 11: Employee Savings Plan 62
Note 12: Stock-Based Compensation 62
Note 13: Supplemental Disclosures of Cash Flow Information and Non-Cash Financing and Investing Activities 65
Note 14: Commitments and Contingencies 66
Note 15: Leases 66
Note 16: Segment Information 67
Note 17: Insurance Company WNFIC 69
Note 18: Shareholders’ Equity 69
Report of Independent Registered Public Accounting Firm 70
34
Brown & Brown, Inc. Consolidated Statements of Income
FOR THE YEAR ENDED DECEMBER 31,
(IN THOUSANDS, EXCEPT PER SHARE DATA) 2021 2020 2019
R E V E N U E S
Commissions and fees $3,047,522 $2,606,108 $2,384,737
Investment income 1,099 2,811 5,780
Other income, net 2,777 4,456 1,654
Total revenues 3,051,398 2,613,375 2,392,171
E X P E N S E S
Employee compensation and benefits 1,636,911 1,436,377 1,308,165
Other operating expenses 402,941 365,973 377,089
(Gain)/loss on disposal (9,605) (2,388) (10,021)
Amortization 119,593 108,523 105,298
Depreciation 33,309 26,276 23,417
Interest 64,981 58,973 63,660
Change in estimated acquisition earn-out payables 40,445 (4,458) (1,366)
Total expenses 2,288,575 1,989,276 1,866,242
Income before income taxes 762,823 624,099 525,929
Income taxes 175,719 143,616 127,415
Net income $587,104 $480,483 $398,514
Net income per share:
Basic $2.08 $1.70 $1.42
Diluted $2.07 $1.69 $1.40
Dividends declared per share $0.38 $0.35 $0.33
See accompanying notes to Consolidated Financial Statements.
35
20
21
AN
NU
AL
RE
PO
RT
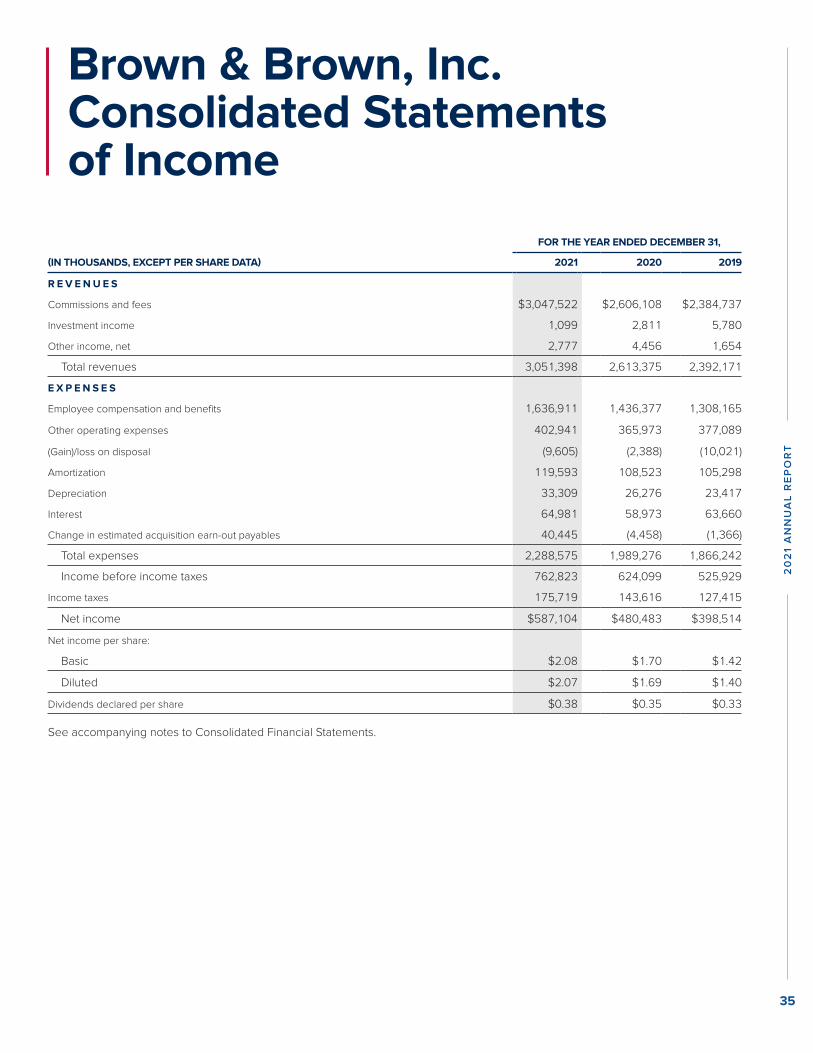
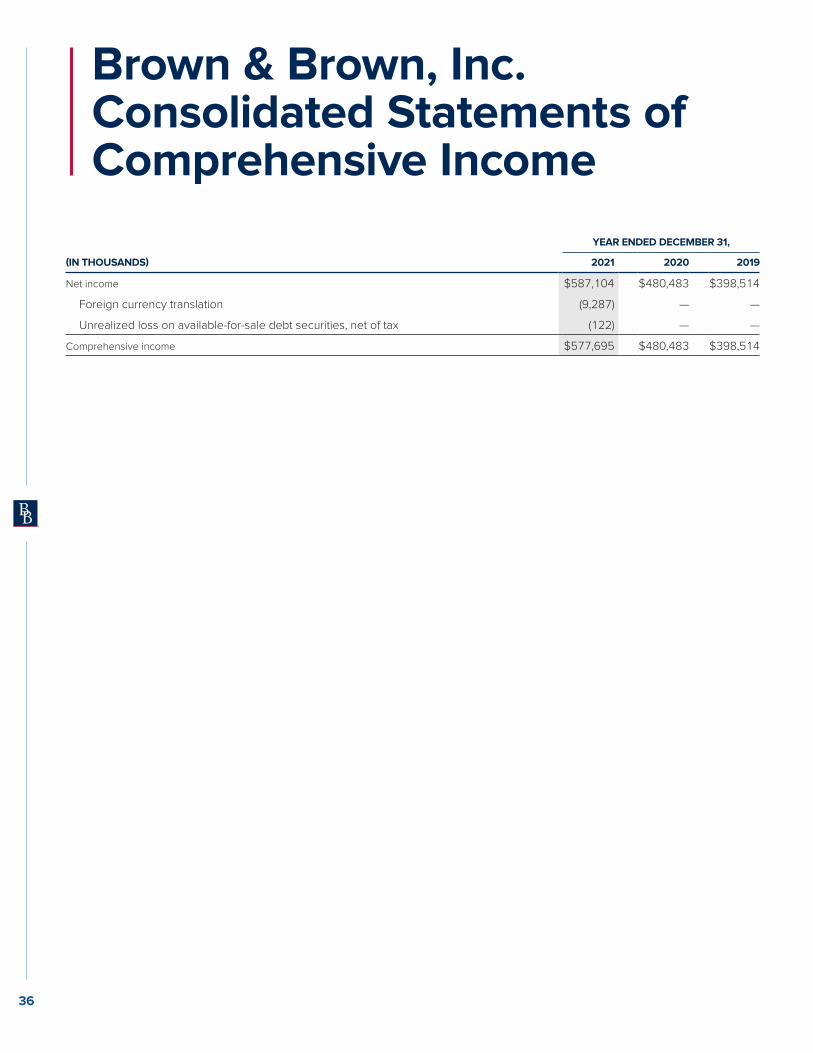
Brown & Brown, Inc. Consolidated Statements of Comprehensive Income
YEAR ENDED DECEMBER 31,
(IN THOUSANDS) 2021 2020 2019
Net income $587,104 $480,483 $398,514
Foreign currency translation (9,287) — —
Unrealized loss on available-for-sale debt securities, net of tax (122) — —
Comprehensive income $577,695 $480,483 $398,514
36
Brown & Brown, Inc. Consolidated Balance Sheets
(IN THOUSANDS, EXCEPT PER SHARE DATA) DECEMBER 31, 2021 DECEMBER 31, 2020
A S S E T S
Current Assets:
Cash and cash equivalents $887,009 $817,398
Restricted cash and investments 583,247 454,517
Short-term investments 12,891 18,332
Premiums, commissions and fees receivable 1,216,188 1,099,248
Reinsurance recoverable 63,106 43,469
Prepaid reinsurance premiums 392,222 377,615
Other current assets 175,621 147,670
Total current assets 3,330,284 2,958,249
Fixed assets, net 212,033 201,115
Operating lease assets 197,035 186,998
Goodwill 4,736,828 4,395,918
Amortizable intangible assets, net 1,081,465 1,049,660
Investments 30,970 24,971
Other assets 206,828 149,581
Total assets $9,795,443 $8,966,492
L I A B I L I T I E S A N D S H A R E H O L D E R S ’ E Q U I T Y
Current Liabilities:
Premiums payable to insurance companies $1,384,562 $1,198,529
Losses and loss adjustment reserve 63,106 43,469
Unearned premiums 392,222 377,615
Premium deposits and credits due customers 122,447 102,505
Accounts payable 206,370 190,497
Accrued expenses and other liabilities 456,159 371,737
Current portion of long-term debt 42,500 70,000
Total current liabilities 2,667,366 2,354,352
Long-term debt less unamortized discount and debt issuance costs 1,980,437 2,025,906
Operating lease liabilities 179,976 172,935
Deferred income taxes, net 386,794 344,222
Other liabilities 383,977 314,854
Shareholders’ Equity:
Common stock, par value $0.10 per share; authorized 560,000 shares; issued 300,993 shares and outstanding 282,496 at 2021, issued 299,689 shares and outstanding
283,004 shares at 2020 - in thousands. 30,099 29,969
Additional paid-in capital 849,424 794,909
Treasury stock, at cost at 18,497 at 2021 and 16,685 shares at 2020, respectively - in thousands (673,902) (591,338)
Accumulated other comprehensive loss (9,409) —
Retained earnings 4,000,681 3,520,683
Total shareholders’ equity 4,196,893 3,754,223
Total liabilities and shareholders’ equity $9,795,443 $8,966,492
See accompanying notes to Consolidated Financial Statements.
37
20
21
AN
NU
AL
RE
PO
RT
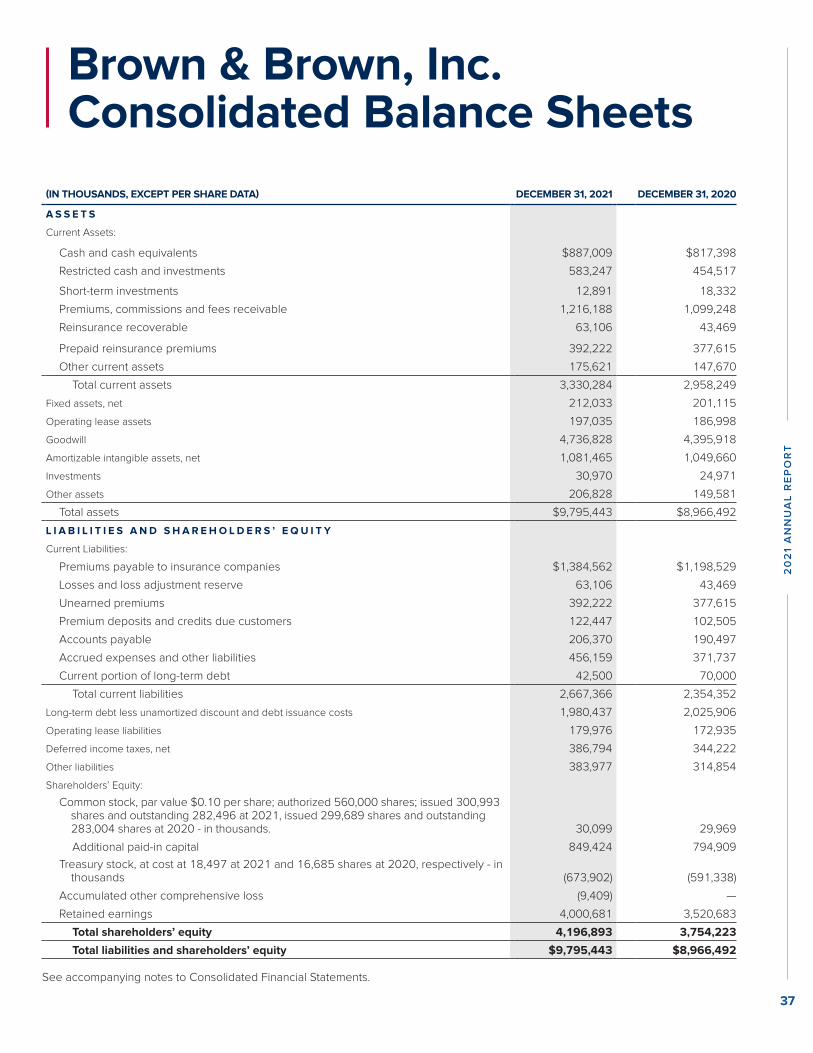
Brown & Brown, Inc. Consolidated Statements of Comprehensive Income
YEAR ENDED DECEMBER 31,
(IN THOUSANDS) 2021 2020 2019
Net income $587,104 $480,483 $398,514
Foreign currency translation (9,287) — —
Unrealized loss on available-for-sale debt securities, net of tax (122) — —
Comprehensive income $577,695 $480,483 $398,514
36
Brown & Brown, Inc. Consolidated Balance Sheets
(IN THOUSANDS, EXCEPT PER SHARE DATA) DECEMBER 31, 2021 DECEMBER 31, 2020
A S S E T S
Current Assets:
Cash and cash equivalents $887,009 $817,398
Restricted cash and investments 583,247 454,517
Short-term investments 12,891 18,332
Premiums, commissions and fees receivable 1,216,188 1,099,248
Reinsurance recoverable 63,106 43,469
Prepaid reinsurance premiums 392,222 377,615
Other current assets 175,621 147,670
Total current assets 3,330,284 2,958,249
Fixed assets, net 212,033 201,115
Operating lease assets 197,035 186,998
Goodwill 4,736,828 4,395,918
Amortizable intangible assets, net 1,081,465 1,049,660
Investments 30,970 24,971
Other assets 206,828 149,581
Total assets $9,795,443 $8,966,492
L I A B I L I T I E S A N D S H A R E H O L D E R S ’ E Q U I T Y
Current Liabilities:
Premiums payable to insurance companies $1,384,562 $1,198,529
Losses and loss adjustment reserve 63,106 43,469
Unearned premiums 392,222 377,615
Premium deposits and credits due customers 122,447 102,505
Accounts payable 206,370 190,497
Accrued expenses and other liabilities 456,159 371,737
Current portion of long-term debt 42,500 70,000
Total current liabilities 2,667,366 2,354,352
Long-term debt less unamortized discount and debt issuance costs 1,980,437 2,025,906
Operating lease liabilities 179,976 172,935
Deferred income taxes, net 386,794 344,222
Other liabilities 383,977 314,854
Shareholders’ Equity:
Common stock, par value $0.10 per share; authorized 560,000 shares; issued 300,993 shares and outstanding 282,496 at 2021, issued 299,689 shares and outstanding
283,004 shares at 2020 - in thousands. 30,099 29,969
Additional paid-in capital 849,424 794,909
Treasury stock, at cost at 18,497 at 2021 and 16,685 shares at 2020, respectively - in thousands (673,902) (591,338)
Accumulated other comprehensive loss (9,409) —
Retained earnings 4,000,681 3,520,683
Total shareholders’ equity 4,196,893 3,754,223
Total liabilities and shareholders’ equity $9,795,443 $8,966,492
See accompanying notes to Consolidated Financial Statements.
37
20
21
AN
NU
AL
RE
PO
RT
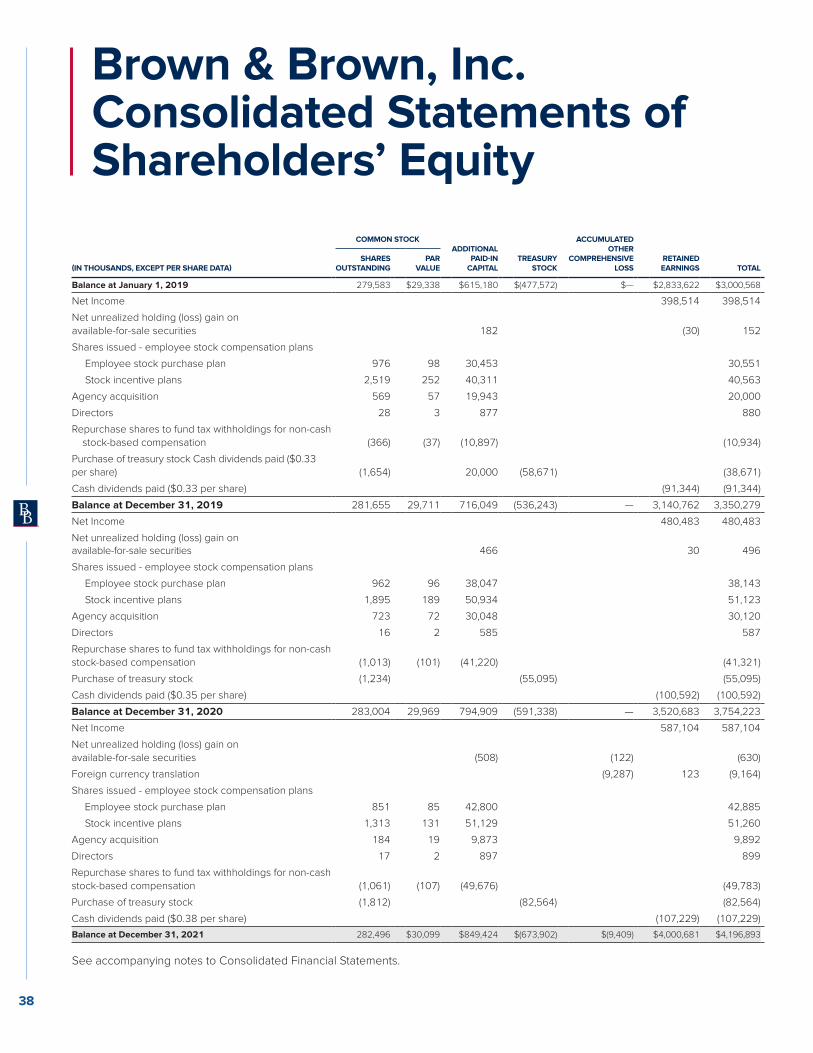
COMMON STOCKADDITIONAL
PAID-INCAPITAL
ACCUMULATEDOTHER
COMPREHENSIVELOSS(IN THOUSANDS, EXCEPT PER SHARE DATA)
SHARESOUTSTANDING
PARVALUE
TREASURYSTOCK
RETAINEDEARNINGS TOTAL
Balance at January 1, 2019 279,583 $29,338 $615,180 $(477,572) $— $2,833,622 $3,000,568
Net Income 398,514 398,514
Net unrealized holding (loss) gain on available-for-sale securities 182 (30) 152
Shares issued - employee stock compensation plans
Employee stock purchase plan 976 98 30,453 30,551
Stock incentive plans 2,519 252 40,311 40,563
Agency acquisition 569 57 19,943 20,000
Directors 28 3 877 880
Repurchase shares to fund tax withholdings for non-cash stock-based compensation (366) (37) (10,897) (10,934)
Purchase of treasury stock Cash dividends paid ($0.33 per share) (1,654) 20,000 (58,671) (38,671)
Cash dividends paid ($0.33 per share) (91,344) (91,344)
Balance at December 31, 2019 281,655 29,711 716,049 (536,243) — 3,140,762 3,350,279
Net Income 480,483 480,483
Net unrealized holding (loss) gain on available-for-sale securities 466 30 496
Shares issued - employee stock compensation plans
Employee stock purchase plan 962 96 38,047 38,143
Stock incentive plans 1,895 189 50,934 51,123
Agency acquisition 723 72 30,048 30,120
Directors 16 2 585 587
Repurchase shares to fund tax withholdings for non-cash stock-based compensation (1,013) (101) (41,220) (41,321)
Purchase of treasury stock (1,234) (55,095) (55,095)
Cash dividends paid ($0.35 per share) (100,592) (100,592)
Balance at December 31, 2020 283,004 29,969 794,909 (591,338) — 3,520,683 3,754,223
Net Income 587,104 587,104
Net unrealized holding (loss) gain on available-for-sale securities (508) (122) (630)
Foreign currency translation (9,287) 123 (9,164)
Shares issued - employee stock compensation plans
Employee stock purchase plan 851 85 42,800 42,885
Stock incentive plans 1,313 131 51,129 51,260
Agency acquisition 184 19 9,873 9,892
Directors 17 2 897 899
Repurchase shares to fund tax withholdings for non-cash stock-based compensation (1,061) (107) (49,676) (49,783)
Purchase of treasury stock (1,812) (82,564) (82,564)
Cash dividends paid ($0.38 per share) (107,229) (107,229)
Balance at December 31, 2021 282,496 $30,099 $849,424 $(673,902) $(9,409) $4,000,681 $4,196,893
See accompanying notes to Consolidated Financial Statements.
Brown & Brown, Inc. Consolidated Statements of Shareholders’ Equity
38
Brown & Brown, Inc. Consolidated Statements of Cash Flows
YEAR ENDED DECEMBER 31,
(IN THOUSANDS) 2021 2020 2019
Cash flows from operating activities:
Net income $587,104 $480,483 $398,514
Adjustments to reconcile net income to net cash provided by operating activities:
Amortization 119,593 108,523 105,298
Depreciation 33,309 26,276 23,417
Non-cash stock-based compensation 61,018 59,749 46,994
Change in estimated acquisition earn-out payables 40,445 (4,458) (1,366)
Deferred income taxes 33,616 15,943 12,383
Amortization of debt discount and disposal of deferred financing costs 2,839 2,319 2,054
Accretion of discounts and premiums, investments 171 48 (5)
(Gain)/loss on sales of investments, fixed assets and customer accounts (7,096) (831) (9,550)
Payments on acquisition earn-outs in excess of original estimated payables (21,060) (4,532) (351)
Effect of changes in foreign exchange rate changes 494 — —
Changes in operating assets and liabilities, net of effect from acquisitions and divestitures:
Premiums, commissions and fees receivable (increase) decrease (72,843) (135,367) (86,778)
Reinsurance recoverables (increase) decrease (19,637) 15,036 6,891
Prepaid reinsurance premiums (increase) decrease (14,607) (11,594) (28,101)
Other assets (increase) decrease (53,746) (42,731) (46,520)
Premiums payable to insurance companies (increase) decrease 127,991 158,775 148,658
Premium deposits and credits due customers increase (decrease) 19,581 (12,886) 7,820
Losses and loss adjustment reserve increase (decrease) 19,637 (15,036) (6,707)
Unearned premiums increase (decrease) 14,607 11,594 28,101
Accounts payable increase (decrease) 51,404 107,754 17,800
Accrued expenses and other liabilities increase (decrease) 66,782 34,716 43,330
Other liabilities increase (decrease) (47,133) (72,134) 16,298
Net cash provided by operating activities 942,469 721,647 678,180
Cash flows from investing activities:
Additions to fixed assets (45,045) (70,700) (73,108)
Payments for businesses acquired, net of cash acquired (366,780) (694,842) (353,043)
Proceeds from sales of fixed assets and customer accounts 16,735 9,615 21,592
Purchases of investments (12,375) (14,168) (17,520)
Proceeds from sales of investments 10,785 11,025 8,494
Net cash used in investing activities (396,680) (759,070) (413,585)
Cash flows from financing activities:
Payments on acquisition earn-outs (62,521) (24,977) (9,566)
Proceeds from long-term debt — 700,000 350,000
Payments on long-term debt (73,125) (55,000) (50,000)
Deferred debt issuance costs (2,683) (6,756) (3,701)
Borrowings on revolving credit facilities — 250,000 100,000
Payments on revolving credit facilities — (350,000) (350,000)
Issuances of common stock for employee stock benefit plans 34,026 30,104 24,999
Repurchase of stock benefit plan shares for employees to fund tax withholdings (49,783) (41,321) (10,933)
Purchase of treasury stock (82,564) (55,095) (58,671)
Settlement of accelerated share repurchase program — — 20,000
Cash dividends paid (107,229) (100,592) (91,344)
Net cash (used in) provided by financing activities (343,879) 346,363 (79,216)
Effect of foreign exchange rate cash changes (3,569) — —
Net increase (decrease) in cash and cash equivalents inclusive of restricted cash 198,341 308,940 185,379
Cash and cash equivalents inclusive of restricted cash at beginning of period 1,271,915 962,975 777,596
Cash and cash equivalents inclusive of restricted cash at end of period $1,470,256 $1,271,915 $962,975
See accompanying notes to Consolidated Financial Statements. Refer to Note 13 for reconciliation of cash and cash equivalents inclusive
of restricted cash. 39
20
21
AN
NU
AL
RE
PO
RT
Notes to Consolidated Financial Statements
NOTE 1. Summary of Significant Accounting Policies
Nature of OperationsBrown & Brown, Inc., a Florida corporation and its subsidiaries (collectively, “Brown & Brown” or the “Company”) is a diversified insurance
agency, wholesale brokerage, insurance programs and service organization that markets and sells insurance products and services,
primarily in the property, casualty and employee benefits areas. Brown & Brown’s business is divided into four reportable segments.
The Retail Segment provides a broad range of insurance products and services to commercial, public and quasi-public, professional
and individual insured customers, and non-insurance risk-mitigating products through our automobile dealer services (“F&I”) businesses.
The National Programs Segment, which acts as a managing general agent (“MGA”), provides professional liability and related package
products for certain professionals, a range of insurance products for individuals, flood coverage, and targeted products and services
designated for specific industries, trade groups, governmental entities and market niches, all of which are delivered through a nationwide
network of independent agents, including Brown & Brown retail agents. The Wholesale Brokerage Segment markets and sells excess
and surplus commercial and personal lines insurance, primarily through independent agents and brokers, as well as Brown & Brown
retail agents. The Services Segment provides insurance-related services, including third-party claims administration and comprehensive
medical utilization management services in both the workers’ compensation and all-lines liability arenas, as well as Medicare Set-aside
services, Social Security disability and Medicare benefits advocacy services and claims adjusting services.
Recently Issued Accounting PronouncementsIn October 2021, the Financial Accounting Standards Board (“FASB”) issued ASU 2021-08, Business Combinations (Topic 805):
Accounting for Contract Assets and Contract Liabilities from Contracts with Customers. The amendment requires an acquirer in a
business combination to recognize and measure contract assets and contract liabilities in accordance with Accounting Standards
Codification (“ASC”) Topic 606. ASU 2021-08 is effective for fiscal years beginning after December 15, 2022 and early adoption is
permitted. While the Company is continuing to assess the timing of adoption and the potential impacts of ASU 2021-08, it does not
expect ASU 2021-08 to have a material effect on its consolidated financial statements.
In March 2020, the FASB issued ASU 2020-04, “Reference Rate Reform (Topic 848): Facilitation of the Effects of Reference Rate Reform
on Financial Reporting.” The amendments provide optional guidance for a limited time to ease the potential burden in accounting
for reference rate reform. The new guidance provides optional expedients and exceptions for applying GAAP to contracts, hedging
relationships and other transactions affected by reference rate reform if certain criteria are met. The amendments apply only to contracts
and hedging relationships that reference the London Interbank Offered Rate (“LIBOR”), or another reference rate expected to be
discontinued due to reference rate reform. These amendments are effective immediately and may be applied prospectively to contract
modifications made and hedging relationships entered into or evaluated on or before December 31, 2022. We are currently evaluating
our contracts and the available expedients provided by the new standard; however, the Company can assert there is no impact to any
carrying value of assets or liabilities aside from our floating-rate debt instruments that are indexed to LIBOR and are carried at amortized
cost. Any further impact of adoption will be in determining the new periodic floating interest rate indexed to our floating-rate debt
instruments with no impact on the balance sheet upon adoption.
Recently Adopted Accounting StandardsIn December 2019, the FASB issued ASU 2019-12, “Income Taxes (Topic 740): Simplifying the Accounting for Income Taxes.” The standard
removes specific exceptions in the current rules and eliminates the need for an organization to analyze whether the following apply in a
given period: (a) exception to the incremental approach for intra-period tax allocation; (b) exceptions to accounting for basis differences
when there are ownership changes in foreign investments and (c) exception in interim period income tax accounting for year-to-date
losses that exceed anticipated losses. The standard also is designed to improve financial statement preparers’ application of income
tax-related guidance and simplify GAAP for (a) franchise taxes that are partially based on income; (b) transactions with a government
that result in a step-up in the tax basis of goodwill; (c) separate financial statements of legal entities that are not subject to tax and (d)
enacted changes in tax laws in interim periods. The Company adopted ASU 2019-12 effective January 1, 2021. The impact of adopting this
standard was not material to the presentation of the Consolidated Financial Statements.
40
In August 2018, the FASB issued ASU 2018-15, “Intangibles—Goodwill and Other—Internal-Use Software (Subtopic 350-40):
Customer’s Accounting for Implementation Costs Incurred in a Cloud Computing Arrangement That Is a Service Contract,” which
provides guidance for capitalizing implementation costs incurred in a hosting arrangement that is a service contract with the
requirements for capitalizing implementation costs incurred to develop or obtain internal-use software (and hosting arrangements
that include an internal-use software license). ASU 2018-15 became effective for public companies for fiscal years, and interim
periods within those fiscal years, beginning after December 15, 2019. The Company adopted ASU 2018-15 effective January 1,
2020. The impact of adoption of this standard on our consolidated financial statements, including accounting policies, processes
and systems, was not material.
In January 2017, the FASB issued ASU No. 2017-04, “Intangibles-Goodwill and Other (Topic 350): Simplifying the Test for Goodwill
Impairment.” The new guidance eliminates Step 2 of the goodwill impairment test. The updated guidance requires an entity to
perform its annual or interim goodwill impairment test by comparing the fair value of the reporting unit to its carrying value, and
recognizing a non-cash impairment charge for the amount by which the carrying value exceeds the reporting unit’s fair value
with the loss not exceeding the total amount of goodwill allocated to that reporting unit. ASU 2017-04 became effective for public
companies for fiscal years, and interim periods within those fiscal years, beginning after December 15, 2019 and will be applied
prospectively. The Company adopted ASU 2017-04 effective January 1, 2020, with interim or annual goodwill impairment tests now
comparing the fair value of a reporting unit with its carrying value and no longer performing Step 2 of the goodwill impairment test.
There was no impact from adopting ASU 2017-04 as there were no impairments recorded.
In June 2016, the FASB issued ASU 2016-13, “Financial Instruments – Credit Losses (Topic 326): Measurement of Credit Losses on
Financial Instruments”. The new guidance adds an impairment model, known as the current expected credit loss (CECL) model that
is based on expected losses rather than incurred losses. These amendments require the measurement of all expected credit losses
for financial assets held at the reporting date based on historical experience, current conditions and reasonable forward-looking
information, which is intended to result in more timely recognition of such losses. All related guidance has been codified into, and
is now known as, ASC 326 – Financial Instruments—Credit Losses. The new standard is effective for public companies for annual
reporting periods beginning after December 15, 2019, and interim periods therein. The Company adopted ASU 2016-13 effective
January 1, 2020 and determined there was not a material impact on the Company’s Financial Statements given that historical trend
analysis and assessments for forward-looking qualitative analysis are already integrated into financial assessments for the Company.
Principles of ConsolidationThe accompanying Consolidated Financial Statements include the accounts of Brown & Brown, Inc. and its subsidiaries. All significant
intercompany account balances and transactions have been eliminated in the Consolidated Financial Statements.
Revenue RecognitionThe Company earns commissions paid by insurance carriers for the binding of insurance coverage. Commissions are earned at a point
in time upon the effective date of bound insurance coverage, as no performance obligation exists after coverage is bound. If there
are other services within the contract, the Company estimates the stand-alone selling price for each separate performance obligation,
and the corresponding apportioned revenue is recognized over a period of time as the performance obligations are fulfilled. The
Company earns fee revenue by receiving negotiated fees in lieu of a commission and from services other than securing insurance
coverage. Fee revenues from certain agreements are recognized depending on when the services within the contract are satisfied
and when we have transferred control of the related services to the customer. In situations where multiple performance obligations
exist within a fee contract, in some instances the use of estimates is required to allocate the transaction price on a relative stand-alone
selling price basis to each separate performance obligation. Incentive commissions represent a form of variable consideration which
includes additional commissions over base commissions received from insurance carriers based on predetermined production levels
mutually agreed upon by both parties. Profit-sharing contingent commissions represent a form of variable consideration associated
with the placement of coverage, for which we earn commissions. Profit-sharing contingent commissions and incentive commissions
are estimated with a constraint applied and accrued relative to the recognition of the corresponding core commissions based on
the amount of consideration that will be received in the coming year such that a significant reversal of revenue is not probable.
Guaranteed supplemental commissions, a form of variable consideration, represent guaranteed fixed-base agreements.
Management determines the policy cancellation reserve based upon historical cancellation experience adjusted for any known
circumstances.
Use of EstimatesThe preparation of the Consolidated Financial Statements in conformity with accounting principles generally accepted in the United
States of America (“GAAP”) requires management to make estimates and assumptions that affect the reported amounts of assets
and liabilities, as well as disclosures of contingent assets and liabilities, at the date of the Consolidated Financial Statements, and the
reported amounts of revenues and expenses during the reporting period. Actual results may differ from those estimates. 41
20
21
AN
NU
AL
RE
PO
RT
Cash and Cash EquivalentsCash and cash equivalents principally consist of demand deposits with financial institutions and highly liquid investments with quoted
market prices having maturities of three months or less when purchased. Included in cash and cash equivalents are unrestricted
premium from insureds and prefunded claims from carriers held in a fiduciary capacity.
Restricted Cash and Investments, and Premiums, Commissions and Fees ReceivableIn our capacity as an insurance agent or broker, the Company typically collects premiums from insureds and, after deducting the
authorized commissions, remits the net premiums to the appropriate insurance company or companies. Accordingly, premiums that
are receivable from insureds are reported within Premiums, commissions, and fees receivable in the Consolidated Balance Sheets.
Unremitted net insurance premiums are held in a fiduciary capacity until the Company disburses them, and the use of such funds is
restricted by laws in certain jurisdictions in which our subsidiaries operate, or restricted due to our contracts with a certain insurance
company or companies in which we hold premiums in a fiduciary capacity. Where allowed by law, the Company invests these
unremitted funds only in cash, money market accounts, tax-free variable-rate demand bonds and commercial paper held for a short-
term. In certain states in which the Company operates, the use and investment alternatives for these funds are regulated and restricted
by various state laws and agencies. These restricted funds are reported as restricted cash and investments on the Consolidated
Balance Sheets. The interest income earned on these unremitted funds, where allowed by state law, is reported as investment income
in the Consolidated Statement of Income.
In other circumstances, the insurance companies collect the premiums directly from the insureds and remit the applicable commissions
to the Company. Accordingly, as reported in the Consolidated Balance Sheets, commissions are receivables from insurance
companies. Fees are primarily receivables due from customers.
InvestmentsCertificates of deposit, and other securities, having maturities of more than three months when purchased are reported at cost and
are adjusted for other-than-temporary market value declines. The Company’s investment holdings include U.S. Government securities,
municipal bonds, domestic corporate and foreign corporate bonds as well as short-duration fixed income funds. Investments within the
portfolio or funds are held as available-for-sale and are carried at their fair value. Any gain/loss applicable from the fair value change is
recorded, net of tax, as other comprehensive income within the equity section of the Consolidated Balance Sheets. Realized gains and
losses are reported as investment income on the Consolidated Statement of Income, with the cost of securities sold determined on a
specific identification basis.
Fixed AssetsFixed assets, including leasehold improvements, are carried at cost, less accumulated depreciation and amortization. Expenditures for
improvements are capitalized, and expenditures for maintenance and repairs are expensed to operations as incurred. Upon sale or
retirement, the cost and related accumulated depreciation and amortization are removed from the accounts and the resulting gain or
loss, if any, is reflected in other income. Depreciation has been determined using the straight-line method over the estimated useful
lives of the related assets, which range from 3 to 40 years. Leasehold improvements are amortized on the straight-line method over
the shorter of the useful life of the improvement or the term of the related lease.
Goodwill and Amortizable Intangible AssetsAll of our business combinations are accounted for using the acquisition method. Acquisition purchase prices are typically based
upon a multiple of average annual EBITDAC (defined below), and/or revenue earned over a period of 3 years within a minimum and
maximum price range. The recorded purchase prices for acquisitions include an estimation of the fair value of liabilities associated
with any potential earn-out provisions. Subsequent changes in the fair value of earn-out obligations are recorded in the Consolidated
Statement of Income when incurred.
The fair value of earn-out obligations is based upon the present value of the expected future payments to be made to the sellers of the
acquired businesses in accordance with the provisions contained in the respective purchase agreements. In determining fair value, the
acquired business’ future performance is estimated using financial projections developed by management for the acquired business
and this estimate reflects market participant assumptions regarding revenue growth and/or profitability. The expected future payments
are estimated on the basis of the earn-out formula and performance targets specified in each purchase agreement compared to
the associated financial projections. These estimates are then discounted to present value using a risk-adjusted rate that takes into
consideration the likelihood that the forecast earn-out payments will be made.42
Amortizable intangible assets are stated at cost, less accumulated amortization, and consist of purchased customer accounts and
non-compete agreements. Purchased customer accounts and non-compete agreements are amortized on a straight-line basis over
the related estimated lives and contract periods, which typically range from 3 to 15 years. Purchased customer accounts represent
the value of the customer relationship, but also consist of records and files that contain information about insurance policies and the
related insured parties that are essential to policy renewals.
The excess of the purchase price of an acquisition over the fair value of the identifiable tangible and amortizable intangible assets
is assigned to goodwill. While goodwill is not amortizable, it is subject to assessment at least annually, and more frequently in the
presence of certain circumstances, for impairment by application of a fair value-based test. The Company compares the fair value of
each reporting unit with its carrying amount to determine if there is potential impairment of goodwill. The Company may elect to first
perform a qualitative assessment to determine whether it is more likely than not that a reporting unit is impaired. If the Company does
not perform a qualitative assessment, or if it is determined that it is more likely than not that the fair value of a reporting unit exceeds
its carrying amount, the Company will calculate the fair value of the reporting unit. If the fair value of the reporting unit is less than its
carrying value, an impairment loss is recorded to the extent that the fair value of the goodwill within the reporting unit is less than its
carrying value. Fair value is estimated based upon multiples of earnings before interest, income taxes, depreciation, amortization and
change in estimated acquisition earn-out payables (“EBITDAC”), or on a discounted cash flow basis. The Company completed its most
recent annual assessment as of November 30, 2021 and determined that the fair value of goodwill significantly exceeded the carrying
value of such assets. In addition, as of December 31, 2021, there are no accumulated impairment losses.
The carrying value of amortizable intangible assets attributable to each business or asset group comprising the Company is
periodically reviewed by management to determine if there are events or changes in circumstances that would indicate that its carrying
amount may not be recoverable. Accordingly, if there are any such changes in circumstances during the year, the Company assesses
the carrying value of its amortizable intangible assets by considering the estimated future undiscounted cash flows generated by the
corresponding business or asset group. Any impairment identified through this assessment may require that the carrying value of
related amortizable intangible assets be adjusted after determining the fair value of the amortizable intangible assets. There were no
impairments recorded for the years ended December 31, 2021, 2020 and 2019.
Income TaxesThe Company records income tax expense using the asset-and-liability method of accounting for deferred income taxes. Under this
method, deferred tax assets and liabilities are recognized for the expected future tax consequences of temporary differences between
the financial statement carrying values and the income tax bases of the Company’s assets and liabilities.
The Company files a consolidated federal income tax return and has elected to file consolidated returns in certain states. Deferred
income taxes are provided for in the Consolidated Financial Statements and relate principally to expenses charged to income for
financial reporting purposes in one period and deducted for income tax purposes in other periods.
Net Income Per ShareBasic net income per share is computed based on the weighted average number of common shares (including participating securities)
issued and outstanding during the period. Diluted net income per share is computed based on the weighted average number of
common shares issued and outstanding plus equivalent shares, assuming the exercise of stock options. The dilutive effect of stock
options is computed by application of the treasury-stock method.
The following is a reconciliation between basic and diluted weighted average shares outstanding for the years ended December 31:
(IN THOUSANDS, EXCEPT PER SHARE DATA) 2021 2020 2019
Net income $587,104 $480,483 $398,514
Net income attributable to unvested awarded performance stock (12,942 ) (15,197) (12,873)
Net income attributable to common shares $574,162 $465,286 $385,641
Weighted average number of common shares outstanding – basic 282,246 283,294 281,566
Less unvested awarded performance stock included in weighted average number of common shares outstanding – basic (6,222) (8,960) (9,095)
Weighted average number of common shares outstanding for basic earnings per common share 276,024 274,334 272,471
Dilutive effect of stock options 1,390 1,533 2,145
Weighted average number of shares outstanding – diluted 277,414 275,867 274,616
Net income per share:
Basic $2.08 $1.70 $1.42
Diluted $2.07 $1.69 $1.4043
20
21
AN
NU
AL
RE
PO
RT

Fair Value of Financial InstrumentsThe carrying amounts of the Company’s financial assets and liabilities, including cash and cash equivalents; restricted cash and short-
term investments; investments; premiums, commissions and fees receivable; reinsurance recoverable; prepaid reinsurance premiums;
premiums payable to insurance companies; losses and loss adjustment reserve; unearned premium; premium deposits and credits
due customers and accounts payable, at December 31, 2021 and 2020, approximate fair value because of the short-term maturity of
these instruments. The carrying amount of the Company’s long-term debt approximates fair value at December 31, 2021 and 2020
as our fixed-rate borrowings of $1,548.5 million approximate their values using market quotes of notes with the similar terms as ours,
which we deem a close approximation of current market rates. The estimated fair value of our variable floating rate debt agreements
is $486.9 million which approximates the carrying value due to the variable interest rate based upon adjusted LIBOR. See Note 3 to
our Consolidated Financial Statements for the fair values related to the establishment of intangible assets and the establishment and
adjustment of earn-out payables. See Note 6 for information on the fair value of investments and Note 9 for information on the fair
value of long-term debt.
Non-Cash Stock-Based CompensationThe Company has stock-based compensation plans that provide for grants of restricted stock, restricted stock units, stock options
and other stock-based awards to employees and non-employee directors of the Company. In addition, the Company has an
Employee Stock Purchase Plan which allows employees to purchase shares in the Company. The Company expenses stock-based
compensation, which is included in Employee compensation and benefits in the Consolidated Statements of Income over the requisite
service period. The significant assumptions underlying our expense calculations include the fair value of the award on the date of
grant, the estimated achievement of any performance targets and estimated forfeiture rates.
The Company uses the Black-Scholes valuation model for valuing all stock options and shares purchased under the Employee Stock
Purchase Plan (the “ESPP”). Compensation for non-vested stock awards is measured at fair value on the grant date based upon the
number of shares expected to vest. Compensation cost for all awards is recognized in earnings, net of estimated forfeitures, on a
straight-line basis over the requisite service period.
ReinsuranceThe Company acts in a risk-bearing capacity for flood insurance associated with the Wright National Flood Insurance Company
(“WNFIC”), which is part of our National Programs Segment. The Company protects itself from claims-related losses by reinsuring
all claims risk exposure. However, for basic admitted policies conforming to the National Flood Insurance Program all exposure is
reinsured with the Federal Emergency Management Agency (“FEMA”). For excess flood insurance policies, all exposure is reinsured
with a reinsurance carrier with an AM Best Company rating of “A” or better. Reinsurance does not legally discharge the ceding
insurer from the primary liability for the full amount due under the reinsured policies. Reinsurance premiums, commissions, expense
reimbursement and reserves related to ceded business are accounted for on a basis consistent with the accounting for the original
policies issued and the terms of reinsurance contracts. Premiums earned and losses and loss adjustment expenses incurred are
reported net of reinsurance amounts. Other underwriting expenses are shown net of earned ceding commission income. The liabilities
for unpaid losses and loss adjustment expenses and unearned premiums are reported gross of ceded reinsurance recoverable.
Balances due from reinsurers on unpaid losses and loss adjustment expenses, including an estimate of such recoverables related to
reserves for incurred but not reported (“IBNR”) losses, are reported as assets and are included in reinsurance recoverable even though
amounts due on unpaid loss and loss adjustment expense are not recoverable from the reinsurer until such losses are paid. The
Company does not believe it is exposed to any material credit risk through its reinsurance as the reinsurer is FEMA for basic admitted
flood policies and national reinsurance carriers for private flood policies, which has an AM Best Company rating of “A” or better.
Historically, no amounts due from reinsurance carriers have been written off as uncollectible.
The Company also operates a capitalized captive insurance facility (the “Captive”), which started in December 2021, for the purpose
of having additional capacity to sell property insurance for earthquake and wind exposed properties. The Captive buys reinsurance,
limiting, but not completely eliminating the Company’s exposure to underwriting losses. The operations of the Captive were not
material to the Consolidated Financial Statements for the year ended December 31, 2021.
44
Unpaid Losses and Loss Adjustment ReserveUnpaid losses and loss adjustment reserve include amounts determined on individual claims and other estimates based upon the
past experience of WNFIC, the Captive and the policyholders for IBNR claims, less anticipated salvage and subrogation recoverable.
The methods of making such estimates and for establishing the resulting reserves are continually reviewed and updated, and any
adjustments resulting therefrom are reflected in operations currently.
The Company engages the services of outside actuarial consulting firms (the “Actuaries”) to assist on an annual basis to render an
opinion on the sufficiency of the Company’s estimates for unpaid losses and related loss adjustment reserve. The Actuaries utilize
both industry experience and the Company’s own experience to develop estimates of those amounts as of year-end. These estimated
liabilities are subject to the impact of future changes in claim severity, frequency and other factors. In spite of the variability inherent in
such estimates, management believes that the liabilities for unpaid losses and related loss adjustment reserve are adequate.
Premiums are recognized as income over the coverage period of the related policies. Unearned premiums represent the portion of
premiums written that relate to the unexpired terms of the policies in force and are determined on a daily pro rata basis. The income is
recorded to the commissions and fees line of the Consolidated Statement of Income.
NOTE 2. RevenuesThe following tables present the revenues disaggregated by revenue source:
FOR THE YEAR ENDED DECEMBER 31, 2021
(IN THOUSANDS) RETAILNATIONAL
PROGRAMSWHOLESALEBROKERAGE SERVICES OTHER(8) TOTAL
Base commissions(1) $1,198,129 $488,787 $323,054 $— $42 $2,010,012
Fees(2) 414,937 173,790 67,233 178,857 (1,787) 833,030
Incentive commissions(3) 98,254 1,653 3,342 — — 103,249
Profit-sharing contingent commissions(4) 38,895 35,259 8,072 — — 82,226
Guaranteed supplemental commissions(5) 16,452 1,619 934 — — 19,005
Investment income(6) 278 550 155 3 113 1,099
Other income, net(7) 993 192 627 — 965 2,777
Total Revenues $ 1,767,938 $701,850 $403,417 $178,860 $(667) $ 3,051,398
FOR THE YEAR ENDED DECEMBER 31, 2020
(IN THOUSANDS) RETAILNATIONAL
PROGRAMSWHOLESALEBROKERAGE SERVICES OTHER(8) TOTAL
Base commissions(1) $1,054,619 $422,916 $273,878 $— $1 $1,751,414
Fees(2) 275,900 159,337 66,051 174,012 (1,291) 674,009
Incentive commissions(3) 89,920 549 3,057 — 31 93,557
Profit-sharing contingent commissions(4) 35,785 27,278 7,871 — — 70,934
Guaranteed supplemental commissions(5) 15,128 (238) 1,304 — — 16,194
Investment income(6) 163 756 184 — 1,708 2,811
Other income, net(7) 1,251 42 452 — 2,711 4,456
Total Revenues $1,472,766 $610,640 $352,797 $174,012 $3,160 $2,613,375
(1) Base commissions generally represent a percentage of the premium paid by an insured and are affected by fluctuations in both premium rate levels charged by insurance
companies and the insureds’ underlying “insurable exposure units,” which are units that insurance companies use to measure or express insurance exposed to risk (such as
property values, or sales and payroll levels) to determine what premium to charge the insured. Insurance companies establish these premium rates based upon many factors,
including loss experience, risk profile and reinsurance rates paid by such insurance companies, none of which we control.
(2) Fee revenues relate to fees for services other than securing coverage for our customers, fees negotiated in lieu of commissions, and F&I products and services.
(3) Incentive commissions include additional commissions over base commissions received from insurance carriers based on predetermined production levels mutually agreed
upon by both parties.
(4) Profit-sharing contingent commissions are based primarily on underwriting results, but may also reflect considerations for volume, growth and/or retention.
(5) Guaranteed supplemental commissions represent guaranteed fixed-base agreements.
(6) Investment income consists primarily of interest on cash and investments.
(7) Other income consists primarily of legal settlements and other miscellaneous income.
(8) Fees within other reflects the elimination of intercompany revenues.45
20
21
AN
NU
AL
RE
PO
RT
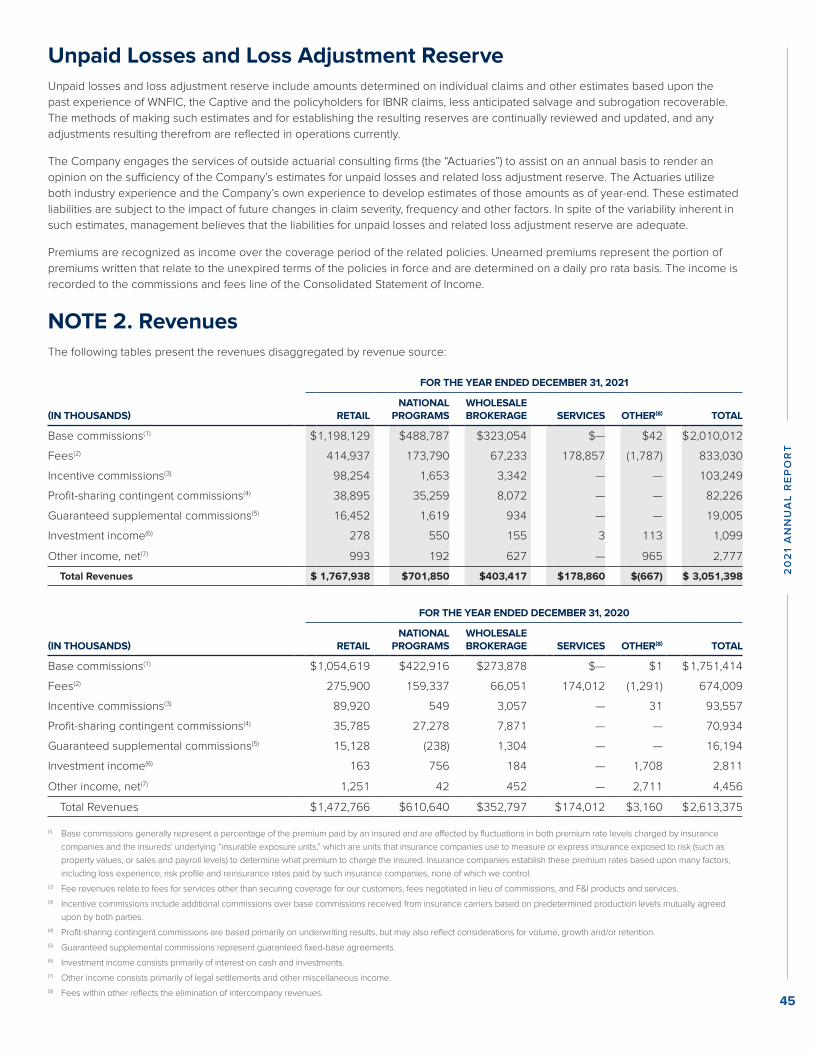
Fair Value of Financial InstrumentsThe carrying amounts of the Company’s financial assets and liabilities, including cash and cash equivalents; restricted cash and short-
term investments; investments; premiums, commissions and fees receivable; reinsurance recoverable; prepaid reinsurance premiums;
premiums payable to insurance companies; losses and loss adjustment reserve; unearned premium; premium deposits and credits
due customers and accounts payable, at December 31, 2021 and 2020, approximate fair value because of the short-term maturity of
these instruments. The carrying amount of the Company’s long-term debt approximates fair value at December 31, 2021 and 2020
as our fixed-rate borrowings of $1,548.5 million approximate their values using market quotes of notes with the similar terms as ours,
which we deem a close approximation of current market rates. The estimated fair value of our variable floating rate debt agreements
is $486.9 million which approximates the carrying value due to the variable interest rate based upon adjusted LIBOR. See Note 3 to
our Consolidated Financial Statements for the fair values related to the establishment of intangible assets and the establishment and
adjustment of earn-out payables. See Note 6 for information on the fair value of investments and Note 9 for information on the fair
value of long-term debt.
Non-Cash Stock-Based CompensationThe Company has stock-based compensation plans that provide for grants of restricted stock, restricted stock units, stock options
and other stock-based awards to employees and non-employee directors of the Company. In addition, the Company has an
Employee Stock Purchase Plan which allows employees to purchase shares in the Company. The Company expenses stock-based
compensation, which is included in Employee compensation and benefits in the Consolidated Statements of Income over the requisite
service period. The significant assumptions underlying our expense calculations include the fair value of the award on the date of
grant, the estimated achievement of any performance targets and estimated forfeiture rates.
The Company uses the Black-Scholes valuation model for valuing all stock options and shares purchased under the Employee Stock
Purchase Plan (the “ESPP”). Compensation for non-vested stock awards is measured at fair value on the grant date based upon the
number of shares expected to vest. Compensation cost for all awards is recognized in earnings, net of estimated forfeitures, on a
straight-line basis over the requisite service period.
ReinsuranceThe Company acts in a risk-bearing capacity for flood insurance associated with the Wright National Flood Insurance Company
(“WNFIC”), which is part of our National Programs Segment. The Company protects itself from claims-related losses by reinsuring
all claims risk exposure. However, for basic admitted policies conforming to the National Flood Insurance Program all exposure is
reinsured with the Federal Emergency Management Agency (“FEMA”). For excess flood insurance policies, all exposure is reinsured
with a reinsurance carrier with an AM Best Company rating of “A” or better. Reinsurance does not legally discharge the ceding
insurer from the primary liability for the full amount due under the reinsured policies. Reinsurance premiums, commissions, expense
reimbursement and reserves related to ceded business are accounted for on a basis consistent with the accounting for the original
policies issued and the terms of reinsurance contracts. Premiums earned and losses and loss adjustment expenses incurred are
reported net of reinsurance amounts. Other underwriting expenses are shown net of earned ceding commission income. The liabilities
for unpaid losses and loss adjustment expenses and unearned premiums are reported gross of ceded reinsurance recoverable.
Balances due from reinsurers on unpaid losses and loss adjustment expenses, including an estimate of such recoverables related to
reserves for incurred but not reported (“IBNR”) losses, are reported as assets and are included in reinsurance recoverable even though
amounts due on unpaid loss and loss adjustment expense are not recoverable from the reinsurer until such losses are paid. The
Company does not believe it is exposed to any material credit risk through its reinsurance as the reinsurer is FEMA for basic admitted
flood policies and national reinsurance carriers for private flood policies, which has an AM Best Company rating of “A” or better.
Historically, no amounts due from reinsurance carriers have been written off as uncollectible.
The Company also operates a capitalized captive insurance facility (the “Captive”), which started in December 2021, for the purpose
of having additional capacity to sell property insurance for earthquake and wind exposed properties. The Captive buys reinsurance,
limiting, but not completely eliminating the Company’s exposure to underwriting losses. The operations of the Captive were not
material to the Consolidated Financial Statements for the year ended December 31, 2021.
44
Unpaid Losses and Loss Adjustment ReserveUnpaid losses and loss adjustment reserve include amounts determined on individual claims and other estimates based upon the
past experience of WNFIC, the Captive and the policyholders for IBNR claims, less anticipated salvage and subrogation recoverable.
The methods of making such estimates and for establishing the resulting reserves are continually reviewed and updated, and any
adjustments resulting therefrom are reflected in operations currently.
The Company engages the services of outside actuarial consulting firms (the “Actuaries”) to assist on an annual basis to render an
opinion on the sufficiency of the Company’s estimates for unpaid losses and related loss adjustment reserve. The Actuaries utilize
both industry experience and the Company’s own experience to develop estimates of those amounts as of year-end. These estimated
liabilities are subject to the impact of future changes in claim severity, frequency and other factors. In spite of the variability inherent in
such estimates, management believes that the liabilities for unpaid losses and related loss adjustment reserve are adequate.
Premiums are recognized as income over the coverage period of the related policies. Unearned premiums represent the portion of
premiums written that relate to the unexpired terms of the policies in force and are determined on a daily pro rata basis. The income is
recorded to the commissions and fees line of the Consolidated Statement of Income.
NOTE 2. RevenuesThe following tables present the revenues disaggregated by revenue source:
FOR THE YEAR ENDED DECEMBER 31, 2021
(IN THOUSANDS) RETAILNATIONAL
PROGRAMSWHOLESALEBROKERAGE SERVICES OTHER(8) TOTAL
Base commissions(1) $1,198,129 $488,787 $323,054 $— $42 $2,010,012
Fees(2) 414,937 173,790 67,233 178,857 (1,787) 833,030
Incentive commissions(3) 98,254 1,653 3,342 — — 103,249
Profit-sharing contingent commissions(4) 38,895 35,259 8,072 — — 82,226
Guaranteed supplemental commissions(5) 16,452 1,619 934 — — 19,005
Investment income(6) 278 550 155 3 113 1,099
Other income, net(7) 993 192 627 — 965 2,777
Total Revenues $ 1,767,938 $701,850 $403,417 $178,860 $(667) $ 3,051,398
FOR THE YEAR ENDED DECEMBER 31, 2020
(IN THOUSANDS) RETAILNATIONAL
PROGRAMSWHOLESALEBROKERAGE SERVICES OTHER(8) TOTAL
Base commissions(1) $1,054,619 $422,916 $273,878 $— $1 $1,751,414
Fees(2) 275,900 159,337 66,051 174,012 (1,291) 674,009
Incentive commissions(3) 89,920 549 3,057 — 31 93,557
Profit-sharing contingent commissions(4) 35,785 27,278 7,871 — — 70,934
Guaranteed supplemental commissions(5) 15,128 (238) 1,304 — — 16,194
Investment income(6) 163 756 184 — 1,708 2,811
Other income, net(7) 1,251 42 452 — 2,711 4,456
Total Revenues $1,472,766 $610,640 $352,797 $174,012 $3,160 $2,613,375
(1) Base commissions generally represent a percentage of the premium paid by an insured and are affected by fluctuations in both premium rate levels charged by insurance
companies and the insureds’ underlying “insurable exposure units,” which are units that insurance companies use to measure or express insurance exposed to risk (such as
property values, or sales and payroll levels) to determine what premium to charge the insured. Insurance companies establish these premium rates based upon many factors,
including loss experience, risk profile and reinsurance rates paid by such insurance companies, none of which we control.
(2) Fee revenues relate to fees for services other than securing coverage for our customers, fees negotiated in lieu of commissions, and F&I products and services.
(3) Incentive commissions include additional commissions over base commissions received from insurance carriers based on predetermined production levels mutually agreed
upon by both parties.
(4) Profit-sharing contingent commissions are based primarily on underwriting results, but may also reflect considerations for volume, growth and/or retention.
(5) Guaranteed supplemental commissions represent guaranteed fixed-base agreements.
(6) Investment income consists primarily of interest on cash and investments.
(7) Other income consists primarily of legal settlements and other miscellaneous income.
(8) Fees within other reflects the elimination of intercompany revenues.45
20
21
AN
NU
AL
RE
PO
RT

Contract Assets and LiabilitiesThe balances of contract assets and contract liabilities arising from contracts with customers as of December 31, 2021 and 2020 were
as follows:
(IN THOUSANDS) DECEMBER 31, 2021 DECEMBER 31, 2020
Contract assets $ 361,834 $ 308,755
Contract liabilities $97,933 $80,997
Unbilled receivables (contract assets) arise when the Company recognizes revenue for amounts which have not yet been billed in our
systems. Deferred revenue (contract liabilities) relates to payments received in advance of performance under the contract before the
transfer of a good or service to the customer.
As of December 31, 2021, deferred revenue (recorded within the accrued expenses and other liabilities caption in the Company’s Consolidated
Balance Sheets) consisted of $67.4 million as current portion to be recognized within one year and $30.5 million in long-term (recorded within the
other liabilities caption in the Company’s Consolidated Balance Sheets) to be recognized beyond one year. As of December 31, 2020, deferred
revenue consisted of $54.0 million as current portion to be recognized within one year and $27.0 million in long-term deferred revenue to be
recognized beyond one year.
Contract assets and contract liabilities arising from acquisitions in 2021 were approximately $5.5 million and $1.2 million, respectively. Contract
assets and contract liabilities arising from acquisitions in 2020 were approximately $11.5 million and $20.0 million, respectively.
During the 12 months ended December 31, 2021 and 2020, the amount of revenue recognized related to performance obligations satisfied in
a previous period, inclusive of changes due to estimates, was approximately $23.3 million and $8.9 million, respectively. The $23.3 million for
2021 consists of additional variable consideration received on our incentive and profit-sharing contingent commissions. The $8.9 million for
2020 consists of $18.1 million of additional variable consideration received on our incentive and profit-sharing contingent commissions, offset
by $7.1 million of revised estimates related to variable consideration on policies where the exposure units were expected to be impacted by the
COVID-19 pandemic (“COVID-19”) and $2.1 million of other adjustments.
Other Assets and Deferred CostIncremental cost to obtain – The Company defers certain costs to obtain customer contracts primarily as they relate to commission-
based compensation plans in the Retail Segment, in which the Company pays an incremental amount of compensation on new
business. These incremental costs are deferred and amortized over a 15-year period. The cost to obtain balance within the Other
assets caption in the Company’s Consolidated Balance Sheets was $58.2 million and $42.2 million as of December 31, 2021 and
December 31, 2020, respectively. For the 12 months ended December 31, 2021 and December 31, 2020, the Company deferred $19.8
million and $17.8 million of incremental cost to obtain customer contracts, respectively. The Company expensed $3.8 million and $2.5
million of the incremental cost to obtain customer contracts for the 12 months ended December 31, 2021 and December 31, 2020,
respectively.
Cost to fulfill - The Company defers certain costs to fulfill contracts and recognizes these costs as the associated performance
obligations are fulfilled. The cost to fulfill balance within the Other current assets caption in the Company’s Consolidated Balance Sheets
was $89.3 million, which is inclusive of deferrals from businesses acquired in the current year of $9.9 million. The cost to fulfill balance as
of December 31, 2020 was $77.8 million. For the 12 months ended December 31, 2021 and 2020, the Company had net deferrals of $1.6
million and $3.3 million related to current year deferrals for costs incurred that relate to performance obligations yet to be fulfilled, net of
the expense of previously deferred contract fulfillment costs associated with performance obligations that were satisfied in the period,
respectively.
NOTE 3. Business CombinationsDuring the year ended December 31, 2021, the Company acquired the assets and assumed certain liabilities of 13 insurance
intermediaries, all of the share capital of 1 insurance intermediary, all the stock of 2 insurance intermediaries, and 3 books of businesses
(customer accounts). Additionally, miscellaneous adjustments were recorded to the purchase price allocation of certain prior acquisitions
completed within the last 12 months as permitted by ASC Topic 805 - Business Combinations (“ASC 805”). Such adjustments are
presented in the “Other” category within the following two tables. The recorded purchase price for all acquisitions includes an estimation
of the fair value of liabilities associated with any potential earn-out provisions. Subsequent changes in the fair value of earn-out obligations
will be recorded in the Consolidated Statement of Income when incurred.
46
The fair value of earn-out obligations is based upon the present value of the expected future payments to be made to the sellers of the
acquired businesses in accordance with the provisions outlined in the respective purchase agreements. In determining fair value, the
acquired business’s future performance is estimated using financial projections developed by management for the acquired business
and reflects market participant assumptions regarding revenue growth and/or profitability. The expected future payments are estimated
on the basis of the earn-out formula and performance targets specified in each purchase agreement compared to the associated
financial projections. These payments are then discounted to present value using a risk-adjusted rate that takes into consideration the
likelihood that the forecast earn-out payments will be made.
Based upon the acquisition date and the complexity of the underlying valuation work, certain amounts included in the Company’s
Consolidated Financial Statements may be provisional and thus subject to further adjustments within the permitted measurement period, as
defined in ASC 805. For the year ended December 31, 2021, adjustments were made within the permitted measurement period that resulted
in a decrease in the aggregate purchase price of the affected acquisitions of $0.5 million relating to the assumption of certain liabilities on
acquisitions completed in 2020. These measurement period adjustments have been reflected as current period adjustments for the year
ended December 31, 2021. The measurement period adjustments impacted goodwill, with no effect on earnings or cash in the current period.
Gross cash paid for acquisitions was $424.6 million and $722.5 million in the years ended December 31, 2021 and 2020, respectively.
We completed 19 acquisitions (including book of business purchases) during the year ended December 31, 2021. We completed
25 acquisitions (including book of business purchases) during the year ended December 31, 2020. The following table summarizes the
purchase price allocations made as of the date of each acquisition for current year acquisitions and adjustments made during the
measurement period for prior year acquisitions. During the measurement periods, the Company will adjust assets or liabilities if new information
is obtained about facts and circumstances that existed as of the acquisition date that, if known, would have resulted in the recognition of those
assets and liabilities as of that date. These adjustments are made in the period in which the amounts are determined and the current period
income effect of such adjustments will be calculated as if the adjustments had been completed as of the acquisition date.
(IN THOUSANDS)
NAMEBUSINESSSEGMENT
EFFECTIVEDATE OF
ACQUISITIONCASHPAID
COMMONSTOCK
ISSUEDOTHER
PAYABLE
RECORDEDEARN-OUT
PAYABLE
NET ASSETS
ACQUIRED
MAXIMUMPOTENTIALEARN-OUT
PAYABLE
O'Leary Insurances (O'Leary) RetailJanuary 1,
2021 $117,408 $4,892 $— $15,348 $137,648 $30,575
Piper Jordan LLC (Piper) RetailMay 1, 2021 43,428 — 1,397 9,854 54,679 15,000
Berkshire Insurance Group, Inc. (Berkshire) Retail
September 1, 2021 41,500 — — — 41,500 —
AGIS Network, Inc. (AGIS)(1) RetailSeptember
1, 2021 11,203 — 24,114 739 36,056 12,289
Winston Financial Services, Inc. (Winston) Retail
October 1, 2021 79,461 5,000 7,724 16,427 108,612 29,000
Remedy Analytics, Inc. (Remedy) RetailOctober 1,
2021 40,762 — 473 7,364 48,599 25,000
Heacock Insurance Group, LLC (Heacock) Retail
October 1, 2021 18,248 — 455 1,900 20,603 6,000
Corporate Insurance Advisors, L.L.C. (CIA) Retail
December 1, 2021 15,314 — 181 6,542 22,037 14,000
Rainmaker Advisory, LLC (Rainmaker) RetailDecember
1, 2021 14,174 — 776 5,937 20,887 10,000
HARCO Insurance Services, Inc. (HARCO) Retail
December 31, 2021 24,266 — 1,000 4,423 29,689 7,350
Other Various Various 18,849 — 3,066 7,227 29,142 13,118
Total $424,613 $9,892 $39,186 $75,761 $549,452 $162,332
(1) Amount in the “other payable” column relates to additional contingent consideration expected to be paid within 12 months.
47
20
21
AN
NU
AL
RE
PO
RT
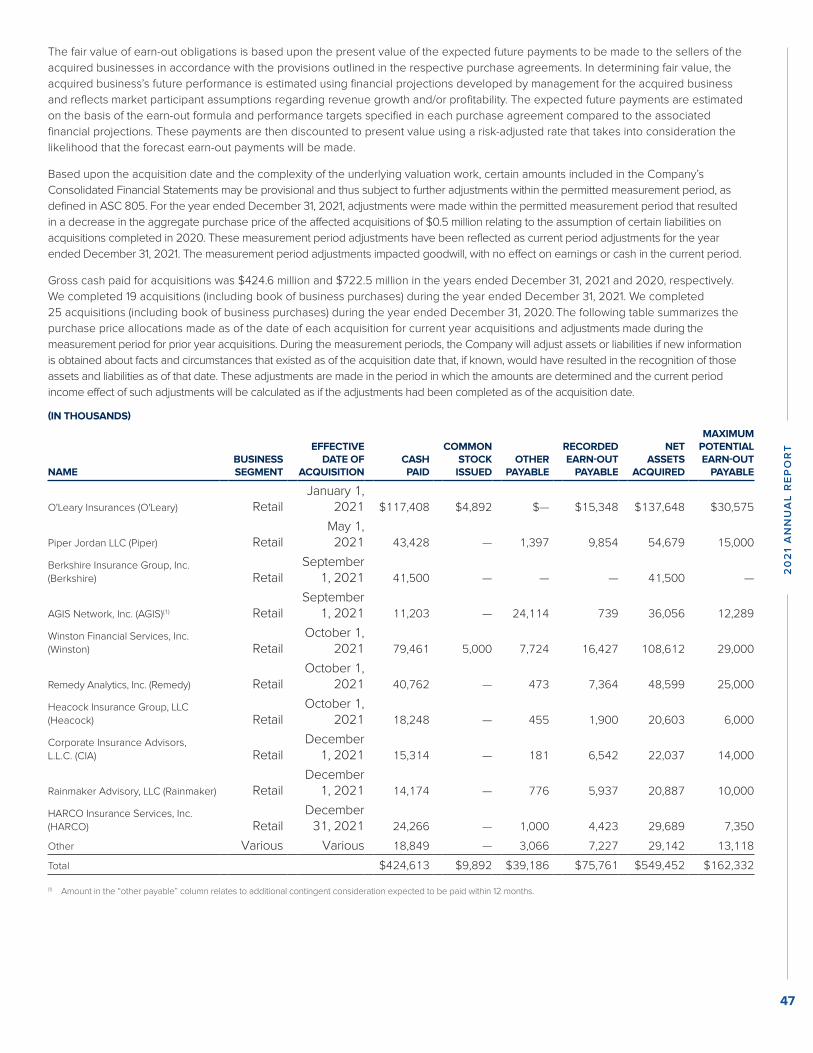
Contract Assets and LiabilitiesThe balances of contract assets and contract liabilities arising from contracts with customers as of December 31, 2021 and 2020 were
as follows:
(IN THOUSANDS) DECEMBER 31, 2021 DECEMBER 31, 2020
Contract assets $ 361,834 $ 308,755
Contract liabilities $97,933 $80,997
Unbilled receivables (contract assets) arise when the Company recognizes revenue for amounts which have not yet been billed in our
systems. Deferred revenue (contract liabilities) relates to payments received in advance of performance under the contract before the
transfer of a good or service to the customer.
As of December 31, 2021, deferred revenue (recorded within the accrued expenses and other liabilities caption in the Company’s Consolidated
Balance Sheets) consisted of $67.4 million as current portion to be recognized within one year and $30.5 million in long-term (recorded within the
other liabilities caption in the Company’s Consolidated Balance Sheets) to be recognized beyond one year. As of December 31, 2020, deferred
revenue consisted of $54.0 million as current portion to be recognized within one year and $27.0 million in long-term deferred revenue to be
recognized beyond one year.
Contract assets and contract liabilities arising from acquisitions in 2021 were approximately $5.5 million and $1.2 million, respectively. Contract
assets and contract liabilities arising from acquisitions in 2020 were approximately $11.5 million and $20.0 million, respectively.
During the 12 months ended December 31, 2021 and 2020, the amount of revenue recognized related to performance obligations satisfied in
a previous period, inclusive of changes due to estimates, was approximately $23.3 million and $8.9 million, respectively. The $23.3 million for
2021 consists of additional variable consideration received on our incentive and profit-sharing contingent commissions. The $8.9 million for
2020 consists of $18.1 million of additional variable consideration received on our incentive and profit-sharing contingent commissions, offset
by $7.1 million of revised estimates related to variable consideration on policies where the exposure units were expected to be impacted by the
COVID-19 pandemic (“COVID-19”) and $2.1 million of other adjustments.
Other Assets and Deferred CostIncremental cost to obtain – The Company defers certain costs to obtain customer contracts primarily as they relate to commission-
based compensation plans in the Retail Segment, in which the Company pays an incremental amount of compensation on new
business. These incremental costs are deferred and amortized over a 15-year period. The cost to obtain balance within the Other
assets caption in the Company’s Consolidated Balance Sheets was $58.2 million and $42.2 million as of December 31, 2021 and
December 31, 2020, respectively. For the 12 months ended December 31, 2021 and December 31, 2020, the Company deferred $19.8
million and $17.8 million of incremental cost to obtain customer contracts, respectively. The Company expensed $3.8 million and $2.5
million of the incremental cost to obtain customer contracts for the 12 months ended December 31, 2021 and December 31, 2020,
respectively.
Cost to fulfill - The Company defers certain costs to fulfill contracts and recognizes these costs as the associated performance
obligations are fulfilled. The cost to fulfill balance within the Other current assets caption in the Company’s Consolidated Balance Sheets
was $89.3 million, which is inclusive of deferrals from businesses acquired in the current year of $9.9 million. The cost to fulfill balance as
of December 31, 2020 was $77.8 million. For the 12 months ended December 31, 2021 and 2020, the Company had net deferrals of $1.6
million and $3.3 million related to current year deferrals for costs incurred that relate to performance obligations yet to be fulfilled, net of
the expense of previously deferred contract fulfillment costs associated with performance obligations that were satisfied in the period,
respectively.
NOTE 3. Business CombinationsDuring the year ended December 31, 2021, the Company acquired the assets and assumed certain liabilities of 13 insurance
intermediaries, all of the share capital of 1 insurance intermediary, all the stock of 2 insurance intermediaries, and 3 books of businesses
(customer accounts). Additionally, miscellaneous adjustments were recorded to the purchase price allocation of certain prior acquisitions
completed within the last 12 months as permitted by ASC Topic 805 - Business Combinations (“ASC 805”). Such adjustments are
presented in the “Other” category within the following two tables. The recorded purchase price for all acquisitions includes an estimation
of the fair value of liabilities associated with any potential earn-out provisions. Subsequent changes in the fair value of earn-out obligations
will be recorded in the Consolidated Statement of Income when incurred.
46
The fair value of earn-out obligations is based upon the present value of the expected future payments to be made to the sellers of the
acquired businesses in accordance with the provisions outlined in the respective purchase agreements. In determining fair value, the
acquired business’s future performance is estimated using financial projections developed by management for the acquired business
and reflects market participant assumptions regarding revenue growth and/or profitability. The expected future payments are estimated
on the basis of the earn-out formula and performance targets specified in each purchase agreement compared to the associated
financial projections. These payments are then discounted to present value using a risk-adjusted rate that takes into consideration the
likelihood that the forecast earn-out payments will be made.
Based upon the acquisition date and the complexity of the underlying valuation work, certain amounts included in the Company’s
Consolidated Financial Statements may be provisional and thus subject to further adjustments within the permitted measurement period, as
defined in ASC 805. For the year ended December 31, 2021, adjustments were made within the permitted measurement period that resulted
in a decrease in the aggregate purchase price of the affected acquisitions of $0.5 million relating to the assumption of certain liabilities on
acquisitions completed in 2020. These measurement period adjustments have been reflected as current period adjustments for the year
ended December 31, 2021. The measurement period adjustments impacted goodwill, with no effect on earnings or cash in the current period.
Gross cash paid for acquisitions was $424.6 million and $722.5 million in the years ended December 31, 2021 and 2020, respectively.
We completed 19 acquisitions (including book of business purchases) during the year ended December 31, 2021. We completed
25 acquisitions (including book of business purchases) during the year ended December 31, 2020. The following table summarizes the
purchase price allocations made as of the date of each acquisition for current year acquisitions and adjustments made during the
measurement period for prior year acquisitions. During the measurement periods, the Company will adjust assets or liabilities if new information
is obtained about facts and circumstances that existed as of the acquisition date that, if known, would have resulted in the recognition of those
assets and liabilities as of that date. These adjustments are made in the period in which the amounts are determined and the current period
income effect of such adjustments will be calculated as if the adjustments had been completed as of the acquisition date.
(IN THOUSANDS)
NAMEBUSINESSSEGMENT
EFFECTIVEDATE OF
ACQUISITIONCASHPAID
COMMONSTOCK
ISSUEDOTHER
PAYABLE
RECORDEDEARN-OUT
PAYABLE
NET ASSETS
ACQUIRED
MAXIMUMPOTENTIALEARN-OUT
PAYABLE
O'Leary Insurances (O'Leary) RetailJanuary 1,
2021 $117,408 $4,892 $— $15,348 $137,648 $30,575
Piper Jordan LLC (Piper) RetailMay 1, 2021 43,428 — 1,397 9,854 54,679 15,000
Berkshire Insurance Group, Inc. (Berkshire) Retail
September 1, 2021 41,500 — — — 41,500 —
AGIS Network, Inc. (AGIS)(1) RetailSeptember
1, 2021 11,203 — 24,114 739 36,056 12,289
Winston Financial Services, Inc. (Winston) Retail
October 1, 2021 79,461 5,000 7,724 16,427 108,612 29,000
Remedy Analytics, Inc. (Remedy) RetailOctober 1,
2021 40,762 — 473 7,364 48,599 25,000
Heacock Insurance Group, LLC (Heacock) Retail
October 1, 2021 18,248 — 455 1,900 20,603 6,000
Corporate Insurance Advisors, L.L.C. (CIA) Retail
December 1, 2021 15,314 — 181 6,542 22,037 14,000
Rainmaker Advisory, LLC (Rainmaker) RetailDecember
1, 2021 14,174 — 776 5,937 20,887 10,000
HARCO Insurance Services, Inc. (HARCO) Retail
December 31, 2021 24,266 — 1,000 4,423 29,689 7,350
Other Various Various 18,849 — 3,066 7,227 29,142 13,118
Total $424,613 $9,892 $39,186 $75,761 $549,452 $162,332
(1) Amount in the “other payable” column relates to additional contingent consideration expected to be paid within 12 months.
47
20
21
AN
NU
AL
RE
PO
RT
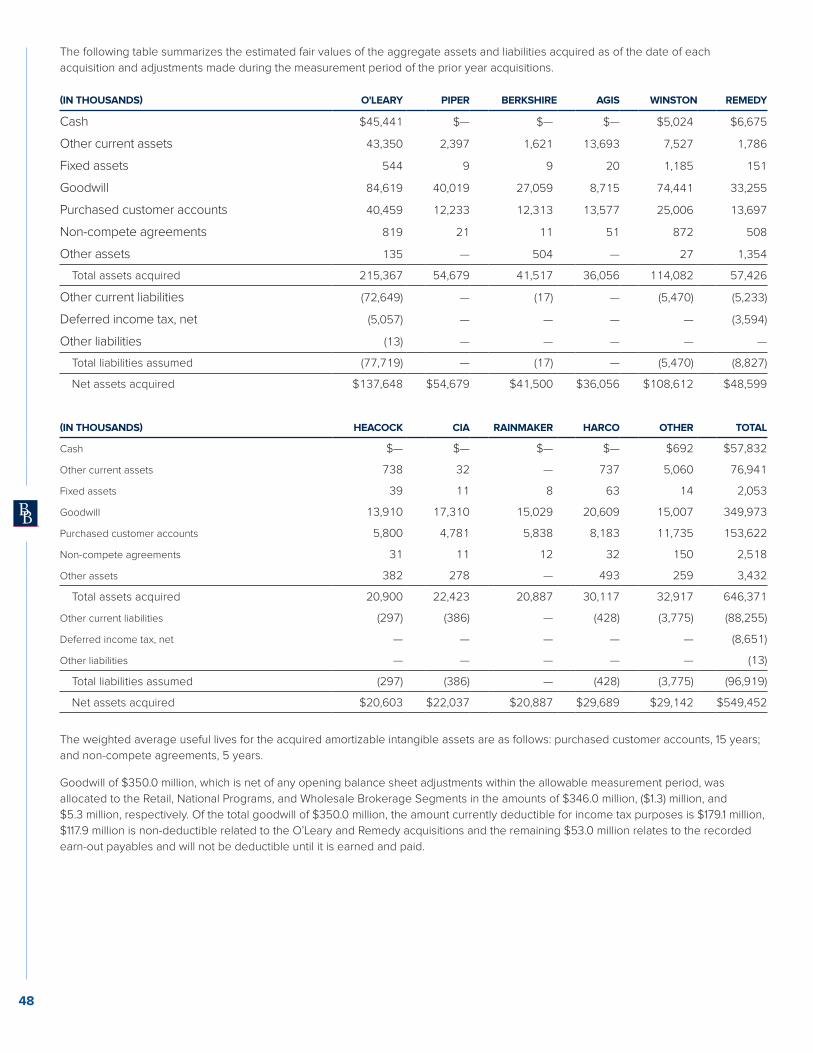
The following table summarizes the estimated fair values of the aggregate assets and liabilities acquired as of the date of each
acquisition and adjustments made during the measurement period of the prior year acquisitions.
(IN THOUSANDS) O'LEARY PIPER BERKSHIRE AGIS WINSTON REMEDY
Cash $45,441 $— $— $— $5,024 $6,675
Other current assets 43,350 2,397 1,621 13,693 7,527 1,786
Fixed assets 544 9 9 20 1,185 151
Goodwill 84,619 40,019 27,059 8,715 74,441 33,255
Purchased customer accounts 40,459 12,233 12,313 13,577 25,006 13,697
Non-compete agreements 819 21 11 51 872 508
Other assets 135 — 504 — 27 1,354
Total assets acquired 215,367 54,679 41,517 36,056 114,082 57,426
Other current liabilities (72,649) — (17) — (5,470) (5,233)
Deferred income tax, net (5,057) — — — — (3,594)
Other liabilities (13) — — — — —
Total liabilities assumed (77,719) — (17) — (5,470) (8,827)
Net assets acquired $137,648 $54,679 $41,500 $36,056 $108,612 $48,599
(IN THOUSANDS) HEACOCK CIA RAINMAKER HARCO OTHER TOTAL
Cash $— $— $— $— $692 $57,832
Other current assets 738 32 — 737 5,060 76,941
Fixed assets 39 11 8 63 14 2,053
Goodwill 13,910 17,310 15,029 20,609 15,007 349,973
Purchased customer accounts 5,800 4,781 5,838 8,183 11,735 153,622
Non-compete agreements 31 11 12 32 150 2,518
Other assets 382 278 — 493 259 3,432
Total assets acquired 20,900 22,423 20,887 30,117 32,917 646,371
Other current liabilities (297) (386) — (428) (3,775) (88,255)
Deferred income tax, net — — — — — (8,651)
Other liabilities — — — — — (13)
Total liabilities assumed (297) (386) — (428) (3,775) (96,919)
Net assets acquired $20,603 $22,037 $20,887 $29,689 $29,142 $549,452
The weighted average useful lives for the acquired amortizable intangible assets are as follows: purchased customer accounts, 15 years;
and non-compete agreements, 5 years.
Goodwill of $350.0 million, which is net of any opening balance sheet adjustments within the allowable measurement period, was
allocated to the Retail, National Programs, and Wholesale Brokerage Segments in the amounts of $346.0 million, ($1.3) million, and
$5.3 million, respectively. Of the total goodwill of $350.0 million, the amount currently deductible for income tax purposes is $179.1 million,
$117.9 million is non-deductible related to the O’Leary and Remedy acquisitions and the remaining $53.0 million relates to the recorded
earn-out payables and will not be deductible until it is earned and paid.
48
For the acquisitions completed during 2021, the results of operations since the acquisition dates have been combined with those of the
Company. The total revenues from the acquisitions completed through December 31, 2021 included in the Consolidated Statement of
Income for the year ended December 31, 2021 were $63.8 million. The income before income taxes, including the intercompany cost of
capital charge, from the acquisitions completed through December 31, 2021 included in the Consolidated Statement of Income for the
year ended December 31, 2021 was a loss of $10.6 million. If the acquisitions had occurred as of the beginning of the respective periods,
the Company’s results of operations would be as shown in the following table. These unaudited pro forma results are not necessarily
indicative of the actual results of operations that would have occurred had the acquisitions actually been made at the beginning of the
respective periods.
(UNAUDITED) YEAR ENDED DECEMBER 31,
(IN THOUSANDS, EXCEPT PER SHARE DATA) 2021 2020
Total revenues $3,128,530 $2,751,167
Income before income taxes $779,533 $653,270
Net income $599,964 $502,942
Net income per share:
Basic $2.13 $1.78
Diluted $2.12 $1.77
Weighted average number of shares outstanding:
Basic 276,024 274,334
Diluted 277,414 275,867
Acquisitions in 2020During the year ended December 31, 2020, the Company acquired the assets and assumed certain liabilities of 20 insurance
intermediaries, all the stock of 1 F&I administrative services company and 4 book of business (customer accounts). Additionally,
miscellaneous adjustments were recorded to the purchase price allocation of certain prior acquisitions completed within the last 12
months as permitted by ASC 805. Such adjustments are presented in the “Other” category within the following two tables.
For the year ended December 31, 2020, several adjustments were made within the permitted measurement period that resulted in an
increase in the aggregate purchase price of the affected acquisitions of $3.5 million, relating to the assumption of certain liabilities.
49
20
21
AN
NU
AL
RE
PO
RT
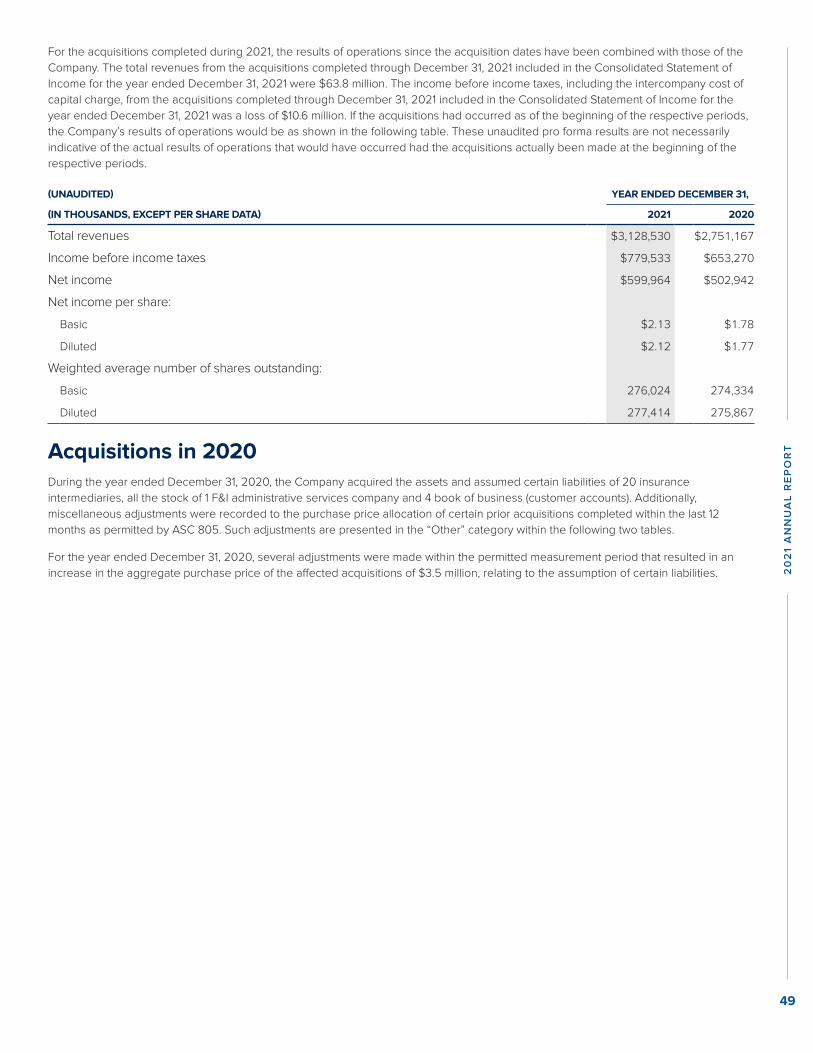
The following table summarizes the estimated fair values of the aggregate assets and liabilities acquired as of the date of each
acquisition and adjustments made during the measurement period of the prior year acquisitions.
(IN THOUSANDS) O'LEARY PIPER BERKSHIRE AGIS WINSTON REMEDY
Cash $45,441 $— $— $— $5,024 $6,675
Other current assets 43,350 2,397 1,621 13,693 7,527 1,786
Fixed assets 544 9 9 20 1,185 151
Goodwill 84,619 40,019 27,059 8,715 74,441 33,255
Purchased customer accounts 40,459 12,233 12,313 13,577 25,006 13,697
Non-compete agreements 819 21 11 51 872 508
Other assets 135 — 504 — 27 1,354
Total assets acquired 215,367 54,679 41,517 36,056 114,082 57,426
Other current liabilities (72,649) — (17) — (5,470) (5,233)
Deferred income tax, net (5,057) — — — — (3,594)
Other liabilities (13) — — — — —
Total liabilities assumed (77,719) — (17) — (5,470) (8,827)
Net assets acquired $137,648 $54,679 $41,500 $36,056 $108,612 $48,599
(IN THOUSANDS) HEACOCK CIA RAINMAKER HARCO OTHER TOTAL
Cash $— $— $— $— $692 $57,832
Other current assets 738 32 — 737 5,060 76,941
Fixed assets 39 11 8 63 14 2,053
Goodwill 13,910 17,310 15,029 20,609 15,007 349,973
Purchased customer accounts 5,800 4,781 5,838 8,183 11,735 153,622
Non-compete agreements 31 11 12 32 150 2,518
Other assets 382 278 — 493 259 3,432
Total assets acquired 20,900 22,423 20,887 30,117 32,917 646,371
Other current liabilities (297) (386) — (428) (3,775) (88,255)
Deferred income tax, net — — — — — (8,651)
Other liabilities — — — — — (13)
Total liabilities assumed (297) (386) — (428) (3,775) (96,919)
Net assets acquired $20,603 $22,037 $20,887 $29,689 $29,142 $549,452
The weighted average useful lives for the acquired amortizable intangible assets are as follows: purchased customer accounts, 15 years;
and non-compete agreements, 5 years.
Goodwill of $350.0 million, which is net of any opening balance sheet adjustments within the allowable measurement period, was
allocated to the Retail, National Programs, and Wholesale Brokerage Segments in the amounts of $346.0 million, ($1.3) million, and
$5.3 million, respectively. Of the total goodwill of $350.0 million, the amount currently deductible for income tax purposes is $179.1 million,
$117.9 million is non-deductible related to the O’Leary and Remedy acquisitions and the remaining $53.0 million relates to the recorded
earn-out payables and will not be deductible until it is earned and paid.
48
For the acquisitions completed during 2021, the results of operations since the acquisition dates have been combined with those of the
Company. The total revenues from the acquisitions completed through December 31, 2021 included in the Consolidated Statement of
Income for the year ended December 31, 2021 were $63.8 million. The income before income taxes, including the intercompany cost of
capital charge, from the acquisitions completed through December 31, 2021 included in the Consolidated Statement of Income for the
year ended December 31, 2021 was a loss of $10.6 million. If the acquisitions had occurred as of the beginning of the respective periods,
the Company’s results of operations would be as shown in the following table. These unaudited pro forma results are not necessarily
indicative of the actual results of operations that would have occurred had the acquisitions actually been made at the beginning of the
respective periods.
(UNAUDITED) YEAR ENDED DECEMBER 31,
(IN THOUSANDS, EXCEPT PER SHARE DATA) 2021 2020
Total revenues $3,128,530 $2,751,167
Income before income taxes $779,533 $653,270
Net income $599,964 $502,942
Net income per share:
Basic $2.13 $1.78
Diluted $2.12 $1.77
Weighted average number of shares outstanding:
Basic 276,024 274,334
Diluted 277,414 275,867
Acquisitions in 2020During the year ended December 31, 2020, the Company acquired the assets and assumed certain liabilities of 20 insurance
intermediaries, all the stock of 1 F&I administrative services company and 4 book of business (customer accounts). Additionally,
miscellaneous adjustments were recorded to the purchase price allocation of certain prior acquisitions completed within the last 12
months as permitted by ASC 805. Such adjustments are presented in the “Other” category within the following two tables.
For the year ended December 31, 2020, several adjustments were made within the permitted measurement period that resulted in an
increase in the aggregate purchase price of the affected acquisitions of $3.5 million, relating to the assumption of certain liabilities.
49
20
21
AN
NU
AL
RE
PO
RT
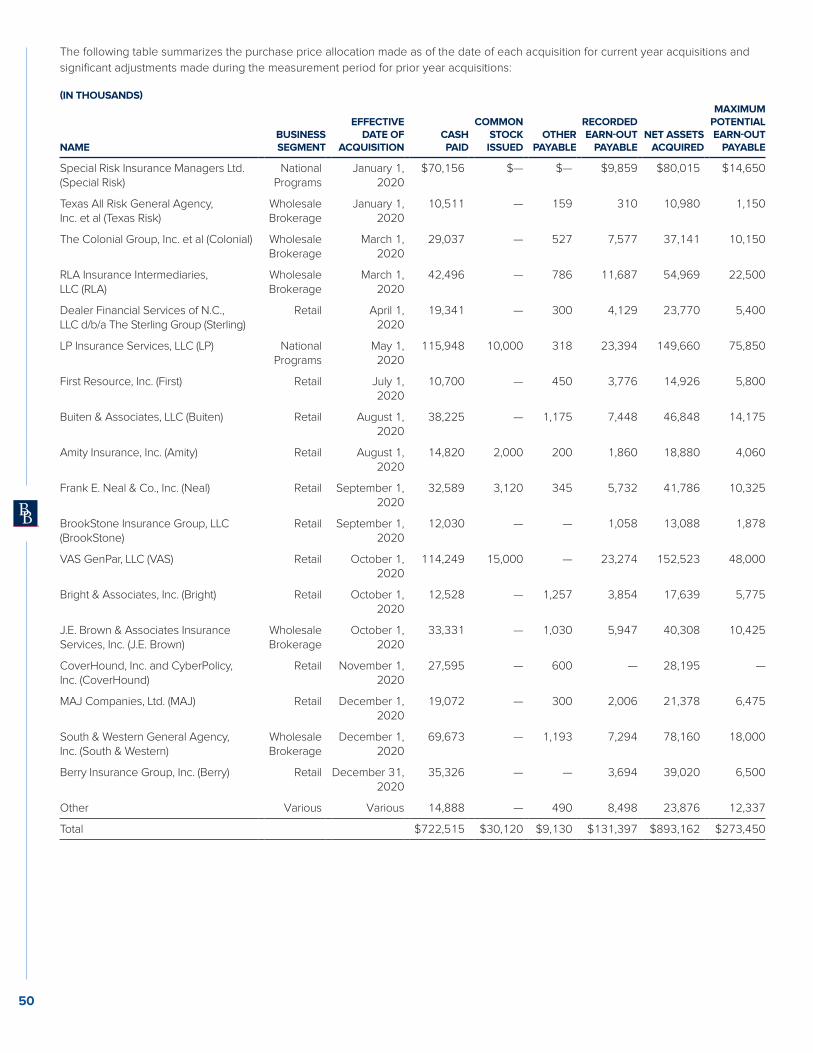
The following table summarizes the purchase price allocation made as of the date of each acquisition for current year acquisitions and
significant adjustments made during the measurement period for prior year acquisitions:
(IN THOUSANDS)
NAMEBUSINESSSEGMENT
EFFECTIVEDATE OF
ACQUISITIONCASHPAID
COMMONSTOCK
ISSUEDOTHER
PAYABLE
RECORDEDEARN-OUT
PAYABLENET ASSETS
ACQUIRED
MAXIMUMPOTENTIALEARN-OUT
PAYABLE
Special Risk Insurance Managers Ltd. (Special Risk)
National Programs
January 1, 2020
$70,156 $— $— $9,859 $80,015 $14,650
Texas All Risk General Agency, Inc. et al (Texas Risk)
Wholesale Brokerage
January 1, 2020
10,511 — 159 310 10,980 1,150
The Colonial Group, Inc. et al (Colonial) Wholesale Brokerage
March 1, 2020
29,037 — 527 7,577 37,141 10,150
RLA Insurance Intermediaries, LLC (RLA)
Wholesale Brokerage
March 1, 2020
42,496 — 786 11,687 54,969 22,500
Dealer Financial Services of N.C., LLC d/b/a The Sterling Group (Sterling)
Retail April 1, 2020
19,341 — 300 4,129 23,770 5,400
LP Insurance Services, LLC (LP) National Programs
May 1, 2020
115,948 10,000 318 23,394 149,660 75,850
First Resource, Inc. (First) Retail July 1, 2020
10,700 — 450 3,776 14,926 5,800
Buiten & Associates, LLC (Buiten) Retail August 1, 2020
38,225 — 1,175 7,448 46,848 14,175
Amity Insurance, Inc. (Amity) Retail August 1, 2020
14,820 2,000 200 1,860 18,880 4,060
Frank E. Neal & Co., Inc. (Neal) Retail September 1, 2020
32,589 3,120 345 5,732 41,786 10,325
BrookStone Insurance Group, LLC (BrookStone)
Retail September 1, 2020
12,030 — — 1,058 13,088 1,878
VAS GenPar, LLC (VAS) Retail October 1, 2020
114,249 15,000 — 23,274 152,523 48,000
Bright & Associates, Inc. (Bright) Retail October 1, 2020
12,528 — 1,257 3,854 17,639 5,775
J.E. Brown & Associates Insurance Services, Inc. (J.E. Brown)
Wholesale Brokerage
October 1, 2020
33,331 — 1,030 5,947 40,308 10,425
CoverHound, Inc. and CyberPolicy, Inc. (CoverHound)
Retail November 1, 2020
27,595 — 600 — 28,195 —
MAJ Companies, Ltd. (MAJ) Retail December 1, 2020
19,072 — 300 2,006 21,378 6,475
South & Western General Agency, Inc. (South & Western)
Wholesale Brokerage
December 1, 2020
69,673 — 1,193 7,294 78,160 18,000
Berry Insurance Group, Inc. (Berry) Retail December 31, 2020
35,326 — — 3,694 39,020 6,500
Other Various Various 14,888 — 490 8,498 23,876 12,337
Total $722,515 $30,120 $9,130 $131,397 $893,162 $273,450
50
The following table summarizes the estimated fair values of the aggregate assets and liabilities acquired as of the date of each
acquisition and adjustments made during the measurement period of the prior year acquisitions.
(IN THOUSANDS)SPECIAL
RISK TEXAS RISK COLONIAL RLA STERLING LP FIRST BUITEN AMITY NEAL
Cash $— $— $— $— $— $— $— $— $— $—
Other current assets 2,477 446 1,344 — 612 3,162 302 2,595 653 2,337
Fixed assets 345 27 59 55 16 1,877 1 43 58 46
Goodwill 63,087 8,940 27,845 53,567 17,339 99,983 9,523 33,641 15,454 28,929
Purchased customer accounts 14,286 3,222 9,205 12,309 5,962 44,801 5,095 11,323 5,614 13,225
Non-compete agreements 136 25 43 481 21 31 21 91 21 31
Other assets — — — — — — — — — 274
Total assets acquired 80,331 12,660 38,496 66,412 23,950 149,854 14,942 47,693 21,800 44,842
Other current liabilities (316) (1,680) (1,355) (11,443) (180) (10) (16) (845) (2,920) (3,056)
Other liabilities — — — — — (184) — — — —
Total liabilities assumed (316) (1,680) (1,355) (11,443) (180) (194) (16) (845) (2,920) (3,056)
Net assets acquired $80,015 $10,980 $37,141 $54,969 $23,770 149,660 $14,926 $46,848 $18,880 $41,786
(IN THOUSANDS)BROOK STONE VAS BRIGHT
J.E. BROWN
COVER HOUND MAJ
SOUTH & WESTERN BERRY OTHER TOTAL
Cash $— $27,673 $— $— $— $— —$ —$ $— $27,673
Other current assets 527 5,486 402 — 375 413 — — 912 22,043
Fixed assets 22 138 23 32 6,441 — 149 30 25 9,387
Goodwill 8,585 100,826 12,218 31,476 19,524 13,003 63,128 29,702 11,325 648,095
Purchased customer accounts 3,689 48,188 5,055 9,479 3,678 8,034 18,513 9,701 8,582 239,961
Non-compete agreements 21 101 42 41 — 11 21 11 64 1,213
Other assets 290 — — — — — — — 3,088 3,652
Total assets acquired 13,134 182,412 17,740 41,028 30,018 21,461 81,811 39,444 23,996 952,024
Other current liabilities (46) (3,760) (101) (720 ) (1,823) (83) (3,651) (424) (120) (32,549)
Other liabilities — (26,129) — — — — — — (26,313)
Total liabilities assumed (46) (29,889) (101) (720 ) (1,823) (83) (3,651) (424) (120) (58,862)
Net assets acquired $13,088 $152,523 $17,639 $40,308 $28,195 $21,378 $78,160 $39,020 $23,876 $893,162
The weighted average useful lives for the acquired amortizable intangible assets are as follows: purchased customer accounts, 15 years;
and non-compete agreements, 5 years.
Goodwill of $648.1 million, which is net of any opening balance sheet adjustments within the allowable measurement period, was
allocated to the Retail, National Programs, Wholesale Brokerage and Services Segments in the amounts of $300.0 million, $163.1 million,
$185.0 million and $0.1 million, respectively. Of the total goodwill of $648.1 million, the amount currently deductible for income tax
purposes is $516.7 million and the remaining $131.4 million relates to the recorded earn-out payables and will not be deductible until it is
earned and paid.
For the acquisitions completed during 2020, the results of operations since the acquisition dates have been combined with those of
the Company. The total revenues from the acquisitions completed through December 31, 2020 included in the Consolidated Statement
of Income for the year ended December 31, 2020 were $93.9 million. The income before income taxes, including the intercompany
cost of capital charge, from the acquisitions completed through December 31, 2020 included in the Consolidated Statement of Income
for the year ended December 31, 2020 was $7.5 million. If the acquisitions had occurred as of the beginning of the respective periods,
the Company’s results of operations would be as shown in the following table. These unaudited pro forma results are not necessarily
indicative of the actual results of operations that would have occurred had the acquisitions actually been made at the beginning of the
respective periods.51
20
21
AN
NU
AL
RE
PO
RT

(UNAUDITED) YEAR ENDED DECEMBER 31,
(IN THOUSANDS, EXCEPT PER SHARE DATA) 2020 2019
Total revenues $2,714,314 $2,579,075
Income before income taxes $650,618 $576,355
Net income $500,900 $436,722
Net income per share:
Basic $1.77 $1.55
Diluted $1.76 $1.54
Weighted average number of shares outstanding:
Basic 274,334 272,471
Diluted 275,867 274,616
Acquisitions in 2019During the year ended December 31, 2019, the Company acquired the assets and assumed certain liabilities of 22 insurance
intermediaries, all the stock of 1 insurance intermediary and 4 book of business (customer accounts). Additionally, miscellaneous
adjustments were recorded to the purchase price allocation of certain prior acquisitions completed within the last 12 months as permitted
by ASC 805. Such adjustments are presented in the “Other” category within the following two tables.
For the year ended December 31, 2019, several adjustments were made within the permitted measurement period that resulted in a
decrease in the aggregate purchase price of the affected acquisitions of $4.1 million, relating to the assumption of certain liabilities.
The following table summarizes the purchase price allocation made as of the date of each acquisition for current year acquisitions and
significant adjustments made during the measurement period for prior year acquisitions:
(IN THOUSANDS)
NAMEBUSINESS SEGMENT
EFFECTIVE DATE OF
ACQUISITIONCASH PAID
COMMON STOCK
ISSUEDOTHER
PAYABLE
RECORDED EARN-OUT
PAYABLE
NET ASSETS
ACQUIRED
MAXIMUM POTENTIAL EARN-OUT
PAYABLE
Smith Insurance Associates, Inc. (Smith)
Retail February 1, 2019
$20,129 $— $0 $2,704 $22,833 $4,550
Donald P. Pipino Company, LTD (Pipino)
Retail February 1, 2019
16,420 — 135 9,821 26,376 12,996
AGA Enterprises, LLC d/b/a Cossio Insurance Agency (Cossio)
Retail March 1, 2019
13,990 — 10 696 14,696 2,000
Medval, LLC (Medval) Services March 1, 2019
29,106 — 100 1,684 30,890 2,500
United Development Systems, Inc. (United)
Retail May 1, 2019 18,987 — 388 3,268 22,643 8,625
Twinbrook Insurance Brokerage, Inc. (Twinbrook)
Retail June 1, 2019 26,251 — 400 1,565 28,216 5,073
Innovative Risk Solutions, Inc. (IRS) Retail July 1, 2019 26,435 — 2,465 6,109 35,009 9,000
WBR Insurance Agency, LLC et al (WBR)
Retail August 1, 2019
10,667 — 203 2,197 13,067 4,575
West Ridge Insurance Agency, Inc. d/b/a Yozell Associates (Yozell)
Retail August 1, 2019
13,030 — 470 768 14,268 6,730
CKP Insurance, LLC (CKP) Retail August 1, 2019
89,190 20,000 4,000 38,093 151,283 76,500
Poole Professional Ltd. Insurance Agents and Brokers et al (Poole)
Retail October 1, 2019
32,358 — 75 4,556 36,989 6,850
VerHagen Glendenning & Walker LLP (VGW)
Retail October 1, 2019
23,032 — 1,498 2,385 26,915 8,170
Other Various Various 36,665 — 2,391 9,026 48,082 14,454
Total $356,260 $20,000 $12,135 $82,872 $471,267 $162,02352
The following table summarizes the estimated fair values of the aggregate assets and liabilities acquired as of the date of each acquisition.
(IN THOUSANDS) SMITH PIPINO COSSIO MEDVAL UNITED TWINBROOK IRS WBR YOZELL CKP
Cash $— $— $— $3,217 $— $— $— $— $— $—
Other current assets 680 819 236 1,708 477 919 1,375 449 1,781 9,170
Fixed assets 39 112 29 50 20 85 11 10 12 193
Goodwill 16,042 16,765 10,010 19,108 15,111 18,935 24,938 9,096 8,904 110,495
Purchased customer accounts 6,500 11,360 4,403 7,300 7,065 8,557 8,800 4,022 3,550 32,274
Non-compete agreements 41 11 21 1 11 12 11 34 21 21
Other assets — 772 — 15 — — — — — —
Total assets acquired 23,302 29,839 14,699 31,399 22,684 28,508 35,135 13,611 14,268 152,153
Other current liabilities (469) (3,463 ) (3) (480) (41) (292) (126) (166) — (870)
Deferred income tax, net — — — (29) — — — (378) — —
Total liabilities assumed (469) (3,463 ) (3) (509) (41) (292) (126) (544) — (870)
Net assets acquired $22,833 $26,376 $14,696 $30,890 $22,643 $28,216 $35,009 $13,067 $14,268 $151,283
(IN THOUSANDS) POOLE VGW OTHER TOTAL
Cash $— $— $— $3,217
Other current assets 938 1,190 (6,786) 12,956
Fixed assets 4 20 (130) 455
Goodwill 28,233 16,595 34,314 328,546
Purchased customer accounts 10,359 9,092 15,020 128,302
Non-compete agreements 33 34 161 412
Other assets — — (732) 55
Total assets acquired 39,567 26,931 41,847 473,943
Other current liabilities (2,578) (16) 6,235 (2,269)
Other liabilities — — — (407)
Total liabilities assumed (2,578) (16) 6,235 (2,676)
Net assets acquired $36,989 $26,915 $48,082 $471,267
The weighted average useful lives for the acquired amortizable intangible assets are as follows: purchased customer accounts, 15 years;
and non-compete agreements, 5 years.
Goodwill of $328.5 million was allocated to the Retail, National Programs, Wholesale Brokerage and Services Segments in the amounts
of $302.6 million, $0.1 million, $6.5 million and $19.3 million, respectively. Of the total goodwill of $328.5 million, $245.6 million is currently
deductible for income tax purposes. The remaining $82.9 million relates to the recorded earn-out payables and will not be deductible
until it is earned and paid.
53
20
21
AN
NU
AL
RE
PO
RT
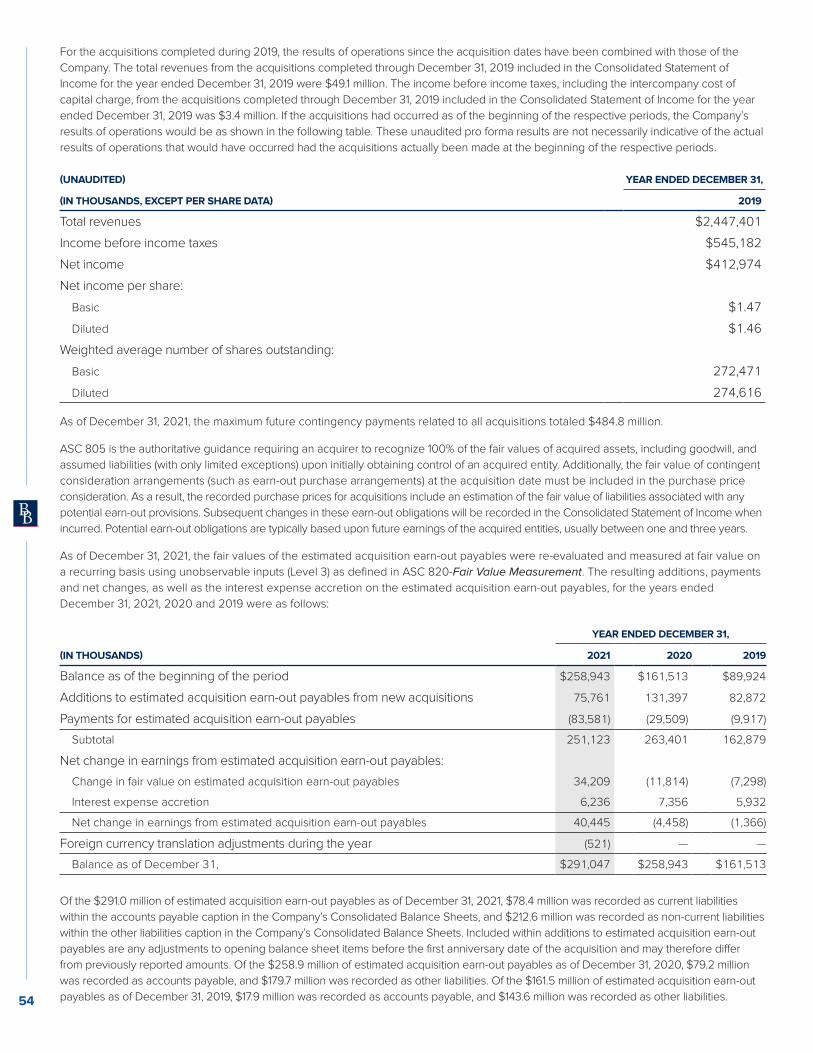
For the acquisitions completed during 2019, the results of operations since the acquisition dates have been combined with those of the
Company. The total revenues from the acquisitions completed through December 31, 2019 included in the Consolidated Statement of
Income for the year ended December 31, 2019 were $49.1 million. The income before income taxes, including the intercompany cost of
capital charge, from the acquisitions completed through December 31, 2019 included in the Consolidated Statement of Income for the year
ended December 31, 2019 was $3.4 million. If the acquisitions had occurred as of the beginning of the respective periods, the Company’s
results of operations would be as shown in the following table. These unaudited pro forma results are not necessarily indicative of the actual
results of operations that would have occurred had the acquisitions actually been made at the beginning of the respective periods.
(UNAUDITED) YEAR ENDED DECEMBER 31,
(IN THOUSANDS, EXCEPT PER SHARE DATA) 2019
Total revenues $2,447,401
Income before income taxes $545,182
Net income $412,974
Net income per share:
Basic $1.47
Diluted $1.46
Weighted average number of shares outstanding:
Basic 272,471
Diluted 274,616
As of December 31, 2021, the maximum future contingency payments related to all acquisitions totaled $484.8 million.
ASC 805 is the authoritative guidance requiring an acquirer to recognize 100% of the fair values of acquired assets, including goodwill, and
assumed liabilities (with only limited exceptions) upon initially obtaining control of an acquired entity. Additionally, the fair value of contingent
consideration arrangements (such as earn-out purchase arrangements) at the acquisition date must be included in the purchase price
consideration. As a result, the recorded purchase prices for acquisitions include an estimation of the fair value of liabilities associated with any
potential earn-out provisions. Subsequent changes in these earn-out obligations will be recorded in the Consolidated Statement of Income when
incurred. Potential earn-out obligations are typically based upon future earnings of the acquired entities, usually between one and three years.
As of December 31, 2021, the fair values of the estimated acquisition earn-out payables were re-evaluated and measured at fair value on
a recurring basis using unobservable inputs (Level 3) as defined in ASC 820-Fair Value Measurement. The resulting additions, payments
and net changes, as well as the interest expense accretion on the estimated acquisition earn-out payables, for the years ended
December 31, 2021, 2020 and 2019 were as follows:
YEAR ENDED DECEMBER 31,
(IN THOUSANDS) 2021 2020 2019
Balance as of the beginning of the period $258,943 $161,513 $89,924
Additions to estimated acquisition earn-out payables from new acquisitions 75,761 131,397 82,872
Payments for estimated acquisition earn-out payables (83,581) (29,509) (9,917)
Subtotal 251,123 263,401 162,879
Net change in earnings from estimated acquisition earn-out payables:
Change in fair value on estimated acquisition earn-out payables 34,209 (11,814) (7,298)
Interest expense accretion 6,236 7,356 5,932
Net change in earnings from estimated acquisition earn-out payables 40,445 (4,458) (1,366)
Foreign currency translation adjustments during the year (521) — —
Balance as of December 31, $291,047 $258,943 $161,513
Of the $291.0 million of estimated acquisition earn-out payables as of December 31, 2021, $78.4 million was recorded as current liabilities
within the accounts payable caption in the Company’s Consolidated Balance Sheets, and $212.6 million was recorded as non-current liabilities
within the other liabilities caption in the Company’s Consolidated Balance Sheets. Included within additions to estimated acquisition earn-out
payables are any adjustments to opening balance sheet items before the first anniversary date of the acquisition and may therefore differ
from previously reported amounts. Of the $258.9 million of estimated acquisition earn-out payables as of December 31, 2020, $79.2 million
was recorded as accounts payable, and $179.7 million was recorded as other liabilities. Of the $161.5 million of estimated acquisition earn-out
payables as of December 31, 2019, $17.9 million was recorded as accounts payable, and $143.6 million was recorded as other liabilities.54
NOTE 4. GoodwillThe changes in the carrying value of goodwill by reportable segment for the years ended December 31, are as follows:
(IN THOUSANDS) RETAILNATIONAL
PROGRAMSWHOLESALEBROKERAGE SERVICES TOTAL
Balance as of January 1, 2020 $2,351,291 $925,541 $298,101 $171,161 $3,746,094
Goodwill of acquired businesses 299,961 163,070 184,956 108 648,095
Goodwill disposed of relating to sales of businesses (782) — — — (782)
Foreign currency translation adjustments during the year — 2,511 — — 2,511
Balance as of December 31, 2020 $2,650,470 $1,091,122 $483,057 $171,269 $4,395,918
Goodwill of acquired businesses 345,961 (1,337) 5,349 — 349,973
Goodwill disposed of relating to sales of businesses (3,050) — — — (3,050)
Foreign currency translation adjustments during the year (6,135) 122 — — (6,013)
Balance as of December 31, 2021 $2,987,246 $1,089,907 $488,406 $171,269 $4,736,828
NOTE 5. Amortizable Intangible AssetsAmortizable intangible assets at December 31, 2021 and 2020 consisted of the following:
DECEMBER 31, 2021 DECEMBER 31, 2020
(IN THOUSANDS)
GROSSCARRYING
VALUEACCUMULATEDAMORTIZATION
NETCARRYING
VALUE
WEIGHTEDAVERAGE
LIFE INYEARS(1)
GROSSCARRYING
VALUEACCUMULATEDAMORTIZATION
NETCARRYING
VALUE
WEIGHTEDAVERAGE
LIFE INYEARS(1)
Purchased customer accounts $2,311,605 $(1,235,261) $1,076,344 14.9 $2,164,968 $(1,118,316) $1,046,652 15.0
Non-compete agreements 37,587 (32,466) 5,121 4.5 35,093 (32,085) 3,008 4.6
Total $2,349,192 $(1,267,727) $1,081,465 $2,200,061 $(1,150,401) $1,049,660
(1) Weighted average life calculated as of the date of acquisition.
Amortization expense for amortizable intangible assets for the years ending December 31, 2022, 2023, 2024, 2025 and 2026
is estimated to be $122.4 million, $115.5 million, $111.3 million, $108.9 million and $102.9 million, respectively.
NOTE 6. InvestmentsAt December 31, 2021, the Company’s amortized cost and fair values of fixed maturity securities are summarized as follows:
(IN THOUSANDS) COST
GROSSUNREALIZED
GAINS
GROSSUNREALIZED
LOSSES FAIR VALUE
U.S. Treasury securities, obligations of U.S. Government agencies and Municipalities
$30,232 $152 $(363) $30,021
Corporate debt 8,259 108 (62) 8,305
Total $38,491 $260 $(425) $38,326
At December 31, 2021, the Company held $30.0 million in fixed income securities composed of U.S Treasury securities, securities
issued by U.S. Government agencies and municipalities, and $8.3 million issued by corporations with investment-grade ratings. Of the
total, $7.4 million is classified as short-term investments on the Consolidated Balance Sheets as maturities are less than one year in
duration. Additionally, the Company holds $5.5 million in short-term investments, which are related to time deposits held with various
financial institutions.
55
20
21
AN
NU
AL
RE
PO
RT
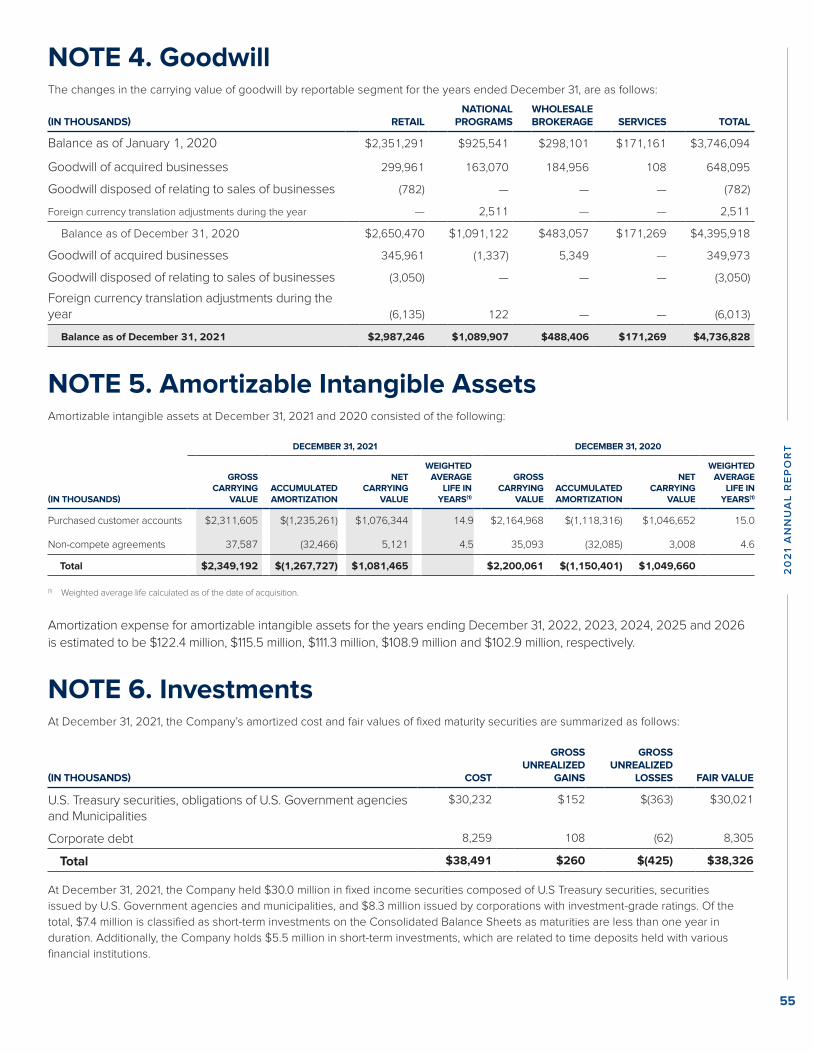
For the acquisitions completed during 2019, the results of operations since the acquisition dates have been combined with those of the
Company. The total revenues from the acquisitions completed through December 31, 2019 included in the Consolidated Statement of
Income for the year ended December 31, 2019 were $49.1 million. The income before income taxes, including the intercompany cost of
capital charge, from the acquisitions completed through December 31, 2019 included in the Consolidated Statement of Income for the year
ended December 31, 2019 was $3.4 million. If the acquisitions had occurred as of the beginning of the respective periods, the Company’s
results of operations would be as shown in the following table. These unaudited pro forma results are not necessarily indicative of the actual
results of operations that would have occurred had the acquisitions actually been made at the beginning of the respective periods.
(UNAUDITED) YEAR ENDED DECEMBER 31,
(IN THOUSANDS, EXCEPT PER SHARE DATA) 2019
Total revenues $2,447,401
Income before income taxes $545,182
Net income $412,974
Net income per share:
Basic $1.47
Diluted $1.46
Weighted average number of shares outstanding:
Basic 272,471
Diluted 274,616
As of December 31, 2021, the maximum future contingency payments related to all acquisitions totaled $484.8 million.
ASC 805 is the authoritative guidance requiring an acquirer to recognize 100% of the fair values of acquired assets, including goodwill, and
assumed liabilities (with only limited exceptions) upon initially obtaining control of an acquired entity. Additionally, the fair value of contingent
consideration arrangements (such as earn-out purchase arrangements) at the acquisition date must be included in the purchase price
consideration. As a result, the recorded purchase prices for acquisitions include an estimation of the fair value of liabilities associated with any
potential earn-out provisions. Subsequent changes in these earn-out obligations will be recorded in the Consolidated Statement of Income when
incurred. Potential earn-out obligations are typically based upon future earnings of the acquired entities, usually between one and three years.
As of December 31, 2021, the fair values of the estimated acquisition earn-out payables were re-evaluated and measured at fair value on
a recurring basis using unobservable inputs (Level 3) as defined in ASC 820-Fair Value Measurement. The resulting additions, payments
and net changes, as well as the interest expense accretion on the estimated acquisition earn-out payables, for the years ended
December 31, 2021, 2020 and 2019 were as follows:
YEAR ENDED DECEMBER 31,
(IN THOUSANDS) 2021 2020 2019
Balance as of the beginning of the period $258,943 $161,513 $89,924
Additions to estimated acquisition earn-out payables from new acquisitions 75,761 131,397 82,872
Payments for estimated acquisition earn-out payables (83,581) (29,509) (9,917)
Subtotal 251,123 263,401 162,879
Net change in earnings from estimated acquisition earn-out payables:
Change in fair value on estimated acquisition earn-out payables 34,209 (11,814) (7,298)
Interest expense accretion 6,236 7,356 5,932
Net change in earnings from estimated acquisition earn-out payables 40,445 (4,458) (1,366)
Foreign currency translation adjustments during the year (521) — —
Balance as of December 31, $291,047 $258,943 $161,513
Of the $291.0 million of estimated acquisition earn-out payables as of December 31, 2021, $78.4 million was recorded as current liabilities
within the accounts payable caption in the Company’s Consolidated Balance Sheets, and $212.6 million was recorded as non-current liabilities
within the other liabilities caption in the Company’s Consolidated Balance Sheets. Included within additions to estimated acquisition earn-out
payables are any adjustments to opening balance sheet items before the first anniversary date of the acquisition and may therefore differ
from previously reported amounts. Of the $258.9 million of estimated acquisition earn-out payables as of December 31, 2020, $79.2 million
was recorded as accounts payable, and $179.7 million was recorded as other liabilities. Of the $161.5 million of estimated acquisition earn-out
payables as of December 31, 2019, $17.9 million was recorded as accounts payable, and $143.6 million was recorded as other liabilities.54
NOTE 4. GoodwillThe changes in the carrying value of goodwill by reportable segment for the years ended December 31, are as follows:
(IN THOUSANDS) RETAILNATIONAL
PROGRAMSWHOLESALEBROKERAGE SERVICES TOTAL
Balance as of January 1, 2020 $2,351,291 $925,541 $298,101 $171,161 $3,746,094
Goodwill of acquired businesses 299,961 163,070 184,956 108 648,095
Goodwill disposed of relating to sales of businesses (782) — — — (782)
Foreign currency translation adjustments during the year — 2,511 — — 2,511
Balance as of December 31, 2020 $2,650,470 $1,091,122 $483,057 $171,269 $4,395,918
Goodwill of acquired businesses 345,961 (1,337) 5,349 — 349,973
Goodwill disposed of relating to sales of businesses (3,050) — — — (3,050)
Foreign currency translation adjustments during the year (6,135) 122 — — (6,013)
Balance as of December 31, 2021 $2,987,246 $1,089,907 $488,406 $171,269 $4,736,828
NOTE 5. Amortizable Intangible AssetsAmortizable intangible assets at December 31, 2021 and 2020 consisted of the following:
DECEMBER 31, 2021 DECEMBER 31, 2020
(IN THOUSANDS)
GROSSCARRYING
VALUEACCUMULATEDAMORTIZATION
NETCARRYING
VALUE
WEIGHTEDAVERAGE
LIFE INYEARS(1)
GROSSCARRYING
VALUEACCUMULATEDAMORTIZATION
NETCARRYING
VALUE
WEIGHTEDAVERAGE
LIFE INYEARS(1)
Purchased customer accounts $2,311,605 $(1,235,261) $1,076,344 14.9 $2,164,968 $(1,118,316) $1,046,652 15.0
Non-compete agreements 37,587 (32,466) 5,121 4.5 35,093 (32,085) 3,008 4.6
Total $2,349,192 $(1,267,727) $1,081,465 $2,200,061 $(1,150,401) $1,049,660
(1) Weighted average life calculated as of the date of acquisition.
Amortization expense for amortizable intangible assets for the years ending December 31, 2022, 2023, 2024, 2025 and 2026
is estimated to be $122.4 million, $115.5 million, $111.3 million, $108.9 million and $102.9 million, respectively.
NOTE 6. InvestmentsAt December 31, 2021, the Company’s amortized cost and fair values of fixed maturity securities are summarized as follows:
(IN THOUSANDS) COST
GROSSUNREALIZED
GAINS
GROSSUNREALIZED
LOSSES FAIR VALUE
U.S. Treasury securities, obligations of U.S. Government agencies and Municipalities
$30,232 $152 $(363) $30,021
Corporate debt 8,259 108 (62) 8,305
Total $38,491 $260 $(425) $38,326
At December 31, 2021, the Company held $30.0 million in fixed income securities composed of U.S Treasury securities, securities
issued by U.S. Government agencies and municipalities, and $8.3 million issued by corporations with investment-grade ratings. Of the
total, $7.4 million is classified as short-term investments on the Consolidated Balance Sheets as maturities are less than one year in
duration. Additionally, the Company holds $5.5 million in short-term investments, which are related to time deposits held with various
financial institutions.
55
20
21
AN
NU
AL
RE
PO
RT
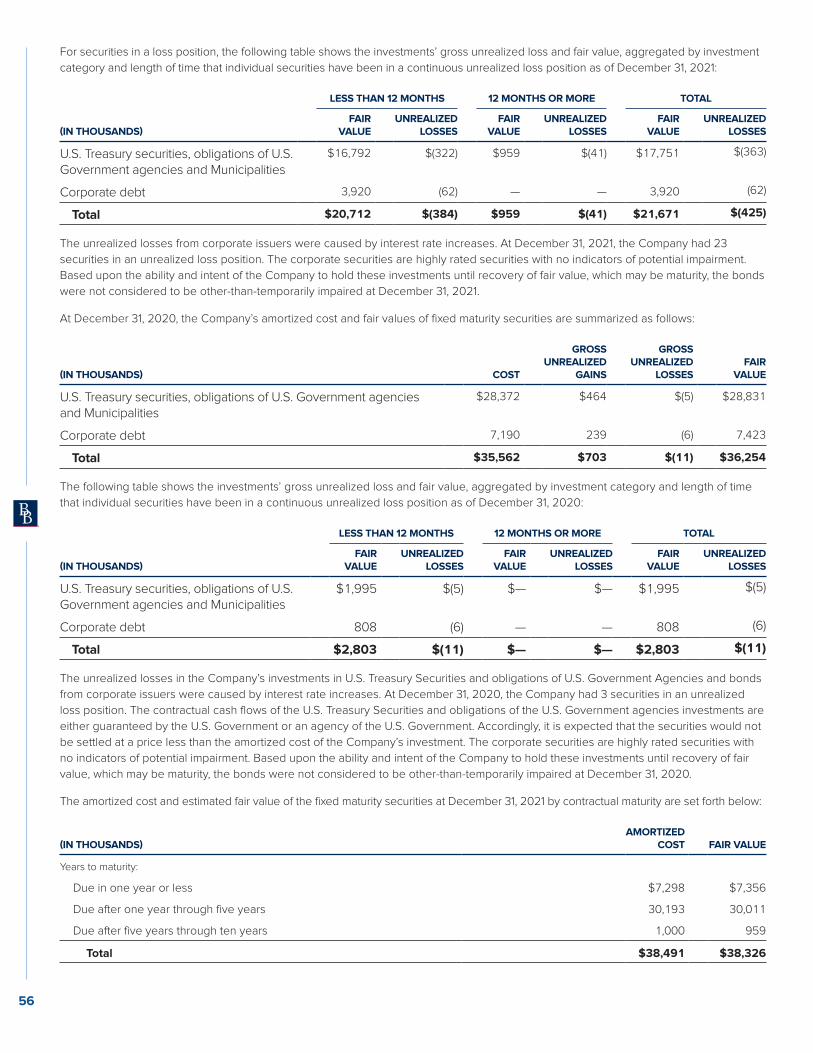
For securities in a loss position, the following table shows the investments’ gross unrealized loss and fair value, aggregated by investment
category and length of time that individual securities have been in a continuous unrealized loss position as of December 31, 2021:
LESS THAN 12 MONTHS 12 MONTHS OR MORE TOTAL
(IN THOUSANDS)FAIR
VALUEUNREALIZED
LOSSESFAIR
VALUEUNREALIZED
LOSSESFAIR
VALUEUNREALIZED
LOSSES
U.S. Treasury securities, obligations of U.S. Government agencies and Municipalities
$16,792 $(322) $959 $(41) $17,751 $(363)
Corporate debt 3,920 (62) — — 3,920 (62)
Total $20,712 $(384) $959 $(41) $21,671 $(425)
The unrealized losses from corporate issuers were caused by interest rate increases. At December 31, 2021, the Company had 23
securities in an unrealized loss position. The corporate securities are highly rated securities with no indicators of potential impairment.
Based upon the ability and intent of the Company to hold these investments until recovery of fair value, which may be maturity, the bonds
were not considered to be other-than-temporarily impaired at December 31, 2021.
At December 31, 2020, the Company’s amortized cost and fair values of fixed maturity securities are summarized as follows:
(IN THOUSANDS) COST
GROSSUNREALIZED
GAINS
GROSSUNREALIZED
LOSSESFAIR
VALUE
U.S. Treasury securities, obligations of U.S. Government agencies and Municipalities
$28,372 $464 $(5) $28,831
Corporate debt 7,190 239 (6) 7,423
Total $35,562 $703 $(11) $36,254
The following table shows the investments’ gross unrealized loss and fair value, aggregated by investment category and length of time
that individual securities have been in a continuous unrealized loss position as of December 31, 2020:
LESS THAN 12 MONTHS 12 MONTHS OR MORE TOTAL
(IN THOUSANDS)FAIR
VALUEUNREALIZED
LOSSESFAIR
VALUEUNREALIZED
LOSSESFAIR
VALUEUNREALIZED
LOSSES
U.S. Treasury securities, obligations of U.S. Government agencies and Municipalities
$1,995 $(5) $— $— $1,995 $(5)
Corporate debt 808 (6) — — 808 (6)
Total $2,803 $(11) $— $— $2,803 $(11)
The unrealized losses in the Company’s investments in U.S. Treasury Securities and obligations of U.S. Government Agencies and bonds
from corporate issuers were caused by interest rate increases. At December 31, 2020, the Company had 3 securities in an unrealized
loss position. The contractual cash flows of the U.S. Treasury Securities and obligations of the U.S. Government agencies investments are
either guaranteed by the U.S. Government or an agency of the U.S. Government. Accordingly, it is expected that the securities would not
be settled at a price less than the amortized cost of the Company’s investment. The corporate securities are highly rated securities with
no indicators of potential impairment. Based upon the ability and intent of the Company to hold these investments until recovery of fair
value, which may be maturity, the bonds were not considered to be other-than-temporarily impaired at December 31, 2020.
The amortized cost and estimated fair value of the fixed maturity securities at December 31, 2021 by contractual maturity are set forth below:
(IN THOUSANDS)AMORTIZED
COST FAIR VALUE
Years to maturity:
Due in one year or less $7,298 $7,356
Due after one year through five years 30,193 30,011
Due after five years through ten years 1,000 959
Total $38,491 $38,326
56
The amortized cost and estimated fair value of the fixed maturity securities at December 31, 2020 by contractual maturity are set forth below:
(IN THOUSANDS)AMORTIZED
COST FAIR VALUE
Years to maturity:
Due in one year or less $11,214 $11,283
Due after one year through five years 23,348 23,976
Due after five years through ten years 1,000 995
Total $35,562 $36,254
The expected maturities in the foregoing table may differ from the contractual maturities because certain borrowers have the right to call
or prepay obligations with or without penalty.
Proceeds from the sales and maturity of the Company’s investment in fixed maturity securities were $9.2 million. This along with maturing
time deposits yielded total cash proceeds from the sale of investments of $10.8 million in the period of January 1, 2021 to December 31,
2021. These proceeds, along with other sources of cash were used to purchase an additional $12.4 million of fixed maturity securities
and to fund certain general corporate purposes. The gains and losses realized on those sales for the period from January 1, 2021 to
December 31, 2021 were insignificant.
Proceeds from the sales and maturity of the Company’s investment in fixed maturity securities were $8.6 million for the year ended
December 31, 2020. This along with maturing time deposits yielded total cash proceeds from the sale of investments of $11.0 million in
the period of January 1, 2020 to December 31, 2020. These proceeds were used to purchase an additional $14.2 million of fixed maturity
securities and to fund certain general corporate purposes. The gains and losses realized on those sales for the period from January 1,
2020 to December 31, 2020 were insignificant.
Realized gains and losses are reported on the Consolidated Statement of Income, with the cost of securities sold determined on a
specific identification basis.
At December 31, 2021, investments with a fair value of approximately $4.1 million were on deposit with state insurance departments to
satisfy regulatory requirements.
NOTE 7. Fixed AssetsFixed assets at December 31 consisted of the following:
(IN THOUSANDS) 2021 2020
Furniture, fixtures, equipment and software $259,081 $259,524
Leasehold improvements 52,142 42,261
Construction in progress — 81,736
Land, buildings and improvements 97,200 8,428
Total cost 408,423 391,949
Less accumulated depreciation and amortization (196,390) (190,834)
Total $212,033 $201,115
Depreciation expense for fixed assets amounted to $33.3 million in 2021, $26.3 million in 2020 and $23.4 million in 2019.
Construction in progress primarily reflects expenditures related to the construction of the new headquarters in Daytona Beach, Florida
which was placed into service in January 2021.
57
20
21
AN
NU
AL
RE
PO
RT
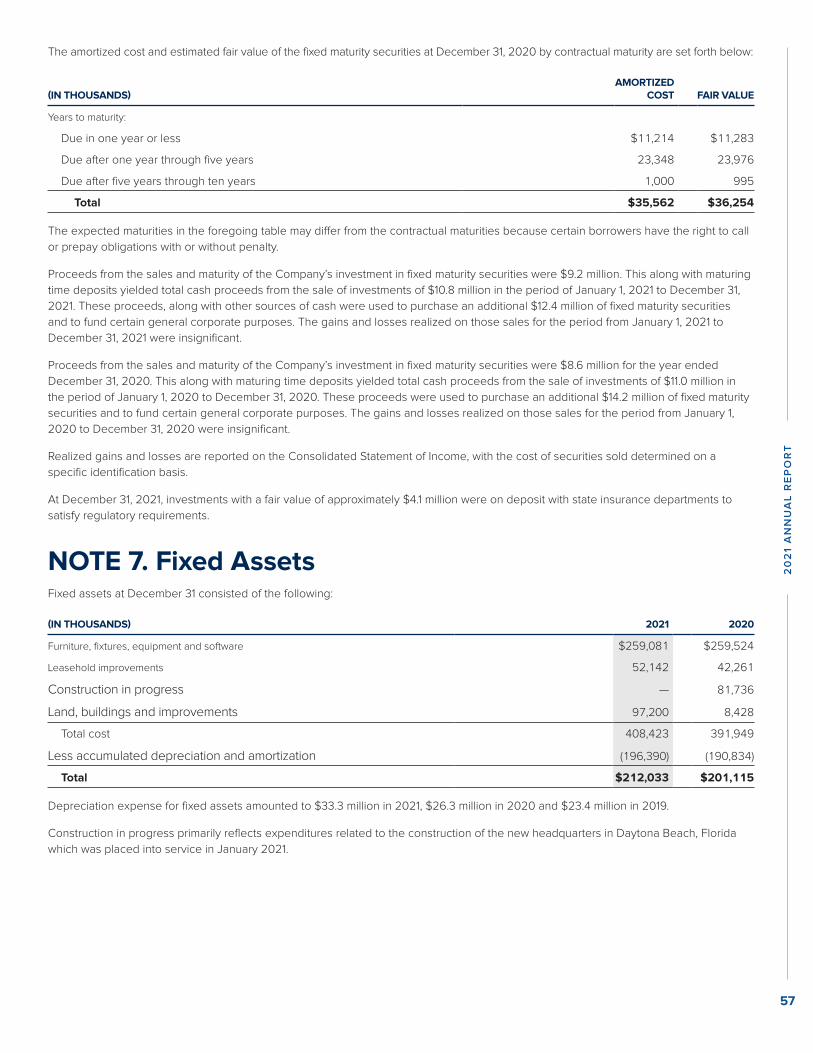
For securities in a loss position, the following table shows the investments’ gross unrealized loss and fair value, aggregated by investment
category and length of time that individual securities have been in a continuous unrealized loss position as of December 31, 2021:
LESS THAN 12 MONTHS 12 MONTHS OR MORE TOTAL
(IN THOUSANDS)FAIR
VALUEUNREALIZED
LOSSESFAIR
VALUEUNREALIZED
LOSSESFAIR
VALUEUNREALIZED
LOSSES
U.S. Treasury securities, obligations of U.S. Government agencies and Municipalities
$16,792 $(322) $959 $(41) $17,751 $(363)
Corporate debt 3,920 (62) — — 3,920 (62)
Total $20,712 $(384) $959 $(41) $21,671 $(425)
The unrealized losses from corporate issuers were caused by interest rate increases. At December 31, 2021, the Company had 23
securities in an unrealized loss position. The corporate securities are highly rated securities with no indicators of potential impairment.
Based upon the ability and intent of the Company to hold these investments until recovery of fair value, which may be maturity, the bonds
were not considered to be other-than-temporarily impaired at December 31, 2021.
At December 31, 2020, the Company’s amortized cost and fair values of fixed maturity securities are summarized as follows:
(IN THOUSANDS) COST
GROSSUNREALIZED
GAINS
GROSSUNREALIZED
LOSSESFAIR
VALUE
U.S. Treasury securities, obligations of U.S. Government agencies and Municipalities
$28,372 $464 $(5) $28,831
Corporate debt 7,190 239 (6) 7,423
Total $35,562 $703 $(11) $36,254
The following table shows the investments’ gross unrealized loss and fair value, aggregated by investment category and length of time
that individual securities have been in a continuous unrealized loss position as of December 31, 2020:
LESS THAN 12 MONTHS 12 MONTHS OR MORE TOTAL
(IN THOUSANDS)FAIR
VALUEUNREALIZED
LOSSESFAIR
VALUEUNREALIZED
LOSSESFAIR
VALUEUNREALIZED
LOSSES
U.S. Treasury securities, obligations of U.S. Government agencies and Municipalities
$1,995 $(5) $— $— $1,995 $(5)
Corporate debt 808 (6) — — 808 (6)
Total $2,803 $(11) $— $— $2,803 $(11)
The unrealized losses in the Company’s investments in U.S. Treasury Securities and obligations of U.S. Government Agencies and bonds
from corporate issuers were caused by interest rate increases. At December 31, 2020, the Company had 3 securities in an unrealized
loss position. The contractual cash flows of the U.S. Treasury Securities and obligations of the U.S. Government agencies investments are
either guaranteed by the U.S. Government or an agency of the U.S. Government. Accordingly, it is expected that the securities would not
be settled at a price less than the amortized cost of the Company’s investment. The corporate securities are highly rated securities with
no indicators of potential impairment. Based upon the ability and intent of the Company to hold these investments until recovery of fair
value, which may be maturity, the bonds were not considered to be other-than-temporarily impaired at December 31, 2020.
The amortized cost and estimated fair value of the fixed maturity securities at December 31, 2021 by contractual maturity are set forth below:
(IN THOUSANDS)AMORTIZED
COST FAIR VALUE
Years to maturity:
Due in one year or less $7,298 $7,356
Due after one year through five years 30,193 30,011
Due after five years through ten years 1,000 959
Total $38,491 $38,326
56
The amortized cost and estimated fair value of the fixed maturity securities at December 31, 2020 by contractual maturity are set forth below:
(IN THOUSANDS)AMORTIZED
COST FAIR VALUE
Years to maturity:
Due in one year or less $11,214 $11,283
Due after one year through five years 23,348 23,976
Due after five years through ten years 1,000 995
Total $35,562 $36,254
The expected maturities in the foregoing table may differ from the contractual maturities because certain borrowers have the right to call
or prepay obligations with or without penalty.
Proceeds from the sales and maturity of the Company’s investment in fixed maturity securities were $9.2 million. This along with maturing
time deposits yielded total cash proceeds from the sale of investments of $10.8 million in the period of January 1, 2021 to December 31,
2021. These proceeds, along with other sources of cash were used to purchase an additional $12.4 million of fixed maturity securities
and to fund certain general corporate purposes. The gains and losses realized on those sales for the period from January 1, 2021 to
December 31, 2021 were insignificant.
Proceeds from the sales and maturity of the Company’s investment in fixed maturity securities were $8.6 million for the year ended
December 31, 2020. This along with maturing time deposits yielded total cash proceeds from the sale of investments of $11.0 million in
the period of January 1, 2020 to December 31, 2020. These proceeds were used to purchase an additional $14.2 million of fixed maturity
securities and to fund certain general corporate purposes. The gains and losses realized on those sales for the period from January 1,
2020 to December 31, 2020 were insignificant.
Realized gains and losses are reported on the Consolidated Statement of Income, with the cost of securities sold determined on a
specific identification basis.
At December 31, 2021, investments with a fair value of approximately $4.1 million were on deposit with state insurance departments to
satisfy regulatory requirements.
NOTE 7. Fixed AssetsFixed assets at December 31 consisted of the following:
(IN THOUSANDS) 2021 2020
Furniture, fixtures, equipment and software $259,081 $259,524
Leasehold improvements 52,142 42,261
Construction in progress — 81,736
Land, buildings and improvements 97,200 8,428
Total cost 408,423 391,949
Less accumulated depreciation and amortization (196,390) (190,834)
Total $212,033 $201,115
Depreciation expense for fixed assets amounted to $33.3 million in 2021, $26.3 million in 2020 and $23.4 million in 2019.
Construction in progress primarily reflects expenditures related to the construction of the new headquarters in Daytona Beach, Florida
which was placed into service in January 2021.
57
20
21
AN
NU
AL
RE
PO
RT
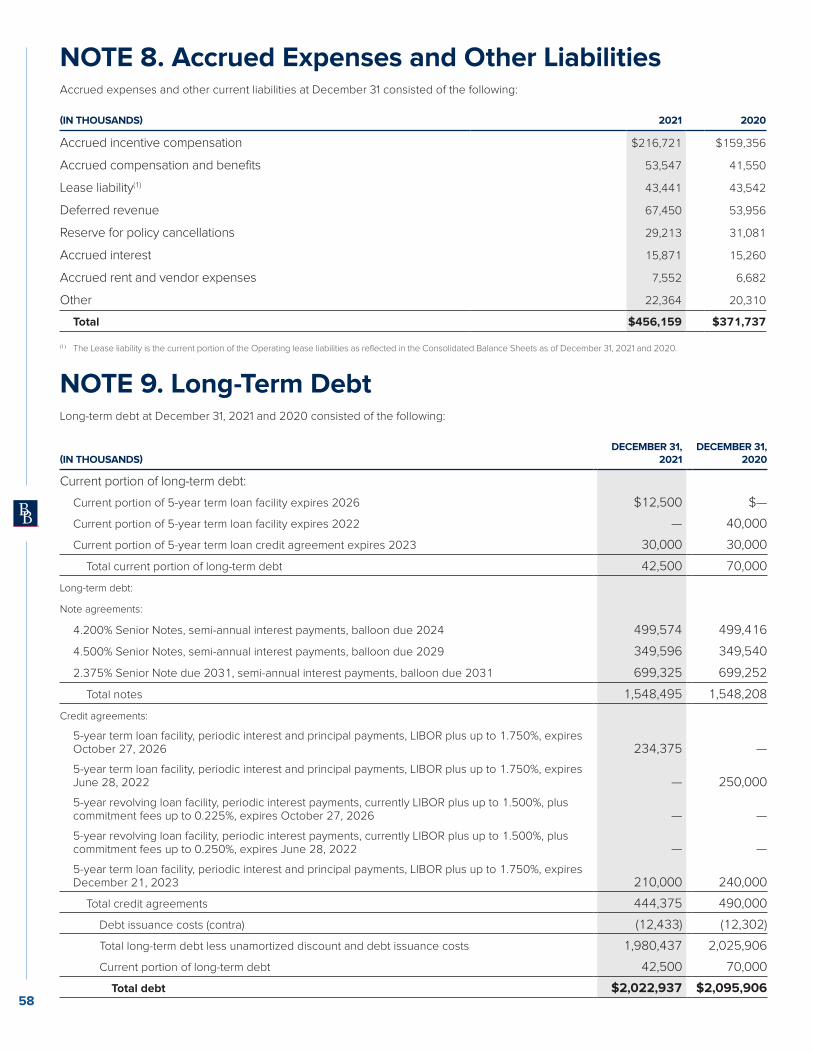
NOTE 8. Accrued Expenses and Other LiabilitiesAccrued expenses and other current liabilities at December 31 consisted of the following:
(IN THOUSANDS) 2021 2020
Accrued incentive compensation $216,721 $159,356
Accrued compensation and benefits 53,547 41,550
Lease liability(1) 43,441 43,542
Deferred revenue 67,450 53,956
Reserve for policy cancellations 29,213 31,081
Accrued interest 15,871 15,260
Accrued rent and vendor expenses 7,552 6,682
Other 22,364 20,310
Total $456,159 $371,737
(1) The Lease liability is the current portion of the Operating lease liabilities as reflected in the Consolidated Balance Sheets as of December 31, 2021 and 2020.
NOTE 9. Long-Term DebtLong-term debt at December 31, 2021 and 2020 consisted of the following:
(IN THOUSANDS)DECEMBER 31,
2021DECEMBER 31,
2020
Current portion of long-term debt:
Current portion of 5-year term loan facility expires 2026 $12,500 $—
Current portion of 5-year term loan facility expires 2022 — 40,000
Current portion of 5-year term loan credit agreement expires 2023 30,000 30,000
Total current portion of long-term debt 42,500 70,000
Long-term debt:
Note agreements:
4.200% Senior Notes, semi-annual interest payments, balloon due 2024 499,574 499,416
4.500% Senior Notes, semi-annual interest payments, balloon due 2029 349,596 349,540
2.375% Senior Note due 2031, semi-annual interest payments, balloon due 2031 699,325 699,252
Total notes 1,548,495 1,548,208
Credit agreements:
5-year term loan facility, periodic interest and principal payments, LIBOR plus up to 1.750%, expires October 27, 2026 234,375 —
5-year term loan facility, periodic interest and principal payments, LIBOR plus up to 1.750%, expires June 28, 2022 — 250,000
5-year revolving loan facility, periodic interest payments, currently LIBOR plus up to 1.500%, plus commitment fees up to 0.225%, expires October 27, 2026 — —
5-year revolving loan facility, periodic interest payments, currently LIBOR plus up to 1.500%, plus commitment fees up to 0.250%, expires June 28, 2022 — —
5-year term loan facility, periodic interest and principal payments, LIBOR plus up to 1.750%, expires December 21, 2023 210,000 240,000
Total credit agreements 444,375 490,000
Debt issuance costs (contra) (12,433) (12,302)
Total long-term debt less unamortized discount and debt issuance costs 1,980,437 2,025,906
Current portion of long-term debt 42,500 70,000
Total debt $2,022,937 $2,095,90658
On October 27, 2021, the Company entered into an amended and restated credit agreement (the “Second Amended and Restated
Credit Agreement”) with the lenders named therein, JPMorgan Chase Bank, N.A. as administrative agent, Bank of America, N.A., Truist
Bank and BMO Harris Bank N.A. as co-syndication agents, and U.S. Bank National Association, Fifth Third Bank, National Association,
Wells Fargo Bank, National Association, PNC Bank, National Association, Morgan Stanley Senior Funding, Inc. and Citizens Bank, N.A. as
co-documentation agents. The Second Amended and Restated Credit Agreement amended and restated the credit agreement dated
April 17, 2014, among certain of such parties, as amended by that certain amended and restated credit agreement dated June 28, 2017
(the “Original Credit Agreement”). The Second Amended and Restated Credit Agreement, among other certain terms, extended the
maturity of the revolving credit facility of $800.0 million and unsecured term loans associated with the agreement of $250.0 million
to October 27, 2026. At the time of the renewal, the Company added an additional $2.7 million in debt issuance costs related to the
transaction. The Company carried forward $0.6 million of existing debt issuance costs related to the previous credit facility agreements
while expensing $0.1 million in debt issuance costs due to certain lenders exiting the renewed facility agreement. As of December 31,
2021, there was an outstanding debt balance issued under the term loan of the Second Amended and Restated Credit Agreement of
$246.9 million with no borrowings outstanding against the revolving credit facility.
On June 28, 2017, the Company entered into an amended and restated credit agreement (the “Amended and Restated Credit
Agreement”) with the lenders named therein, JPMorgan Chase Bank, N.A. as administrative agent and certain other banks as
co-syndication agents and co-documentation agents. The Amended and Restated Credit Agreement amended and restated the
credit agreement dated April 17, 2014, among such parties (the “Original Credit Agreement”). The Amended and Restated Credit
Agreement extended the applicable maturity date of the existing revolving credit facility (the “Revolving Credit Facility”) of $800.0
million to June 28, 2022 and re-evidences unsecured term loans at $400.0 million while also extending the applicable maturity date
to June 28, 2022. The quarterly term loan principal amortization schedule was reset. At the time of the execution of the Amended and
Restated Credit Agreement, $67.5 million of principal from the original unsecured term loans was repaid using operating cash balances,
and the Company added an additional $2.8 million in debt issuance costs related to the Revolving Credit Facility to the Consolidated
Balance Sheets. The Company also expensed to the Consolidated Statements of Income $0.2 million of debt issuance costs related to
the Original Credit Agreement due to certain lenders exiting before execution of the Amended and Restated Credit Agreement. The
Company also carried forward $1.6 million on the Consolidated Balance Sheets the remaining unamortized portion of the Original
Credit Agreement debt issuance costs, which will be amortized over the term of the Amended and Restated Credit Agreement. As
of December 31, 2020, there was an outstanding debt balance issued under the term loan of the Amended and Restated Credit
Agreement of $290.0 million with no borrowings outstanding against the Revolving Credit Facility.
On September 18, 2014, the Company issued $500.0 million of 4.200% unsecured Senior Notes due in 2024. The Senior Notes were
given investment grade ratings of BBB-/Baa3 with a stable outlook. The notes are subject to certain covenant restrictions and regulations
which are customary for credit rated obligations. At the time of funding, the proceeds were offered at a discount of the original note
amount which also excluded an underwriting fee discount. The net proceeds received from the issuance were used to repay the
outstanding balance of $475.0 million on the Revolving Credit Facility and for other general corporate purposes. As of December 31, 2021
and December 31, 2020, there was an outstanding debt balance of $500.0 million exclusive of the associated discount balance.
On December 21, 2018, the Company entered into a term loan credit agreement (the “Term Loan Credit Agreement”) with the lenders
named therein, Wells Fargo Bank, National Association, as administrative agent, and certain other banks as co-syndication agents and
as joint lead arrangers and joint bookrunners. The Term Loan Credit Agreement provides for an unsecured term loan in the initial amount
of $300.0 million, which may, subject to lenders’ discretion, potentially be increased up to an aggregate amount of $450.0 million (the
“Term Loan”). The Term Loan is repayable over the five-year term from the effective date of the Term Loan Credit Agreement, which
was December 21, 2018. Based on the Company’s net debt leverage ratio or a non-credit enhanced senior unsecured long-term debt
rating as determined by Moody’s Investor Service and Standard & Poor’s Rating Service, the rates of interest charged on the term loan
are 1.000% to 1.750%, above the adjusted 1-Month LIBOR rate. On December 21, 2018, the Company borrowed $300.0 million under the
Term Loan Credit Agreement and used $250.0 million of the proceeds to reduce indebtedness under the Revolving Credit Facility. As
of December 31, 2021, there was an outstanding debt balance issued under the Term Loan of $240.0 million. As of December 31, 2020,
there was an outstanding debt balance issued under the Term Loan of $270.0 million.
On March 11, 2019, the Company completed the issuance of $350.0 million aggregate principal amount of the Company’s 4.500% Senior
Notes due 2029. The Senior Notes were given investment grade ratings of BBB-/Baa3 with a stable outlook. The notes are subject to
certain covenant restrictions, which are customary for credit rated obligations. At the time of funding, the proceeds were offered at a
discount of the original note amount, which also excluded an underwriting fee discount. The net proceeds received from the issuance
were used to repay a portion of the outstanding balance of $350.0 million on the Revolving Credit Facility, utilized in connection with the
financing related to our acquisition of Hays and for other general corporate purposes. As of December 31, 2021, and December 31, 2020
there was an outstanding debt balance of $350.0 million exclusive of the associated discount balance.
On September 24, 2020, the Company completed the issuance of $700.0 million aggregate principal amount of the Company’s 2.375%
Senior Notes due 2031. The Senior Notes were given investment grade ratings of BBB- stable outlook and Baa3 positive outlook. The
notes are subject to certain covenant restrictions, which are customary for credit rated obligations. At the time of funding, the proceeds
were offered at a discount of the original note amount, which also excluded an underwriting fee discount. The net proceeds received
59
20
21
AN
NU
AL
RE
PO
RT
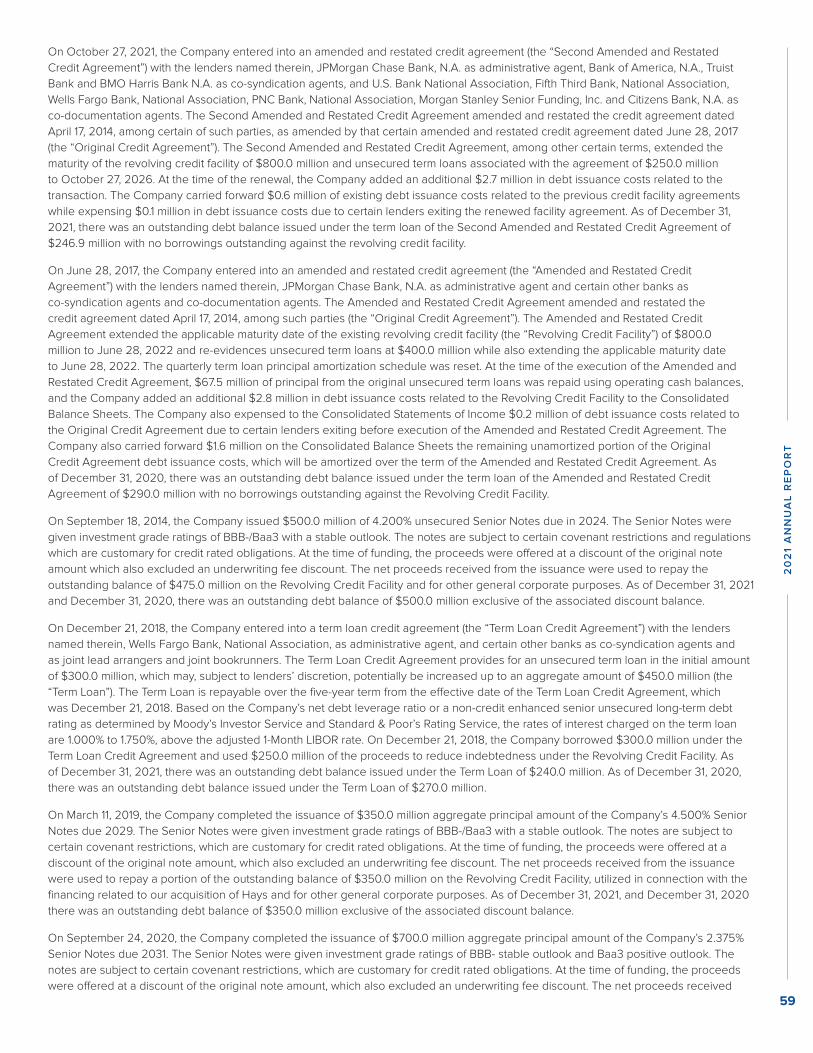
NOTE 8. Accrued Expenses and Other LiabilitiesAccrued expenses and other current liabilities at December 31 consisted of the following:
(IN THOUSANDS) 2021 2020
Accrued incentive compensation $216,721 $159,356
Accrued compensation and benefits 53,547 41,550
Lease liability(1) 43,441 43,542
Deferred revenue 67,450 53,956
Reserve for policy cancellations 29,213 31,081
Accrued interest 15,871 15,260
Accrued rent and vendor expenses 7,552 6,682
Other 22,364 20,310
Total $456,159 $371,737
(1) The Lease liability is the current portion of the Operating lease liabilities as reflected in the Consolidated Balance Sheets as of December 31, 2021 and 2020.
NOTE 9. Long-Term DebtLong-term debt at December 31, 2021 and 2020 consisted of the following:
(IN THOUSANDS)DECEMBER 31,
2021DECEMBER 31,
2020
Current portion of long-term debt:
Current portion of 5-year term loan facility expires 2026 $12,500 $—
Current portion of 5-year term loan facility expires 2022 — 40,000
Current portion of 5-year term loan credit agreement expires 2023 30,000 30,000
Total current portion of long-term debt 42,500 70,000
Long-term debt:
Note agreements:
4.200% Senior Notes, semi-annual interest payments, balloon due 2024 499,574 499,416
4.500% Senior Notes, semi-annual interest payments, balloon due 2029 349,596 349,540
2.375% Senior Note due 2031, semi-annual interest payments, balloon due 2031 699,325 699,252
Total notes 1,548,495 1,548,208
Credit agreements:
5-year term loan facility, periodic interest and principal payments, LIBOR plus up to 1.750%, expires October 27, 2026 234,375 —
5-year term loan facility, periodic interest and principal payments, LIBOR plus up to 1.750%, expires June 28, 2022 — 250,000
5-year revolving loan facility, periodic interest payments, currently LIBOR plus up to 1.500%, plus commitment fees up to 0.225%, expires October 27, 2026 — —
5-year revolving loan facility, periodic interest payments, currently LIBOR plus up to 1.500%, plus commitment fees up to 0.250%, expires June 28, 2022 — —
5-year term loan facility, periodic interest and principal payments, LIBOR plus up to 1.750%, expires December 21, 2023 210,000 240,000
Total credit agreements 444,375 490,000
Debt issuance costs (contra) (12,433) (12,302)
Total long-term debt less unamortized discount and debt issuance costs 1,980,437 2,025,906
Current portion of long-term debt 42,500 70,000
Total debt $2,022,937 $2,095,90658
On October 27, 2021, the Company entered into an amended and restated credit agreement (the “Second Amended and Restated
Credit Agreement”) with the lenders named therein, JPMorgan Chase Bank, N.A. as administrative agent, Bank of America, N.A., Truist
Bank and BMO Harris Bank N.A. as co-syndication agents, and U.S. Bank National Association, Fifth Third Bank, National Association,
Wells Fargo Bank, National Association, PNC Bank, National Association, Morgan Stanley Senior Funding, Inc. and Citizens Bank, N.A. as
co-documentation agents. The Second Amended and Restated Credit Agreement amended and restated the credit agreement dated
April 17, 2014, among certain of such parties, as amended by that certain amended and restated credit agreement dated June 28, 2017
(the “Original Credit Agreement”). The Second Amended and Restated Credit Agreement, among other certain terms, extended the
maturity of the revolving credit facility of $800.0 million and unsecured term loans associated with the agreement of $250.0 million
to October 27, 2026. At the time of the renewal, the Company added an additional $2.7 million in debt issuance costs related to the
transaction. The Company carried forward $0.6 million of existing debt issuance costs related to the previous credit facility agreements
while expensing $0.1 million in debt issuance costs due to certain lenders exiting the renewed facility agreement. As of December 31,
2021, there was an outstanding debt balance issued under the term loan of the Second Amended and Restated Credit Agreement of
$246.9 million with no borrowings outstanding against the revolving credit facility.
On June 28, 2017, the Company entered into an amended and restated credit agreement (the “Amended and Restated Credit
Agreement”) with the lenders named therein, JPMorgan Chase Bank, N.A. as administrative agent and certain other banks as
co-syndication agents and co-documentation agents. The Amended and Restated Credit Agreement amended and restated the
credit agreement dated April 17, 2014, among such parties (the “Original Credit Agreement”). The Amended and Restated Credit
Agreement extended the applicable maturity date of the existing revolving credit facility (the “Revolving Credit Facility”) of $800.0
million to June 28, 2022 and re-evidences unsecured term loans at $400.0 million while also extending the applicable maturity date
to June 28, 2022. The quarterly term loan principal amortization schedule was reset. At the time of the execution of the Amended and
Restated Credit Agreement, $67.5 million of principal from the original unsecured term loans was repaid using operating cash balances,
and the Company added an additional $2.8 million in debt issuance costs related to the Revolving Credit Facility to the Consolidated
Balance Sheets. The Company also expensed to the Consolidated Statements of Income $0.2 million of debt issuance costs related to
the Original Credit Agreement due to certain lenders exiting before execution of the Amended and Restated Credit Agreement. The
Company also carried forward $1.6 million on the Consolidated Balance Sheets the remaining unamortized portion of the Original
Credit Agreement debt issuance costs, which will be amortized over the term of the Amended and Restated Credit Agreement. As
of December 31, 2020, there was an outstanding debt balance issued under the term loan of the Amended and Restated Credit
Agreement of $290.0 million with no borrowings outstanding against the Revolving Credit Facility.
On September 18, 2014, the Company issued $500.0 million of 4.200% unsecured Senior Notes due in 2024. The Senior Notes were
given investment grade ratings of BBB-/Baa3 with a stable outlook. The notes are subject to certain covenant restrictions and regulations
which are customary for credit rated obligations. At the time of funding, the proceeds were offered at a discount of the original note
amount which also excluded an underwriting fee discount. The net proceeds received from the issuance were used to repay the
outstanding balance of $475.0 million on the Revolving Credit Facility and for other general corporate purposes. As of December 31, 2021
and December 31, 2020, there was an outstanding debt balance of $500.0 million exclusive of the associated discount balance.
On December 21, 2018, the Company entered into a term loan credit agreement (the “Term Loan Credit Agreement”) with the lenders
named therein, Wells Fargo Bank, National Association, as administrative agent, and certain other banks as co-syndication agents and
as joint lead arrangers and joint bookrunners. The Term Loan Credit Agreement provides for an unsecured term loan in the initial amount
of $300.0 million, which may, subject to lenders’ discretion, potentially be increased up to an aggregate amount of $450.0 million (the
“Term Loan”). The Term Loan is repayable over the five-year term from the effective date of the Term Loan Credit Agreement, which
was December 21, 2018. Based on the Company’s net debt leverage ratio or a non-credit enhanced senior unsecured long-term debt
rating as determined by Moody’s Investor Service and Standard & Poor’s Rating Service, the rates of interest charged on the term loan
are 1.000% to 1.750%, above the adjusted 1-Month LIBOR rate. On December 21, 2018, the Company borrowed $300.0 million under the
Term Loan Credit Agreement and used $250.0 million of the proceeds to reduce indebtedness under the Revolving Credit Facility. As
of December 31, 2021, there was an outstanding debt balance issued under the Term Loan of $240.0 million. As of December 31, 2020,
there was an outstanding debt balance issued under the Term Loan of $270.0 million.
On March 11, 2019, the Company completed the issuance of $350.0 million aggregate principal amount of the Company’s 4.500% Senior
Notes due 2029. The Senior Notes were given investment grade ratings of BBB-/Baa3 with a stable outlook. The notes are subject to
certain covenant restrictions, which are customary for credit rated obligations. At the time of funding, the proceeds were offered at a
discount of the original note amount, which also excluded an underwriting fee discount. The net proceeds received from the issuance
were used to repay a portion of the outstanding balance of $350.0 million on the Revolving Credit Facility, utilized in connection with the
financing related to our acquisition of Hays and for other general corporate purposes. As of December 31, 2021, and December 31, 2020
there was an outstanding debt balance of $350.0 million exclusive of the associated discount balance.
On September 24, 2020, the Company completed the issuance of $700.0 million aggregate principal amount of the Company’s 2.375%
Senior Notes due 2031. The Senior Notes were given investment grade ratings of BBB- stable outlook and Baa3 positive outlook. The
notes are subject to certain covenant restrictions, which are customary for credit rated obligations. At the time of funding, the proceeds
were offered at a discount of the original note amount, which also excluded an underwriting fee discount. The net proceeds received
59
20
21
AN
NU
AL
RE
PO
RT
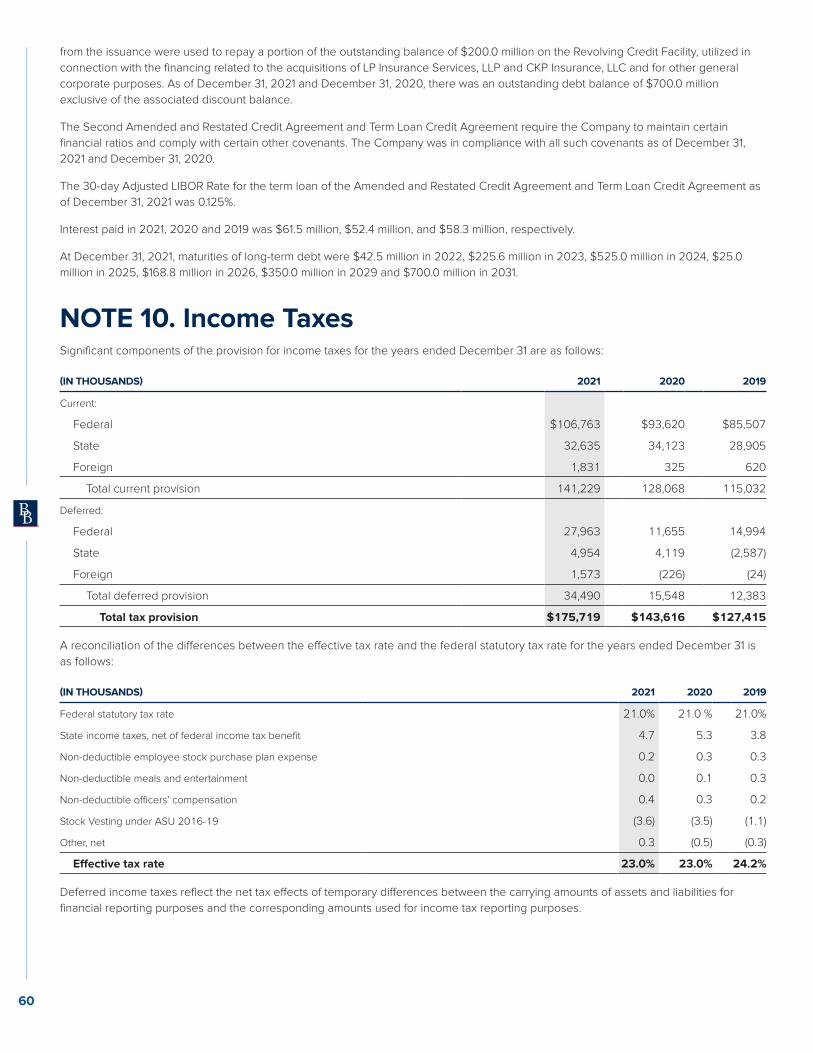
from the issuance were used to repay a portion of the outstanding balance of $200.0 million on the Revolving Credit Facility, utilized in
connection with the financing related to the acquisitions of LP Insurance Services, LLP and CKP Insurance, LLC and for other general
corporate purposes. As of December 31, 2021 and December 31, 2020, there was an outstanding debt balance of $700.0 million
exclusive of the associated discount balance.
The Second Amended and Restated Credit Agreement and Term Loan Credit Agreement require the Company to maintain certain
financial ratios and comply with certain other covenants. The Company was in compliance with all such covenants as of December 31,
2021 and December 31, 2020.
The 30-day Adjusted LIBOR Rate for the term loan of the Amended and Restated Credit Agreement and Term Loan Credit Agreement as
of December 31, 2021 was 0.125%.
Interest paid in 2021, 2020 and 2019 was $61.5 million, $52.4 million, and $58.3 million, respectively.
At December 31, 2021, maturities of long-term debt were $42.5 million in 2022, $225.6 million in 2023, $525.0 million in 2024, $25.0
million in 2025, $168.8 million in 2026, $350.0 million in 2029 and $700.0 million in 2031.
NOTE 10. Income TaxesSignificant components of the provision for income taxes for the years ended December 31 are as follows:
(IN THOUSANDS) 2021 2020 2019
Current:
Federal $106,763 $93,620 $85,507
State 32,635 34,123 28,905
Foreign 1,831 325 620
Total current provision 141,229 128,068 115,032
Deferred:
Federal 27,963 11,655 14,994
State 4,954 4,119 (2,587)
Foreign 1,573 (226) (24)
Total deferred provision 34,490 15,548 12,383
Total tax provision $175,719 $143,616 $127,415
A reconciliation of the differences between the effective tax rate and the federal statutory tax rate for the years ended December 31 is
as follows:
(IN THOUSANDS) 2021 2020 2019
Federal statutory tax rate 21.0% 21.0 % 21.0%
State income taxes, net of federal income tax benefit 4.7 5.3 3.8
Non-deductible employee stock purchase plan expense 0.2 0.3 0.3
Non-deductible meals and entertainment 0.0 0.1 0.3
Non-deductible officers’ compensation 0.4 0.3 0.2
Stock Vesting under ASU 2016-19 (3.6) (3.5) (1.1)
Other, net 0.3 (0.5) (0.3)
Effective tax rate 23.0% 23.0% 24.2%
Deferred income taxes reflect the net tax effects of temporary differences between the carrying amounts of assets and liabilities for
financial reporting purposes and the corresponding amounts used for income tax reporting purposes.
60
Significant components of the Company’s net deferred tax liabilities as of December 31 are as follows:
(IN THOUSANDS) 2021 2020
Non-current deferred tax liabilities:
Intangible assets $440,238 $400,335
Fixed assets 20,004 11,740
ASC 842 ROU Asset 47,663 46,730
Impact of adoption of ASC 606 revenue recognition 15,216 19,928
Net unrealized holding (loss)/gain on available-for-sale securities (41) 176
Total non-current deferred tax liabilities 523,080 478,909
Non-current deferred tax assets:
Deferred compensation 66,354 59,897
Accruals and reserves 15,708 19,497
ASC 842 lease liabilities 53,343 53,150
Net operating loss carryforwards and 163( j) disallowed carryforwards 1,910 3,168
Valuation allowance for deferred tax assets (1,029) (1,025)
Total non-current deferred tax assets 136,286 134,687
Net non-current deferred tax liability $386,794 $344,222
Income taxes paid in 2021, 2020 and 2019 were $147.5 million, $132.9 million and $110.0 million, respectively.
At December 31, 2021, the Company had no net operating loss carryforwards for federal purposes and $34.5 million net operating
loss carryforwards for state income tax reporting purposes, portions of which expire in the years 2022 through indefinite. The state
carryforward amount is derived from the operating results of certain subsidiaries. As of December 31, 2021, the Company had a net
operating loss carryforward in Canada of $1.8 million.
A reconciliation of the beginning and ending amount of unrecognized tax benefits is as follows:
(IN THOUSANDS) 2021 2020 2019
Unrecognized tax benefits balance at January 1 $1,267 $1,127 $1,639
Gross increases for tax positions of prior years 270 848 778
Gross decreases for tax positions of prior years (446) (708) (791)
Settlements (174) — (499 )
Unrecognized tax benefits balance at December 31 $917 $1,267 $1,127
The Company recognizes interest and penalties related to uncertain tax positions in income tax expense. As of December 31, 2021, 2020
and 2019 the Company had $0.3 million, $0.3 million and $0.2 million of accrued interest and penalties related to uncertain tax positions,
respectively.
The total amount of unrecognized tax benefits that would affect the Company’s effective tax rate if recognized was $0.9 million as of
December 31, 2021, $1.3 million as of December 31, 2020 and $1.1 million as of December 31, 2019. The Company does not expect its
unrecognized tax benefits to change significantly over the next 12 months.
The Company is subject to taxation in the United States and various state jurisdictions. The Company is also subject to taxation in the
United Kingdom, Ireland and Canada. In the United States, federal returns for fiscal years 2018 through 2021 remain open and subject to
examination by the Internal Revenue Service. The Company files and remits state income taxes in various states where the Company has
determined it is required to file state income taxes. The Company’s filings with those states remain open for audit for the fiscal years 2017
through 2021. In the United Kingdom, the Company’s filings remain open for audit for the fiscal years 2020 through 2021. In Canada, the
Company’s filings remain open for audit for the fiscal years 2016 through 2021. In Ireland, the Company’s filings remain open for audit for
the fiscal years 2017 through 2021. The Company also operates in Bermuda and the Cayman Islands. The Company is not subject to any
income taxes in these countries.
During 2019, the Company settled the previously disclosed State of Colorado income tax audit for the fiscal years 2013-2016, the State of
Kansas income tax audit for the fiscal years 2014-2016, and the State of New York income tax audit for the fiscal years 2015-2017.
During 2021, the Company settled the previously disclosed State of Wisconsin income tax audit for the fiscal years 2015-2018, the
State of Illinois income tax audit for the fiscal years 2015-2017, and the State of California income tax audit for the fiscal years 2015-2017.
There were no material adjustments as a result of the finalization of these audits. The Company is currently under audit in the State of 61
20
21
AN
NU
AL
RE
PO
RT
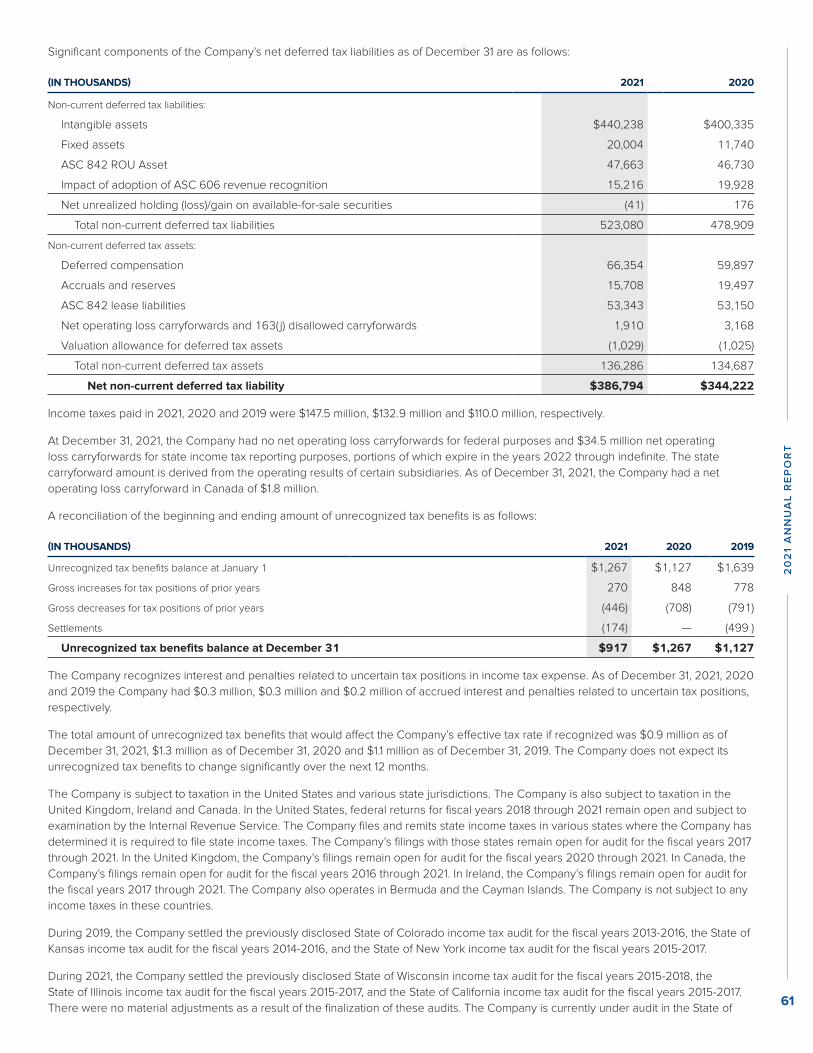
from the issuance were used to repay a portion of the outstanding balance of $200.0 million on the Revolving Credit Facility, utilized in
connection with the financing related to the acquisitions of LP Insurance Services, LLP and CKP Insurance, LLC and for other general
corporate purposes. As of December 31, 2021 and December 31, 2020, there was an outstanding debt balance of $700.0 million
exclusive of the associated discount balance.
The Second Amended and Restated Credit Agreement and Term Loan Credit Agreement require the Company to maintain certain
financial ratios and comply with certain other covenants. The Company was in compliance with all such covenants as of December 31,
2021 and December 31, 2020.
The 30-day Adjusted LIBOR Rate for the term loan of the Amended and Restated Credit Agreement and Term Loan Credit Agreement as
of December 31, 2021 was 0.125%.
Interest paid in 2021, 2020 and 2019 was $61.5 million, $52.4 million, and $58.3 million, respectively.
At December 31, 2021, maturities of long-term debt were $42.5 million in 2022, $225.6 million in 2023, $525.0 million in 2024, $25.0
million in 2025, $168.8 million in 2026, $350.0 million in 2029 and $700.0 million in 2031.
NOTE 10. Income TaxesSignificant components of the provision for income taxes for the years ended December 31 are as follows:
(IN THOUSANDS) 2021 2020 2019
Current:
Federal $106,763 $93,620 $85,507
State 32,635 34,123 28,905
Foreign 1,831 325 620
Total current provision 141,229 128,068 115,032
Deferred:
Federal 27,963 11,655 14,994
State 4,954 4,119 (2,587)
Foreign 1,573 (226) (24)
Total deferred provision 34,490 15,548 12,383
Total tax provision $175,719 $143,616 $127,415
A reconciliation of the differences between the effective tax rate and the federal statutory tax rate for the years ended December 31 is
as follows:
(IN THOUSANDS) 2021 2020 2019
Federal statutory tax rate 21.0% 21.0 % 21.0%
State income taxes, net of federal income tax benefit 4.7 5.3 3.8
Non-deductible employee stock purchase plan expense 0.2 0.3 0.3
Non-deductible meals and entertainment 0.0 0.1 0.3
Non-deductible officers’ compensation 0.4 0.3 0.2
Stock Vesting under ASU 2016-19 (3.6) (3.5) (1.1)
Other, net 0.3 (0.5) (0.3)
Effective tax rate 23.0% 23.0% 24.2%
Deferred income taxes reflect the net tax effects of temporary differences between the carrying amounts of assets and liabilities for
financial reporting purposes and the corresponding amounts used for income tax reporting purposes.
60
Significant components of the Company’s net deferred tax liabilities as of December 31 are as follows:
(IN THOUSANDS) 2021 2020
Non-current deferred tax liabilities:
Intangible assets $440,238 $400,335
Fixed assets 20,004 11,740
ASC 842 ROU Asset 47,663 46,730
Impact of adoption of ASC 606 revenue recognition 15,216 19,928
Net unrealized holding (loss)/gain on available-for-sale securities (41) 176
Total non-current deferred tax liabilities 523,080 478,909
Non-current deferred tax assets:
Deferred compensation 66,354 59,897
Accruals and reserves 15,708 19,497
ASC 842 lease liabilities 53,343 53,150
Net operating loss carryforwards and 163( j) disallowed carryforwards 1,910 3,168
Valuation allowance for deferred tax assets (1,029) (1,025)
Total non-current deferred tax assets 136,286 134,687
Net non-current deferred tax liability $386,794 $344,222
Income taxes paid in 2021, 2020 and 2019 were $147.5 million, $132.9 million and $110.0 million, respectively.
At December 31, 2021, the Company had no net operating loss carryforwards for federal purposes and $34.5 million net operating
loss carryforwards for state income tax reporting purposes, portions of which expire in the years 2022 through indefinite. The state
carryforward amount is derived from the operating results of certain subsidiaries. As of December 31, 2021, the Company had a net
operating loss carryforward in Canada of $1.8 million.
A reconciliation of the beginning and ending amount of unrecognized tax benefits is as follows:
(IN THOUSANDS) 2021 2020 2019
Unrecognized tax benefits balance at January 1 $1,267 $1,127 $1,639
Gross increases for tax positions of prior years 270 848 778
Gross decreases for tax positions of prior years (446) (708) (791)
Settlements (174) — (499 )
Unrecognized tax benefits balance at December 31 $917 $1,267 $1,127
The Company recognizes interest and penalties related to uncertain tax positions in income tax expense. As of December 31, 2021, 2020
and 2019 the Company had $0.3 million, $0.3 million and $0.2 million of accrued interest and penalties related to uncertain tax positions,
respectively.
The total amount of unrecognized tax benefits that would affect the Company’s effective tax rate if recognized was $0.9 million as of
December 31, 2021, $1.3 million as of December 31, 2020 and $1.1 million as of December 31, 2019. The Company does not expect its
unrecognized tax benefits to change significantly over the next 12 months.
The Company is subject to taxation in the United States and various state jurisdictions. The Company is also subject to taxation in the
United Kingdom, Ireland and Canada. In the United States, federal returns for fiscal years 2018 through 2021 remain open and subject to
examination by the Internal Revenue Service. The Company files and remits state income taxes in various states where the Company has
determined it is required to file state income taxes. The Company’s filings with those states remain open for audit for the fiscal years 2017
through 2021. In the United Kingdom, the Company’s filings remain open for audit for the fiscal years 2020 through 2021. In Canada, the
Company’s filings remain open for audit for the fiscal years 2016 through 2021. In Ireland, the Company’s filings remain open for audit for
the fiscal years 2017 through 2021. The Company also operates in Bermuda and the Cayman Islands. The Company is not subject to any
income taxes in these countries.
During 2019, the Company settled the previously disclosed State of Colorado income tax audit for the fiscal years 2013-2016, the State of
Kansas income tax audit for the fiscal years 2014-2016, and the State of New York income tax audit for the fiscal years 2015-2017.
During 2021, the Company settled the previously disclosed State of Wisconsin income tax audit for the fiscal years 2015-2018, the
State of Illinois income tax audit for the fiscal years 2015-2017, and the State of California income tax audit for the fiscal years 2015-2017.
There were no material adjustments as a result of the finalization of these audits. The Company is currently under audit in the State of 61
20
21
AN
NU
AL
RE
PO
RT
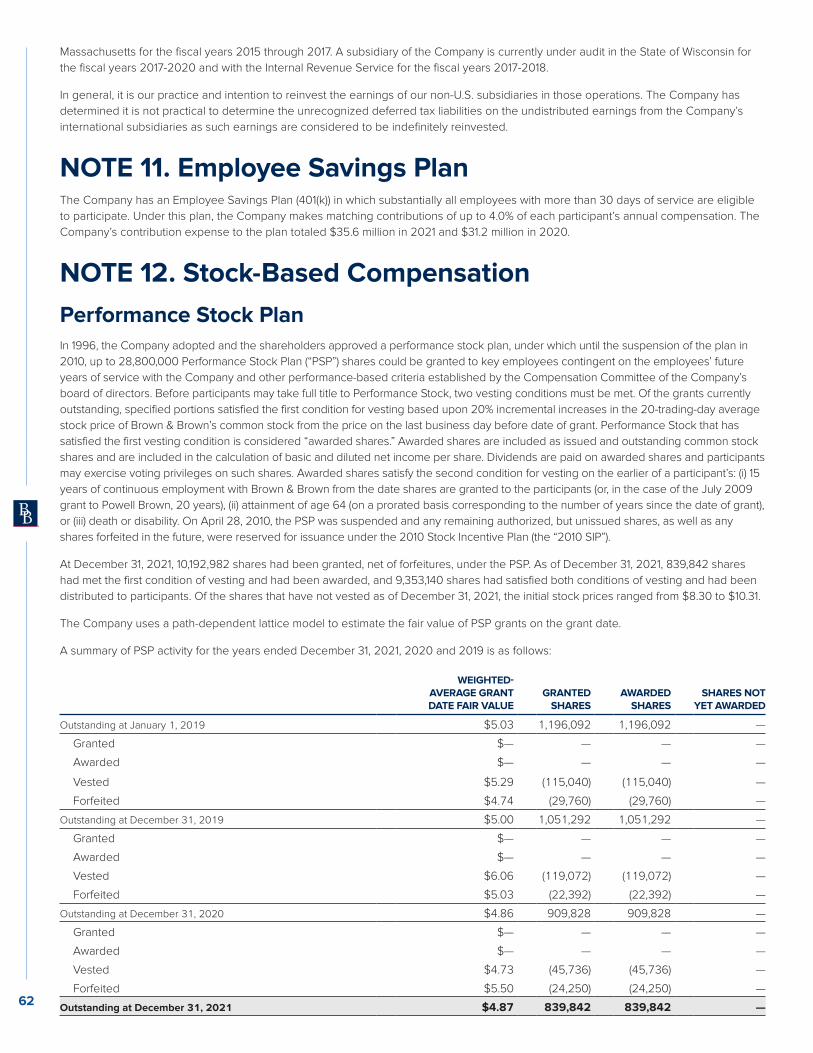
Massachusetts for the fiscal years 2015 through 2017. A subsidiary of the Company is currently under audit in the State of Wisconsin for
the fiscal years 2017-2020 and with the Internal Revenue Service for the fiscal years 2017-2018.
In general, it is our practice and intention to reinvest the earnings of our non-U.S. subsidiaries in those operations. The Company has
determined it is not practical to determine the unrecognized deferred tax liabilities on the undistributed earnings from the Company’s
international subsidiaries as such earnings are considered to be indefinitely reinvested.
NOTE 11. Employee Savings PlanThe Company has an Employee Savings Plan (401(k)) in which substantially all employees with more than 30 days of service are eligible
to participate. Under this plan, the Company makes matching contributions of up to 4.0% of each participant’s annual compensation. The
Company’s contribution expense to the plan totaled $35.6 million in 2021 and $31.2 million in 2020.
NOTE 12. Stock-Based Compensation
Performance Stock PlanIn 1996, the Company adopted and the shareholders approved a performance stock plan, under which until the suspension of the plan in
2010, up to 28,800,000 Performance Stock Plan (“PSP”) shares could be granted to key employees contingent on the employees’ future
years of service with the Company and other performance-based criteria established by the Compensation Committee of the Company’s
board of directors. Before participants may take full title to Performance Stock, two vesting conditions must be met. Of the grants currently
outstanding, specified portions satisfied the first condition for vesting based upon 20% incremental increases in the 20-trading-day average
stock price of Brown & Brown’s common stock from the price on the last business day before date of grant. Performance Stock that has
satisfied the first vesting condition is considered “awarded shares.” Awarded shares are included as issued and outstanding common stock
shares and are included in the calculation of basic and diluted net income per share. Dividends are paid on awarded shares and participants
may exercise voting privileges on such shares. Awarded shares satisfy the second condition for vesting on the earlier of a participant’s: (i) 15
years of continuous employment with Brown & Brown from the date shares are granted to the participants (or, in the case of the July 2009
grant to Powell Brown, 20 years), (ii) attainment of age 64 (on a prorated basis corresponding to the number of years since the date of grant),
or (iii) death or disability. On April 28, 2010, the PSP was suspended and any remaining authorized, but unissued shares, as well as any
shares forfeited in the future, were reserved for issuance under the 2010 Stock Incentive Plan (the “2010 SIP”).
At December 31, 2021, 10,192,982 shares had been granted, net of forfeitures, under the PSP. As of December 31, 2021, 839,842 shares
had met the first condition of vesting and had been awarded, and 9,353,140 shares had satisfied both conditions of vesting and had been
distributed to participants. Of the shares that have not vested as of December 31, 2021, the initial stock prices ranged from $8.30 to $10.31.
The Company uses a path-dependent lattice model to estimate the fair value of PSP grants on the grant date.
A summary of PSP activity for the years ended December 31, 2021, 2020 and 2019 is as follows:
WEIGHTED-AVERAGE GRANTDATE FAIR VALUE
GRANTEDSHARES
AWARDEDSHARES
SHARES NOTYET AWARDED
Outstanding at January 1, 2019 $5.03 1,196,092 1,196,092 —
Granted $— — — —
Awarded $— — — —
Vested $5.29 (115,040) (115,040) —
Forfeited $4.74 (29,760) (29,760) —
Outstanding at December 31, 2019 $5.00 1,051,292 1,051,292 —
Granted $— — — —
Awarded $— — — —
Vested $6.06 (119,072) (119,072) —
Forfeited $5.03 (22,392) (22,392) —
Outstanding at December 31, 2020 $4.86 909,828 909,828 —
Granted $— — — —
Awarded $— — — —
Vested $4.73 (45,736) (45,736) —
Forfeited $5.50 (24,250) (24,250) —
Outstanding at December 31, 2021 $4.87 839,842 839,842 —62
The total fair value of PSP grants that vested during each of the years ended December 31, 2021, 2020 and 2019 was $2.3 million,
$5.0 million and $3.5 million, respectively.
Stock Incentive PlansOn April 28, 2010, the shareholders of the Company approved the 2010 Stock Incentive Plan (“2010 SIP”), which was suspended May
1, 2019. On May 1, 2019, the shareholders of the Company approved the 2019 Stock Incentive Plan (“2019 SIP”) that provides for the
granting of restricted stock, restricted stock units, stock options, stock appreciation rights and other stock-based awards to employees
and directors contingent on performance-based and/or time-based criteria established by the Compensation Committee of the
Company’s board of directors. In addition, the 2019 SIP provides for a limited delegation of authority of the Company’s chief executive
officer to grant awards to individuals who are not subject to Section 16 of the Securities Exchange Act of 1934. The principal purpose of
the 2019 SIP is to attract, incentivize and retain key employees by offering those persons an opportunity to acquire or increase a direct
proprietary interest in the Company’s operations and future success. The number of shares of stock reserved for issuance under the
2019 SIP is 2,283,475 shares, plus any shares that are authorized for issuance under the 2010 SIP (described below), and not already
subject to grants under the 2010 SIP, and that were outstanding as of May 1, 2019, the date of suspension of the 2010 SIP, together with
PSP shares, 2010 SIP shares and 2019 SIP shares forfeited after that date. As of May 1, 2019, 6,957,897 shares were available for issuance
under the 2010 SIP, which were then transferred to the 2019 SIP.
The Company has granted restricted share awards (including both restricted stock and restricted stock units) to our employees in the
form of time-based grants and performance-based grants under the 2010 SIP and 2019 SIP. To date, a substantial majority of restricted
share grants to employees under these plans vest in 5 to 10 years. The performance-based grants are subject to the achievement
of certain performance criteria by grantees, which may include growth in a defined book of business, Organic Revenue growth and
operating profit growth of a profit center, Organic Revenue growth of the Company and consolidated diluted net income per share
growth at certain levels of the Company. The performance measurement period ranges from 3 to 5 years. Beginning in 2016, certain
performance-based grants have a payout range between 0% to 200% depending on the achievement against the stated performance
target. Prior to 2016, the majority of the grants had a binary performance measurement criteria that only allowed for 0% or 100% payout.
Non-employee members of the board of directors received shares annually issued pursuant to the 2010 SIP and 2019 SIP as part of their
annual compensation. A total of 27,885 shares were issued in April 2019, 16,490 shares were issued in May 2020 and 16,857 shares
were issued in May 2021.
The Company uses the closing stock price on the day before the grant date to determine the fair value of grants under the 2010 SIP
and 2019 SIP and then applies an estimated forfeiture factor to estimate the annual expense. Additionally, the Company uses the path-
dependent lattice model to estimate the fair value of grants with PSP-type vesting conditions as of the grant date. SIP shares that satisfied
the first vesting condition for PSP-type grants or the established performance criteria are considered awarded shares. Awarded shares are
included as issued and outstanding common stock shares and are included in the calculation of basic and diluted net income per share.
A summary of 2010 SIP and 2019 SIP activity for the years ended December 31, 2021, 2020 and 2019 is as follows:
WEIGHTED-AVERAGE GRANTDATE FAIR VALUE
GRANTEDSHARES
AWARDEDSHARES
SHARES NOTYET AWARDED
Outstanding at January 1, 2019 $16.69 11,102,375 6,595,319 4,507,056
Granted $28.53 1,812,047 797,778 1,014,269(1)
Awarded $17.26 299,339 1,954,983 (1,655,644)
Vested $14.29 (1,068,211) (1,068,211) —
Forfeited $19.09 (503,632) (209,293) (294,339)
Outstanding at December 31, 2019 $18.10 11,641,918 8,070,576 3,571,342
Granted $46.58 970,997 148,015 822,982(2)
Awarded $19.71 497,082 1,880,512 (1,383,430)
Vested $15.97 (3,059,619) (3,059,619) —
Forfeited $20.75 (356,041) (119,637) (236,404)
Outstanding at December 31, 2020 $19.89 9,694,337 6,919,847 2,774,490
Granted $46.05 1,143,094 204,826 938,268(3)
Awarded $25.80 310,147 1,272,554 (962,407)
Vested $15.73 (3,223,964) (3,223,964) —
Forfeited $30.54 (315,168) (147,702) (167,466)
Outstanding at December 31, 2021 $21.59 7,608,446 5,025,561 2,582,885
63
20
21
AN
NU
AL
RE
PO
RT
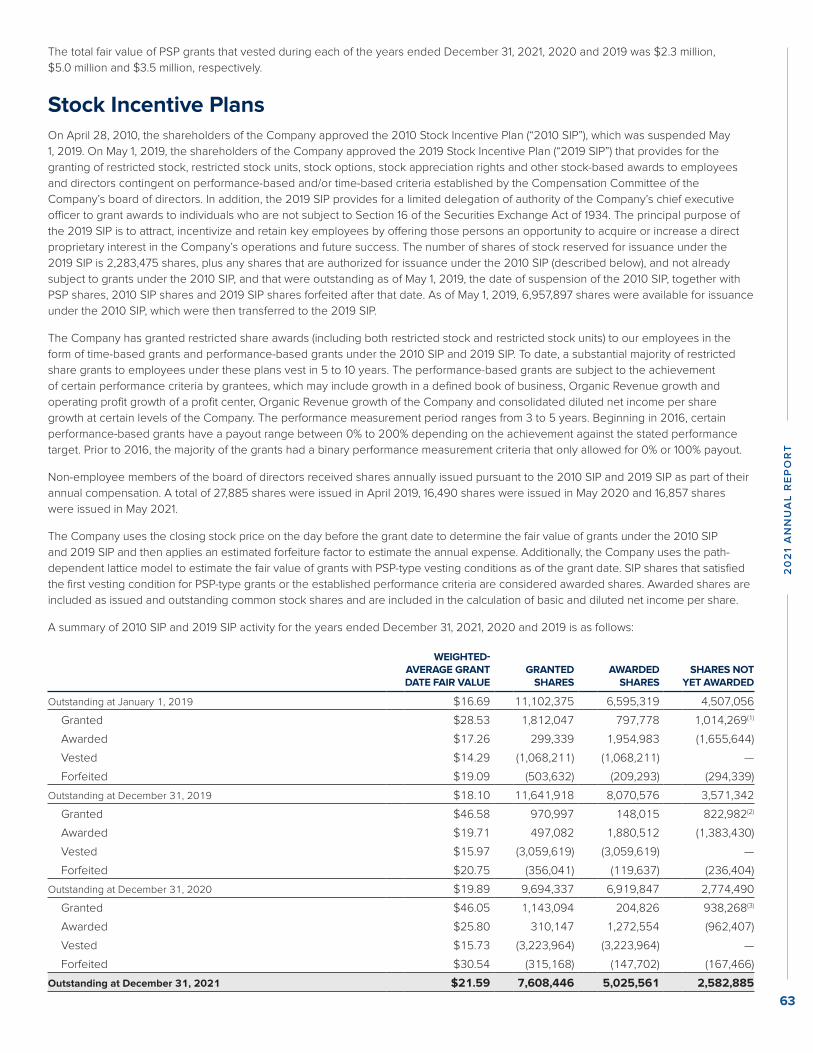
Massachusetts for the fiscal years 2015 through 2017. A subsidiary of the Company is currently under audit in the State of Wisconsin for
the fiscal years 2017-2020 and with the Internal Revenue Service for the fiscal years 2017-2018.
In general, it is our practice and intention to reinvest the earnings of our non-U.S. subsidiaries in those operations. The Company has
determined it is not practical to determine the unrecognized deferred tax liabilities on the undistributed earnings from the Company’s
international subsidiaries as such earnings are considered to be indefinitely reinvested.
NOTE 11. Employee Savings PlanThe Company has an Employee Savings Plan (401(k)) in which substantially all employees with more than 30 days of service are eligible
to participate. Under this plan, the Company makes matching contributions of up to 4.0% of each participant’s annual compensation. The
Company’s contribution expense to the plan totaled $35.6 million in 2021 and $31.2 million in 2020.
NOTE 12. Stock-Based Compensation
Performance Stock PlanIn 1996, the Company adopted and the shareholders approved a performance stock plan, under which until the suspension of the plan in
2010, up to 28,800,000 Performance Stock Plan (“PSP”) shares could be granted to key employees contingent on the employees’ future
years of service with the Company and other performance-based criteria established by the Compensation Committee of the Company’s
board of directors. Before participants may take full title to Performance Stock, two vesting conditions must be met. Of the grants currently
outstanding, specified portions satisfied the first condition for vesting based upon 20% incremental increases in the 20-trading-day average
stock price of Brown & Brown’s common stock from the price on the last business day before date of grant. Performance Stock that has
satisfied the first vesting condition is considered “awarded shares.” Awarded shares are included as issued and outstanding common stock
shares and are included in the calculation of basic and diluted net income per share. Dividends are paid on awarded shares and participants
may exercise voting privileges on such shares. Awarded shares satisfy the second condition for vesting on the earlier of a participant’s: (i) 15
years of continuous employment with Brown & Brown from the date shares are granted to the participants (or, in the case of the July 2009
grant to Powell Brown, 20 years), (ii) attainment of age 64 (on a prorated basis corresponding to the number of years since the date of grant),
or (iii) death or disability. On April 28, 2010, the PSP was suspended and any remaining authorized, but unissued shares, as well as any
shares forfeited in the future, were reserved for issuance under the 2010 Stock Incentive Plan (the “2010 SIP”).
At December 31, 2021, 10,192,982 shares had been granted, net of forfeitures, under the PSP. As of December 31, 2021, 839,842 shares
had met the first condition of vesting and had been awarded, and 9,353,140 shares had satisfied both conditions of vesting and had been
distributed to participants. Of the shares that have not vested as of December 31, 2021, the initial stock prices ranged from $8.30 to $10.31.
The Company uses a path-dependent lattice model to estimate the fair value of PSP grants on the grant date.
A summary of PSP activity for the years ended December 31, 2021, 2020 and 2019 is as follows:
WEIGHTED-AVERAGE GRANTDATE FAIR VALUE
GRANTEDSHARES
AWARDEDSHARES
SHARES NOTYET AWARDED
Outstanding at January 1, 2019 $5.03 1,196,092 1,196,092 —
Granted $— — — —
Awarded $— — — —
Vested $5.29 (115,040) (115,040) —
Forfeited $4.74 (29,760) (29,760) —
Outstanding at December 31, 2019 $5.00 1,051,292 1,051,292 —
Granted $— — — —
Awarded $— — — —
Vested $6.06 (119,072) (119,072) —
Forfeited $5.03 (22,392) (22,392) —
Outstanding at December 31, 2020 $4.86 909,828 909,828 —
Granted $— — — —
Awarded $— — — —
Vested $4.73 (45,736) (45,736) —
Forfeited $5.50 (24,250) (24,250) —
Outstanding at December 31, 2021 $4.87 839,842 839,842 —62
The total fair value of PSP grants that vested during each of the years ended December 31, 2021, 2020 and 2019 was $2.3 million,
$5.0 million and $3.5 million, respectively.
Stock Incentive PlansOn April 28, 2010, the shareholders of the Company approved the 2010 Stock Incentive Plan (“2010 SIP”), which was suspended May
1, 2019. On May 1, 2019, the shareholders of the Company approved the 2019 Stock Incentive Plan (“2019 SIP”) that provides for the
granting of restricted stock, restricted stock units, stock options, stock appreciation rights and other stock-based awards to employees
and directors contingent on performance-based and/or time-based criteria established by the Compensation Committee of the
Company’s board of directors. In addition, the 2019 SIP provides for a limited delegation of authority of the Company’s chief executive
officer to grant awards to individuals who are not subject to Section 16 of the Securities Exchange Act of 1934. The principal purpose of
the 2019 SIP is to attract, incentivize and retain key employees by offering those persons an opportunity to acquire or increase a direct
proprietary interest in the Company’s operations and future success. The number of shares of stock reserved for issuance under the
2019 SIP is 2,283,475 shares, plus any shares that are authorized for issuance under the 2010 SIP (described below), and not already
subject to grants under the 2010 SIP, and that were outstanding as of May 1, 2019, the date of suspension of the 2010 SIP, together with
PSP shares, 2010 SIP shares and 2019 SIP shares forfeited after that date. As of May 1, 2019, 6,957,897 shares were available for issuance
under the 2010 SIP, which were then transferred to the 2019 SIP.
The Company has granted restricted share awards (including both restricted stock and restricted stock units) to our employees in the
form of time-based grants and performance-based grants under the 2010 SIP and 2019 SIP. To date, a substantial majority of restricted
share grants to employees under these plans vest in 5 to 10 years. The performance-based grants are subject to the achievement
of certain performance criteria by grantees, which may include growth in a defined book of business, Organic Revenue growth and
operating profit growth of a profit center, Organic Revenue growth of the Company and consolidated diluted net income per share
growth at certain levels of the Company. The performance measurement period ranges from 3 to 5 years. Beginning in 2016, certain
performance-based grants have a payout range between 0% to 200% depending on the achievement against the stated performance
target. Prior to 2016, the majority of the grants had a binary performance measurement criteria that only allowed for 0% or 100% payout.
Non-employee members of the board of directors received shares annually issued pursuant to the 2010 SIP and 2019 SIP as part of their
annual compensation. A total of 27,885 shares were issued in April 2019, 16,490 shares were issued in May 2020 and 16,857 shares
were issued in May 2021.
The Company uses the closing stock price on the day before the grant date to determine the fair value of grants under the 2010 SIP
and 2019 SIP and then applies an estimated forfeiture factor to estimate the annual expense. Additionally, the Company uses the path-
dependent lattice model to estimate the fair value of grants with PSP-type vesting conditions as of the grant date. SIP shares that satisfied
the first vesting condition for PSP-type grants or the established performance criteria are considered awarded shares. Awarded shares are
included as issued and outstanding common stock shares and are included in the calculation of basic and diluted net income per share.
A summary of 2010 SIP and 2019 SIP activity for the years ended December 31, 2021, 2020 and 2019 is as follows:
WEIGHTED-AVERAGE GRANTDATE FAIR VALUE
GRANTEDSHARES
AWARDEDSHARES
SHARES NOTYET AWARDED
Outstanding at January 1, 2019 $16.69 11,102,375 6,595,319 4,507,056
Granted $28.53 1,812,047 797,778 1,014,269(1)
Awarded $17.26 299,339 1,954,983 (1,655,644)
Vested $14.29 (1,068,211) (1,068,211) —
Forfeited $19.09 (503,632) (209,293) (294,339)
Outstanding at December 31, 2019 $18.10 11,641,918 8,070,576 3,571,342
Granted $46.58 970,997 148,015 822,982(2)
Awarded $19.71 497,082 1,880,512 (1,383,430)
Vested $15.97 (3,059,619) (3,059,619) —
Forfeited $20.75 (356,041) (119,637) (236,404)
Outstanding at December 31, 2020 $19.89 9,694,337 6,919,847 2,774,490
Granted $46.05 1,143,094 204,826 938,268(3)
Awarded $25.80 310,147 1,272,554 (962,407)
Vested $15.73 (3,223,964) (3,223,964) —
Forfeited $30.54 (315,168) (147,702) (167,466)
Outstanding at December 31, 2021 $21.59 7,608,446 5,025,561 2,582,885
63
20
21
AN
NU
AL
RE
PO
RT
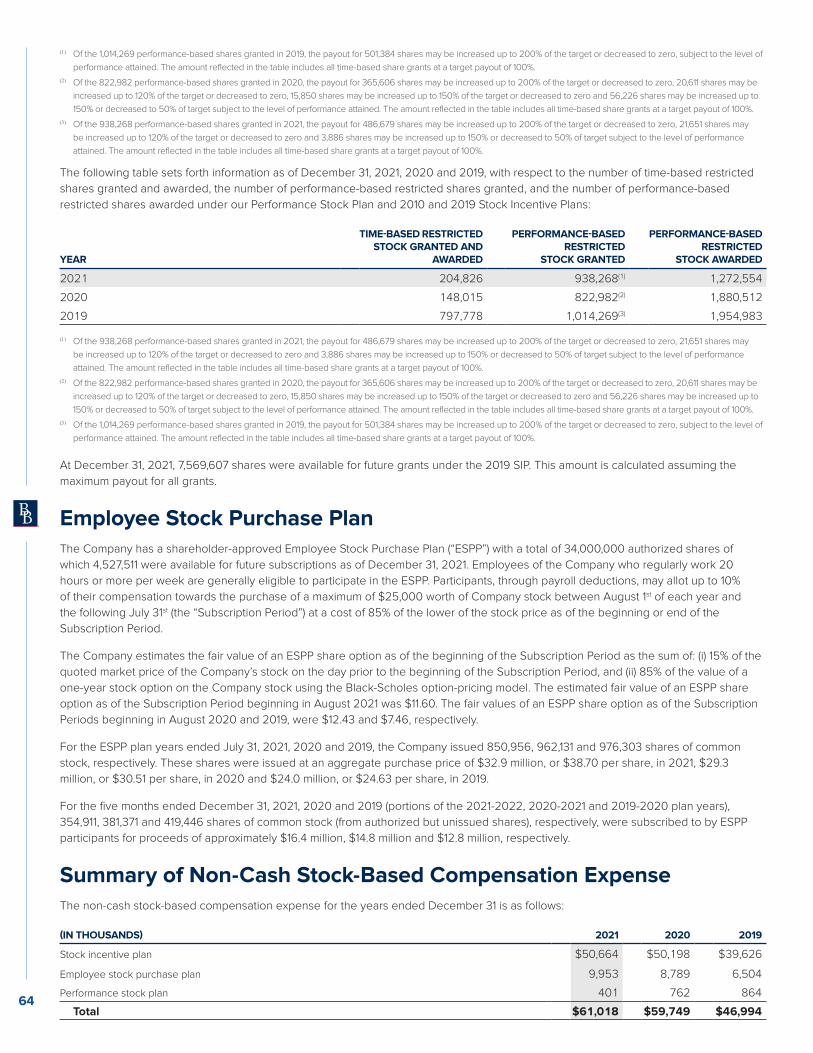
(1) Of the 1,014,269 performance-based shares granted in 2019, the payout for 501,384 shares may be increased up to 200% of the target or decreased to zero, subject to the level of
performance attained. The amount reflected in the table includes all time-based share grants at a target payout of 100%.
(2) Of the 822,982 performance-based shares granted in 2020, the payout for 365,606 shares may be increased up to 200% of the target or decreased to zero, 20,611 shares may be
increased up to 120% of the target or decreased to zero, 15,850 shares may be increased up to 150% of the target or decreased to zero and 56,226 shares may be increased up to
150% or decreased to 50% of target subject to the level of performance attained. The amount reflected in the table includes all time-based share grants at a target payout of 100%.
(3) Of the 938,268 performance-based shares granted in 2021, the payout for 486,679 shares may be increased up to 200% of the target or decreased to zero, 21,651 shares may
be increased up to 120% of the target or decreased to zero and 3,886 shares may be increased up to 150% or decreased to 50% of target subject to the level of performance
attained. The amount reflected in the table includes all time-based share grants at a target payout of 100%.
The following table sets forth information as of December 31, 2021, 2020 and 2019, with respect to the number of time-based restricted
shares granted and awarded, the number of performance-based restricted shares granted, and the number of performance-based
restricted shares awarded under our Performance Stock Plan and 2010 and 2019 Stock Incentive Plans:
YEAR
TIME-BASED RESTRICTEDSTOCK GRANTED AND
AWARDED
PERFORMANCE-BASEDRESTRICTED
STOCK GRANTED
PERFORMANCE-BASEDRESTRICTED
STOCK AWARDED
2021 204,826 938,268(1) 1,272,554
2020 148,015 822,982(2) 1,880,512
2019 797,778 1,014,269(3) 1,954,983
(1) Of the 938,268 performance-based shares granted in 2021, the payout for 486,679 shares may be increased up to 200% of the target or decreased to zero, 21,651 shares may
be increased up to 120% of the target or decreased to zero and 3,886 shares may be increased up to 150% or decreased to 50% of target subject to the level of performance
attained. The amount reflected in the table includes all time-based share grants at a target payout of 100%.
(2) Of the 822,982 performance-based shares granted in 2020, the payout for 365,606 shares may be increased up to 200% of the target or decreased to zero, 20,611 shares may be
increased up to 120% of the target or decreased to zero, 15,850 shares may be increased up to 150% of the target or decreased to zero and 56,226 shares may be increased up to
150% or decreased to 50% of target subject to the level of performance attained. The amount reflected in the table includes all time-based share grants at a target payout of 100%.
(3) Of the 1,014,269 performance-based shares granted in 2019, the payout for 501,384 shares may be increased up to 200% of the target or decreased to zero, subject to the level of
performance attained. The amount reflected in the table includes all time-based share grants at a target payout of 100%.
At December 31, 2021, 7,569,607 shares were available for future grants under the 2019 SIP. This amount is calculated assuming the
maximum payout for all grants.
Employee Stock Purchase PlanThe Company has a shareholder-approved Employee Stock Purchase Plan (“ESPP”) with a total of 34,000,000 authorized shares of
which 4,527,511 were available for future subscriptions as of December 31, 2021. Employees of the Company who regularly work 20
hours or more per week are generally eligible to participate in the ESPP. Participants, through payroll deductions, may allot up to 10%
of their compensation towards the purchase of a maximum of $25,000 worth of Company stock between August 1st of each year and
the following July 31st (the “Subscription Period”) at a cost of 85% of the lower of the stock price as of the beginning or end of the
Subscription Period.
The Company estimates the fair value of an ESPP share option as of the beginning of the Subscription Period as the sum of: (i) 15% of the
quoted market price of the Company’s stock on the day prior to the beginning of the Subscription Period, and (ii) 85% of the value of a
one-year stock option on the Company stock using the Black-Scholes option-pricing model. The estimated fair value of an ESPP share
option as of the Subscription Period beginning in August 2021 was $11.60. The fair values of an ESPP share option as of the Subscription
Periods beginning in August 2020 and 2019, were $12.43 and $7.46, respectively.
For the ESPP plan years ended July 31, 2021, 2020 and 2019, the Company issued 850,956, 962,131 and 976,303 shares of common
stock, respectively. These shares were issued at an aggregate purchase price of $32.9 million, or $38.70 per share, in 2021, $29.3
million, or $30.51 per share, in 2020 and $24.0 million, or $24.63 per share, in 2019.
For the five months ended December 31, 2021, 2020 and 2019 (portions of the 2021-2022, 2020-2021 and 2019-2020 plan years),
354,911, 381,371 and 419,446 shares of common stock (from authorized but unissued shares), respectively, were subscribed to by ESPP
participants for proceeds of approximately $16.4 million, $14.8 million and $12.8 million, respectively.
Summary of Non-Cash Stock-Based Compensation ExpenseThe non-cash stock-based compensation expense for the years ended December 31 is as follows:
(IN THOUSANDS) 2021 2020 2019
Stock incentive plan $50,664 $50,198 $39,626
Employee stock purchase plan 9,953 8,789 6,504
Performance stock plan 401 762 864
Total $61,018 $59,749 $46,99464
Summary of Unamortized Compensation ExpenseAs of December 31, 2021, the Company estimates there to be $135.1 million of unamortized compensation expense related to all non-
vested stock-based compensation arrangements granted under the Company’s stock-based compensation plans, based upon current
projections of grant measurement against performance criteria. That expense is expected to be recognized over a weighted average
period of 3.36 years.
NOTE 13. Supplemental Disclosures of Cash Flow Information and Non-Cash Financing and Investing ActivitiesThroughout 2020, the Company deferred $31.1 million in employer-only payroll tax payments as allowed under the Coronavirus Aid, Relief,
and Economic Security Act (the “CARES” Act), which was signed into law on March 27, 2020. During 2021, there were no additional deferrals
under the CARES Act. The Company paid the first installment of $15.6 million in December 2021. The remaining balance of approximately
$15.6 million of deferred employer payroll tax payments related to the CARES Act is expected to be paid in December 2022.
During the second quarter of 2021, the Company received an $8.1 million reimbursement for capitalizable costs of public infrastructure
improvements related to the construction of the Company’s headquarters in accordance with an economic development grant
agreement between the Company and the City of Daytona Beach and Volusia County. The reimbursement has been reflected as a
reduction to the additions to fixed asset line item on the Consolidated Statements of Cash Flows for the year ended December 31, 2021.
The Company’s cash paid during the period for interest and income taxes are summarized as follows:
YEAR ENDED DECEMBER 31,
(IN THOUSANDS) 2021 2020 2019
Cash paid during the period for:
Interest $61,531 $52,378 $58,290
Income taxes, net of refunds $146,932 $131,596 $109,766
The Company’s significant non-cash investing and financing activities are summarized as follows:
YEAR ENDED DECEMBER 31,
(IN THOUSANDS) 2021 2020 2019
Other payables issued for agency acquisitions and purchased customer accounts $15,072 $9,130 $12,135
Estimated acquisition earn-out payables and related charges $75,761 $131,397 $82,872
Contingent payable issued for agency acquisition $24,114 $— $—
Common stock issued for agency acquisition $9,892 $— $—
Notes payable assumed for agency acquisition $1,355 $— $—
Notes received on the sale of fixed assets and customer accounts $— $— $9,903
Our Restricted Cash balance is composed of funds held in separate premium trust accounts as required by state law or, in some cases,
per agreement with our carrier partners. The following is a reconciliation of cash and cash equivalents inclusive of restricted cash as of
December 31, 2021, 2020 and 2019.
BALANCE AS OF DECEMBER 31,
(IN THOUSANDS) 2021 2020 2019
Table to reconcile cash and cash equivalents inclusive of restricted cash
Cash and cash equivalents $887,009 $817,398 $542,174
Restricted cash 583,247 454,517 420,801
Total cash and cash equivalents inclusive of restricted cash at the end of the period $1,470,256 $1,271,915 $962,975
65
20
21
AN
NU
AL
RE
PO
RT
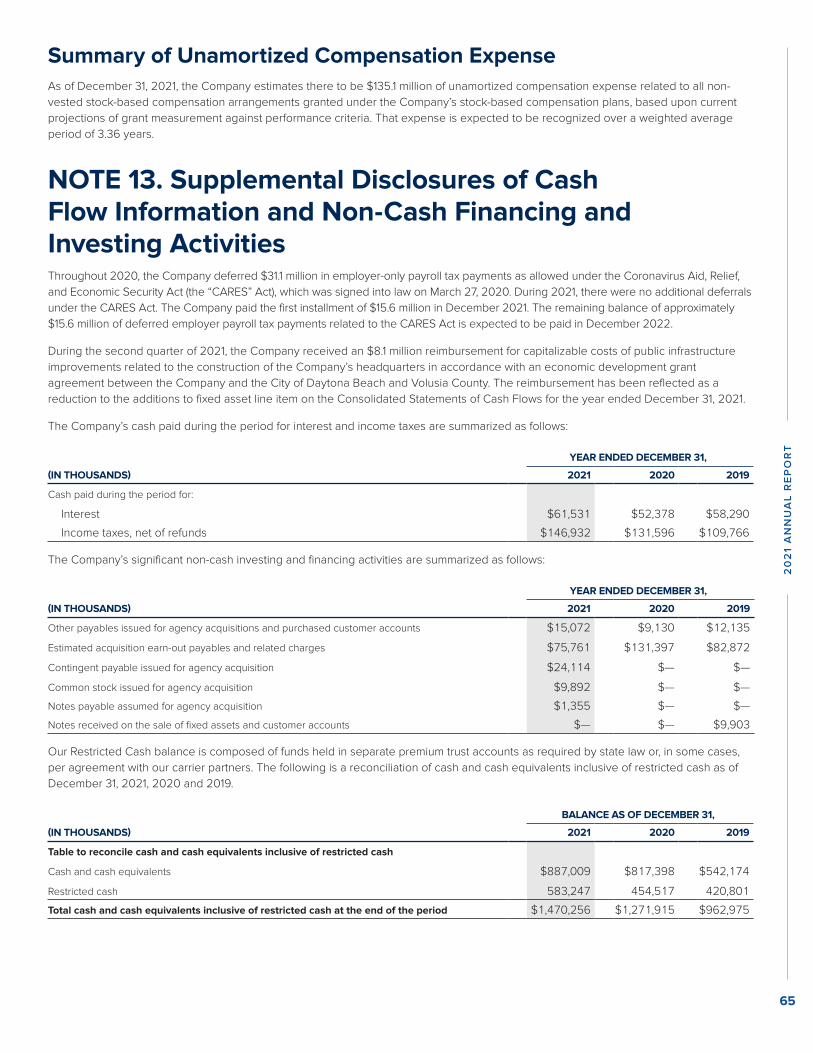
(1) Of the 1,014,269 performance-based shares granted in 2019, the payout for 501,384 shares may be increased up to 200% of the target or decreased to zero, subject to the level of
performance attained. The amount reflected in the table includes all time-based share grants at a target payout of 100%.
(2) Of the 822,982 performance-based shares granted in 2020, the payout for 365,606 shares may be increased up to 200% of the target or decreased to zero, 20,611 shares may be
increased up to 120% of the target or decreased to zero, 15,850 shares may be increased up to 150% of the target or decreased to zero and 56,226 shares may be increased up to
150% or decreased to 50% of target subject to the level of performance attained. The amount reflected in the table includes all time-based share grants at a target payout of 100%.
(3) Of the 938,268 performance-based shares granted in 2021, the payout for 486,679 shares may be increased up to 200% of the target or decreased to zero, 21,651 shares may
be increased up to 120% of the target or decreased to zero and 3,886 shares may be increased up to 150% or decreased to 50% of target subject to the level of performance
attained. The amount reflected in the table includes all time-based share grants at a target payout of 100%.
The following table sets forth information as of December 31, 2021, 2020 and 2019, with respect to the number of time-based restricted
shares granted and awarded, the number of performance-based restricted shares granted, and the number of performance-based
restricted shares awarded under our Performance Stock Plan and 2010 and 2019 Stock Incentive Plans:
YEAR
TIME-BASED RESTRICTEDSTOCK GRANTED AND
AWARDED
PERFORMANCE-BASEDRESTRICTED
STOCK GRANTED
PERFORMANCE-BASEDRESTRICTED
STOCK AWARDED
2021 204,826 938,268(1) 1,272,554
2020 148,015 822,982(2) 1,880,512
2019 797,778 1,014,269(3) 1,954,983
(1) Of the 938,268 performance-based shares granted in 2021, the payout for 486,679 shares may be increased up to 200% of the target or decreased to zero, 21,651 shares may
be increased up to 120% of the target or decreased to zero and 3,886 shares may be increased up to 150% or decreased to 50% of target subject to the level of performance
attained. The amount reflected in the table includes all time-based share grants at a target payout of 100%.
(2) Of the 822,982 performance-based shares granted in 2020, the payout for 365,606 shares may be increased up to 200% of the target or decreased to zero, 20,611 shares may be
increased up to 120% of the target or decreased to zero, 15,850 shares may be increased up to 150% of the target or decreased to zero and 56,226 shares may be increased up to
150% or decreased to 50% of target subject to the level of performance attained. The amount reflected in the table includes all time-based share grants at a target payout of 100%.
(3) Of the 1,014,269 performance-based shares granted in 2019, the payout for 501,384 shares may be increased up to 200% of the target or decreased to zero, subject to the level of
performance attained. The amount reflected in the table includes all time-based share grants at a target payout of 100%.
At December 31, 2021, 7,569,607 shares were available for future grants under the 2019 SIP. This amount is calculated assuming the
maximum payout for all grants.
Employee Stock Purchase PlanThe Company has a shareholder-approved Employee Stock Purchase Plan (“ESPP”) with a total of 34,000,000 authorized shares of
which 4,527,511 were available for future subscriptions as of December 31, 2021. Employees of the Company who regularly work 20
hours or more per week are generally eligible to participate in the ESPP. Participants, through payroll deductions, may allot up to 10%
of their compensation towards the purchase of a maximum of $25,000 worth of Company stock between August 1st of each year and
the following July 31st (the “Subscription Period”) at a cost of 85% of the lower of the stock price as of the beginning or end of the
Subscription Period.
The Company estimates the fair value of an ESPP share option as of the beginning of the Subscription Period as the sum of: (i) 15% of the
quoted market price of the Company’s stock on the day prior to the beginning of the Subscription Period, and (ii) 85% of the value of a
one-year stock option on the Company stock using the Black-Scholes option-pricing model. The estimated fair value of an ESPP share
option as of the Subscription Period beginning in August 2021 was $11.60. The fair values of an ESPP share option as of the Subscription
Periods beginning in August 2020 and 2019, were $12.43 and $7.46, respectively.
For the ESPP plan years ended July 31, 2021, 2020 and 2019, the Company issued 850,956, 962,131 and 976,303 shares of common
stock, respectively. These shares were issued at an aggregate purchase price of $32.9 million, or $38.70 per share, in 2021, $29.3
million, or $30.51 per share, in 2020 and $24.0 million, or $24.63 per share, in 2019.
For the five months ended December 31, 2021, 2020 and 2019 (portions of the 2021-2022, 2020-2021 and 2019-2020 plan years),
354,911, 381,371 and 419,446 shares of common stock (from authorized but unissued shares), respectively, were subscribed to by ESPP
participants for proceeds of approximately $16.4 million, $14.8 million and $12.8 million, respectively.
Summary of Non-Cash Stock-Based Compensation ExpenseThe non-cash stock-based compensation expense for the years ended December 31 is as follows:
(IN THOUSANDS) 2021 2020 2019
Stock incentive plan $50,664 $50,198 $39,626
Employee stock purchase plan 9,953 8,789 6,504
Performance stock plan 401 762 864
Total $61,018 $59,749 $46,99464
Summary of Unamortized Compensation ExpenseAs of December 31, 2021, the Company estimates there to be $135.1 million of unamortized compensation expense related to all non-
vested stock-based compensation arrangements granted under the Company’s stock-based compensation plans, based upon current
projections of grant measurement against performance criteria. That expense is expected to be recognized over a weighted average
period of 3.36 years.
NOTE 13. Supplemental Disclosures of Cash Flow Information and Non-Cash Financing and Investing ActivitiesThroughout 2020, the Company deferred $31.1 million in employer-only payroll tax payments as allowed under the Coronavirus Aid, Relief,
and Economic Security Act (the “CARES” Act), which was signed into law on March 27, 2020. During 2021, there were no additional deferrals
under the CARES Act. The Company paid the first installment of $15.6 million in December 2021. The remaining balance of approximately
$15.6 million of deferred employer payroll tax payments related to the CARES Act is expected to be paid in December 2022.
During the second quarter of 2021, the Company received an $8.1 million reimbursement for capitalizable costs of public infrastructure
improvements related to the construction of the Company’s headquarters in accordance with an economic development grant
agreement between the Company and the City of Daytona Beach and Volusia County. The reimbursement has been reflected as a
reduction to the additions to fixed asset line item on the Consolidated Statements of Cash Flows for the year ended December 31, 2021.
The Company’s cash paid during the period for interest and income taxes are summarized as follows:
YEAR ENDED DECEMBER 31,
(IN THOUSANDS) 2021 2020 2019
Cash paid during the period for:
Interest $61,531 $52,378 $58,290
Income taxes, net of refunds $146,932 $131,596 $109,766
The Company’s significant non-cash investing and financing activities are summarized as follows:
YEAR ENDED DECEMBER 31,
(IN THOUSANDS) 2021 2020 2019
Other payables issued for agency acquisitions and purchased customer accounts $15,072 $9,130 $12,135
Estimated acquisition earn-out payables and related charges $75,761 $131,397 $82,872
Contingent payable issued for agency acquisition $24,114 $— $—
Common stock issued for agency acquisition $9,892 $— $—
Notes payable assumed for agency acquisition $1,355 $— $—
Notes received on the sale of fixed assets and customer accounts $— $— $9,903
Our Restricted Cash balance is composed of funds held in separate premium trust accounts as required by state law or, in some cases,
per agreement with our carrier partners. The following is a reconciliation of cash and cash equivalents inclusive of restricted cash as of
December 31, 2021, 2020 and 2019.
BALANCE AS OF DECEMBER 31,
(IN THOUSANDS) 2021 2020 2019
Table to reconcile cash and cash equivalents inclusive of restricted cash
Cash and cash equivalents $887,009 $817,398 $542,174
Restricted cash 583,247 454,517 420,801
Total cash and cash equivalents inclusive of restricted cash at the end of the period $1,470,256 $1,271,915 $962,975
65
20
21
AN
NU
AL
RE
PO
RT
NOTE 14. Commitments and Contingencies
Legal ProceedingsThe Company records losses for claims in excess of the limits of, or outside the coverage of, applicable insurance at the time and to the
extent they are probable and estimable. In accordance with ASC Topic 450-Contingencies, the Company accrues anticipated costs of
settlement, damages, losses for liability claims and, under certain conditions, costs of defense, based upon historical experience or to the
extent specific losses are probable and estimable. Otherwise, the Company expenses these costs as incurred. If the best estimate of a
probable loss is a range rather than a specific amount, the Company accrues the amount at the lower end of the range.
The Company’s accruals for legal matters that were probable and estimable were not material at December 31, 2021 and 2020. We
continue to assess certain litigation and claims to determine the amounts, if any, that management believes will be paid as a result of
such claims and litigation and, therefore, additional losses may be accrued and paid in the future, which could adversely impact the
Company’s operating results, cash flows and overall liquidity. The Company maintains third-party insurance policies to provide coverage
for certain legal claims, in an effort to mitigate its overall exposure to unanticipated claims or adverse decisions. However, as (i) one
or more of the Company’s insurance carriers could take the position that portions of these claims are not covered by the Company’s
insurance, (ii) to the extent that payments are made to resolve claims and lawsuits, applicable insurance policy limits are eroded and (iii)
the claims and lawsuits relating to these matters are continuing to develop, it is possible that future results of operations or cash flows for
any particular quarterly or annual period could be materially affected by unfavorable resolutions of these matters. Based upon the AM
Best Company ratings of these third-party insurers, management does not believe there is a substantial risk of an insurer’s material non-
performance related to any current insured claims.
On the basis of current information, the availability of insurance and legal advice, in management’s opinion, the Company is not currently
involved in any legal proceedings which, individually or in the aggregate, would have a material adverse effect on its financial condition,
operations and/or cash flows.
NOTE 15. LeasesSubstantially all of the Company’s leases are classified as operating leases and primarily represent real estate leases for office space
used to conduct the Company’s business that expire on various dates through 2041. Leases generally contain renewal options and
escalation clauses based upon increases in the lessors’ operating expenses and other charges. The Company anticipates that most of
these leases will be renewed or replaced upon expiration.
The Company assesses at inception of a contract if it contains a lease. This assessment is based on: (i) whether the contract involves the
use of a distinct identified asset, (ii) whether the Company obtains the right to substantially all the economic benefit from the use of the
asset throughout the period, and (iii) whether the Company has the right to direct the use of the asset.
The right-of-use asset is initially measured at cost, which is primarily composed of the initial lease liability, plus any initial direct costs
incurred, less any lease incentives received. The lease liability is initially measured at the present value of the minimum lease payments
through the term of the lease. Minimum lease payments are discounted to present value using the incremental borrowing rate at the
lease commencement date, which approximates the rate of interest the Company expects to be paid on a secured borrowing in an
amount equal to the lease payments for the underlying asset under similar terms and economic conditions. The Company elected not to
recognize right-of-use assets and lease liabilities for short-term leases that have a total term of 12 months or less. The effect of short-
term leases on the Company’s right-of-use asset and lease liability would not be significant. The balances and classification of operating
lease right-of-use assets and operating lease liabilities within the Consolidated Balance Sheets as of December 31, 2021 and 2020 is
as follows:
(IN THOUSANDS)DECEMBER 31,
2021DECEMBER 31,
2020
BALANCE SHEET
Assets:
Operating lease right-of-use assets $197,035 $186,998
Total assets Operating lease assets 197,035 186,998
Liabilities:
Current operating lease liabilities Accrued expenses and other liabilities 43,441 43,542
Non-current operating lease liabilities Operating lease liabilities 179,976 172,935
Total liabilities $223,417 $216,477
66
As of December 31, 2021, the Company has entered into future lease agreements expected to commence in 2022 consisting of
undiscounted lease liabilities of $18.8 million.
Variable lease cost represents lease payments that are based on an index or similar rate. They are initially measured using the index or
rate in effect at lease commencement and are based on the minimum payments stated in the lease. Additional payments based on the
change in an index or rate, or payments based on a change in the Company’s portion of the operating expenses, including real estate
taxes and insurance, are recorded as a period expense when incurred.
Lease expense for operating leases consists of the lease payments, inclusive of lease incentives, plus any initial direct costs, and is
recognized on a straight-line basis over the lease term. Included in lease expense are any variable lease payments incurred in the period
that were not included in the initial lease liability.
The components of lease cost for operating leases for the 12 months ended December 31, 2021 and 2020 were:
(IN THOUSANDS)FOR THE YEAR ENDED
DECEMBER 31, 2021FOR THE YEAR ENDED
DECEMBER 31, 2020
Operating leases:
Lease cost $52,751 $53,821
Variable lease cost 4,316 3,739
Short term lease cost 1,165 468
Operating lease cost 58,232 58,028
Sublease income (1,661) (1,798)
Total lease cost net $56,571 $56,230
The weighted average remaining lease term and the weighted average discount rate for operating leases as of December 31, 2021 were:
Weighted-average remaining lease term 6.47
Weighted-average discount rate 2.72
Maturities of the operating lease liabilities by fiscal year at December 31, 2021 for the Company’s operating leases are as follows:
(IN THOUSANDS) OPERATING LEASES
2022 $48,743
2023 44,794
2024 37,996
2025 31,587
2026 22,511
Thereafter 56,416
Total undiscounted lease payments 242,047
Less: Imputed interest 18,630
Present value of future lease payments $223,417
Supplemental cash flow information for operating leases:
(IN THOUSANDS)FOR THE YEAR ENDED
DECEMBER 31, 2021FOR THE YEAR ENDED
DECEMBER 31, 2020
Cash paid for amounts included in measurement of liabilities
Operating cash flows from operating leases $56,034 $54,946
Right-of-use assets obtained in exchange for new operating liabilities $53,978 $45,750
NOTE 16. Segment InformationBrown & Brown’s business is divided into four reportable segments: (i) the Retail segment, which provides a broad range of insurance
products and services to commercial, public and quasi-public entities, and to professional and individual customers, and non-insurance
risk-mitigating products through our F&I businesses, (ii) the National Programs segment, which acts as an MGA, provides professional
liability and related package products for certain professionals, a range of insurance products for individuals, flood coverage, and
targeted products and services designated for specific industries, trade groups, governmental entities and market niches, all of which are 67
20
21
AN
NU
AL
RE
PO
RT

delivered through nationwide networks of independent agents, and Brown & Brown retail agents, (iii) the Wholesale Brokerage segment,
which markets and sells excess and surplus commercial and personal lines insurance, primarily through independent agents and brokers,
as well as Brown & Brown retail agents, and (iv) the Services segment, which provides insurance-related services, including third-party
claims administration and comprehensive medical utilization management services in both the workers’ compensation and all-lines
liability arenas, as well as Medicare Set-aside services, Social Security disability and Medicare benefits advocacy services and claims
adjusting services.
Brown & Brown conducts all of its operations within the United States of America, except for a wholesale brokerage operation based in
London, England, retail operations in Ireland, Bermuda and the Cayman Islands, and a national programs operation in Canada. These
operations earned $78.0 million, $35.1 million and $17.7 million of total revenues for the years ended December 31, 2021, 2020 and 2019,
respectively. Long-lived assets held outside of the United States during each of these three years were not material.
The accounting policies of the reportable segments are the same as those described in Note 1. The Company evaluates the performance
of its segments based upon revenues and income before income taxes. Intersegment revenues are eliminated.
Summarized financial information concerning the Company’s reportable segments is shown in the following table. The “Other” column
includes any income and expenses not allocated to reportable segments and corporate-related items, including the intercompany
interest expense charge to the reporting segment.
YEAR ENDED DECEMBER 31, 2021
(IN THOUSANDS) RETAILNATIONAL
PROGRAMSWHOLESALEBROKERAGE SERVICES OTHER TOTAL
Total revenues $1,767,938 $701,850 $403,417 $178,860 $(667) $3,051,398
Investment income $278 $550 $155 $3 $113 $1,099
Amortization $77,810 $27,357 $9,150 $5,276 $— $119,593
Depreciation $11,194 $9,839 $2,646 $1,484 $8,146 $33,309
Interest expense $91,425 $11,381 $15,990 $2,899 $(56,714) $64,981
Income before income taxes $334,377 $242,334 $94,845 $28,257 $63,010 $762,823
Total assets $5,040,706 $2,943,006 $1,154,373 $299,185 $358,173 $9,795,443
Capital expenditures $8,093 $13,467 $1,612 $1,609 $20,264 $45,045
YEAR ENDED DECEMBER 31, 2020
(IN THOUSANDS) RETAILNATIONAL
PROGRAMSWHOLESALEBROKERAGE SERVICES OTHER TOTAL
Total revenues $1,472,766 $610,640 $352,797 $174,012 $3,160 $2,613,375
Investment income $163 $756 $184 $— $1,708 $2,811
Amortization $67,315 $27,166 $8,481 $5,561 $— $108,523
Depreciation $9,071 $8,658 $1,948 $1,424 $5,175 $26,276
Interest expense $85,968 $20,597 $10,281 $4,142 $(62,015) $58,973
Income before income taxes $262,245 $182,892 $93,593 $27,994 $57,375 $624,099
Total assets $7,093,627 $3,510,983 $1,791,717 $480,440 $(3,910,275) $8,966,492
Capital expenditures $13,175 $7,208 $3,324 $1,424 $45,569 $70,700
YEAR ENDED DECEMBER 31, 2019
(IN THOUSANDS) RETAILNATIONAL
PROGRAMSWHOLESALEBROKERAGE SERVICES OTHER TOTAL
Total revenues $1,367,261 $518,384 $310,087 $193,781 $2,658 $2,392,171
Investment income $149 $1,397 $178 $139 $3,917 $5,780
Amortization $63,146 $25,482 $11,191 $5,479 $— $105,298
Depreciation $7,390 $6,791 $1,674 $1,229 $6,333 $23,417
Interest expense $87,295 $16,690 $4,756 $4,404 $(49,485) $63,660
Income before income taxes $222,875 $143,737 $82,739 $40,337 $36,241 $525,929
Total assets $6,413,459 $3,110,368 $1,390,250 $481,336 $(3,772,592) $7,622,821
Capital expenditures $12,497 $10,365 $6,171 $804 $43,271 $73,108
68
Historically, the total assets balance in the “Other” column has been negative, reflecting the historical accumulation of the purchase price
for acquisitions which are funded at the corporate level, net of a portion returned to Corporate through intercompany interest charges,
as well as the historical accumulation of payments for income taxes, dividends, and share repurchases which are paid by Corporate, but
not pushed down to the segments. As of December 31, 2021, the Company settled the historical accumulation of the cash outlays paid by
Corporate that gave rise to the related intercompany receivables and payables to better reflect the total assets of each segment.
NOTE 17. Insurance Company WNFICAlthough the reinsurers are liable to the Company for amounts reinsured, our subsidiary, WNFIC remains primarily liable to its
policyholders for the full amount of the policies written whether or not the reinsurers meet their obligations to the Company when they
become due. The effects of reinsurance on premiums written and earned at December 31 are as follows:
2021 2020
(IN THOUSANDS) WRITTEN EARNED WRITTEN EARNED
Direct premiums $747,384 $732,777 $728,109 $716,515
Assumed premiums — — — —
Ceded premiums 747,366 732,759 728,093 716,499
Net premiums $18 $18 $16 $16
All premiums written by WNFIC under the National Flood Insurance Program are 100.0% ceded to FEMA, for which WNFIC received
a 30.0% expense allowance from January 1, 2021 through September 30, 2021 and a 29.9% expense allowance from October 1, 2021
through December 31, 2021. As of December 31, 2021 and 2020, the Company ceded $745.0 million and $725.8 million of written
premiums for Federal Flood, respectively.
As of December 31, 2021, the Consolidated Balance Sheets contained Reinsurance recoverable of $63.1 million and Prepaid reinsurance
premiums of $392.2 million. As of December 31, 2020, the Consolidated Balance Sheets contained reinsurance recoverable of $43.5
million and prepaid reinsurance premiums of $377.6 million. There was no net activity in the reserve for losses and loss adjustment
expense for the years ended December 31, 2021 and 2020, as WNFIC’s direct premiums written were 100.0% ceded to two reinsurers.
The balance of the reserve for losses and loss adjustment expense, excluding related reinsurance recoverables was $63.1 million as of
December 31, 2021 and $43.5 million as of December 31, 2020.
WNFIC maintains capital in excess of minimum statutory amount of $7.5 million as required by regulatory authorities. The statutory
capital and surplus of WNFIC was $33.1 million as of December 31, 2021 and $32.6 million as of December 31, 2020. As of December 31,
2021 and 2020, WNFIC generated statutory net income of $1.6 million and $0.8 million, respectively. The maximum amount of ordinary
dividends that WNFIC can pay to shareholders in a rolling 12 month period is limited to the greater of 10.0% of statutory adjusted capital
and surplus of 100.0% of adjusted net income. There was no dividend payout in 2020 and 2021 and the maximum dividend payout that
may be made in 2022 without prior approval is $3.3 million.
NOTE 18. Shareholders’ EquityUnder the authorization from the Company’s board of directors, shares may be purchased from time to time, at the Company’s discretion
and subject to the availability of stock, market conditions, the trading price of the stock, alternative uses for capital, the Company’s
financial performance and other potential factors. These purchases may be carried out through open market purchases, block trades,
accelerated share repurchase plans of up to $100.0 million each (unless otherwise approved by the board of directors), negotiated
private transactions or pursuant to any trading plan that may be adopted in accordance with Rule 10b5-1 of the Securities Exchange Act of
1934. On May 1, 2019, the Company’s board of directors authorized the purchasing of up to an additional $372.5 million of the Company’s
outstanding common stock.
During 2021, the Company repurchased 1,811,853 shares at an average price of $45.57 for a total cost of $82.6 million under the current
share repurchase authorization. During 2020, the Company repurchased 1,234,417 shares at an average price of $44.63 for a total cost
of $55.1 million under the current share repurchase authorization. At December 31, 2021, the remaining amount authorized by our board
of directors for share repurchases was approximately $323.6 million. Under the authorized repurchase programs, the Company has
repurchased approximately 18.5 million shares for an aggregate cost of approximately $673.9 million between 2014 and 2021.
During 2021, the Company paid an annualized dividend of $0.380 per share for a total of $107.2 million in annualized dividends paid.
During 2020, the Company paid an annualized dividend of $0.348 per share for a total $100.6 million in annualized dividends paid. On
January 20, 2022 the board of directors approved a dividend of $0.1025 per share payable on February 16, 2022 to shareholders of
record on February 4, 2022.
During 2021, the Company issued 184,772 shares valued at $9.9 million associated with business combinations. During 2020, the
Company issued 722,939 shares valued at $30.1 million associated with business combinations.
69
20
21
AN
NU
AL
RE
PO
RT
Report of Independent Registered Public Accounting Firm
To the shareholders and the Board of Directors of Brown &
Brown, Inc.
Opinion on the Financial Statements
We have audited the accompanying consolidated balance
sheets of Brown & Brown, Inc. and subsidiaries (the “Company”)
as of December 31, 2021 and 2020, the related consolidated
statements of income, comprehensive income, shareholders’
equity, and cash flows, for each of the three years in the period
ended December 31, 2021, and the related notes (collectively
referred to as the “financial statements”). In our opinion, the
financial statements present fairly, in all material respects, the
financial position of the Company as of December 31, 2021 and
2020, and the results of its operations and its cash flows for each
of the three years in the period ended December 31, 2021, in
conformity with accounting principles generally accepted in the
United States of America.
We have also audited, in accordance with the standards of the
Public Company Accounting Oversight Board (United States)
(PCAOB), the Company’s internal control over financial reporting
as of December 31, 2021, based on criteria established in Internal Control — Integrated Framework (2013) issued by the Committee
of Sponsoring Organizations of the Treadway Commission and
our report dated February 22, 2022 expressed an unqualified
opinion on the Company’s internal control over financial reporting.
Basis for Opinion
These financial statements are the responsibility of the Company’s
management. Our responsibility is to express an opinion on
the Company’s financial statements based on our audits. We
are a public accounting firm registered with the PCAOB and
are required to be independent with respect to the Company
in accordance with the U.S. federal securities laws and the
applicable rules and regulations of the Securities and Exchange
Commission and the PCAOB.
We conducted our audits in accordance with the standards of the
PCAOB. Those standards require that we plan and perform the
audit to obtain reasonable assurance about whether the financial
statements are free of material misstatement, whether due to error
or fraud. Our audits included performing procedures to assess the
risks of material misstatement of the financial statements, whether
due to error or fraud, and performing procedures that respond to
those risks. Such procedures included examining, on a test basis,
evidence regarding the amounts and disclosures in the financial
statements. Our audits also included evaluating the accounting
principles used and significant estimates made by management,
as well as evaluating the overall presentation of the financial
statements. We believe that our audits provide a reasonable basis
for our opinion.
Critical Audit Matter
The critical audit matter communicated below is a matter arising
from the current-period audit of the financial statements that
was communicated or required to be communicated to the
audit committee and that (1) relates to accounts or disclosures
that are material to the financial statements and (2) involved our
especially challenging, subjective, or complex judgments. The
communication of critical audit matters does not alter in any way
our opinion on the financial statements, taken as a whole, and
we are not, by communicating the critical audit matter below,
providing a separate opinion on the critical audit matter or on the
accounts or disclosures to which it relates.
Earn-out obligation — Refer to Notes 1 (Goodwill
and Amortizable Intangible Assets) and 3 (Business
Combinations) to the financial statements
Critical Audit Matter Description
The Company’s acquisition purchase price for business
combinations is typically based upon a multiple of average annual
operating profit and/or revenue earned over a one to three-year
period within a minimum and maximum price range. The recorded
purchase price for most acquisitions includes an estimation of
the fair value of liabilities associated with potential earn-out
provisions, when an earn-out obligation is part of the negotiated
transaction. The fair value of the earn-out obligations is based
upon the present value of the expected future payments to be
made to the sellers of the acquired businesses in accordance with
the provisions contained in the respective purchase agreements.
Subsequent changes in the fair value of the earn-out obligations
are recorded in the consolidated statement of income when
incurred.
In determining fair value of the earn-out obligation, the acquired
business’s future performance is estimated using financial projections
of future earnings developed by management that are discounted
to a present value using a risk-adjusted rate that takes into
consideration the likelihood that the forecasted earn-out obligation
will be paid. The earn-out obligation balance was $291 million as of
December 31, 2021 and the potential maximum earn-out obligation
was $484.8 million. Of the total earn-out obligation balance, $78.4
million is recorded in accounts payable and $212.6 million is
recorded in other liabilities in the consolidated balance sheet.
We identified the earn-out obligation as a critical audit matter
because of the increased auditor judgment and extent of effort 70
required to evaluate whether an adjustment is required for the
earn-out obligation in periods after the acquisition. Specifically,
there was a high degree of auditor judgment and an increased
extent of effort to audit the reasonableness of management’s
assumptions related to projections of future earnings of the
acquired businesses.
How the Critical Audit Matter Was Addressed in the Audit
Our audit procedures related to the forecasted future earnings
assumptions used in determining the fair value of the earn-out
obligation included the following, among others:
• We tested the design and operating effectiveness of controls
over management’s earn-out obligation calculation, including
the controls over management’s determination of future
earnings.
• We read the asset/stock purchase agreements and associated
addenda and agreed the provisions of the contracts to the earn-
out obligation models for our testing selections.
• We read any post-acquisition asset/stock purchase agreements
and associated addenda modifications for any additional terms
to evaluate the completeness and reasonableness of the
models utilized to calculate the earn-out obligation for our testing
selections.
• We evaluated the reasonableness of projections of future
earnings for the earn-out obligation models by comparing the
projections to historical results and assessing management’s
key assumptions for our testing selections.
• We evaluated management’s ability to accurately forecast future
earnings by comparing actual results to management’s historical
forecast and forecasted growth rates to that of comparable
subsidiaries for our testing selections.
/s/ Deloitte & Touche LLP
Tampa, Florida
February 22, 2022
We have served as the Company’s auditor since 2002.
71
20
21
AN
NU
AL
RE
PO
RT
Report of Independent Registered Public Accounting Firm
To the shareholders and the Board of Directors of Brown &
Brown, Inc.
Opinion on Internal Control over Financial Reporting
We have audited the internal control over financial reporting
of Brown & Brown, Inc. (the “Company”) and subsidiaries
as of December 31, 2021, based on criteria established in
Internal Control — Integrated Framework (2013) issued by
the Committee of Sponsoring Organizations of the Treadway
Commission (COSO). In our opinion, the Company maintained,
in all material respects, effective internal control over
financial reporting as of December 31, 2021, based on criteria
established in Internal Control — Integrated Framework (2013) issued by COSO.
We have also audited, in accordance with the standards of the
Public Company Accounting Oversight Board (United States)
(PCAOB), the consolidated financial statements as of and for the
year ended December 31, 2021, of the Company and our report
dated February 22, 2022, expressed an unqualified opinion on
those financial statements.
As described in Management’s Report on Internal Control Over
Financial Reporting, management excluded from its assessment the
internal control over financial reporting at O’Leary Insurance, Piper
Jordan, LLC, Berkshire Insurance Group, Inc., AGIS Network, Inc.,
Winston Financial Services, Inc., Remedy Analytics Inc., Heacock
Insurance Group, LLC, and Dealer Admin. Services, Inc., which
were acquired in 2021 and whose financial statements constitute
approximately 2.44% and 5.63% of net and total assets, respectively,
1.91% of revenues, and (1.55%) of net income of the consolidated
financial statement amounts as of and for the year ended
December 31, 2021. Accordingly, our audit did not include the internal
control over financial reporting of these acquired entities.
Basis for Opinion
The Company’s management is responsible for maintaining effective
internal control over financial reporting and for its assessment of the
effectiveness of internal control over financial reporting, included in
the accompanying Management’s Report on Internal Control Over
Financial Reporting. Our responsibility is to express an opinion on
the Company’s internal control over financial reporting based on our
audit. We are a public accounting firm registered with the PCAOB
and are required to be independent with respect to the Company in
accordance with the U.S. federal securities laws and the applicable
rules and regulations of the Securities and Exchange Commission
and the PCAOB.
We conducted our audit in accordance with the standards of the
PCAOB. Those standards require that we plan and perform the audit
to obtain reasonable assurance about whether effective internal
control over financial reporting was maintained in all material respects.
Our audit included obtaining an understanding of internal control
over financial reporting, assessing the risk that a material weakness
exists, testing and evaluating the design and operating effectiveness
of internal control based on the assessed risk, and performing such
other procedures as we considered necessary in the circumstances.
We believe that our audit provides a reasonable basis for our opinion.
Definition and Limitations of Internal Control over Financial
Reporting
A company’s internal control over financial reporting is a process
designed to provide reasonable assurance regarding the
reliability of financial reporting and the preparation of financial
statements for external purposes in accordance with generally
accepted accounting principles. A company’s internal control over
financial reporting includes those policies and procedures that (1)
pertain to the maintenance of records that, in reasonable detail,
accurately and fairly reflect the transactions and dispositions of
the assets of the company; (2) provide reasonable assurance that
transactions are recorded as necessary to permit preparation
of financial statements in accordance with generally accepted
accounting principles, and that receipts and expenditures of the
company are being made only in accordance with authorizations
of management and directors of the company; and (3) provide
reasonable assurance regarding prevention or timely detection
of unauthorized acquisition, use, or disposition of the company’s
assets that could have a material effect on the financial statements.
Because of its inherent limitations, internal control over financial
reporting may not prevent or detect misstatements. Also, projections
of any evaluation of effectiveness to future periods are subject to
the risk that controls may become inadequate because of changes
in conditions, or that the degree of compliance with the policies or
procedures may deteriorate.
/s/ Deloitte & Touche LLP
Tampa, Florida
February 22, 2022
72
Management’s Report on Internal Control over Financial Reporting
The management of Brown & Brown, Inc. and its subsidiaries (“Brown
& Brown”) is responsible for establishing and maintaining adequate
internal control over financial reporting, as such term is defined in
Securities Exchange Act Rule 13a-15(f). Under the supervision and
with the participation of management, including Brown & Brown’s
principal executive officer and principal financial officer, Brown &
Brown conducted an evaluation of the effectiveness of internal
control over financial reporting based upon the framework in Internal Control-Integrated Framework (2013) issued by the Committee of
Sponsoring Organizations of the Treadway Commission (“COSO”).
In conducting Brown & Brown’s evaluation of the effectiveness
of its internal control over financial reporting, Brown & Brown has
excluded the following acquisitions completed by Brown & Brown
during 2021: O’Leary Insurances, Piper Jordan LLC, Berkshire
Insurance Group, Inc., AGIS Network, Inc., Winston Financial
Services, Inc., Remedy Analytics, Inc., Heacock Insurance Group,
LLC, and Dealer Admin. Services, Inc. (collectively the “2021
Excluded Acquisitions”), which were acquired during 2021 and
whose financial statements constitute approximately 2.44% and
5.63% of net and total assets, respectively, 1.91% of revenues,
and (1.55%) of net income of the consolidated financial statement
amounts as of and for the year ended December 31, 2021. Refer
to Note 3 to the Consolidated Financial Statements for further
discussion of these acquisitions and their impact on Brown &
Brown’s Consolidated Financial Statements.
Based upon Brown & Brown’s evaluation under the framework
in Internal Control-Integrated Framework (2013) issued by
the Committee of Sponsoring Organizations of the Treadway
Commission, management concluded that internal control
over financial reporting was effective as of December 31, 2021.
Management’s internal control over financial reporting as of
December 31, 2021 has been audited by Deloitte & Touche LLP, an
independent registered public accounting firm, as stated in their
report which is included herein.
Brown & Brown, Inc.
Daytona Beach, Florida
February 22, 2022
/s/ J. Powell Brown /s/ R. Andrew Watts
J. Powell Brown R. Andrew Watts
Chief executive officer Executive vice president, chief
financial officer and treasurer
73
20
21
AN
NU
AL
RE
PO
RT
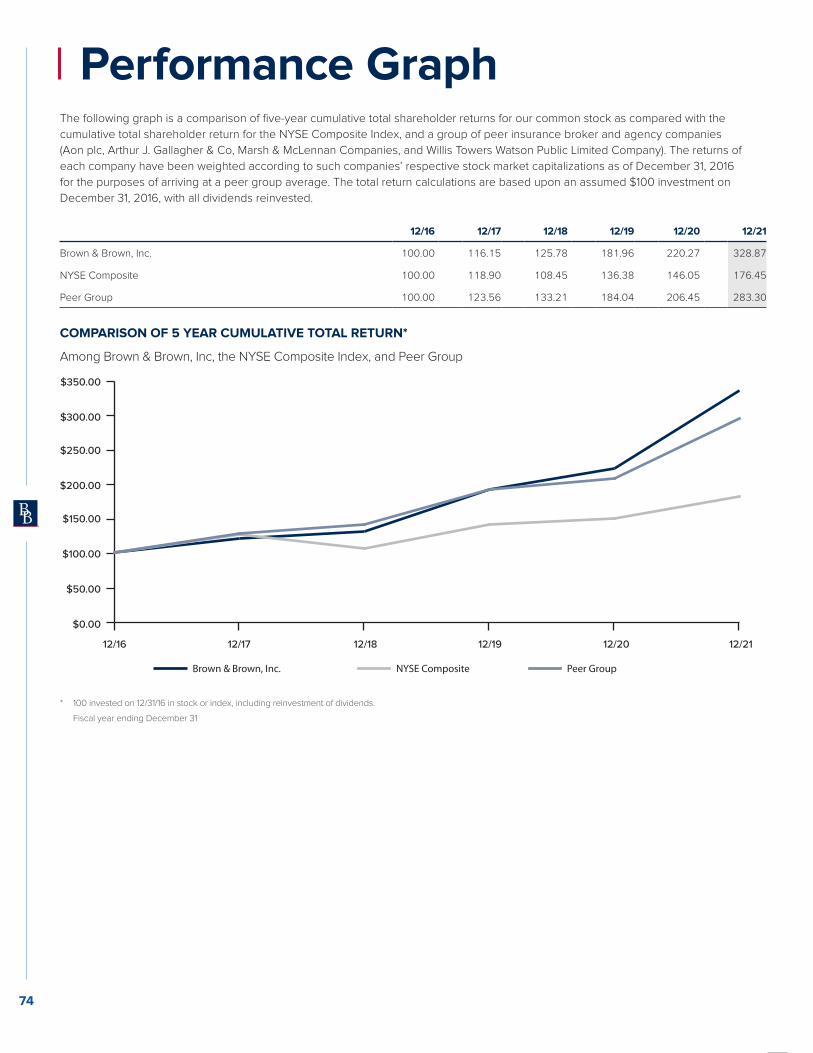
Performance GraphThe following graph is a comparison of five-year cumulative total shareholder returns for our common stock as compared with the
cumulative total shareholder return for the NYSE Composite Index, and a group of peer insurance broker and agency companies
(Aon plc, Arthur J. Gallagher & Co, Marsh & McLennan Companies, and Willis Towers Watson Public Limited Company). The returns of
each company have been weighted according to such companies’ respective stock market capitalizations as of December 31, 2016
for the purposes of arriving at a peer group average. The total return calculations are based upon an assumed $100 investment on
December 31, 2016, with all dividends reinvested.
12/16 12/17 12/18 12/19 12/20 12/21
Brown & Brown, Inc. 100.00 116.15 125.78 181.96 220.27 328.87
NYSE Composite 100.00 118.90 108.45 136.38 146.05 176.45
Peer Group 100.00 123.56 133.21 184.04 206.45 283.30
COMPARISON OF 5 YEAR CUMULATIVE TOTAL RETURN*
Among Brown & Brown, Inc, the NYSE Composite Index, and Peer Group
$0.00
$50.00
$100.00
$150.00
$200.00
$250.00
$300.00
$350.00
12/2112/2012/1912/1812/1712/16
Brown & Brown, Inc. NYSE Composite Peer Group
* 100 invested on 12/31/16 in stock or index, including reinvestment of dividends.
Fiscal year ending December 31
74
Shareholder InformationCorporate Offices
300 North Beach Street
Daytona Beach, Florida 32114
(386) 252-9601
Outside Counsel
Holland & Knight LLP
200 South Orange Avenue, Suite 2600
Orlando, Florida 32801
Corporate Information and Shareholder Services
The Company has included, as Exhibits 31.1 and 31.2, and 32.1
and 32.2 to its Annual Report on Form 10-K for fiscal year 2021,
filed with the Securities and Exchange Commission, certificates
of the chief executive officer and the chief financial officer of the
Company certifying the Company’s public disclosure is accurate
and complete and that they have established and maintained
adequate internal controls. The Company has also submitted to
the New York Stock Exchange a certificate from its chief executive
officer certifying that he is not aware of any violation by the
Company of New York Stock Exchange corporate governance
listing standards.
A copy of the Company’s 2021 Annual Report on Form 10-K
will be furnished without charge to any shareholder who
directs a request in writing to:
Corporate Secretary
Brown & Brown, Inc.
300 North Beach Street
Daytona Beach, Florida 32114
A reasonable charge will be made for copies
of the exhibits to the Form 10-K.
Annual Meeting
The Annual Meeting of Shareholders of
Brown & Brown, Inc. will be held virtually.
Please register at
http://www.viewproxy.com/bbinsurance.com/2022/htype.asp
Transfer Agent and Registrar
American Stock Transfer & Trust Company, LLC
6201 15th Ave.
Brooklyn, New York 11219
(800) 937-5449
email: [email protected]
www.astfinancial.com
Independent Registered Public Accounting Firm
Deloitte & Touche LLP
201 North Franklin Street
Suite 3600
Tampa, Florida 33602
Stock Listing
The New York Stock Exchange Symbol: BRO
On February 18, 2022, there were 282,215,614 shares of
our common stock outstanding, held by approximately 1,512
shareholders of record.
Additional Information
Information concerning the services of Brown & Brown, Inc., as
well as access to current earnings releases, is available on Brown
& Brown’s website at www.bbinsurance.com.
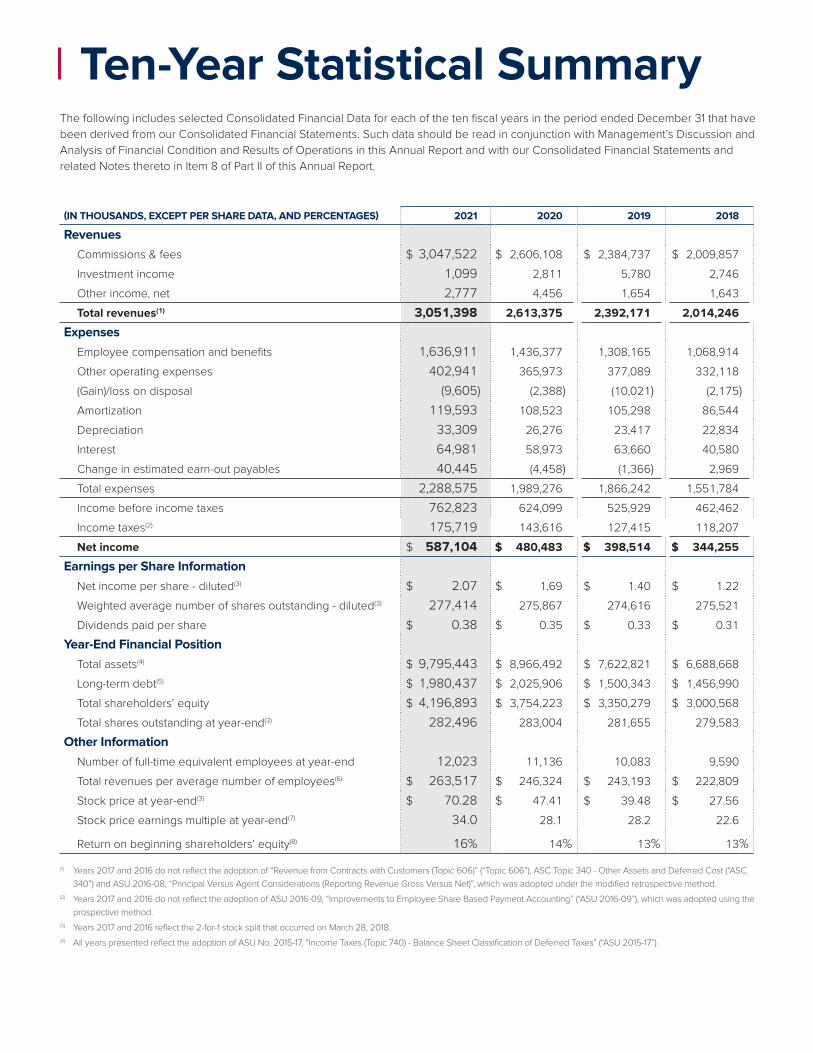
Ten-Year Statistical SummaryThe following includes selected Consolidated Financial Data for each of the ten fiscal years in the period ended December 31 that have
been derived from our Consolidated Financial Statements. Such data should be read in conjunction with Management’s Discussion and
Analysis of Financial Condition and Results of Operations in this Annual Report and with our Consolidated Financial Statements and
related Notes thereto in Item 8 of Part II of this Annual Report.
(IN THOUSANDS, EXCEPT PER SHARE DATA, AND PERCENTAGES)
Year Ended December 31,
2021 2020 2019 2018 2017 2016 2015 2014 2013 2012
Revenues
Commissions & fees $ 3,047,522 $ 2,606,108 $ 2,384,737 $ 2,009,857 $ 1,857,270 $ 1,762,787 $ 1,656,951 $ 1,567,460 $ 1,355,503 $ 1,189,081
Investment income 1,099 2,811 5,780 2,746 1,626 1,456 1,004 747 638 797
Other income, net 2,777 4,456 1,654 1,643 22,451 2,386 2,554 7,589 7,138 10,154
Total revenues(1) 3,051,398 2,613,375 2,392,171 2,014,246 1,881,347 1,766,629 1,660,509 1,575,796 1,363,279 1,200,032
Expenses
Employee compensation and benefits 1,636,911 1,436,377 1,308,165 1,068,914 994,652 925,217 856,952 811,112 705,603 624,371
Other operating expenses 402,941 365,973 377,089 332,118 283,470 262,872 251,055 235,328 195,677 174,389
(Gain)/loss on disposal (9,605) (2,388) (10,021) (2,175) (2,157) (1,291) (619) 47,425 — —
Amortization 119,593 108,523 105,298 86,544 85,446 86,663 87,421 82,941 67,932 63,573
Depreciation 33,309 26,276 23,417 22,834 22,698 21,003 20,890 20,895 17,485 15,373
Interest 64,981 58,973 63,660 40,580 38,316 39,481 39,248 28,408 16,440 16,097
Change in estimated earn-out payables 40,445 (4,458) (1,366) 2,969 9,200 9,185 3,003 9,938 2,533 1,418
Total expenses 2,288,575 1,989,276 1,866,242 1,551,784 1,431,625 1,343,130 1,257,950 1,236,047 1,005,670 895,221
Income before income taxes 762,823 624,099 525,929 462,462 449,722 423,499 402,559 339,749 357,609 304,811
Income taxes(2) 175,719 143,616 127,415 118,207 50,092 166,008 159,241 132,853 140,497 120,766
Net income $ 587,104 $ 480,483 $ 398,514 $ 344,255 $ 399,630 $ 257,491 $ 243,318 $ 206,896 $ 217,112 $ 184,045
Earnings per Share Information
Net income per share - diluted(3) $ 2.07 $ 1.69 $ 1.40 $ 1.22 $ 1.40 $ 0.91 $ 0.85 $ 0.71 $ 0.74 $ 0.63
Weighted average number of shares outstanding - diluted(3) 277,414 275,867 274,616 275,521 277,586 275,608 280,224 285,782 285,248 284,020
Dividends paid per share $ 0.38 $ 0.35 $ 0.33 $ 0.31 $ 0.28 $ 0.25 $ 0.23 $ 0.21 $ 0.19 $ 0.17
Year-End Financial Position
Total assets(4) $ 9,795,443 $ 8,966,492 $ 7,622,821 $ 6,688,668 $ 5,747,550 $ 5,262,734 $ 4,979,844 $ 4,931,027 $ 3,620,232 $ 3,103,650
Long-term debt(5) $ 1,980,437 $ 2,025,906 $ 1,500,343 $ 1,456,990 $ 856,141 $ 1,018,372 $ 1,071,618 $ 1,142,948 $ 379,171 $ 449,136
Total shareholders’ equity $ 4,196,893 $ 3,754,223 $ 3,350,279 $ 3,000,568 $ 2,582,699 $ 2,360,211 $ 2,149,776 $ 2,113,745 $ 2,007,141 $ 1,807,333
Total shares outstanding at year-end(3) 282,496 283,004 281,655 279,583 276,210 280,208 277,970 286,972 290,838 287,756
Other Information
Number of full-time equivalent employees at year-end 12,023 11,136 10,083 9,590 8,491 8,297 7,807 7,591 6,992 6,438
Total revenues per average number of employees(6) $ 263,517 $ 246,324 $ 243,193 $ 222,809 $ 224,130 $ 219,403 $ 215,679 $ 216,114 $ 203,020 $ 191,729
Stock price at year-end(3) $ 70.28 $ 47.41 $ 39.48 $ 27.56 $ 25.73 $ 22.43 $ 16.05 $ 16.45 $ 15.70 $ 12.73
Stock price earnings multiple at year-end(7) 34.0 28.1 28.2 22.6 18.3 24.6 18.9 23.3 21.1 20.2
Return on beginning shareholders’ equity(8) 16% 14% 13% 13% 17% 12% 12% 10% 12% 11%
(1) Years 2017 and 2016 do not reflect the adoption of “Revenue from Contracts with Customers (Topic 606)” (“Topic 606”), ASC Topic 340 - Other Assets and Deferred Cost (“ASC
340”) and ASU 2016-08, “Principal Versus Agent Considerations (Reporting Revenue Gross Versus Net)”, which was adopted under the modified retrospective method.
(2) Years 2017 and 2016 do not reflect the adoption of ASU 2016-09, “Improvements to Employee Share Based Payment Accounting” (“ASU 2016-09”), which was adopted using the
prospective method.
(3) Years 2017 and 2016 reflect the 2-for-1 stock split that occurred on March 28, 2018.
(4) All years presented reflect the adoption of ASU No. 2015-17, “Income Taxes (Topic 740) - Balance Sheet Classification of Deferred Taxes” (“ASU 2015-17”).
(5) Please refer to Part I, Item 7 “Management’s Discussion and Analysis of Financial Condition and Results of Operations” and Note 9 “Long-Term Debt” for more
details.
(6) Represents total revenues divided by the average of the number of full-time equivalent employees at the beginning of the year and the number of full-time
equivalent employees at the end of the year.
(7) Stock price at year-end divided by net income per share diluted.
(8) Represents net income divided by total shareholders’ equity as of the beginning of the year.
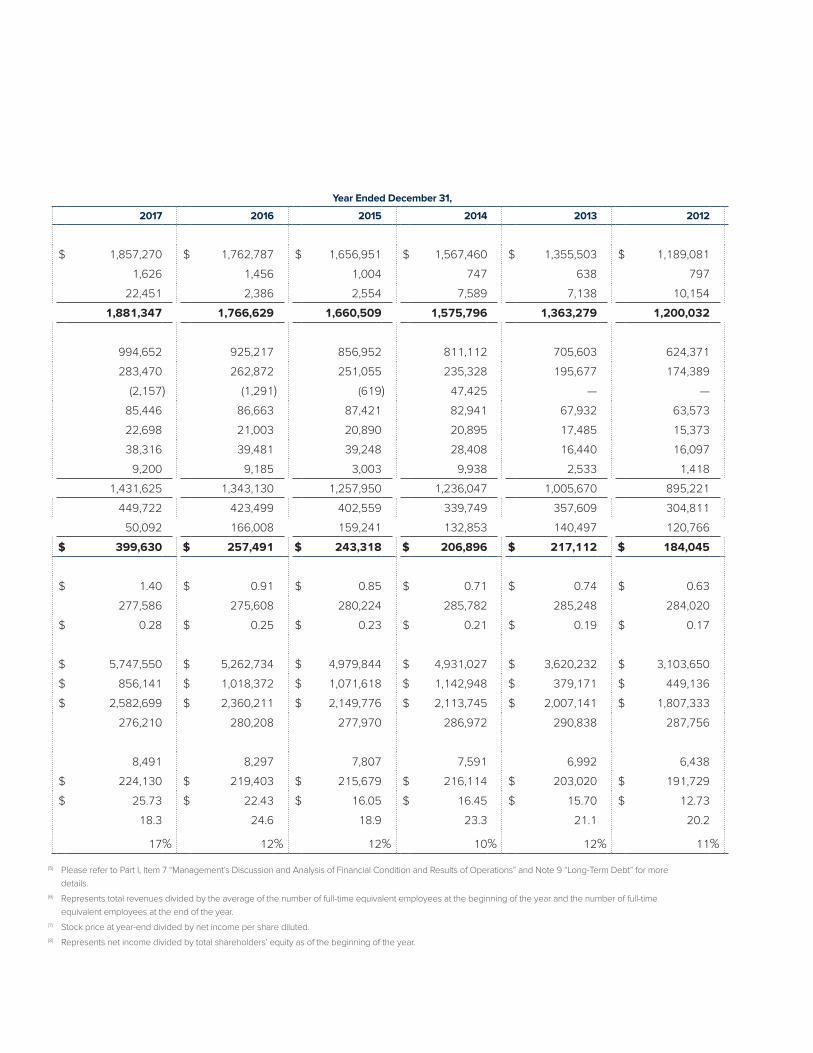

300 North Beach StreetDaytona Beach, FL 32114(386) 252-9601
bbinsurance.com
CHARGE ONCHARGE ONTO $4 BILLION AND BEYONDTO $4 BILLION AND BEYOND
Brow
n & B
rown, Inc. | 2021 A
nnual Report