2020 6 month financial results
TRANSCRIPT

Sensitivity: Public
2020 – 6 MonthFinancial Results

Sensitivity: Public
A Crisis Like No Other: COVID-19
-4,9%-5,2%
-6,0%
IMF World Bank OECD
A Deep Global Recession in 2020 Different Recovery Scenarios
0
2
4
6
8
10
1 2 3 4 5 6 70
2
4
6
8
10
12
1 2 3 4 5 6 7
0
2
4
6
8
10
12
1 2 3 4 5 6 7
0
2
4
6
8
10
12
1 2 3 4 5 6 7
0
2
4
6
8
10
12
1 2 3 4 5 6 7
V-Shaped L-Shaped
U-Shaped Z-Shaped
W-Shaped

Sensitivity: Public
COVID-19 Impact: Appliance Market

Sensitivity: Public
COVID-19 Impact: Evolving Needs
Evolving Consumer Needs
▪ Conscious Consumption
▪ Re-Prioritizing What is Important
▪ E-Commerce Boom
Seizing Opportunities
▪ Reliability
▪ Value for Money
▪ Resource Efficiency

Sensitivity: Public
Consolidated inventory value was reduced to EUR 762 mio. with effective stock management
▪ Around 18% improvement compared to last year
In our production facilities, all necessary precautions were taken at world standards and production was maintained with maximum capacity.
▪ Utilizing 90% Capacity with World Class Protective Measures
COVID-19 Impact: Building Resilience
Solid Business Continuity Inventory Optimization
100
60
120
1-M
ar
8-M
ar
15
-Mar
22
-Mar
29
-Mar
5-A
pr
12
-Ap
r
19
-Ap
r
26
-Ap
r
3-M
ay
10
-May
17
-May
24
-May
31
-May
7-J
un
14
-Ju
n
21
-Ju
n
28
-Ju
n
5-J
ul
Daily Production Capacities
927 968
843 807 762
June-19 Sep-19 Dec-19 March-20 June-20
Inventory (EURmn)

Sensitivity: Public
COVID-19 Impact: Serving Communities
Ventilator Production Hospital Donations
• The project started on March 25, the first prototype was produced on March 31, mass production began on April 25, and 5,000 ventilator production was completed on June 20.
• Nearly 3.000 ventilators have been exported.• Arcelik donated 59 ventilators to different countries.
Turkey, Brazil, Azerbaijan, Uzbekistan, Chad, Niger, Bangladesh, Somalia, Afghanistan, Nigeria, Dagestan, UAE, Libya, Syria, Romania, Philippines, Ukraine, Russia, Kazakhstan, Indonesia, Pakistan, Kenya, S.Africa
• In Turkey, more than 2000 Arcelik and Beko brand products were donated.
• Nearly 8,800 products were donated to more than 550 hospitals in 20 countries.
Turkey, Romania, France, Spain, Poland, Kosovo, Serbia, Bosnia and Herzegovina, Slovenia, Philippines, Ukraine, United Kingdom, Czech Republic, Ghana, Thailand, Nigeria, Angola, Germany, Pakistan, Bangladesh

Sensitivity: Public
COVID-19 Arcelik "New Normal" Program
Identifying the changing consumer habits andbehaviours; re-designing the brand approach to fulfiltheir needs
1
2
3
4
Creating a more competitive and profitable productportfolio to fulfill the needs in hygiene, quality andlifestyle based on shifting consumer behaviour
Growing e-commerce in potential markets, deployingthe new e-commerce strategy in 2020
Transition to «New Normal» and ensuring health andsafety of the employees and the business continuity in production and offices in the following 12-36 months

Sensitivity: Public
2020 Q2 Highlights
TRY7.8bnRevenue
▪ Limited top line contraction at 7%
▪ Slight decline in gross margin due to lower CUR (QoQ)
▪ ~2.5ppt QoQ improvement in OPEX/Sales
▪ One-off contribution of ~TRY67mn in EBITDA
▪ Strong FCF sustained: TRY1,859 mn. FCF* in 2Q20
▪ Improvement in working capital and leverage in a
challenging environment
▪ Arçelik is now among the supporters of TCFD (Task Force on
Climate-related Financial Disclosures)
11.1%EBITDA Margin
26%NWC/Sales Ratio
1.9xLeverage
* Free Cash Flow calculated as Net Operating Cash Flow + CAPEX

Sensitivity: Public
10.511.2
11.1
10.5
8.4
10.2
2019 Q2 2020 Q1 2020 Q2
31.4
31.8
30.9
2019 Q2 2020 Q1 2020 Q2
8,428
7,768 7,832
2019 Q2 2020 Q1 2020 Q2
Organic decline in international sales due to lock-downs
Contraction in domestic unit sales
TRY Depreciation
11.1%
30.9%Lower CUR in TR and RO, factory closures in ZA, PK, BD
Slightly better raw material prices
Stronger EUR/USD towards the end of 2Q
Stricter OPEX Management
Lower contribution from one-off items (QoQ)
2020 Q2 Key Factors Sales/Margins
RevenueGrowth -7%
GrossMargin
EBITDA Margin
EBITDA margin excluding one off items
-25%
+20%
-17%
28.7%
33.8%
28.7%
7.6%
15.8%
7.3%
Apr-20
May-20
Jun-20

Sensitivity: Public
2020 Q2 Improvement in OPEX/Sales
OPEX Items - % of Sales
1Q
20
2Q
20
Pers
on
nel
Exp
.
Ad
min
istr
ativ
eEx
p.
Logi
stic
Exp
.
Ad
vert
isin
g,
Pro
mo
tio
nEx
p.
Gu
aran
tee
Exp
.
Inst
alla
tio
n E
xp.
Oth
er
• Support of government incentives
• Significant cut in administrative expenses
• Lower marketing investments, cancellation of
some trade fairs
• Better inventory management
• Measures taken and rebound in revenue in June
led to lowest monthly OPEX/Sales since 2013.
Successful Cost-Cutting Measures

Sensitivity: Public
2020 Q2 Historically Low WC/Sales
• Decreasing receivables days in domestic market
• Continuation of measures in inventory
management, such as SKU optimization,
elimination of aged inventory and toxic SKUs
• Achieving better terms from large, international
suppliers
• Supplier financing programme
Continuing Improvement in WC Management
30.3%
33.8%32.7%
28.4%
25.7%
Jun-16 Jun-17 Jun-18 Jun-19 Jun-20

Sensitivity: Public
1,565 1,739
-1,095
355782
811
-581
-550
1H19 1H20
EBITDA Chg. İn Working Capital Adjustments CAPEX
2020 H1 Strong Cash GenerationFCF Generation (TRYmn)
• Higher EBITDA generation in 1H20 in TRY terms
• Slightly lower CAPEX in TRY, ~15% decline in EUR
• Substantially stronger performance in WCR
FCF Performance Further Improved
672
2,355

Sensitivity: Public
2020 Q2 Strong Balance Sheet
• TRY 9,3 bln. in cash (80% in hard currency)
• Undistributed dividend of TRY 500 mio. and
Token sale of TRY 310 mio. to support liquidity
• Successfully rolled over H1 TRY-redemptions and
have also done prefinancing at convenient rates
• Hard currency FX debt service is limited with
Eurobond coupon payments
• Continuation of strict hedging policy
• Net leverage below 2X
FCF Performance Further Improved
15.2%
25.0%
11.3%
June '18 Sep '18 Dec '18 Mar '19 June '19 Sep '19 Dec '19 Mar'20 June '20
3.1
2.4
1.9
June '18 Sep '18 Dec '18 Mar '19 June '19 Sep '19 Dec '19 Mar'20 June '20
6,937
9,253
2019 Q4 2020 Q2
Cash and Equivalents (TRYmn)
TRY Average Interest Rate (Period End)
Net Leverage

Sensitivity: Public
Regional MarketDynamics

Sensitivity: Public
+4%
2020 Q2 Turkish Market
MDA-6 TVAir-Conditioner
Market -1% +7%
Turkish MDA6 Market YoY Change
MDA-6 and A/C data (sell-in) is based on WGMA for 2Q20. TV market reflects the data of a retail panel market for April-May 2020 (Junes figures are not released yet).
6%12% 14%
-11% -8%
14%
Jan
Feb
Ma
r
Ap
r
Ma
y
Jun
Jul
Au
g
Sep
Oct
No
v
Dec
2019 2020

Sensitivity: Public
2020 Q2 Arçelik Performance in Turkey: MDA6
1%
16%
-4%
-10%-7%
23%
-20%
-15%
-10%
-5%
0%
5%
10%
15%
20%
25%
Jan Feb Mar Apr May Jun Jul Aug Sep Oct Nov Dec
2019 2020
3.00
3.50
4.00
4.50
5.00
Jan Feb Mar Apr May Jun Jul Aug Sep Oct Nov Dec
2018 2019 2020
• Intentionally cautious approach in sell-insales, combined with high base of 2019,resulting in YoY decline in 2Q20 (-15%)
• However, sell-out was much stronger than sell-induring whole quarter
• More room for sell-in growth in 2H2020due to low level of dealer inventory
• E-com fulfilment increased from 121 to 1.469dealers in a month after Covid-19.
• Daily e-commerce revenue is 10-fold after e-commobilisation
• Web traffic increased 43% compared to last year(32,6 Mio people visited our websites in 2020).
• We leveraged our competitive advantagefocusing speed and service (Delivery in 48-hours, unconditional return in 14 days)
Strong Performance in Sell-Out
Installation Figures for MDA6 – Change (YoY)
Inventory Level at Dealers – MDA6 (Months)
Omnichannel Transformation

Sensitivity: Public
2020 Q2 Arçelik Performance in Turkey: TV, A/C, SDA
9%
-26%
40%
-7%
32%
46%
38%
13%
24%
April May June
Strong Performance in Sell-in
Unit Change (YoY)
Revenue Change (TL, YoY)
Stronger Performance in Sell-Out
0%
18% 17%
-15%
31%
-20%
-16%
50%
-3%
+5%
2Q20 (YoY)
+29%
+24%
+15%
+3%
+15%
2Q20 (Sell-Out/Sell-in)
Unit Change (YoY)
Sell-out/Sell-in (Units)
Sensitivity: Public
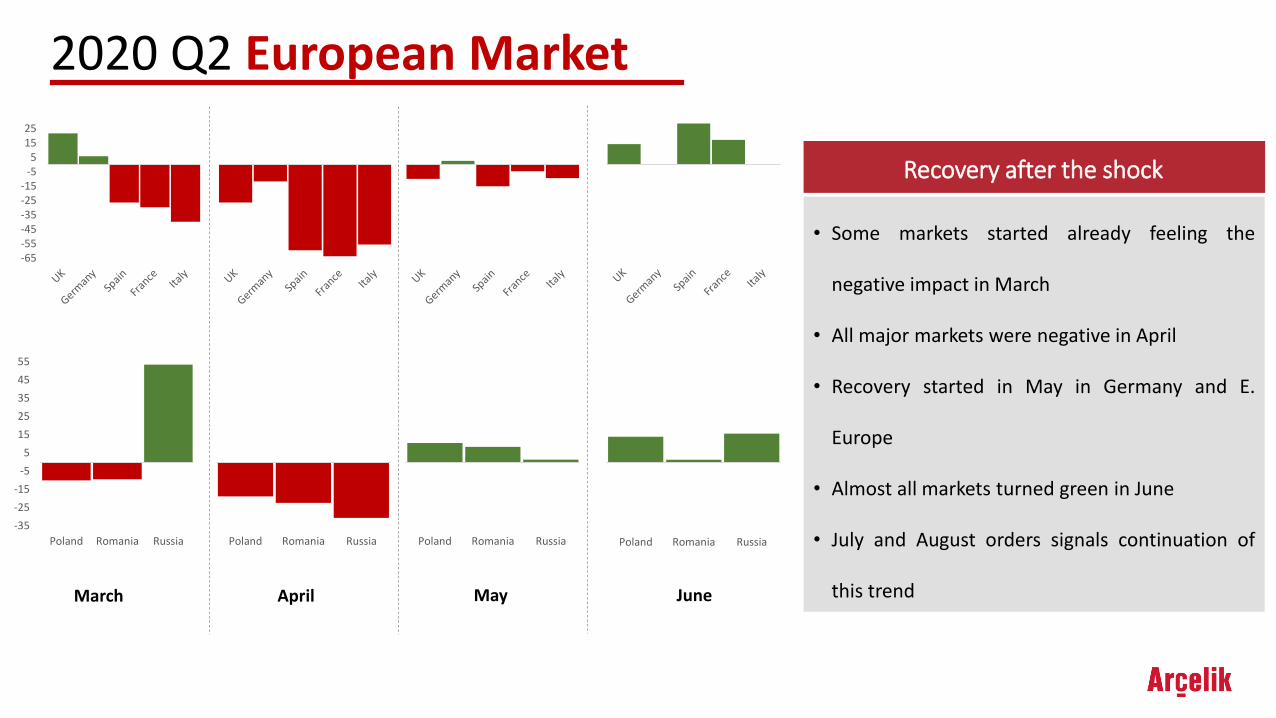
2020 Q2 European Market
-65-55-45-35-25-15
-55
1525
-35
-25
-15
-5
5
15
25
35
45
55
Poland Romania Russia Poland Romania Russia Poland Romania Russia
March April May June
• Some markets started already feeling the
negative impact in March
• All major markets were negative in April
• Recovery started in May in Germany and E.
Europe
• Almost all markets turned green in June
• July and August orders signals continuation of
this trend
Recovery after the shock
Poland Romania Russia

Sensitivity: Public
2020 Q2 European Market
• Significant increase in online channel share,especially during lockdown periods
• Loyal customers accelerated rise of click &mortar business more than pure onlineplayers
➢ 56% YTD increase in click&mortar
➢ 16% YTD increase in pure online
Booming Online Sales
23 21 2744
36 29 27 3447
36
Jan-20
Feb-20
Mar-20
Apr-20
May-20
Online Channel Value Share - %
Western Europe
CIS Countries
Eastern Europe

Sensitivity: Public
1.3
0.5 0.5
0.1 0.1
1.5
-1.4
-0.4
UK Germany Spain France Italy Poland Romania Russia
2020 Q2 Arçelik Performance in Europe
• Succesfully managed structural change
• Gained market share in online channels
• Product range has a good fit with online sales
6.2% 6.3%
7.7%8.4%
5M19 5M20
Arcelik Group Value Market Share – MDA 8
Traditional Channel Online Channel
Arcelik Group Unit Market Share Change – YoY
• Strong crisis performance with market sharegains in major markets in Europe
Market Share Gains
Winner in the Online

Sensitivity: Public
▪ Almost no sales in S. Africa in April due tolock-down
▪ Reopening of retailers started on June 1st.
▪ June contraction in MDA-9 was limited at5-10% range
▪ Defy’s exports in June was up by ~20% inEUR terms
▪ Profitability normalized in June
▪ ~55% revenue contraction in Pakistan inPKR terms reflecting both macroconditions and COVID19 impact.
▪ Singer Bangladesh had ~40% contractionin top-line despite a strong recovery inJune
▪ ASEAN revenue realized at USD21mn,indicating to 27% YoY decline.
~-60%
~-10%
APAC
~-75%
~-10%
South Africa & Sub Sahara
▪ Online sales support in April, May
▪ Significant contraction in France, Spainand Italy in April and May
▪ Visible recovery especially in W. Europe inJune led by Germany
▪ Contraction in E. Europe slowed down inJune and some countries turned positive
▪ Market share gains continued in 2Q20
Europe Africa Asia-Pacific
2020 Q2 Arçelik Performance in International
9%4%42%
Arcelik Regional Sales Growth (YoY % in EUR)
April+May-20 June-20
~-25%~-30%
~-5%
~+5%
East Europe West Europe

Sensitivity: Public
Sales Performance

Sensitivity: Public
2020 Q2 Sales by Region
34.7%
28.1%
13.9%
6.6%2.8%
5.3%
4.3%
41.4%
28.0%
14.1%
3.5%2.6%
2.5%3.1%
4.7%
33.5%
30.8%
13.8%
7.0%2.5%
5.1%
4.9%
38.6%
30.2%
13.9%
4.3%
2.8%2.6%
3.0%4.6%
Turkey Western Europe CIS&Eastern Europe Africa Middle East Pakistan Bangladesh Other
5,129 6,014
10,2019,586
15,330 15,600
2019 6M 2020 6A
Turkey International
2,926 3,245
5,502 4,587
8,4287,832
2019 Q2 2020 Q2
-17%
-7%
+11%
2019 Q2
2020 Q2
-6%
+2%
+17%
2019 6M
2020 6M

Sensitivity: Public
2,926 3,245
5,502 4,587
319
-1440525
-
1,000
2,000
3,000
4,000
5,000
6,000
7,000
8,000
9,000
10,000
2019 Q2 TR - Organic INT - Organic INT - FX Impact 2020 Q2
Turkey International Revenue Impact
TL mn
2020 Q2 Sales Bridge
8,428
7,832
2020 Q2 Organic Currency Effect Acquisition TOTAL
Domestic Growth 10.9% 0.0% 0.0% 10.9%
International Growth -26.2% 9.5% 0.0% -16.6%
Total Growth -13.3% 6.2% 0.0% -7.1%

Sensitivity: Public
P&L Performance

Sensitivity: Public
2020 Q2 Income Statement
* EBIT was calculated by deducting the impact of foreign exchange gains and losses arising from trade receivables and payables, credit finance income and charges and cashdiscount expense and adding income and expenses from sale of property plant and equipment.
** Net income before minority
TL mn 2020 Q2 2019 Q2 2020 Q1 Δ% YoY
Δ%
QoQ 2020 6M 2019 6M Δ% YoY
Revenue 7,832 8,428 7,768 -7 1 15,600 15,330 2
Gross Profit 2,419 2,643 2,470 -8 -2 4,889 4,882 0
margin 30.9 31.4 31.8 31.3 31.8
EBIT * 572 629 589 -9 -3 1,161 1,058 10
margin 7.3 7.5 7.6 7.4 6.9
Profit Before Tax 526 302 308 74 70 834 562 48
margin 6.7 3.6 4.0 5.3 3.7
Net Income** 409 232 259 76 57 668 458 46
margin 5.2 2.8 3.3 4.3 3.0
EBITDA* 869 887 871 -2 0 1,739 1,565 11
margin 11.1 10.5 11.2 11.2 10.2
EBITDA - ex.one-offs 801 887 654 -10 23 1,455 1,565 -7
margin 10.2 10.5 8.4 9.3 10.2

Sensitivity: Public
2020 Guidance

Sensitivity: Public
2020 Expectations▪ In the mid of this global pandemic, the first priority of company management has been to ensure the health and well-
being of all employees and their families all over the world.
▪ The second critical issue is to keep the high liquid position of the company to be prepared against any scenario.
▪ After a weak demand in second quarter, we expect strong demand in Q3. (mid-single digit growth in EUR)
▪ Raw-material prices and EUR:USD parity are expected to continue act as tail-wind in 2H20.
▪ Though there are still uncertainty around Q4 related with COVID-19, the business impact may not be as hard as April
and May.
▪ With all measures taken and implemented in all our factories and suppliers globally, we aim to keep our factories
running while keeping all our employees safe.
▪ Thanks to our operational competitive advantages and strong balance sheet, we continue to see more opportunities in
the market aftermath of COVID-19.

Sensitivity: Public
2020 Guidance
Turkey (in TRY) 15-20% growth
International (in FX) Around 5% decline
Arçelik Revenue
10-15%
growth in TRY
Profitability10.5-11.0% 2020 EBITDA Margin
Long term EBITDA Margin >11.5%
CAPEXAround EUR
150-160 mio.WC/Sales Below 30%

Sensitivity: Public
APPENDIX:Other Financial Statements

Sensitivity: Public
1,324
1,064
1,460
29.2
30.2
26.1
20.0
22.0
24.0
26.0
28.0
30.0
32.0
700
800
900
1,000
1,100
1,200
1,300
1,400
1,500
2019 Q2 2020 Q1 2020 Q2
Revenue Gross Margin (%)
759
980 914
25.623.3
21.8
10.0
15.0
20.0
25.0
30.0
100
300
500
700
900
2019 Q2 2020 Q1 2020 Q2
Revenue Gross Margin (%)
6,345
5,723
5,458
32.5
33.6 33.7
30.0
31.0
32.0
33.0
34.0
35.0
4,500
5,000
5,500
6,000
6,500
2019 Q2 2020 Q1 2020 Q2
Revenue Gross Margin (%)
8,428
7,768 7,832
31.4 31.830.9
21.0
23.0
25.0
27.0
29.0
31.0
33.0
5,000
5,500
6,000
6,500
7,000
7,500
8,000
8,500
9,000
9,500
2019 Q2 2020 Q1 2020 Q2
Revenue Gross Margin (%)
2020 Q2 Margin by SegmentsConsolidated
White Goods Consumer Electronics Other

Sensitivity: Public
9,157 8,959
5,821 5,875
5,580 5,670
1,091 1,248
8,665 8,275
2016 - Assets 2016 - Liabilities 2017 1Q - Assets 20171Q - Liabilities
Trade Rec. Inventory Other Rec. Trade Payables Other Pay. Working Capital
2020 Q2 Working Capital
2020 3M 2020 6M
Working Capital / Sales
30.3% 30.8% 29.3% 32.2% 33.8% 33.5%
30.3% 31.6% 32.7% 35.1% 28.0% 27.3% 28.4% 28.3% 27.0% 26.4%25.7%
Jun-16 Sep-16 Dec-16 Mar-17 Jun-17 Sep-17 Dec-17 Mar-18 Jun-18 Sep-18 Dec-18 Mar-19 Jun-19 Sep-19 Dec-19 Mar-20 Jun-20

Sensitivity: Public
49%
29%
9%
3%4% 6%
USD EUR TRY GBP RUB Diğer
2020 Q2 Cash & Financial Debt
Debt Maturity Profile
Cash Breakdown by Currency
4,225 5,342 6,478 5,788 5,482 6,937 7,827 9,253
-4,687 -5,517 -5,602 -5,596 -5,772 -6,152 -6,210 -5,781
-6,836 -6,432 -7,529 -7,690 -7,359-8,803 -9,885 -10,113
3.15
2.36 2.31 2.40 2.41 2.392.33
1.88
-2.00
-1.00
0.00
1.00
2.00
3.00
4.00
-17,000
-12,000
-7,000
-2,000
3,000
8,000
18 Q3 18 Q4 19 Q1 19 Q2 19 Q3 19 Q4 20 Q1 20 Q2
Cash and cash equivalent Short term debt Long term debt Net Debt/EBITDA
TL mn
Financial Debt profile (as of Jun 30 2020)
Effective mn Original TL mn
Interest Rate p.a. (%) Currency Equivalent
TRY 11.3% 4,183 4,183
EUR 0.9% 233 1,799
GBP 0.7% 3 28
USD 1.9% 47 322
ZAR 6.9% 980 390
AUD 3.3% 13 63
RUB 2.0% 27 3
PKR 10.0% 10,892 442
BDT 9.0% 6,722 543
Total 7,773
USD 5.1% 506 3,459
EUR 4.0% 360 2,778
TRY* 19.1% 1,015 1,015
Total Bond 7,253
Total 15,026
*Average fixed rate at 19.1% through Interest Rate Swaps
2020
18%
2021
46%
2022
6%
2023
26%
2023+
4%

Sensitivity: Public
2020 Q2 FX Hedging
• The primary strategy is on balance sheet hedging mainlythrough cash, receivables, payables and financialliabilities, and the remaining part is hedged throughfinancial derivatives.
• FX hedging is a strictly pursued policy in Arçelik since more than 30 currenciesare actively managed in global operations.
• It is a KPI for the company management not to have an FX exposureexceeding low single-digit % of equity.
-4.1%
-1.1%
-5.7%
-2.5%-2.1%-2.0%
-3.7%
0.4%
-1.2%
-5.1%
-3.6%
-1.2%
3.9%
-2.9%-2.4%
-1.2%
-3.2%
0.7%
-8.0%
-6.0%
-4.0%
-2.0%
0.0%
2.0%
4.0%
6.0%
-500
-400
-300
-200
-100
0
100
200
300
400
16
Q1
16
Q2
16
Q3
16
Q4
17
Q1
17
Q2
17
Q3
17
Q4
18
Q1
18
Q2
18
Q3
18
Q4
19
Q1
19
Q2
19
Q3
19
Q4
20
Q1
20
Q2
Net FX Position Net FX/Equity
(TRYmn)
Before
Hedge
Hedged
Position
Net
Position
EUR -1,170 1,261 91
USD 147 -231 -84
GBP 458 -431 26
Other 848 -807 41
TOTAL 282 -208 74
0.7%Net FX Position/Equity

Sensitivity: Public
2020 H1 Cash Flow
2020 1H
2019 1H

Sensitivity: Public
2Q20 Highlights
▪ Lockdowns and other measures led to ~40% top-line contraction in 2Q20
▪ Double-digit increase in June sales
▪ Washing Machine, SDA and MW Oven performed relatively better
▪ Better product mix helped gross margin throughout the quarter.
▪ EBIT margin declined on a YoY basis mainly due to revenue contraction
2020 Q2 Singer Bangladesh Results
BDT mn 2020 Q2 2019 Q2 2020 Q1 Δ% YoY
Δ%
QoQ 2020 6M 2019 6M Δ% YoY
Revenue 2,995 5,198 3,064 -42 -2 6,059 7,941 14
Gross Profit 830 1,442 825 -42 1 1,655 2,233 16margin 27.7 27.7 26.9 27.3 28.1
EBIT 266 695 266 -62 0 532 997 18margin 8.9 13.4 8.7 8.8 12.6
Profit Before Tax 129 560 163 -77 -21 292 745 15margin 4.3 10.8 5.3 4.8 9.4
Net Income 79 389 111 -80 -29 191 512 12margin 2.6 7.5 3.6 3.2 6.4

Sensitivity: Public
Info-Text
2020 Q2 Raw Material Trends
Metal Prices Index Quarterly Average - Market Plastic Prices Index Quarterly Average - Market
Source: Steel BB, Steel OrbisIndex includes: CRC, HRC, Galvanized Steel, Stainless Steel, Copper, Aluminium
Source: ICIS - Chemical Industry News & Chemical Market IntelligenceIndex includes: ABS, Polystyrene, Polyurethane, Polypropylene
40
50
60
70
80
90
100
110
Jan
-16
Ap
r-1
6
Jul-
16
Oct
-16
Jan
-17
Ap
r-1
7
Jul-
17
Oct
-17
Jan
-18
Ap
r-1
8
Jul-
18
Oct
-18
Jan
-19
Ap
r-1
9
Jul-
19
Oct
-19
Jan
-20
Ap
r-2
0
2Q Average Metals Price Index (Market)
60
70
80
90
100
110
120
130
140
Jan
-16
Ap
r-1
6
Jul-
16
Oct
-16
Jan
-17
Ap
r-1
7
Jul-
17
Oct
-17
Jan
-18
Ap
r-1
8
Jul-
18
Oct
-18
Jan
-19
Ap
r-1
9
Jul-
19
Oct
-19
Jan
-20
Ap
r-2
0
2Q Average Plastics Price Index (Market)
3Q18 4Q18 1Q19 2Q19 3Q19 4Q19 1Q20 2Q20
90 85 83 82 79 77 77 72
3Q18 4Q18 1Q19 2Q19 3Q19 4Q19 1Q20 2Q20
121 111 105 110 104 101 100 89

Sensitivity: Public
Contacts for Investor Relations
Polat Şen
CFO
Tel: (+90 212) 314 34 34
Hande Sarıdal
Finance Director
Tel: (+90 212) 314 31 85
Orkun İnanbil
Investor Relations Manager
Tel: (+90 212) 314 31 14
www.arcelikas.com
Investor Relations App
Kerimcan Uzun
Investor Relations Specialist
Tel: (+90 212) 705 96 81

Sensitivity: Public
Disclaimer
This presentation contains information and analysis on financial statements as well
as forward-looking statements that reflect the Company management’s current
views with respect to certain future events. Although it is believed that the
information and analysis are correct and expectations reflected in these statements
are reasonable, they may be affected by a variety of variables and changes in
underlying assumptions that could cause actual results to differ materially.
Neither Arçelik nor any of its managers or employees nor any other person shall
have any liability whatsoever for any loss arising from the use of this presentation.

Sensitivity: Public
Thank You