2019/20 – q1 performance measures report
TRANSCRIPT

2019/20 – Q1 Performance Measures Report
Attachment B: 2019/20 Halifax Transit Q1 Performance Measures Report

Contents Boardings & Revenue .................................................................................................................................... 1
Historical Boardings & Revenue ................................................................................................................ 1
Revenue – Actual vs. Planned ................................................................................................................... 3
Mean Distance Between Failures ................................................................................................................. 5
Mean Distance Between Service Calls .......................................................................................................... 6
Bus Maintenance Cost – Quarter Average vs Budget ................................................................................... 7
Fuel Price – Year to Date Average vs Budget ................................................................................................ 7
Access-A-Bus Trip Details .............................................................................................................................. 8
Passenger Overloads ..................................................................................................................................... 9
Customer Service – All Services .................................................................................................................... 9
Boardings & Passengers per Hour............................................................................................................... 11
Average Daily Boardings by Service Day ................................................................................................. 12
Passengers per Hour ............................................................................................................................... 12
Boardings & Passengers per Hour........................................................................................................... 13
Express Service Peak Boardings and Passengers per Trip ....................................................................... 15
Boardings by District ............................................................................................................................... 16
Weekday Boardings by District – All Day ............................................................................................ 16
Weekday Boardings by District – AM Peak Period ............................................................................. 17
Passengers per Hour by Route ................................................................................................................ 18
Express Service Peak Passengers per Trip by Route ............................................................................... 19
Regional Express Peak Passengers per Trip by Route ............................................................................. 19
Ferry Passengers per Hour ...................................................................................................................... 19
On-Time Performance ................................................................................................................................. 20
Overall Network On-Time Performance ................................................................................................. 20
Weekday On-Time Performance ............................................................................................................. 21
Weekday Peak Period On-Time Performance ........................................................................................ 23
Express Service On-Time Performance ................................................................................................... 25
Loss Of Service ............................................................................................................................................ 26

Halifax Transit 2019/20 – Q1 Performance Measures Report 1
Boardings & Revenue Revenue and boardings are reported to demonstrate how well transit services were used over the quarter, in comparison to the same quarter the previous year.
By installing Automatic Passenger Counter (APC) systems throughout the network in the 2017/18 fiscal year, Halifax Transit is now able to track the number of boardings by counting passengers entering the bus at each stop, instead of estimating boardings from revenue. Therefore, the data source for boardings in the chart below changed effective 2017/18. When a trip requires a transfer, the boardings metric would count the same passenger each time they entered a new bus. This method of data collection provides a more accurate measure of how passengers are utilizing the system, as assumptions related to multi-use revenue sources, such as tickets and passes, are removed, and replaced by physical counts.
In the first quarter, Conventional boardings increased 10% from this quarter last year, Ferry boardings dropped 2.9% and Access-A-Bus boardings increased slightly by 0.2%. Overall, system wide boardings increased this quarter by 9.3% compared to last year. Overall revenue this quarter increased 6.3% from last year. The route network changes implemented in August 2018 have resulted in more passengers transferring at the Lacewood Terminal and Mumford Terminal, which partly contributes to the increase in boardings, but is estimated to account for less than 1% of the overall network wide increase in boardings.
Historical Boardings & Revenue
5.62 m 5.41 m 5.88 m 6.33 m6.98 m
$7.4 m $7.09 m $6.88 m $7.22 m $7.77 m
$0 m
$2 m
$4 m
$6 m
$8 m
$10 m
0 m
2 m
4 m
6 m
8 m
10 m
15/16 16/17 17/18 18/19 19/20
Conventional Boardings & Revenue - Q1
Boardings
Revenue
411.8k 470.9k 451.1k 442.8k 430.k
$663.8k$755.7k $718.6k $699.6k $662.k
$0
$250,000
$500,000
$750,000
$1,000,000
0
250,000
500,000
750,000
1,000,000
15/16 16/17 17/18 18/19 19/20
Ferry Boardings & Revenue - Q1
Boardings
Revenue

Halifax Transit 2019/20 – Q1 Performance Measures Report 2
42.6k 42.6k 43.2k 46.7k 46.8k
$72.5k $69.5k $73.5k $75.5k$67.1k
$0
$20,000
$40,000
$60,000
$80,000
$100,000
0
20,000
40,000
60,000
80,000
100,000
15/16 16/17 17/18 18/19 19/20
Access-A-Bus Boardings & Revenue - Q1
Boardings
Revenue
6.07 m 5.92 m
6.38 m
6.82 m
7.46 m
$8.13 m
$7.92 m$7.67 m
$7.99 m
$8.5 m
$0 m
$1 m
$2 m
$3 m
$4 m
$5 m
$6 m
$7 m
$8 m
$9 m
$10 m
0 m
1 m
2 m
3 m
4 m
5 m
6 m
7 m
8 m
9 m
10 m
15/16 16/17 17/18 18/19
Halifax Transit Boardings & Revenue - Q1
Boardings
Revenue

Halifax Transit 2019/20 – Q1 Performance Measures Report 3
Revenue – Actual vs. Planned The following charts provide an indication of how much revenue has been generated by each service type and by Halifax Transit in comparison to the planned budget revenue. Conventional revenue in the first quarter increased 7.6% from this time last year and is trending 6% above the planned amount. Ferry revenue to date decreased 5.4% from last year and is trending 1.2% below the planned amount. Access-A-Bus revenue to date has decreased 11% and is trending 4.3% below the planned amount. Overall revenue to date has increased 6.3% from this time last year and stands at 5.4% higher than the planned amount.
$7,769,229$7,300,000
$0
$1,000,000
$2,000,000
$3,000,000
$4,000,000
$5,000,000
$6,000,000
$7,000,000
$8,000,000
$9,000,000
Actual Planned
2019/20 Q1 Actual vs Planned Conventional Revenue
$662,042 $670,000
$0
$100,000
$200,000
$300,000
$400,000
$500,000
$600,000
$700,000
$800,000
Actual Planned
2019/20 Q1 Actual vs Planned Ferry Revenue

Halifax Transit 2019/20 – Q1 Performance Measures Report 4
$67,140$70,000
$0
$10,000
$20,000
$30,000
$40,000
$50,000
$60,000
$70,000
$80,000
Actual Planned
2019/20 Q1 Actual vs Planned Access-A-Bus Revenue
$8,498,411$8,040,000
$0
$1,000,000
$2,000,000
$3,000,000
$4,000,000
$5,000,000
$6,000,000
$7,000,000
$8,000,000
$9,000,000
Actual Planned
2019/20 Q1 Actual vs Planned Halifax Transit Revenue

Halifax Transit 2019/20 – Q1 Performance Measures Report 5
Mean Distance Between Failures Halifax Transit consulted with a number of transit authorities in Canada, and the Canadian Urban Transit Association (CUTA), to understand the difference between past maintenance performance indicators and the industry standard. As a consequence, it was determined that Halifax Transit had reported all maintenance service calls, while other jurisdictions removed service calls associated with auxiliary equipment such as AVL, communication equipment, fareboxes, alarms, lights, passenger-related issues, etc. Also, some jurisdictions reported the number of change-offs (buses discontinuing their scheduled service) to be reflected as failures instead of service calls. Halifax Transit has selected to continue reporting service calls but as a separate metric; Mean Distance Between Service Calls. In order to remain consistent with the industry standard, a new metric defined as Mean Distance Between Failures (MDBF) has been selected and defined below.
Halifax Transit’s Mean Distance Between Failures (MDBF) is the distance in kms covered between failures. CUTA references the Federal Transit Administration’s definition of failures which states that there are two classes of failures. The first being major mechanical system failures, which is the “failure of some mechanical element of the revenue vehicle that prevents the vehicle from completing a scheduled revenue trip or from starting the next scheduled revenue trip because actual movement is limited or because of safety concerns.” The second type is other mechanical system failures which is the “failure of some other mechanical element of the revenue vehicle that, because of local agency policy, prevents the revenue vehicle from completing a scheduled revenue trip or from starting the next scheduled revenue trip even though the vehicle is physically able to continue in revenue service”. Therefore, the MDBF is equal to the number of instances whereby a failure resulted in a change-off of the bus or service being lost. This metric does not consider failures resulting from passenger-related events (i.e. sickness on the bus), farebox defects or accident damages as they do not impede the scheduled revenue trips, which aligns with other transit authorities surveyed. Due to the nature of the data sources, Halifax Transit is looking to improve the accuracy of this number by removing failures that were logged, but resulted in “no fault found”. Currently, the reported number does include these items.
Bus Maintenance had set a target of 7,000 kms between failures in 2018. As this target has been successfully met, the target in 2018, we will be increasing the target to 7,500 kms for 2019. The target for this KPI shall be revisited on annual basis to promote continuous improvement, which may be achieved by implementation and support of quality and preventative maintenance initiatives.
For the first quarter of 2019, the MDBF for conventional transit was 8,393 kms. This is equivalent to a 13.97% improvement from the first quarter of previous year (2018). Bus Maintenance will continue to monitor this KPI and further develop quality initiatives to decrease aftertreatment and cooling system defects.

Halifax Transit 2019/20 – Q1 Performance Measures Report 6
Mean Distance Between Service Calls In order to continue monitoring the number of maintenance service calls, this will be reflected as a separate metric; Mean Distance Between Service Calls (MDBS). This number will reflect the distance in kilometres covered on average between maintenance service calls. This number includes all instances of service calls including issues with secondary equipment, passenger-related events and damages to the bus resulting from minor accidents. Bus Maintenance is continuing to benchmark this metric in order to provide a target.
For the first quarter of 2019, the MDBS for conventional transit was 3,833 kms. In comparison to the first quarter of 2018/19 (3,756 kms), this is an improvement of 2%. For the first quarter of 2019, the MDBS for Access-A-Bus service was 38,879 kms. Bus Maintenance will continue to monitor this metric in order to reduce service calls.
54686092
5598 5887
73646433 6714
80548393
0
1000
2000
3000
4000
5000
6000
7000
8000
9000
Q1 Q2 Q3 Q4
Mean Distance Between Failures
2017/18 2018/19 2019/20 Target
3475
3789
35823473
3756
3591
3252
37383833
2800
3000
3200
3400
3600
3800
4000
Q1 Q2 Q3 Q4
Mean Distance Between Service Calls
2017/18 2018/19 2019/20

Halifax Transit 2019/20 – Q1 Performance Measures Report 7
Bus Maintenance Cost – Quarter Average vs Budget In the first quarter maintenance costs were $1.22/km, while the budgeted maintenance cost was $1.28/km. Therefore, in the first quarter the average cost per km was under budget by $0.07/km or 5.5%.
Fuel Price – Year to Date Average vs Budget The budgeted fuel price for 2019/20 was set at 80 cents/litre. In the first quarter, the average fuel price to date was 78 cents/litre, 2 cents lower than the budgeted cost per litre.
$1.22$1.28
$0.00
$0.20
$0.40
$0.60
$0.80
$1.00
$1.20
$1.40
Average Price Budget Price
Maintenance Cost per Kilometre - Q1 Average vs Budget
$0.777 $0.800
$0.00
$0.10
$0.20
$0.30
$0.40
$0.50
$0.60
$0.70
$0.80
$0.90
Average Price Budget Price
Fuel Price per Litre - YTD Average vs Budget

Halifax Transit 2019/20 – Q1 Performance Measures Report 8
Access-A-Bus Trip Details Access-A-Bus trip details are tracked monthly to provide an indication of efficiency in Access-A-Bus usage and booking. In April 2018 Access-A-Bus completed a scheduling software upgrade and process improvement review. After introducing these new, standardized processes, scheduling effectiveness has improved. These changes have resulted in statistics, such as the number of trip cancellations, no shows and errors, being recategorized and therefore may not be comparable with prior years.
In the first quarter of 2019/20, 121 fewer trips were operated compared to first quarter last year, a decrease of 0.3%. The waitlist increased by 128% this quarter compared to last year, due to an increase in late cancellations and no shows. No shows and late cancellations are particularly challenging to fill, having little to no time to fill these bookings with passengers from the waitlist.
42,476 42,355
477 191
9,553 10,343
781 1,783630774
0
10,000
20,000
30,000
40,000
50,000
60,000
18/19 19/20
Access-A-Bus Trip Details - Q1
Actual Trips Operated Not Provided Cancelled Waitlisted No Shows

Halifax Transit 2019/20 – Q1 Performance Measures Report 9
Passenger Overloads Halifax Transit tracks overloads that are reported to help match scheduling requirements to passenger demands. The following graph shows the most commonly overloaded routes during the quarter. This does not include all overloads, as many go unreported for a number of reasons. Work is underway to improve the reporting process to ensure the data provides a more accurate reflection of actual conditions.
Customer Service – All Services Customer service statistics are measured monthly using the Hansen Customer Relationship Management software along with Crystal Reports. Feedback is first categorized by subject matter and then divided into two categories: feedback resolved within service standard and feedback resolved outside service standard. The service standard varies depending on the subject matter.
This quarter, 53% of feedback received was related to bus operators, the remaining 47% is comprised of feedback regarding service issues, planning and scheduling, bus stops and shelters, marketing, compliments and other miscellaneous comments. Halifax Transit aims to address 90% of feedback within service standard. This quarter 92% of customer feedback was resolved within standard.
Call volumes to the Departures Line (902-480-8000) are displayed by day of the week. In the first quarter of 2019/20, average call volumes were lower than this time last year for both weekdays as well as for Saturdays and Sundays.
11
7
6
5
4 4
3 3 3
2 2 2
1 1 1
0
2
4
6
8
10
12
80 138 9A/B 4 10 136 1 90 2 14 60 29 7 61 82
Repo
rted
Ove
rload
Inci
denc
es
Route
2019/20 Q1 Reported Overload Incidences by Route

Halifax Transit 2019/20 – Q1 Performance Measures Report 10
1%
4%
6%
53%
8%
6%
7%
6% 9%
Summary of Customer Feedback - Q1
Transit Technology
Planning & Scheduling
Bus Stops & Shelters
Bus Operators
Service Issues
Access-A-Bus
Marketing
Compliments
Other Feedback
Feedback resolved within standard: 92%
2%4% 6%
56%
7%5%
7%5%
8%
1%4%
6%
53%
9%6% 7% 7%
9%
0%
10%
20%
30%
40%
50%
60%
Customer Feedback Comparison - Q1
2018/19 2019/20

Halifax Transit 2019/20 – Q1 Performance Measures Report 11
Boardings & Passengers per Hour Automatic Passenger Counter (APC) data is now being been used to report bus ridership statistics. The APCs provide data within a 90% degree of accuracy. Boardings by Route demonstrate passenger usage during the past quarter. APC data has been collected since September 2016. The standard deviation is included to demonstrate the degree of variance in boardings from the daily average passenger count.
Average weekday boardings in the first quarter were 97,169 ± 6,790 (7.0% variance). Average Saturday boardings this quarter were 55,490 ± 5,791 (10.4% variance). Average Sunday boardings this quarter were 38,803 ± 5,648 (14.6% variance).
New routes implemented on August 20, 2018 as part of the Moving Forward Together Plan are not comparable to individual routes they have replaced and as such are not compared by route. Boardings by route comparisons for the following routes will resume in the second quarter of 2019/20.
Corridor Routes: 2 Fairview 3 Crosstown 4 Universities
Express Routes: 123 Timberlea Express 135 Flamingo Express 136 Farnham Gate Express 137 Clayton Park Express 138 Parkland Express
Local Routes: 21 Timberlea 28 Bayers Lake 30 Clayton Park West 39 Flamingo
Rural Route: 433 Tantallon
62195844
4544
53964965
3851
51824806
3909
0
1000
2000
3000
4000
5000
6000
7000
Weekday Saturday Sunday
Pass
enge
rsAverage Departures Line Call Volumes - Q1
2017/18 2018/19 2019/20

Halifax Transit 2019/20 – Q1 Performance Measures Report 12
Average Daily Boardings by Service Day
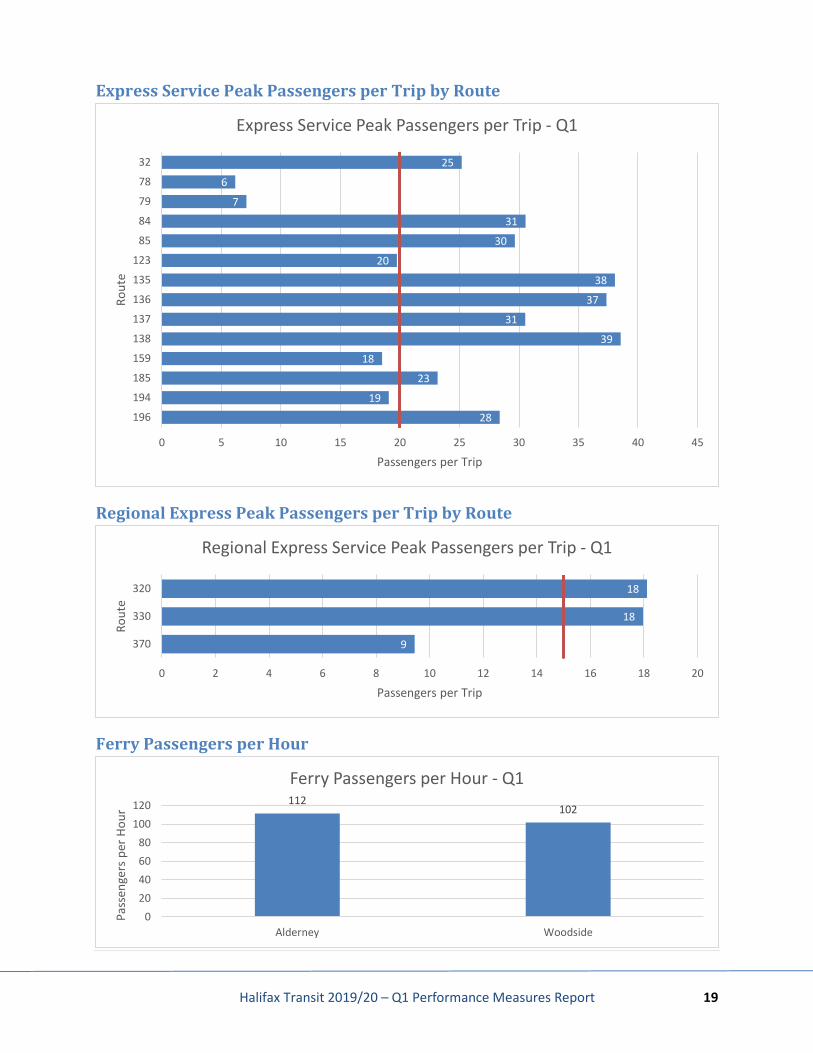
Passengers per Hour Passengers per hour measures the volume of passengers carried per service hour by route. Due to differences in service model/design, Express Routes are measured instead by passengers per trip. Ridership fluctuates significantly by season and therefore figures are compared to the same quarter in the previous year. Conventional route targets vary by time of day and are not illustrated at this time as data is being presented over the entire service day only. Express routes have a ridership target of 20 passengers per trip, while Regional Express Routes have a target of 15 passengers per trip.
88,3
92 93,6
80
97,3
71
94,4
75
97,1
69
50,3
55 55,3
90
52,8
64
52,7
96
55,4
90
33,7
64 39,1
52
36,3
42
36,1
84
38,8
03
0
20,000
40,000
60,000
80,000
100,000
120,000
Q1 Q2 Q3 Q4 Q1
2018/19 2019/20
Average Daily Boardings Comparison
Weekday Saturday Sunday

Halifax Transit 2019/20 – Q1 Performance Measures Report 13
Boardings & Passengers per Hour
Boardings Pass/Hr Boardings Pass/Hr Boardings Pass/Hr Boardings Pass/Hr Boardings Pass/Hr Boardings Pass/Hr1 9,265 59 9,610 62 7,169 64 8,044 70 4,914 58 4,595 53
2 (new) 4,717 44 4,535 45 2,303 302 (removed) 2,600 43 2,023 38 1,009 33
3 (new) 6,587 44 3,767 44 3,412 364 (new) 4,468 36 2,117 42 1,549 34
4 (removed) 2,296 38 1,787 31 1,124 355 114 31 114 277 4,569 40 5,026 45 3,205 34 3,741 40 1,845 36 1,870 35
9A/B 5,882 34 6,864 41 3,335 45 4,085 56 2,521 35 2,710 389A 3,946 36 4,644 43 1,643 46 1,944 55 1,119 32 1,152 339B 1,936 31 2,220 38 1,692 44 2,141 56 1,402 38 1,558 4210 4,467 41 4,681 44 2,739 37 3,487 47 1,799 37 1,913 3911 93 40 128 5314 2,327 37 2,484 39 1,135 34 1,367 40 1,007 35 935 3115 208 14 215 14 129 11 162 16 126 10 148 12
16 (removed) 1,091 23 659 1517 (removed) 1,139 2918 (removed) 1,625 27 1,287 26 694 27
21 1,180 27 1,002 34 672 18 869 25 323 18 475 2622 555 16 648 20 456 13 488 15 331 9 365 11
23 (removed) 361 2028 (new) 1,429 39 1,445 35 575 31
29 2,608 28 3,154 35 1,488 24 1,974 32 1,224 20 1,268 2130A/B (new) 852 24 580 17 299 15
30A (new) 469 25 304 18 129 1130B (new) 383 22 276 16 170 2039 (new) 1,194 26 937 19 384 18
41 1,128 38 1,264 3842 (removed) 1,136 31
51 1,024 43 1,108 47 584 35 618 37 315 37 305 34
Q1 Comparison - Average Daily Boardings by Route
RouteWeekday Saturday Sunday
18/19 19/20 18/19 19/20 18/19 19/20

Halifax Transit 2019/20 – Q1 Performance Measures Report 14
Boardings Pass/Hr Boardings Pass/Hr Boardings Pass/Hr Boardings Pass/Hr Boardings Pass/Hr Boardings Pass/Hr52 (removed) 5,841 49 4,092 43 3,781 43
53 1,304 50 1,271 50 787 52 837 55 384 50 333 4054 744 34 847 40 460 30 591 38 254 26 249 2555 393 18 401 19 207 13 273 18 187 12 182 1256 851 24 953 29 875 25 1,141 32 588 18 582 1857 556 13 535 13 264 9 284 9 135 8 138 858 692 25 719 26 422 23 507 27 352 20 325 1959 1,967 25 1,955 25 766 33 809 35 486 20 487 2160 2,490 33 2,743 37 1,751 44 1,971 49 1,258 44 1,193 4261 2,185 28 2,229 29 1,054 27 1,233 32 912 24 876 2362 800 25 830 27 515 23 569 25 278 17 268 1763 711 40 781 4464 323 30 587 3265 241 14 258 16 93 7 105 8 49 8 51 866 1,448 23 1,547 26 483 30 517 32 345 22 284 1868 1,269 26 1,389 29 785 28 848 29 492 18 504 1872 1,340 29 1,382 30 950 20 1,090 23 511 19 468 1780 4,031 33 4,251 34 3,423 33 3,798 36 2,726 29 2,514 2881 1,264 24 1,414 2782 962 21 980 21 228 10 248 11 101 9 98 983 154 12 149 11 85 9 92 10 45 10 40 987 1,324 30 1,256 28 1,034 21 1,237 25 543 18 523 1888 80 14 94 16 57 11 75 14 20 9 22 989 436 19 529 2590 1,148 24 1,280 27 746 17 957 21 473 19 418 16
400 234 18 197 16 82 12 81 11 62 9 55 7401 139 11 154 13
433 (new) 168 23 51 10Alderney 3,427 114 3,350 112 4,114 235 4,049 231 2,170 124 2,879 165Woodside 2,207 105 2,139 102
Q1 Comparison - Average Daily Boardings by Route
RouteWeekday Saturday Sunday
18/19 19/20 18/19 19/20 18/19 19/20

Halifax Transit 2019/20 – Q1 Performance Measures Report 15
Express Service Peak Boardings and Passengers per Trip
Boardings Pass/Trip Boardings Pass/Trip31 (removed) 275 31
32 451 25 451 2533 (removed) 153 3834 (removed) 680 4035 (removed) 260 29
78 82 6 87 679 94 8 85 784 892 33 852 3185 115 29 118 30
123 (new) 285 20135 (new) 531 38136 (new) 596 37137 (new) 365 31138 (new) 538 39
159 519 17 553 18185 729 23 738 23194 126 16 152 19196 116 29 113 28320 188 16 216 18330 309 14 376 18370 116 10 103 9
19/20
Q1 Comparison - Average Daily Peak Boardings by Route
RouteWeekday
18/19
Halifax Transit 2019/20 – Q1 Performance Measures Report 16
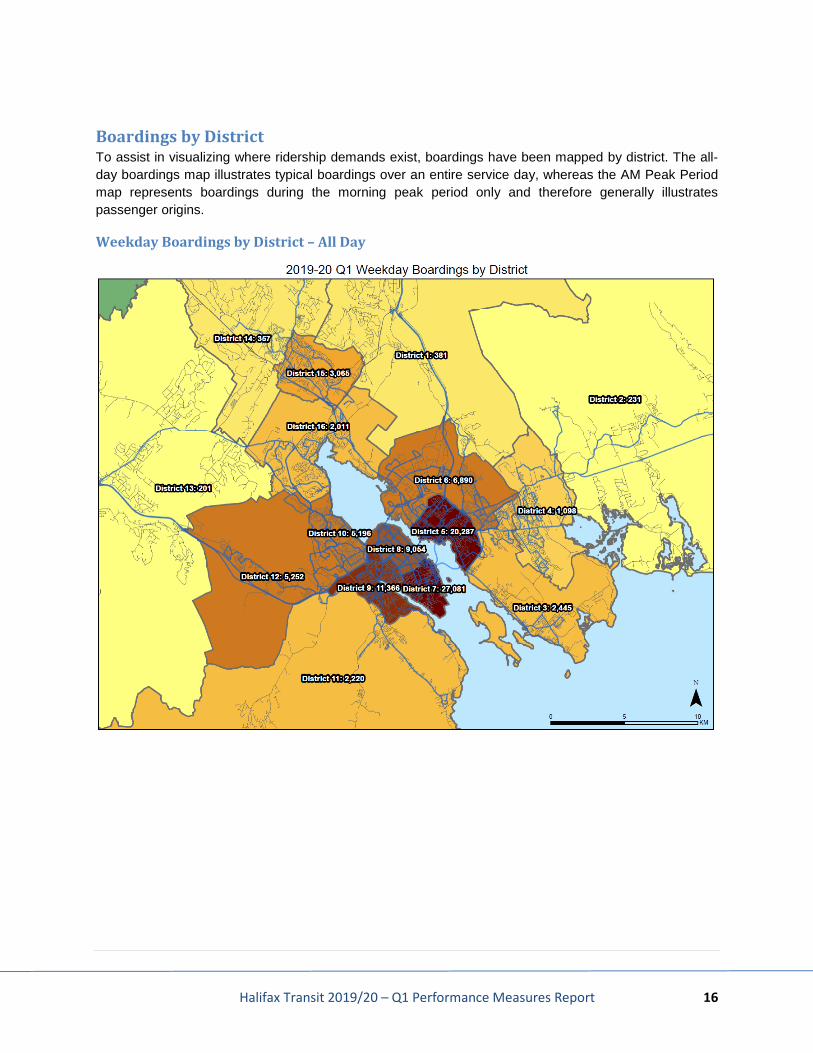
Boardings by District To assist in visualizing where ridership demands exist, boardings have been mapped by district. The all- day boardings map illustrates typical boardings over an entire service day, whereas the AM Peak Period map represents boardings during the morning peak period only and therefore generally illustrates passenger origins.
Weekday Boardings by District – All Day

Halifax Transit 2019/20 – Q1 Performance Measures Report 17
Weekday Boardings by District – AM Peak Period

Halifax Transit 2019/20 – Q1 Performance Measures Report 18
Passengers per Hour by Route
6244
4436
2745
4144
5339
1434
2039
3524
3026
3847
5040
1929
1326
2537
2927
4432
1626
2930
3427
2111
1625
2716
1310
0 10 20 30 40 50 60 70
123457
9A/B1011141521222829
30A/B323941515354555657585960616263646566687280818283888990
400401433
Passengers per Hour (Excluding Express Routes) - Q1
Halifax Transit 2019/20 – Q1 Performance Measures Report 19
Express Service Peak Passengers per Trip by Route
Regional Express Peak Passengers per Trip by Route
Ferry Passengers per Hour
25
6
7
31
30
20
38
37
31
39
18
23
19
28
0 5 10 15 20 25 30 35 40 45
32
78
79
84
85
123
135
136
137
138
159
185
194
196
Passengers per Trip
Rout
eExpress Service Peak Passengers per Trip - Q1
18
18
9
0 2 4 6 8 10 12 14 16 18 20
320
330
370
Passengers per Trip
Rout
e
Regional Express Service Peak Passengers per Trip - Q1
112102
020406080
100120
Alderney Woodside
Pass
enge
rs p
er H
our
Ferry Passengers per Hour - Q1

Halifax Transit 2019/20 – Q1 Performance Measures Report 20
On-Time Performance On-time performance is a measure of route reliability and is tracked monthly to demonstrate schedule adherence across the network of routes. Terminals and select bus stops along each route are classified as time-points and have assigned and publicized scheduled arrival times. On-time performance demonstrates the percentage of observed time-point arrivals that are between one minute early and three minutes late.
Transit industry standard targets for on-time performance tend to range between 85% and 90%, although service types are not always comparably grouped, nor are schedule adherence definitions consistent between agencies. Halifax Transit will analyze on-time performance across the network in order to establish a benchmark and target for the minimum percentage of trips to depart on time.
Compared to the first quarter last year, on-time performance dropped from 80% to 77%. This included the implementation of new routes in August 2018, some of which were on new streets where previous transit data was unavailable. The schedule of some of these routes will be adjusted in November 2019 in order to improve the on time performance now that one year of data has been collected and analyzed.
Overall Network On-Time Performance
80%76% 77%
80%77%
0%
10%
20%
30%
40%
50%
60%
70%
80%
90%
100%
Q1 Q2 Q3 Q4 Q1
2018/19 2019/20
Halifax Transit Overall On-Time Performance

Halifax Transit 2019/20 – Q1 Performance Measures Report 21
Weekday On-Time Performance
74%
72%
80%
72%
79%
80%
79%
87%
80%
74%
82%
67%
94%
89%
74%
82%
82%
71%
84%
77%
96%
71%
69%
77%
77%
59%
77%
68%
84%
79%
64%
76%
57%
88%
79%
82%
93%
70%
81%
87%
71%
86%
85%
95%
0% 10% 20% 30% 40% 50% 60% 70% 80% 90% 100%
1
*2
*3
*4
5
7
9A/B
10
11
14
15
21
22
28
29
30A/B
*39
41
51
53
54
55
56
Rout
e N
umbe
r
Q1 Weekday On Time Performance
2018/19
2019/20
* Route 2 is compared to former Route 2; Route 3 to former Route 52; Route 4 to former Routes 17, 18 and 42;and Route 39 to former Route 16.

Halifax Transit 2019/20 – Q1 Performance Measures Report 22
93%
96%
84%
85%
78%
81%
93%
75%
91%
73%
83%
80%
72%
81%
85%
94%
72%
92%
85%
79%
86%
86%
88%
93%
94%
82%
87%
70%
77%
89%
85%
91%
73%
77%
78%
70%
65%
81%
97%
68%
91%
88%
63%
86%
85%
81%
0% 10% 20% 30% 40% 50% 60% 70% 80% 90% 100%
57
58
59
60
61
62
63
64
65
66
68
72
80
81
82
83
87
88
89
90
320
400
401
Rout
e N
umbe
rQ1 Weekday On Time Performance
2018/19
2019/20

Halifax Transit 2019/20 – Q1 Performance Measures Report 23
Weekday Peak Period On-Time Performance
58%
58%
78%
52%
79%
77%
73%
85%
80%
62%
77%
60%
92%
88%
64%
73%
74%
67%
78%
79%
53%
54%
71%
70%
59%
71%
64%
79%
79%
48%
72%
56%
80%
75%
78%
93%
57%
67%
82%
69%
80%
82%
0% 10% 20% 30% 40% 50% 60% 70% 80% 90% 100%
1
*2
*3
*4
5
7
9A/B
10
11
14
15
21
22
28
29
30A/B
*39
41
51
53
54
55
Rout
e N
umbe
rQ1 Weekday Peak On-Time Performance
2018/19
2019/20
* Route 2 is compared to former route 2; Route 3 to former Route 52; Route 4 to former Routes 17, 18 and 42; and Route 39 to former Route 16.

Halifax Transit 2019/20 – Q1 Performance Measures Report 24
96%
93%
95%
75%
83%
68%
77%
92%
73%
88%
52%
72%
66%
67%
75%
77%
95%
64%
90%
84%
73%
82%
85%
96%
93%
93%
73%
86%
57%
73%
92%
81%
89%
54%
64%
63%
59%
55%
70%
97%
55%
90%
86%
48%
81%
83%
0% 10% 20% 30% 40% 50% 60% 70% 80% 90% 100%
56
57
58
59
60
61
62
63
64
65
66
68
72
80
81
82
83
87
88
89
90
320
400
Rout
e N
umbe
rQ1 Weekday Peak On-Time Performance
2018/19
2019/20

Halifax Transit 2019/20 – Q1 Performance Measures Report 25
Express Service On-Time Performance
On-time performance demonstrates the percentage of time-point arrivals that are between one minute early and three minutes late. When route schedules are created, the variability of travel times between timepoints is taken into account. Generally, routes are scheduled at the higher end of observed travel times in order to be on time. This means that on some trips, buses will layover at timepoints to avoid departing early. Schedules for express routes were created based on shorter travel times to keep buses moving toward destinations and prevent them from laying over. The below graph demonstrates on-time performance for express routes based on timepoints at the beginning and end of the routes, as well as any terminals and park and rides. This includes Scotia Square, Summer Street, and the future Wrights Cove Terminal location on Marketplace Drive, but does not include other on-street timepoints.
82%
100%
93%
76%
78%
82%
81%
71%
64%
86%
87%
82%
72%
100%
90%
67%
67%
64%
59%
60%
66%
57%
82%
69%
66%
52%
86%
79%
77%
0% 10% 20% 30% 40% 50% 60% 70% 80% 90% 100%
32
78
79
84
85
123
135
136
137
138
159
185
194
196
320
330
370
Rout
e N
umbe
r
2019/20 Q1 Express Service On Time Performance
2018/19 Q1
2019/20 Q1

Halifax Transit 2019/20 – Q1 Performance Measures Report 26
Loss Of Service Loss of service is the total number of scheduled service hours that were not completed. If a trip was able to be filled or partially filled by a standby bus, that time would not be included in this figure. In the first quarter, the total loss of service was 881 hours and 27 minutes, this equates to 0.42% of the revenue hours for the quarter.
0.20%
0.30%
0.24%
0.32%
0.37%
0.59%
0.00%
0.10%
0.20%
0.30%
0.40%
0.50%
0.60%
0.70%
April May June
Month
Loss of Service as a Percentage of Revenue Hours Q1
2018-19 2019-20