2019 - sullivancotter
TRANSCRIPT
Survey data effective January 1, 2019
2019Medical Group Compensation and Productivity Survey Report
© 2019 SullivanCotter, Inc. All rights reserved.200 W. Madison Street, Suite 2450Chicago, IL 60606-3416
2019
MEDICAL GROUP
COMPENSATION
AND PRODUCTIVITY
SURVEY REPORT
Survey data effective January 1, 2019

LICENSE AGREEMENT
LICENSE AGREEMENT
By accessing or downloading the Survey Report files online or by opening the
packaging for this Survey Report, you agree to the terms of this License
Agreement (this “Agreement”). If you do not agree to these terms and have not
yet accessed or downloaded the Survey Report files or opened the packaging
for this Survey Report, you may cancel your online purchase or download at this
time or you may return this Survey Report to SullivanCotter, Inc. for a full refund
within thirty (30) days of receipt, but you may not access or download the Survey
Report files or open the packaging for, or otherwise use, this Survey Report.
Accessing or downloading the Survey Report files or opening the packaging, or
otherwise using, this Survey Report binds you to this Agreement.
This Agreement is entered into by and between SullivanCotter, Inc. ("SullivanCotter") and the purchaser or
participant of this Survey Report (the “Licensee”). In consideration of the mutual covenants in this Agreement,
SullivanCotter and the Licensee agree as follows:
Grant of License. This Survey Report contains the aggregation of compensation data and other data provided to
SullivanCotter by its survey participants, statistics, tables, reports, research, aggregations, calculations, data
analysis, formulas, summaries, content, text and other information and materials provided to the Licensee by
SullivanCotter through any other means, whether digital or hard copy, related thereto (the “Aggregated Data”).
SullivanCotter hereby grants the Licensee a nonexclusive, nontransferable, nonassignable (in connection with a
sale of assets, merger, change of control, reorganization or by operation of law), nonsublicensable, revocable,
limited license to use the Aggregated Data as expressly permitted by this Agreement. The Licensee has the right
to use the Aggregated Data and to reproduce excerpts of them in reports of memoranda created by the Licensee
in the regular course of its own internal business or in the regular course of providing consulting services to its
customers, so long as the Aggregated Data are properly cited as provided by SullivanCotter, Inc. “Regular course
of providing consulting services to its customers or in the regular course of its own internal business” exclusively
means (a) to copy and distribute internally to officers and employees of the Licensee in accordance with
SullivanCotter’s additional copy policy, (b) to prepare reports for internal business discussions and analysis and
(c) if the Licensee is a consultant or consulting firm, to use limited portions of the Aggregated Data in conjunction
with other data and information to provide custom analyses and reports for the Licensee's clients’ own internal
business purposes.
iii

LICENSE AGREEMENT
Limitations on Use. Notwithstanding anything to the contrary, Aggregated Data must not be resold or used, in
whole or in part, in stand-alone product, including externally available research, reports, models, tools, programs
and algorithms, whether such products are provided or used free or for a fee, and even if the Aggregated Data are
combined with other data sources. Except as expressly provided in this Agreement, or as expressly permitted in a
prior written consent from SullivanCotter or other agreement with SullivanCotter, the Licensee must not (a) copy or
distribute the Aggregated Data for any other use, including, without limitation, marketing or sales activities, website
posts, use by any third party or distribution of the Survey Report in part or in its entirety, (b) reproduce, store in a
retrieval system or transmit in any form or by any means, electronic, mechanical, photocopying, recording or
otherwise the Aggregated Data, (c) authorize any other parties, whether contractors, clients or agents who are not
direct employees of the Licensee to access the Aggregated Data or (d) permit, assist or encourage (directly or
indirectly) any unauthorized public or third-party access to or use of the Aggregated Data. The Licensee may not
use the name SullivanCotter, Inc. in any type of marketing or sales activities.
Rights in Data. The Aggregated Data are the proprietary information of SullivanCotter and are based on the
confidential information of SullivanCotter. The Aggregated Data are highly valuable to SullivanCotter and
SullivanCotter takes steps to protect its Aggregated Data. The Licensee agrees to treat the Aggregated Data
and all other proprietary information of SullivanCotter as confidential and take steps to protect the Aggregated
Data from unauthorized disclosure and use. The Licensee agrees that the Survey Report and the Aggregated
Data are protected by the U.S. Copyright Act and other intellectual property laws and international treaties. The
Licensee agrees not to challenge SullivanCotter’s rights or ownership in the Aggregated Data or to challenge the
proprietary nature of the Aggregated Data. This Agreement does not convey to the Licensee any proprietary
interest in or other ownership of the Aggregated Data or the underlying compensation data or other information.
The Licensee acknowledges that SullivanCotter owns the Aggregated Data, including all copyrights, patents, trade
secrets and other proprietary rights therein. There is no joint venture, partnership, agency or fiduciary relationship
existing between the parties and the parties do not intend to create any such relationship by this Agreement.
The Licensee does not have the authority to act for or to bind SullivanCotter in any respect whatsoever. The
Aggregated Data may not be used by any individual or company without first obtaining a license from
SullivanCotter.
Warranties Disclaimed and Limitation of Liability. THE AGGREGATED DATA ARE PROVIDED “AS IS.”
SULLIVANCOTTER DISCLAIMS ALL RESPONSIBILITY OF ANY KIND, ORAL OR WRITTEN, EXPRESS OR
IMPLIED, INCLUDING, BUT NOT LIMITED TO, FITNESS FOR A PARTICULAR PURPOSE, AVAILABILITY,
ACCURACY, OMISSIONS, COMPLETENESS OR CORRECTNESS OF INFORMATION OR
NON-INFRINGEMENT, INTEGRATION, SECURITY OR ANY OTHER WARRANTY IN CONNECTION WITH
ANYTHING DONE OR SUPPLIED BY SULLIVANCOTTER PURSUANT TO THIS AGREEMENT.
SULLIVANCOTTER SHALL IN NO EVENT WHATSOEVER BE LIABLE TO THE LICENSEE OR ANY OTHER
PARTY FOR ANY INDIRECT, SPECIAL, CONSEQUENTIAL, INCIDENTAL OR SIMILAR DAMAGES,
INCLUDING DAMAGES FOR LOST DATA OR ECONOMIC LOSS EVEN IF SULLIVANCOTTER HAS BEEN
NOTIFIED OF THE POSSIBILITY OF SUCH LOSS. SOME JURISDICTIONS DO NOT ALLOW THE EXCLUSION
OR LIMITATION OF IMPLIED WARRANTIES OR LIABILITY FOR INCIDENTAL OR CONSEQUENTIAL
DAMAGES, IN WHICH CASE THESE PROVISIONS MAY NOT BE FULLY APPLICABLE. THIS PARAGRAPH
SHALL SURVIVE THE TERMINATION OF THIS AGREEMENT. IN NO EVENT WILL THE LIABILITY OF
SULLIVANCOTTER EXCEED THE TOTAL AMOUNT PAID BY THE LICENSEE UNDER THIS AGREEMENT OR,
IF NONE, THEN THE AMOUNT OF ONE THOUSAND DOLLARS. IF THE LICENSEE IS DISSATISFIED WITH
THE AGGREGATED DATA OR ANYTHING ELSE DONE OR SUPPLIED BY SULLIVANCOTTER PURSUANT
TO THIS AGREEMENT, THE LICENSEE’S SOLE REMEDY IS TO TERMINATE THIS AGREEMENT. This
paragraph shall be enforceable to the maximum extent permitted by law.
iv
LICENSE AGREEMENT
Indemnification. The Licensee agrees to indemnify, hold harmless and defend SullivanCotter from and against any
action, cause, claim, damage, debt, demand or liability, including reasonable costs and attorneys' fees, asserted
by any person, arising out of or relating to (a) the Licensee's authorized or unauthorized use of the Aggregated
Data or (b) the Licensee's breach of this Agreement.
Term and Termination. The term of this Agreement is perpetual, subject to this section. SullivanCotter reserves
the right to terminate this Agreement upon written notice to the Licensee if the Licensee breaches any of the
terms of this Agreement. In addition, if SullivanCotter, in its sole judgment, believes that the Aggregated Data are
being used for a purpose not approved by SullivanCotter, SullivanCotter’s rights are being jeopardized, the
Licensee is using the Aggregated Data in any way that is adverse to SullivanCotter’s proprietary rights or to
directly compete with SullivanCotter or the Licensee is in default under this Agreement, SullivanCotter may
immediately terminate this Agreement. Upon termination of this Agreement, the Licensee shall return to
SullivanCotter, delete or destroy all copies of all confidential information, including, without limitation, all
documents and electronically stored information (ESI). “ESI” refers to any information that requires electrical
power to store or to retrieve, including, but not limited to, information stored in or obtainable from email servers,
active and archived email accounts, databases, network storage devices, network drives, file servers, legacy
systems, backup tapes, Internet applications, desktop or laptop computer hard drives, electronic data storage
media (e.g., CDs, DVDs and floppy disks), electronic data storage devices (e.g., USB flash drives, external hard
drives and memory cards) and electronic handheld devices (e.g., cell phones, personal digital assistants and
Blackberrys or similar devices). “Document” means printed or recorded matter or writings, including, without
limitation, correspondence, agreements, memoranda, notes, notebooks, diaries, interoffice or intraoffice
communications, minutes, telegrams, letters, photographs, drawings, sketches, drafts, ESI, emails, tapes or
recordings, computer disks, computer tapes, data stored on a computer, digital or electronic data in any form,
reports, charts, bulletins, circulars, advertisements, catalogs, publications, work assignments, work sheets and
instructions, in the possession, custody or control of the Licensee.
Remedies. The Licensee acknowledges and agrees that SullivanCotter will suffer irreparable harm if the Licensee
breaches the terms of this Agreement and that monetary damages would not be adequate remedy for any such
breach.
Order Form. SullivanCotter may require the Licensee to submit an order form or other written confirmation prior to
obtaining certain Aggregated Data, which may define the Aggregated Data licensed, further limit the purpose for
use of the Aggregated Data and specify payment terms.
Notices. Any notices permitted or required hereunder will be in writing, delivered to the parties at their addresses
set forth in the order form (or as otherwise notified in writing) by personal delivery, registered mail, express courier
service or email. Either party may update its contact information for the purposes of this section by providing
written notice to the other party of such changes.
Governing Law. This Agreement shall be governed by and construed in accordance with the laws of the state of
Illinois.
v
LICENSE AGREEMENT
Modification and Entire Agreement. SullivanCotter (and not the Licensee) shall have the right, at any time, to add
to or modify the terms of this Agreement. The Licensee's continued access to or use of the Aggregated Data
after the date of delivery of the notice or a click wrap agreement to such amended terms is deemed to constitute
acceptance of the amendment. If the Licensee disagrees with any new or modified terms of this Agreement, the
Licensee may elect to terminate this Agreement and its access to the Aggregated Data as its sole and exclusive
remedy. Any failure of one party to comply with any obligation hereunder may be expressly waived in writing by
the other party, but such waiver or failure to insist upon strict compliance with such obligation will not operate as
a waiver of, or estoppel with respect to, any subsequent failure. This Agreement and any order form(s) constitute
the entire understanding between the parties. If a court of competent jurisdiction determines that any restriction
in this Agreement is overbroad or unreasonable under the circumstances, such restriction shall be modified or
revised by such court to include the maximum reasonable restriction allowed by law. This Agreement supersedes
any and all prior agreements, understandings or other communications between the parties concerning the subject
matter of this Agreement. If any provision of this Agreement is declared to be invalid, such provision shall be
severed from this Agreement and the other provisions hereof shall be in full force and effect.
vi

TABLE OF CONTENTS
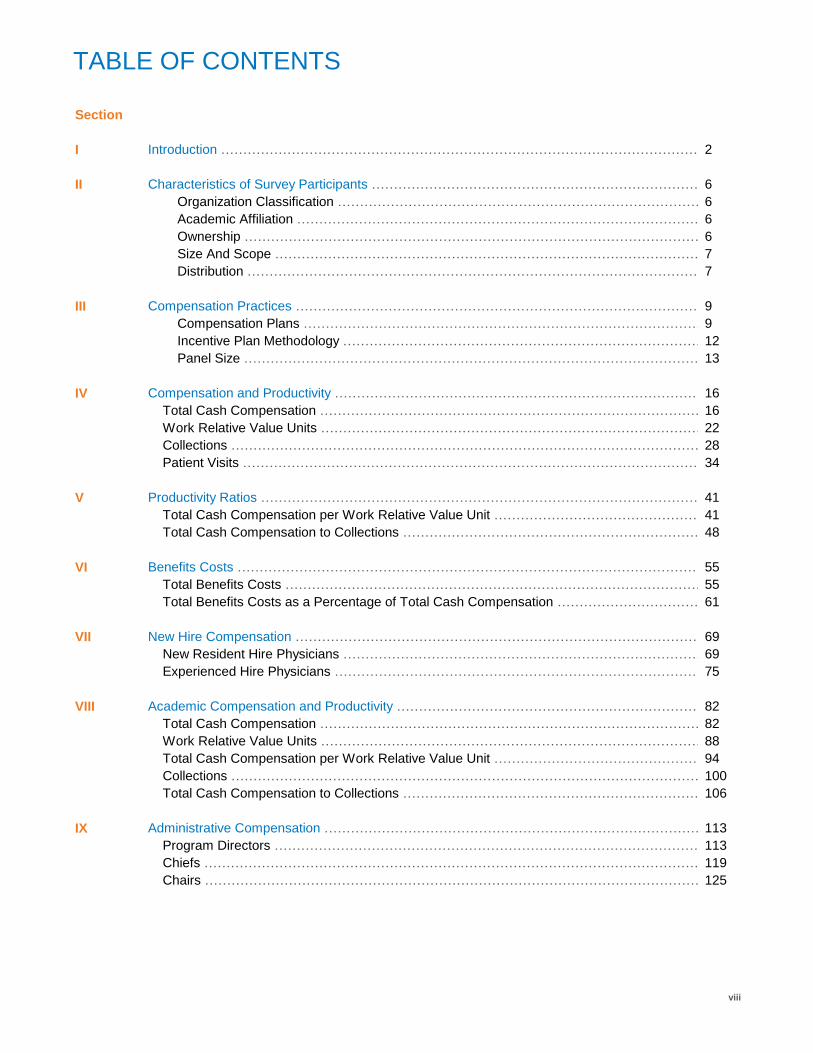
TABLE OF CONTENTS
Section
I Introduction ……………………………………………………………………………………………………… 2
II Characteristics of Survey Participants ……………………………………………………………………………………………………… 6
Organization Classification ……………………………………………………………………………………………………… 6
Academic Affiliation ……………………………………………………………………………………………………… 6
Ownership ……………………………………………………………………………………………………… 6
Size And Scope ……………………………………………………………………………………………………… 7
Distribution ……………………………………………………………………………………………………… 7
III Compensation Practices ……………………………………………………………………………………………………… 9
Compensation Plans ……………………………………………………………………………………………………… 9
Incentive Plan Methodology ……………………………………………………………………………………………………… 12
Panel Size ……………………………………………………………………………………………………… 13
IV Compensation and Productivity ……………………………………………………………………………………………………… 16
Total Cash Compensation ……………………………………………………………………………………………………… 16
Work Relative Value Units ……………………………………………………………………………………………………… 22
Collections ……………………………………………………………………………………………………… 28
Patient Visits ……………………………………………………………………………………………………… 34
V Productivity Ratios ……………………………………………………………………………………………………… 41
Total Cash Compensation per Work Relative Value Unit ……………………………………………………………………………………………………… 41
Total Cash Compensation to Collections ……………………………………………………………………………………………………… 48
VI Benefits Costs ……………………………………………………………………………………………………… 55
Total Benefits Costs ……………………………………………………………………………………………………… 55
Total Benefits Costs as a Percentage of Total Cash Compensation ……………………………………………………………………………………………………… 61
VII New Hire Compensation ……………………………………………………………………………………………………… 69
New Resident Hire Physicians ……………………………………………………………………………………………………… 69
Experienced Hire Physicians ……………………………………………………………………………………………………… 75
VIII Academic Compensation and Productivity ……………………………………………………………………………………………………… 82
Total Cash Compensation ……………………………………………………………………………………………………… 82
Work Relative Value Units ……………………………………………………………………………………………………… 88
Total Cash Compensation per Work Relative Value Unit ……………………………………………………………………………………………………… 94
Collections ……………………………………………………………………………………………………… 100
Total Cash Compensation to Collections ……………………………………………………………………………………………………… 106
IX Administrative Compensation ……………………………………………………………………………………………………… 113
Program Directors ……………………………………………………………………………………………………… 113
Chiefs ……………………………………………………………………………………………………… 119
Chairs ……………………………………………………………………………………………………… 125
viii
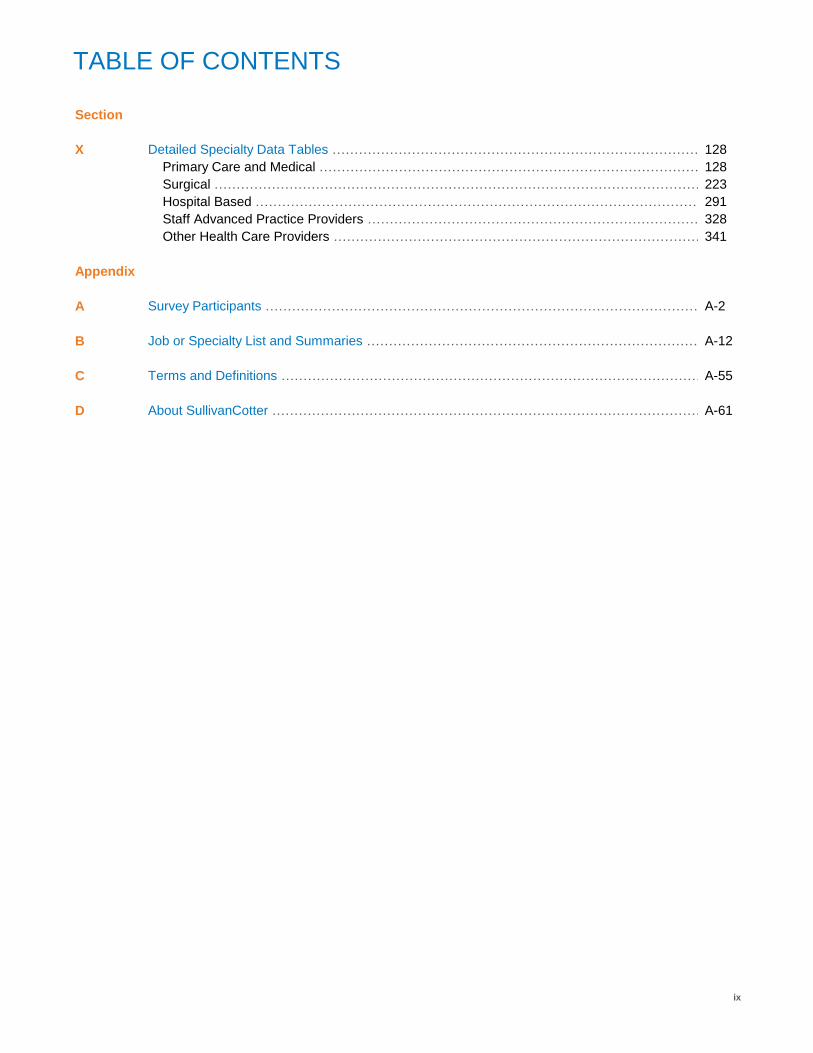
TABLE OF CONTENTS
Section
X Detailed Specialty Data Tables ……………………………………………………………………………………………………… 128
Primary Care and Medical ……………………………………………………………………………………………………… 128
Surgical ……………………………………………………………………………………………………… 223
Hospital Based ……………………………………………………………………………………………………… 291
Staff Advanced Practice Providers ……………………………………………………………………………………………………… 328
Other Health Care Providers ……………………………………………………………………………………………………… 341
Appendix
A Survey Participants ……………………………………………………………………………………………………… A-2
B Job or Specialty List and Summaries ……………………………………………………………………………………………………… A-12
C Terms and Definitions ……………………………………………………………………………………………………… A-55
D About SullivanCotter ……………………………………………………………………………………………………… A-61
ix

SECTION I:
INTRODUCTION
INTRODUCTION
SullivanCotter, Inc. (SullivanCotter) is pleased to present the 2019 Medical
Group Compensation and Productivity Survey Report, now in its fifth edition.
Survey participants submitted data from January 2019 to April 2019 for the
2018 calendar year or the most recent fiscal year. Data were reported by 286
medical groups across the United States. Total cash compensation (TCC) data
were collected on 142,847 incumbents. The survey participants are listed in
appendix A.
SullivanCotter ensures that all organization-specific data remain strictly confidential. While individual organization
names appear in the survey participant list, no correlation to an organization's data is provided.
The data are effective as of January 1, 2019.
The compensation practices section is only available to survey participants who completed the
corresponding section of the 2019 Medical Group Compensation and Productivity Survey. The survey
participants who did not complete this section receive a survey report excluding the compensation
practices section.
For more information on the full report, including how to purchase any additional sections, contact the
Center for Information, Analytics and Insights at [email protected].
This report is organized into 10 sections:
Section I presents general information regarding this survey report.
Section II presents general survey participant characteristics.
Section III presents compensation practices.
Section IV presents TCC, productivity and patient visits for staff physicians by specialty.
Section V presents productivity ratios for staff physicians by specialty, including TCC per work relative value unit
(work RVU) and TCC to collections.
Section VI presents total benefits costs and total benefits costs as a percentage of TCC for staff physicians by
specialty.
Section VII presents starting base salary and TCC for new resident and experienced hire physicians by specialty.
Section VIII presents TCC, productivity and productivity ratios for organizations with academic affiliations by
specialty.
Section IX presents TCC for incumbents with administrative responsibilities, including program directors, chiefs
and chairs.
P 2 SECTION I
Medical Group Compensation and Productivity Survey Report
© 2019 SullivanCotter, Inc. All rights reserved.
INTRODUCTION
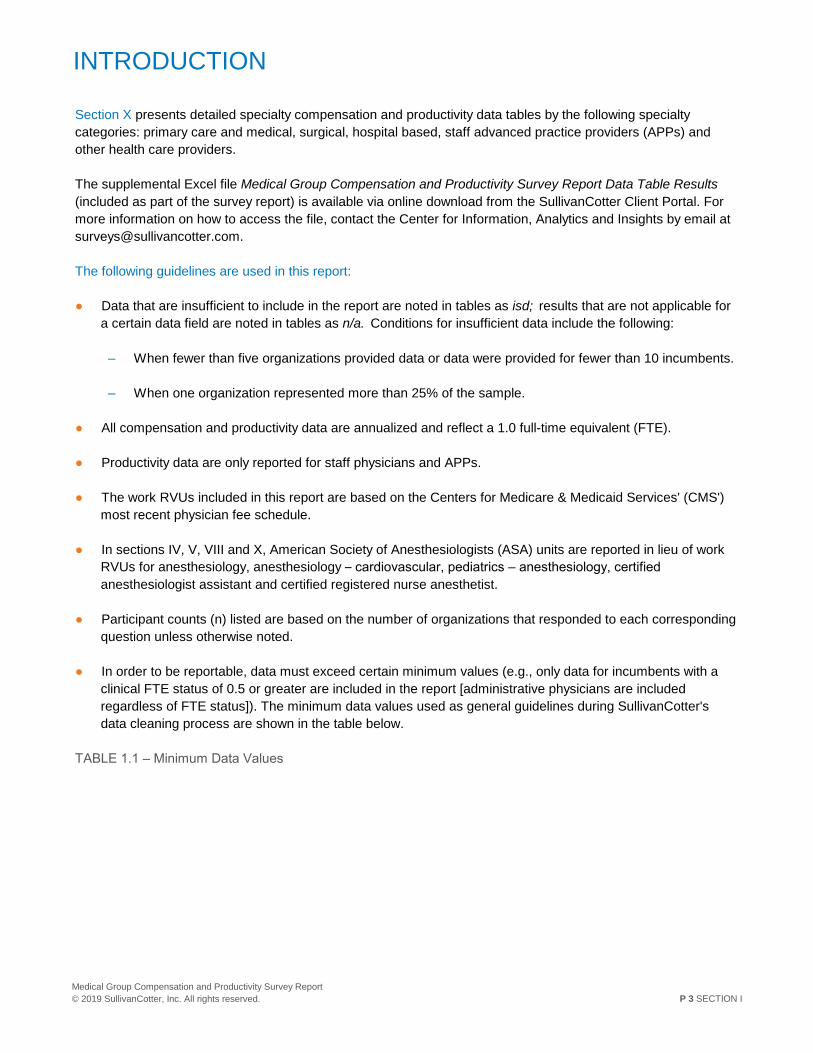
Section X presents detailed specialty compensation and productivity data tables by the following specialty
categories: primary care and medical, surgical, hospital based, staff advanced practice providers (APPs) and
other health care providers.
The supplemental Excel file Medical Group Compensation and Productivity Survey Report Data Table Results
(included as part of the survey report) is available via online download from the SullivanCotter Client Portal. For
more information on how to access the file, contact the Center for Information, Analytics and Insights by email at
The following guidelines are used in this report:
● Data that are insufficient to include in the report are noted in tables as isd; results that are not applicable for
a certain data field are noted in tables as n/a. Conditions for insufficient data include the following:
– When fewer than five organizations provided data or data were provided for fewer than 10 incumbents.
– When one organization represented more than 25% of the sample.
● All compensation and productivity data are annualized and reflect a 1.0 full-time equivalent (FTE).
● Productivity data are only reported for staff physicians and APPs.
● The work RVUs included in this report are based on the Centers for Medicare & Medicaid Services' (CMS')
most recent physician fee schedule.
● In sections IV, V, VIII and X, American Society of Anesthesiologists (ASA) units are reported in lieu of work
RVUs for anesthesiology, anesthesiology – cardiovascular, pediatrics – anesthesiology, certified
anesthesiologist assistant and certified registered nurse anesthetist.
● Participant counts (n) listed are based on the number of organizations that responded to each corresponding
question unless otherwise noted.
● In order to be reportable, data must exceed certain minimum values (e.g., only data for incumbents with a
clinical FTE status of 0.5 or greater are included in the report [administrative physicians are included
regardless of FTE status]). The minimum data values used as general guidelines during SullivanCotter's
data cleaning process are shown in the table below.
TABLE 1.1 – Minimum Data Values
P 3 SECTION I
Medical Group Compensation and Productivity Survey Report
© 2019 SullivanCotter, Inc. All rights reserved.
INTRODUCTION
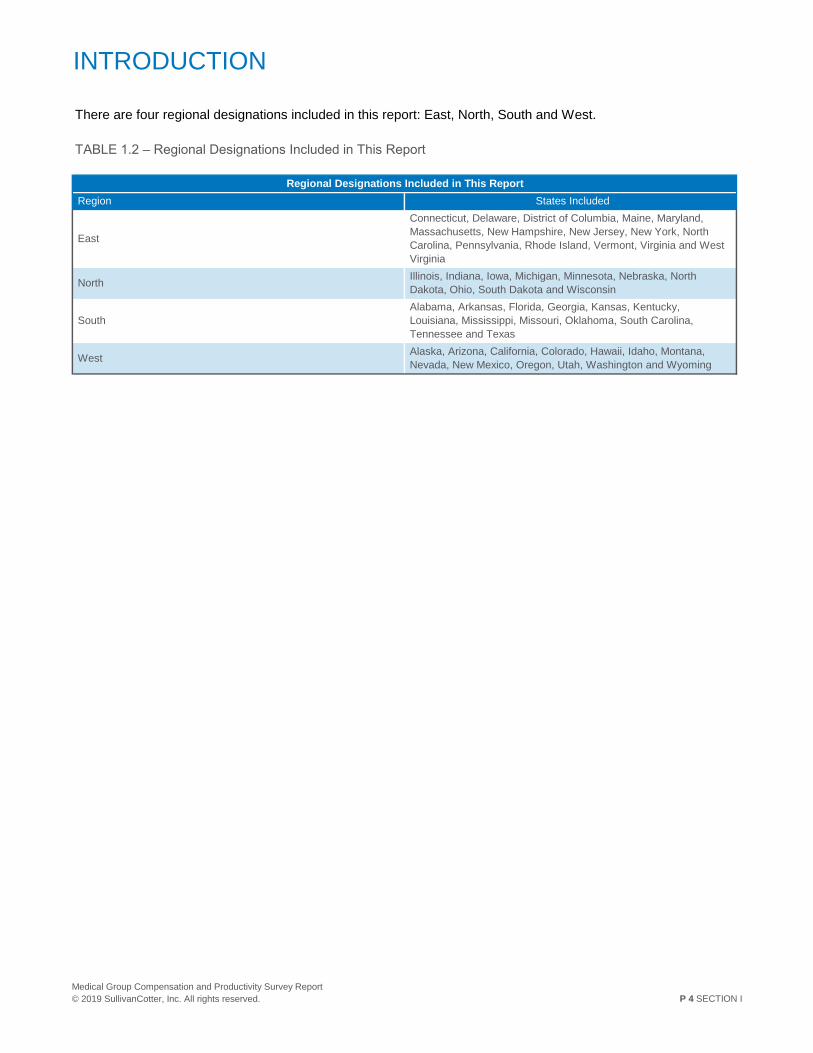
There are four regional designations included in this report: East, North, South and West.
TABLE 1.2 – Regional Designations Included in This Report
Regional Designations Included in This Report
South
Alabama, Arkansas, Florida, Georgia, Kansas, Kentucky,
Louisiana, Mississippi, Missouri, Oklahoma, South Carolina,
Tennessee and Texas
West Alaska, Arizona, California, Colorado, Hawaii, Idaho, Montana,
Nevada, New Mexico, Oregon, Utah, Washington and Wyoming
Region States Included
East
Connecticut, Delaware, District of Columbia, Maine, Maryland,
Massachusetts, New Hampshire, New Jersey, New York, North
Carolina, Pennsylvania, Rhode Island, Vermont, Virginia and West
Virginia
North Illinois, Indiana, Iowa, Michigan, Minnesota, Nebraska, North
Dakota, Ohio, South Dakota and Wisconsin
P 4 SECTION I
Medical Group Compensation and Productivity Survey Report
© 2019 SullivanCotter, Inc. All rights reserved.

SECTION II:
CHARACTERISTICS
OF SURVEY
PARTICIPANTS
CHARACTERISTICS OF SURVEY PARTICIPANTS
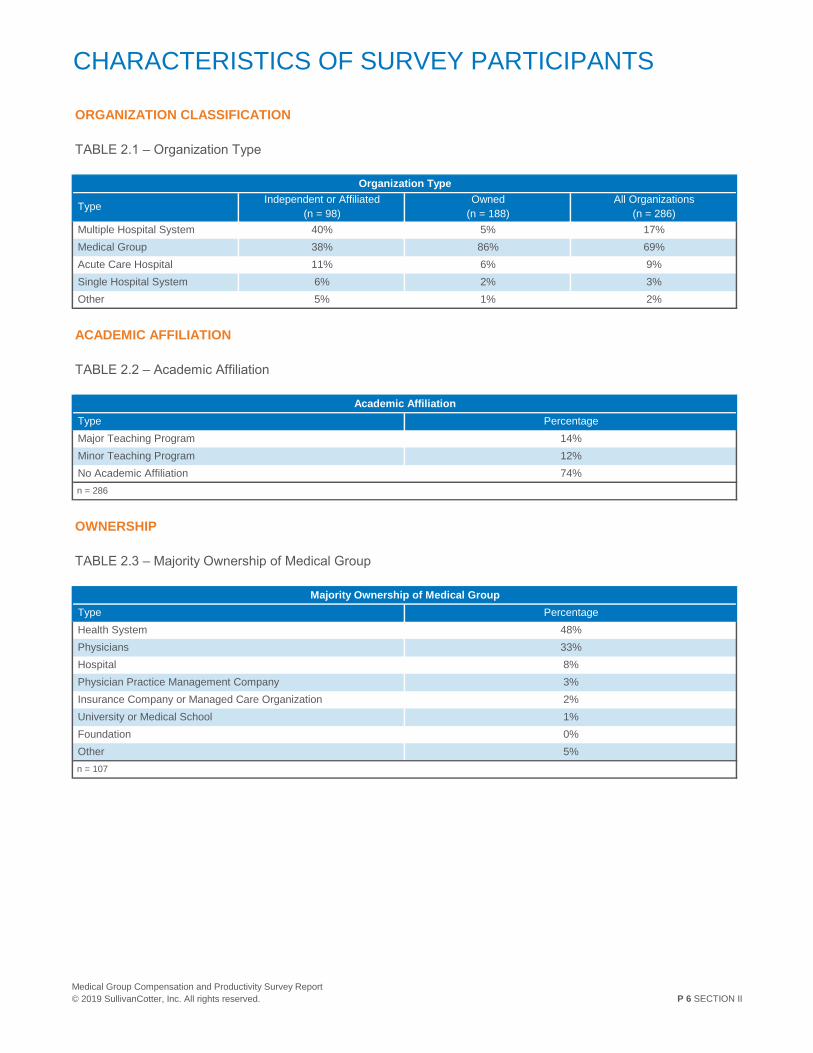
ORGANIZATION CLASSIFICATION
TABLE 2.1 – Organization Type
ACADEMIC AFFILIATION
TABLE 2.2 – Academic Affiliation
OWNERSHIP
TABLE 2.3 – Majority Ownership of Medical Group
Organization Type
TypeIndependent or Affiliated Owned All Organizations
(n = 98) (n = 188) (n = 286)
Acute Care Hospital 11% 6% 9%
Single Hospital System 6% 2% 3%
Multiple Hospital System 40% 5% 17%
Medical Group 38% 86% 69%
Major Teaching Program 14%
Minor Teaching Program 12%
No Academic Affiliation 74%
Other 5% 1% 2%
Academic Affiliation
Type Percentage
Physicians 33%
Hospital 8%
Physician Practice Management Company 3%
n = 286
Majority Ownership of Medical Group
Type Percentage
Health System 48%
Other 5%
n = 107
Insurance Company or Managed Care Organization 2%
University or Medical School 1%
Foundation 0%
P 6 SECTION II
Medical Group Compensation and Productivity Survey Report
© 2019 SullivanCotter, Inc. All rights reserved.

CHARACTERISTICS OF SURVEY PARTICIPANTS
SIZE AND SCOPE
TABLE 2.4 – Financial and Operating Measures
DISTRIBUTION
TABLE 2.5 – Distribution of Participating Organizations by Size
TABLE 2.6 – Distribution of Participating Organizations by Region
Financial and Operating Measures
Measure n Mean Median
Hospital Beds Operated 59
FTE Employees 255
Net Revenue(1) 269
Hospital Beds Licensed 56
Employed-Physicians-to-APPs Ratio 247
Emergency Department Visits 29
Employed Physicians 264
Employed APPs 250
(1)Net revenue is displayed in millions.
Distribution of Participating Organizations by Size
Number of Provider FTEs n Orgs n Incumbents(1)
Hospital Admissions 31
Outpatient Care Visits 31
Fewer Than 50 Provider FTEs 54 1,086
50 to 150 Provider FTEs 52 4,664
(1)Number of incumbents includes physicians, APPs and other health care providers.
Distribution of Participating Organizations by Region
Region n Orgs n Incumbents(1)
151 to 300 Provider FTEs 39 8,359
More Than 300 Provider FTEs 141 128,738
Organization Percentage Incumbent Percentage
East 67 42,628
North 96 45,998
(1)Number of incumbents includes physicians, APPs and other health care providers.
South 70 27,405
West 53 26,816
Organization Percentage Incumbent Percentage
P 7 SECTION II
Medical Group Compensation and Productivity Survey Report
© 2019 SullivanCotter, Inc. All rights reserved.

SECTION III:
COMPENSATION
PRACTICES
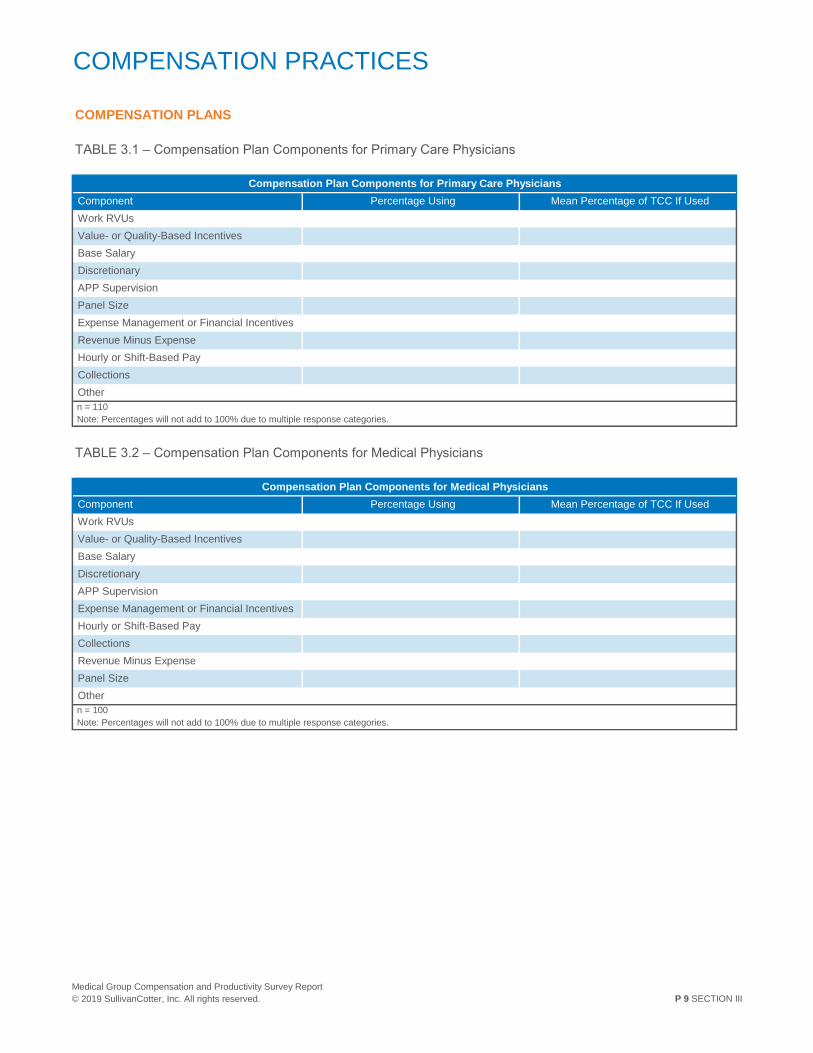
COMPENSATION PRACTICES
COMPENSATION PLANS
TABLE 3.1 – Compensation Plan Components for Primary Care Physicians
TABLE 3.2 – Compensation Plan Components for Medical Physicians
Value- or Quality-Based Incentives
Base Salary
Compensation Plan Components for Primary Care Physicians
Component
Work RVUs
Panel Size
Expense Management or Financial Incentives
Discretionary
APP Supervision
Collections
Other
Revenue Minus Expense
Hourly or Shift-Based Pay
Percentage Using Mean Percentage of TCC If Used
Work RVUs
Value- or Quality-Based Incentives
n = 110
Note: Percentages will not add to 100% due to multiple response categories.
Compensation Plan Components for Medical Physicians
Component
APP Supervision
Expense Management or Financial Incentives
Base Salary
Discretionary
Revenue Minus Expense
Panel Size
Hourly or Shift-Based Pay
Collections
Other
Percentage Using Mean Percentage of TCC If Used
n = 100
Note: Percentages will not add to 100% due to multiple response categories.
P 9 SECTION III
Medical Group Compensation and Productivity Survey Report
© 2019 SullivanCotter, Inc. All rights reserved.

SECTION IV:
COMPENSATION
AND PRODUCTIVITY

TOTAL CASH COMPENSATION
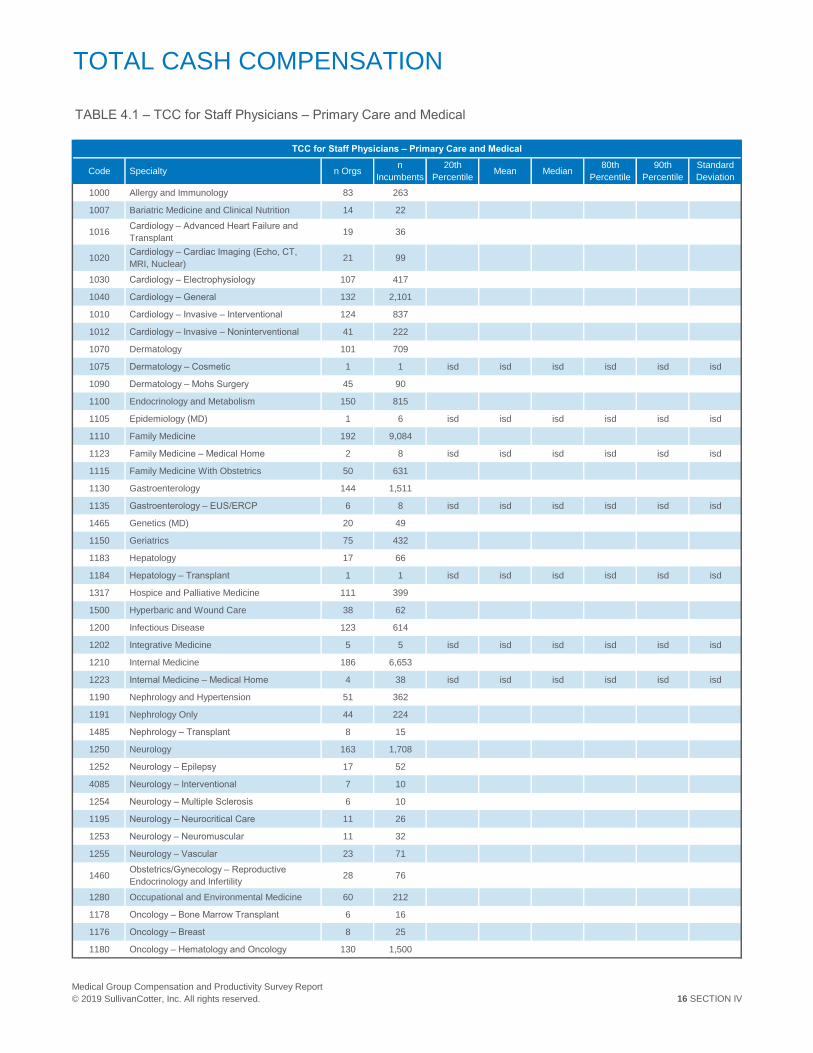
TOTAL CASH COMPENSATION
TABLE 4.1 – TCC for Staff Physicians – Primary Care and Medical
Code Specialty n Orgsn
Incumbents
20th
PercentileMean Median
80th
Percentile
90th
Percentile
Standard
Deviation
1000 Allergy and Immunology 83 263
1007 Bariatric Medicine and Clinical Nutrition 14 22
1016 Cardiology – Advanced Heart Failure and
Transplant19 36
1020 Cardiology – Cardiac Imaging (Echo, CT,
MRI, Nuclear)21 99
1030 Cardiology – Electrophysiology 107 417
1040 Cardiology – General 132 2,101
1010 Cardiology – Invasive – Interventional 124 837
1012 Cardiology – Invasive – Noninterventional 41 222
1070 Dermatology 101 709
1075 Dermatology – Cosmetic 1 1 isd isd isd isd isd isd
1090 Dermatology – Mohs Surgery 45 90
1100 Endocrinology and Metabolism 150 815
1105 Epidemiology (MD) 1 6 isd isd isd isd isd isd
1110 Family Medicine 192 9,084
1123 Family Medicine – Medical Home 2 8 isd isd isd isd isd isd
1115 Family Medicine With Obstetrics 50 631
1130 Gastroenterology 144 1,511
1135 Gastroenterology – EUS/ERCP 6 8 isd isd isd isd isd isd
1465 Genetics (MD) 20 49
1150 Geriatrics 75 432
1183 Hepatology 17 66
1184 Hepatology – Transplant 1 1 isd isd isd isd isd isd
1317 Hospice and Palliative Medicine 111 399
1500 Hyperbaric and Wound Care 38 62
1200 Infectious Disease 123 614
1202 Integrative Medicine 5 5 isd isd isd isd isd isd
1210 Internal Medicine 186 6,653
1223 Internal Medicine – Medical Home 4 38 isd isd isd isd isd isd
1190 Nephrology and Hypertension 51 362
1191 Nephrology Only 44 224
1485 Nephrology – Transplant 8 15
1250 Neurology 163 1,708
1252 Neurology – Epilepsy 17 52
4085 Neurology – Interventional 7 10
1254 Neurology – Multiple Sclerosis 6 10
1195 Neurology – Neurocritical Care 11 26
1253 Neurology – Neuromuscular 11 32
1255 Neurology – Vascular 23 71
1460 Obstetrics/Gynecology – Reproductive
Endocrinology and Infertility28 76
1280 Occupational and Environmental Medicine 60 212
1178 Oncology – Bone Marrow Transplant 6 16
1176 Oncology – Breast 8 25
1180 Oncology – Hematology and Oncology 130 1,500
TCC for Staff Physicians – Primary Care and Medical
16 SECTION IV
Medical Group Compensation and Productivity Survey Report
© 2019 SullivanCotter, Inc. All rights reserved.

SECTION V:
PRODUCTIVITY
RATIOS
TOTAL CASH COMPENSATION PER
WORK RELATIVE VALUE UNIT
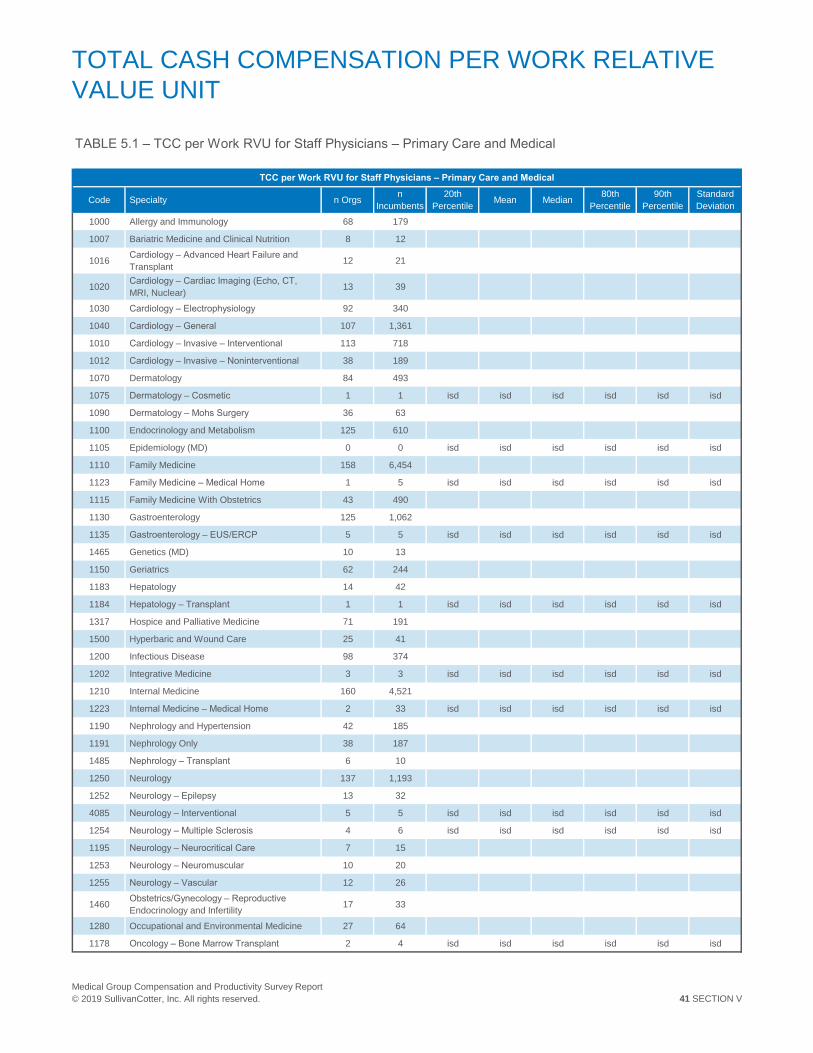
TOTAL CASH COMPENSATION PER WORK RELATIVE
VALUE UNIT
TABLE 5.1 – TCC per Work RVU for Staff Physicians – Primary Care and Medical
Code Specialty n Orgsn
Incumbents
20th
PercentileMean Median
80th
Percentile
90th
Percentile
Standard
Deviation
1000 Allergy and Immunology 68 179
1007 Bariatric Medicine and Clinical Nutrition 8 12
1016 Cardiology – Advanced Heart Failure and
Transplant12 21
1020 Cardiology – Cardiac Imaging (Echo, CT,
MRI, Nuclear)13 39
1030 Cardiology – Electrophysiology 92 340
1040 Cardiology – General 107 1,361
1010 Cardiology – Invasive – Interventional 113 718
1012 Cardiology – Invasive – Noninterventional 38 189
1070 Dermatology 84 493
1075 Dermatology – Cosmetic 1 1 isd isd isd isd isd isd
1090 Dermatology – Mohs Surgery 36 63
1100 Endocrinology and Metabolism 125 610
1105 Epidemiology (MD) 0 0 isd isd isd isd isd isd
1110 Family Medicine 158 6,454
1123 Family Medicine – Medical Home 1 5 isd isd isd isd isd isd
1115 Family Medicine With Obstetrics 43 490
1130 Gastroenterology 125 1,062
1135 Gastroenterology – EUS/ERCP 5 5 isd isd isd isd isd isd
1465 Genetics (MD) 10 13
1150 Geriatrics 62 244
1183 Hepatology 14 42
1184 Hepatology – Transplant 1 1 isd isd isd isd isd isd
1317 Hospice and Palliative Medicine 71 191
1500 Hyperbaric and Wound Care 25 41
1200 Infectious Disease 98 374
1202 Integrative Medicine 3 3 isd isd isd isd isd isd
1210 Internal Medicine 160 4,521
1223 Internal Medicine – Medical Home 2 33 isd isd isd isd isd isd
1190 Nephrology and Hypertension 42 185
1191 Nephrology Only 38 187
1485 Nephrology – Transplant 6 10
1250 Neurology 137 1,193
1252 Neurology – Epilepsy 13 32
4085 Neurology – Interventional 5 5 isd isd isd isd isd isd
1254 Neurology – Multiple Sclerosis 4 6 isd isd isd isd isd isd
1195 Neurology – Neurocritical Care 7 15
1253 Neurology – Neuromuscular 10 20
1255 Neurology – Vascular 12 26
1460 Obstetrics/Gynecology – Reproductive
Endocrinology and Infertility17 33
1280 Occupational and Environmental Medicine 27 64
1178 Oncology – Bone Marrow Transplant 2 4 isd isd isd isd isd isd
TCC per Work RVU for Staff Physicians – Primary Care and Medical
41 SECTION V
Medical Group Compensation and Productivity Survey Report
© 2019 SullivanCotter, Inc. All rights reserved.

SECTION VI:
BENEFITS COSTS
TOTAL BENEFITS COSTS
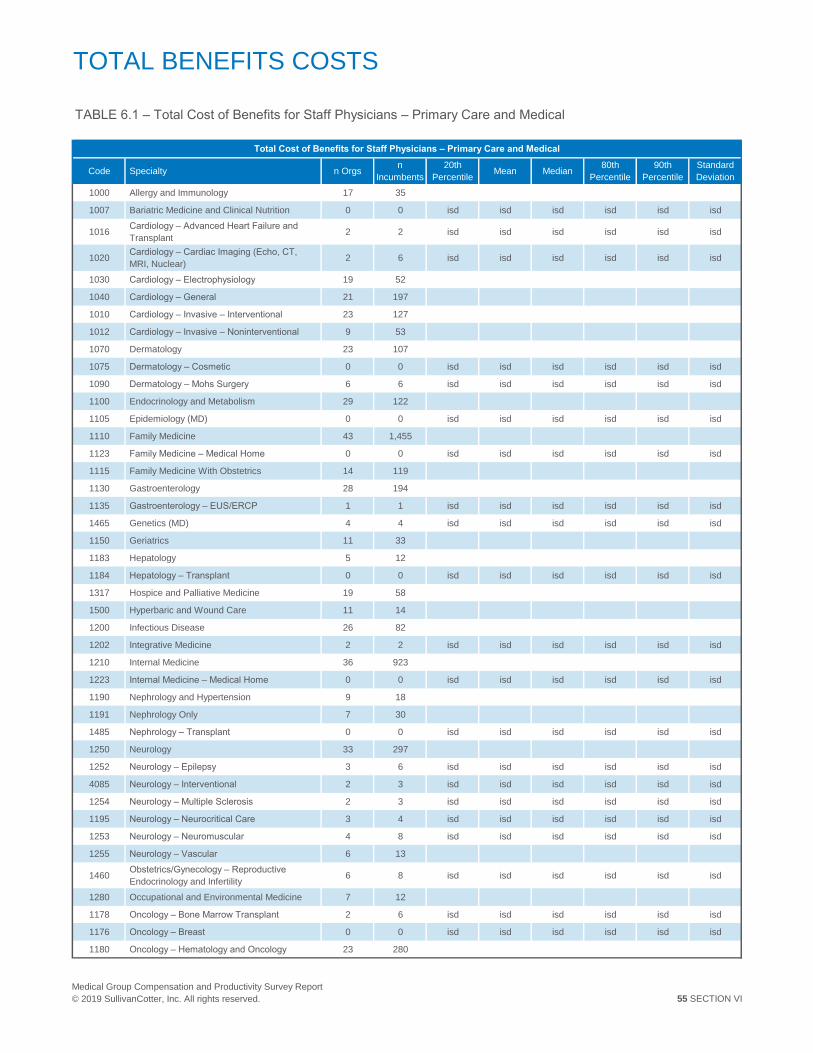
TOTAL BENEFITS COSTS
TABLE 6.1 – Total Cost of Benefits for Staff Physicians – Primary Care and Medical
Code Specialty n Orgsn
Incumbents
20th
PercentileMean Median
80th
Percentile
90th
Percentile
Standard
Deviation
1000 Allergy and Immunology 17 35
1007 Bariatric Medicine and Clinical Nutrition 0 0 isd isd isd isd isd isd
1016 Cardiology – Advanced Heart Failure and
Transplant2 2 isd isd isd isd isd isd
1020 Cardiology – Cardiac Imaging (Echo, CT,
MRI, Nuclear)2 6 isd isd isd isd isd isd
1030 Cardiology – Electrophysiology 19 52
1040 Cardiology – General 21 197
1010 Cardiology – Invasive – Interventional 23 127
1012 Cardiology – Invasive – Noninterventional 9 53
1070 Dermatology 23 107
1075 Dermatology – Cosmetic 0 0 isd isd isd isd isd isd
1090 Dermatology – Mohs Surgery 6 6 isd isd isd isd isd isd
1100 Endocrinology and Metabolism 29 122
1105 Epidemiology (MD) 0 0 isd isd isd isd isd isd
1110 Family Medicine 43 1,455
1123 Family Medicine – Medical Home 0 0 isd isd isd isd isd isd
1115 Family Medicine With Obstetrics 14 119
1130 Gastroenterology 28 194
1135 Gastroenterology – EUS/ERCP 1 1 isd isd isd isd isd isd
1465 Genetics (MD) 4 4 isd isd isd isd isd isd
1150 Geriatrics 11 33
1183 Hepatology 5 12
1184 Hepatology – Transplant 0 0 isd isd isd isd isd isd
1317 Hospice and Palliative Medicine 19 58
1500 Hyperbaric and Wound Care 11 14
1200 Infectious Disease 26 82
1202 Integrative Medicine 2 2 isd isd isd isd isd isd
1210 Internal Medicine 36 923
1223 Internal Medicine – Medical Home 0 0 isd isd isd isd isd isd
1190 Nephrology and Hypertension 9 18
1191 Nephrology Only 7 30
1485 Nephrology – Transplant 0 0 isd isd isd isd isd isd
1250 Neurology 33 297
1252 Neurology – Epilepsy 3 6 isd isd isd isd isd isd
4085 Neurology – Interventional 2 3 isd isd isd isd isd isd
1254 Neurology – Multiple Sclerosis 2 3 isd isd isd isd isd isd
1195 Neurology – Neurocritical Care 3 4 isd isd isd isd isd isd
1253 Neurology – Neuromuscular 4 8 isd isd isd isd isd isd
1255 Neurology – Vascular 6 13
1460 Obstetrics/Gynecology – Reproductive
Endocrinology and Infertility6 8 isd isd isd isd isd isd
1280 Occupational and Environmental Medicine 7 12
1178 Oncology – Bone Marrow Transplant 2 6 isd isd isd isd isd isd
1176 Oncology – Breast 0 0 isd isd isd isd isd isd
1180 Oncology – Hematology and Oncology 23 280
Total Cost of Benefits for Staff Physicians – Primary Care and Medical
55 SECTION VI
Medical Group Compensation and Productivity Survey Report
© 2019 SullivanCotter, Inc. All rights reserved.

SECTION VII:
NEW HIRE
COMPENSATION

NEW RESIDENT HIRE PHYSICIANS

NEW RESIDENT HIRE PHYSICIANS
TABLE 7.1 – Starting Base Salary for New Resident and Fellow Hires – Primary Care and Medical
Code Specialty n Orgsn
Incumbents
20th
PercentileMean Median
80th
Percentile
90th
Percentile
Standard
Deviation
1000 Allergy and Immunology 3 3 isd isd isd isd isd isd
1007 Bariatric Medicine and Clinical Nutrition 1 1 isd isd isd isd isd isd
1016 Cardiology – Advanced Heart Failure and
Transplant0 0 isd isd isd isd isd isd
1020 Cardiology – Cardiac Imaging (Echo, CT,
MRI, Nuclear)1 1 isd isd isd isd isd isd
1030 Cardiology – Electrophysiology 2 2 isd isd isd isd isd isd
1040 Cardiology – General 10 20
1010 Cardiology – Invasive – Interventional 4 4 isd isd isd isd isd isd
1012 Cardiology – Invasive – Noninterventional 1 2 isd isd isd isd isd isd
1070 Dermatology 8 11
1075 Dermatology – Cosmetic 0 0 isd isd isd isd isd isd
1090 Dermatology – Mohs Surgery 2 2 isd isd isd isd isd isd
1100 Endocrinology and Metabolism 5 5 isd isd isd isd isd isd
1105 Epidemiology (MD) 0 0 isd isd isd isd isd isd
1110 Family Medicine 22 128
1123 Family Medicine – Medical Home 0 0 isd isd isd isd isd isd
1115 Family Medicine With Obstetrics 5 5 isd isd isd isd isd isd
1130 Gastroenterology 9 19
1135 Gastroenterology – EUS/ERCP 0 0 isd isd isd isd isd isd
1465 Genetics (MD) 1 1 isd isd isd isd isd isd
1150 Geriatrics 0 0 isd isd isd isd isd isd
1183 Hepatology 0 0 isd isd isd isd isd isd
1184 Hepatology – Transplant 0 0 isd isd isd isd isd isd
1317 Hospice and Palliative Medicine 6 6 isd isd isd isd isd isd
1500 Hyperbaric and Wound Care 0 0 isd isd isd isd isd isd
1200 Infectious Disease 6 8 isd isd isd isd isd isd
1202 Integrative Medicine 0 0 isd isd isd isd isd isd
1210 Internal Medicine 16 47
1223 Internal Medicine – Medical Home 0 0 isd isd isd isd isd isd
1190 Nephrology and Hypertension 3 5 isd isd isd isd isd isd
1191 Nephrology Only 2 4 isd isd isd isd isd isd
1485 Nephrology – Transplant 0 0 isd isd isd isd isd isd
1250 Neurology 15 23
1252 Neurology – Epilepsy 1 3 isd isd isd isd isd isd
4085 Neurology – Interventional 1 1 isd isd isd isd isd isd
1254 Neurology – Multiple Sclerosis 0 0 isd isd isd isd isd isd
1195 Neurology – Neurocritical Care 2 3 isd isd isd isd isd isd
1253 Neurology – Neuromuscular 0 0 isd isd isd isd isd isd
1255 Neurology – Vascular 0 0 isd isd isd isd isd isd
1460 Obstetrics/Gynecology – Reproductive
Endocrinology and Infertility0 0 isd isd isd isd isd isd
1280 Occupational and Environmental Medicine 1 2 isd isd isd isd isd isd
1178 Oncology – Bone Marrow Transplant 0 0 isd isd isd isd isd isd
1176 Oncology – Breast 0 0 isd isd isd isd isd isd
1180 Oncology – Hematology and Oncology 8 16
Starting Base Salary for New Resident and Fellow Hires – Primary Care and Medical
69 SECTION VII
Medical Group Compensation and Productivity Survey Report
© 2019 SullivanCotter, Inc. All rights reserved.

SECTION VIII:
ACADEMIC
COMPENSATION
AND PRODUCTIVITY
TOTAL CASH COMPENSATION

TOTAL CASH COMPENSATION
TABLE 8.1 – TCC for Academic Providers – Primary Care and Medical
Code Specialty n Orgsn
Incumbents
20th
PercentileMean Median
80th
Percentile
90th
Percentile
Standard
Deviation
1000 Allergy and Immunology 35 111
1007 Bariatric Medicine and Clinical Nutrition 2 5 isd isd isd isd isd isd
1016 Cardiology – Advanced Heart Failure and
Transplant7 7 isd isd isd isd isd isd
1020 Cardiology – Cardiac Imaging (Echo, CT,
MRI, Nuclear)11 50
1030 Cardiology – Electrophysiology 40 211
1040 Cardiology – General 47 1,111
1010 Cardiology – Invasive – Interventional 41 366
1012 Cardiology – Invasive – Noninterventional 13 61
1070 Dermatology 40 330
1075 Dermatology – Cosmetic 1 1 isd isd isd isd isd isd
1090 Dermatology – Mohs Surgery 24 43
1100 Endocrinology and Metabolism 49 393
1105 Epidemiology (MD) 1 6 isd isd isd isd isd isd
1110 Family Medicine 50 2,576
1123 Family Medicine – Medical Home 1 5 isd isd isd isd isd isd
1115 Family Medicine With Obstetrics 12 177
1130 Gastroenterology 48 733
1135 Gastroenterology – EUS/ERCP 2 3 isd isd isd isd isd isd
1465 Genetics (MD) 9 24
1150 Geriatrics 33 160
1183 Hepatology 10 47
1184 Hepatology – Transplant 0 0 isd isd isd isd isd isd
1317 Hospice and Palliative Medicine 40 151
1500 Hyperbaric and Wound Care 13 16
1200 Infectious Disease 47 302
1202 Integrative Medicine 3 4 isd isd isd isd isd isd
1210 Internal Medicine 54 2,775
1223 Internal Medicine – Medical Home 1 31 isd isd isd isd isd isd
1190 Nephrology and Hypertension 22 162
1191 Nephrology Only 20 118
1485 Nephrology – Transplant 3 7 isd isd isd isd isd isd
1250 Neurology 51 875
1252 Neurology – Epilepsy 12 38
4085 Neurology – Interventional 1 1 isd isd isd isd isd isd
1254 Neurology – Multiple Sclerosis 3 8 isd isd isd isd isd isd
1195 Neurology – Neurocritical Care 6 12
1253 Neurology – Neuromuscular 8 20
1255 Neurology – Vascular 14 44
1460 Obstetrics/Gynecology – Reproductive
Endocrinology and Infertility20 49
1280 Occupational and Environmental Medicine 22 60
1178 Oncology – Bone Marrow Transplant 3 4 isd isd isd isd isd isd
1176 Oncology – Breast 2 4 isd isd isd isd isd isd
1180 Oncology – Hematology and Oncology 46 784
TCC for Academic Providers – Primary Care and Medical
82 SECTION VIII
Medical Group Compensation and Productivity Survey Report
© 2019 SullivanCotter, Inc. All rights reserved.

SECTION IX:
ADMINISTRATIVE
COMPENSATION

PROGRAM DIRECTORS
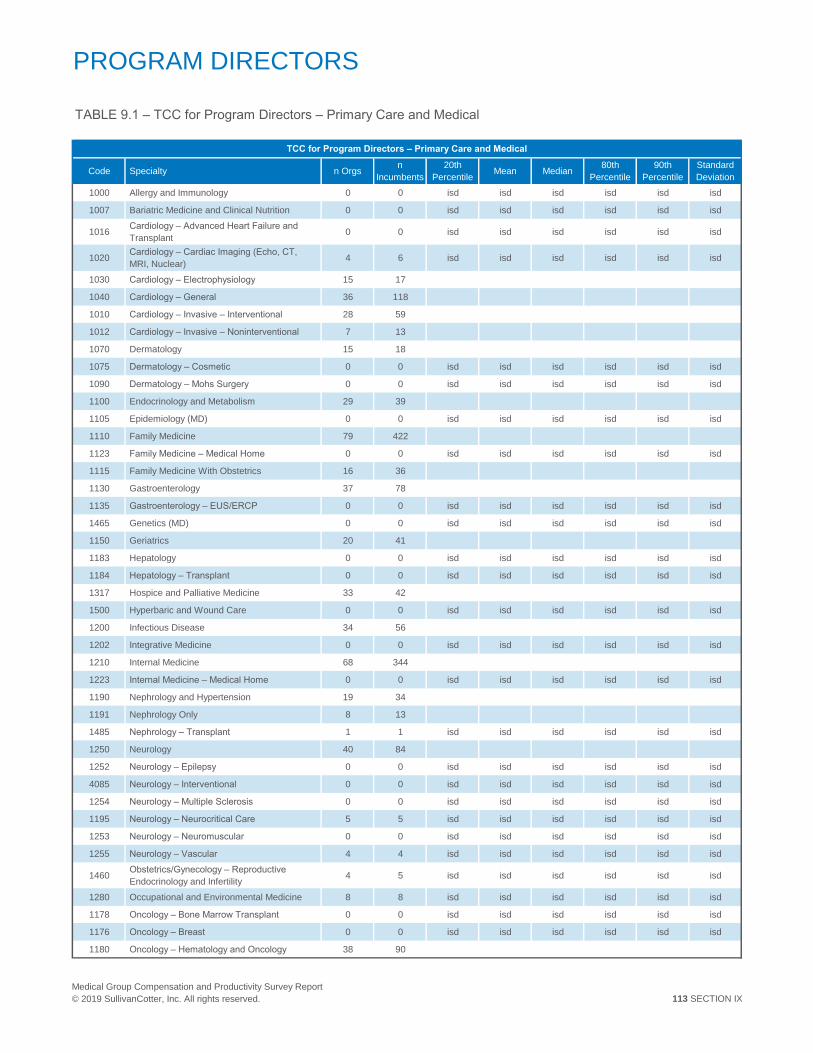
PROGRAM DIRECTORS
TABLE 9.1 – TCC for Program Directors – Primary Care and Medical
Code Specialty n Orgsn
Incumbents
20th
PercentileMean Median
80th
Percentile
90th
Percentile
Standard
Deviation
1000 Allergy and Immunology 0 0 isd isd isd isd isd isd
1007 Bariatric Medicine and Clinical Nutrition 0 0 isd isd isd isd isd isd
1016 Cardiology – Advanced Heart Failure and
Transplant0 0 isd isd isd isd isd isd
1020 Cardiology – Cardiac Imaging (Echo, CT,
MRI, Nuclear)4 6 isd isd isd isd isd isd
1030 Cardiology – Electrophysiology 15 17
1040 Cardiology – General 36 118
1010 Cardiology – Invasive – Interventional 28 59
1012 Cardiology – Invasive – Noninterventional 7 13
1070 Dermatology 15 18
1075 Dermatology – Cosmetic 0 0 isd isd isd isd isd isd
1090 Dermatology – Mohs Surgery 0 0 isd isd isd isd isd isd
1100 Endocrinology and Metabolism 29 39
1105 Epidemiology (MD) 0 0 isd isd isd isd isd isd
1110 Family Medicine 79 422
1123 Family Medicine – Medical Home 0 0 isd isd isd isd isd isd
1115 Family Medicine With Obstetrics 16 36
1130 Gastroenterology 37 78
1135 Gastroenterology – EUS/ERCP 0 0 isd isd isd isd isd isd
1465 Genetics (MD) 0 0 isd isd isd isd isd isd
1150 Geriatrics 20 41
1183 Hepatology 0 0 isd isd isd isd isd isd
1184 Hepatology – Transplant 0 0 isd isd isd isd isd isd
1317 Hospice and Palliative Medicine 33 42
1500 Hyperbaric and Wound Care 0 0 isd isd isd isd isd isd
1200 Infectious Disease 34 56
1202 Integrative Medicine 0 0 isd isd isd isd isd isd
1210 Internal Medicine 68 344
1223 Internal Medicine – Medical Home 0 0 isd isd isd isd isd isd
1190 Nephrology and Hypertension 19 34
1191 Nephrology Only 8 13
1485 Nephrology – Transplant 1 1 isd isd isd isd isd isd
1250 Neurology 40 84
1252 Neurology – Epilepsy 0 0 isd isd isd isd isd isd
4085 Neurology – Interventional 0 0 isd isd isd isd isd isd
1254 Neurology – Multiple Sclerosis 0 0 isd isd isd isd isd isd
1195 Neurology – Neurocritical Care 5 5 isd isd isd isd isd isd
1253 Neurology – Neuromuscular 0 0 isd isd isd isd isd isd
1255 Neurology – Vascular 4 4 isd isd isd isd isd isd
1460 Obstetrics/Gynecology – Reproductive
Endocrinology and Infertility4 5 isd isd isd isd isd isd
1280 Occupational and Environmental Medicine 8 8 isd isd isd isd isd isd
1178 Oncology – Bone Marrow Transplant 0 0 isd isd isd isd isd isd
1176 Oncology – Breast 0 0 isd isd isd isd isd isd
1180 Oncology – Hematology and Oncology 38 90
TCC for Program Directors – Primary Care and Medical
113 SECTION IX
Medical Group Compensation and Productivity Survey Report
© 2019 SullivanCotter, Inc. All rights reserved.
SECTION X:
DETAILED
SPECIALTY DATA
TABLES

PRIMARY CARE AND MEDICAL
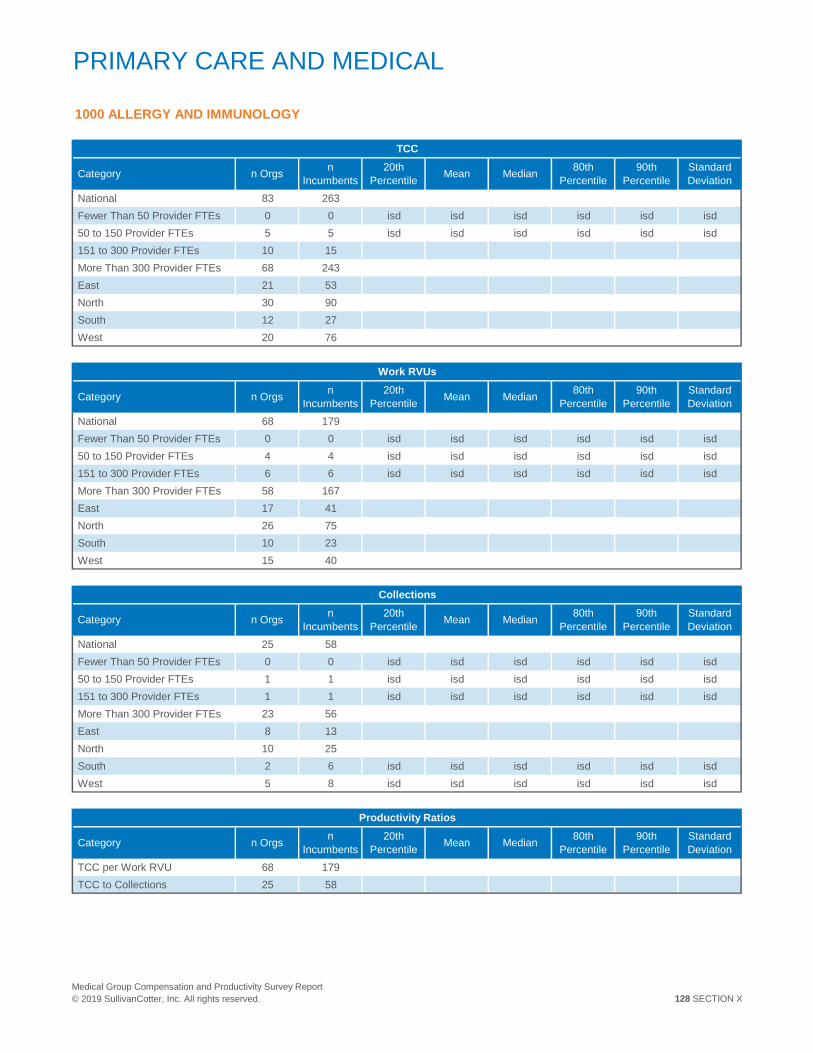
PRIMARY CARE AND MEDICAL
Category n Orgsn
Incumbents
20th
PercentileMean Median
80th
Percentile
90th
Percentile
Standard
Deviation
National 83 263
Fewer Than 50 Provider FTEs 0 0 isd isd isd isd isd isd
50 to 150 Provider FTEs 5 5 isd isd isd isd isd isd
151 to 300 Provider FTEs 10 15
More Than 300 Provider FTEs 68 243
East 21 53
North 30 90
South 12 27
West 20 76
Category n Orgsn
Incumbents
20th
PercentileMean Median
80th
Percentile
90th
Percentile
Standard
Deviation
National 68 179
Fewer Than 50 Provider FTEs 0 0 isd isd isd isd isd isd
50 to 150 Provider FTEs 4 4 isd isd isd isd isd isd
151 to 300 Provider FTEs 6 6 isd isd isd isd isd isd
More Than 300 Provider FTEs 58 167
East 17 41
North 26 75
South 10 23
West 15 40
Category n Orgsn
Incumbents
20th
PercentileMean Median
80th
Percentile
90th
Percentile
Standard
Deviation
National 25 58
Fewer Than 50 Provider FTEs 0 0 isd isd isd isd isd isd
50 to 150 Provider FTEs 1 1 isd isd isd isd isd isd
151 to 300 Provider FTEs 1 1 isd isd isd isd isd isd
More Than 300 Provider FTEs 23 56
East 8 13
North 10 25
South 2 6 isd isd isd isd isd isd
West 5 8 isd isd isd isd isd isd
Category n Orgsn
Incumbents
20th
PercentileMean Median
80th
Percentile
90th
Percentile
Standard
Deviation
TCC per Work RVU 68 179
TCC to Collections 25 58
1000 ALLERGY AND IMMUNOLOGY
TCC
Work RVUs
Collections
Productivity Ratios
128 SECTION X
Medical Group Compensation and Productivity Survey Report
© 2019 SullivanCotter, Inc. All rights reserved.

APPENDIX A:
SURVEY
PARTICIPANTS
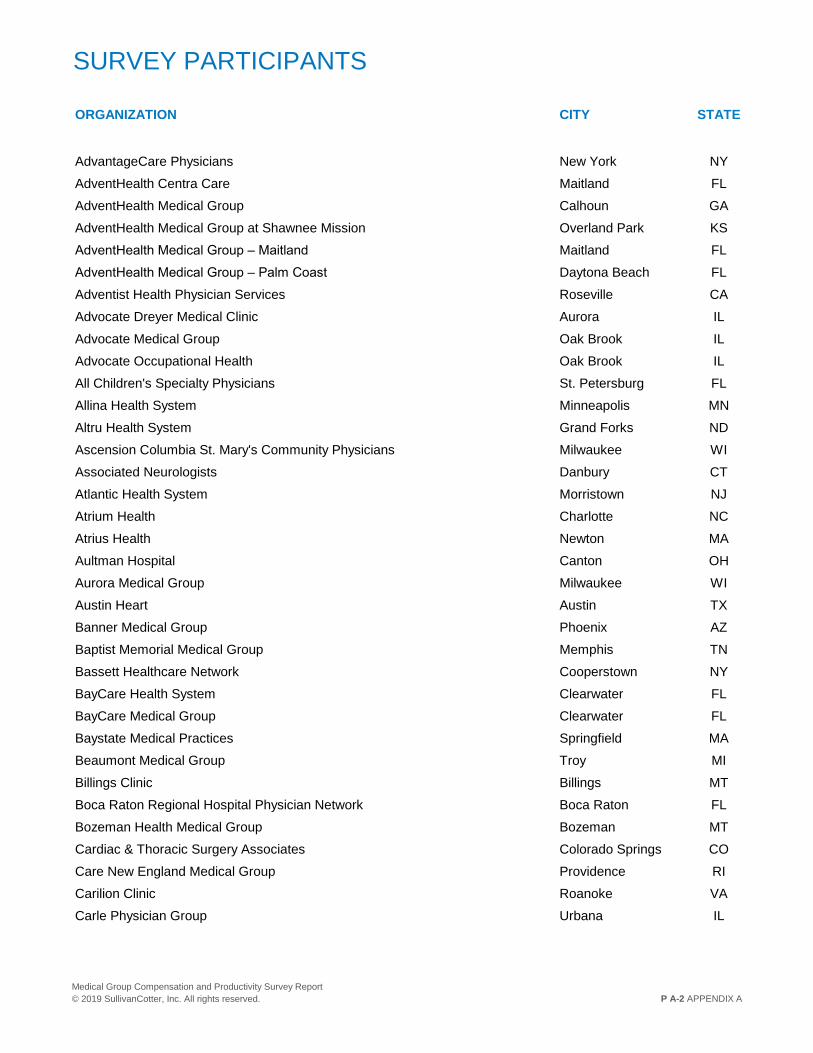
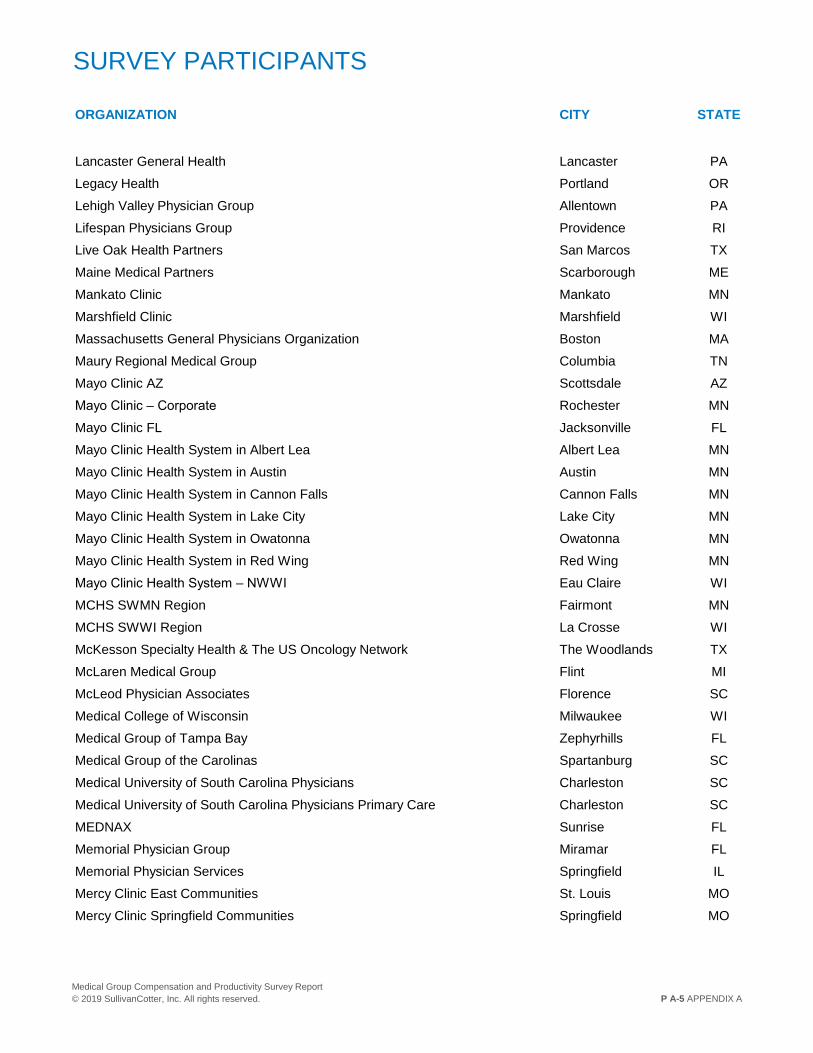
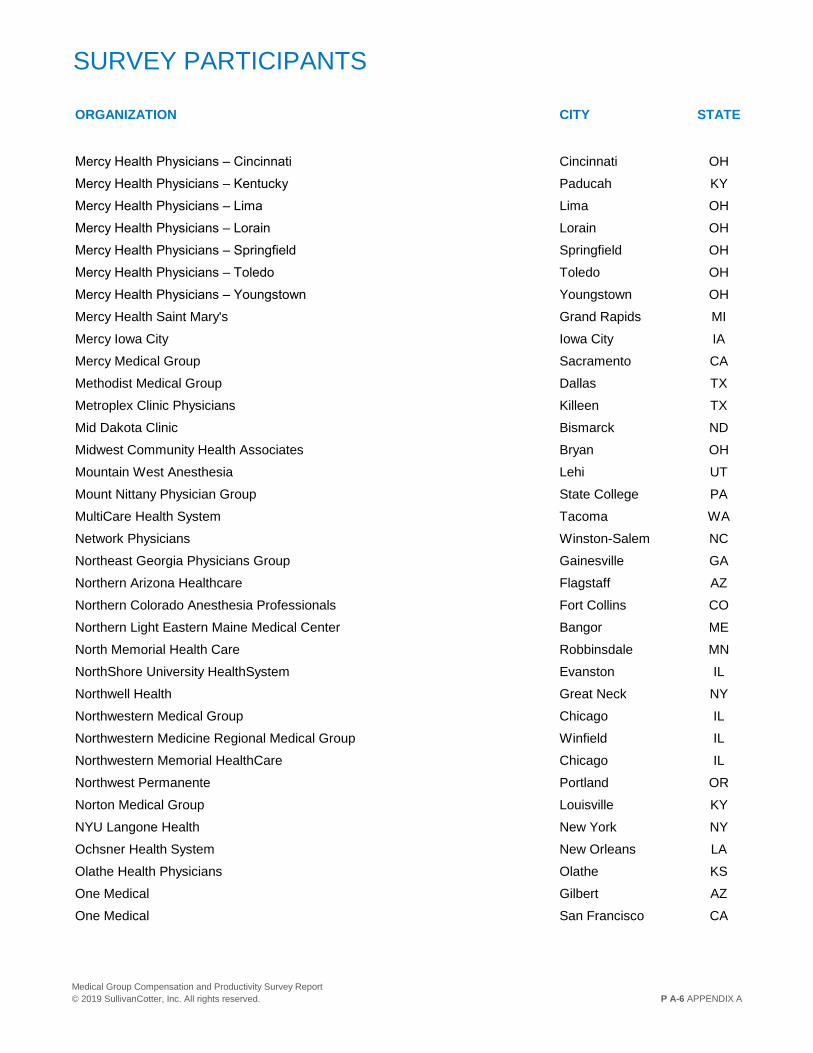
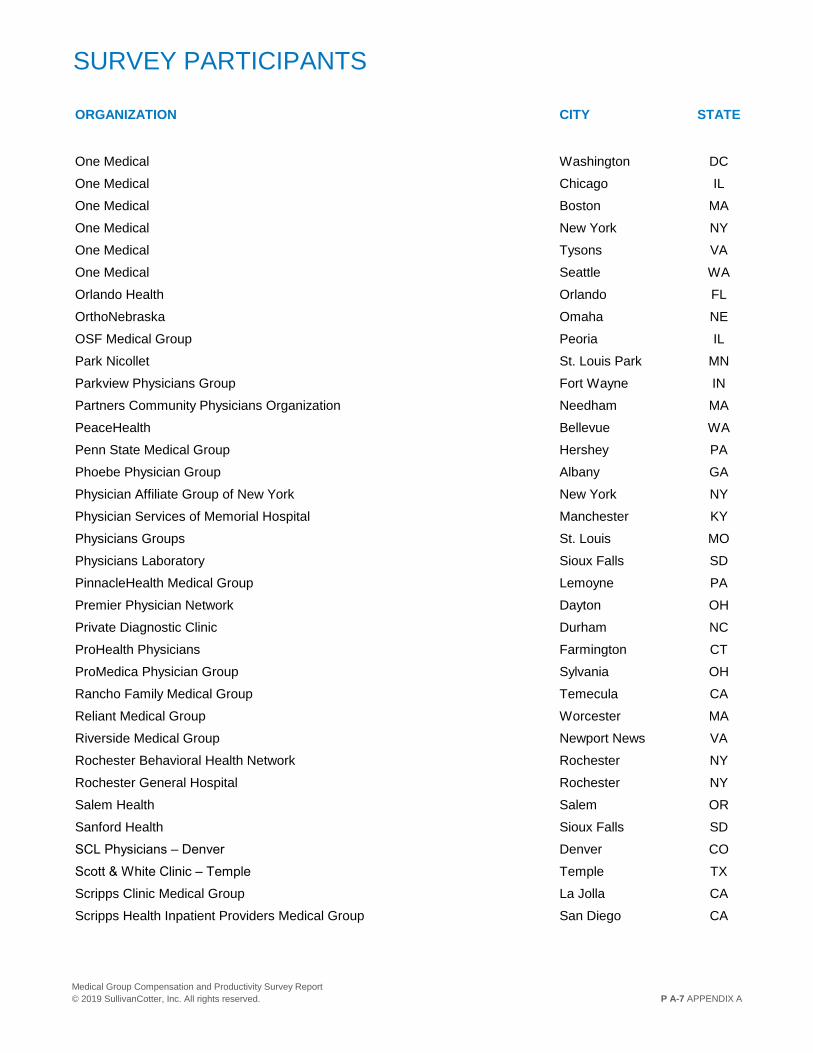
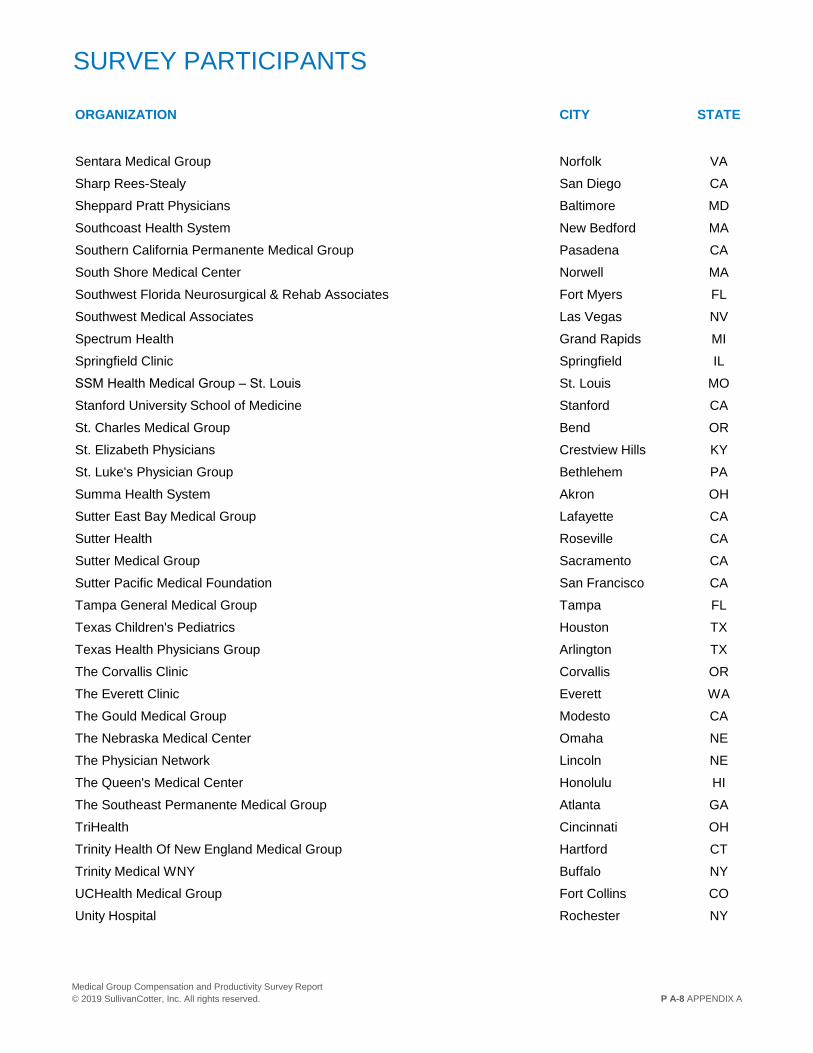
SURVEY PARTICIPANTS
ORGANIZATION CITY STATE
AdvantageCare Physicians New York NY
AdventHealth Centra Care Maitland FL
AdventHealth Medical Group Calhoun GA
AdventHealth Medical Group at Shawnee Mission Overland Park KS
AdventHealth Medical Group – Maitland Maitland FL
AdventHealth Medical Group – Palm Coast Daytona Beach FL
Adventist Health Physician Services Roseville CA
Advocate Dreyer Medical Clinic Aurora IL
Advocate Medical Group Oak Brook IL
Advocate Occupational Health Oak Brook IL
All Children's Specialty Physicians St. Petersburg FL
Allina Health System Minneapolis MN
Altru Health System Grand Forks ND
Ascension Columbia St. Mary's Community Physicians Milwaukee WI
Associated Neurologists Danbury CT
Atlantic Health System Morristown NJ
Atrium Health Charlotte NC
Atrius Health Newton MA
Aultman Hospital Canton OH
Aurora Medical Group Milwaukee WI
Austin Heart Austin TX
Banner Medical Group Phoenix AZ
Baptist Memorial Medical Group Memphis TN
Bassett Healthcare Network Cooperstown NY
BayCare Health System Clearwater FL
BayCare Medical Group Clearwater FL
Baystate Medical Practices Springfield MA
Beaumont Medical Group Troy MI
Billings Clinic Billings MT
Boca Raton Regional Hospital Physician Network Boca Raton FL
Bozeman Health Medical Group Bozeman MT
Cardiac & Thoracic Surgery Associates Colorado Springs CO
Care New England Medical Group Providence RI
Carilion Clinic Roanoke VA
Carle Physician Group Urbana IL
P A-2 APPENDIX A
Medical Group Compensation and Productivity Survey Report
© 2019 SullivanCotter, Inc. All rights reserved.
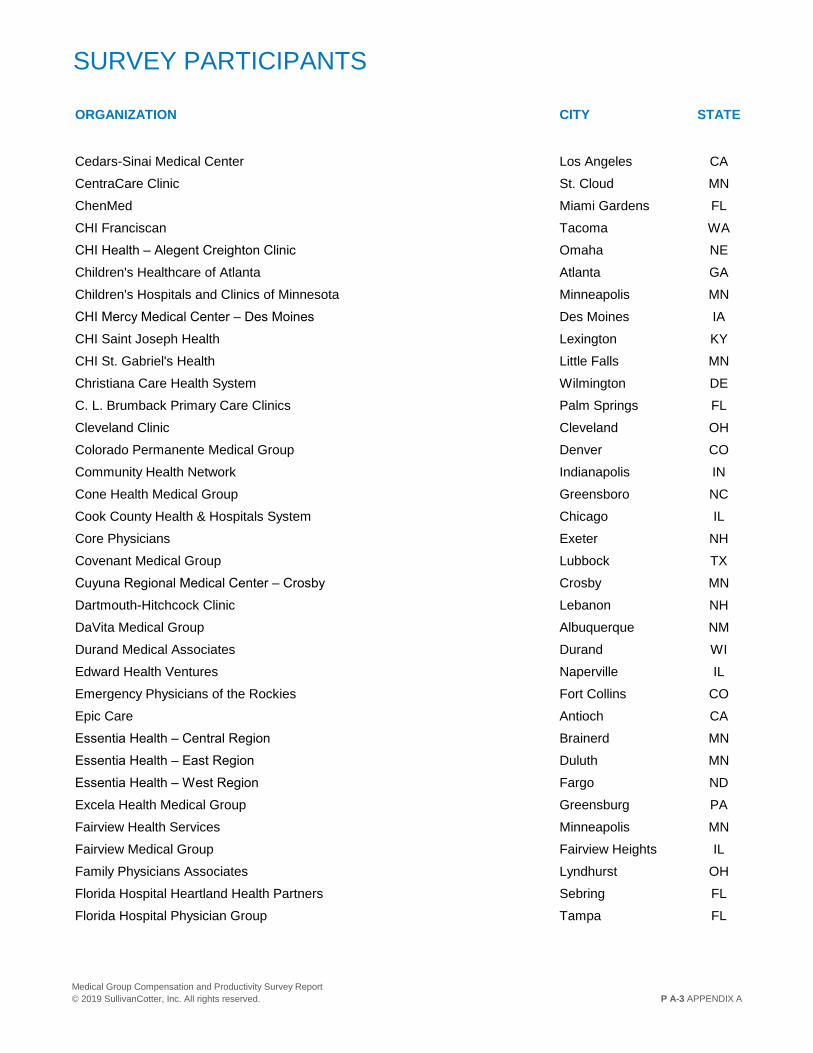
SURVEY PARTICIPANTS
ORGANIZATION CITY STATE
Cedars-Sinai Medical Center Los Angeles CA
CentraCare Clinic St. Cloud MN
ChenMed Miami Gardens FL
CHI Franciscan Tacoma WA
CHI Health – Alegent Creighton Clinic Omaha NE
Children's Healthcare of Atlanta Atlanta GA
Children's Hospitals and Clinics of Minnesota Minneapolis MN
CHI Mercy Medical Center – Des Moines Des Moines IA
CHI Saint Joseph Health Lexington KY
CHI St. Gabriel's Health Little Falls MN
Christiana Care Health System Wilmington DE
C. L. Brumback Primary Care Clinics Palm Springs FL
Cleveland Clinic Cleveland OH
Colorado Permanente Medical Group Denver CO
Community Health Network Indianapolis IN
Cone Health Medical Group Greensboro NC
Cook County Health & Hospitals System Chicago IL
Core Physicians Exeter NH
Covenant Medical Group Lubbock TX
Cuyuna Regional Medical Center – Crosby Crosby MN
Dartmouth-Hitchcock Clinic Lebanon NH
DaVita Medical Group Albuquerque NM
Durand Medical Associates Durand WI
Edward Health Ventures Naperville IL
Emergency Physicians of the Rockies Fort Collins CO
Epic Care Antioch CA
Essentia Health – Central Region Brainerd MN
Essentia Health – East Region Duluth MN
Essentia Health – West Region Fargo ND
Excela Health Medical Group Greensburg PA
Fairview Health Services Minneapolis MN
Fairview Medical Group Fairview Heights IL
Family Physicians Associates Lyndhurst OH
Florida Hospital Heartland Health Partners Sebring FL
Florida Hospital Physician Group Tampa FL
P A-3 APPENDIX A
Medical Group Compensation and Productivity Survey Report
© 2019 SullivanCotter, Inc. All rights reserved.
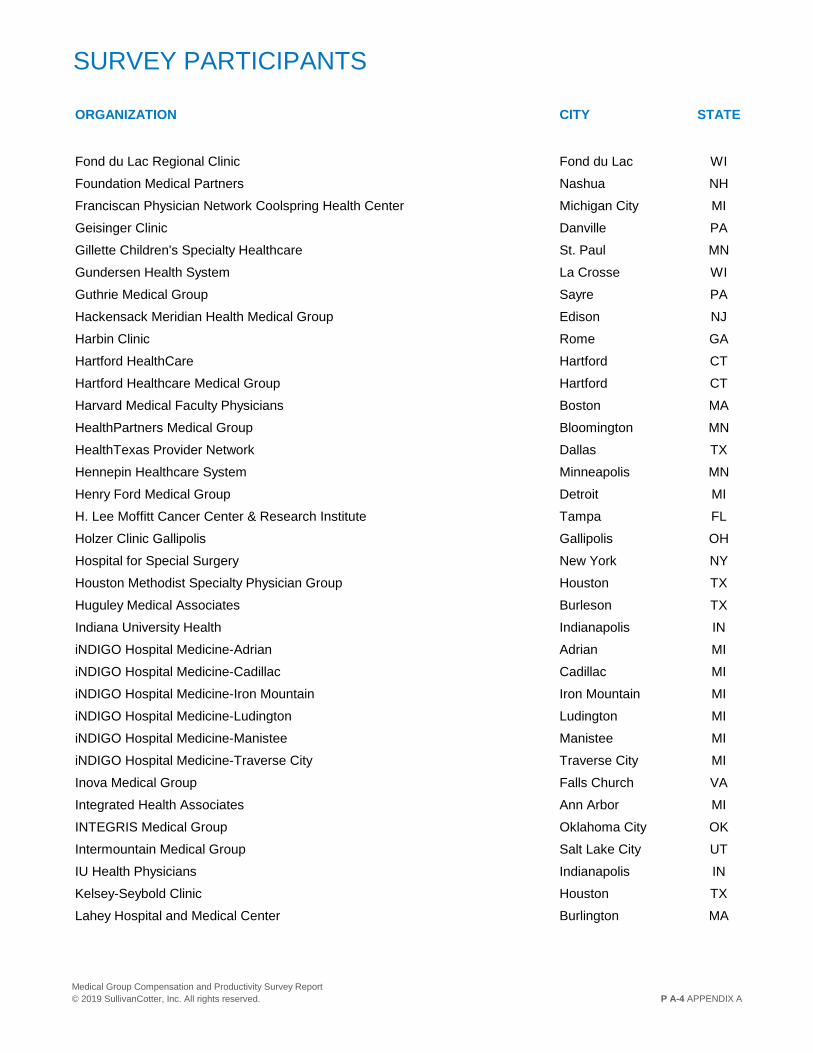
SURVEY PARTICIPANTS
ORGANIZATION CITY STATE
Fond du Lac Regional Clinic Fond du Lac WI
Foundation Medical Partners Nashua NH
Franciscan Physician Network Coolspring Health Center Michigan City MI
Geisinger Clinic Danville PA
Gillette Children's Specialty Healthcare St. Paul MN
Gundersen Health System La Crosse WI
Guthrie Medical Group Sayre PA
Hackensack Meridian Health Medical Group Edison NJ
Harbin Clinic Rome GA
Hartford HealthCare Hartford CT
Hartford Healthcare Medical Group Hartford CT
Harvard Medical Faculty Physicians Boston MA
HealthPartners Medical Group Bloomington MN
HealthTexas Provider Network Dallas TX
Hennepin Healthcare System Minneapolis MN
Henry Ford Medical Group Detroit MI
H. Lee Moffitt Cancer Center & Research Institute Tampa FL
Holzer Clinic Gallipolis Gallipolis OH
Hospital for Special Surgery New York NY
Houston Methodist Specialty Physician Group Houston TX
Huguley Medical Associates Burleson TX
Indiana University Health Indianapolis IN
iNDIGO Hospital Medicine-Adrian Adrian MI
iNDIGO Hospital Medicine-Cadillac Cadillac MI
iNDIGO Hospital Medicine-Iron Mountain Iron Mountain MI
iNDIGO Hospital Medicine-Ludington Ludington MI
iNDIGO Hospital Medicine-Manistee Manistee MI
iNDIGO Hospital Medicine-Traverse City Traverse City MI
Inova Medical Group Falls Church VA
Integrated Health Associates Ann Arbor MI
INTEGRIS Medical Group Oklahoma City OK
Intermountain Medical Group Salt Lake City UT
IU Health Physicians Indianapolis IN
Kelsey-Seybold Clinic Houston TX
Lahey Hospital and Medical Center Burlington MA
P A-4 APPENDIX A
Medical Group Compensation and Productivity Survey Report
© 2019 SullivanCotter, Inc. All rights reserved.
SURVEY PARTICIPANTS
ORGANIZATION CITY STATE
Lancaster General Health Lancaster PA
Legacy Health Portland OR
Lehigh Valley Physician Group Allentown PA
Lifespan Physicians Group Providence RI
Live Oak Health Partners San Marcos TX
Maine Medical Partners Scarborough ME
Mankato Clinic Mankato MN
Marshfield Clinic Marshfield WI
Massachusetts General Physicians Organization Boston MA
Maury Regional Medical Group Columbia TN
Mayo Clinic AZ Scottsdale AZ
Mayo Clinic – Corporate Rochester MN
Mayo Clinic FL Jacksonville FL
Mayo Clinic Health System in Albert Lea Albert Lea MN
Mayo Clinic Health System in Austin Austin MN
Mayo Clinic Health System in Cannon Falls Cannon Falls MN
Mayo Clinic Health System in Lake City Lake City MN
Mayo Clinic Health System in Owatonna Owatonna MN
Mayo Clinic Health System in Red Wing Red Wing MN
Mayo Clinic Health System – NWWI Eau Claire WI
MCHS SWMN Region Fairmont MN
MCHS SWWI Region La Crosse WI
McKesson Specialty Health & The US Oncology Network The Woodlands TX
McLaren Medical Group Flint MI
McLeod Physician Associates Florence SC
Medical College of Wisconsin Milwaukee WI
Medical Group of Tampa Bay Zephyrhills FL
Medical Group of the Carolinas Spartanburg SC
Medical University of South Carolina Physicians Charleston SC
Medical University of South Carolina Physicians Primary Care Charleston SC
MEDNAX Sunrise FL
Memorial Physician Group Miramar FL
Memorial Physician Services Springfield IL
Mercy Clinic East Communities St. Louis MO
Mercy Clinic Springfield Communities Springfield MO
P A-5 APPENDIX A
Medical Group Compensation and Productivity Survey Report
© 2019 SullivanCotter, Inc. All rights reserved.
SURVEY PARTICIPANTS
ORGANIZATION CITY STATE
Mercy Health Physicians – Cincinnati Cincinnati OH
Mercy Health Physicians – Kentucky Paducah KY
Mercy Health Physicians – Lima Lima OH
Mercy Health Physicians – Lorain Lorain OH
Mercy Health Physicians – Springfield Springfield OH
Mercy Health Physicians – Toledo Toledo OH
Mercy Health Physicians – Youngstown Youngstown OH
Mercy Health Saint Mary's Grand Rapids MI
Mercy Iowa City Iowa City IA
Mercy Medical Group Sacramento CA
Methodist Medical Group Dallas TX
Metroplex Clinic Physicians Killeen TX
Mid Dakota Clinic Bismarck ND
Midwest Community Health Associates Bryan OH
Mountain West Anesthesia Lehi UT
Mount Nittany Physician Group State College PA
MultiCare Health System Tacoma WA
Network Physicians Winston-Salem NC
Northeast Georgia Physicians Group Gainesville GA
Northern Arizona Healthcare Flagstaff AZ
Northern Colorado Anesthesia Professionals Fort Collins CO
Northern Light Eastern Maine Medical Center Bangor ME
North Memorial Health Care Robbinsdale MN
NorthShore University HealthSystem Evanston IL
Northwell Health Great Neck NY
Northwestern Medical Group Chicago IL
Northwestern Medicine Regional Medical Group Winfield IL
Northwestern Memorial HealthCare Chicago IL
Northwest Permanente Portland OR
Norton Medical Group Louisville KY
NYU Langone Health New York NY
Ochsner Health System New Orleans LA
Olathe Health Physicians Olathe KS
One Medical Gilbert AZ
One Medical San Francisco CA
P A-6 APPENDIX A
Medical Group Compensation and Productivity Survey Report
© 2019 SullivanCotter, Inc. All rights reserved.
SURVEY PARTICIPANTS
ORGANIZATION CITY STATE
One Medical Washington DC
One Medical Chicago IL
One Medical Boston MA
One Medical New York NY
One Medical Tysons VA
One Medical Seattle WA
Orlando Health Orlando FL
OrthoNebraska Omaha NE
OSF Medical Group Peoria IL
Park Nicollet St. Louis Park MN
Parkview Physicians Group Fort Wayne IN
Partners Community Physicians Organization Needham MA
PeaceHealth Bellevue WA
Penn State Medical Group Hershey PA
Phoebe Physician Group Albany GA
Physician Affiliate Group of New York New York NY
Physician Services of Memorial Hospital Manchester KY
Physicians Groups St. Louis MO
Physicians Laboratory Sioux Falls SD
PinnacleHealth Medical Group Lemoyne PA
Premier Physician Network Dayton OH
Private Diagnostic Clinic Durham NC
ProHealth Physicians Farmington CT
ProMedica Physician Group Sylvania OH
Rancho Family Medical Group Temecula CA
Reliant Medical Group Worcester MA
Riverside Medical Group Newport News VA
Rochester Behavioral Health Network Rochester NY
Rochester General Hospital Rochester NY
Salem Health Salem OR
Sanford Health Sioux Falls SD
SCL Physicians – Denver Denver CO
Scott & White Clinic – Temple Temple TX
Scripps Clinic Medical Group La Jolla CA
Scripps Health Inpatient Providers Medical Group San Diego CA
P A-7 APPENDIX A
Medical Group Compensation and Productivity Survey Report
© 2019 SullivanCotter, Inc. All rights reserved.
SURVEY PARTICIPANTS
ORGANIZATION CITY STATE
Sentara Medical Group Norfolk VA
Sharp Rees-Stealy San Diego CA
Sheppard Pratt Physicians Baltimore MD
Southcoast Health System New Bedford MA
Southern California Permanente Medical Group Pasadena CA
South Shore Medical Center Norwell MA
Southwest Florida Neurosurgical & Rehab Associates Fort Myers FL
Southwest Medical Associates Las Vegas NV
Spectrum Health Grand Rapids MI
Springfield Clinic Springfield IL
SSM Health Medical Group – St. Louis St. Louis MO
Stanford University School of Medicine Stanford CA
St. Charles Medical Group Bend OR
St. Elizabeth Physicians Crestview Hills KY
St. Luke's Physician Group Bethlehem PA
Summa Health System Akron OH
Sutter East Bay Medical Group Lafayette CA
Sutter Health Roseville CA
Sutter Medical Group Sacramento CA
Sutter Pacific Medical Foundation San Francisco CA
Tampa General Medical Group Tampa FL
Texas Children's Pediatrics Houston TX
Texas Health Physicians Group Arlington TX
The Corvallis Clinic Corvallis OR
The Everett Clinic Everett WA
The Gould Medical Group Modesto CA
The Nebraska Medical Center Omaha NE
The Physician Network Lincoln NE
The Queen's Medical Center Honolulu HI
The Southeast Permanente Medical Group Atlanta GA
TriHealth Cincinnati OH
Trinity Health Of New England Medical Group Hartford CT
Trinity Medical WNY Buffalo NY
UCHealth Medical Group Fort Collins CO
Unity Hospital Rochester NY
P A-8 APPENDIX A
Medical Group Compensation and Productivity Survey Report
© 2019 SullivanCotter, Inc. All rights reserved.
SURVEY PARTICIPANTS
ORGANIZATION CITY STATE
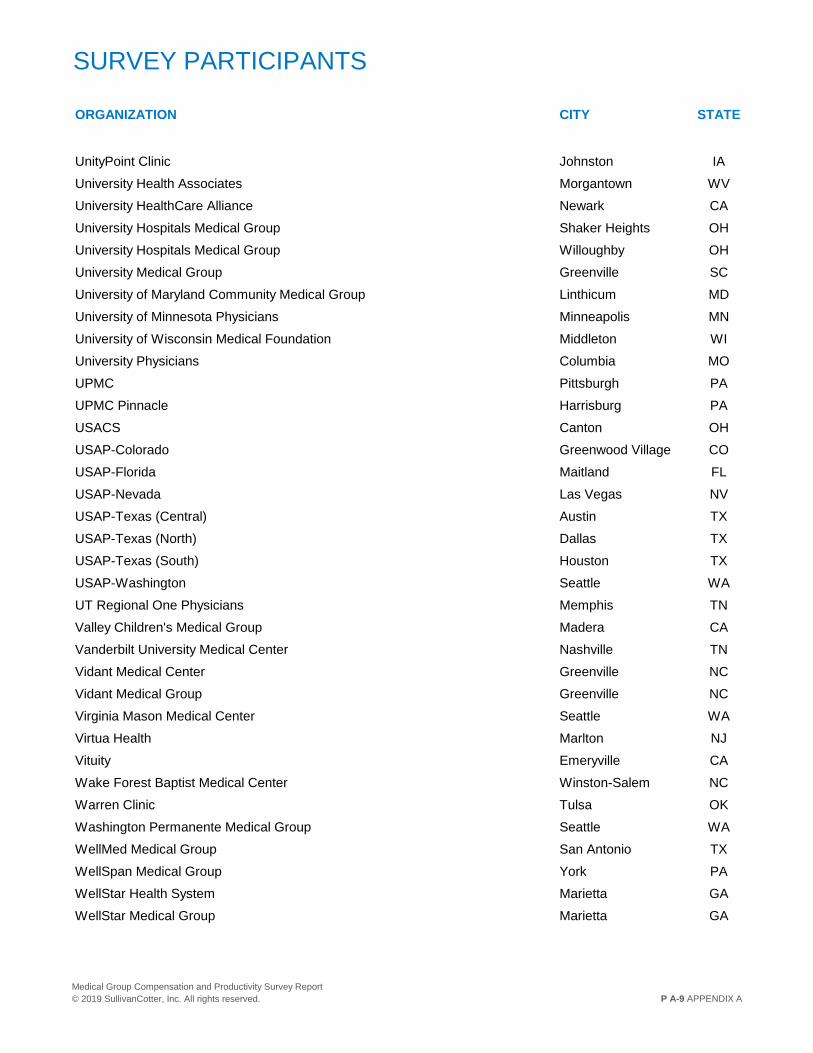
UnityPoint Clinic Johnston IA
University Health Associates Morgantown WV
University HealthCare Alliance Newark CA
University Hospitals Medical Group Shaker Heights OH
University Hospitals Medical Group Willoughby OH
University Medical Group Greenville SC
University of Maryland Community Medical Group Linthicum MD
University of Minnesota Physicians Minneapolis MN
University of Wisconsin Medical Foundation Middleton WI
University Physicians Columbia MO
UPMC Pittsburgh PA
UPMC Pinnacle Harrisburg PA
USACS Canton OH
USAP-Colorado Greenwood Village CO
USAP-Florida Maitland FL
USAP-Nevada Las Vegas NV
USAP-Texas (Central) Austin TX
USAP-Texas (North) Dallas TX
USAP-Texas (South) Houston TX
USAP-Washington Seattle WA
UT Regional One Physicians Memphis TN
Valley Children's Medical Group Madera CA
Vanderbilt University Medical Center Nashville TN
Vidant Medical Center Greenville NC
Vidant Medical Group Greenville NC
Virginia Mason Medical Center Seattle WA
Virtua Health Marlton NJ
Vituity Emeryville CA
Wake Forest Baptist Medical Center Winston-Salem NC
Warren Clinic Tulsa OK
Washington Permanente Medical Group Seattle WA
WellMed Medical Group San Antonio TX
WellSpan Medical Group York PA
WellStar Health System Marietta GA
WellStar Medical Group Marietta GA
P A-9 APPENDIX A
Medical Group Compensation and Productivity Survey Report
© 2019 SullivanCotter, Inc. All rights reserved.
SURVEY PARTICIPANTS
ORGANIZATION CITY STATE
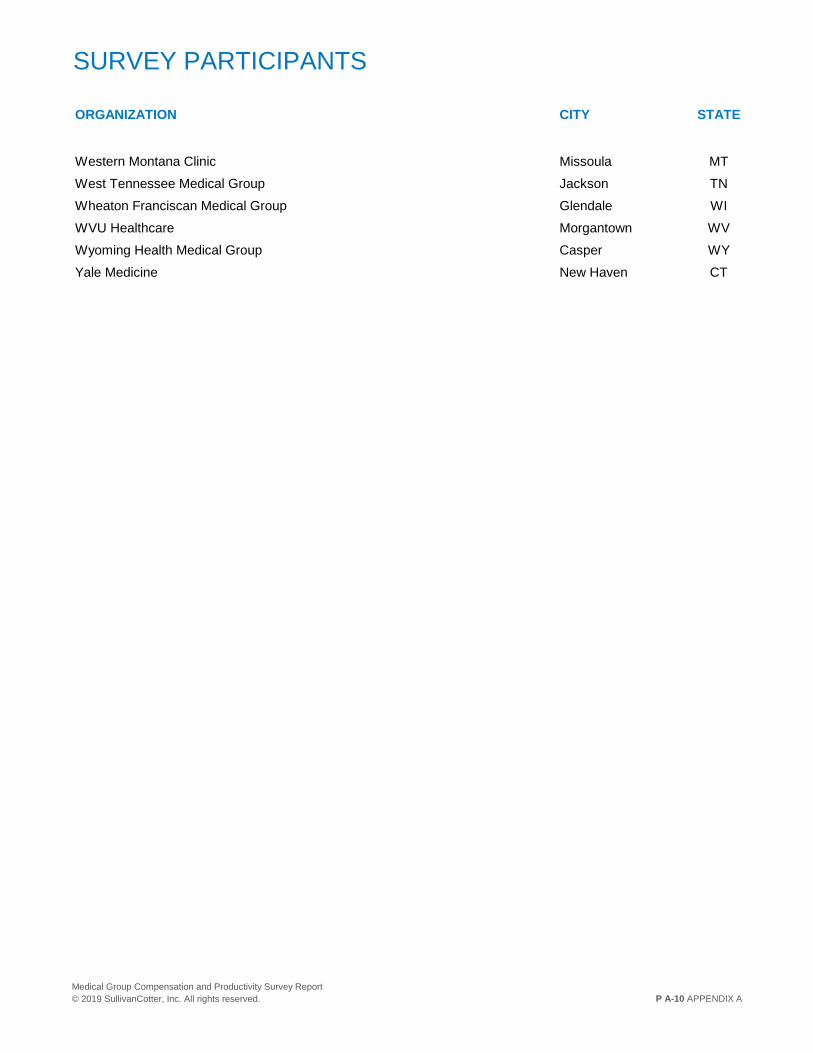
Western Montana Clinic Missoula MT
West Tennessee Medical Group Jackson TN
Wheaton Franciscan Medical Group Glendale WI
WVU Healthcare Morgantown WV
Wyoming Health Medical Group Casper WY
Yale Medicine New Haven CT
P A-10 APPENDIX A
Medical Group Compensation and Productivity Survey Report
© 2019 SullivanCotter, Inc. All rights reserved.
APPENDIX B:
JOB OR SPECIALTY
LIST AND
SUMMARIES
JOB OR SPECIALTY LIST AND SUMMARIES
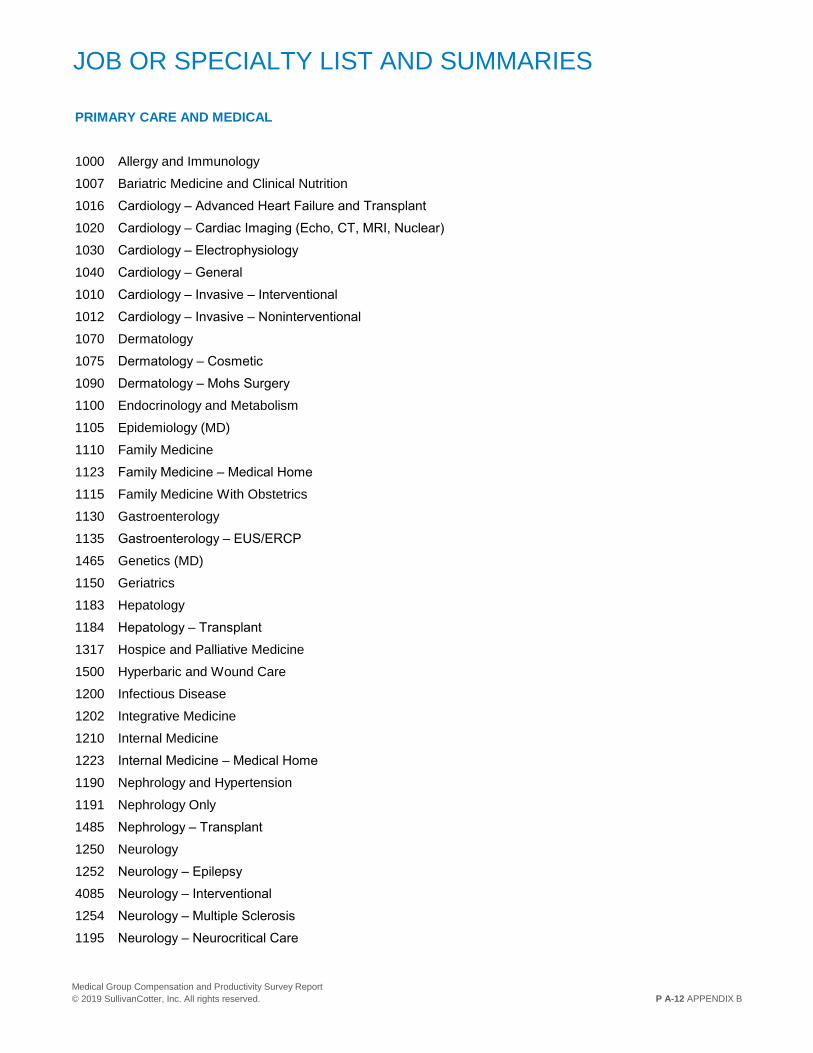
PRIMARY CARE AND MEDICAL
1000 Allergy and Immunology
1007 Bariatric Medicine and Clinical Nutrition
1016 Cardiology – Advanced Heart Failure and Transplant
1020 Cardiology – Cardiac Imaging (Echo, CT, MRI, Nuclear)
1030 Cardiology – Electrophysiology
1040 Cardiology – General
1010 Cardiology – Invasive – Interventional
1012 Cardiology – Invasive – Noninterventional
1070 Dermatology
1075 Dermatology – Cosmetic
1090 Dermatology – Mohs Surgery
1100 Endocrinology and Metabolism
1105 Epidemiology (MD)
1110 Family Medicine
1123 Family Medicine – Medical Home
1115 Family Medicine With Obstetrics
1130 Gastroenterology
1135 Gastroenterology – EUS/ERCP
1465 Genetics (MD)
1150 Geriatrics
1183 Hepatology
1184 Hepatology – Transplant
1317 Hospice and Palliative Medicine
1500 Hyperbaric and Wound Care
1200 Infectious Disease
1202 Integrative Medicine
1210 Internal Medicine
1223 Internal Medicine – Medical Home
1190 Nephrology and Hypertension
1191 Nephrology Only
1485 Nephrology – Transplant
1250 Neurology
1252 Neurology – Epilepsy
4085 Neurology – Interventional
1254 Neurology – Multiple Sclerosis
1195 Neurology – Neurocritical Care
P A-12 APPENDIX B
Medical Group Compensation and Productivity Survey Report
© 2019 SullivanCotter, Inc. All rights reserved.
JOB OR SPECIALTY LIST AND SUMMARIES
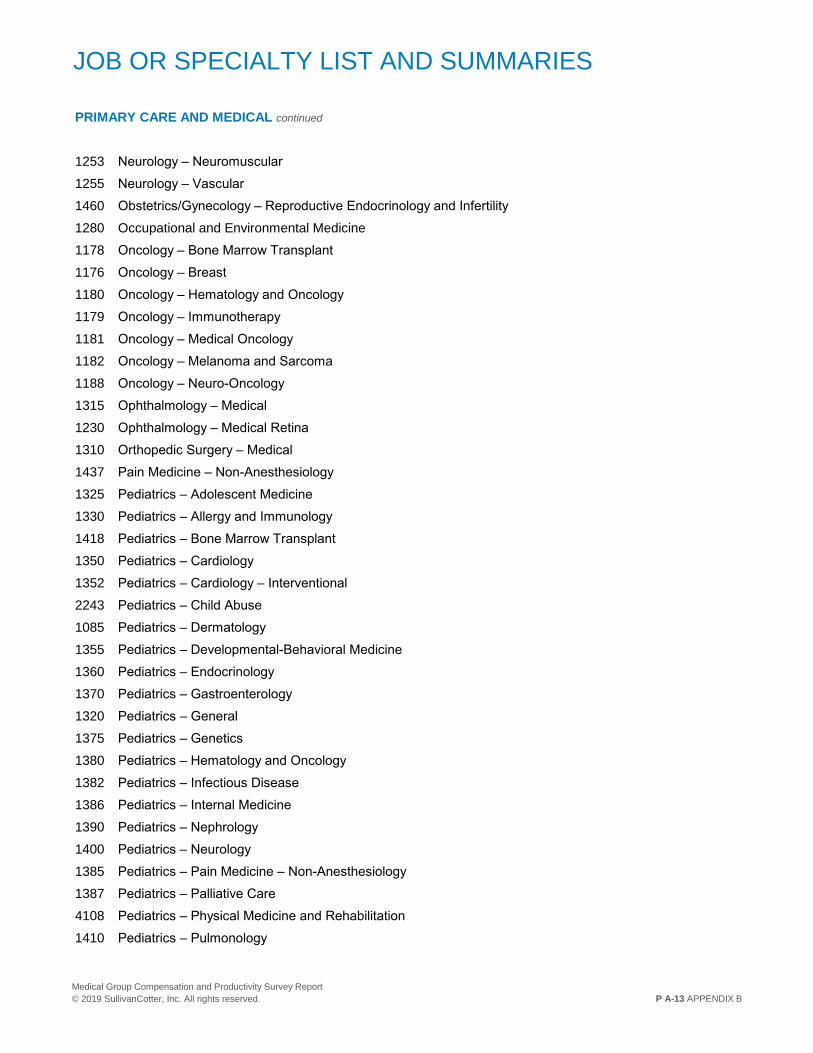
PRIMARY CARE AND MEDICAL continued
1253 Neurology – Neuromuscular
1255 Neurology – Vascular
1460 Obstetrics/Gynecology – Reproductive Endocrinology and Infertility
1280 Occupational and Environmental Medicine
1178 Oncology – Bone Marrow Transplant
1176 Oncology – Breast
1180 Oncology – Hematology and Oncology
1179 Oncology – Immunotherapy
1181 Oncology – Medical Oncology
1182 Oncology – Melanoma and Sarcoma
1188 Oncology – Neuro-Oncology
1315 Ophthalmology – Medical
1230 Ophthalmology – Medical Retina
1310 Orthopedic Surgery – Medical
1437 Pain Medicine – Non-Anesthesiology
1325 Pediatrics – Adolescent Medicine
1330 Pediatrics – Allergy and Immunology
1418 Pediatrics – Bone Marrow Transplant
1350 Pediatrics – Cardiology
1352 Pediatrics – Cardiology – Interventional
2243 Pediatrics – Child Abuse
1085 Pediatrics – Dermatology
1355 Pediatrics – Developmental-Behavioral Medicine
1360 Pediatrics – Endocrinology
1370 Pediatrics – Gastroenterology
1320 Pediatrics – General
1375 Pediatrics – Genetics
1380 Pediatrics – Hematology and Oncology
1382 Pediatrics – Infectious Disease
1386 Pediatrics – Internal Medicine
1390 Pediatrics – Nephrology
1400 Pediatrics – Neurology
1385 Pediatrics – Pain Medicine – Non-Anesthesiology
1387 Pediatrics – Palliative Care
4108 Pediatrics – Physical Medicine and Rehabilitation
1410 Pediatrics – Pulmonology
P A-13 APPENDIX B
Medical Group Compensation and Productivity Survey Report
© 2019 SullivanCotter, Inc. All rights reserved.
JOB OR SPECIALTY LIST AND SUMMARIES
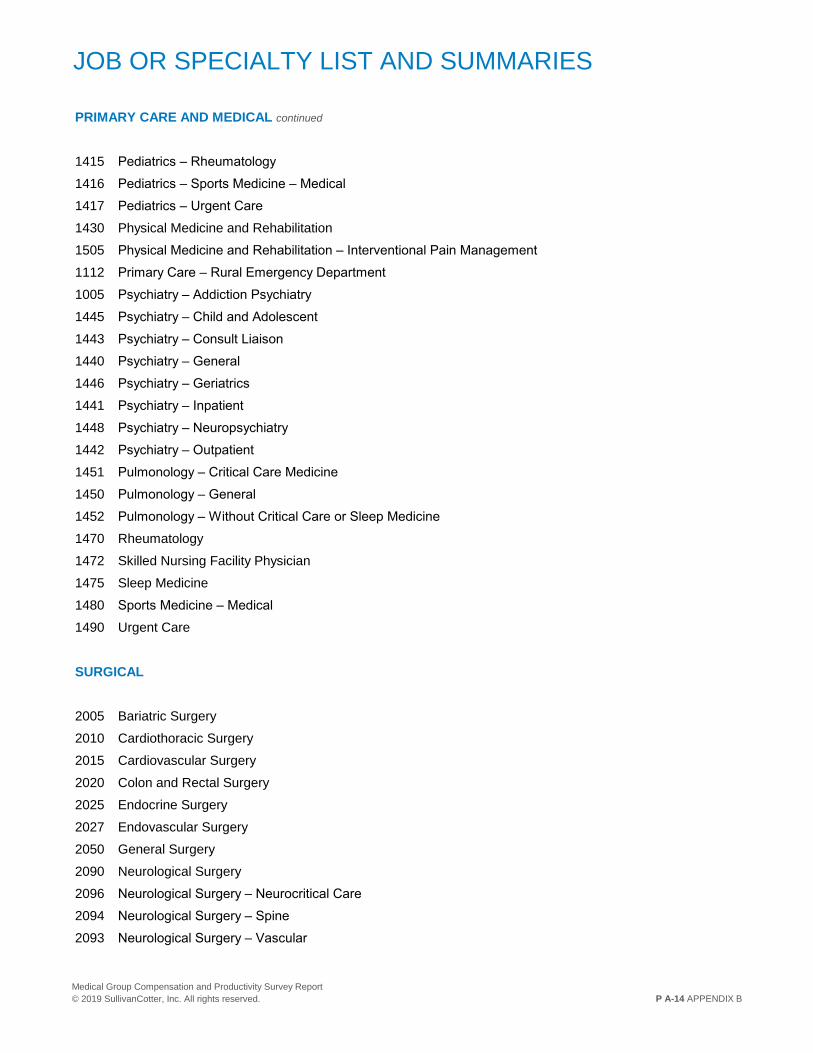
PRIMARY CARE AND MEDICAL continued
1415 Pediatrics – Rheumatology
1416 Pediatrics – Sports Medicine – Medical
1417 Pediatrics – Urgent Care
1430 Physical Medicine and Rehabilitation
1505 Physical Medicine and Rehabilitation – Interventional Pain Management
1112 Primary Care – Rural Emergency Department
1005 Psychiatry – Addiction Psychiatry
1445 Psychiatry – Child and Adolescent
1443 Psychiatry – Consult Liaison
1440 Psychiatry – General
1446 Psychiatry – Geriatrics
1441 Psychiatry – Inpatient
1448 Psychiatry – Neuropsychiatry
1442 Psychiatry – Outpatient
1451 Pulmonology – Critical Care Medicine
1450 Pulmonology – General
1452 Pulmonology – Without Critical Care or Sleep Medicine
1470 Rheumatology
1472 Skilled Nursing Facility Physician
1475 Sleep Medicine
1480 Sports Medicine – Medical
1490 Urgent Care
SURGICAL
2005 Bariatric Surgery
2010 Cardiothoracic Surgery
2015 Cardiovascular Surgery
2020 Colon and Rectal Surgery
2025 Endocrine Surgery
2027 Endovascular Surgery
2050 General Surgery
2090 Neurological Surgery
2096 Neurological Surgery – Neurocritical Care
2094 Neurological Surgery – Spine
2093 Neurological Surgery – Vascular
P A-14 APPENDIX B
Medical Group Compensation and Productivity Survey Report
© 2019 SullivanCotter, Inc. All rights reserved.
JOB OR SPECIALTY LIST AND SUMMARIES
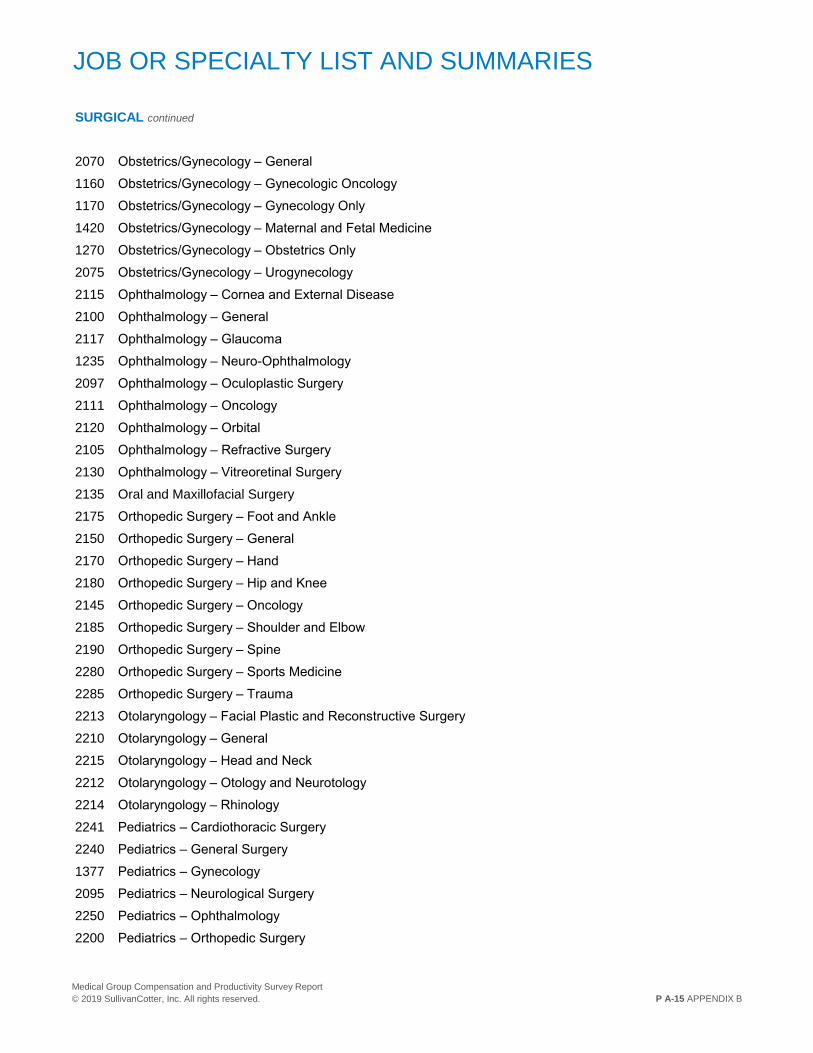
SURGICAL continued
2070 Obstetrics/Gynecology – General
1160 Obstetrics/Gynecology – Gynecologic Oncology
1170 Obstetrics/Gynecology – Gynecology Only
1420 Obstetrics/Gynecology – Maternal and Fetal Medicine
1270 Obstetrics/Gynecology – Obstetrics Only
2075 Obstetrics/Gynecology – Urogynecology
2115 Ophthalmology – Cornea and External Disease
2100 Ophthalmology – General
2117 Ophthalmology – Glaucoma
1235 Ophthalmology – Neuro-Ophthalmology
2097 Ophthalmology – Oculoplastic Surgery
2111 Ophthalmology – Oncology
2120 Ophthalmology – Orbital
2105 Ophthalmology – Refractive Surgery
2130 Ophthalmology – Vitreoretinal Surgery
2135 Oral and Maxillofacial Surgery
2175 Orthopedic Surgery – Foot and Ankle
2150 Orthopedic Surgery – General
2170 Orthopedic Surgery – Hand
2180 Orthopedic Surgery – Hip and Knee
2145 Orthopedic Surgery – Oncology
2185 Orthopedic Surgery – Shoulder and Elbow
2190 Orthopedic Surgery – Spine
2280 Orthopedic Surgery – Sports Medicine
2285 Orthopedic Surgery – Trauma
2213 Otolaryngology – Facial Plastic and Reconstructive Surgery
2210 Otolaryngology – General
2215 Otolaryngology – Head and Neck
2212 Otolaryngology – Otology and Neurotology
2214 Otolaryngology – Rhinology
2241 Pediatrics – Cardiothoracic Surgery
2240 Pediatrics – General Surgery
1377 Pediatrics – Gynecology
2095 Pediatrics – Neurological Surgery
2250 Pediatrics – Ophthalmology
2200 Pediatrics – Orthopedic Surgery
P A-15 APPENDIX B
Medical Group Compensation and Productivity Survey Report
© 2019 SullivanCotter, Inc. All rights reserved.

JOB OR SPECIALTY LIST AND SUMMARIES
SURGICAL continued
2205 Pediatrics – Otolaryngology
2265 Pediatrics – Plastic and Reconstructive Surgery
2335 Pediatrics – Urology
2260 Plastic and Reconstructive Surgery
2262 Plastic and Reconstructive Surgery – Hand
2264 Surgical Critical Care
2007 Surgical Oncology – Breast Surgery
2098 Surgical Oncology – General
2099 Surgical Oncology – Thoracic
3001 Surgical Oncology – Urology
2275 Thoracic Surgery
2296 Transplant Surgery – General
2300 Transplant Surgery – Kidney
2310 Transplant Surgery – Liver
2292 Transplant Surgery – Medical
2290 Transplant Surgery – Thoracic
2295 Trauma Surgery
2008 Trauma Surgery – Burn
2320 Urology
2340 Vascular Surgery
HOSPITAL BASED
2000 Anesthesiology
2003 Anesthesiology – Cardiovascular
2226 Anesthesiology – Neurocritical Care
2230 Anesthesiology – Pain Medicine
1060 Critical Care Medicine
1055 Critical Care Medicine – Cardiology
2030 Emergency Medicine
1185 Hospitalist
1192 Hospitalist – Extensivist
1193 Hospitalist – Neurology
1260 Hospitalist – Nocturnist
1245 Obstetrics/Gynecology – Laborist
2270 Pathology – Anatomic
P A-16 APPENDIX B
Medical Group Compensation and Productivity Survey Report
© 2019 SullivanCotter, Inc. All rights reserved.

JOB OR SPECIALTY LIST AND SUMMARIES
HOSPITAL BASED continued
4100 Pathology – Anatomic and Clinical
4101 Pathology – Blood Banking and Transfusion Medicine
4103 Pathology – Clinical
4104 Pathology – Cytopathology
4010 Pathology – Dermatopathology
4070 Pathology – Microbiology
4075 Pathology – Molecular Genetic
4077 Pathology – Stem Cell Therapy
4107 Pathology – Surgical
4005 Pediatrics – Anesthesiology
1384 Pediatrics – Critical Care Medicine
1056 Pediatrics – Critical Care Medicine – Cardiology
2035 Pediatrics – Emergency Medicine
1187 Pediatrics – Hospitalist
1240 Pediatrics – Neonatal-Perinatal Medicine
4105 Pediatrics – Pathology
4045 Pediatrics – Radiology
4040 Radiology – Diagnostic
4030 Radiology – Interventional
1175 Radiology – Mammography
4020 Radiology – Neurointerventional
4080 Radiology – Nuclear Medicine
4130 Radiology – Radiation Oncology
STAFF ADVANCED PRACTICE PROVIDERS
3029 Certified Anesthesiologist Assistant
3080 Certified Nurse Midwife
3030 Certified Registered Nurse Anesthetist
3025 Clinical Nurse Specialist
3109 Nurse Practitioner – Hospital Based
3113 Nurse Practitioner – Medical
3115 Nurse Practitioner – Primary Care
3117 Nurse Practitioner – Surgical
3179 Physician Assistant – Hospital Based
3180 Physician Assistant – Medical
P A-17 APPENDIX B
Medical Group Compensation and Productivity Survey Report
© 2019 SullivanCotter, Inc. All rights reserved.

JOB OR SPECIALTY LIST AND SUMMARIES
STAFF ADVANCED PRACTICE PROVIDERS continued
3182 Physician Assistant – Primary Care
3185 Physician Assistant – Surgical
OTHER HEALTH CARE PROVIDERS
3000 Audiologist
3020 Biochemistry
3023 Cancer Biology
3027 Cellular and Molecular Biology
3033 Chemistry
3211 Child Psychologist (PhD)
3035 Chiropractor
3034 Computational Biology
3040 Dentist
3090 Dosimetrist
3053 Epidemiology
3054 Genetics
3060 Immunology
3070 Microbiology
3075 Neurophysiology
3215 Neuropsychology (PhD)
3073 Neuroscience
3118 Nutritionist (Non-MD)
3120 Occupational Therapist
3130 Optometrist
3042 Orthodontics
3150 Pathology
3137 Pathology Assistant
3041 Pediatric Dentist
3155 Perfusionist
3160 Pharmacist
3221 Pharmacology
3170 Physical Therapist
3050 Physics – Diagnostic Radiology
3055 Physics – Imaging
3100 Physics – Nuclear Medicine
P A-18 APPENDIX B
Medical Group Compensation and Productivity Survey Report
© 2019 SullivanCotter, Inc. All rights reserved.
JOB OR SPECIALTY LIST AND SUMMARIES
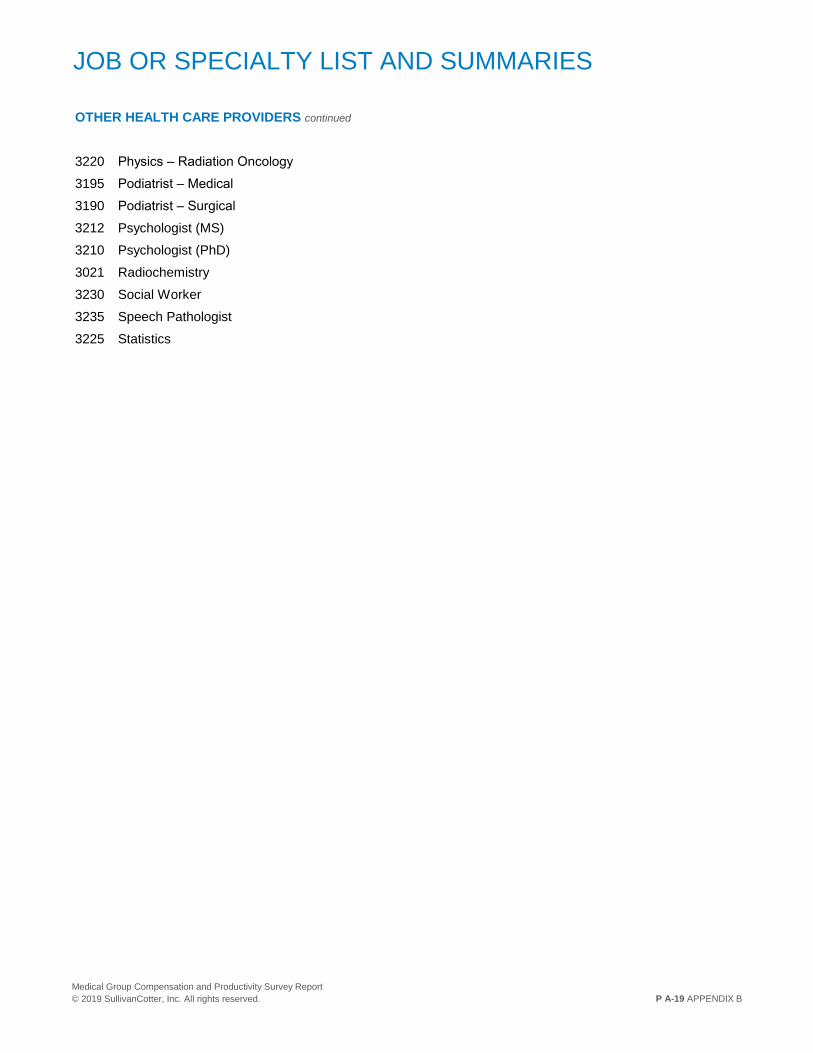
OTHER HEALTH CARE PROVIDERS continued
3220 Physics – Radiation Oncology
3195 Podiatrist – Medical
3190 Podiatrist – Surgical
3212 Psychologist (MS)
3210 Psychologist (PhD)
3021 Radiochemistry
3230 Social Worker
3235 Speech Pathologist
3225 Statistics
P A-19 APPENDIX B
Medical Group Compensation and Productivity Survey Report
© 2019 SullivanCotter, Inc. All rights reserved.
APPENDIX C:
TERMS AND
DEFINITIONS
APPENDIX D:
ABOUT
SULLIVANCOTTER
ABOUT SULLIVANCOTTER
SullivanCotter partners with health care and other not-for-profit organizations to
drive performance and improve outcomes through the development and
implementation of integrated workforce strategies. Using our time-tested
methodologies and industry-leading research and information, we provide
data-driven insights and expertise to help organizations align business strategy
and performance objectives – enabling our clients to deliver on their mission,
vision and values.
For more information, visit www.sullivancotter.com or call 888.739.7039.
SullivanCotter has offices in Atlanta, Boston, Chicago, Denver, Detroit,
Eau Claire, Minneapolis, New York, Parsippany, Philadelphia, Pittsburgh and
San Francisco.
P A-61 APPENDIX D
Medical Group Compensation and Productivity Survey Report
© 2019 SullivanCotter, Inc. All rights reserved.