2019 q1 report - seattle
TRANSCRIPT
Date (xx/xx/xxxx) Department Name Page Number5/7/2019 Seattle Department of Transportation5/7/2019 Seattle Department of Transportation
2019 Q1 Report

Date (xx/xx/xxxx) Department Name Page Number5/7/2019 Seattle Department of Transportation5/7/2019 Page 2
2019 Q1 report
• Progress against 2019 planned accomplishments
• Q1 delivery highlights
• Q1 finance update
• 2019 spend plan
Date (xx/xx/xxxx) Department Name Page Number5/7/2019 Seattle Department of Transportation5/7/2019 Page 3
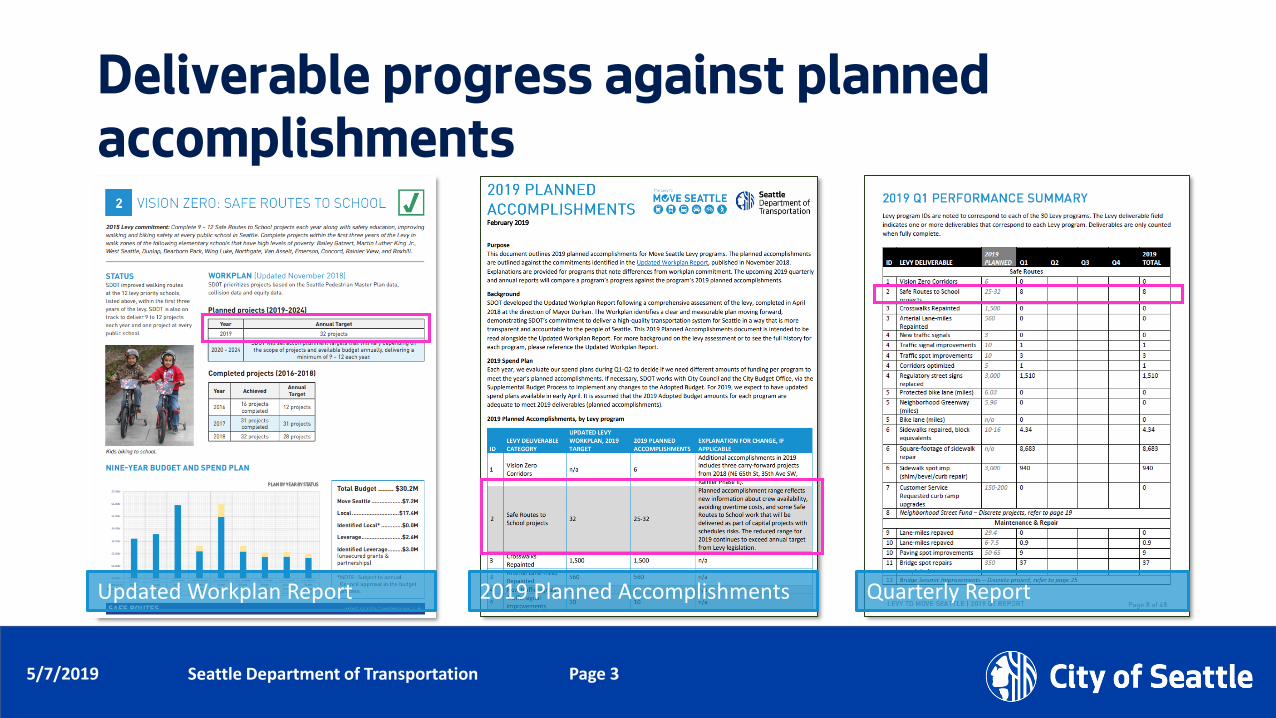
Deliverable progress against planned accomplishments
Updated Workplan Report 2019 Planned Accomplishments Quarterly Report
Date (xx/xx/xxxx) Department Name Page Number5/7/2019 Seattle Department of Transportation5/7/2019 Page 4
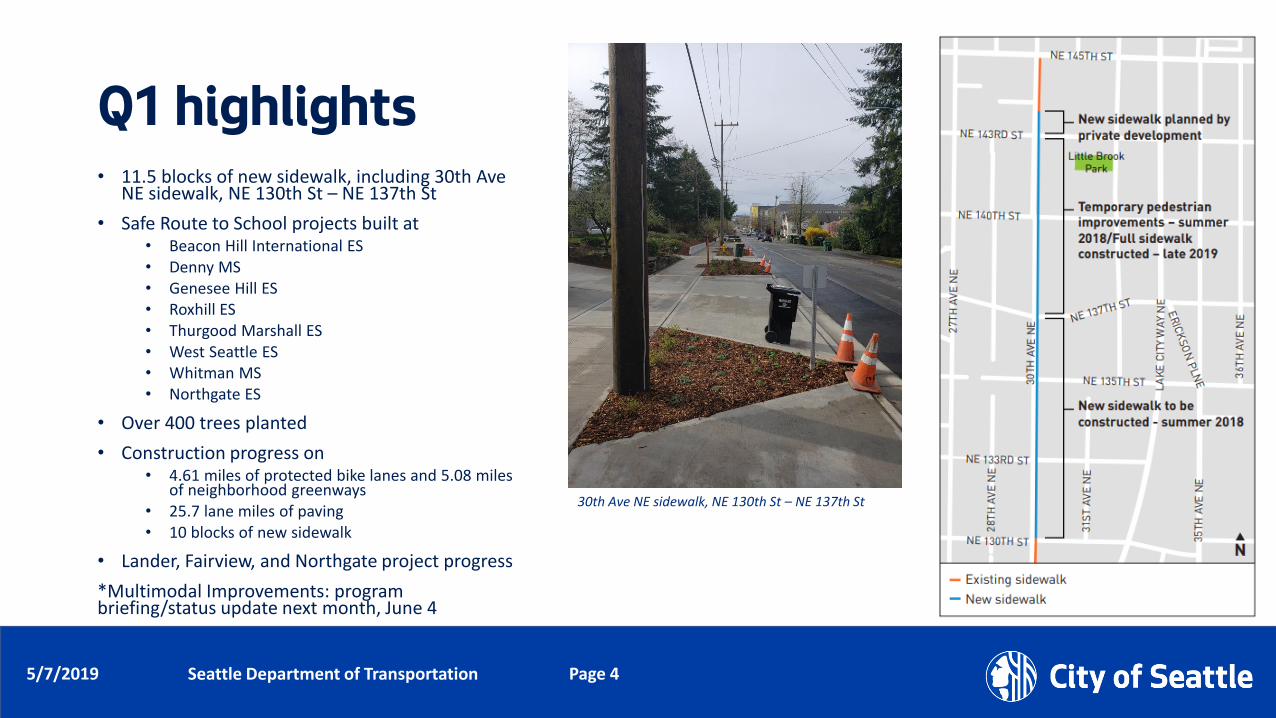
Q1 highlights• 11.5 blocks of new sidewalk, including 30th Ave
NE sidewalk, NE 130th St – NE 137th St
• Safe Route to School projects built at • Beacon Hill International ES • Denny MS • Genesee Hill ES • Roxhill ES • Thurgood Marshall ES • West Seattle ES • Whitman MS • Northgate ES
• Over 400 trees planted
• Construction progress on • 4.61 miles of protected bike lanes and 5.08 miles
of neighborhood greenways• 25.7 lane miles of paving• 10 blocks of new sidewalk
• Lander, Fairview, and Northgate project progress
*Multimodal Improvements: program briefing/status update next month, June 4
30th Ave NE sidewalk, NE 130th St – NE 137th St
Date (xx/xx/xxxx) Department Name Page Number5/7/2019 Seattle Department of Transportation5/7/2019 Page 5
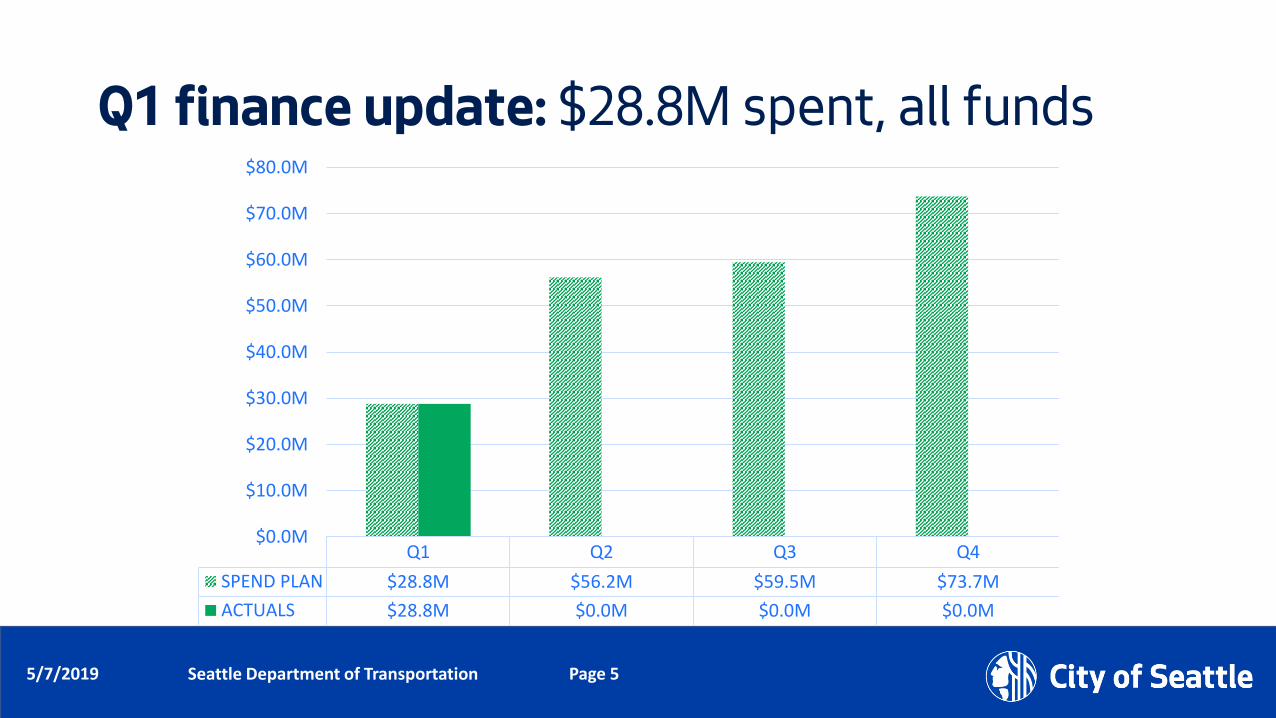
Q1 finance update: $28.8M spent, all funds
Q1 Q2 Q3 Q4
SPEND PLAN $28.8M $56.2M $59.5M $73.7M
ACTUALS $28.8M $0.0M $0.0M $0.0M
$0.0M
$10.0M
$20.0M
$30.0M
$40.0M
$50.0M
$60.0M
$70.0M
$80.0M
Date (xx/xx/xxxx) Department Name Page Number5/7/2019 Seattle Department of Transportation5/7/2019 Page 6
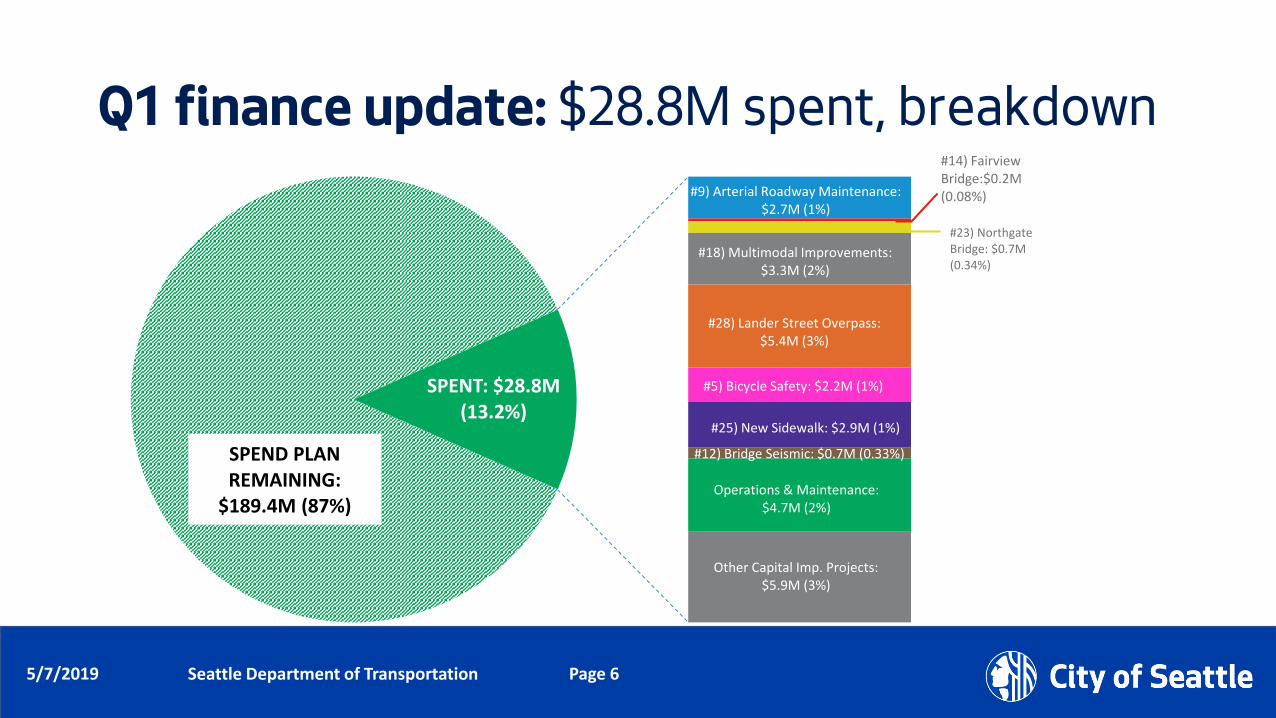
Q1 finance update: $28.8M spent, breakdown
SPEND PLAN REMAINING:
$189.4M (87%)
#9) Arterial Roadway Maintenance: $2.7M (1%)
#14) Fairview Bridge:$0.2M(0.08%)
#23) Northgate Bridge: $0.7M(0.34%)
#18) Multimodal Improvements: $3.3M (2%)
#28) Lander Street Overpass: $5.4M (3%)
#5) Bicycle Safety: $2.2M (1%)
#25) New Sidewalk: $2.9M (1%)
#12) Bridge Seismic: $0.7M (0.33%)
Operations & Maintenance: $4.7M (2%)
Other Capital Imp. Projects: $5.9M (3%)
SPENT: $28.8M(13.2%)

Date (xx/xx/xxxx) Department Name Page Number5/7/2019 Seattle Department of Transportation5/7/2019 Page 7
SDOT spend plans: Overview
Spend plans: project cost estimates over time
Public works contractor-delivered work Crew delivered work
• Becomes more refined as projects advance design, begin construction
• Assumes lags in payments of consultants and contractors
• Driven by separate process

Date (xx/xx/xxxx) Department Name Page Number5/7/2019 Seattle Department of Transportation5/7/2019 Page 8
Spend plan example: Delridge RapidRide H line

Date (xx/xx/xxxx) Department Name Page Number5/7/2019 Seattle Department of Transportation5/7/2019 Page 9
2019 spend plan, $218M: breakdown by spend risk
$40.4M, 18%
$36.0M, 17%
$69.3M, 32%
$43.6M, 20%
$28.9M, 13%
Contractor Delivered: currently in design, 2019 construction projected
Contractor Delivered: currently in design, design-only in 2019
Contractor Delivered: Currently in construction
Non-Contractor Delivered
O&M Projects
Spend plan breakdown by type
Contractor delivered: currently in design, 2019 construction projected
$40.4M
Contractor delivered: currently in design, design-only in 2019
$36.0M
Contractor delivered: Currently in construction $69.3M
Non-contractor delivered $43.6M
O&M projects $28.9M
TOTAL $218.2M
Date (xx/xx/xxxx) Department Name Page Number5/7/2019 Seattle Department of Transportation5/7/2019 Page 10
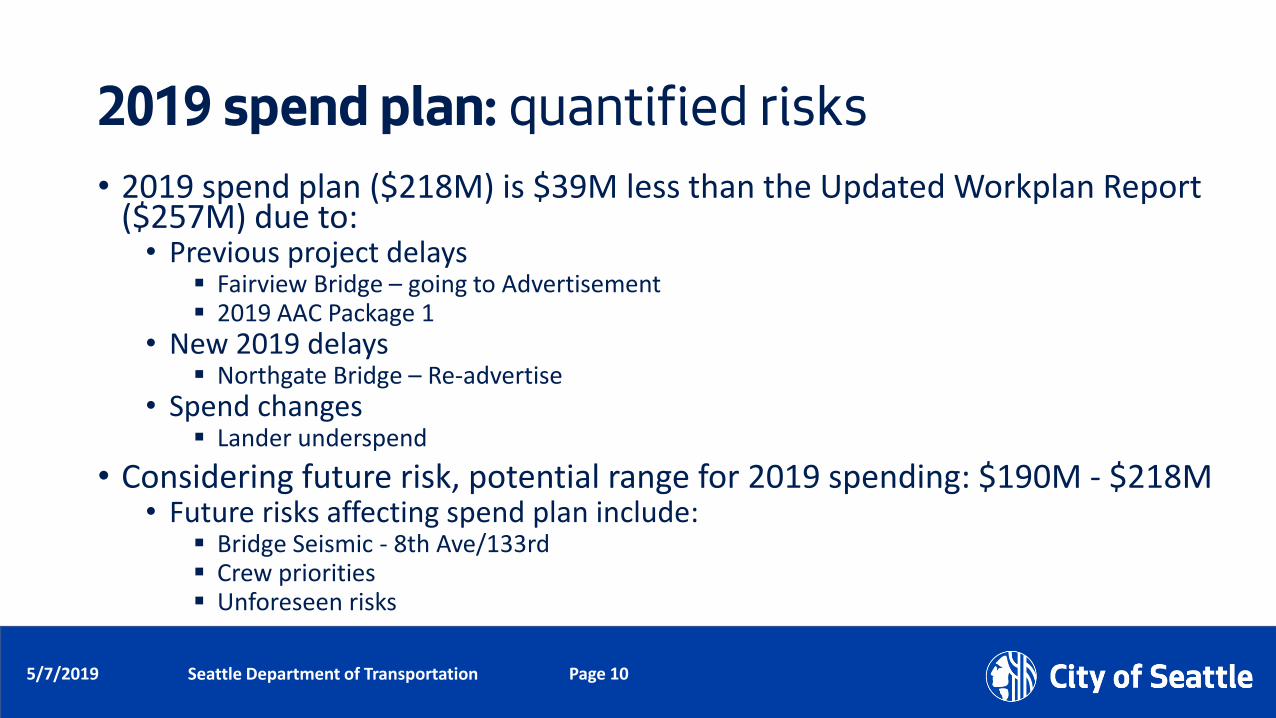
2019 spend plan: quantified risks• 2019 spend plan ($218M) is $39M less than the Updated Workplan Report
($257M) due to: • Previous project delays
▪ Fairview Bridge – going to Advertisement▪ 2019 AAC Package 1
• New 2019 delays▪ Northgate Bridge – Re-advertise
• Spend changes▪ Lander underspend
• Considering future risk, potential range for 2019 spending: $190M - $218M• Future risks affecting spend plan include:
▪ Bridge Seismic - 8th Ave/133rd▪ Crew priorities▪ Unforeseen risks

Date (xx/xx/xxxx) Department Name Page Number5/7/2019 Seattle Department of Transportation5/7/2019 Page 11
2019 spend plan: Looking ahead
Actuals
Spend plan
$112M
$140M
$166M
$218M
$330M$316M
$210M
$180M
$154M
$0 M
$50 M
$100 M
$150 M
$200 M
$250 M
$300 M
$350 M
2016 2017 2018 2019 2020 2021 2022 2023 2024
Date (xx/xx/xxxx) Department Name Page Number5/7/2019 Seattle Department of Transportation5/7/2019 Page 12
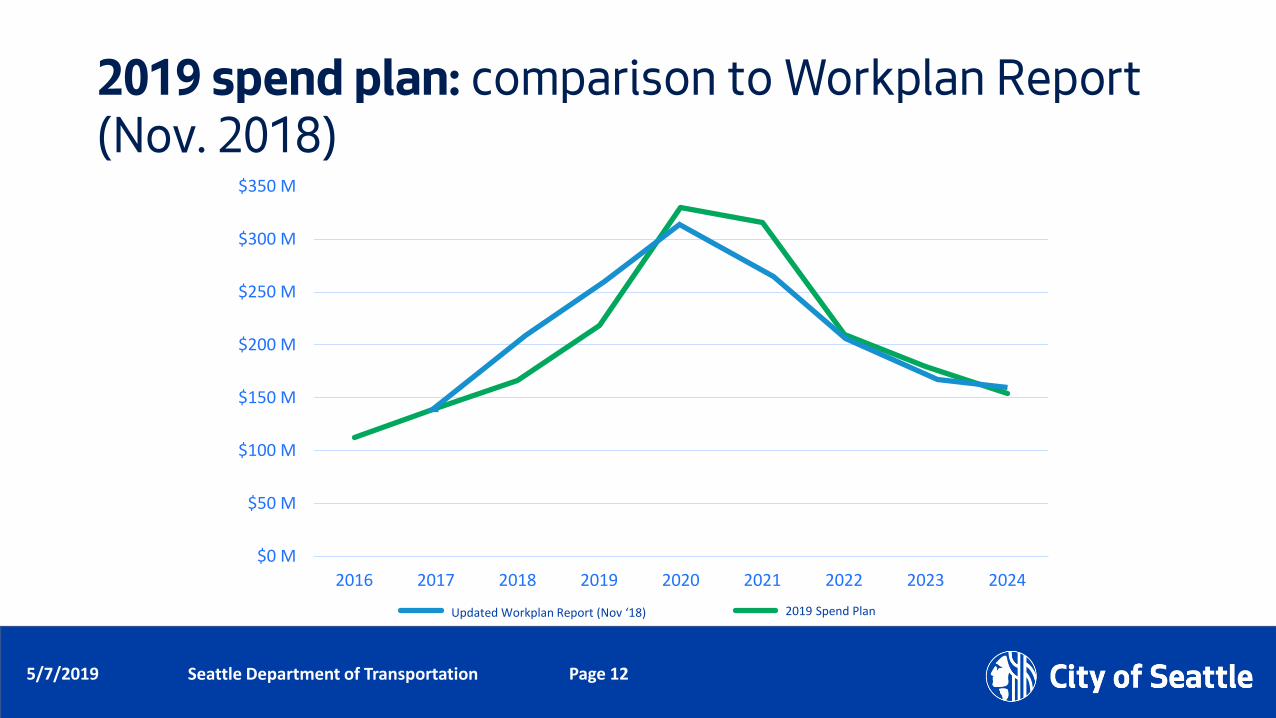
2019 spend plan: comparison to Workplan Report (Nov. 2018)
$0 M
$50 M
$100 M
$150 M
$200 M
$250 M
$300 M
$350 M
2016 2017 2018 2019 2020 2021 2022 2023 2024
Updated Workplan Report (Nov ‘18) 2019 Spend Plan

Date (xx/xx/xxxx) Department Name Page Number5/7/2019 Seattle Department of Transportation5/7/2019 Page 13
Questions?
www.seattle.gov/LevytoMoveSeattle

Date (xx/xx/xxxx)
Department NamePage Number
05/07/2019 Seattle Department of Transportation Page 1
E Marginal Way Project Update
Levy Oversight CommitteeMegan Hoyt, SDOT

Date (xx/xx/xxxx)
Department NamePage Number
05/07/2019 Seattle Department of Transportation Page 2
Presentation Overview
2
• Project overview
• Progress to-date
• Cost estimate and funding opportunities
• Proposed next steps

Date (xx/xx/xxxx)
Department NamePage Number
05/07/2019 Seattle Department of Transportation Page 3
Project basics
3
• Limits: S Spokane St – S Michigan St
• Levy Funds: $5M
• Original expected project cost: $40M - $49M
• Original leverage assumptions: $20M Port of Seattle; $20M Federal Funds

Date (xx/xx/xxxx)
Department NamePage Number
05/07/2019 Seattle Department of Transportation Page 4
Project goals
Improve freight mobility and access
Promote efficiencies in freight movements
Enhance separation for people walking and biking

Date (xx/xx/xxxx)
Department NamePage Number
05/07/2019 Seattle Department of Transportation Page 5
Project limits
5
• North, South and Central Segments• 80% of cost is in North segment
• Pavement reconstruction• Separated bicycle facility• Sidewalk replacement• Drainage and landscaping• New and rebuilt traffic signals• Signal upgrades• ITS elements • Water main replacement (SPU)

Date (xx/xx/xxxx)
Department NamePage Number
05/07/2019 Seattle Department of Transportation Page 6
Heavy Haul Pavement Network
• Pavement between S Massachusetts St and S Spokane St will be upgraded to Heavy Haul standards
• Reconstructs roadway to provide 50-year life
• Redesigns intersections and adds adaptive signals to improve traffic flow
• Improves freight safety by separating people on bicycles
Date (xx/xx/xxxx)
Department NamePage Number
05/07/2019 Seattle Department of Transportation Page 7
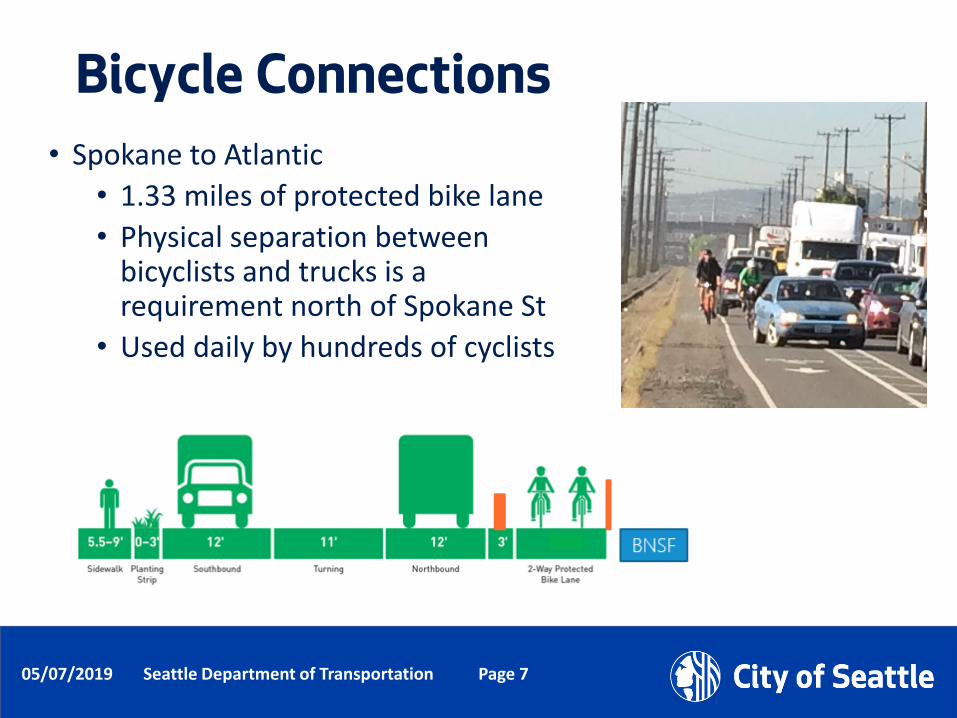
Bicycle Connections• Spokane to Atlantic
• 1.33 miles of protected bike lane
• Physical separation between bicyclists and trucks is a requirement north of Spokane St
• Used daily by hundreds of cyclists
Date (xx/xx/xxxx)
Department NamePage Number
05/07/2019 Seattle Department of Transportation Page 8
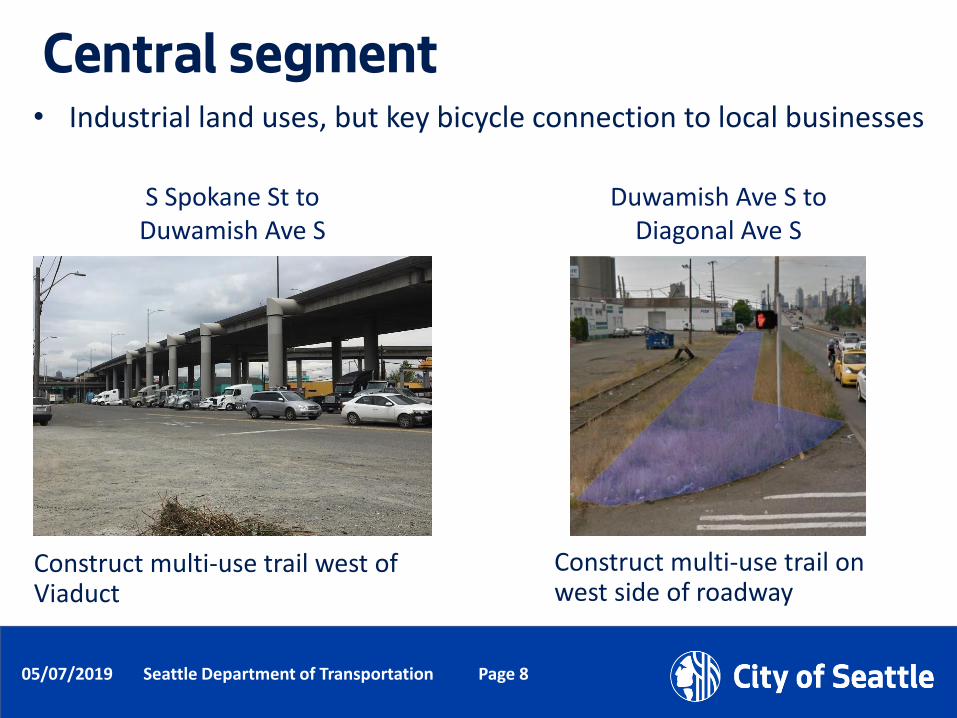
Central segment
S Spokane St to Duwamish Ave S
Duwamish Ave S to Diagonal Ave S
Construct multi-use trail west of Viaduct
Construct multi-use trail on west side of roadway
• Industrial land uses, but key bicycle connection to local businesses
Date (xx/xx/xxxx)
Department NamePage Number
05/07/2019 Seattle Department of Transportation Page 9
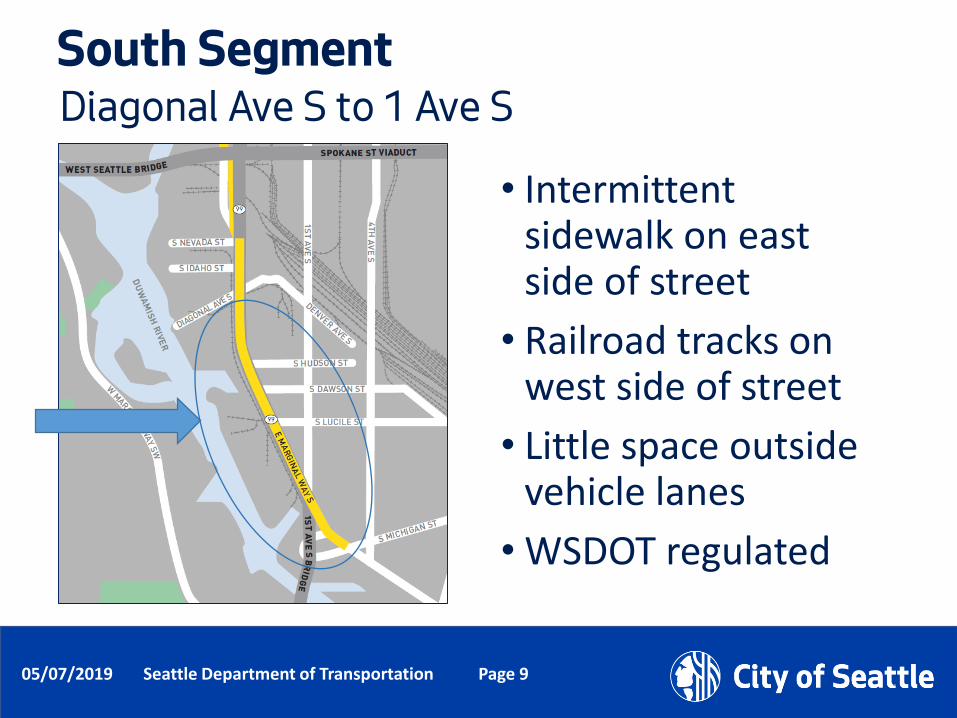
South Segment
9
Diagonal Ave S to 1 Ave S
• Intermittent sidewalk on east side of street
• Railroad tracks on west side of street
• Little space outside vehicle lanes
• WSDOT regulated
Date (xx/xx/xxxx)
Department NamePage Number
05/07/2019 Seattle Department of Transportation Page 10
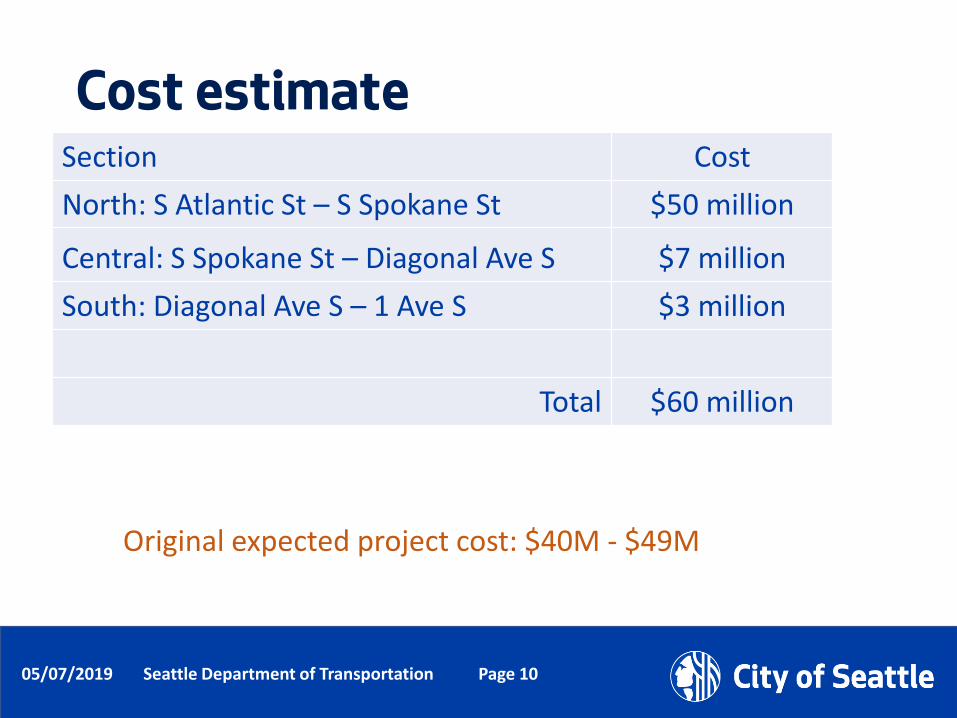
Cost estimateSection Cost
North: S Atlantic St – S Spokane St $50 million
Central: S Spokane St – Diagonal Ave S $7 million
South: Diagonal Ave S – 1 Ave S $3 million
Total $60 million
Original expected project cost: $40M - $49M
Date (xx/xx/xxxx)
Department NamePage Number
05/07/2019 Seattle Department of Transportation Page 11
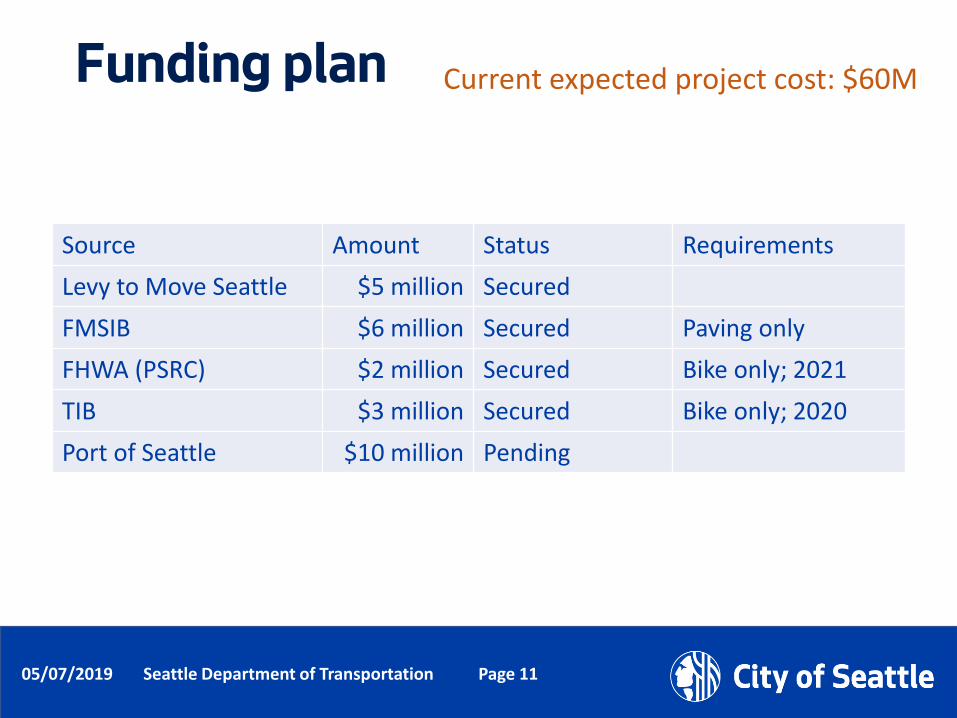
Funding plan
Source Amount Status Requirements
Levy to Move Seattle $5 million Secured
FMSIB $6 million Secured Paving only
FHWA (PSRC) $2 million Secured Bike only; 2021
TIB $3 million Secured Bike only; 2020
Port of Seattle $10 million Pending
Current expected project cost: $60M

Date (xx/xx/xxxx)
Department NamePage Number
05/07/2019 Seattle Department of Transportation Page 12
Proposed PhasingA phased approach utilizes current secured funding
Phase One - $10.5M• Bicycle facility between S Atlantic St and S
Spokane St• Rebuild signal and relocate railroad track at S
Hanford St• New signal at S Horton St
Phase Two • Roadway reconstruction to Heavy Haul
standards• Replace west sidewalk• Water main replacement (SPU)
Date (xx/xx/xxxx)
Department NamePage Number
05/07/2019 Seattle Department of Transportation Page 13
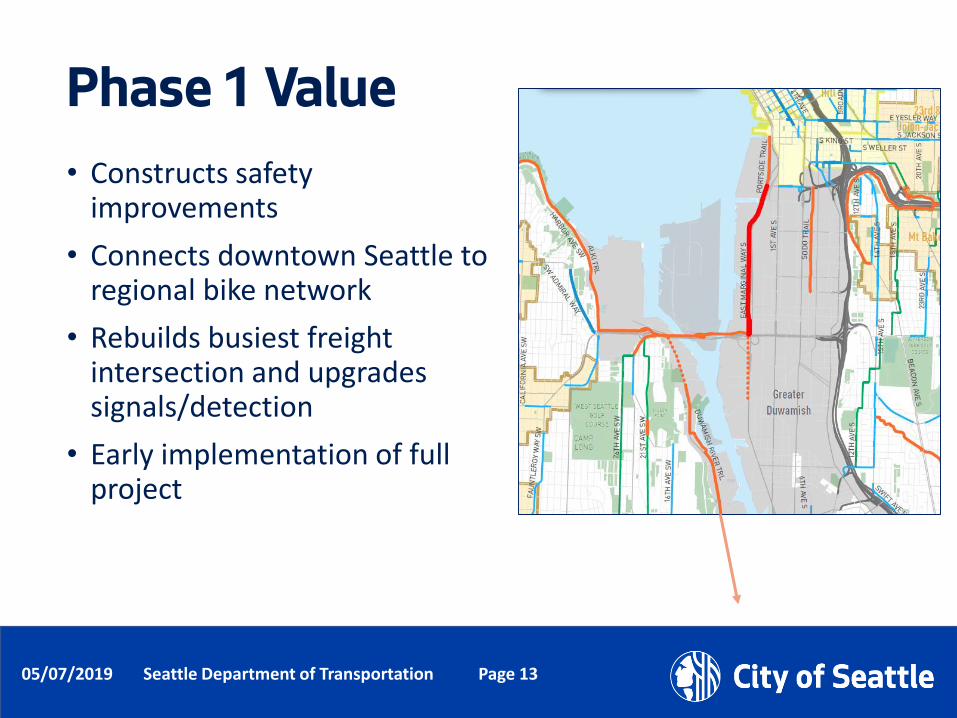
Phase 1 Value
• Constructs safety improvements
• Connects downtown Seattle to regional bike network
• Rebuilds busiest freight intersection and upgrades signals/detection
• Early implementation of full project

Date (xx/xx/xxxx)
Department NamePage Number
05/07/2019 Seattle Department of Transportation Page 14
Phase 1 Funding• Utilizes all remaining Levy funds
• Includes partnership with other Levy Programs:• $150K from Freight Spot Improvements (design)• $150K from Freight Spot Improvements (construction)• $300K combined from New Signals, Signal Major Maintenance and
Signal Spot Maintenance• Potential to include design funds from Bicycle Master Plan
implementation
• Allows SDOT to meet grant requirements
Future Funding• Will require regional support from State representatives, WSDOT,
and Port of Seattle
• Funding Plan and regional support is not confirmed; SDOT does not plan to apply for federal funds in 2019
Date (xx/xx/xxxx)
Department NamePage Number
05/07/2019 Seattle Department of Transportation Page 15
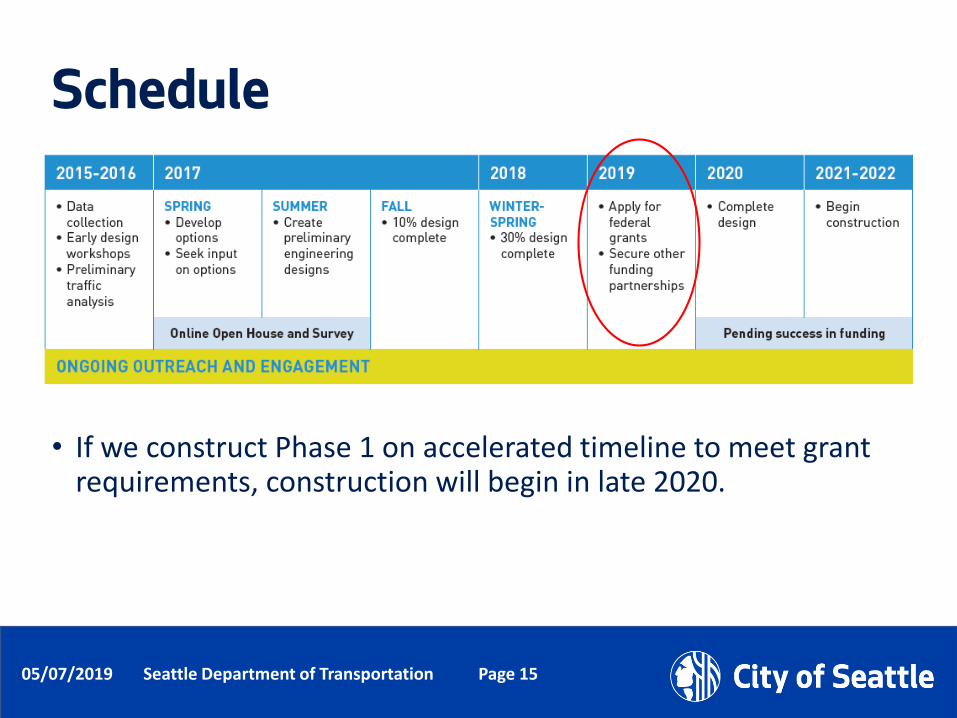
Schedule
• If we construct Phase 1 on accelerated timeline to meet grant requirements, construction will begin in late 2020.
Date (xx/xx/xxxx)
Department NamePage Number
05/07/2019 Seattle Department of Transportation Page 16
Next Steps
• Design and Construct Phase 1
• Apply for federal INFRA/BUILD funds once funding plan and regional support are secured
• When do you want future updates?• Specific design milestones?
• When there are updates on whether we can apply for Federal funds?
• When we’re successful in confirming a funding plan?
• Other?

Date (xx/xx/xxxx)
Department NamePage Number
05/07/2019 Seattle Department of Transportation Page 17
Questions?
Seattle Department of TransportationMegan Hoyt, E Marginal Way Project Manager
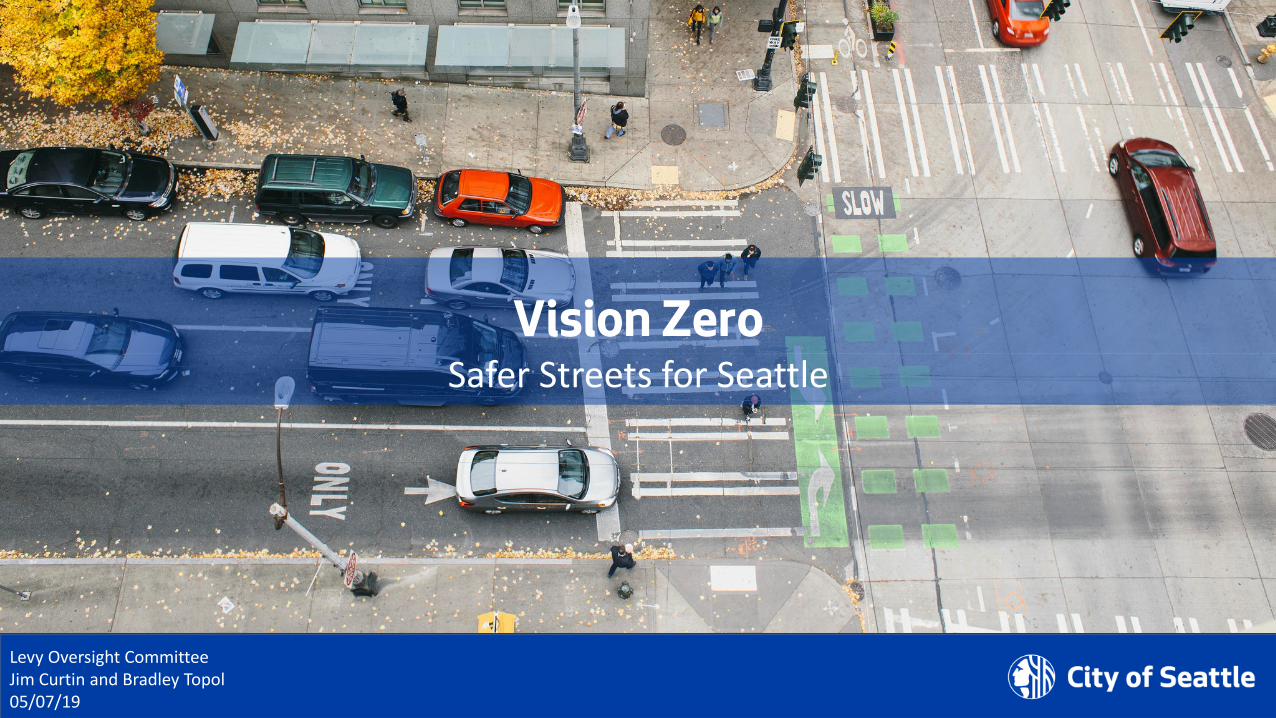
Department of TransportationLevy Oversight CommitteeJim Curtin and Bradley Topol 05/07/19
Vision Zero Safer Streets for Seattle

Department of Transportation
Our mission, vision, and core values
Committed to 5 core values to create a city that is:• Safe• Interconnected• Affordable• Vibrant• Innovative
For all
Mission: deliver a high-quality transportation system for Seattle
Vision: connected people, places, and products

Department of Transportation
Presentation overview•Background•Data and trends •Priority projects•New initiatives •Next steps•Questions

Department of Transportation
Background1997: Vision Zero starts in Sweden
2000: WA State Target Zero
2012: Seattle Road Safety Action Plan
2015: Seattle launches Vision Zero
2016: Codified through Comp Plan update
2016: Lower citywide speed limits
2017: Bicycle and Pedestrian Safety Analysis
2018: BPSA assessment Complete Streets Checklist
Department of Transportation
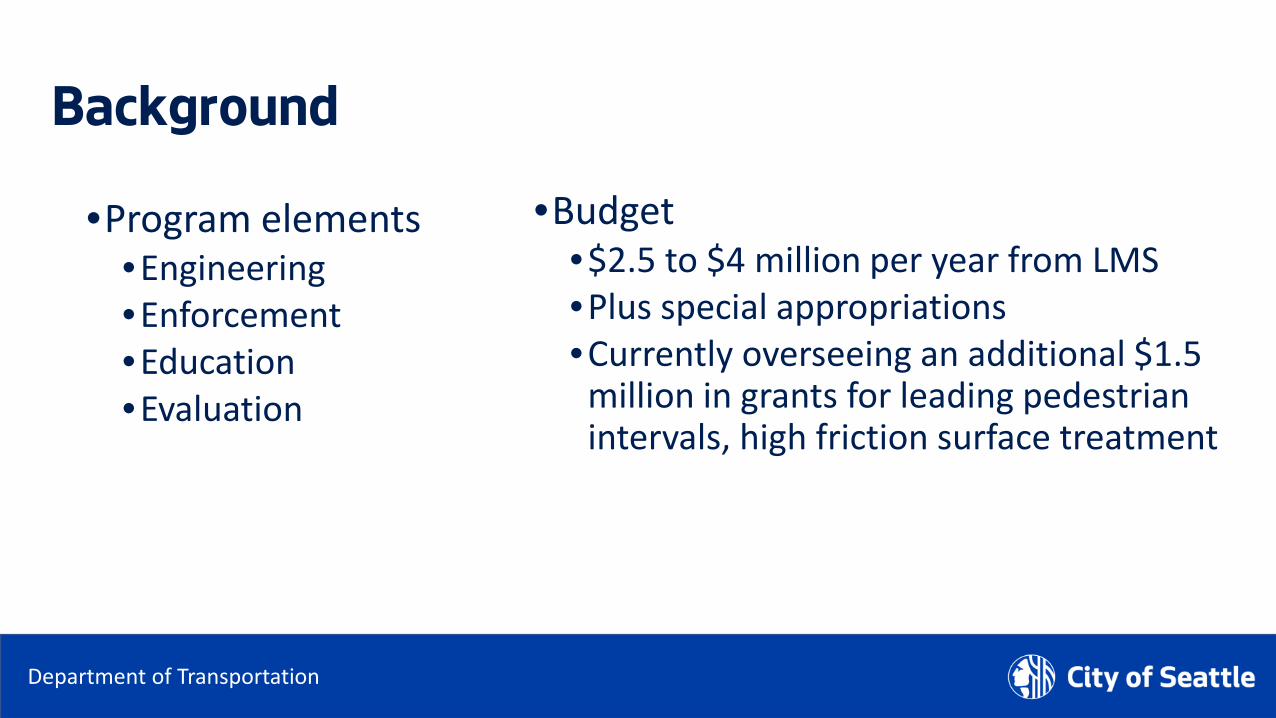
Background
•Program elements•Engineering•Enforcement•Education•Evaluation
•Budget•$2.5 to $4 million per year from LMS•Plus special appropriations•Currently overseeing an additional $1.5
million in grants for leading pedestrian intervals, high friction surface treatment
Department of Transportation
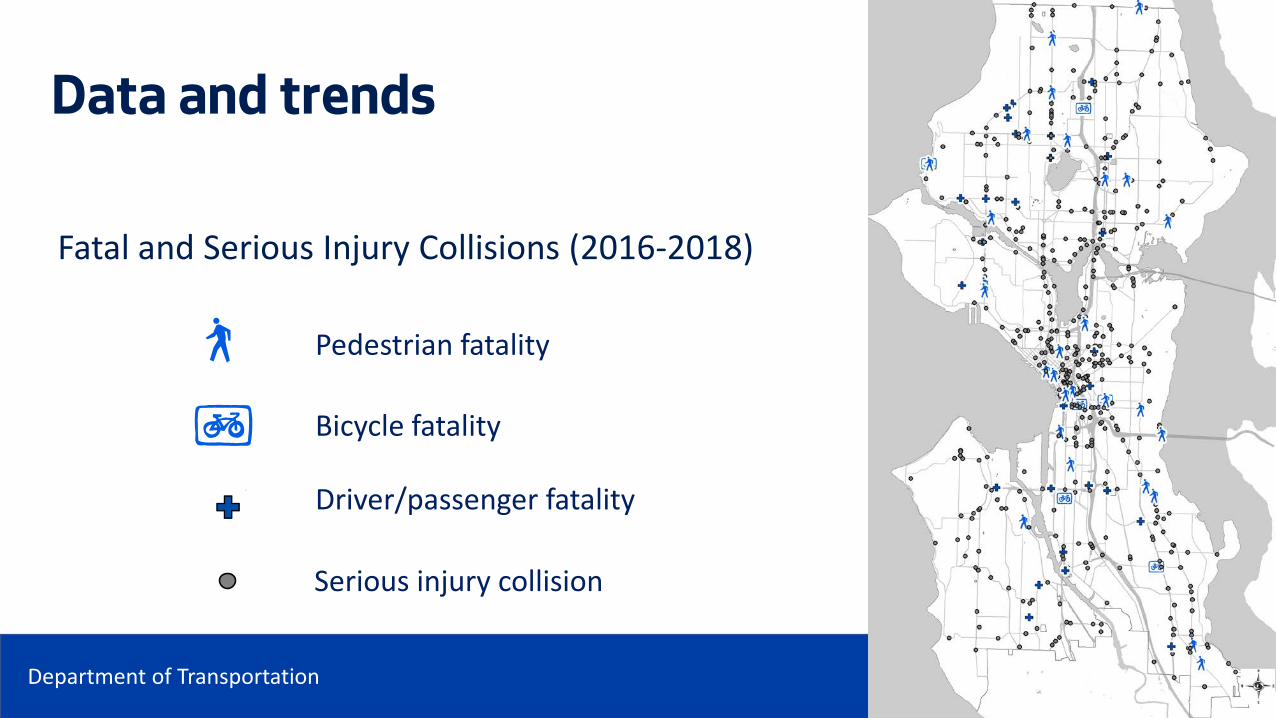
Data and trends
Fatal and Serious Injury Collisions (2016-2018)
Pedestrian fatality
Bicycle fatality
Driver/passenger fatality
Serious injury collision
GF
¡©
m

Department of Transportation
Data and trends
*2018 data is preliminary and may change
• Despite massive growth, Seattle continues to be on the right track
• Seattle amongst safest cities in US
Department of Transportation
Data and trends
0
5
10
15
20
25
30
35
40
45
2006
2007
2008
2009
2010
2011
2012
2013
2014
2015
2016
2017
2018
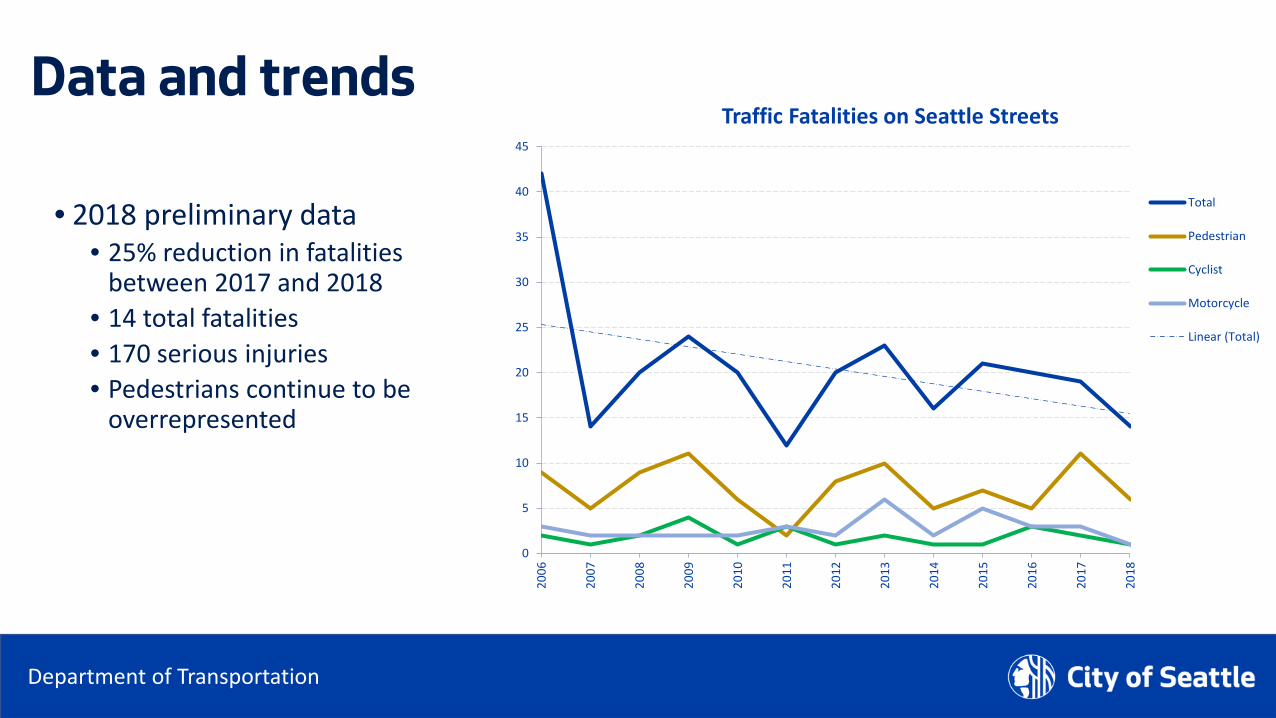
Traffic Fatalities on Seattle Streets
Total
Pedestrian
Cyclist
Motorcycle
Linear (Total)
• 2018 preliminary data • 25% reduction in fatalities
between 2017 and 2018• 14 total fatalities • 170 serious injuries • Pedestrians continue to be
overrepresented
Department of Transportation
Data and trends

Department of Transportation
Equity
• Focus investments on highest need areas• Enforcement RET in progress in
partnership with SPD • Tracking the neighborhoods,
communities, and people adversely affected by collisions
• Reaching historically underrepresented communities with safety resources
Rainier Corridor RET

Department of Transportation
Safety corridors• Large projects
• Multi-million dollar investments • Significant changes to street design • Examples: NE 65th St, Rainier Ave S
• Traditional projects • May include channelization changes,
new signals or signal adjustments, crossing modifications, curb ramps, speed limit changes, turn restrictions
• Examples: Greenwood-Phinney, 5th Ave NE, North Beacon
Banner Way NE
Department of Transportation
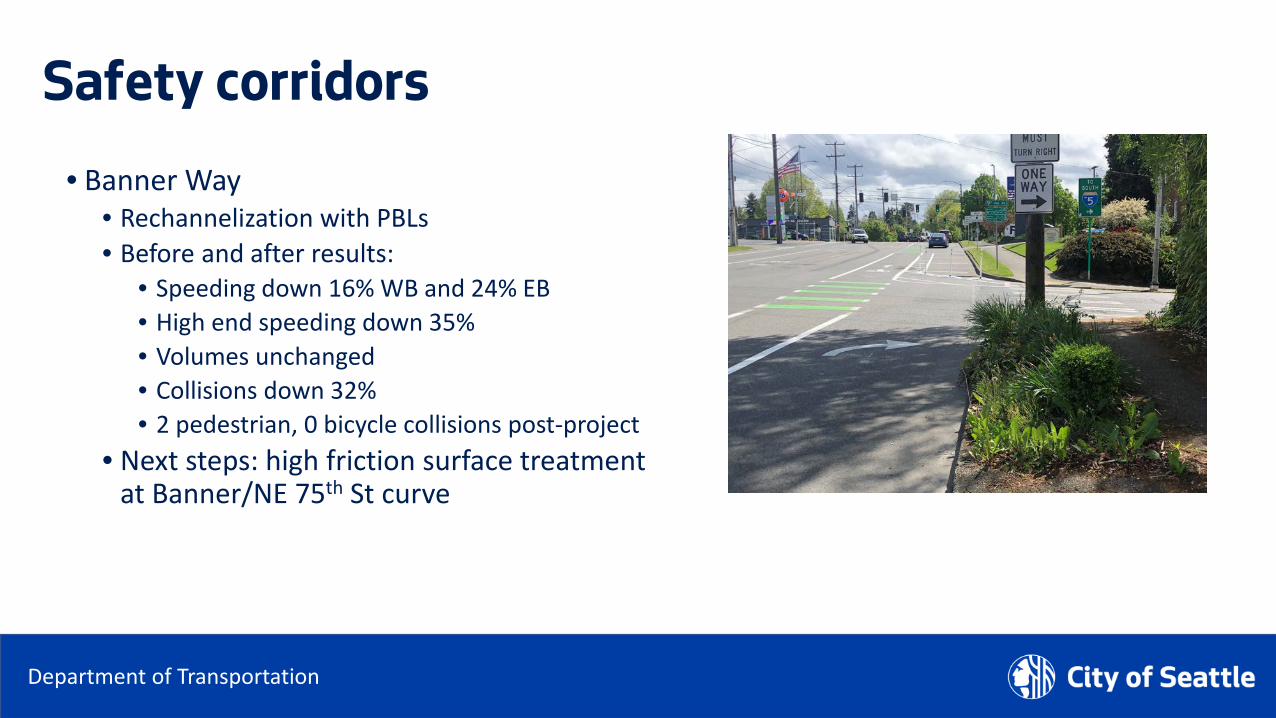
Safety corridors• Banner Way
• Rechannelization with PBLs • Before and after results:
• Speeding down 16% WB and 24% EB• High end speeding down 35%• Volumes unchanged • Collisions down 32%• 2 pedestrian, 0 bicycle collisions post-project
• Next steps: high friction surface treatment at Banner/NE 75th St curve
Banner Way NE
Department of Transportation
Speed limits
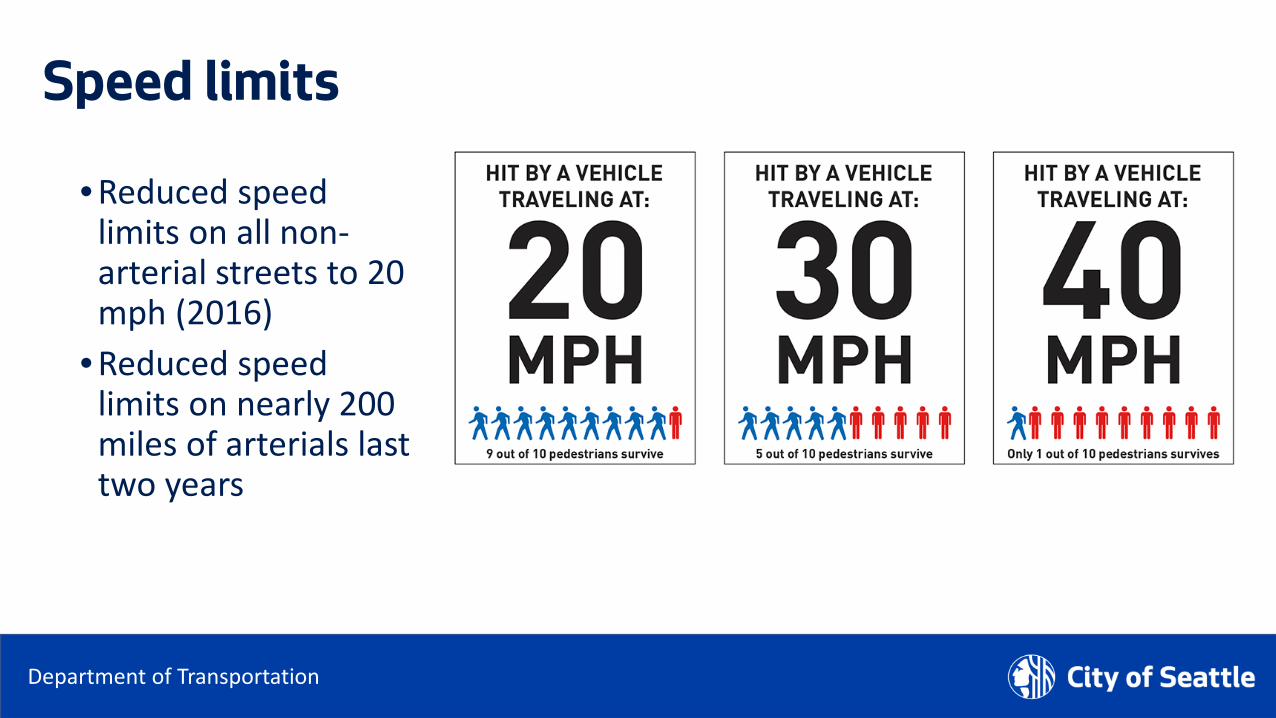
• Reduced speed limits on all non-arterial streets to 20 mph (2016)
• Reduced speed limits on nearly 200 miles of arterials last two years

Department of Transportation
Speed limits
• Downtown• Speed limit reduced in November 2016 • 6% decrease in serious crashes• 9% decrease in total crashes

Department of Transportation
Speed limits
• Focus on urban villages where 80% of pedestrian collisions occur
• Early results promising: • Speeds have decreased • 50th percentile speeds averaging 25 mph• Greenwood/Phinney UV
• Crashes down 43% of Greenwood• Total crashes down 51% on NE 85th St • Injury, serious injury, and fatal crashes down 36%
Speed limit adjustmentcomplete
2019-2020
2020-2021
Future corridors
2019-2020
2020-2021
ArterialsSpeed limit adjustmentcomplete
Urban Villages
Speed LimitEvaluation Workplan
AURO
RA A
VE N
NE 65TH ST
24TH
AVE
E
RAIN
IER
AVE
S
DELR
IDG
E W
AY S
W
1stAV
E S 4th
AVE
S
GRE
ENW
OO
D AV
E N
35TH
AVE
SW
SW ROXBURY ST
Department of Transportation
Traffic signals
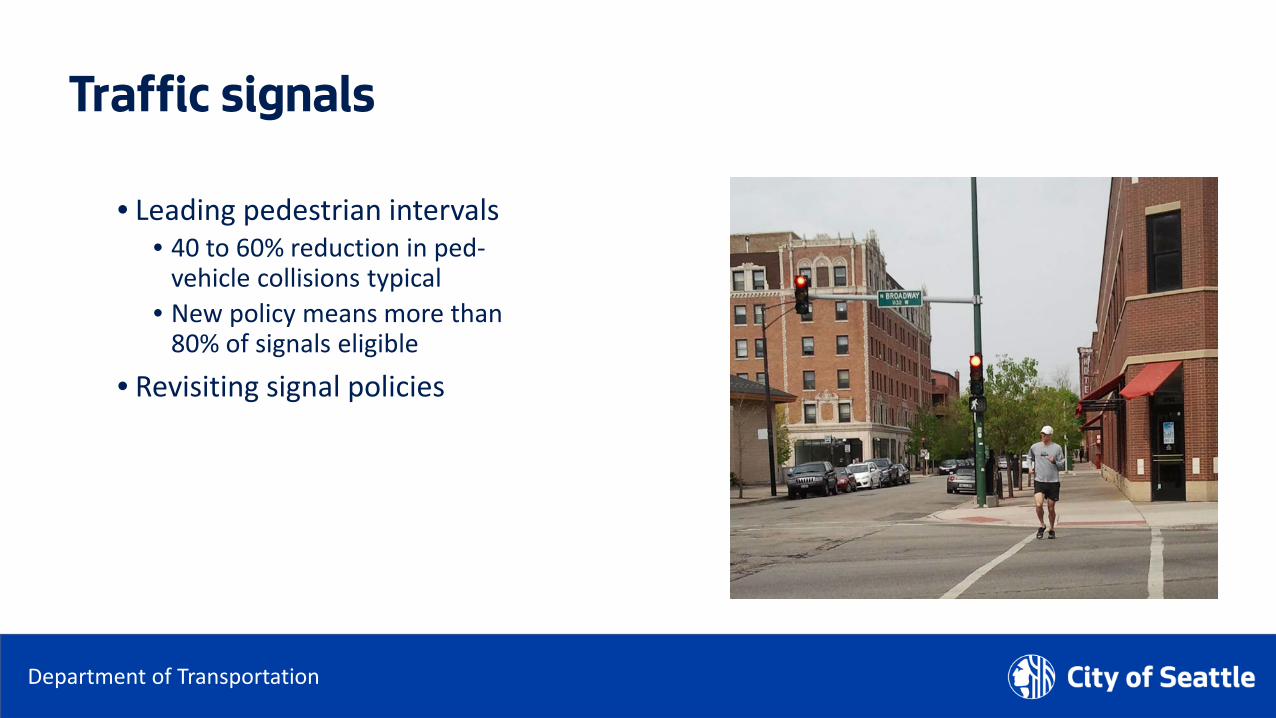
• Leading pedestrian intervals • 40 to 60% reduction in ped-
vehicle collisions typical • New policy means more than
80% of signals eligible
• Revisiting signal policies
Department of Transportation
New initiatives
17
• Bicycle and Pedestrian Safety Analysis Phase 2• Seattle’s Safest Driver 2.0• New online dashboard• Pedestrian safety emphasis patrols
Department of Transportation
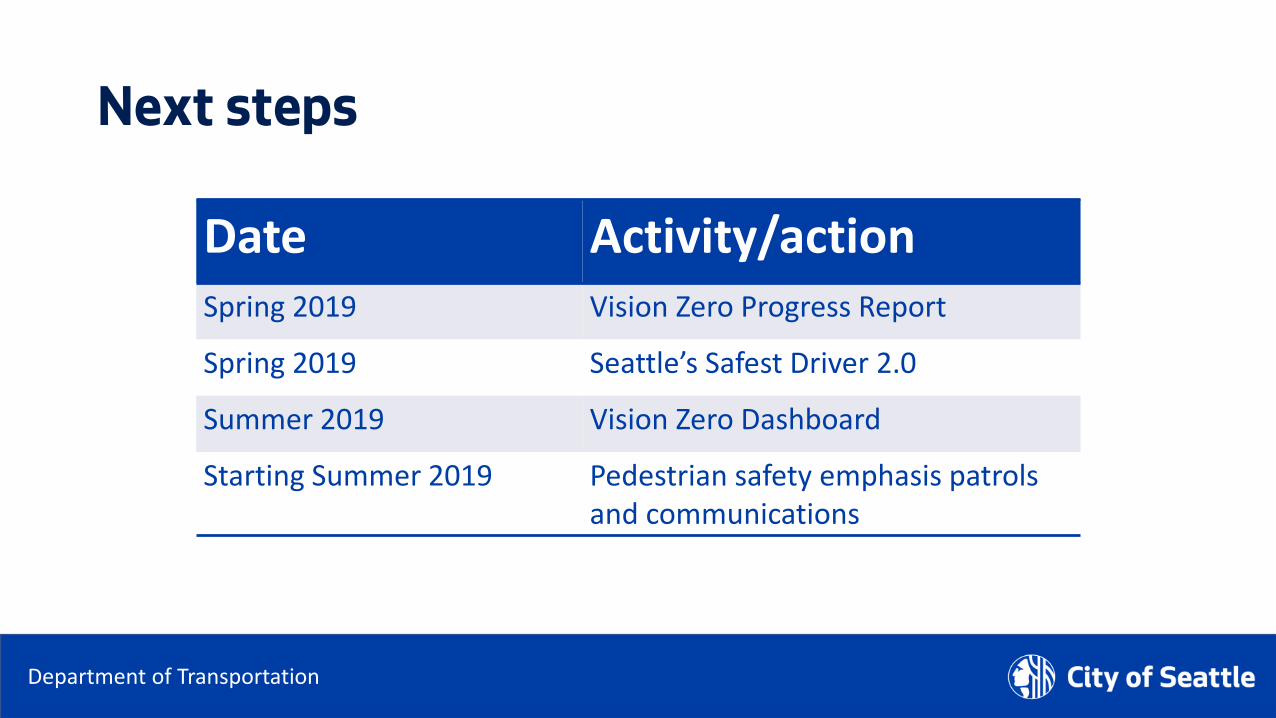
Next steps
Date Activity/actionSpring 2019 Vision Zero Progress Report
Spring 2019 Seattle’s Safest Driver 2.0
Summer 2019 Vision Zero Dashboard
Starting Summer 2019 Pedestrian safety emphasis patrols and communications

Department of Transportation
Questions?
[email protected] | (206) [email protected] | (206) 263-3855
www.seattle.gov/visionzero