2019 president's budget - usda · rural cooperatives magazine, the internet, and participation...
TRANSCRIPT
2019 President's Budget Rural Business-Cooperative Service
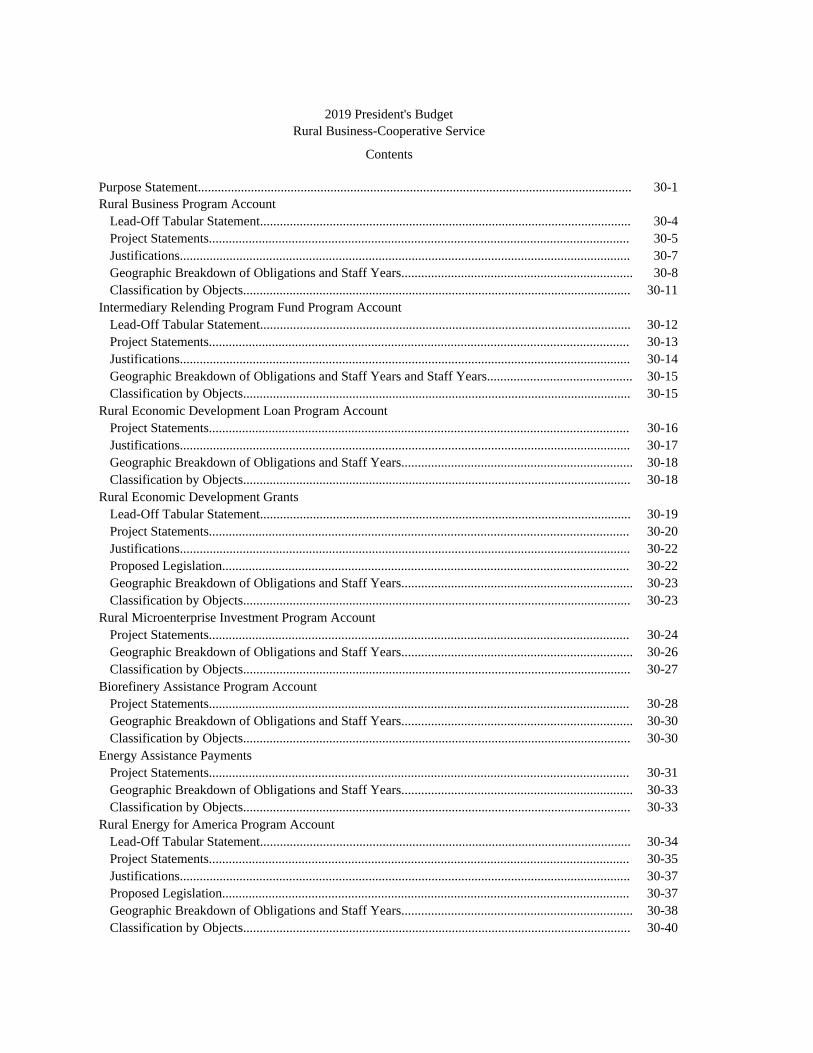
Contents
Purpose Statement................................................................................................................................... 30-1 Rural Business Program Account
Intermediary Relending Program Fund Program Account
Rural Economic Development Loan Program Account
Rural Economic Development Grants
Rural Microenterprise Investment Program Account
Biorefinery Assistance Program Account
Energy Assistance Payments
Rural Energy for America Program Account
Lead-Off Tabular Statement................................................................................................................ 30-4 Project Statements............................................................................................................................... 30-5 Justifications........................................................................................................................................ 30-7 Geographic Breakdown of Obligations and Staff Years...................................................................... 30-8 Classification by Objects..................................................................................................................... 30-11
Lead-Off Tabular Statement................................................................................................................ 30-12 Project Statements............................................................................................................................... 30-13 Justifications........................................................................................................................................ 30-14 Geographic Breakdown of Obligations and Staff Years and Staff Years............................................ 30-15 Classification by Objects..................................................................................................................... 30-15
Project Statements............................................................................................................................... 30-16 Justifications........................................................................................................................................ 30-17 Geographic Breakdown of Obligations and Staff Years...................................................................... 30-18 Classification by Objects..................................................................................................................... 30-18
Lead-Off Tabular Statement................................................................................................................ 30-19 Project Statements............................................................................................................................... 30-20 Justifications........................................................................................................................................ 30-22 Proposed Legislation........................................................................................................................... 30-22 Geographic Breakdown of Obligations and Staff Years...................................................................... 30-23 Classification by Objects..................................................................................................................... 30-23
Project Statements............................................................................................................................... 30-24 Geographic Breakdown of Obligations and Staff Years...................................................................... 30-26 Classification by Objects..................................................................................................................... 30-27
Project Statements............................................................................................................................... 30-28 Geographic Breakdown of Obligations and Staff Years...................................................................... 30-30 Classification by Objects..................................................................................................................... 30-30
Project Statements............................................................................................................................... 30-31 Geographic Breakdown of Obligations and Staff Years...................................................................... 30-33 Classification by Objects..................................................................................................................... 30-33
Lead-Off Tabular Statement................................................................................................................ 30-34 Project Statements............................................................................................................................... 30-35 Justifications........................................................................................................................................ 30-37 Proposed Legislation........................................................................................................................... 30-37 Geographic Breakdown of Obligations and Staff Years...................................................................... 30-38 Classification by Objects..................................................................................................................... 30-40

Rural Cooperative Development Grants Lead-Off Tabular Statement................................................................................................................ 30-41
Empowerment Zones and Enterprise Communities Grants
Healthy Foods Financing Initiative
Summary of Budget and Performance
Project Statements............................................................................................................................... 30-42 Justifications........................................................................................................................................ 30-44 Geographic Breakdown of Obligations and Staff Years...................................................................... 30-45 Classification by Objects..................................................................................................................... 30-49
Project Statements............................................................................................................................... 30-50
Lead-Off Tabular Statement................................................................................................................ 30-51 Project Statements............................................................................................................................... 30-52 Justifications........................................................................................................................................ 30-53 Geographic Breakdown of Obligations and Staff Years...................................................................... 30-53 Classification by Objects..................................................................................................................... 30-53
Status of Programs.................................................................................................................................. 30-54
Summary of Budget and Performance................................................................................................. 30-59
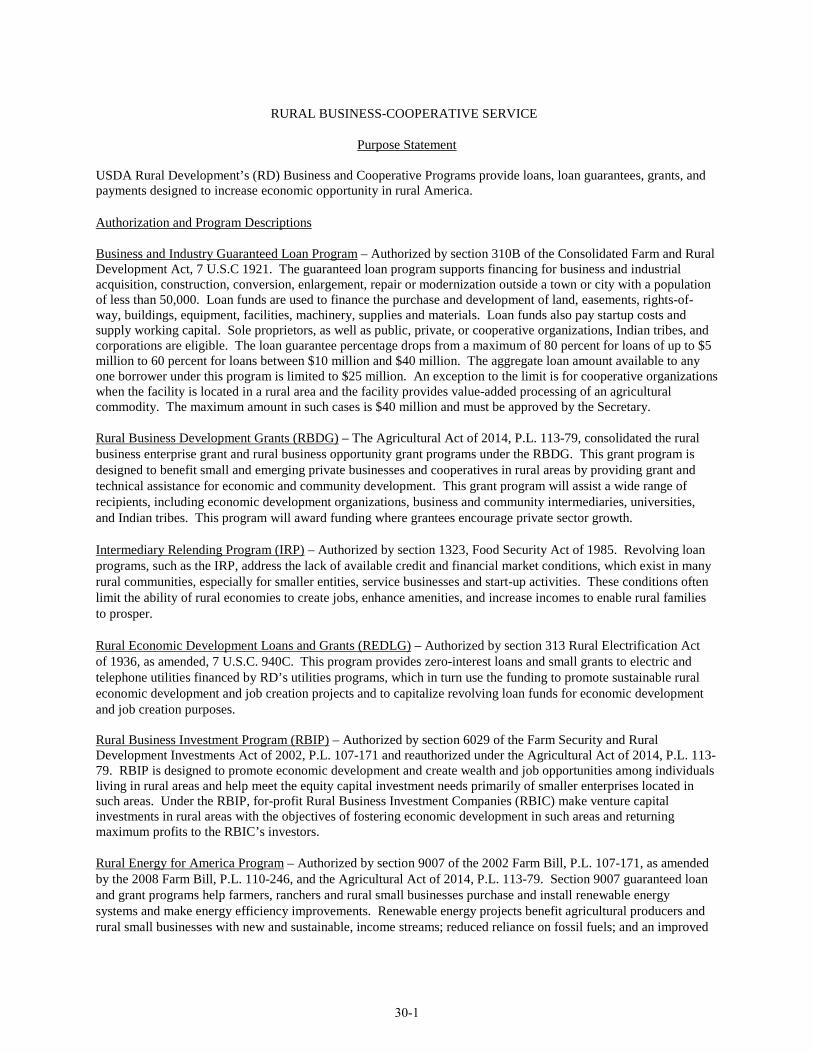
RURAL BUSINESS-COOPERATIVE SERVICE
Purpose Statement
USDA Rural Development’s (RD) Business and Cooperative Programs provide loans, loan guarantees, grants, and payments designed to increase economic opportunity in rural America.
Authorization and Program Descriptions
Business and Industry Guaranteed Loan Program – Authorized by section 310B of the Consolidated Farm and Rural Development Act, 7 U.S.C 1921. The guaranteed loan program supports financing for business and industrial acquisition, construction, conversion, enlargement, repair or modernization outside a town or city with a population of less than 50,000. Loan funds are used to finance the purchase and development of land, easements, rights-of-way, buildings, equipment, facilities, machinery, supplies and materials. Loan funds also pay startup costs and supply working capital. Sole proprietors, as well as public, private, or cooperative organizations, Indian tribes, and corporations are eligible. The loan guarantee percentage drops from a maximum of 80 percent for loans of up to $5 million to 60 percent for loans between $10 million and $40 million. The aggregate loan amount available to any one borrower under this program is limited to $25 million. An exception to the limit is for cooperative organizations when the facility is located in a rural area and the facility provides value-added processing of an agricultural commodity. The maximum amount in such cases is $40 million and must be approved by the Secretary.
Rural Business Development Grants (RBDG) – The Agricultural Act of 2014, P.L. 113-79, consolidated the rural business enterprise grant and rural business opportunity grant programs under the RBDG. This grant program is designed to benefit small and emerging private businesses and cooperatives in rural areas by providing grant and technical assistance for economic and community development. This grant program will assist a wide range of recipients, including economic development organizations, business and community intermediaries, universities, and Indian tribes. This program will award funding where grantees encourage private sector growth.
Intermediary Relending Program (IRP) – Authorized by section 1323, Food Security Act of 1985. Revolving loan programs, such as the IRP, address the lack of available credit and financial market conditions, which exist in many rural communities, especially for smaller entities, service businesses and start-up activities. These conditions often limit the ability of rural economies to create jobs, enhance amenities, and increase incomes to enable rural families to prosper.
Rural Economic Development Loans and Grants (REDLG) – Authorized by section 313 Rural Electrification Act of 1936, as amended, 7 U.S.C. 940C. This program provides zero-interest loans and small grants to electric and telephone utilities financed by RD’s utilities programs, which in turn use the funding to promote sustainable rural economic development and job creation projects and to capitalize revolving loan funds for economic development and job creation purposes.
Rural Business Investment Program (RBIP) – Authorized by section 6029 of the Farm Security and Rural Development Investments Act of 2002, P.L. 107-171 and reauthorized under the Agricultural Act of 2014, P.L. 113-79. RBIP is designed to promote economic development and create wealth and job opportunities among individuals living in rural areas and help meet the equity capital investment needs primarily of smaller enterprises located in such areas. Under the RBIP, for-profit Rural Business Investment Companies (RBIC) make venture capital investments in rural areas with the objectives of fostering economic development in such areas and returning maximum profits to the RBIC’s investors.
Rural Energy for America Program – Authorized by section 9007 of the 2002 Farm Bill, P.L. 107-171, as amended by the 2008 Farm Bill, P.L. 110-246, and the Agricultural Act of 2014, P.L. 113-79. Section 9007 guaranteed loan and grant programs help farmers, ranchers and rural small businesses purchase and install renewable energy systems and make energy efficiency improvements. Renewable energy projects benefit agricultural producers and rural small businesses with new and sustainable, income streams; reduced reliance on fossil fuels; and an improved
30-1
environment. Energy efficiency projects also reduce the cost of production and business operations. Grants may also be used for energy audits.
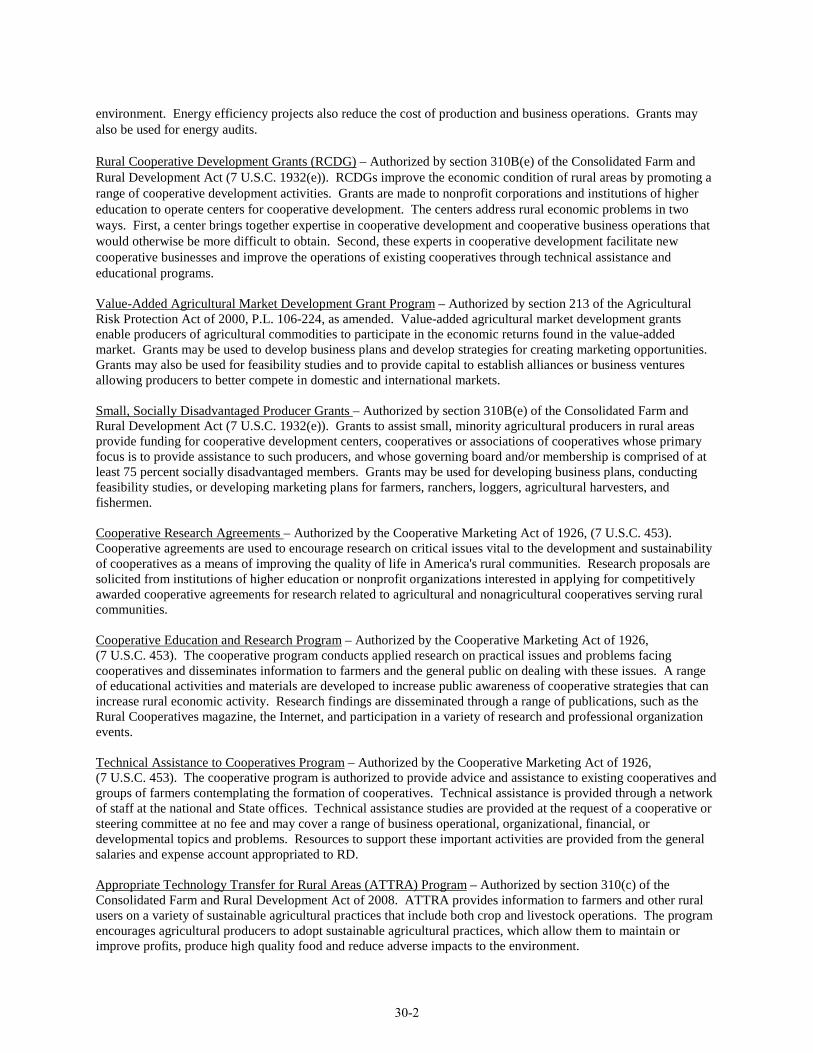
Rural Cooperative Development Grants (RCDG) – Authorized by section 310B(e) of the Consolidated Farm and Rural Development Act (7 U.S.C. 1932(e)). RCDGs improve the economic condition of rural areas by promoting a range of cooperative development activities. Grants are made to nonprofit corporations and institutions of higher education to operate centers for cooperative development. The centers address rural economic problems in two ways. First, a center brings together expertise in cooperative development and cooperative business operations that would otherwise be more difficult to obtain. Second, these experts in cooperative development facilitate new cooperative businesses and improve the operations of existing cooperatives through technical assistance and educational programs.
Value-Added Agricultural Market Development Grant Program – Authorized by section 213 of the Agricultural Risk Protection Act of 2000, P.L. 106-224, as amended. Value-added agricultural market development grants enable producers of agricultural commodities to participate in the economic returns found in the value-added market. Grants may be used to develop business plans and develop strategies for creating marketing opportunities. Grants may also be used for feasibility studies and to provide capital to establish alliances or business ventures allowing producers to better compete in domestic and international markets.
Small, Socially Disadvantaged Producer Grants – Authorized by section 310B(e) of the Consolidated Farm and Rural Development Act (7 U.S.C. 1932(e)). Grants to assist small, minority agricultural producers in rural areas provide funding for cooperative development centers, cooperatives or associations of cooperatives whose primary focus is to provide assistance to such producers, and whose governing board and/or membership is comprised of at least 75 percent socially disadvantaged members. Grants may be used for developing business plans, conducting feasibility studies, or developing marketing plans for farmers, ranchers, loggers, agricultural harvesters, and fishermen.
Cooperative Research Agreements – Authorized by the Cooperative Marketing Act of 1926, (7 U.S.C. 453). Cooperative agreements are used to encourage research on critical issues vital to the development and sustainability of cooperatives as a means of improving the quality of life in America's rural communities. Research proposals are solicited from institutions of higher education or nonprofit organizations interested in applying for competitively awarded cooperative agreements for research related to agricultural and nonagricultural cooperatives serving rural communities.
Cooperative Education and Research Program – Authorized by the Cooperative Marketing Act of 1926, (7 U.S.C. 453). The cooperative program conducts applied research on practical issues and problems facing cooperatives and disseminates information to farmers and the general public on dealing with these issues. A range of educational activities and materials are developed to increase public awareness of cooperative strategies that can increase rural economic activity. Research findings are disseminated through a range of publications, such as the Rural Cooperatives magazine, the Internet, and participation in a variety of research and professional organization events.
Technical Assistance to Cooperatives Program – Authorized by the Cooperative Marketing Act of 1926, (7 U.S.C. 453). The cooperative program is authorized to provide advice and assistance to existing cooperatives and groups of farmers contemplating the formation of cooperatives. Technical assistance is provided through a network of staff at the national and State offices. Technical assistance studies are provided at the request of a cooperative or steering committee at no fee and may cover a range of business operational, organizational, financial, or developmental topics and problems. Resources to support these important activities are provided from the general salaries and expense account appropriated to RD.
Appropriate Technology Transfer for Rural Areas (ATTRA) Program – Authorized by section 310(c) of the Consolidated Farm and Rural Development Act of 2008. ATTRA provides information to farmers and other rural users on a variety of sustainable agricultural practices that include both crop and livestock operations. The program encourages agricultural producers to adopt sustainable agricultural practices, which allow them to maintain or improve profits, produce high quality food and reduce adverse impacts to the environment.
30-2
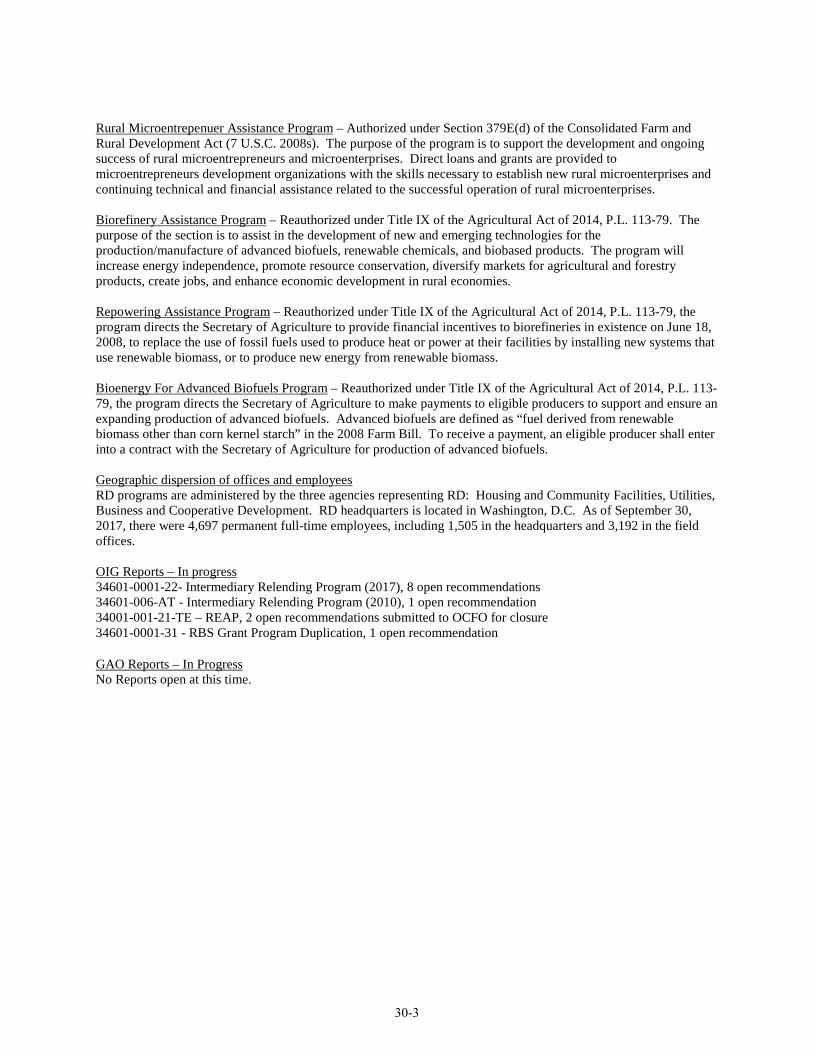
Rural Microentrepenuer Assistance Program – Authorized under Section 379E(d) of the Consolidated Farm and Rural Development Act (7 U.S.C. 2008s). The purpose of the program is to support the development and ongoing success of rural microentrepreneurs and microenterprises. Direct loans and grants are provided to microentrepreneurs development organizations with the skills necessary to establish new rural microenterprises and continuing technical and financial assistance related to the successful operation of rural microenterprises.
Biorefinery Assistance Program – Reauthorized under Title IX of the Agricultural Act of 2014, P.L. 113-79. The purpose of the section is to assist in the development of new and emerging technologies for the production/manufacture of advanced biofuels, renewable chemicals, and biobased products. The program will increase energy independence, promote resource conservation, diversify markets for agricultural and forestry products, create jobs, and enhance economic development in rural economies.
Repowering Assistance Program – Reauthorized under Title IX of the Agricultural Act of 2014, P.L. 113-79, the program directs the Secretary of Agriculture to provide financial incentives to biorefineries in existence on June 18, 2008, to replace the use of fossil fuels used to produce heat or power at their facilities by installing new systems that use renewable biomass, or to produce new energy from renewable biomass.
Bioenergy For Advanced Biofuels Program – Reauthorized under Title IX of the Agricultural Act of 2014, P.L. 113-79, the program directs the Secretary of Agriculture to make payments to eligible producers to support and ensure an expanding production of advanced biofuels. Advanced biofuels are defined as “fuel derived from renewable biomass other than corn kernel starch” in the 2008 Farm Bill. To receive a payment, an eligible producer shall enter into a contract with the Secretary of Agriculture for production of advanced biofuels.
Geographic dispersion of offices and employees RD programs are administered by the three agencies representing RD: Housing and Community Facilities, Utilities, Business and Cooperative Development. RD headquarters is located in Washington, D.C. As of September 30, 2017, there were 4,697 permanent full-time employees, including 1,505 in the headquarters and 3,192 in the field offices.
OIG Reports – In progress 34601-0001-22- Intermediary Relending Program (2017), 8 open recommendations 34601-006-AT - Intermediary Relending Program (2010), 1 open recommendation 34001-001-21-TE – REAP, 2 open recommendations submitted to OCFO for closure 34601-0001-31 - RBS Grant Program Duplication, 1 open recommendation
GAO Reports – In Progress No Reports open at this time.
30-3
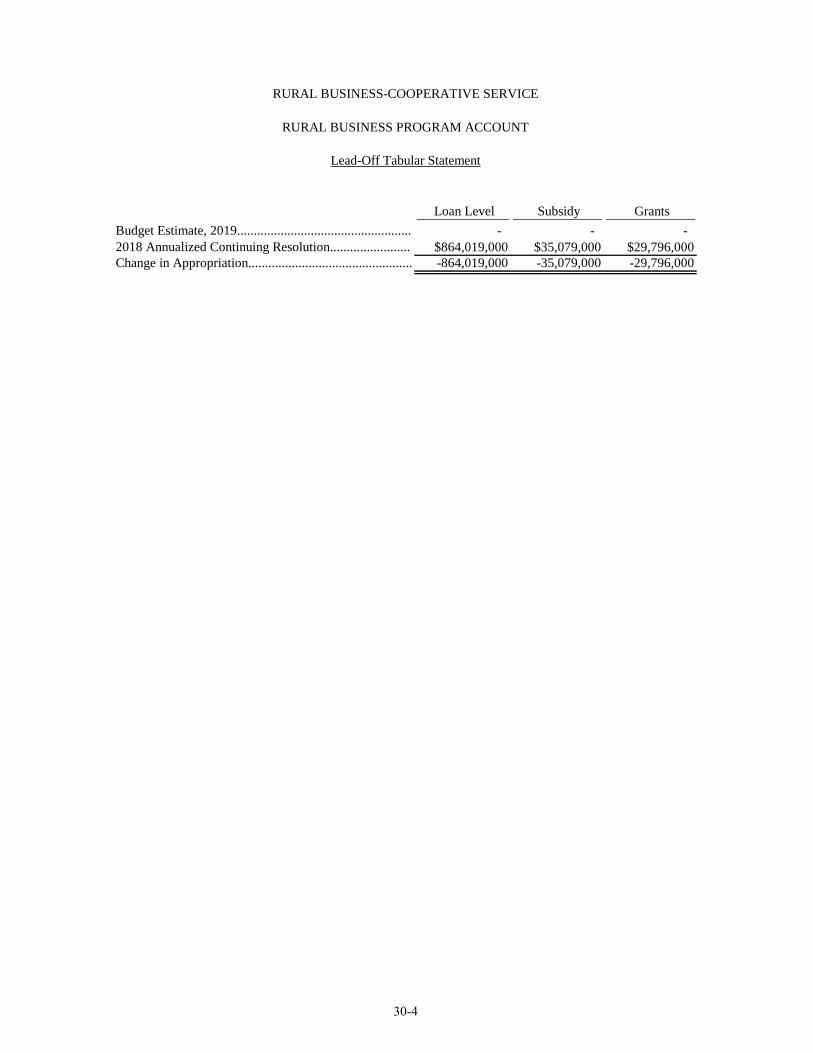
RURAL BUSINESS-COOPERATIVE SERVICE
RURAL BUSINESS PROGRAM ACCOUNT
Lead-Off Tabular Statement
2018 Annualized Continuing Resolution........................ Change in Appropriation.................................................
Budget Estimate, 2019.................................................... Loan Level
-$864,019,000 -864,019,000
Subsidy -
$35,079,000 -35,079,000
Grants -
$29,796,000 -29,796,000
30-4
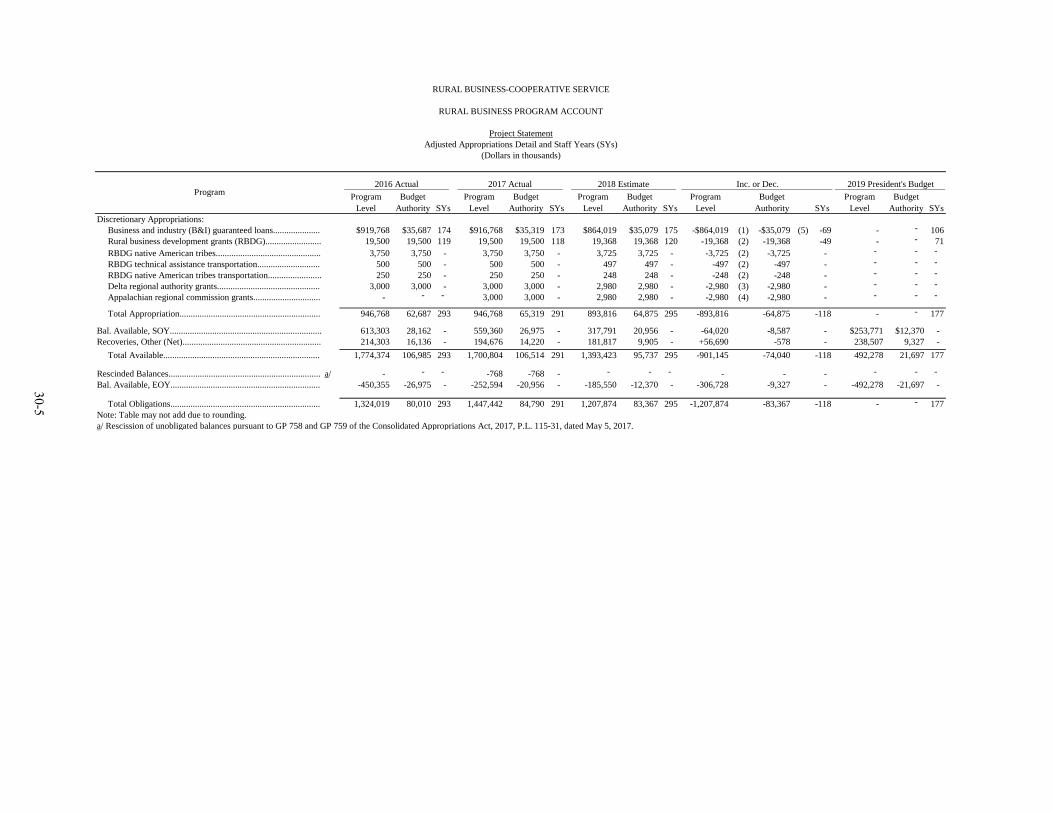
RURAL BUSINESS-COOPERATIVE SERVICE
RURAL BUSINESS PROGRAM ACCOUNT
Project Statement Adjusted Appropriations Detail and Staff Years (SYs)
(Dollars in thousands)
2016 Actual 2017 Actual 2018 Estimate Inc. or Dec. 2019 President's Budget Program Program Budget Program Budget Program Budget Program Budget Program Budget
Level Authority SYs Level Authority SYs Level Authority SYs Level Authority SYs Level Authority SYs Discretionary Appropriations: Business and industry (B&I) guaranteed loans..................... $919,768 $35,687 174 $916,768 $35,319 173 $864,019 $35,079 175 -$864,019 (1) -$35,079 (5) -69 - - 106 Rural business development grants (RBDG)......................... 19,500 19,500 119 19,500 19,500 118 19,368 19,368 120 -19,368 (2) -19,368 -49 - - 71 RBDG native American tribes............................................... 3,750 3,750 - 3,750 3,750 - 3,725 3,725 - -3,725 (2) -3,725 - - - -RBDG technical assistance transportation............................ 500 500 - 500 500 - 497 497 - -497 (2) -497 - - - -RBDG native American tribes transportation........................ 250 250 - 250 250 - 248 248 - -248 (2) -248 - - - -Delta regional authority grants.............................................. 3,000 3,000 - 3,000 3,000 - 2,980 2,980 - -2,980 (3) -2,980 - - - -Appalachian regional commission grants.............................. - - - 3,000 3,000 - 2,980 2,980 - -2,980 (4) -2,980 - - - -
Total Appropriation............................................................... 946,768 62,687 293 946,768 65,319 291 893,816 64,875 295 -893,816 -64,875 -118 - - 177
Bal. Available, SOY.................................................................... 613,303 28,162 - 559,360 26,975 - 317,791 20,956 - -64,020 -8,587 - $253,771 $12,370 -Recoveries, Other (Net).............................................................. 214,303 16,136 - 194,676 14,220 - 181,817 9,905 - +56,690 -578 - 238,507 9,327 -Total Available...................................................................... 1,774,374 106,985 293 1,700,804 106,514 291 1,393,423 95,737 295 -901,145 -74,040 -118 492,278 21,697 177
Rescinded Balances.................................................................... a/ - - - -768 -768 - - - - - - - - - -Bal. Available, EOY................................................................... -450,355 -26,975 - -252,594 -20,956 - -185,550 -12,370 - -306,728 -9,327 - -492,278 -21,697 -30-5 Total Obligations................................................................... 1,324,019 80,010 293 1,447,442 84,790 291 1,207,874 83,367 295 -1,207,874 -83,367 -118 - - 177 Note: Table may not add due to rounding. a/ Rescission of unobligated balances pursuant to GP 758 and GP 759 of the Consolidated Appropriations Act, 2017, P.L. 115-31, dated May 5, 2017.
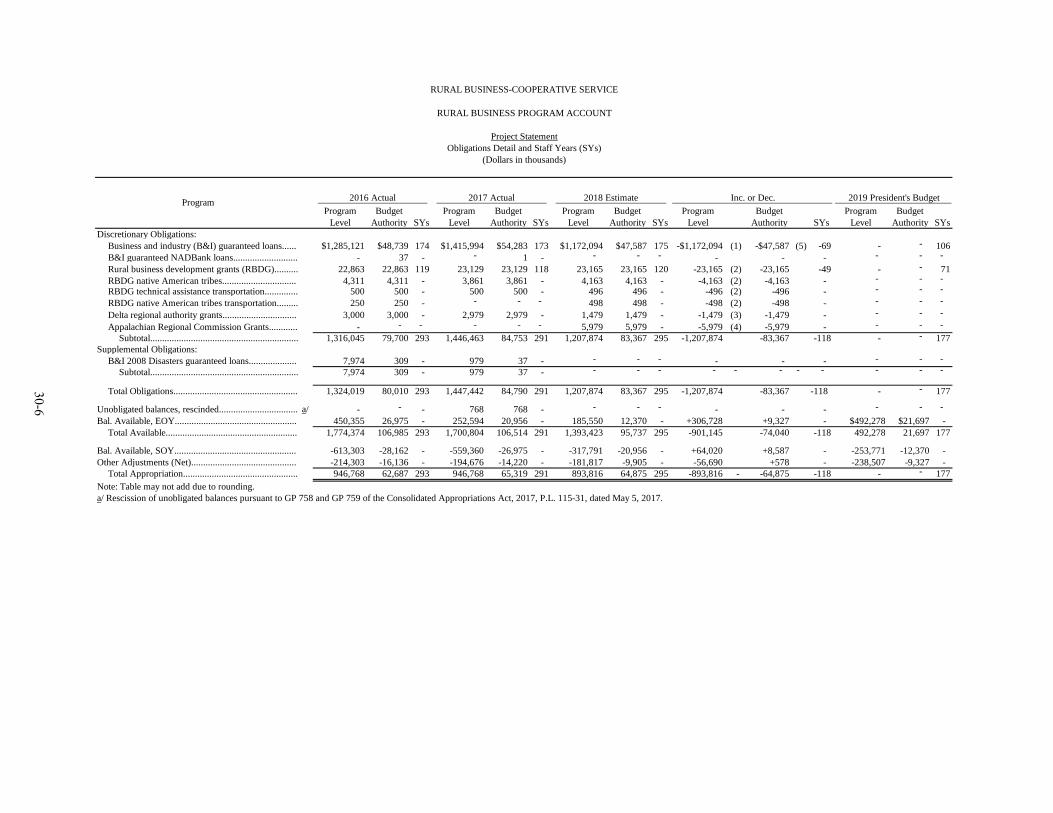
RURAL BUSINESS-COOPERATIVE SERVICE
RURAL BUSINESS PROGRAM ACCOUNT
Project Statement Obligations Detail and Staff Years (SYs)
(Dollars in thousands)
2016 Actual 2017 Actual 2018 Estimate Inc. or Dec. 2019 President's Budget Program Program Budget Program Budget Program Budget Program Budget Program Budget Level Authority SYs Level Authority SYs Level Authority SYs Level Authority SYs Level Authority SYs
Discretionary Obligations: Business and industry (B&I) guaranteed loans...... $1,285,121 $48,739 174 $1,415,994 $54,283 173 $1,172,094 $47,587 175 -$1,172,094 (1) -$47,587 (5) -69 - - 106 B&I guaranteed NADBank loans........................... - 37 - - 1 - - - - - - - - - -Rural business development grants (RBDG).......... 22,863 22,863 119 23,129 23,129 118 23,165 23,165 120 -23,165 (2) -23,165 -49 - - 71 RBDG native American tribes............................... 4,311 4,311 - 3,861 3,861 - 4,163 4,163 - -4,163 (2) -4,163 - - - -RBDG technical assistance transportation.............. 500 500 - 500 500 - 496 496 - -496 (2) -496 - - - -RBDG native American tribes transportation......... 250 250 - - - - 498 498 - -498 (2) -498 - - - -Delta regional authority grants............................... 3,000 3,000 - 2,979 2,979 - 1,479 1,479 - -1,479 (3) -1,479 - - - -Appalachian Regional Commission Grants............ - - - - - - 5,979 5,979 - -5,979 (4) -5,979 - - - -Subtotal.............................................................. 1,316,045 79,700 293 1,446,463 84,753 291 1,207,874 83,367 295 -1,207,874 -83,367 -118 - - 177
Supplemental Obligations: B&I 2008 Disasters guaranteed loans.................... 7,974 309 - 979 37 - - - - - - - - - -Subtotal.............................................................. 7,974 309 - 979 37 - - - - - - - - - - - -
30-6
Total Obligations.................................................... 1,324,019 80,010 293 1,447,442 84,790 291 1,207,874 83,367 295 -1,207,874 -83,367 -118 - - 177
Unobligated balances, rescinded................................. a/ - - - 768 768 - - - - - - - - - -Bal. Available, EOY................................................... 450,355 26,975 - 252,594 20,956 - 185,550 12,370 - +306,728 +9,327 - $492,278 $21,697 -Total Available....................................................... 1,774,374 106,985 293 1,700,804 106,514 291 1,393,423 95,737 295 -901,145 -74,040 -118 492,278 21,697 177
Bal. Available, SOY................................................... -613,303 -28,162 - -559,360 -26,975 - -317,791 -20,956 - +64,020 +8,587 - -253,771 -12,370 -Other Adjustments (Net)............................................ -214,303 -16,136 - -194,676 -14,220 - -181,817 -9,905 - -56,690 +578 - -238,507 -9,327 -Total Appropriation................................................ 946,768 62,687 293 946,768 65,319 291 893,816 64,875 295 -893,816 - -64,875 -118 - - 177
Note: Table may not add due to rounding. a/ Rescission of unobligated balances pursuant to GP 758 and GP 759 of the Consolidated Appropriations Act, 2017, P.L. 115-31, dated May 5, 2017.
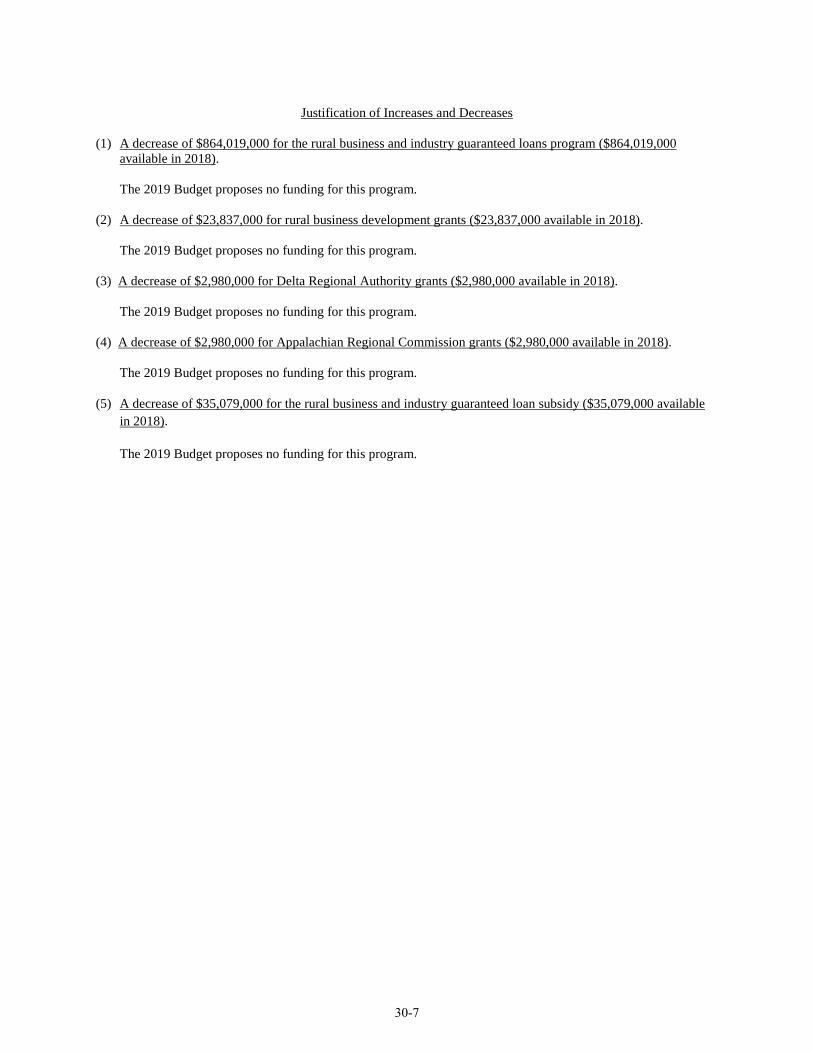
Justification of Increases and Decreases
(1) A decrease of $864,019,000 for the rural business and industry guaranteed loans program ($864,019,000 available in 2018).
The 2019 Budget proposes no funding for this program.
(2) A decrease of $23,837,000 for rural business development grants ($23,837,000 available in 2018).
The 2019 Budget proposes no funding for this program.
(3) A decrease of $2,980,000 for Delta Regional Authority grants ($2,980,000 available in 2018).
The 2019 Budget proposes no funding for this program.
(4) A decrease of $2,980,000 for Appalachian Regional Commission grants ($2,980,000 available in 2018).
The 2019 Budget proposes no funding for this program.
(5) A decrease of $35,079,000 for the rural business and industry guaranteed loan subsidy ($35,079,000 available in 2018).
The 2019 Budget proposes no funding for this program.
30-7
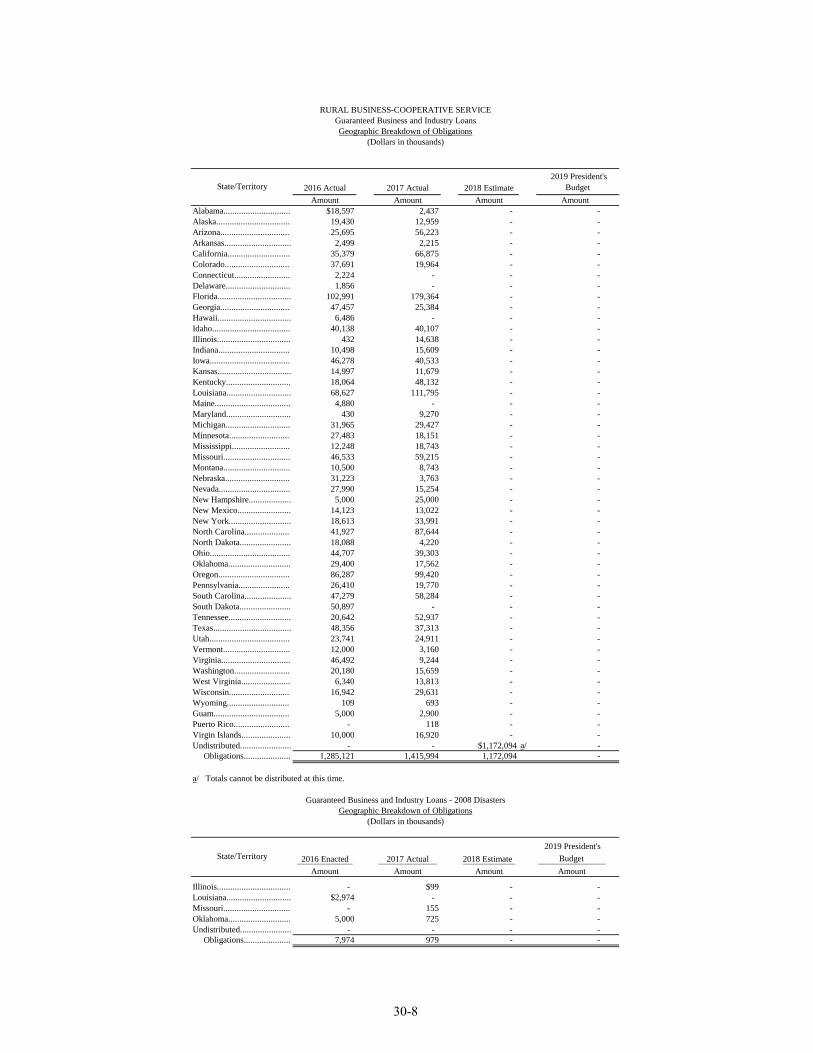
RURAL BUSINESS-COOPERATIVE SERVICE Guaranteed Business and Industry Loans Geographic Breakdown of Obligations
(Dollars in thousands)
2019 President's State/Territory 2016 Actual 2017 Actual 2018 Estimate Budget
Amount Amount Amount Amount Alabama.............................. $18,597 2,437 - -Alaska................................. 19,430 12,959 - -Arizona............................... 25,695 56,223 - -Arkansas.............................. 2,499 2,215 - -California............................ 35,379 66,875 - -Colorado............................. 37,691 19,964 - -Connecticut......................... 2,224 - - -Delaware............................. 1,856 - - -Florida................................. 102,991 179,364 - -Georgia............................... 47,457 25,384 - -Hawaii................................. 6,486 - - -Idaho................................... 40,138 40,107 - -Illinois................................. 432 14,638 - -Indiana................................ 10,498 15,609 - -Iowa.................................... 46,278 40,533 - -Kansas................................. 14,997 11,679 - -Kentucky............................. 18,064 48,132 - -Louisiana............................. 68,627 111,795 - -Maine.................................. 4,880 - - -Maryland............................. 430 9,270 - -Michigan............................. 31,965 29,427 - -Minnesota........................... 27,483 18,151 - -Mississippi.......................... 12,248 18,743 - -Missouri.............................. 46,533 59,215 - -Montana.............................. 10,500 8,743 - -Nebraska............................. 31,223 3,763 - -Nevada................................ 27,990 15,254 - -New Hampshire................... 5,000 25,000 - -New Mexico........................ 14,123 13,022 - -New York............................ 18,613 33,991 - -North Carolina.................... 41,927 87,644 - -North Dakota....................... 18,088 4,220 - -Ohio.................................... 44,707 39,303 - -Oklahoma............................ 29,400 17,562 - -Oregon................................ 86,287 99,420 - -Pennsylvania....................... 26,410 19,770 - -South Carolina..................... 47,279 58,284 - -South Dakota....................... 50,897 - - -Tennessee............................ 20,642 52,937 - -Texas................................... 48,356 37,313 - -Utah.................................... 23,741 24,911 - -Vermont.............................. 12,000 3,160 - -Virginia............................... 46,492 9,244 - -Washington......................... 20,180 15,659 - -West Virginia...................... 6,340 13,813 - -Wisconsin........................... 16,942 29,631 - -Wyoming............................ 109 693 - -Guam.................................. 5,000 2,900 - -Puerto Rico......................... - 118 - -Virgin Islands...................... 10,000 16,920 - -Undistributed....................... - - $1,172,094 a/ -Obligations..................... 1,285,121 1,415,994 1,172,094 -
a/ Totals cannot be distributed at this time.
Guaranteed Business and Industry Loans - 2008 Disasters Geographic Breakdown of Obligations
(Dollars in thousands)
State/Territory 2016 Enacted 2017 Actual 2018 Estimate 2019 President's
Budget Amount Amount Amount Amount
Illinois................................. - $99 - -Louisiana............................. $2,974 - - -Missouri.............................. - 155 - -Oklahoma............................ 5,000 725 - -Undistributed....................... - - - -Obligations..................... 7,974 979 - -
30-8

RURAL BUSINESS-COOPERATIVE SERVICE Rural Business Development Grants Geographic Breakdown of Obligations
(Dollars in thousands)
2019 President's
State/Territory 2016 Actual Amount
2017 Actual Amount
2018 Estimate Amount
Budget Amount
Alabama.............................................................. $766 $767 - -Alaska................................................................. 138 145 - -Arizona................................................................ 310 323 - -Arkansas.............................................................. 486 490 - -California............................................................ 684 694 - -Colorado.............................................................. 269 243 - -Connecticut......................................................... 147 152 - -Delaware............................................................. 105 107 - -Florida................................................................. 628 634 - -Georgia................................................................ 899 915 - -Hawaii................................................................. 101 101 - -Idaho................................................................... 197 199 - -Illinois................................................................. 431 440 - -Indiana................................................................ 526 520 - -Iowa.................................................................... 300 302 - -Kansas................................................................. 233 236 - -Kentucky............................................................. 722 741 - -Louisiana............................................................. 449 479 - -Maine.................................................................. 290 296 - -Maryland............................................................. 221 230 - -Massachusetts..................................................... 177 179 - -Michigan............................................................. 834 807 - -Minnesota............................................................ 400 393 - -Mississippi.......................................................... 636 653 - -Missouri.............................................................. 610 618 - -Montana.............................................................. 192 197 - -Nebraska............................................................. 169 169 - -Nevada................................................................ 88 109 - -New Hampshire.................................................. 174 203 - -New Jersey.......................................................... 166 171 - -New Mexico........................................................ 240 251 - -New York............................................................ 1,171 1,231 - -North Carolina.................................................... 932 944 - -North Dakota....................................................... 613 688 - -Ohio.................................................................... 762 747 - -Oklahoma............................................................ 432 440 - -Oregon................................................................ 286 287 - -Pennsylvania....................................................... 733 742 - -Rhode Island....................................................... 84 86 - -South Carolina.................................................... 668 676 - -South Dakota....................................................... 208 166 - -Tennessee............................................................ 784 791 - -Texas................................................................... 932 944 - -Utah..................................................................... 129 130 - -Vermont.............................................................. 1,294 1,210 - -Virginia............................................................... 596 612 - -Washington......................................................... 375 383 - -West Virginia...................................................... 380 381 - -Wisconsin............................................................ 474 467 - -Wyoming............................................................. 105 133 - -Puerto Rico......................................................... 253 244 - -Other Countries................................................... 64 64 - -Undistributed...................................................... - - $23,165 a/ -Obligations.......................................................... 22,863 23,129 23,165 -
a/ Totals cannot be distributed at this time.
30-9
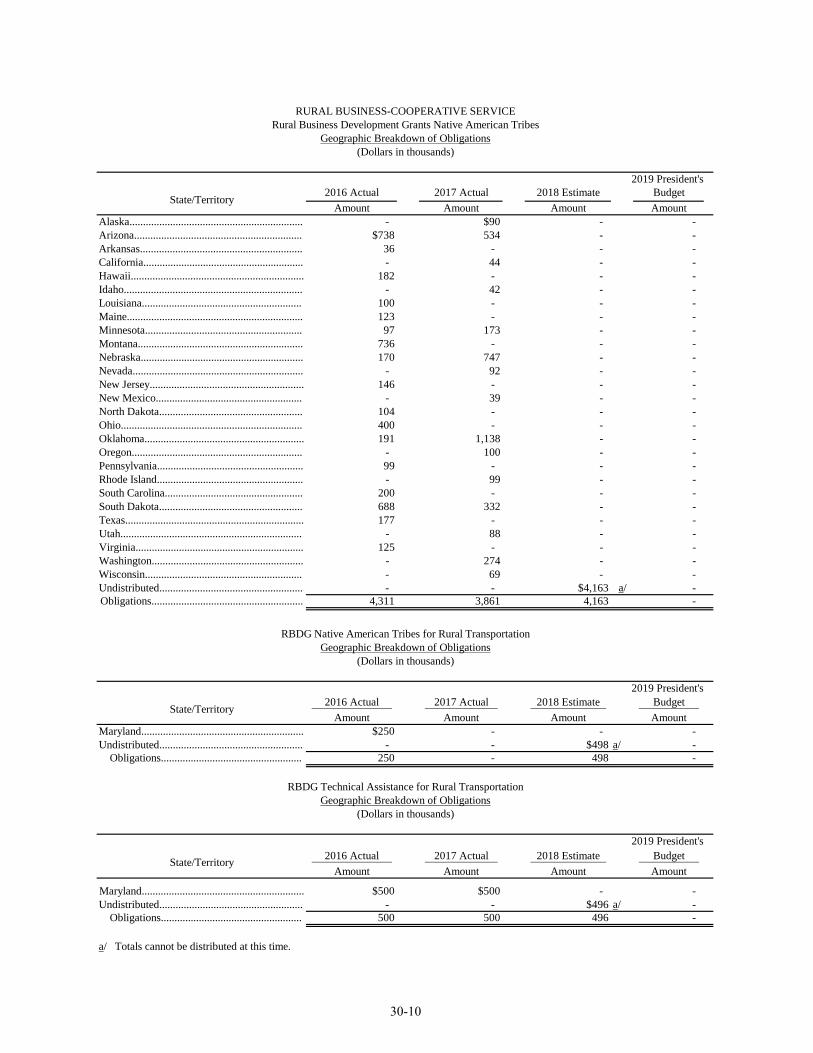
RURAL BUSINESS-COOPERATIVE SERVICE Rural Business Development Grants Native American Tribes
Geographic Breakdown of Obligations (Dollars in thousands)
2019 President's
State/Territory 2016 Actual Amount
2017 Actual Amount
2018 Estimate Amount
Budget Amount
Alaska................................................................ - $90 - -Arizona.............................................................. $738 534 - -Arkansas............................................................ 36 - - -California........................................................... - 44 - -Hawaii................................................................ 182 - - -Idaho.................................................................. - 42 - -Louisiana........................................................... 100 - - -Maine................................................................. 123 - - -Minnesota.......................................................... 97 173 - -Montana............................................................. 736 - - -Nebraska............................................................ 170 747 - -Nevada............................................................... - 92 - -New Jersey......................................................... 146 - - -New Mexico...................................................... - 39 - -North Dakota..................................................... 104 - - -Ohio................................................................... 400 - - -Oklahoma........................................................... 191 1,138 - -Oregon............................................................... - 100 - -Pennsylvania...................................................... 99 - - -Rhode Island...................................................... - 99 - -South Carolina................................................... 200 - - -South Dakota..................................................... 688 332 - -Texas.................................................................. 177 - - -Utah................................................................... - 88 - -Virginia.............................................................. 125 - - -Washington........................................................ - 274 - -Wisconsin.......................................................... - 69 - -Undistributed..................................................... - - $4,163 a/ -Obligations........................................................ 4,311 3,861 4,163 -
RBDG Native American Tribes for Rural Transportation Geographic Breakdown of Obligations
(Dollars in thousands)
2019 President's
State/Territory 2016 Actual Amount
2017 Actual Amount
2018 Estimate Amount
Budget Amount
Maryland............................................................ $250 - - -Undistributed..................................................... - - $498 a/ -Obligations.................................................... 250 - 498 -
RBDG Technical Assistance for Rural Transportation Geographic Breakdown of Obligations
(Dollars in thousands)
2019 President's
State/Territory 2016 Actual Amount
2017 Actual Amount
2018 Estimate Amount
Budget Amount
Maryland............................................................ $500 $500 - -Undistributed..................................................... - - $496 a/ -Obligations.................................................... 500 500 496 -
a/ Totals cannot be distributed at this time.
30-10
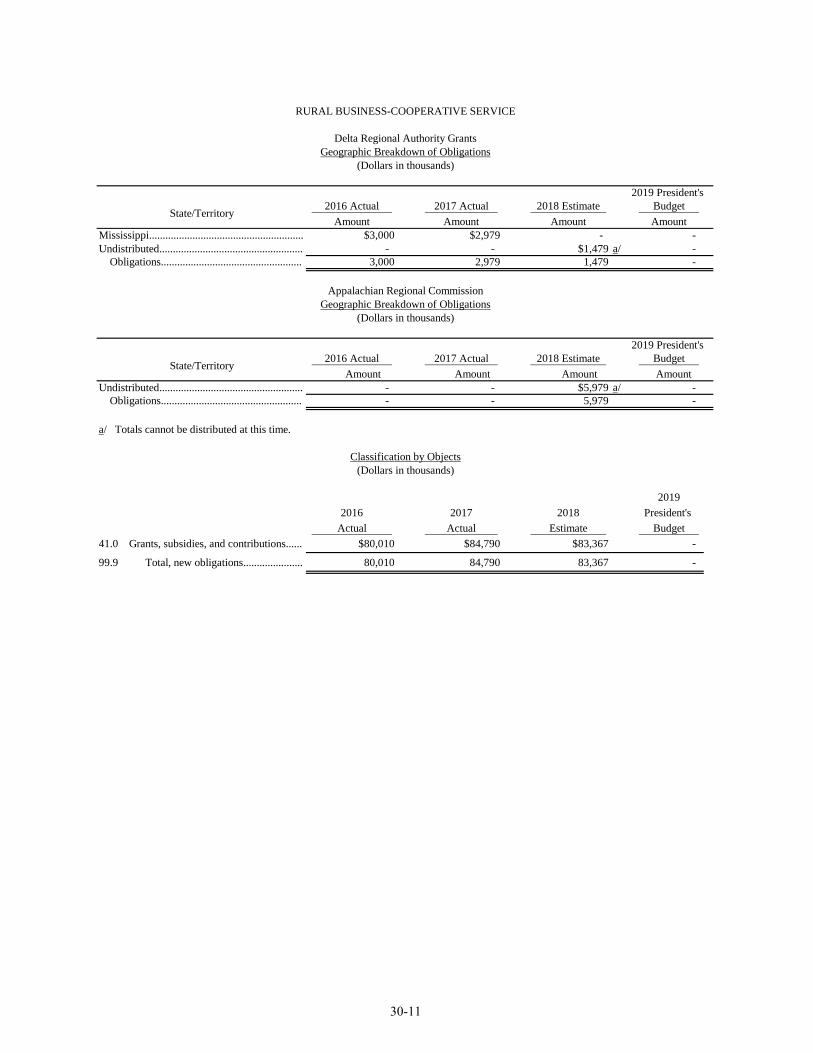
RURAL BUSINESS-COOPERATIVE SERVICE
Delta Regional Authority Grants Geographic Breakdown of Obligations
(Dollars in thousands)
2019 President's
State/Territory 2016 Actual Amount
2017 Actual Amount
2018 Estimate Amount
Budget Amount
Mississippi......................................................... $3,000 $2,979 - -Undistributed..................................................... - - $1,479 a/ -Obligations.................................................... 3,000 2,979 1,479 -
Appalachian Regional Commission Geographic Breakdown of Obligations
(Dollars in thousands)
State/Territory
Undistributed.....................................................Obligations....................................................
2016 Actual Amount
--
2017 Actual Amount
--
2018 Estimate Amount $5,979 a/5,979
2019 President's Budget Amount
--
a/ Totals cannot be distributed at this time.
Classification by Objects (Dollars in thousands)
41.0 Grants, subsidies, and contributions......
2016 Actual
$80,010
2017 Actual
$84,790
2018 Estimate
$83,367
2019 President's Budget
-
99.9 Total, new obligations...................... 80,010 84,790 83,367 -
30-11
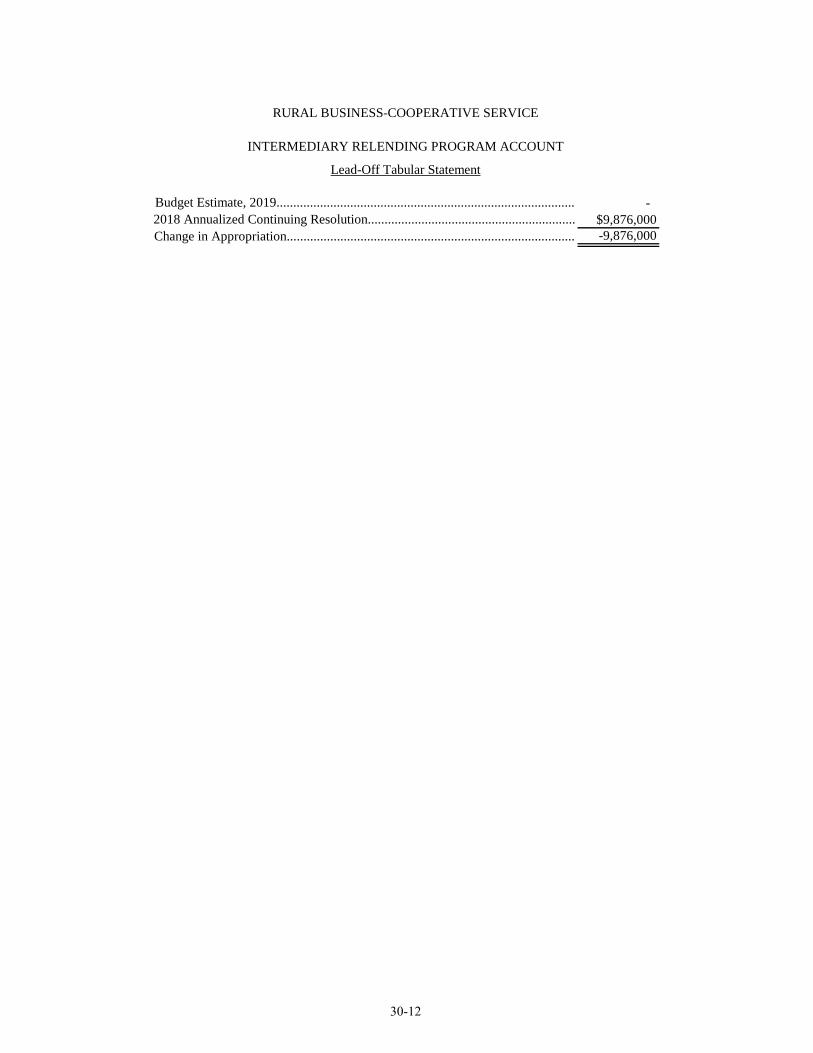
RURAL BUSINESS-COOPERATIVE SERVICE
INTERMEDIARY RELENDING PROGRAM ACCOUNT
Lead-Off Tabular Statement
Budget Estimate, 2019......................................................................................... -2018 Annualized Continuing Resolution.............................................................. $9,876,000 Change in Appropriation...................................................................................... -9,876,000
30-12
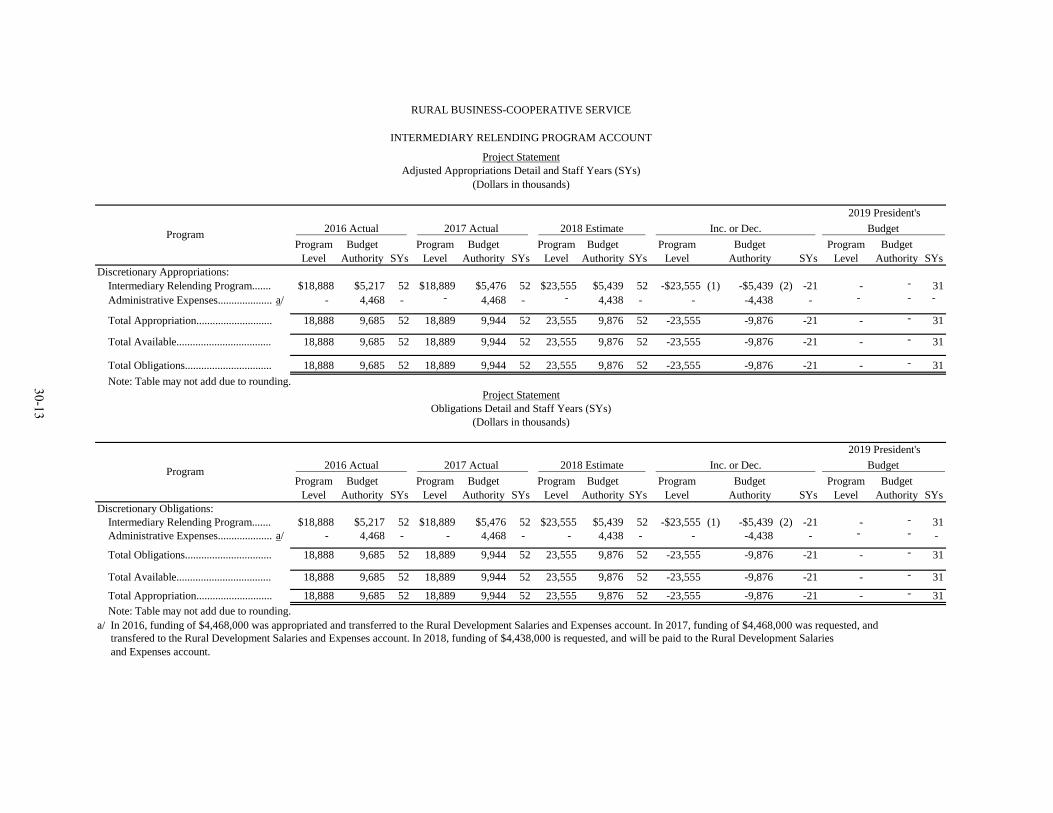
RURAL BUSINESS-COOPERATIVE SERVICE
INTERMEDIARY RELENDING PROGRAM ACCOUNT
Project Statement Adjusted Appropriations Detail and Staff Years (SYs)
(Dollars in thousands)
2019 President's 2016 Actual 2017 Actual 2018 Estimate Inc. or Dec. Budget Program
Program Budget Program Budget Program Budget Program Budget Program Budget Level Authority SYs Level Authority SYs Level Authority SYs Level Authority SYs Level Authority SYs
Discretionary Appropriations: Intermediary Relending Program....... $18,888 $5,217 52 $18,889 $5,476 52 $23,555 $5,439 52 -$23,555 (1) -$5,439 (2) -21 - - 31 Administrative Expenses.................... a/ - 4,468 - - 4,468 - - 4,438 - - -4,438 - - - -
Total Appropriation............................ 18,888 9,685 52 18,889 9,944 52 23,555 9,876 52 -23,555 -9,876 -21 - - 31
Total Available................................... 18,888 9,685 52 18,889 9,944 52 23,555 9,876 52 -23,555 -9,876 -21 - - 31
30-13
Total Obligations................................ 18,888 9,685 52 18,889 9,944 52 23,555 9,876 52 -23,555 -9,876 -21 - - 31 Note: Table may not add due to rounding.
Project Statement Obligations Detail and Staff Years (SYs)
(Dollars in thousands)
2019 President's 2016 Actual 2017 Actual 2018 Estimate Inc. or Dec. Budget Program
Program Budget Program Budget Program Budget Program Budget Program Budget Level Authority SYs Level Authority SYs Level Authority SYs Level Authority SYs Level Authority SYs
Discretionary Obligations: Intermediary Relending Program....... $18,888 $5,217 52 $18,889 $5,476 52 $23,555 $5,439 52 -$23,555 (1) -$5,439 (2) -21 - - 31 Administrative Expenses.................... a/ - 4,468 - - 4,468 - - 4,438 - - -4,438 - - - -
Total Obligations................................ 18,888 9,685 52 18,889 9,944 52 23,555 9,876 52 -23,555 -9,876 -21 - - 31
Total Available................................... 18,888 9,685 52 18,889 9,944 52 23,555 9,876 52 -23,555 -9,876 -21 - - 31
Total Appropriation............................ 18,888 9,685 52 18,889 9,944 52 23,555 9,876 52 -23,555 -9,876 -21 - - 31 Note: Table may not add due to rounding.
a/ In 2016, funding of $4,468,000 was appropriated and transferred to the Rural Development Salaries and Expenses account. In 2017, funding of $4,468,000 was requested, and transfered to the Rural Development Salaries and Expenses account. In 2018, funding of $4,438,000 is requested, and will be paid to the Rural Development Salaries and Expenses account.
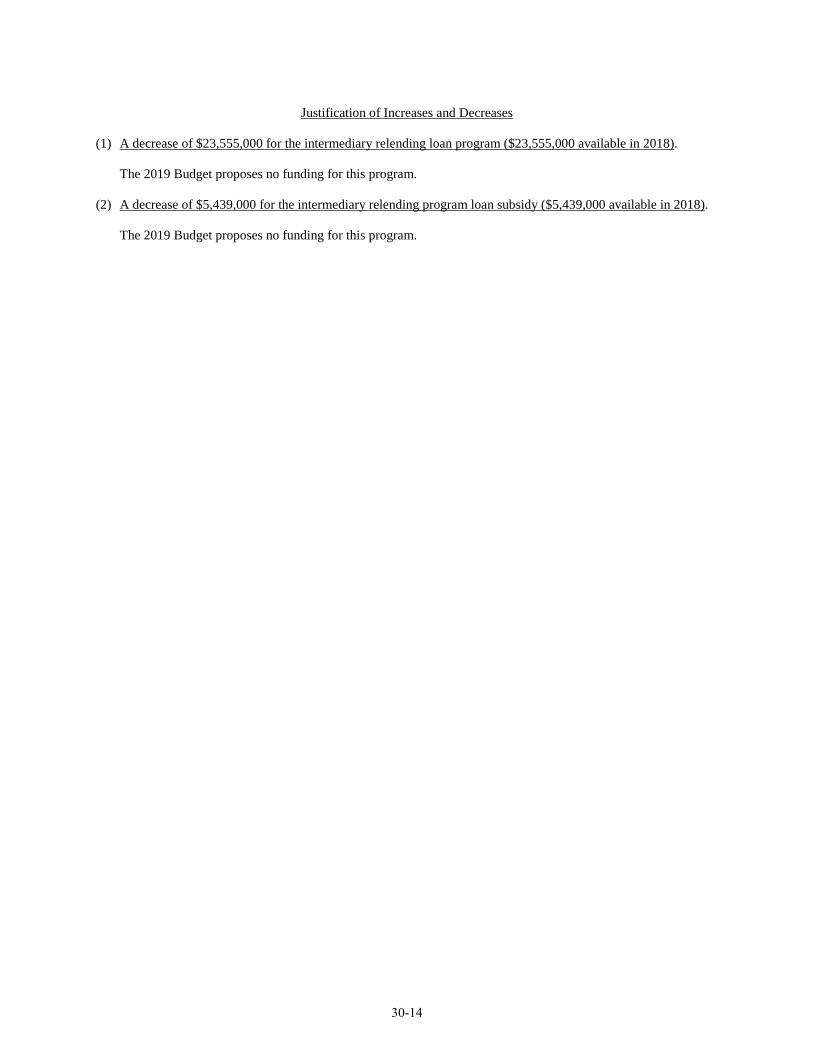
Justification of Increases and Decreases
(1) A decrease of $23,555,000 for the intermediary relending loan program ($23,555,000 available in 2018).
The 2019 Budget proposes no funding for this program.
(2) A decrease of $5,439,000 for the intermediary relending program loan subsidy ($5,439,000 available in 2018).
The 2019 Budget proposes no funding for this program.
30-14
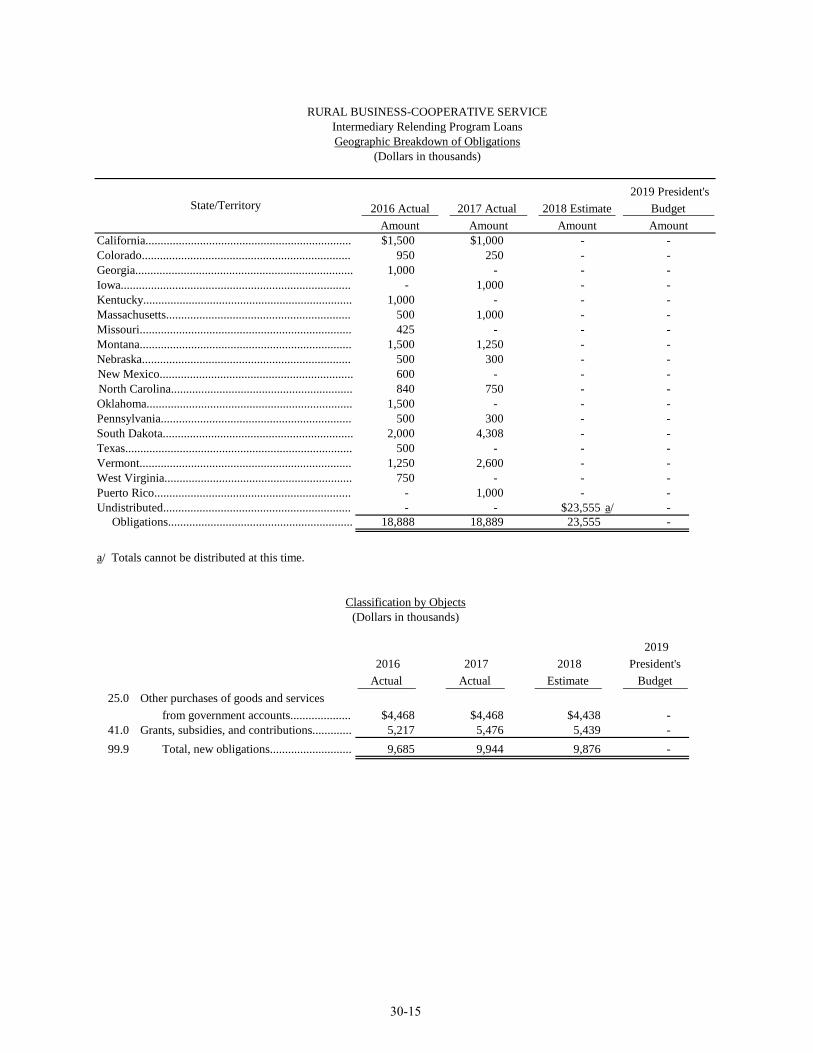
RURAL BUSINESS-COOPERATIVE SERVICE Intermediary Relending Program Loans Geographic Breakdown of Obligations
(Dollars in thousands)
State/Territory 2016 Actual Amount
2017 Actual Amount
2018 Estimate 2019 President
Amount
's Budget Amount
California.................................................................... $1,500 $1,000 - -Colorado..................................................................... 950 250 - -Georgia........................................................................ 1,000 - - -Iowa............................................................................ - 1,000 - -Kentucky..................................................................... 1,000 - - -Massachusetts............................................................. 500 1,000 - -Missouri...................................................................... 425 - - -Montana...................................................................... 1,500 1,250 - -Nebraska..................................................................... 500 300 - -New Mexico................................................................ 600 - - -North Carolina............................................................ 840 750 - -Oklahoma.................................................................... 1,500 - - -Pennsylvania............................................................... 500 300 - -South Dakota............................................................... 2,000 4,308 - -Texas........................................................................... 500 - - -Vermont...................................................................... 1,250 2,600 - -West Virginia.............................................................. 750 - - -Puerto Rico................................................................. - 1,000 - -Undistributed.............................................................. - - $23,555 a/ - Obligations............................................................. 18,888 18,889 23,555 -
a/ Totals cannot be distributed at this time.
Classification by Objects (Dollars in thousands)
2019 2016 2017 2018 President's Actual Actual Estimate Budget
25.0 Other purchases of goods and services from government accounts.................... $4,468 $4,468 $4,438 -
41.0 Grants, subsidies, and contributions............. 5,217 5,476 5,439 -99.9 Total, new obligations........................... 9,685 9,944 9,876 -
30-15
RURAL BUSINESS-COOPERATIVE SERVICE
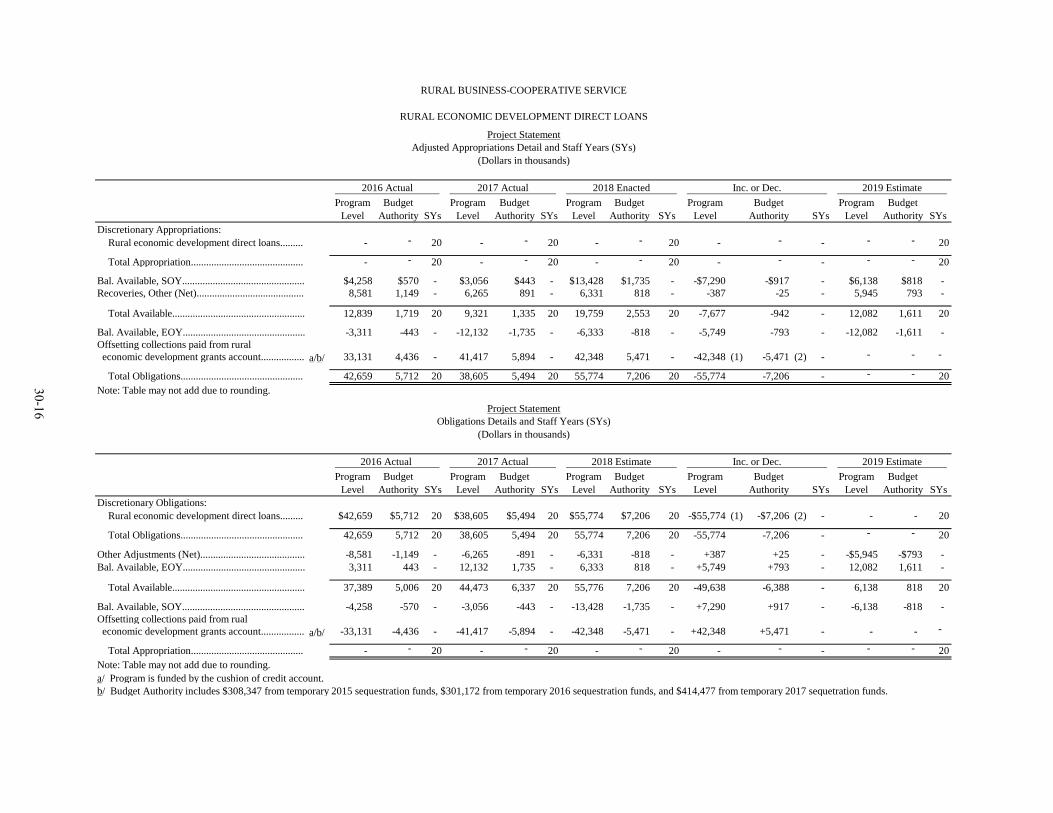
RURAL ECONOMIC DEVELOPMENT DIRECT LOANS
Project Statement Adjusted Appropriations Detail and Staff Years (SYs)
(Dollars in thousands)
2016 Actual 2017 Actual 2018 Enacted Inc. or Dec. 2019 Estimate Program Budget Program Budget Program Budget Program Budget Program Budget Level Authority SYs Level Authority SYs Level Authority SYs Level Authority SYs Level Authority SYs
Discretionary Appropriations: Rural economic development direct loans......... - - 20 - - 20 - - 20 - - - - - 20
Total Appropriation............................................ - - 20 - - 20 - - 20 - - - - - 20
Bal. Available, SOY................................................ $4,258 $570 - $3,056 $443 - $13,428 $1,735 - -$7,290 -$917 - $6,138 $818 -Recoveries, Other (Net).......................................... 8,581 1,149 - 6,265 891 - 6,331 818 - -387 -25 - 5,945 793 -
Total Available.................................................... 12,839 1,719 20 9,321 1,335 20 19,759 2,553 20 -7,677 -942 - 12,082 1,611 20
Bal. Available, EOY................................................ -3,311 -443 - -12,132 -1,735 - -6,333 -818 - -5,749 -793 - -12,082 -1,611 -Offsetting collections paid from rural economic development grants account................. a/b/ 33,131 4,436 - 41,417 5,894 - 42,348 5,471 - -42,348 (1) -5,471 (2) - - - -
30-16
Total Obligations................................................ 42,659 5,712 20 38,605 5,494 20 55,774 7,206 20 -55,774 -7,206 - - - 20 Note: Table may not add due to rounding.
Project Statement Obligations Details and Staff Years (SYs)
(Dollars in thousands)
2016 Actual 2017 Actual 2018 Estimate Inc. or Dec. 2019 Estimate Program Budget Program Budget Program Budget Program Budget Program Budget Level Authority SYs Level Authority SYs Level Authority SYs Level Authority SYs Level Authority SYs
Discretionary Obligations: Rural economic development direct loans......... $42,659 $5,712 20 $38,605 $5,494 20 $55,774 $7,206 20 -$55,774 (1) -$7,206 (2) - - - 20
Total Obligations................................................ 42,659 5,712 20 38,605 5,494 20 55,774 7,206 20 -55,774 -7,206 - - - 20
Other Adjustments (Net)......................................... -8,581 -1,149 - -6,265 -891 - -6,331 -818 - +387 +25 - -$5,945 -$793 -Bal. Available, EOY................................................ 3,311 443 - 12,132 1,735 - 6,333 818 - +5,749 +793 - 12,082 1,611 -
Total Available.................................................... 37,389 5,006 20 44,473 6,337 20 55,776 7,206 20 -49,638 -6,388 - 6,138 818 20
Bal. Available, SOY................................................ -4,258 -570 - -3,056 -443 - -13,428 -1,735 - +7,290 +917 - -6,138 -818 -Offsetting collections paid from rual economic development grants account................. a/b/ -33,131 -4,436 - -41,417 -5,894 - -42,348 -5,471 - +42,348 +5,471 - - - -
Total Appropriation............................................ - - 20 - - 20 - - 20 - - - - - 20 Note: Table may not add due to rounding. a/ Program is funded by the cushion of credit account. b/ Budget Authority includes $308,347 from temporary 2015 sequestration funds, $301,172 from temporary 2016 sequestration funds, and $414,477 from temporary 2017 sequetration funds.
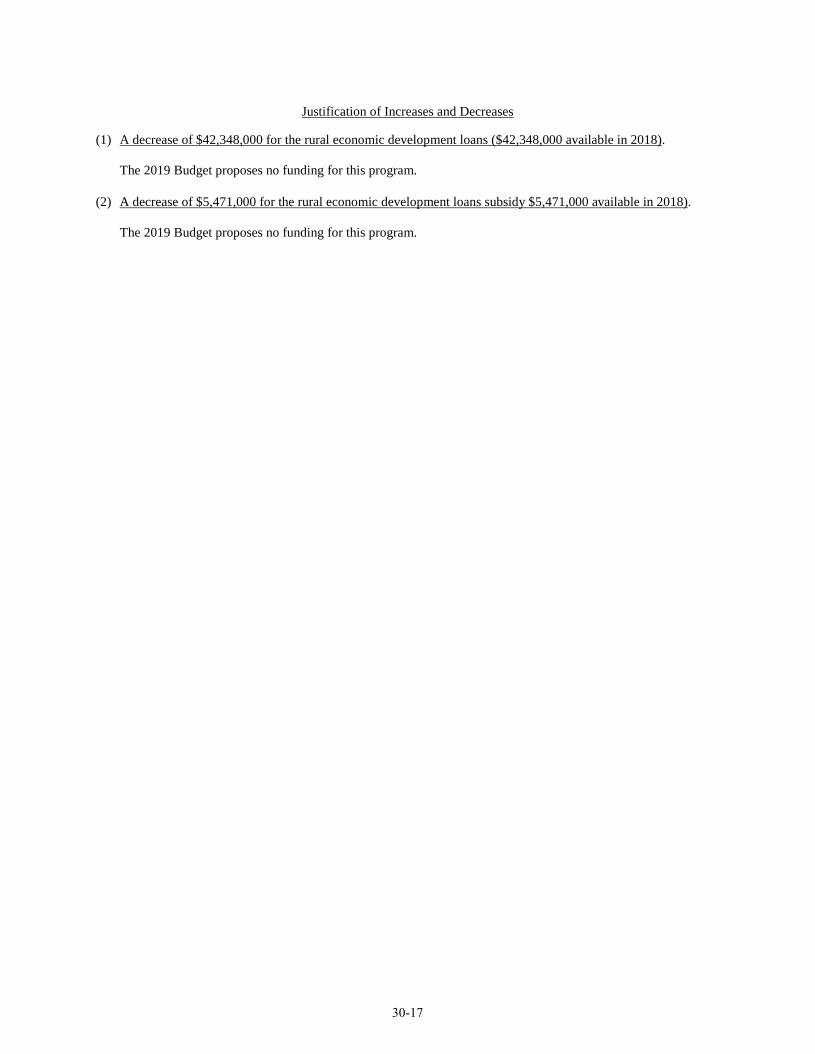
Justification of Increases and Decreases
(1) A decrease of $42,348,000 for the rural economic development loans ($42,348,000 available in 2018).
The 2019 Budget proposes no funding for this program.
(2) A decrease of $5,471,000 for the rural economic development loans subsidy $5,471,000 available in 2018).
The 2019 Budget proposes no funding for this program.
30-17
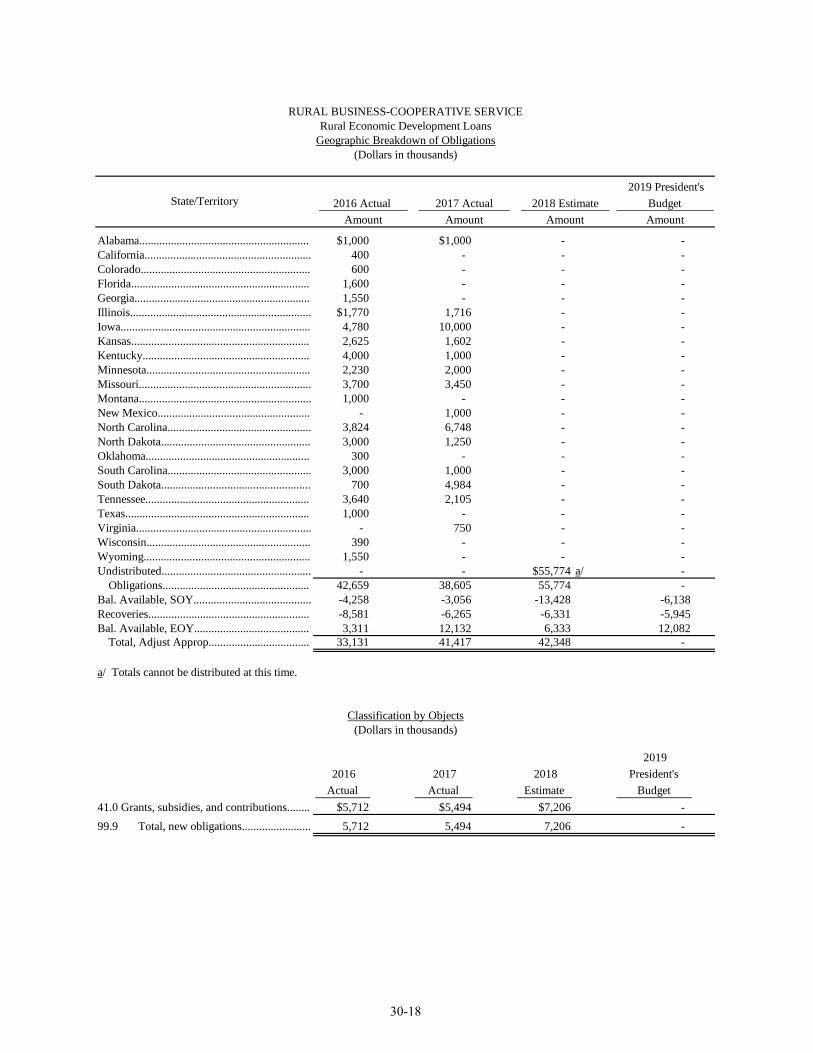
RURAL BUSINESS-COOPERATIVE SERVICE Rural Economic Development Loans Geographic Breakdown of Obligations
(Dollars in thousands)
2019 President's State/Territory 2016 Actual 2017 Actual 2018 Estimate Budget
Amount Amount Amount Amount
Alabama........................................................... $1,000 $1,000 - -California.......................................................... 400 - - -Colorado........................................................... 600 - - -Florida.............................................................. 1,600 - - -Georgia............................................................. 1,550 - - -Illinois............................................................... $1,770 1,716 - -Iowa.................................................................. 4,780 10,000 - -Kansas.............................................................. 2,625 1,602 - -Kentucky.......................................................... 4,000 1,000 - -Minnesota......................................................... 2,230 2,000 - -Missouri............................................................ 3,700 3,450 - -Montana............................................................ 1,000 - - -New Mexico..................................................... - 1,000 - -North Carolina.................................................. 3,824 6,748 - -North Dakota.................................................... 3,000 1,250 - -Oklahoma......................................................... 300 - - -South Carolina.................................................. 3,000 1,000 - -South Dakota.................................................... 700 4,984 - -Tennessee......................................................... 3,640 2,105 - -Texas................................................................ 1,000 - - -Virginia............................................................. - 750 - -Wisconsin......................................................... 390 - - -Wyoming.......................................................... 1,550 - - -Undistributed.................................................... - - $55,774 a/ -Obligations................................................... 42,659 38,605 55,774 -
Bal. Available, SOY......................................... -4,258 -3,056 -13,428 -6,138 Recoveries........................................................ -8,581 -6,265 -6,331 -5,945 Bal. Available, EOY........................................ 3,311 12,132 6,333 12,082 Total, Adjust Approp................................... 33,131 41,417 42,348 -
a/ Totals cannot be distributed at this time.
Classification by Objects (Dollars in thousands)
2019 2016 2017 2018 President's Actual Actual Estimate Budget
41.0 Grants, subsidies, and contributions........ $5,712 $5,494 $7,206 -99.9 Total, new obligations........................ 5,712 5,494 7,206 -
30-18

RURAL BUSINESS-COOPERATIVE SERVICE
RURAL ECONOMIC DEVELOPMENT GRANTS
Lead-Off Tabular Statement
Budget Estimate, 2019........................................................................................................ 2018 Annualized Continuing Resolution............................................................................ Change in Appropriation.....................................................................................................
Lead-Off Tabular Statement (On basis of funding)
Budget Estimate, 2019........................................................................................................ 2018 Annualized Continuing Resolution............................................................................ Change in Funding..............................................................................................................
-$225,000,000 -132,000,000 93,000,000
-$9,272,000 -9,272,000
30-19
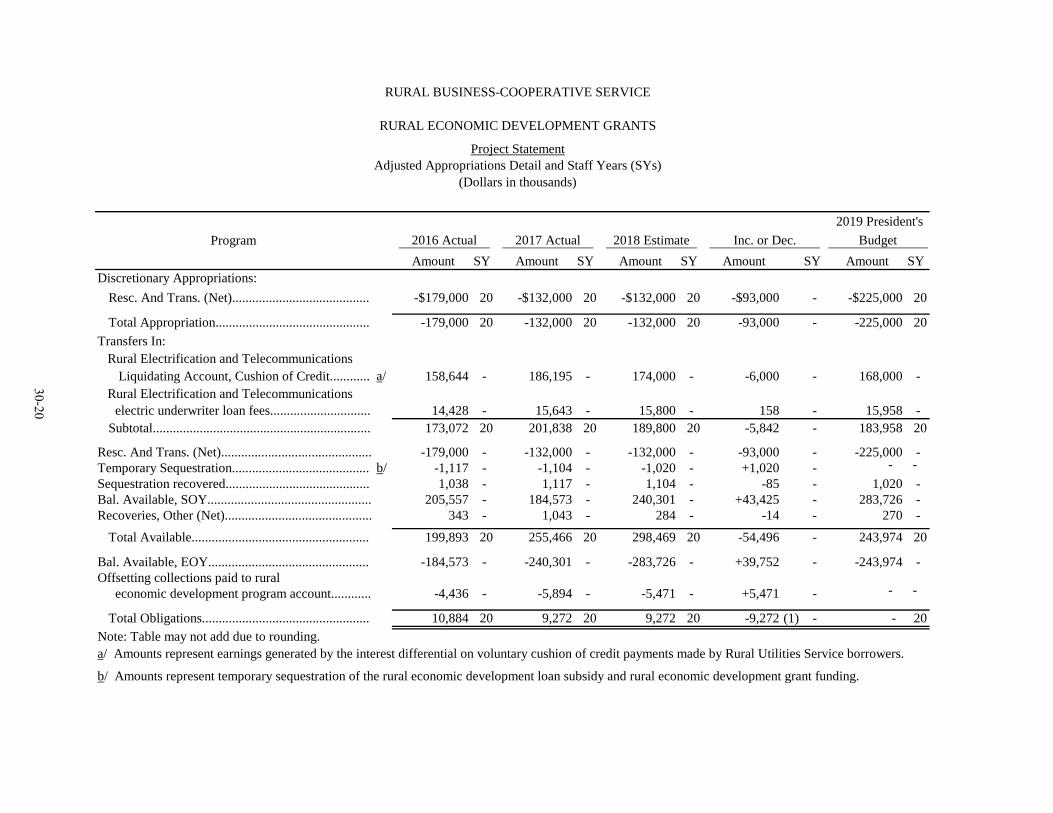
RURAL BUSINESS-COOPERATIVE SERVICE
RURAL ECONOMIC DEVELOPMENT GRANTS
Project Statement Adjusted Appropriations Detail and Staff Years (SYs)
(Dollars in thousands)
2019 President's Program 2016 Actual 2017 Actual 2018 Estimate Inc. or Dec. Budget
Amount SY Amount SY Amount SY Amount SY Amount SY Discretionary Appropriations: Resc. And Trans. (Net)......................................... -$179,000 20 -$132,000 20 -$132,000 20 -$93,000 - -$225,000 20
30-20
Total Appropriation.............................................. -179,000 20 -132,000 20 -132,000 20 -93,000 - -225,000 20 Transfers In: Rural Electrification and Telecommunications Liquidating Account, Cushion of Credit............ a/ 158,644 - 186,195 - 174,000 - -6,000 - 168,000 -
Rural Electrification and Telecommunications electric underwriter loan fees.............................. 14,428 - 15,643 - 15,800 - 158 - 15,958 -Subtotal................................................................. 173,072 20 201,838 20 189,800 20 -5,842 - 183,958 20
Resc. And Trans. (Net)............................................. -179,000 - -132,000 - -132,000 - -93,000 - -225,000 -Temporary Sequestration......................................... b/ -1,117 - -1,104 - -1,020 - +1,020 - - -Sequestration recovered........................................... 1,038 - 1,117 - 1,104 - -85 - 1,020 -Bal. Available, SOY................................................. 205,557 - 184,573 - 240,301 - +43,425 - 283,726 -Recoveries, Other (Net)............................................ 343 - 1,043 - 284 - -14 - 270 -
Total Available..................................................... 199,893 20 255,466 20 298,469 20 -54,496 - 243,974 20
Bal. Available, EOY................................................ -184,573 - -240,301 - -283,726 - +39,752 - -243,974 -Offsetting collections paid to rural economic development program account............ -4,436 - -5,894 - -5,471 - +5,471 - - -
Total Obligations.................................................. 10,884 20 9,272 20 9,272 20 -9,272 (1) - - 20 Note: Table may not add due to rounding. a/ Amounts represent earnings generated by the interest differential on voluntary cushion of credit payments made by Rural Utilities Service borrowers.
b/ Amounts represent temporary sequestration of the rural economic development loan subsidy and rural economic development grant funding.
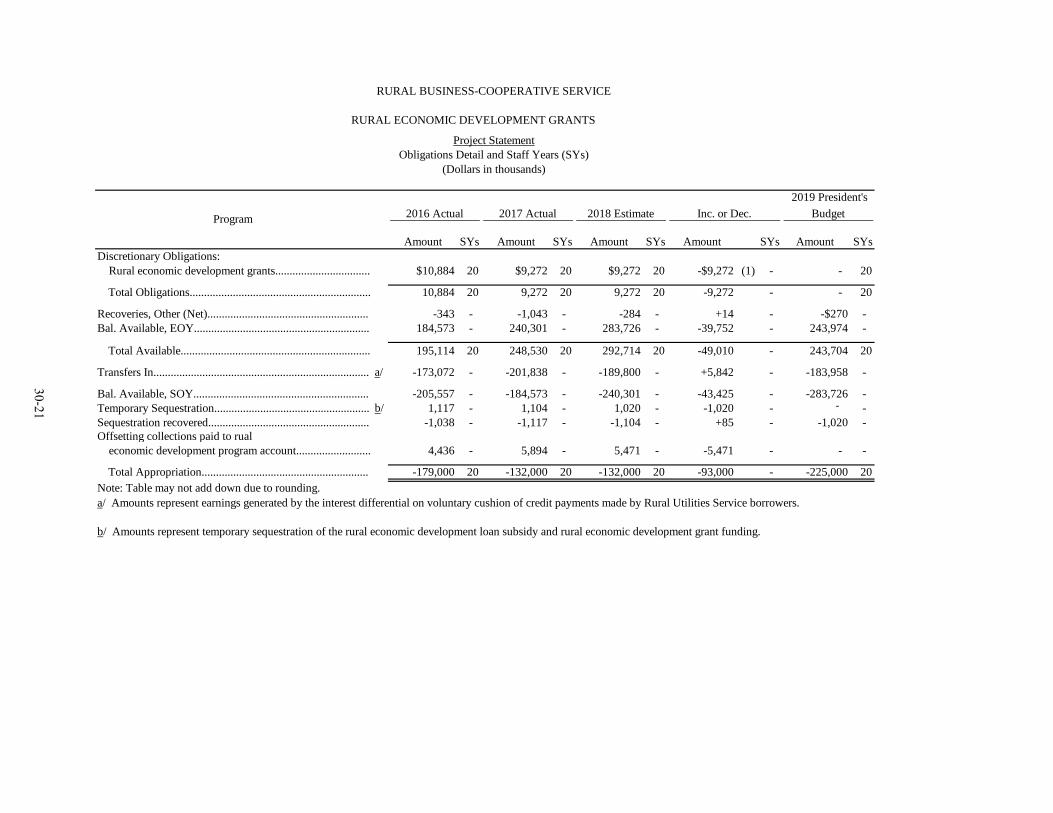
RURAL BUSINESS-COOPERATIVE SERVICE
RURAL ECONOMIC DEVELOPMENT GRANTS
Project Statement Obligations Detail and Staff Years (SYs)
(Dollars in thousands)
2019 President's 2016 Actual 2017 Actual 2018 Estimate Inc. or Dec. Budget Program
Amount SYs Amount SYs Amount SYs Amount SYs Amount SYs Discretionary Obligations: Rural economic development grants................................. $10,884 20 $9,272 20 $9,272 20 -$9,272 (1) - - 20
Total Obligations............................................................... 10,884 20 9,272 20 9,272 20 -9,272 - - 20
Recoveries, Other (Net)........................................................ -343 - -1,043 - -284 - +14 - -$270 -Bal. Available, EOY............................................................. 184,573 - 240,301 - 283,726 - -39,752 - 243,974 -
30-21
Total Available.................................................................. 195,114 20 248,530 20 292,714 20 -49,010 - 243,704 20
Transfers In........................................................................... a/ -173,072 - -201,838 - -189,800 - +5,842 - -183,958 -
Bal. Available, SOY............................................................. -205,557 - -184,573 - -240,301 - -43,425 - -283,726 -Temporary Sequestration...................................................... b/ 1,117 - 1,104 - 1,020 - -1,020 - - -Sequestration recovered........................................................ -1,038 - -1,117 - -1,104 - +85 - -1,020 -Offsetting collections paid to rual economic development program account.......................... 4,436 - 5,894 - 5,471 - -5,471 - - -
Total Appropriation.......................................................... -179,000 20 -132,000 20 -132,000 20 -93,000 - -225,000 20 Note: Table may not add down due to rounding. a/ Amounts represent earnings generated by the interest differential on voluntary cushion of credit payments made by Rural Utilities Service borrowers.
b/ Amounts represent temporary sequestration of the rural economic development loan subsidy and rural economic development grant funding.
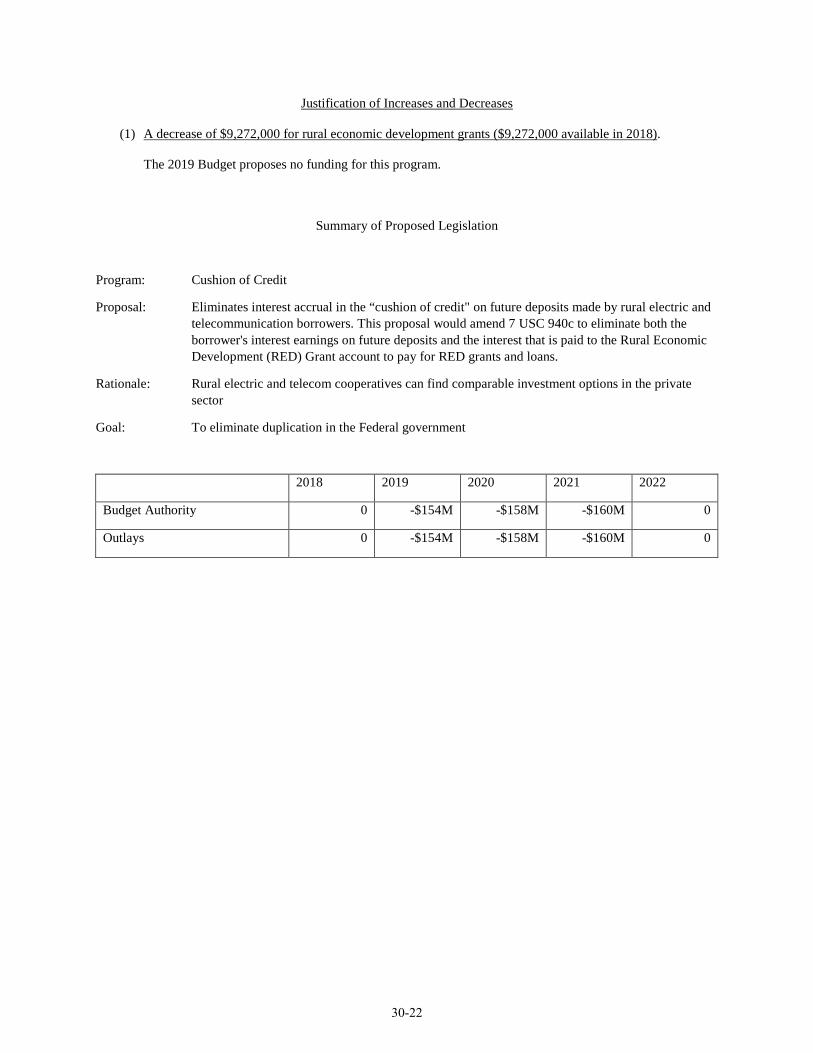
Justification of Increases and Decreases
(1) A decrease of $9,272,000 for rural economic development grants ($9,272,000 available in 2018).
The 2019 Budget proposes no funding for this program.
Summary of Proposed Legislation
Program: Cushion of Credit
Proposal: Eliminates interest accrual in the “cushion of credit" on future deposits made by rural electric and telecommunication borrowers. This proposal would amend 7 USC 940c to eliminate both the borrower's interest earnings on future deposits and the interest that is paid to the Rural Economic Development (RED) Grant account to pay for RED grants and loans.
Rationale: Rural electric and telecom cooperatives can find comparable investment options in the private sector
Goal: To eliminate duplication in the Federal government
2018 2019 2020 2021 2022
Budget Authority 0 -$154M -$158M -$160M 0
Outlays 0 -$154M -$158M -$160M 0
30-22
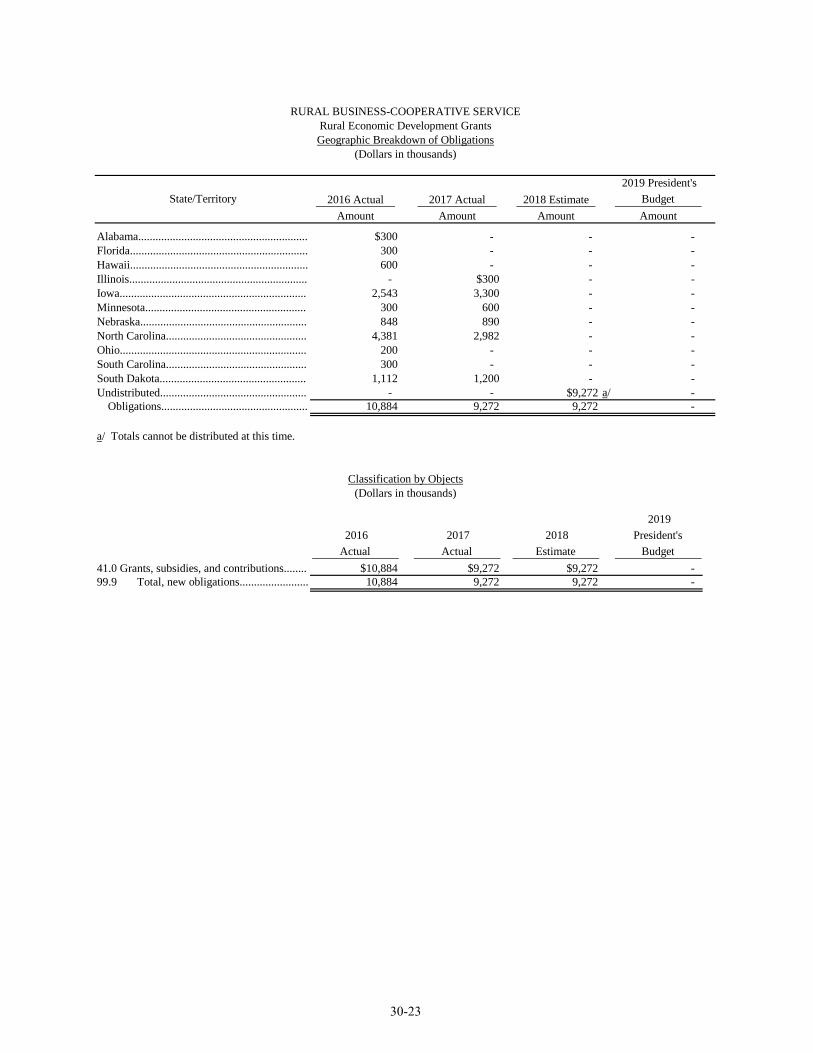
RURAL BUSINESS-COOPERATIVE SERVICE Rural Economic Development Grants Geographic Breakdown of Obligations
(Dollars in thousands)
2019 President's State/Territory 2016 Actual 2017 Actual 2018 Estimate Budget
Amount Amount Amount Amount
Alabama........................................................... $300 - - -Florida.............................................................. 300 - - -Hawaii.............................................................. 600 - - -Illinois.............................................................. - $300 - -Iowa................................................................. 2,543 3,300 - -Minnesota........................................................ 300 600 - -Nebraska.......................................................... 848 890 - -North Carolina................................................. 4,381 2,982 - -Ohio................................................................. 200 - - -South Carolina................................................. 300 - - -South Dakota................................................... 1,112 1,200 - -Undistributed................................................... - - $9,272 a/ -Obligations................................................... 10,884 9,272 9,272 -
a/ Totals cannot be distributed at this time.
Classification by Objects (Dollars in thousands)
41.0 Grants, subsidies, and contributions........ 99.9 Total, new obligations........................
2016 Actual
$10,884 10,884
2017 Actual
$9,272 9,272
2018 Estimate
$9,2729,272
2019 President's Budget
--
30-23
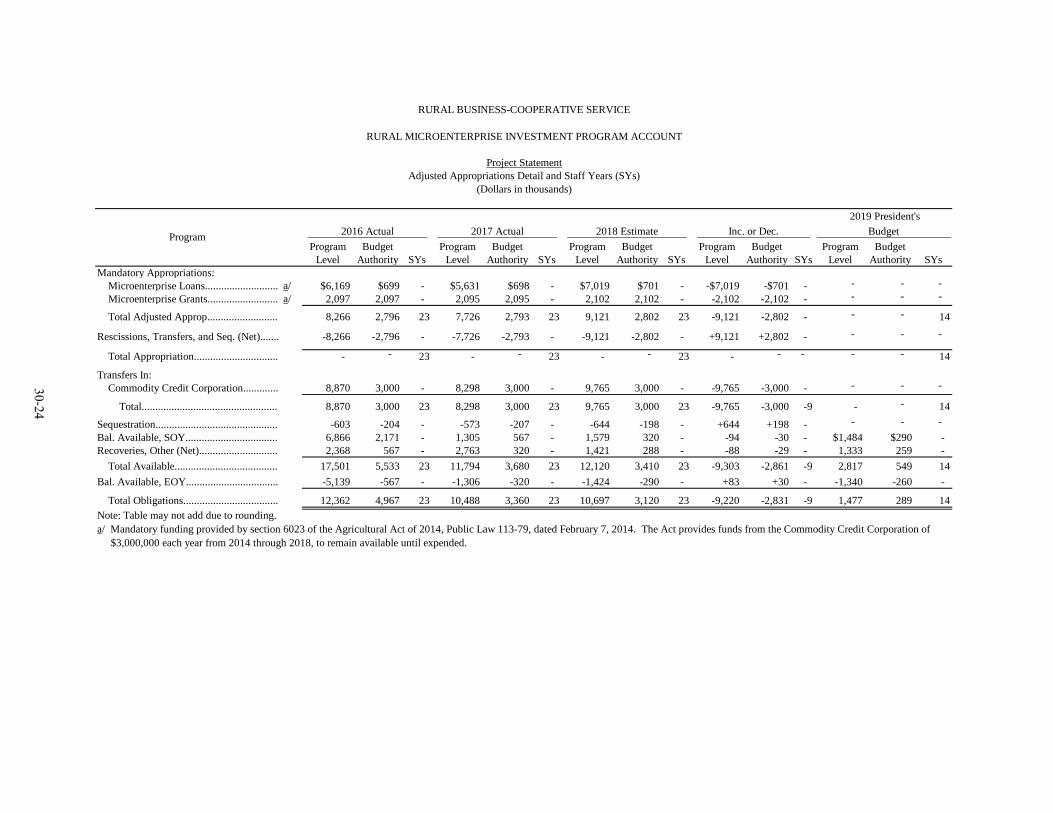
RURAL BUSINESS-COOPERATIVE SERVICE
RURAL MICROENTERPRISE INVESTMENT PROGRAM ACCOUNT
Project Statement Adjusted Appropriations Detail and Staff Years (SYs)
(Dollars in thousands)
2019 President's 2016 Actual 2017 Actual 2018 Estimate Inc. or Dec. Budget Program
Program Budget Program Budget Program Budget Program Budget Program Budget Level Authority SYs Level Authority SYs Level Authority SYs Level Authority SYs Level Authority SYs
Mandatory Appropriations: Microenterprise Loans........................... a/ $6,169 $699 - $5,631 $698 - $7,019 $701 - -$7,019 -$701 - - - -Microenterprise Grants.......................... a/ 2,097 2,097 - 2,095 2,095 - 2,102 2,102 - -2,102 -2,102 - - - -
Total Adjusted Approp.......................... 8,266 2,796 23 7,726 2,793 23 9,121 2,802 23 -9,121 -2,802 - - - 14
Rescissions, Transfers, and Seq. (Net)....... -8,266 -2,796 - -7,726 -2,793 - -9,121 -2,802 - +9,121 +2,802 - - - -
30-24
Total Appropriation............................... - - 23 - - 23 - - 23 - - - - - 14
Transfers In: Commodity Credit Corporation............. 8,870 3,000 - 8,298 3,000 - 9,765 3,000 - -9,765 -3,000 - - - -
Total.................................................. 8,870 3,000 23 8,298 3,000 23 9,765 3,000 23 -9,765 -3,000 -9 - - 14
Sequestration............................................. -603 -204 - -573 -207 - -644 -198 - +644 +198 - - - -Bal. Available, SOY.................................. 6,866 2,171 - 1,305 567 - 1,579 320 - -94 -30 - $1,484 $290 -Recoveries, Other (Net)............................. 2,368 567 - 2,763 320 - 1,421 288 - -88 -29 - 1,333 259 -Total Available...................................... 17,501 5,533 23 11,794 3,680 23 12,120 3,410 23 -9,303 -2,861 -9 2,817 549 14
Bal. Available, EOY.................................. -5,139 -567 - -1,306 -320 - -1,424 -290 - +83 +30 - -1,340 -260 -
Total Obligations................................... 12,362 4,967 23 10,488 3,360 23 10,697 3,120 23 -9,220 -2,831 -9 1,477 289 14 Note: Table may not add due to rounding.a/ Mandatory funding provided by section 6023 of the Agricultural Act of 2014, Public Law 113-79, dated February 7, 2014. The Act provides funds from the Commodity Credit Corporation of $3,000,000 each year from 2014 through 2018, to remain available until expended.
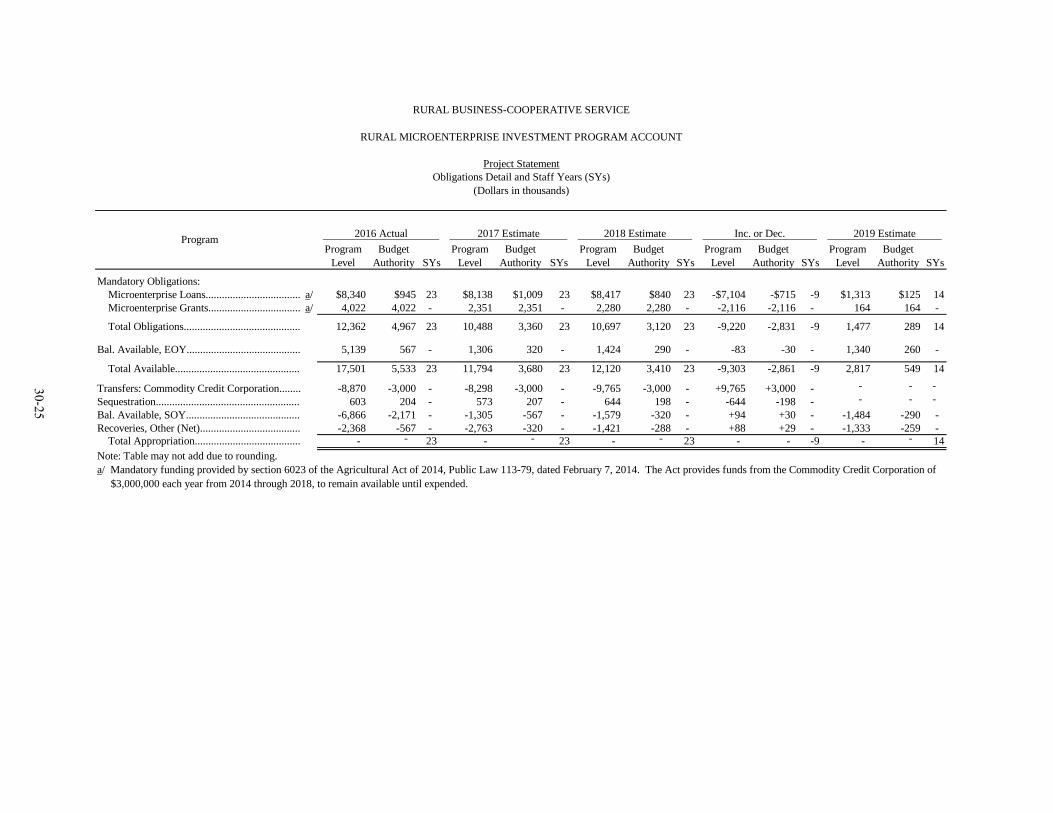
RURAL BUSINESS-COOPERATIVE SERVICE
RURAL MICROENTERPRISE INVESTMENT PROGRAM ACCOUNT
Project Statement Obligations Detail and Staff Years (SYs)
(Dollars in thousands)
2016 Actual 2017 Estimate 2018 Estimate Inc. or Dec. 2019 Estimate Program Program Budget Program Budget Program Budget Program Budget Program Budget Level Authority SYs Level Authority SYs Level Authority SYs Level Authority SYs Level Authority SYs
Mandatory Obligations: Microenterprise Loans................................... a/ $8,340 $945 23 $8,138 $1,009 23 $8,417 $840 23 -$7,104 -$715 -9 $1,313 $125 14 Microenterprise Grants.................................. a/ 4,022 4,022 - 2,351 2,351 - 2,280 2,280 - -2,116 -2,116 - 164 164 -
Total Obligations........................................... 12,362 4,967 23 10,488 3,360 23 10,697 3,120 23 -9,220 -2,831 -9 1,477 289 14
Bal. Available, EOY.......................................... 5,139 567 - 1,306 320 - 1,424 290 - -83 -30 - 1,340 260 -
30-25
Total Available.............................................. 17,501 5,533 23 11,794 3,680 23 12,120 3,410 23 -9,303 -2,861 -9 2,817 549 14
Transfers: Commodity Credit Corporation........ -8,870 -3,000 - -8,298 -3,000 - -9,765 -3,000 - +9,765 +3,000 - - - -Sequestration..................................................... 603 204 - 573 207 - 644 198 - -644 -198 - - - -Bal. Available, SOY.......................................... -6,866 -2,171 - -1,305 -567 - -1,579 -320 - +94 +30 - -1,484 -290 -Recoveries, Other (Net)..................................... -2,368 -567 - -2,763 -320 - -1,421 -288 - +88 +29 - -1,333 -259 -Total Appropriation....................................... - - 23 - - 23 - - 23 - - -9 - - 14
Note: Table may not add due to rounding.a/ Mandatory funding provided by section 6023 of the Agricultural Act of 2014, Public Law 113-79, dated February 7, 2014. The Act provides funds from the Commodity Credit Corporation of $3,000,000 each year from 2014 through 2018, to remain available until expended.
RURAL BUSINESS-COOPERATIVE SERVICE Mandatory Rural Microentrepreneur Assistance Program Direct Loans
Geographic Breakdown of Obligations (Dollars in thousands)
2019 President's State/Territory 2016 Actual 2017 Actual 2018 Estimate Budget
Amount Amount Amount Amount Arizona............................... $550 $500 - -Arkansas............................. - 500 - -California............................ - 1,400 - -Hawaii................................. 900 - - -Kentucky............................. 500 - - -Maine.................................. 500 - - -Maryland............................. - 1,000 - -Michigan............................. 900 - - -Montana.............................. - 250 - -Nebraska............................. 250 500 - -New Hampshire.................. - 150 - -North Carolina.................... 1,400 900 - -Ohio.................................... 400 - - -Oklahoma........................... 500 - - -Oregon................................ 840 688 - -Pennsylvania....................... 100 - - -South Carolina.................... - 450 - -Tennessee........................... - 400 - -Vermont.............................. 900 1,400 - -Washington......................... 100 - - -Puerto Rico......................... 500 - - -Undistributed...................... - - $8,417 a/ $1,313 a/ Obligations...................... 8,340 8,138 8,417 1,313
a/ Totals cannot be distributed at this time.
30-26

RURAL BUSINESS-COOPERATIVE SERVICE Mandatory Rural Microentrepreneur Assistance Program Grants
Geographic Breakdown of Obligations (Dollars in thousands)
2019 President's State/Territory 2016 Actual 2017 Actual 2018 Estimate Budget
Amount Amount Amount Amount Arizona.............................................................. Arkansas............................................................ California.......................................................... Delaware........................................................... Hawaii............................................................... Idaho................................................................. Illinois............................................................... Kansas............................................................... Kentucky........................................................... Maine................................................................ Maryland........................................................... Massachusetts................................................... Michigan........................................................... Minnesota.......................................................... Montana............................................................ Nebraska........................................................... Nevada.............................................................. New Hampshire................................................. New Jersey........................................................ North Carolina................................................... North Dakota..................................................... Ohio.................................................................. Oklahoma.......................................................... Oregon.............................................................. Pennsylvania..................................................... South Carolina................................................... South Dakota..................................................... Tennessee.......................................................... Vermont............................................................ Washington....................................................... West Virginia.................................................... Wisconsin.......................................................... Puerto Rico........................................................ Undistributed.....................................................
$151 -243 54 10070 88 25 89 449 229 209 127 104 133 194 77 -99401 55 41 100159 92 -98 -205 90 66170 105 -
$1336522728 -46341231196108803553451142638 -1972220 -14727438510028060 -99 --
- -- -- -- -- -- -- -- -- -- -- -- -- -- -- -- -- -- -- -- -- -- -- -- -- -- -- -- -- -- -- -- -- -
$2,280 a/ $164 a/ Obligations.................................................... 4,022 2,351 2,280 164
a/ Totals cannot be distributed at this time.
Classification by Objects (Dollars in thousands)
41.0 99.9
Grants, subsidies, and contributions......... Total, new obligations........................
2016 Actual
$4,967 4,967
2017 Actual
$3,360 3,360
2018 Estimate
$3,120 3,120
2019 President's Budget
$289 289
NOTE: Amounts include mandatory funding.
30-27
RURAL BUSINESS-COOPERATIVE SERVICE
BIOREFINERY ASSISTANCE PROGRAM ACCOUNT
Project Statement Adjusted Appropriations Detail and Staff Years (SYs)
(Dollars in thousands)
2019 President's 2016 Actual 2017 Actual 2018 Estimate Inc. or Dec. Budget
Program Program Budget Program Budget Program Budget Program Budget Program Budget Level Authority SYs Level Authority SYs Level Authority SYs Level Authority SYs Level Authority SYs
Mandatory Appropriations: Guaranteed biorefinery loans.................... a/ $207,850 $46,600 16 - - 16 - - 16 - - -6 - - 10
Total Adjusted Approp............................. 207,850 46,600 16 - - 16 - - 16 - - -6 - - 10 Rescissions, Transfers, and Seq. (Net) ......................................... -207,850 -46,600 - - - - - - - - - - - - -
30-28
Total Appropriation.................................. - - 16 - - 16 - - 16 - - -6 - - 10 Transfers In: Commodity Credit Corporation................ 223,015 50,000 - - - - $110,186 $23,403 - -$110,186 -$23,403 - - - -Commodity Credit Corporation................ 72,926 16,350 - - - - 92,279 19,600 - -92,279 -19,600 - - - -Total..................................................... 295,941 66,350 - - - - 202,465 43,003 - -202,465 -43,003 - - - -
Sequestration................................................ -15,165 -3,400 - - - - - - - - - - - - -Discretionary block on S&E funds................ b/c/ -87,421 -19,600 - -$111,247 -$23,150 - - - - - - - - - -
Bal. Available, SOY...................................... 553,526 124,100 - 705,218 174,150 - 431,411 91,632 - -97,935 -20,801 - $333,476 $70,830 -Recoveries, Other (Net)............................ 116,106 6,700 - - - - - - - - - - - - -
Total Available......................................... 862,986 174,150 16 593,972 151,000 16 633,876 134,635 16 -300,400 -63,805 -6 333,476 70,830 10
Bal. Available, EOY..................................... -862,986 -174,150 - -272,392 -91,632 - -333,476 -70,830 - - - - -333,476 -70,830 -
Total Obligations...................................... - - 16 321,580 59,368 16 300,400 63,805 16 -300,400 -63,805 -6 - - 10
a/ Mandatory funding provided by section 9003 of the Agricultural Act of 2014, Public Law 113-79, dated February 7, 2014. The Act provides funds from the Commodity Credit Corporation of $100,000,000 for 2014, $50,000,000 for both 2015 and 2016, to remain available until expended.
b/ Consolidated Appropriations Act, 2016, PL 114-113, dated December, 18, 2015, GP 714(4) blocks S&E to be spent to run the program in excess of $27,000,000 of the funding appropriated for the program for 2016.
c/ Consolidated Appropriations Act, 2017, PL 115-31, dated May, 5, 2017, GP 714(4) blocks S&E to be spent to run the program in excess of $151,000,000 of the funding available for the program for 2017.
RURAL BUSINESS-COOPERATIVE SERVICE
BIOREFINERY ASSISTANCE PROGRAM ACCOUNT
Project Statement Obligations Detail and Staff Years (SYs)
(Dollars in thousands)
2019 President's 2016 Actual 2017 Actual 2018 Estimate Inc. or Dec. Budget
Program Program Budget Program Budget Program Budget Program Budget Program Budget Level Authority SYs Level Authority SYs Level Authority SYs Level Authority SYs Level Authority SYs
Mandatory Obligations: Guaranteed biorefinery loans.................... a/ - - 16 $321,580 $59,368 16 $300,400 $63,805 16 -$300,400 -$63,805 -6 - - 10
Total Obligations...................................... - - 16 321,580 59,368 16 300,400 63,805 16 -300,400 -63,805 -6 - - 10
Bal. Available, EOY................................. $862,986 $174,150 - 272,392 91,632 - 333,476 70,830 - - - - $333,476 $70,830 -
30-29
Total Available....................................... 862,986 174,150 16 593,972 151,000 16 633,876 134,635 16 -300,400 -63,805 -6 333,476 70,830 10
Transfers In:.................................................. -295,941 -66,350 - - - - -202,465 -43,003 - +202,465 +43,003 - - - -
Sequestration................................................. 15,165 3,400 - - - - - - - - - - - - -Discretionary block on S&E funds................ b/c/ 87,421 19,600 - 111,247 23,150 - - - - - - - - - -Bal. Available, SOY...................................... -553,526 -124,100 - -705,218 -174,150 - -431,411 -91,632 - +97,935 +20,801 - -333,476 -70,830 -Recoveries, Other (Net)................................ -116,106 -6,700 - - - - - - - - - - - - -
Total Appropriation............................... - - 16 - - 16 - - 16 - - -6 - - 10
a/ Mandatory funding provided by section 9003 of the Agricultural Act of 2014, Public Law 113-79, dated February 7, 2014. The Act provides funds from the Commodity Credit Corporation of $100,000,000 for 2014, $50,000,000 for both 2015 and 2016, to remain available until expended.
b/ Consolidated Appropriations Act, 2016, PL 114-113, dated December, 18, 2015, GP 714(4) blocks S&E to be spent to run the program in excess of $27,000,000 of the funding appropriated for the program for 2016.
c/ Consolidated Appropriations Act, 2017, PL 115-31, dated May, 5, 2017, GP 714(4) blocks S&E to be spent to run the program in excess of $151,000,000 of the funding available for the program for 2017.
RURAL BUSINESS-COOPERATIVE SERVICE Mandatory Guaranteed Biorefinery Loans Geographic Breakdown of Obligations
(Dollars in thousands)
2019 President's State/Territory 2016 Actual 2017 Actual 2018 Estimate Budget
Amount Amount Amount Amount
Nevada.................................................................... - $310,580 - -Oregon.................................................................... - 11,000 - -Undistributed.......................................................... - - $300,400 a/ - Obligations.......................................................... - 321,580 300,400 -
a/ Totals cannot be distributed at this time.
(Dollars in thousands) Classification by Objects
41.0 Grants, subsidies, and contributions.........
99.9 Total, new obligations.......................
2016 Actual
-
-
2017 Actual $59,368
59,368
2018 Estimate
$63,805
63,805
2019 President's Budget
-
-
30-30

RURAL BUSINESS-COOPERATIVE SERVICE
ENERGY ASSISTANCE PAYMENTS
Project Statement Adjusted Appropriation Detail and Staff Years (SYs)
(Dollars in thousands)
2019 President's Program 2016 Actual 2017 Actual 2018 Estimate Inc. or Dec. Budget
Amount SYs Amount SYs Amount SYs Amount SYs Amount SYs Mandatory Appropriations: Repowering assistance payments................................. a/ - - - - -Bioenergy program for advanced biofuel payments.... a/ $13,980 2 $13,965 2 $14,010 2 -$14,010 -1 - 1
30-31
Total Adjusted Approp................................................ 13,980 2 13,965 2 14,010 2 -14,010 -1 - 1
Rescissions, Transfers, and Seq. (Net).............................................................. -13,980 - -13,965 - -14,010 - +14,010 - - -
Total Appropriation................................................. - 2 - 2 - 2 -14,010 -1 - 1
Transfers In: Commodity Credit Corporation................................... 15,000 - 15,000 - 15,000 - -15,000 - - -Total......................................................................... 15,000 - 15,000 - 15,000 - -15,000 - - -
Sequestration................................................................... -1,020 - -1,035 - -990 - +990 - - -Bal. Available, SOY........................................................ 9,298 - 11,208 - 14,440 - -2,760 - $11,679 -Recoveries, Other (Net).................................................. 2,031 - 3,057 - - - - - - -
Total Available............................................................ 25,309 2 28,230 2 28,450 2 -16,770 -1 11,679
Bal. Available, EOY....................................................... -11,208 - -14,440 - -11,679 - +11,679 - - -
Total Obligations......................................................... 14,101 2 13,791 2 16,770 2 -5,091 -1 11,679 Note: Table may not add due to rounding. a/ Mandatory funding provided by section 9005 of the Agricultural Act of 2014, Public Law 113-79, dated February 7, 2014. The Act provides funds from the Commodity Credit Corporation of $15,000,000 for 2014 through 2018, to remain available until expended.
1
1
RURAL BUSINESS-COOPERATIVE SERVICE
ENERGY ASSISTANCE PAYMENTS
Project Statement Obligations Detail and Staff Years (SYs)
(Dollars in thousands)
2019 President's Program 2016 Actual 2017 Actual 2018 Estimate Inc. or Dec. Budget
Amount SYs Amount SYs Amount SYs Amount Amount SYs Mandatory Obligations: Repowering assistance payments...................................... a/ - - - - $5,018 - -$5,018 - - Bioenergy program for advanced biofuels payments a/ $14,101 2 $13,791 2 11,752 2 -73 $11,679 1
Subtotal......................................................................... 14,101 2 13,791 2 16,770 2 -5,091 11,679 1
30-32
Total Obligations.................................................................. 14,101 2 13,791 2 16,770 2 -5,091 11,679 1
Bal. Available, EOY............................................................. 11,208 - 14,440 - 11,679 - -11,679 - -
Total Available.................................................................. 25,309 2 28,230 2 28,450 2 -16,770 +11,679 1 Transfers In: Commodity Credit Corporation.......................................... -15,000 - -15,000 - -15,000 - +15,000 - - Total............................................................................... -15,000 - -15,000 - -15,000 - +15,000 - -
Sequestration........................................................................ 1,020 - 1,035 - 990 - -990 - -
Bal. Available, SOY............................................................. -9,298 - -11,208 - -14,440 - +2,760 -11,679 -Recoveries, Other (Net)........................................................ -2,031 - -3,057 - - - - - -
Total Appropriation........................................................... - 2 - 2 - 2 - - 1 Note: Table may not add due to rounding. a/ Mandatory funding provided by section 9005 of the Agricultural Act of 2014, Public Law 113-79, dated February 7, 2014. The Act provides funds from the Commodity Credit Corporation of $15,000,000 for 2014 through 2018, to remain available until expended.
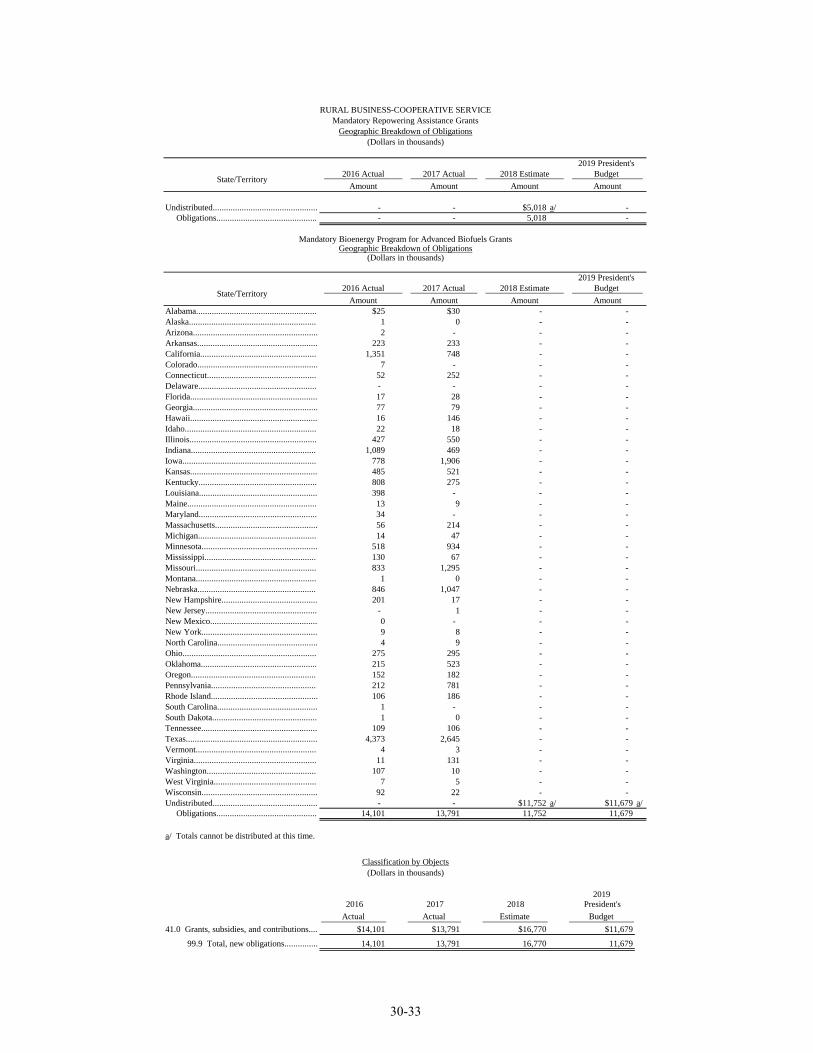
RURAL BUSINESS-COOPERATIVE SERVICE Mandatory Repowering Assistance Grants Geographic Breakdown of Obligations
(Dollars in thousands)
2019 President's 2016 Actual 2017 Actual 2018 Estimate Budget State/Territory Amount Amount Amount Amount
Undistributed............................................... - - $5,018 a/ -Obligations............................................. - - 5,018 -
Mandatory Bioenergy Program for Advanced Biofuels Grants Geographic Breakdown of Obligations
(Dollars in thousands)
2019 President's 2016 Actual 2017 Actual 2018 Estimate Budget State/Territory Amount Amount Amount Amount
Alabama...................................................... $25 $30 - -Alaska......................................................... 1 0 - -Arizona........................................................ 2 - - -Arkansas...................................................... 223 233 - -California.................................................... 1,351 748 - -Colorado...................................................... 7 - - -Connecticut................................................. 52 252 - -Delaware..................................................... - - - -Florida......................................................... 17 28 - -Georgia........................................................ 77 79 - -Hawaii......................................................... 16 146 - -Idaho........................................................... 22 18 - -Illinois......................................................... 427 550 - -Indiana........................................................ 1,089 469 - -Iowa............................................................ 778 1,906 - -Kansas......................................................... 485 521 - -Kentucky..................................................... 808 275 - -Louisiana..................................................... 398 - - -Maine.......................................................... 13 9 - -Maryland..................................................... 34 - - -Massachusetts.............................................. 56 214 - -Michigan..................................................... 14 47 - -Minnesota.................................................... 518 934 - -Mississippi.................................................. 130 67 - -Missouri...................................................... 833 1,295 - -Montana...................................................... 1 0 - -Nebraska..................................................... 846 1,047 - -New Hampshire........................................... 201 17 - -New Jersey.................................................. - 1 - -New Mexico................................................ 0 - - -New York.................................................... 9 8 - -North Carolina............................................. 4 9 - -Ohio............................................................ 275 295 - -Oklahoma.................................................... 215 523 - -Oregon........................................................ 152 182 - -Pennsylvania............................................... 212 781 - -Rhode Island................................................ 106 186 - -South Carolina............................................. 1 - - -South Dakota............................................... 1 0 - -Tennessee.................................................... 109 106 - -Texas........................................................... 4,373 2,645 - -Vermont...................................................... 4 3 - -Virginia....................................................... 11 131 - -Washington................................................. 107 10 - -West Virginia.............................................. 7 5 - -Wisconsin.................................................... 92 22 - -Undistributed............................................... - - $11,752 a/ $11,679 a/ Obligations............................................. 14,101 13,791 11,752 11,679
a/ Totals cannot be distributed at this time.
Classification by Objects (Dollars in thousands)
2019 2016 2017 2018 President's Actual Actual Estimate Budget
41.0 Grants, subsidies, and contributions.... $14,101 $13,791 $16,770 $11,679
99.9 Total, new obligations............... 14,101 13,791 16,770 11,679
30-33
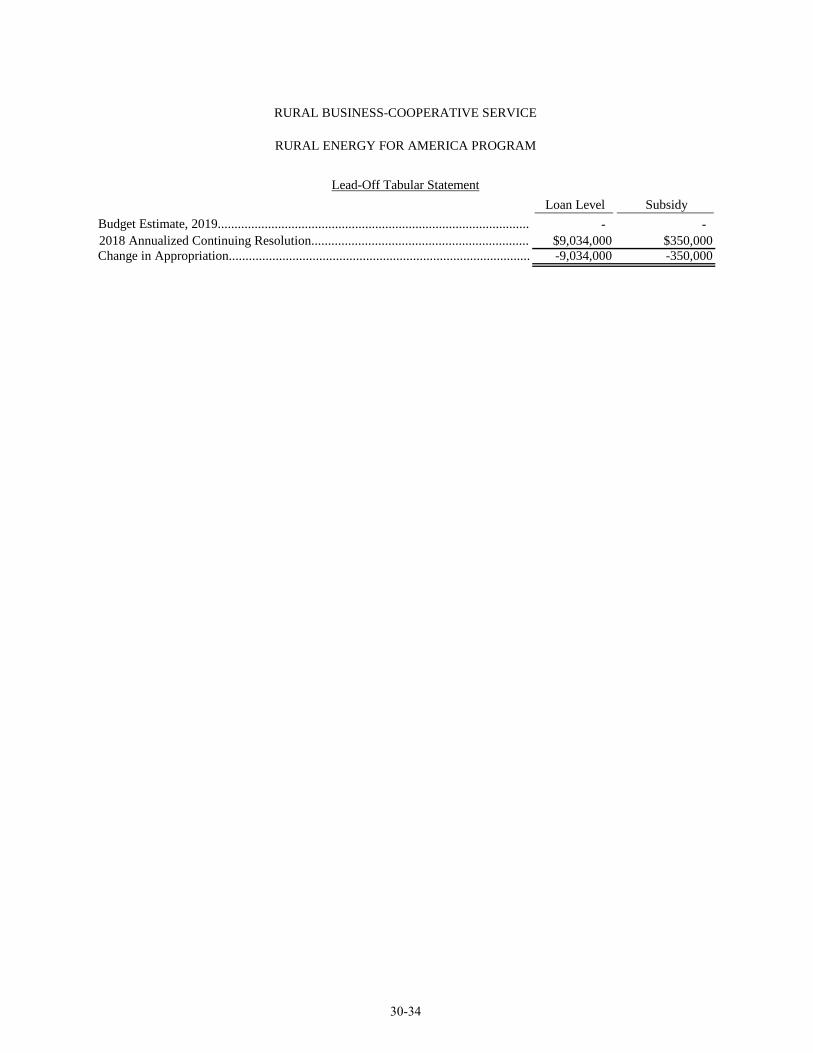
RURAL BUSINESS-COOPERATIVE SERVICE
RURAL ENERGY FOR AMERICA PROGRAM
Lead-Off Tabular Statement
Budget Estimate, 2019............................................................................................. 2018 Annualized Continuing Resolution................................................................. Change in Appropriation..........................................................................................
Loan Level-
$9,034,000 -9,034,000
Subsidy -
$350,000 -350,000
30-34
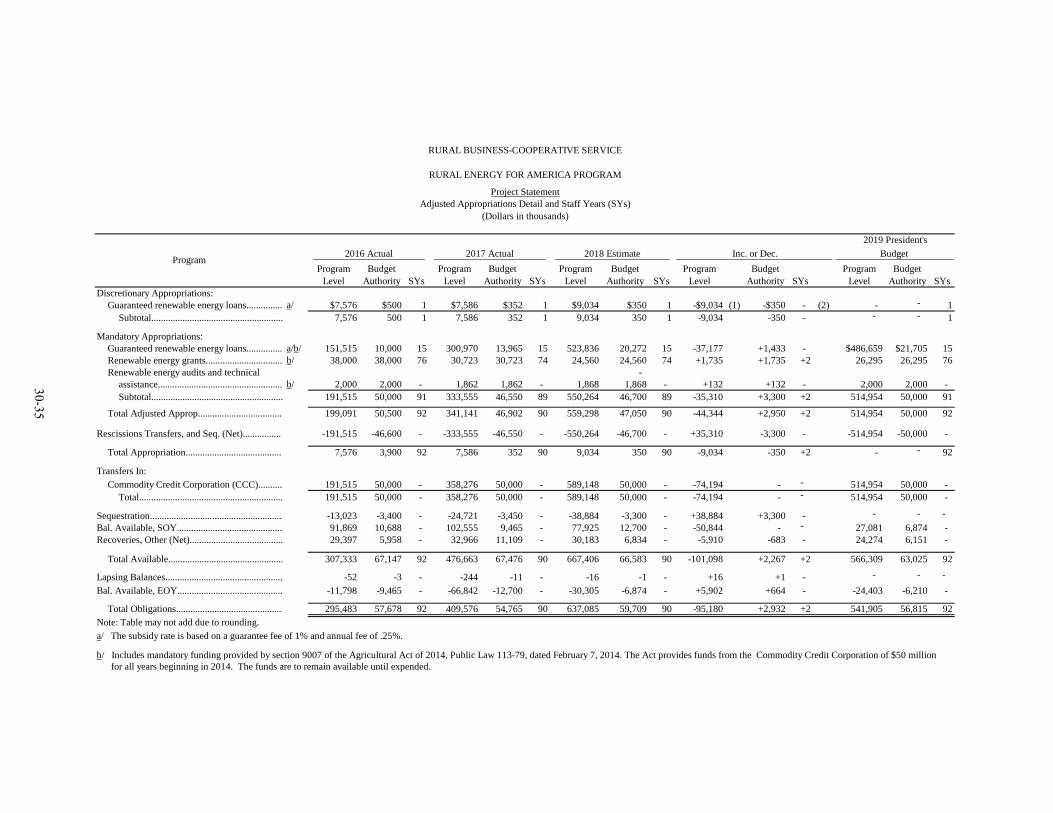
30-35
RURAL BUSINESS-COOPERATIVE SERVICE
RURAL ENERGY FOR AMERICA PROGRAM
Project Statement Adjusted Appropriations Detail and Staff Years (SYs)
(Dollars in thousands)
2019 President's 2016 Actual 2017 Actual 2018 Estimate Inc. or Dec. Budget Program
Program Budget Program Budget Program Budget Program Budget Program Budget Level Authority SYs Level Authority SYs Level Authority SYs Level Authority SYs Level Authority SYs
Discretionary Appropriations: Guaranteed renewable energy loans............... a/ $7,576 $500 1 $7,586 $352 1 $9,034 $350 1 -$9,034 (1) -$350 - (2) - - 1 Subtotal....................................................... 7,576 500 1 7,586 352 1 9,034 350 1 -9,034 -350 - - - 1
Mandatory Appropriations: Guaranteed renewable energy loans............... a/b/ 151,515 10,000 15 300,970 13,965 15 523,836 20,272 15 -37,177 +1,433 - $486,659 $21,705 15 Renewable energy grants................................ b/ 38,000 38,000 76 30,723 30,723 74 24,560 24,560 74 +1,735 +1,735 +2 26,295 26,295 76 Renewable energy audits and technical -assistance.................................................... b/ 2,000 2,000 - 1,862 1,862 - 1,868 1,868 - +132 +132 - 2,000 2,000 -Subtotal....................................................... 191,515 50,000 91 333,555 46,550 89 550,264 46,700 89 -35,310 +3,300 +2 514,954 50,000 91
Total Adjusted Approp................................... 199,091 50,500 92 341,141 46,902 90 559,298 47,050 90 -44,344 +2,950 +2 514,954 50,000 92
Rescissions Transfers, and Seq. (Net)................ -191,515 -46,600 - -333,555 -46,550 - -550,264 -46,700 - +35,310 -3,300 - -514,954 -50,000 -
Total Appropriation........................................ 7,576 3,900 92 7,586 352 90 9,034 350 90 -9,034 -350 +2 - - 92
Transfers In: Commodity Credit Corporation (CCC).......... 191,515 50,000 - 358,276 50,000 - 589,148 50,000 - -74,194 - - 514,954 50,000 -Total............................................................ 191,515 50,000 - 358,276 50,000 - 589,148 50,000 - -74,194 - - 514,954 50,000 -
Sequestration....................................................... -13,023 -3,400 - -24,721 -3,450 - -38,884 -3,300 - +38,884 +3,300 - - - -Bal. Available, SOY............................................ 91,869 10,688 - 102,555 9,465 - 77,925 12,700 - -50,844 - - 27,081 6,874 -Recoveries, Other (Net)....................................... 29,397 5,958 - 32,966 11,109 - 30,183 6,834 - -5,910 -683 - 24,274 6,151 -
Total Available................................................ 307,333 67,147 92 476,663 67,476 90 667,406 66,583 90 -101,098 +2,267 +2 566,309 63,025 92
Lapsing Balances................................................. -52 -3 - -244 -11 - -16 -1 - +16 +1 - - - -Bal. Available, EOY............................................ -11,798 -9,465 - -66,842 -12,700 - -30,305 -6,874 - +5,902 +664 - -24,403 -6,210 -
Total Obligations............................................ 295,483 57,678 92 409,576 54,765 90 637,085 59,709 90 -95,180 +2,932 +2 541,905 56,815 92 Note: Table may not add due to rounding.a/ The subsidy rate is based on a guarantee fee of 1% and annual fee of .25%.
b/ Includes mandatory funding provided by section 9007 of the Agricultural Act of 2014, Public Law 113-79, dated February 7, 2014. The Act provides funds from the Commodity Credit Corporation of $50 million for all years beginning in 2014. The funds are to remain available until expended.
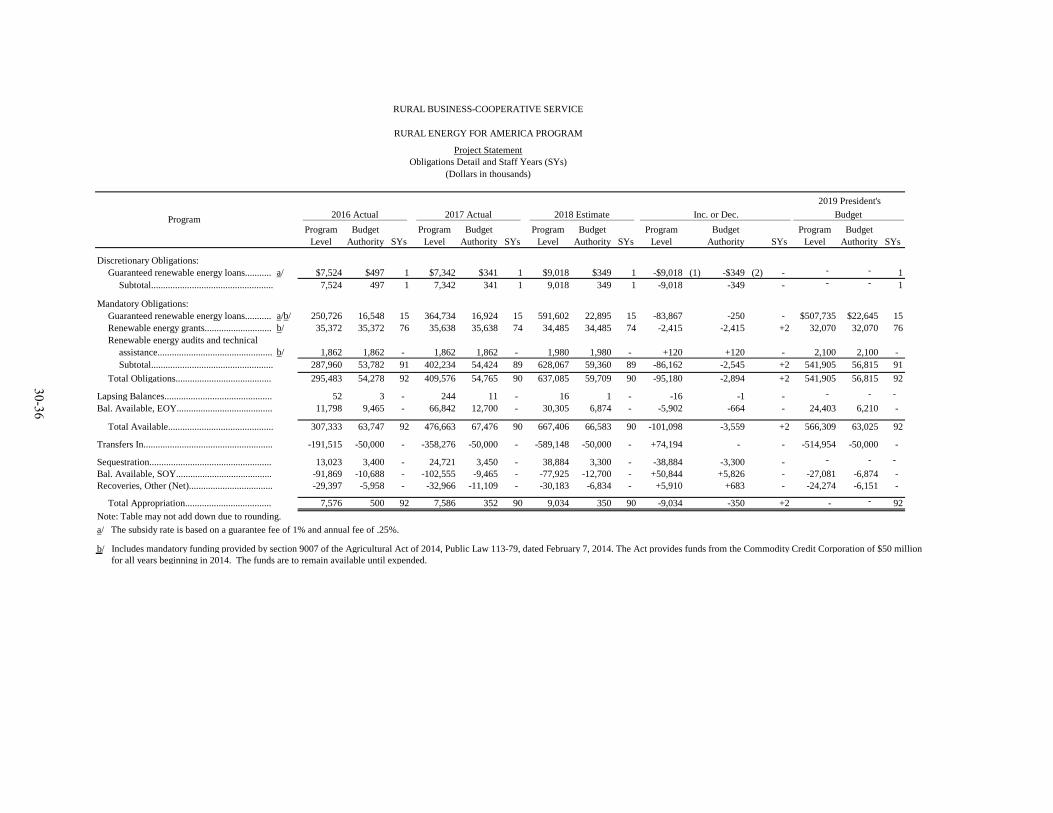
RURAL BUSINESS-COOPERATIVE SERVICE
RURAL ENERGY FOR AMERICA PROGRAM
Project Statement Obligations Detail and Staff Years (SYs)
(Dollars in thousands)
2019 President's 2016 Actual 2017 Actual 2018 Estimate Inc. or Dec. Budget Program
Program Budget Program Budget Program Budget Program Budget Program Budget Level Authority SYs Level Authority SYs Level Authority SYs Level Authority SYs Level Authority SYs
Discretionary Obligations: Guaranteed renewable energy loans........... a/ $7,524 $497 1 $7,342 $341 1 $9,018 $349 1 -$9,018 (1) -$349 (2) - - - 1 Subtotal................................................... 7,524 497 1 7,342 341 1 9,018 349 1 -9,018 -349 - - - 1
Mandatory Obligations: Guaranteed renewable energy loans........... a/b/ 250,726 16,548 15 364,734 16,924 15 591,602 22,895 15 -83,867 -250 - $507,735 $22,645 15 Renewable energy grants............................ b/ 35,372 35,372 76 35,638 35,638 74 34,485 34,485 74 -2,415 -2,415 +2 32,070 32,070 76 Renewable energy audits and technical assistance................................................ b/ 1,862 1,862 - 1,862 1,862 - 1,980 1,980 - +120 +120 - 2,100 2,100 -Subtotal................................................... 287,960 53,782 91 402,234 54,424 89 628,067 59,360 89 -86,162 -2,545 +2 541,905 56,815 91
30-36
Total Obligations........................................ 295,483 54,278 92 409,576 54,765 90 637,085 59,709 90 -95,180 -2,894 +2 541,905 56,815 92
Lapsing Balances............................................. 52 3 - 244 11 - 16 1 - -16 -1 - - - -Bal. Available, EOY........................................ 11,798 9,465 - 66,842 12,700 - 30,305 6,874 - -5,902 -664 - 24,403 6,210 -
Total Available............................................ 307,333 63,747 92 476,663 67,476 90 667,406 66,583 90 -101,098 -3,559 +2 566,309 63,025 92
Transfers In...................................................... -191,515 -50,000 - -358,276 -50,000 - -589,148 -50,000 - +74,194 - - -514,954 -50,000 -
Sequestration................................................... 13,023 3,400 - 24,721 3,450 - 38,884 3,300 - -38,884 -3,300 - - - -Bal. Available, SOY........................................ -91,869 -10,688 - -102,555 -9,465 - -77,925 -12,700 - +50,844 +5,826 - -27,081 -6,874 -Recoveries, Other (Net)................................... -29,397 -5,958 - -32,966 -11,109 - -30,183 -6,834 - +5,910 +683 - -24,274 -6,151 -
Total Appropriation.................................... 7,576 500 92 7,586 352 90 9,034 350 90 -9,034 -350 +2 - - 92 Note: Table may not add down due to rounding. a/ The subsidy rate is based on a guarantee fee of 1% and annual fee of .25%.
b/ Includes mandatory funding provided by section 9007 of the Agricultural Act of 2014, Public Law 113-79, dated February 7, 2014. The Act provides funds from the Commodity Credit Corporation of $50 million for all years beginning in 2014. The funds are to remain available until expended.
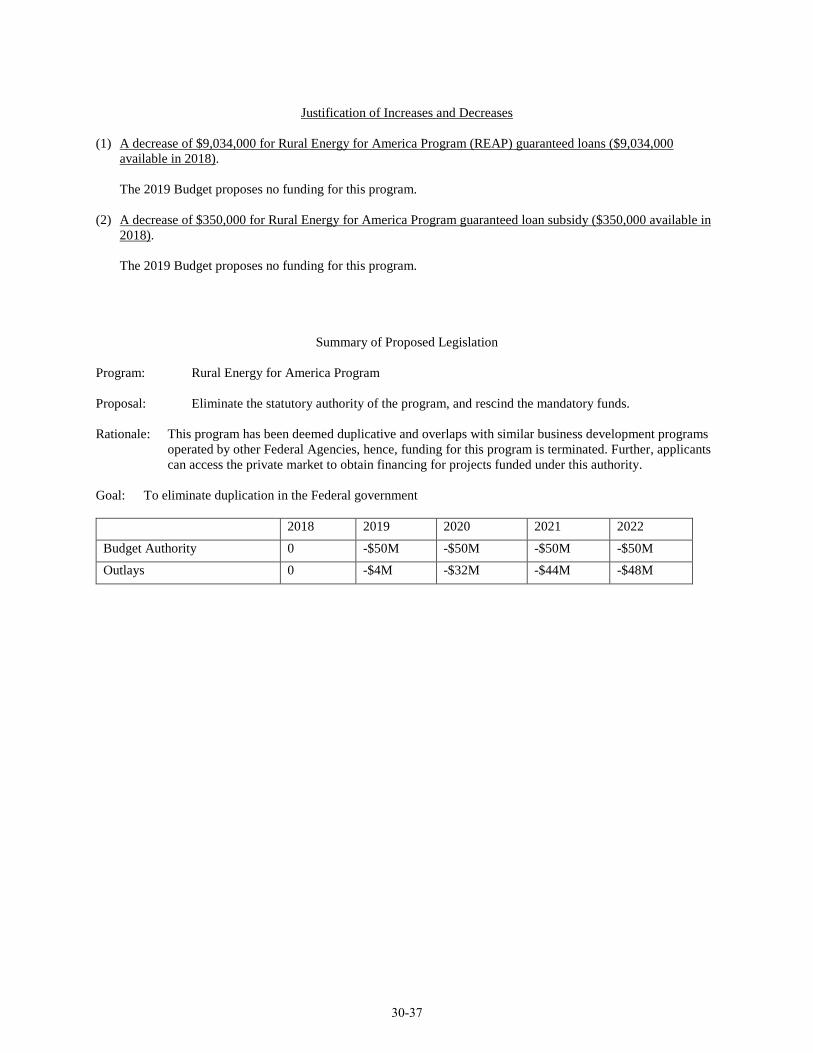
Justification of Increases and Decreases
(1) A decrease of $9,034,000 for Rural Energy for America Program (REAP) guaranteed loans ($9,034,000 available in 2018).
The 2019 Budget proposes no funding for this program.
(2) A decrease of $350,000 for Rural Energy for America Program guaranteed loan subsidy ($350,000 available in 2018).
The 2019 Budget proposes no funding for this program.
Summary of Proposed Legislation
Program: Rural Energy for America Program
Proposal: Eliminate the statutory authority of the program, and rescind the mandatory funds.
Rationale: This program has been deemed duplicative and overlaps with similar business development programs operated by other Federal Agencies, hence, funding for this program is terminated. Further, applicants can access the private market to obtain financing for projects funded under this authority.
Goal: To eliminate duplication in the Federal government
2018 2019 2020 2021 2022
Budget Authority 0 -$50M -$50M -$50M -$50M
Outlays 0 -$4M -$32M -$44M -$48M
30-37
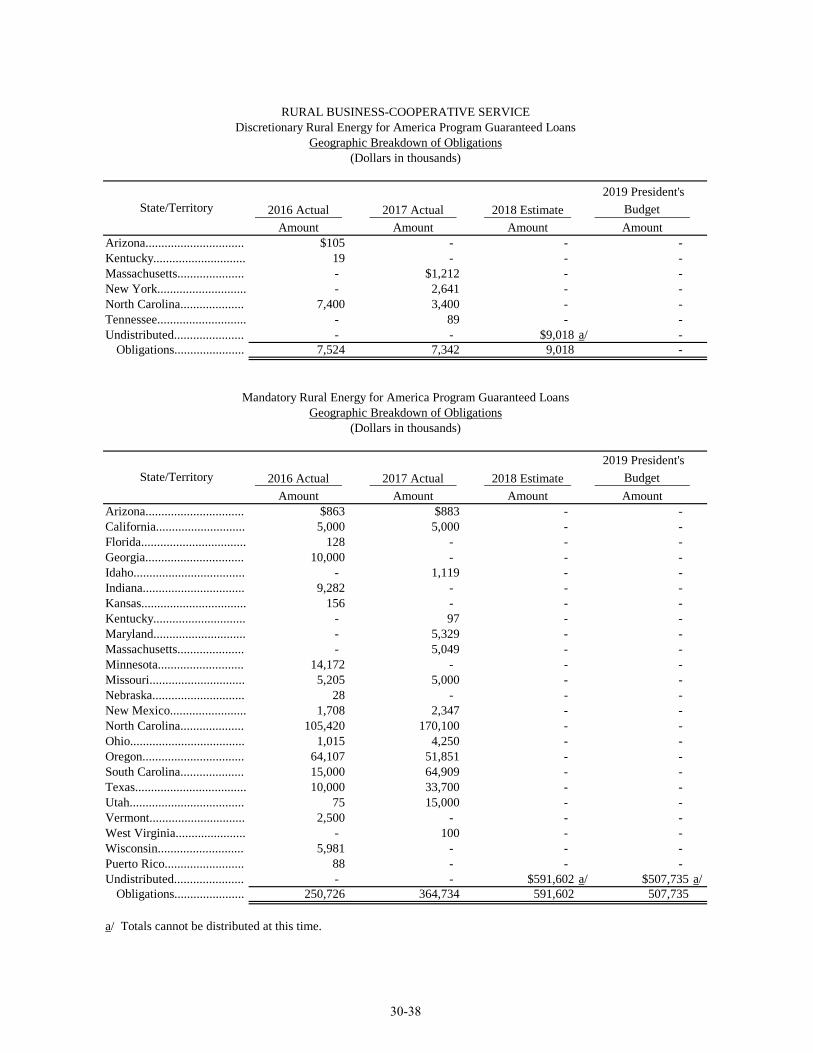
RURAL BUSINESS-COOPERATIVE SERVICE Discretionary Rural Energy for America Program Guaranteed Loans
Geographic Breakdown of Obligations (Dollars in thousands)
2019 President's State/Territory 2016 Actual 2017 Actual 2018 Estimate Budget
Amount Amount Amount Amount Arizona............................... $105 - - -Kentucky............................. 19 - - -Massachusetts..................... - $1,212 - -New York............................ - 2,641 - -North Carolina.................... 7,400 3,400 - -Tennessee............................ - 89 - -Undistributed...................... - - $9,018 a/ -Obligations...................... 7,524 7,342 9,018 -
Mandatory Rural Energy for America Program Guaranteed Loans Geographic Breakdown of Obligations
(Dollars in thousands)
2019 President's State/Territory 2016 Actual 2017 Actual 2018 Estimate Budget
Amount Amount Amount Amount Arizona............................... $863 $883 - -California............................ 5,000 5,000 - -Florida................................. 128 - - -Georgia............................... 10,000 - - -Idaho................................... - 1,119 - -Indiana................................ 9,282 - - -Kansas................................. 156 - - -Kentucky............................. - 97 - -Maryland............................. - 5,329 - -Massachusetts..................... - 5,049 - -Minnesota........................... 14,172 - - -Missouri.............................. 5,205 5,000 - -Nebraska............................. 28 - - -New Mexico........................ 1,708 2,347 - -North Carolina.................... 105,420 170,100 - -Ohio.................................... 1,015 4,250 - -Oregon................................ 64,107 51,851 - -South Carolina.................... 15,000 64,909 - -Texas................................... 10,000 33,700 - -Utah.................................... 75 15,000 - -Vermont.............................. 2,500 - - -West Virginia...................... - 100 - -Wisconsin........................... 5,981 - - -Puerto Rico......................... 88 - - -Undistributed...................... - - $591,602 a/ $507,735 a/ Obligations...................... 250,726 364,734 591,602 507,735
a/ Totals cannot be distributed at this time.
30-38
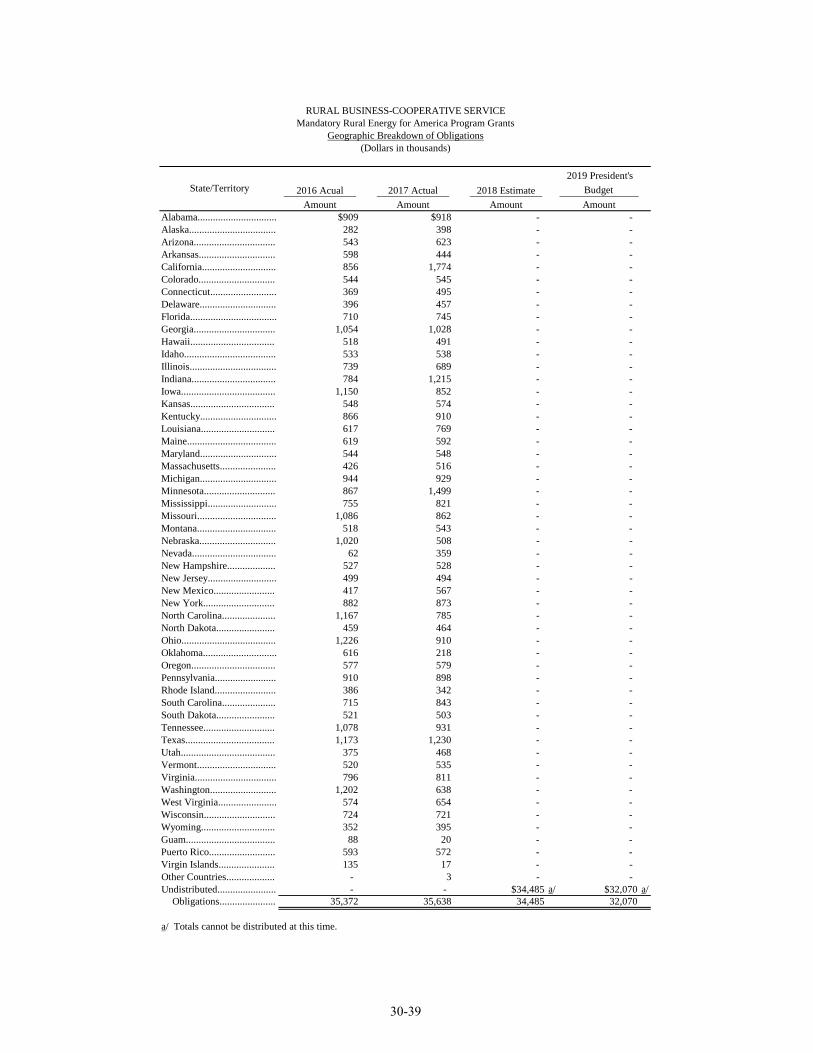
RURAL BUSINESS-COOPERATIVE SERVICE Mandatory Rural Energy for America Program Grants
Geographic Breakdown of Obligations (Dollars in thousands)
2019 President's State/Territory 2016 Acual 2017 Actual 2018 Estimate Budget
Amount Amount Amount Amount Alabama............................... $909 $918 - -Alaska.................................. 282 398 - -Arizona................................ 543 623 - -Arkansas.............................. 598 444 - -California............................. 856 1,774 - -Colorado.............................. 544 545 - -Connecticut.......................... 369 495 - -Delaware.............................. 396 457 - -Florida.................................. 710 745 - -Georgia................................ 1,054 1,028 - -Hawaii................................. 518 491 - -Idaho.................................... 533 538 - -Illinois.................................. 739 689 - -Indiana................................. 784 1,215 - -Iowa..................................... 1,150 852 - -Kansas................................. 548 574 - -Kentucky.............................. 866 910 - -Louisiana............................. 617 769 - -Maine................................... 619 592 - -Maryland.............................. 544 548 - -Massachusetts...................... 426 516 - -Michigan.............................. 944 929 - -Minnesota............................ 867 1,499 - -Mississippi........................... 755 821 - -Missouri............................... 1,086 862 - -Montana............................... 518 543 - -Nebraska.............................. 1,020 508 - -Nevada................................. 62 359 - -New Hampshire................... 527 528 - -New Jersey........................... 499 494 - -New Mexico........................ 417 567 - -New York............................ 882 873 - -North Carolina..................... 1,167 785 - -North Dakota....................... 459 464 - -Ohio..................................... 1,226 910 - -Oklahoma............................. 616 218 - -Oregon................................. 577 579 - -Pennsylvania........................ 910 898 - -Rhode Island........................ 386 342 - -South Carolina..................... 715 843 - -South Dakota....................... 521 503 - -Tennessee............................ 1,078 931 - -Texas................................... 1,173 1,230 - -Utah..................................... 375 468 - -Vermont............................... 520 535 - -Virginia................................ 796 811 - -Washington.......................... 1,202 638 - -West Virginia....................... 574 654 - -Wisconsin............................ 724 721 - -Wyoming............................. 352 395 - -Guam................................... 88 20 - -Puerto Rico.......................... 593 572 - -Virgin Islands...................... 135 17 - -Other Countries................... - 3 - -Undistributed....................... - - $34,485 a/ $32,070 a/ Obligations...................... 35,372 35,638 34,485 32,070
a/ Totals cannot be distributed at this time.
30-39
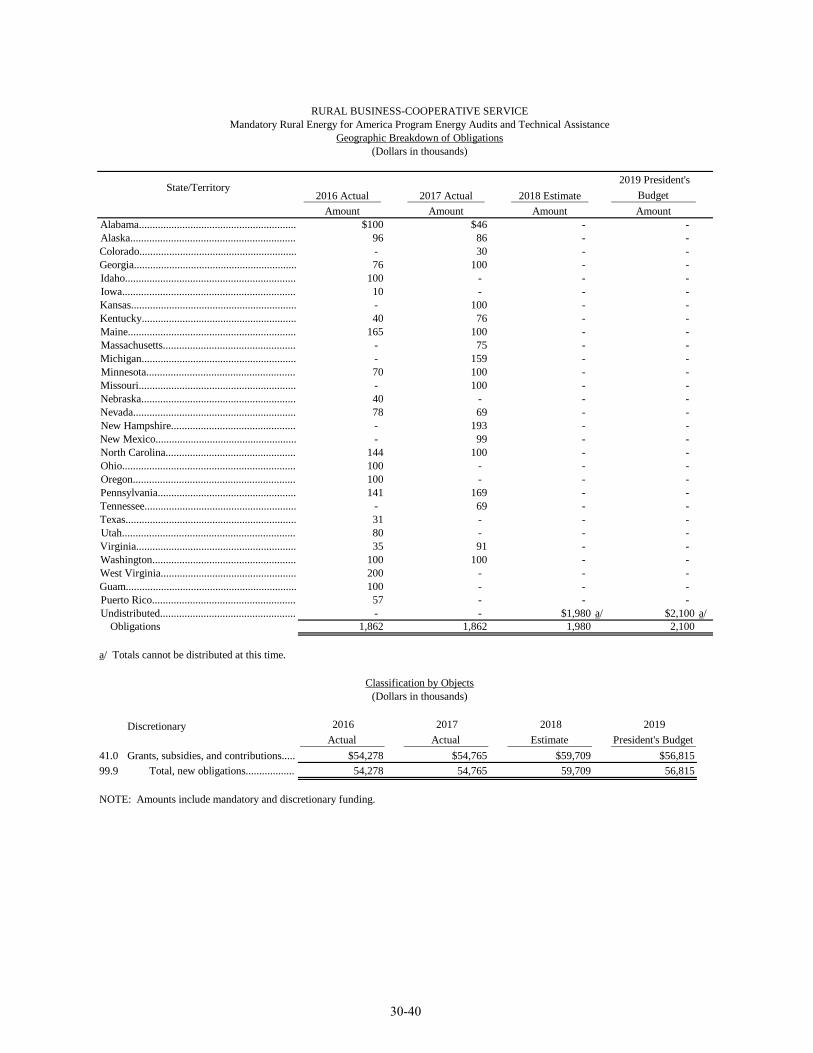
RURAL BUSINESS-COOPERATIVE SERVICE Mandatory Rural Energy for America Program Energy Audits and Technical Assistance
Geographic Breakdown of Obligations (Dollars in thousands)
2019 President'sState/Territory
2016 Actual 2017 Actual 2018 Estimate Budget Amount Amount Amount Amount
Alabama.......................................................... Alaska............................................................. Colorado.......................................................... Georgia............................................................ Idaho............................................................... Iowa................................................................ Kansas............................................................. Kentucky......................................................... Maine.............................................................. Massachusetts................................................. Michigan......................................................... Minnesota....................................................... Missouri.......................................................... Nebraska......................................................... Nevada............................................................ New Hampshire.............................................. New Mexico.................................................... North Carolina................................................ Ohio................................................................ Oregon............................................................ Pennsylvania................................................... Tennessee........................................................ Texas............................................................... Utah................................................................ Virginia........................................................... Washington..................................................... West Virginia.................................................. Guam............................................................... Puerto Rico..................................................... Undistributed..................................................
$100 96 -76 10010 -40 165 --70 -4078 --144 100100141 -318035 100 20010057 -
$468630100 --1007610075159100100 -6919399100 --16969 --91100 ----
- -- -- -- -- -- -- -- -- -- -- -- -- -- -- -- -- -- -- -- -- -- -- -- -- -- -- -- -- -
$1,980 a/ $2,100 a/ Obligations 1,862 1,862 1,980 2,100
a/ Totals cannot be distributed at this time.
Classification by Objects (Dollars in thousands)
41.0 99.9
Discretionary
Grants, subsidies, and contributions..... Total, new obligations..................
2016 Actual
$54,278 54,278
2017 Actual
$54,765 54,765
2018 Estimate
$59,709 59,709
2019 President's Budget
$56,815 56,815
NOTE: Amounts include mandatory and discretionary funding.
30-40
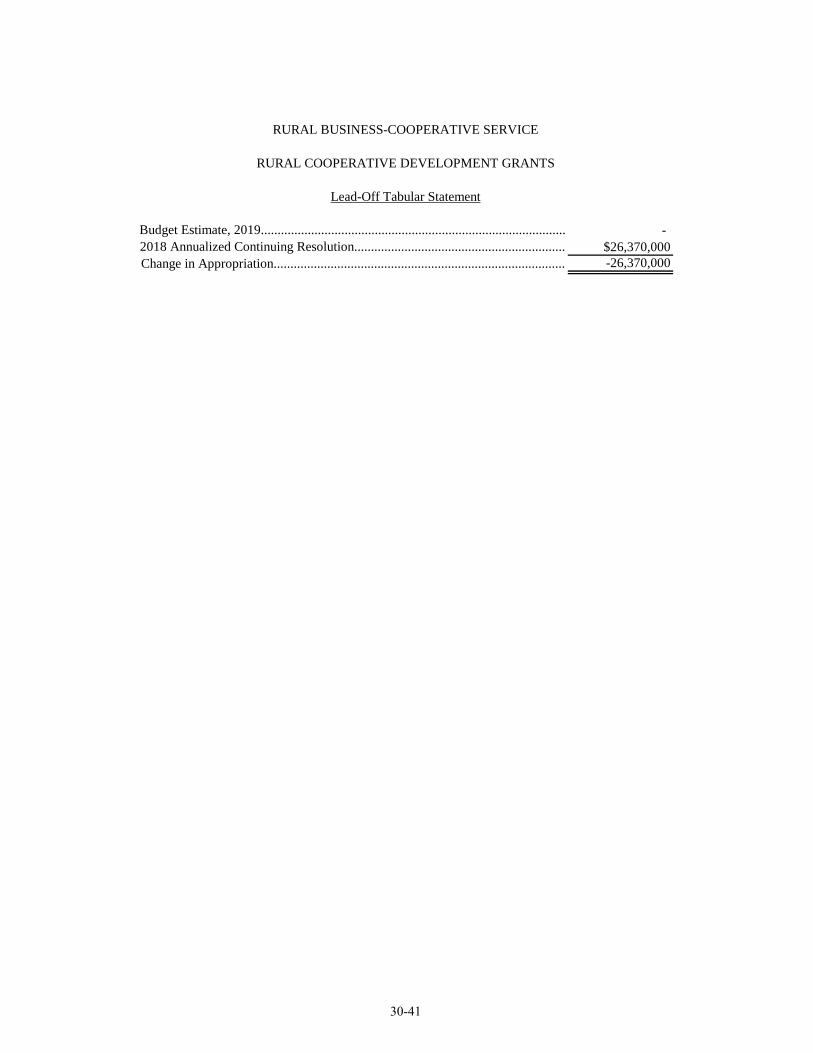
RURAL BUSINESS-COOPERATIVE SERVICE
RURAL COOPERATIVE DEVELOPMENT GRANTS
Lead-Off Tabular Statement
Budget Estimate, 2019........................................................................................... -2018 Annualized Continuing Resolution............................................................... $26,370,000 Change in Appropriation....................................................................................... -26,370,000
30-41
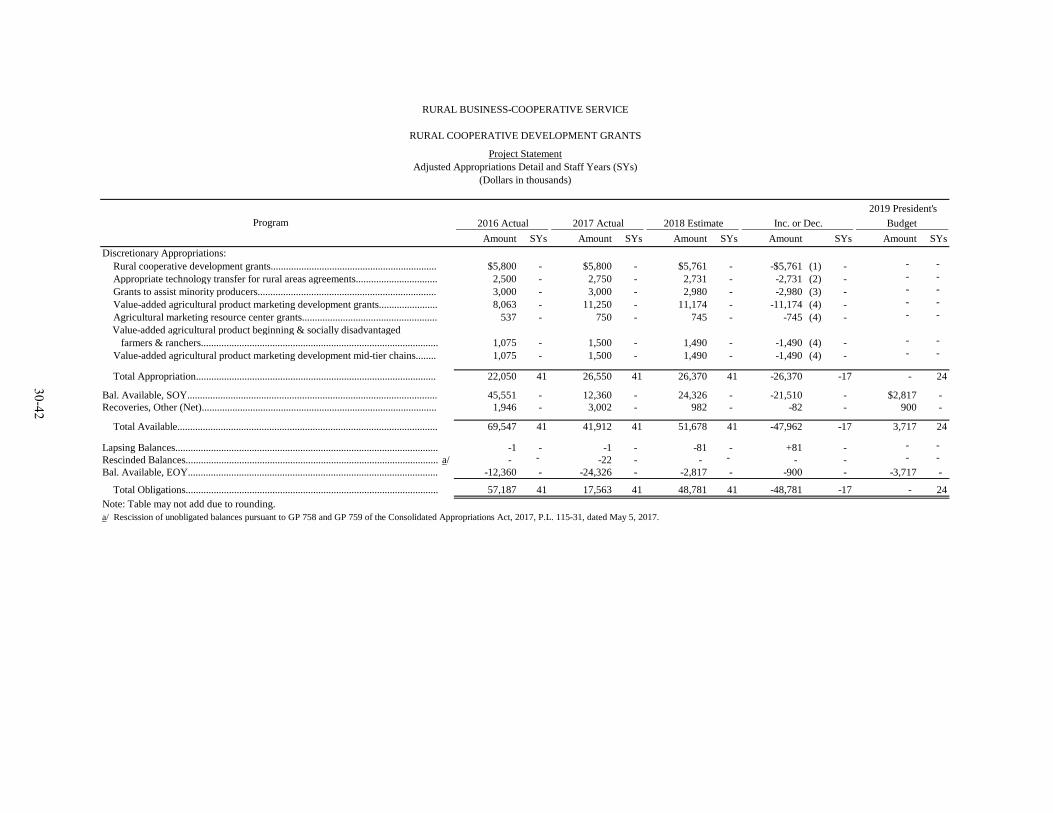
RURAL BUSINESS-COOPERATIVE SERVICE
RURAL COOPERATIVE DEVELOPMENT GRANTS
Project Statement Adjusted Appropriations Detail and Staff Years (SYs)
(Dollars in thousands)
2019 President's Program 2016 Actual 2017 Actual 2018 Estimate Inc. or Dec. Budget
Amount SYs Amount SYs Amount SYs Amount SYs Amount SYs Discretionary Appropriations: Rural cooperative development grants................................................................. $5,800 - $5,800 - $5,761 - -$5,761 (1) - - -Appropriate technology transfer for rural areas agreements................................ 2,500 - 2,750 - 2,731 - -2,731 (2) - - -Grants to assist minority producers...................................................................... 3,000 - 3,000 - 2,980 - -2,980 (3) - - -Value-added agricultural product marketing development grants....................... 8,063 - 11,250 - 11,174 - -11,174 (4) - - -Agricultural marketing resource center grants..................................................... 537 - 750 - 745 - -745 (4) - - -
Value-added agricultural product beginning & socially disadvantaged farmers & ranchers............................................................................................. 1,075 - 1,500 - 1,490 - -1,490 (4) - - -Value-added agricultural product marketing development mid-tier chains........ 1,075 - 1,500 - 1,490 - -1,490 (4) - - -
30-42
Total Appropriation.............................................................................................. 22,050 41 26,550 41 26,370 41 -26,370 -17 - 24
Bal. Available, SOY.................................................................................................. 45,551 - 12,360 - 24,326 - -21,510 - $2,817 -Recoveries, Other (Net)............................................................................................ 1,946 - 3,002 - 982 - -82 - 900 -
Total Available...................................................................................................... 69,547 41 41,912 41 51,678 41 -47,962 -17 3,717 24
Lapsing Balances....................................................................................................... -1 - -1 - -81 - +81 - - -Rescinded Balances................................................................................................... a/ - - -22 - - - - - - -Bal. Available, EOY.................................................................................................. -12,360 - -24,326 - -2,817 - -900 - -3,717 -
Total Obligations................................................................................................... 57,187 41 17,563 41 48,781 41 -48,781 -17 -Note: Table may not add due to rounding. a/ Rescission of unobligated balances pursuant to GP 758 and GP 759 of the Consolidated Appropriations Act, 2017, P.L. 115-31, dated May 5, 2017.
24
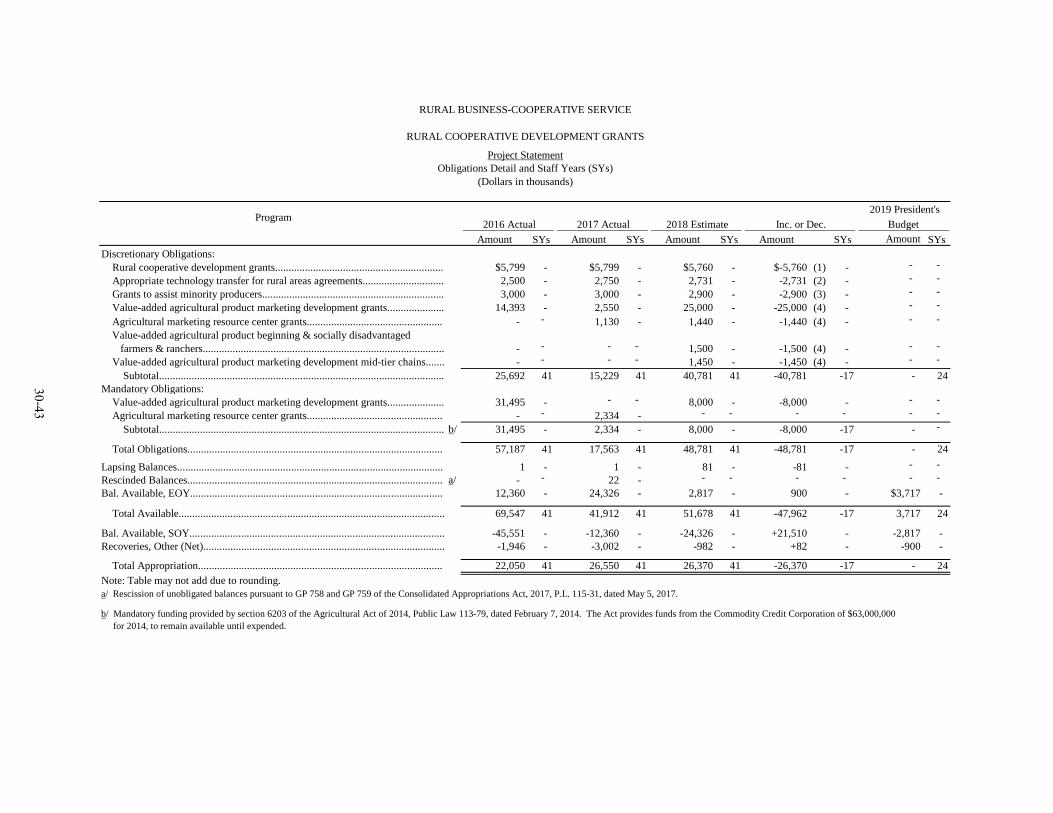
RURAL BUSINESS-COOPERATIVE SERVICE
RURAL COOPERATIVE DEVELOPMENT GRANTS
Project Statement Obligations Detail and Staff Years (SYs)
(Dollars in thousands)
2019 President'sProgram 2016 Actual 2017 Actual 2018 Estimate Inc. or Dec. Budget
Amount SYs Amount SYs Amount SYs Amount SYs Amount SYs
30-43
Discretionary Obligations: Rural cooperative development grants.............................................................. $5,799 - $5,799 - $5,760 - $-5,760 (1) - - -Appropriate technology transfer for rural areas agreements.............................. 2,500 - 2,750 - 2,731 - -2,731 (2) - - -Grants to assist minority producers................................................................... 3,000 - 3,000 - 2,900 - -2,900 (3) - - -Value-added agricultural product marketing development grants..................... 14,393 - 2,550 - 25,000 - -25,000 (4) - - -Agricultural marketing resource center grants.................................................. - - 1,130 - 1,440 - -1,440 (4) - - -
Value-added agricultural product beginning & socially disadvantaged farmers & ranchers......................................................................................... - - - - 1,500 - -1,500 (4) - - -Value-added agricultural product marketing development mid-tier chains....... - - - - 1,450 - -1,450 (4) - - -Subtotal......................................................................................................... 25,692 41 15,229 41 40,781 41 -40,781 -17 -
Mandatory Obligations: Value-added agricultural product marketing development grants..................... 31,495 - - - 8,000 - -8,000 - - -Agricultural marketing resource center grants.................................................. - - 2,334 - - - - - - -Subtotal......................................................................................................... b/ 31,495 - 2,334 - 8,000 - -8,000 -17 - -
Total Obligations.............................................................................................. 57,187 41 17,563 41 48,781 41 -48,781 -17 -
Lapsing Balances.................................................................................................. 1 - 1 - 81 - -81 - - -Rescinded Balances.............................................................................................. a/ - - 22 - - - - - - -Bal. Available, EOY............................................................................................. 12,360 - 24,326 - 2,817 - 900 - $3,717 -
Total Available.................................................................................................. 69,547 41 41,912 41 51,678 41 -47,962 -17 3,717 24
Bal. Available, SOY.............................................................................................. -45,551 - -12,360 - -24,326 - +21,510 - -2,817 -Recoveries, Other (Net)......................................................................................... -1,946 - -3,002 - -982 - +82 - -900 -
Total Appropriation.......................................................................................... 22,050 41 26,550 41 26,370 41 -26,370 -17 -Note: Table may not add due to rounding. a/ Rescission of unobligated balances pursuant to GP 758 and GP 759 of the Consolidated Appropriations Act, 2017, P.L. 115-31, dated May 5, 2017.
b/ Mandatory funding provided by section 6203 of the Agricultural Act of 2014, Public Law 113-79, dated February 7, 2014. The Act provides funds from the Commodity Credit Corporation of $63,000,000 for 2014, to remain available until expended.
24
24
24
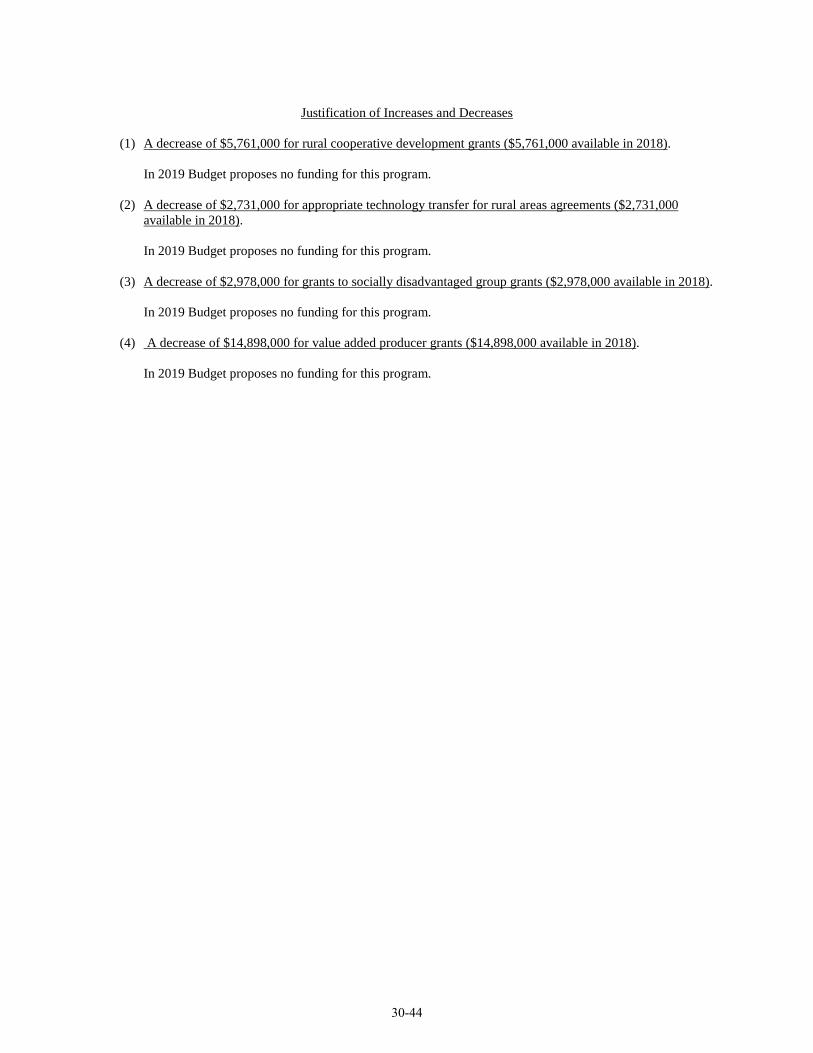
Justification of Increases and Decreases
(1) A decrease of $5,761,000 for rural cooperative development grants ($5,761,000 available in 2018).
In 2019 Budget proposes no funding for this program.
(2) A decrease of $2,731,000 for appropriate technology transfer for rural areas agreements ($2,731,000 available in 2018).
In 2019 Budget proposes no funding for this program.
(3) A decrease of $2,978,000 for grants to socially disadvantaged group grants ($2,978,000 available in 2018).
In 2019 Budget proposes no funding for this program.
(4) A decrease of $14,898,000 for value added producer grants ($14,898,000 available in 2018).
In 2019 Budget proposes no funding for this program.
30-44
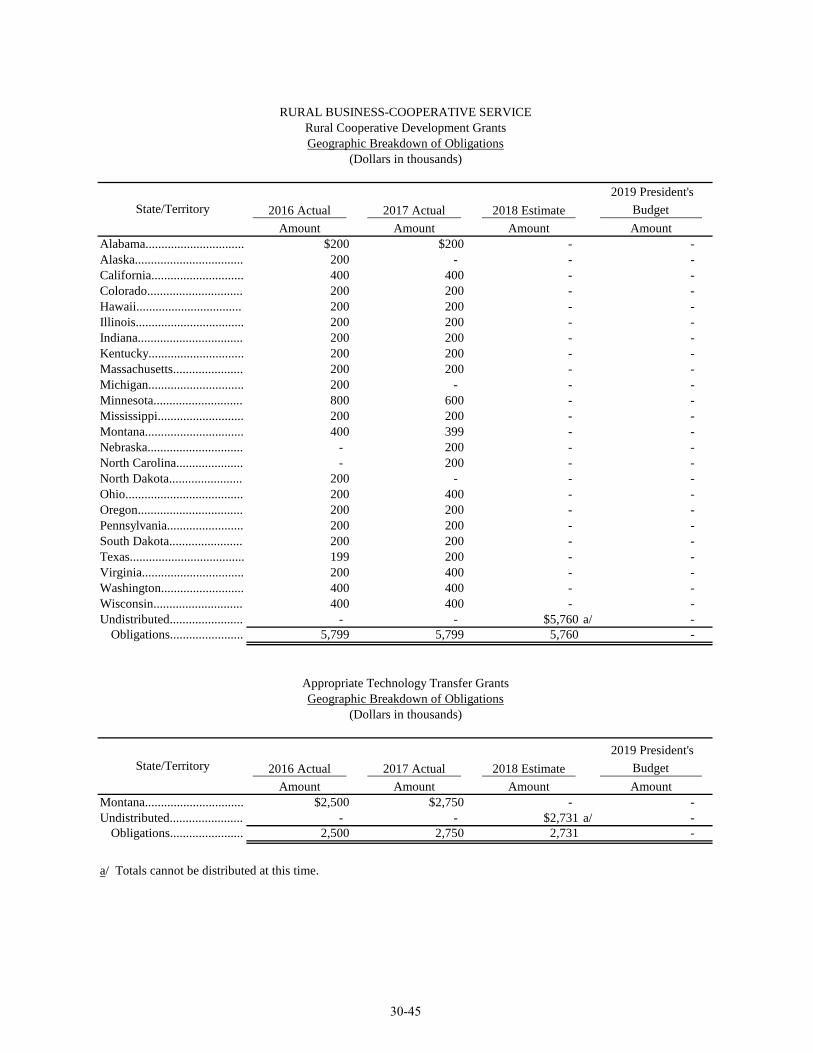
RURAL BUSINESS-COOPERATIVE SERVICE Rural Cooperative Development Grants Geographic Breakdown of Obligations
(Dollars in thousands)
2019 President's State/Territory 2016 Actual 2017 Actual 2018 Estimate Budget
Amount Amount Amount Amount Alabama............................... $200 $200 - -Alaska.................................. 200 - - -California............................. 400 400 - -Colorado.............................. 200 200 - -Hawaii................................. 200 200 - -Illinois.................................. 200 200 - -Indiana................................. 200 200 - -Kentucky.............................. 200 200 - -Massachusetts...................... 200 200 - -Michigan.............................. 200 - - -Minnesota............................ 800 600 - -Mississippi........................... 200 200 - -Montana............................... 400 399 - -Nebraska.............................. - 200 - -North Carolina..................... - 200 - -North Dakota....................... 200 - - -Ohio..................................... 200 400 - -Oregon................................. 200 200 - -Pennsylvania........................ 200 200 - -South Dakota....................... 200 200 - -Texas.................................... 199 200 - -Virginia................................ 200 400 - -Washington.......................... 400 400 - -Wisconsin............................ 400 400 - -Undistributed....................... - - $5,760 a/ -Obligations....................... 5,799 5,799 5,760 -
Appropriate Technology Transfer Grants Geographic Breakdown of Obligations
(Dollars in thousands)
2019 President's State/Territory 2016 Actual 2017 Actual 2018 Estimate Budget
Amount Amount Amount Amount Montana............................... $2,500 $2,750 - -Undistributed....................... - - $2,731 a/ -Obligations....................... 2,500 2,750 2,731 -
a/ Totals cannot be distributed at this time.
30-45
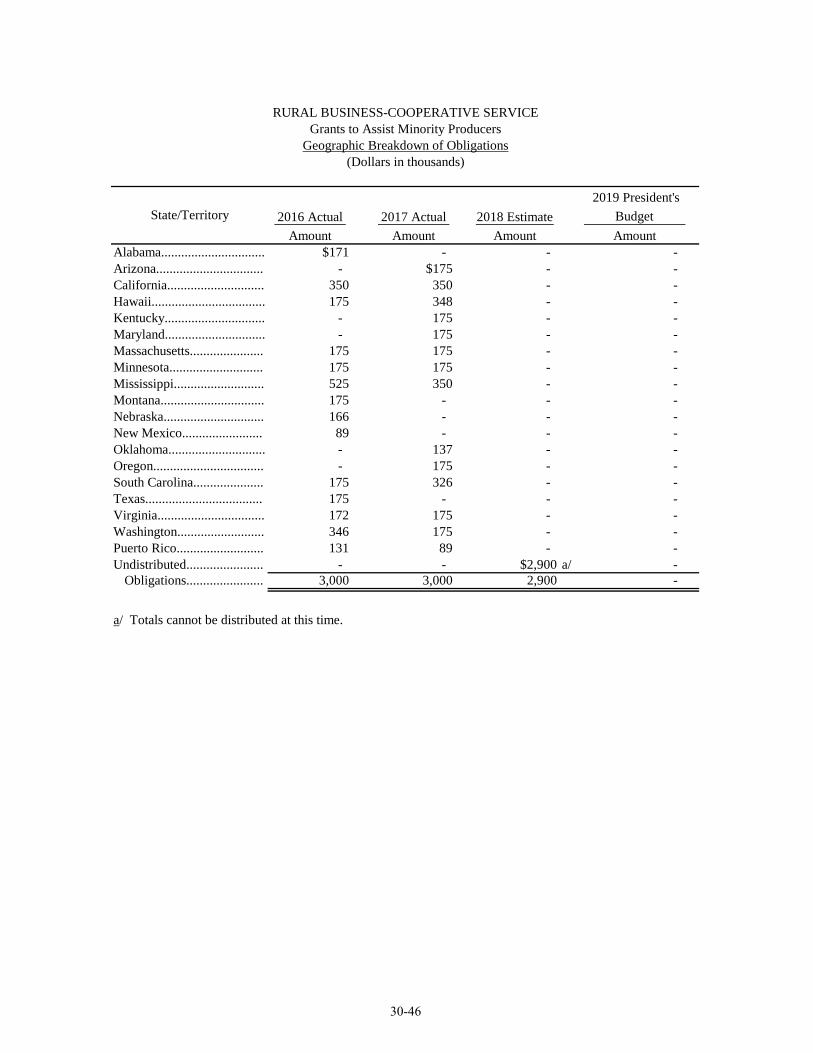
RURAL BUSINESS-COOPERATIVE SERVICE Grants to Assist Minority Producers Geographic Breakdown of Obligations
(Dollars in thousands)
2019 President's State/Territory 2016 Actual 2017 Actual 2018 Estimate Budget
Amount Amount Amount Amount Alabama............................... $171 - - -Arizona................................ - $175 - -California............................. 350 350 - -Hawaii.................................. 175 348 - -Kentucky.............................. - 175 - -Maryland.............................. - 175 - -Massachusetts...................... 175 175 - -Minnesota............................ 175 175 - -Mississippi........................... 525 350 - -Montana............................... 175 - - -Nebraska.............................. 166 - - -New Mexico........................ 89 - - -Oklahoma............................. - 137 - -Oregon................................. - 175 - -South Carolina..................... 175 326 - -Texas................................... 175 - - -Virginia................................ 172 175 - -Washington.......................... 346 175 - -Puerto Rico.......................... 131 89 - -Undistributed....................... - - $2,900 a/ -Obligations....................... 3,000 3,000 2,900 -
a/ Totals cannot be distributed at this time.
30-46

RURAL BUSINESS-COOPERATIVE SERVICE Value-Added Agricultural Product Marketing Development Grants - Discretionary
Geographic Breakdown of Obligations (Dollars in thousands)
2019 President's State/Territory 2016 Actual 2017 Actual 2018 Estimate Budget
Amount Amount Amount Amount Alabama............................... $542 - - -Arizona................................. 841 - - -Arkansas............................... 513 - - -California............................. 1,955 - - -Colorado............................... 223 - - -Connecticut.......................... 250 - - -Delaware.............................. 250 - - -Florida.................................. 488 - - -Georgia................................. 1,456 $2,000 - -Idaho.................................... 864 - - -Illinois.................................. $789 - - -Indiana.................................. 390 - - -Iowa...................................... 571 - - -Kansas.................................. 786 50 - -Kentucky.............................. 1,709 - - -Louisiana.............................. 500 - - -Maryland.............................. 675 - - -Pennsylvania........................ - 250 - -Texas.................................... - 250 - -Puerto Rico.......................... 1,590 - - -Undistributed....................... - - $25,000 a/ -Obligations....................... 14,393 2,550 25,000 -
a/ Totals cannot be distributed at this time.
30-47
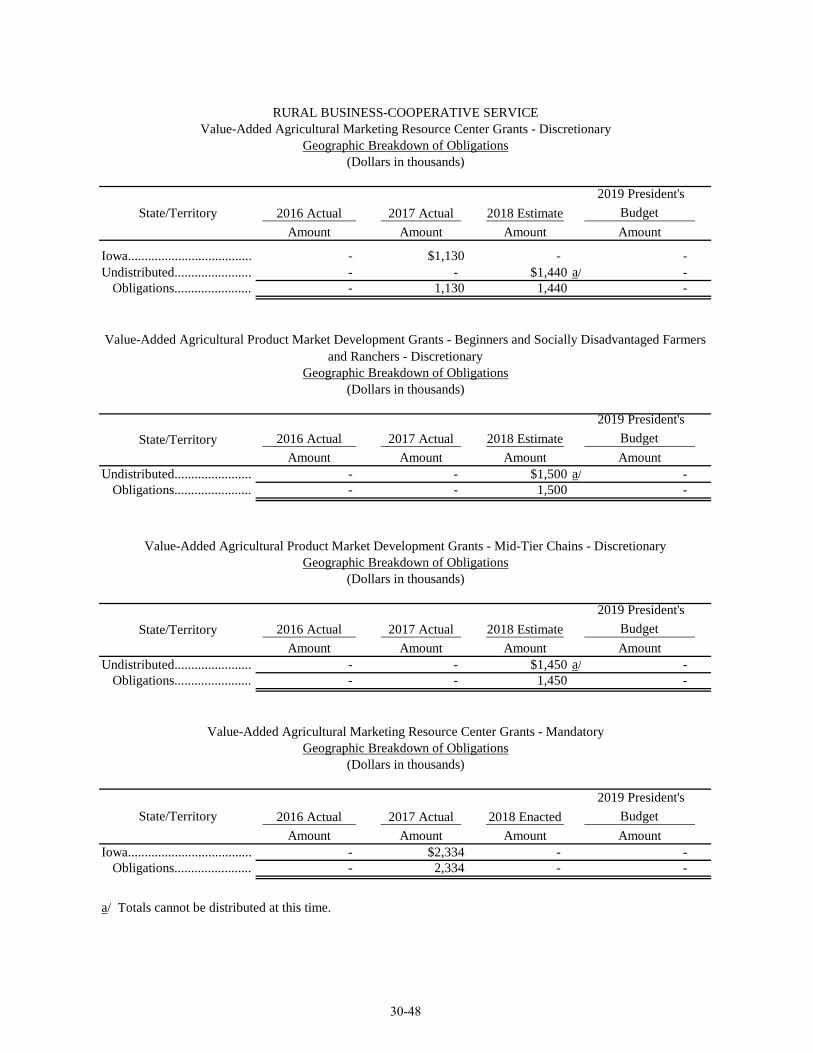
RURAL BUSINESS-COOPERATIVE SERVICE Value-Added Agricultural Marketing Resource Center Grants - Discretionary
Geographic Breakdown of Obligations (Dollars in thousands)
2019 President's State/Territory 2016 Actual 2017 Actual 2018 Estimate Budget
Amount Amount Amount Amount
Iowa..................................... - $1,130 - -Undistributed....................... - - $1,440 a/ -Obligations....................... - 1,130 1,440 -
Value-Added Agricultural Product Market Development Grants - Beginners and Socially Disadvantaged Farmers and Ranchers - Discretionary
Geographic Breakdown of Obligations (Dollars in thousands)
2019 President's State/Territory 2016 Actual 2017 Actual 2018 Estimate Budget
Amount Amount Amount Amount Undistributed....................... - - $1,500 a/ -Obligations....................... - - 1,500 -
Value-Added Agricultural Product Market Development Grants - Mid-Tier Chains - Discretionary Geographic Breakdown of Obligations
(Dollars in thousands)
2019 President's State/Territory 2016 Actual 2017 Actual 2018 Estimate Budget
Amount Amount Amount Amount Undistributed....................... - - $1,450 a/ -Obligations....................... - - 1,450 -
Value-Added Agricultural Marketing Resource Center Grants - Mandatory Geographic Breakdown of Obligations
(Dollars in thousands)
2019 President's State/Territory 2016 Actual 2017 Actual 2018 Enacted Budget
Amount Amount Amount Amount Iowa..................................... - $2,334 - -Obligations....................... - 2,334 - -
a/ Totals cannot be distributed at this time.
30-48
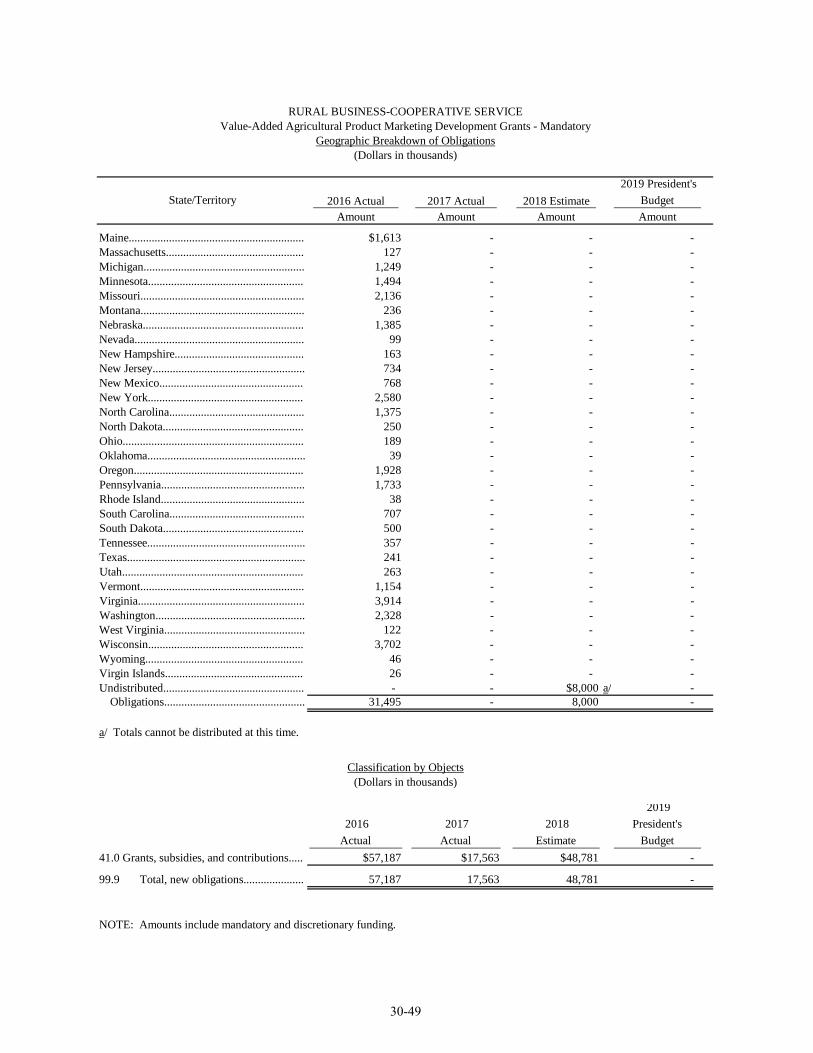
RURAL BUSINESS-COOPERATIVE SERVICE Value-Added Agricultural Product Marketing Development Grants - Mandatory
Geographic Breakdown of Obligations (Dollars in thousands)
2019 President's State/Territory 2016 Actual 2017 Actual 2018 Estimate Budget
Amount Amount Amount Amount
Maine............................................................. $1,613 - - -Massachusetts................................................ 127 - - -Michigan........................................................ 1,249 - - -Minnesota...................................................... 1,494 - - -Missouri......................................................... 2,136 - - -Montana......................................................... 236 - - -Nebraska........................................................ 1,385 - - -Nevada........................................................... 99 - - -New Hampshire............................................. 163 - - -New Jersey..................................................... 734 - - -New Mexico.................................................. 768 - - -New York...................................................... 2,580 - - -North Carolina............................................... 1,375 - - -North Dakota................................................. 250 - - -Ohio............................................................... 189 - - -Oklahoma....................................................... 39 - - -Oregon........................................................... 1,928 - - -Pennsylvania.................................................. 1,733 - - -Rhode Island.................................................. 38 - - -South Carolina............................................... 707 - - -South Dakota................................................. 500 - - -Tennessee....................................................... 357 - - -Texas.............................................................. 241 - - -Utah............................................................... 263 - - -Vermont......................................................... 1,154 - - -Virginia.......................................................... 3,914 - - -Washington.................................................... 2,328 - - -West Virginia................................................. 122 - - -Wisconsin...................................................... 3,702 - - -Wyoming....................................................... 46 - - -Virgin Islands................................................ 26 - - -Undistributed................................................. - - $8,000 a/ -Obligations................................................. 31,495 - 8,000 -
a/ Totals cannot be distributed at this time.
Classification by Objects (Dollars in thousands)
2019 2016 2017 2018 President's Actual Actual Estimate Budget
41.0 Grants, subsidies, and contributions..... $57,187 $17,563 $48,781 -
99.9 Total, new obligations..................... 57,187 17,563 48,781 -
NOTE: Amounts include mandatory and discretionary funding.
30-49
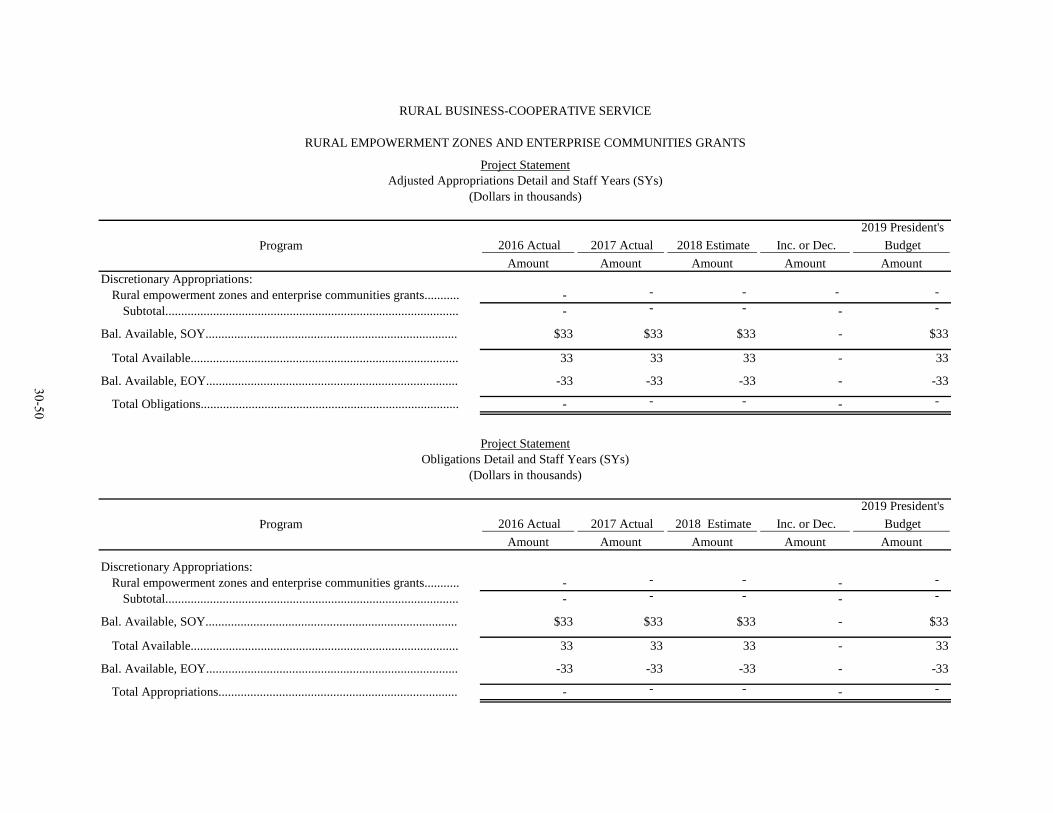
RURAL BUSINESS-COOPERATIVE SERVICE
RURAL EMPOWERMENT ZONES AND ENTERPRISE COMMUNITIES GRANTS
Project Statement Adjusted Appropriations Detail and Staff Years (SYs)
(Dollars in thousands)
2019 President'sProgram 2016 Actual 2017 Actual 2018 Estimate Inc. or Dec. Budget
Amount Amount Amount Amount Amount Discretionary Appropriations: Rural empowerment zones and enterprise communities grants........... - - - - -Subtotal............................................................................................ - - - - -
Bal. Available, SOY............................................................................... $33 $33 $33 - $33
Total Available.................................................................................... 33 33 33 - 33
Bal. Available, EOY............................................................................... -33 -33 -33 - -33 30-50 Total Obligations................................................................................. - - - - -
Project Statement Obligations Detail and Staff Years (SYs)
(Dollars in thousands)
2019 President'sProgram 2016 Actual 2017 Actual 2018 Estimate Inc. or Dec. Budget
Amount Amount Amount Amount Amount
Discretionary Appropriations: Rural empowerment zones and enterprise communities grants........... - - - - -Subtotal............................................................................................ - - - - -
Bal. Available, SOY............................................................................... $33 $33 $33 - $33
Total Available.................................................................................... 33 33 33 - 33
Bal. Available, EOY............................................................................... -33 -33 -33 - -33
Total Appropriations........................................................................... - - - - -
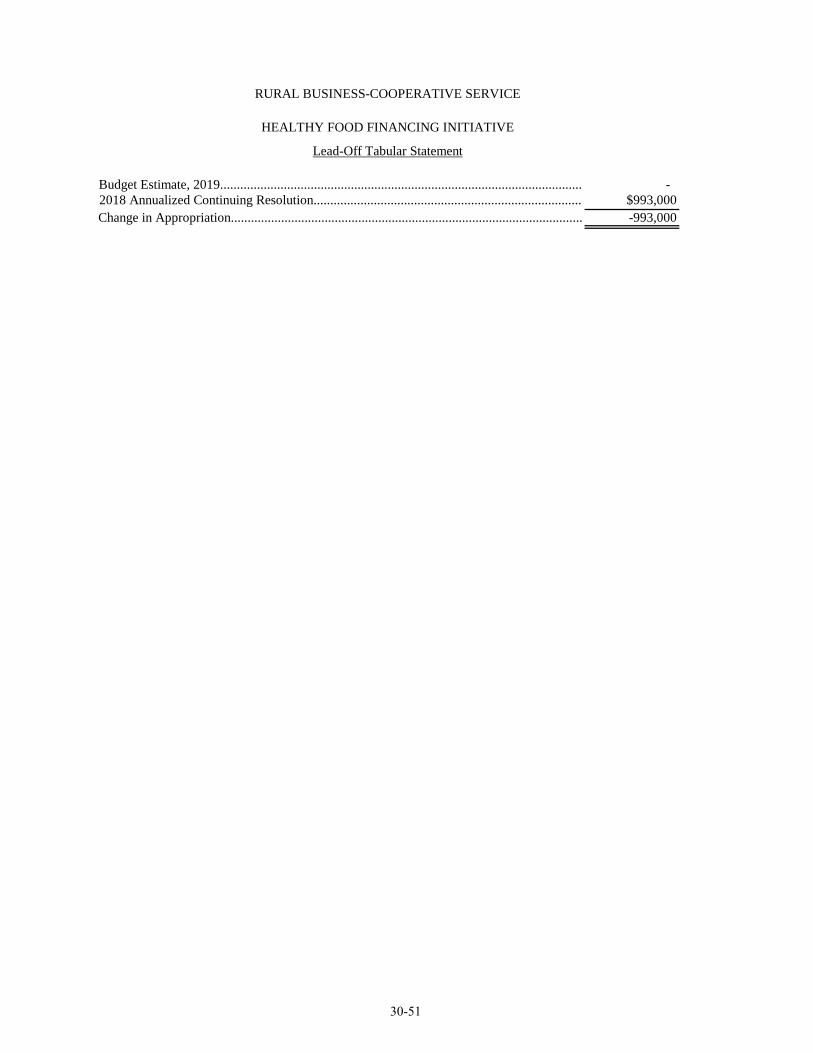
RURAL BUSINESS-COOPERATIVE SERVICE
HEALTHY FOOD FINANCING INITIATIVE
Lead-Off Tabular Statement
Budget Estimate, 2019............................................................................................................ -2018 Annualized Continuing Resolution................................................................................ $993,000 Change in Appropriation......................................................................................................... -993,000
30-51

RURAL BUSINESS-COOPERATIVE SERVICE
HEALTHY FOOD FINANCING INITIATIVE
Project Statement Adjusted Appropriations Detail and Staff Years (SYs)
(Dollars in thousands)
2019 President's Program 2016 Actual 2017 Actual 2018 Estimate Inc. or Dec. Budget
Amount SYs Amount SYs Amount SYs Amount SYs Amount SYs Discretionary Appropriations:Healthy food financing initiative.............................. - - $1,000 - $993 - -$993 (1) - - -
Total Appropriation.................................................. - - 1,000 - 993 - -993 - - -
Bal. Available, SOY..................................................... - - - - 1,000 - -1,000 - - -
Total Available.......................................................... - - 1,000 - 1,993 - -1,993 - - -
Bal. Available, EOY..................................................... - - -1,000 - - - - - - -30-52 Total Obligations...................................................... - - - - 1,993 - -1,993 - - -
HEALTHY FOOD FINANCING INITIATIVE Project Statement
Obligations Detail and Staff Years (SYs) (Dollars in thousands)
2019 President's Program 2016 Actual 2017 Actual 2018 Estimate Inc. or Dec. Budget
Amount SYs Amount SYs Amount SYs Amount SYs Amount SYs Discretionary Obligations:Healthy food financing initiative.............................. - - - - $1,993 - -$1,993 (1) - - -Total Obligations...................................................... - - - - 1,993 - -1,993 - - -
Bal. Available, EOY..................................................... - - $1,000 - - - - - - -
Total Available.......................................................... - - 1,000 - 1,993 - -1,993 - - -
Bal. Available, SOY..................................................... - - - - -1,000 - +1,000 - - -
Total Appropriation.................................................. - - 1,000 - 993 - -993 - - -
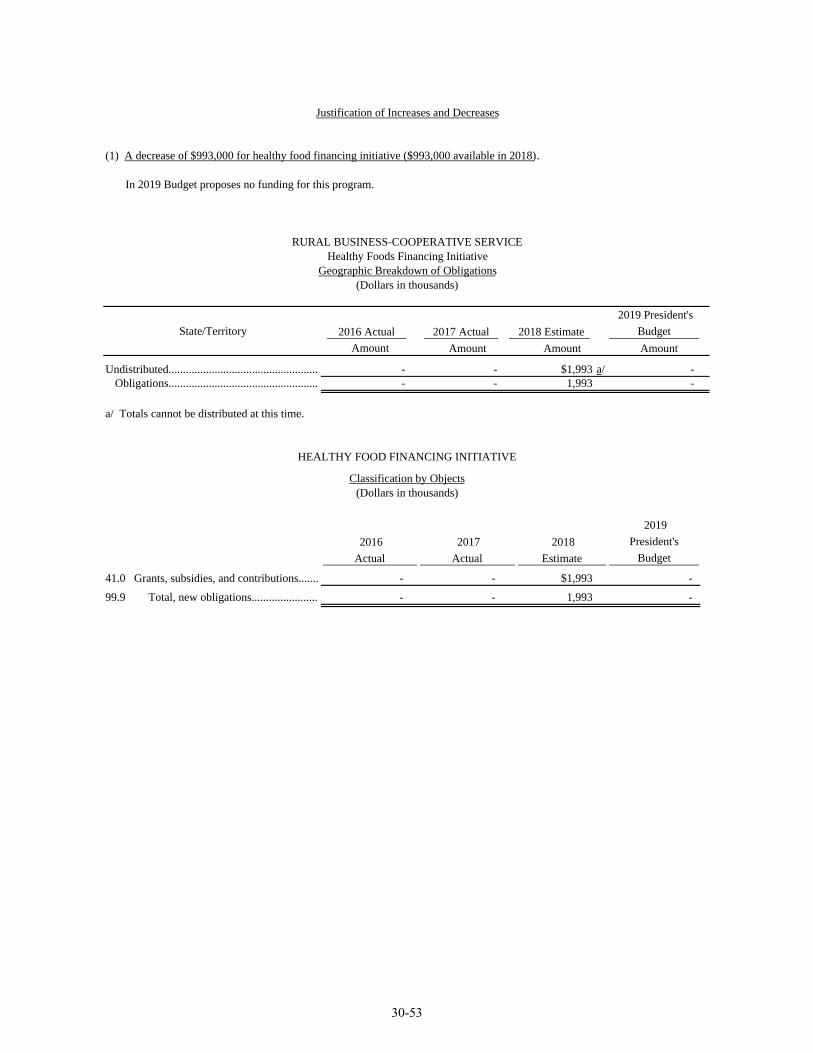
Justification of Increases and Decreases
(1) A decrease of $993,000 for healthy food financing initiative ($993,000 available in 2018).
In 2019 Budget proposes no funding for this program.
RURAL BUSINESS-COOPERATIVE SERVICE Healthy Foods Financing Initiative
Geographic Breakdown of Obligations (Dollars in thousands)
2019 President's State/Territory 2016 Actual
Amount 2017 Actual
Amount 2018 Estimate
Amount Budget Amount
Undistributed.................................................... Obligations....................................................
--
--
$1,993 a/ 1,993
--
a/ Totals cannot be distributed at this time.
Classification by Objects (Dollars in thousands)
HEALTHY FOOD FINANCING INITIATIVE
41.0
99.9
Grants, subsidies, and contributions.......
Total, new obligations.......................
2016 Actual
-
-
2017 Actual
-
-
$1,993
2018 Estimate
1,993
2019 President's
Budget
-
-
30-53
RURAL BUSINESS-COOPERATIVE SERVICE
Status of Programs
The Rural Business-Cooperative Service (RBS) programs provide direct loans, loan guarantees, grants, technical assistance and payments designed to increase economic opportunity in rural America. Rural Development (RD) State and field office staffs work collaboratively with political and business leaders to leverage RD resources.
RBS promotes economic development by supporting loan guarantees to businesses through banks, credit unions and community-managed lending pools. RBS offers technical assistance and information to help agricultural producers and cooperatives get started and improve the effectiveness of their operations. RBS programs are committed to helping improve the economy and quality of life in rural America. Through these programs, we touch rural America in many ways.
Business and Industry Guaranteed (B&I) Loan Program
Current Activities:
The B&I Guaranteed Loan Program is one of the major tools that RD employs to facilitate business growth in rural areas. The B&I Guaranteed Loan Program provides funding through small or regional scale lenders to ensure rural communities have access to capital. In 2017, RD issued 407 B&I loan guarantees totaling $1.4 billion assisting 485 rural businesses, and creating or saving 14,952 jobs.
Selected Examples of Recent Progress:
In New Hampshire, Rural Development provided a $25 million guaranteed loan to North Country Growers, LLC. B&I loan funds will be used to construct 20 acres of hydroponic greenhouses for growing tomatoes and lettuce for shipping throughout New England. The project is expected to create 76 jobs at a rate of $22.00 per hour.
Rural Energy for America Program (REAP)
Current Activities:
In 2017, REAP funded 1,199 projects totaling $409.57 million ($37.49 million in grants and $372.08 million in loan guarantees) with $55.95 million in budget authority from mandatory funding. Mandatory funds of $1.86 million supported 22 grants for the REAP’s Energy Audit and Renewable Energy Development Assistance Program. The remaining $54.09 million of mandatory funds supported 1,177 Renewable Energy System and Energy Efficiency Improvement projects with $35.63 million in grants and $372.08 million in loan guarantees. When operational, the 2017 REAP projects are expected to generate/save approximately 1.2 million megawatt hours (MWh) and produce 89.4 million gallons of advanced biofuel annually. REAP’s $55.95 million in budget authority assisted 1,847 businesses leveraging total project cost of over $1.2 billion.
Selected Examples of Recent Progress:
Legacy Biogas, LLC, in Fremont, NC, was awarded a REAP loan guarantee on a $3.4 million loan to construct a $6 million anaerobic digester at a hog farm that will generate over 7,000 MWh of energy per year. This agricultural waste to renewable energy project will produce enough energy to power more than 575 average sized homes annually. The loan to this rural small business has a payback period of less than four years.
New Generation Dairy, Inc., a rural small business in Fort Branch, IN, was awarded an $11,832 grant to replace all of their fluorescent and incandescent lighting with more energy efficient LED lighting. The new lighting upgrades are expected to save 115,562 kWh annually, enough energy to power 10 average sized homes. With total project costs of just over $47,000, the payback period is approximately three years.
30-54
Intermediary Relending Program (IRP)
Current Activities:
The IRP lends money to economic development intermediaries (non-profits and public bodies) who re-lend it to rural businesses (ultimate recipients) that might not otherwise be able to obtain such financing. The program supports sustainable economic development and helps create or retain jobs in disadvantaged and remote communities. In 2017, IRP issued 31 loans totaling $18.9 million to intermediaries to establish revolving loan funds to assist 642 businesses and to create or save 14,450 jobs.
Selected Examples of Recent Progress:
Prairieland EDC of Minnesota borrowed a total of $4.75 million in four IRP loans for capitalizing a revolving loan fund to relend for business and community development throughout a 20 county region in Southern Minnesota. The fund has an emphasis in General Accepted accounting Principles lending and job creation.
Selected examples of ultimate recipient loans: • Ultimate recipient Ron’s Repair borrowed $162,500 from the fund for a business expansion, adding 6 bays
to the repair shop as well as a new parts room, warehouse, and expanded parts inventory; and • Ultimate recipient Midwest Fire and Repair borrowed $250,000 for a business acquisition, including real
estate, equipment, and business assets.
Coastal Enterprises, Inc. of Maine borrowed $1 million in IRP funds to capitalize a revolving loan fund to relend for business and community development.
Selected examples of ultimate recipient loans: • Ultimate recipient Phoenix Footwear Group borrowed $55,000 from the fund for working capital; and • Ultimate recipient Twin Pine Camps, LLC borrowed $170,000 from the fund for new cabins.
Rural Microentrepreneur Assistance Program (RMAP)
Current Activities:
The RMAP program supports the development and ongoing success of rural microentrepreneurs and microenterprises that consist of 10 or less employees. Direct loans and technical assistance grants are made to select Microenterprise Development Organizations, through a competitive grant program specified in regulation. In 2017, a total of $10.2 million in loans was obligated to 18 RMAP applicants. The $2.6 million in RMAP grants was provided to 72 applicants to support the development and ongoing success of rural microentrepreneurs and microenterprises.
Selected Examples of Recent Progress:
Lakota Fund, Inc., South Dakota, borrowed $334,026 in RMAP funds to capitalize a revolving loan fund to relend for micro business development. An example of a loan made to an ultimate recipient loan:
• Timber Ghost Outdoor Services borrowed $25,000 for equipment and other startup costs for this hunting guide service on the Pine Ridge Indian Reservation.
Appalachian Community Enterprises, Inc., of Georgia received a combination of loan/grant RMAP funds. RMAP loan funds of $500,000 were used to capitalize a rural microloan revolving loan fund to make microloans to rural microentrepreneurs and microenterprises for business and community development. RMAP grant funds of $105,000 will be used to provide technical assistance and training to rural microentrepreneurs and microenterprises.
Selected examples of loans made to ultimate recipients: • Timeout Sporting Goods and Apparel borrowed $45,000 from the fund for business acquisition; and
30-55

• Tiger Mountain H20, LLC borrowed $50,000 from the fund for working capital.
Rural Economic Development Loan and Grant (REDLG) Program
Current Activities:
The REDLG program provides zero-interest loans to local utilities which, in turn, relend the funds to local businesses (ultimate recipients) for projects that will create and retain employment in rural areas. The program funds business start-up, expansion, business incubators, education and training facilities and equipment, community development assistance, health care and other projects that support rural economic development.
In 2017, REDLG issued 47 loans totaling $38.6 million creating or saving 1,579 jobs. In addition, 34 grants totaling $9.3 million were made to qualifying utilities assisting 62 businesses and creating or saving 565 jobs.
Selected Examples of Recent Progress:
Itasca Mantrap Cooperative Electrical Association received a $1 million RED-Loan and a $300,000 RED-Grant to be loaned to KI Developers of Park Rapids, LLC, for the purpose of constructing 69 independent/assisting living units and 19 memory care units. The facility will have 24 hour nursing care on-site and licensed staff available daily for assistance. The project created 40 new jobs.
Rural Business Development Grant (RBDG) Program
Current Activities:
RBDG provides grant to support towns, communities, State agencies, etc. in providing targeted technical assistance, training, and other activities leading to the development or expansion of small and emerging private businesses in rural areas that have fewer than 50 employees and less than $1 million in gross revenues. Programmatic activities are separated into enterprise or opportunity type grant activities. RBDG awarded 502 grants totaling $30.4 million. These grants assisted 7,356 businesses in creating or saving 7,376 jobs.
Selected Examples of Recent Progress:
In North Dakota, Sitting Bull College received a $53,068 technical assistance grant that was used to provide two monthly workshops in each Standing Rock Sioux tribe district on entrepreneurship and financing opportunities. The workshops included one-on-one entrepreneurship training and technical assistance to small businesses and entrepreneurs. The technical assistance includes business planning and applying for financial assistance training/accounting financial assistance training.
Value Added Producer Grant (VAPG) Program
Current Activities:
The VAPG program helps agricultural producers grow their businesses by turning raw commodities into value added products, expanding marketing opportunities and developing new uses for existing products. In 2017, the VAPG Program funded 11 grants for a total of $2.6 million. These grants created or saved 45 jobs.
Selected Examples of Recent Progress:
Pisel Farm, Gilmore City, IA, received a VAPG working capital grant in 2016 to assist with development and marketing of a new product “CYburgdog”, which is a bratwurst-style link made from surplus ground beef from the operation. The product will be co-branded with Iowa State University, with “CY” referring to the Iowa State Cyclones. Funds will be used to help establish the brand and create markets within a 400-mile radius of the farm.
The Arkansas Foodshed Cooperative in Little Rock AR, is a new farmer cooperative organized, received a $24,000
30-56
planning grant to increase access to fresh, local food while supporting the livelihoods of small-scale Arkansas farmers. A team of certified organic and certified naturally grown farmers has joined together to strengthen their regional food system (foodshed) by growing food that cultivates jobs and community. The co-op uses locally sourced food to employ and empower low resource agriculture producers across the State. Value Added Producer grant planning funds will facilitate a feasibility study to determine whether the co-op’s initial market assessment is accurate as well as quantify the size of the wholesale markets within reach of the co-op’s potential supply. A positive feasibility assessment will lead to the development of a 3-year business plan to outline the co-op’s near term activities and financial capabilities.
Agricultural Marketing Resource Center (AgMRC)
Current Activities:
AgMRC provides funding to maintain electronic national information on value added agriculture for producers, processors and service providers. In addition to supporting the VAPG program, AgMRC provides a wealth of information on commodities and products including: agriculture-tourism, aquaculture, energy, forestry, fiber, grains and seeds. Additionally, AgMRC provides prospective value added producers with resources and information on markets and industries as well as tools to assist with developing feasibility studies and business plans. Through its website, AgMRC offers tips and information for agricultural producers looking to start a business, how to get prepared, and strategies and analysis for developing a successful business. The funds awarded provide the resources, research and other support, to maintain the AgMRC website. Funding for 2017 was approximately $2.6 million, with 4,000 unique visits per day supporting over 100 different commodities and products.
Rural Cooperative Development Grant
Current Activities:
These centers work with and support new cooperative businesses. RCDG are awarded to non-profit groups and higher education institutions. The recipients will use the funds to operate centers to develop or expand rural businesses, especially cooperatives and mutually-owned businesses. The funding can be used to conduct feasibility studies, create and implement business plans, offer technical assistance, establish low-interest loans, and help rural businesses develop new markets for their products and services. In 2017 these centers assisted more than 831 small businesses and cooperatives created and/or saved more than 738 jobs. In 2017, grants totaling approximately $5.8 million were made to 29 centers.
Selected Examples of Recent Progress:
Cooperative Development Services, Inc., in Dane, Wisconsin, received a $200,000 grant, supporting the development of producer-owned co-ops, farmer-owned value-added enterprises and providing cooperative solutions to rural community development co-ops. Funds will also be used to deliver outreach, education and technical assistance in rural areas through Wisconsin, Minnesota, and Iowa.
Appropriate Technology Transfer to Rural America (ATTRA)
Current Activities:
The ATTRA program, also called the National Sustainable Agriculture Information Service, provides sustainable agriculture information to those engaged in or serving commercial agriculture, such as farmers, ranchers, extension agents, farm organizations, and farm-based businesses. In 2017, $2.75 million was obligated to fund ATTRA.
30-57
Selected Examples of Recent Progress:
The National Center for Appropriate Technology (NCAT) provides technical assistance, outreach, and education.
During 2017, NCAT specialists assisted clients 26,500 times with technical assistance materials. Farmers, ranchers, and agriculture educators across the country received information and technical assistance in situations including helping an active-duty military person plan how to start a fruit farm in Hawaii following retirement, helping a Texas producer start a meal preparation and delivery business using locally grown produce, cheeses, proteins and break products, helping a New Hampshire veteran start a Grade A Goat dairy, and advising a Louisiana urban community gardening on sustainable methods to capture water. The website received over 427,000 visits, in which users accessed 1,047,304 pages.
ATTRA specialists attended 53 workshops or conferences, where they gave presentations or met with producers, agriculture educators, or agriculture service industry representatives, and connected with a total of 16,810 attendees. NCAT/ATTRA offers veteran and beginning farmer training in a program called “Armed to Farm” which provides free training and hands-on education for veterans and their spouses. Training for 30 veterans from 15 different States was held in Fayetteville, Arkansas, in June, and three more “Armed to Farm” trainings are scheduled to be completed by the end of calendar year 2017.
Socially-Disadvantaged Producer Grant (SDPG) Program
Current Activities:
The SDPG program provides technical assistance grants to socially-disadvantaged groups (cooperatives, groups of cooperatives, and cooperative development centers) for the purpose of developing cooperatives. In 2017, the SDPG program awarded $3 million in grants to 18 organizations that assisted 531 businesses and 657 farmers.
Selected Examples of Recent Progress:
The Hmong American Farmers Association in St. Paul, Minnesota, was awarded a $175,000 grant to provide in-the-fields group trainings, and one-to-one consultations on sustainable agricultural practices, farm business management, value-added production and cooperative development.
University of Maryland Eastern Shore was awarded $175,000 to provide technical training and outreach assistance to approximately 130-150 socially disadvantaged groups, primarily women and minorities, on the benefits of cooperative markets and market research; product or service improvement, and benefits of a single-portal designed to improve small business efficiency among socially-disadvantaged groups.
Numu Allottee Association in Madras, Oregon, was awarded a $175,000 grant to provide technical training and assistance to landowners for the development of a cooperative management model to obtain resources for the rehabilitation of the trust land damaged by overgrazing, drought, water diversion, and mismanagement by the Bureau of Indian Affairs.
Ka’u Coffee Growers Cooperative in Pahala, Hawaii, were awarded $173,241 to provide technical assistance to train and educate coffee farmers to improve coffee tree health, optimize coffee quality and yield for maximum returns.
30-58
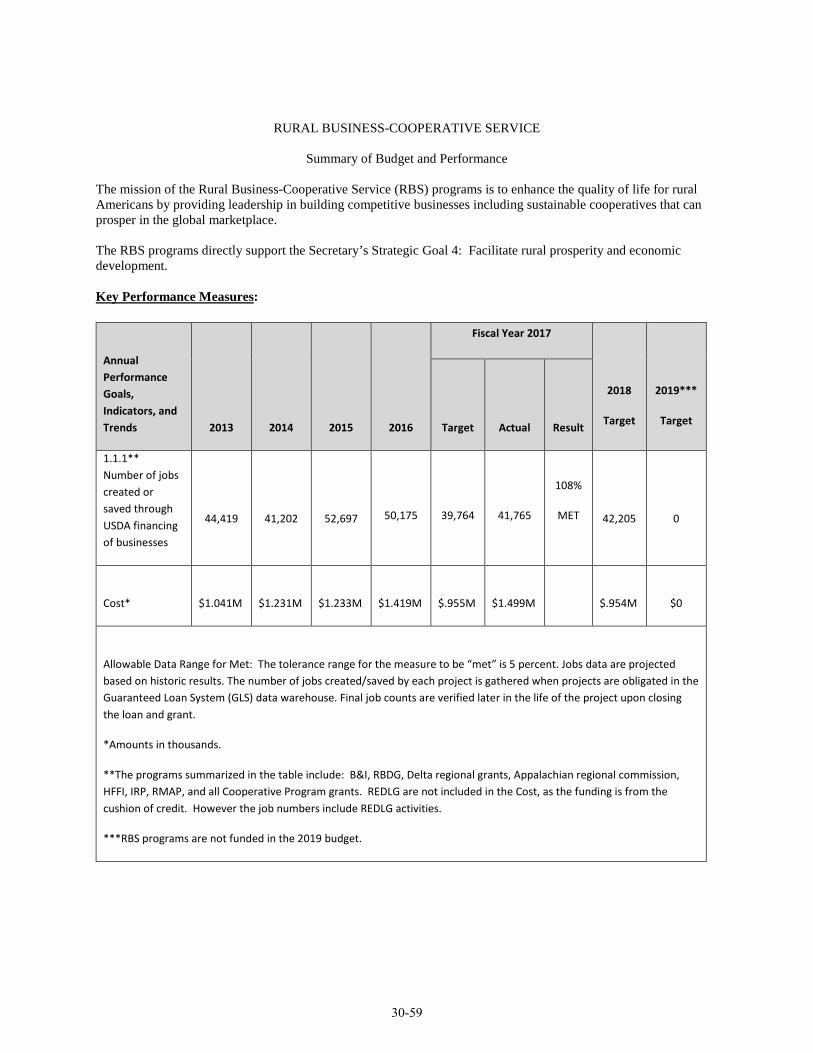
RURAL BUSINESS-COOPERATIVE SERVICE
Summary of Budget and Performance
The mission of the Rural Business-Cooperative Service (RBS) programs is to enhance the quality of life for rural Americans by providing leadership in building competitive businesses including sustainable cooperatives that can prosper in the global marketplace.
The RBS programs directly support the Secretary’s Strategic Goal 4: Facilitate rural prosperity and economic development.
Key Performance Measures:
Annual Performance Goals, Indicators, and Trends 2013 2014 2015 2016
Fiscal Year 2017
2018
Target
2019***
Target Target Actual Result
1.1.1** Number of jobs created or saved through USDA financing of businesses
44,419 41,202 52,697 50,175 39,764 41,765
108%
MET 42,205 0
Cost* $1.041M $1.231M $1.233M $1.419M $.955M $1.499M $.954M $0
Allowable Data Range for Met: The tolerance range for the measure to be “met” is 5 percent. Jobs data are projected based on historic results. The number of jobs created/saved by each project is gathered when projects are obligated in the Guaranteed Loan System (GLS) data warehouse. Final job counts are verified later in the life of the project upon closing the loan and grant.
*Amounts in thousands.
**The programs summarized in the table include: B&I, RBDG, Delta regional grants, Appalachian regional commission, HFFI, IRP, RMAP, and all Cooperative Program grants. REDLG are not included in the Cost, as the funding is from the cushion of credit. However the job numbers include REDLG activities.
***RBS programs are not funded in the 2019 budget.
30-59