2019 nuclear decommissioning funding study
TRANSCRIPT
Research
2019 Nuclear Decommissioning Funding StudyNDT Fund Balances, Annual Contributions, and Decommissioning Cost Estimates as of Dec. 31, 2018

1
Table of Contents
Executive Summary 2
Methodology 4
Investor-Owned Utilities 5
Public Power Utilities 6
Fund Balances 7
Contributions 8
Cost Estimates 9
Funding Status 10
Pro Forma vs. Actual Contributions 12
Cost Comparisons 14
Escalation Rates 15
Asset Allocations 16
NDT Investment Returns 17
Investment Returns of Investor-Owned Utilities 18
Global Nuclear Power Generation 19
Endnotes 20

2
Executive Summary
Callan’s annual Nuclear Decommissioning Funding Study offers key insights into the status of nucleardecommissioning funding in the U.S. to make peer comparisons more accurate and relevant. The 2019study covers 26 investor-owned and 26 public power utilities (excluding public power owners with smallshares)1 with an ownership interest in the 98 operating nuclear reactors and 11 of the non-operatingreactors in the U.S. The number of utilities with an ownership interest declined steadily in the early- tomid-2000s, due primarily to mergers/acquisitions and the sale of nuclear-generating facilities. However,in recent years the number of these utilities has remained fairly steady.
98 Operating Nuclear Power Reactors in the U.S.
(Number of Reactors per State)
Source: Nuclear Energy Institute
West of the Mississippi East of the Mississippi
Decommissioning Funding and ReportingThe U.S. Nuclear Regulatory Commission (NRC) oversees the decommissioning of nuclearfacilities and requires owners to set aside funds for the work. Approximately 70% of licensees areauthorized to accumulate decommissioning funds over the operating life of their plants. Theseowners—generally traditional, rate-regulated utilities—gradually build up the funding fordecommissioning over the plant’s operating life by collecting money from customers through rates,which is then placed in a nuclear decommissioning trust (NDT). The remaining licensees(approximately 30%) must provide financial assurance through other methods, such as prepaiddecommissioning funds and/or a surety method or guarantee.
What Is Nuclear Decommissioning?After a nuclear power plant is closed, the facility must be decommissioned bysafely removing it from service and reducing residual radioactivity to a level thatpermits release of the property and termination of the operating license.Decommissioning involves removing spent fuel from the reactor vessel,dismantling and disposing of radioactive components and materials such as thereactor and piping, and cleaning up any radioactive or hazardous contaminationthat remains on site.
Investor-owned vs. Public Power
1 Public power owners excluded: Dalton Utilities (Edwin Hatch 1 & 2 and Vogtle 1 & 2), Hudson Light and Power Department (Seabrook 1), and Taunton Municipal Lighting Plant (Seabrook 1).
NDT Fund Balances
89%
Cost Estimates
86%
11%
14%
3
Executive Summary
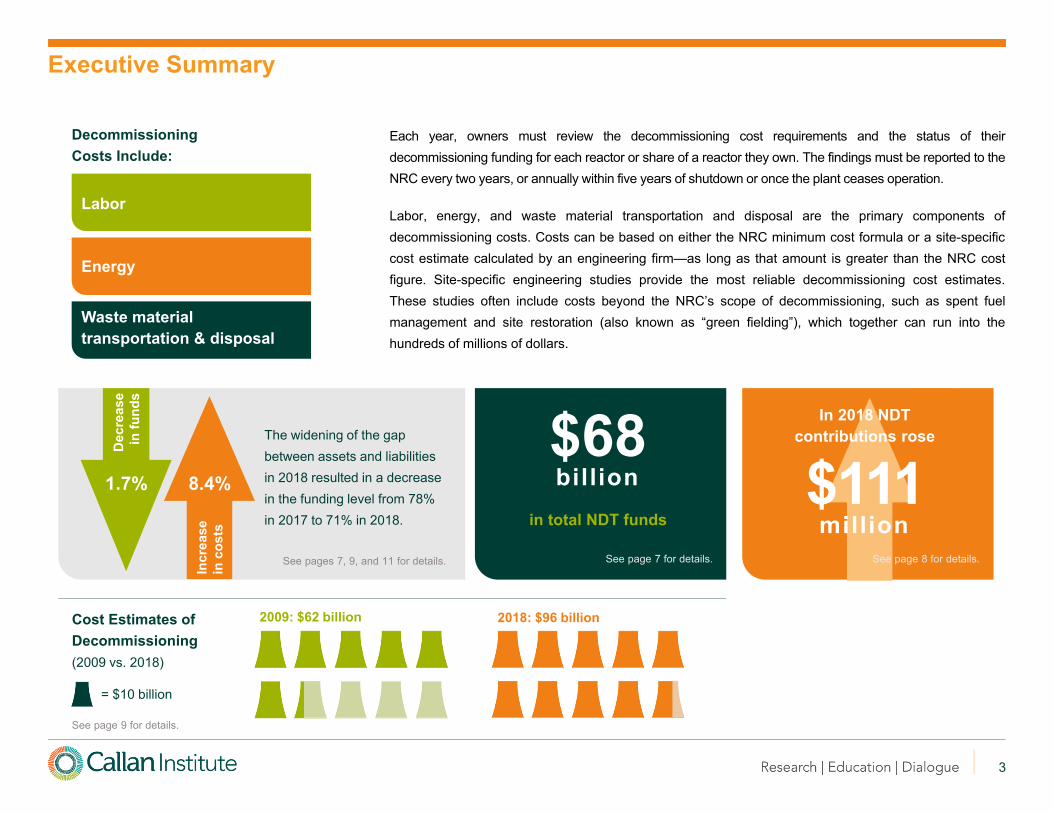
Each year, owners must review the decommissioning cost requirements and the status of theirdecommissioning funding for each reactor or share of a reactor they own. The findings must be reported to theNRC every two years, or annually within five years of shutdown or once the plant ceases operation.
Labor, energy, and waste material transportation and disposal are the primary components ofdecommissioning costs. Costs can be based on either the NRC minimum cost formula or a site-specificcost estimate calculated by an engineering firm—as long as that amount is greater than the NRC costfigure. Site-specific engineering studies provide the most reliable decommissioning cost estimates.These studies often include costs beyond the NRC’s scope of decommissioning, such as spent fuelmanagement and site restoration (also known as “green fielding”), which together can run into thehundreds of millions of dollars.
DecommissioningCosts Include:
Labor
Energy
Waste materialtransportation & disposal
The widening of the gap between assets and liabilities in 2018 resulted in a decrease in the funding level from 78% in 2017 to 71% in 2018.
See pages 7, 9, and 11 for details.
Dec
reas
e in
fund
s
Incr
ease
in
cos
ts
8.4%1.7%
2009: $62 billion 2018: $96 billionCost Estimates of Decommissioning(2009 vs. 2018)
= $10 billion
See page 9 for details.
$68 billion
in total NDT funds
See page 7 for details.
In 2018 NDT contributions rose
$111 million
See page 8 for details.

4
Methodology
This Nuclear Decommissioning Funding Study covers two types of utilities:
1. Investor-owned utilities, which are publicly traded companies that provide for-profit electric service, and
2. Public power utilities, which are operated by local governments to provide not-for-profit electric service.
We list these companies in alphabetical order in two separate tables (pages 5 and 6). For each table, the firstcolumn provides the range of the years of license expiration (Lic Exp) for each unit owned along with theaverage years to expiration in brackets.1 We collected the decommissioning cost estimates, NDT fundbalances, and annual contributions from sources including (but not limited to): company 10-K filings with theSecurities and Exchange Commission (SEC), company decommissioning report filings with the NRC inaccordance with 10 CFR 50.75, and company annual reports. The NRC and Nuclear Energy Institute’swebsites were also valuable resources in collecting and verifying information in this report.
Unless otherwise noted, cost estimates are in 2018 dollars and based on site-specific studies representing the totalcost (license termination, spent fuel management, and site restoration) to decommission the facility. In order tomake the data comparable, we have calculated a “pro forma” decommissioning cost estimate, which is the higher ofeither the company cost estimate of decommissioning or $905/kilowatt (KW). We arrived at $905/KW by taking theaverage cost per KW reported for all investor-owned utilities. Trust fund balances represent liquidation values andinclude any internal reserves dedicated to decommissioning unless otherwise noted. Contributions include those toboth external trust funds and any internal reserves dedicated to decommissioning.
Pro forma fund shortfall is the difference between the “pro forma” cost estimate of decommissioning and thefund balance. Pro forma contribution is the pro forma fund shortfall divided by the average years until licenseexpiration as represented in brackets under the license expiration column. The average years until licenseexpiration weights each unit’s license by its percent of the total megawatts owned by that particular utility, andtakes into account license extensions granted by the NRC as of December 31, 2018.
1 Non-operating units are included in all figures except the range of license expiration years.
5
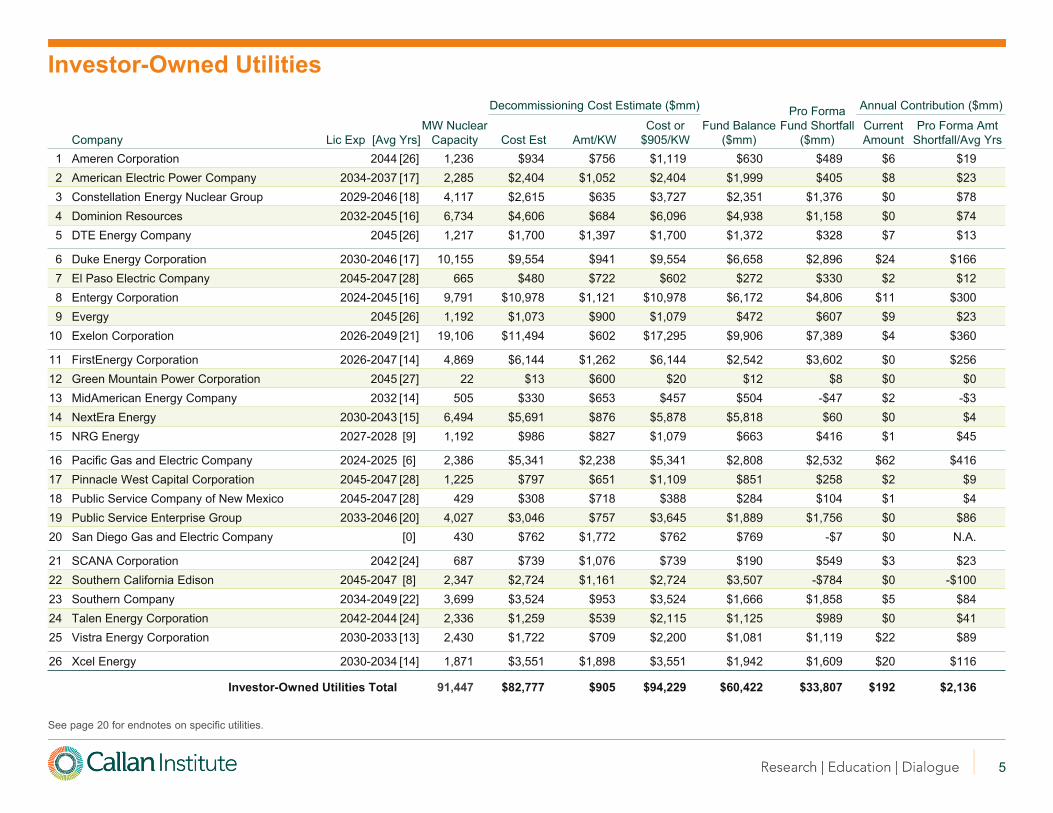
Investor-Owned Utilities
See page 20 for endnotes on specific utilities.
Decommissioning Cost Estimate ($mm) Pro Forma Fund Shortfall
($mm)
Annual Contribution ($mm)
Company Lic Exp [Avg Yrs]MW Nuclear
Capacity Cost Est Amt/KWCost or
$905/KWFund Balance
($mm)Current Amount
Pro Forma Amt Shortfall/Avg Yrs
1 Ameren Corporation 2044 [26] 1,236 $934 $756 $1,119 $630 $489 $6 $192 American Electric Power Company 2034-2037 [17] 2,285 $2,404 $1,052 $2,404 $1,999 $405 $8 $233 Constellation Energy Nuclear Group 2029-2046 [18] 4,117 $2,615 $635 $3,727 $2,351 $1,376 $0 $784 Dominion Resources 2032-2045 [16] 6,734 $4,606 $684 $6,096 $4,938 $1,158 $0 $745 DTE Energy Company 2045 [26] 1,217 $1,700 $1,397 $1,700 $1,372 $328 $7 $13
6 Duke Energy Corporation 2030-2046 [17] 10,155 $9,554 $941 $9,554 $6,658 $2,896 $24 $1667 El Paso Electric Company 2045-2047 [28] 665 $480 $722 $602 $272 $330 $2 $128 Entergy Corporation 2024-2045 [16] 9,791 $10,978 $1,121 $10,978 $6,172 $4,806 $11 $3009 Evergy 2045 [26] 1,192 $1,073 $900 $1,079 $472 $607 $9 $23
10 Exelon Corporation 2026-2049 [21] 19,106 $11,494 $602 $17,295 $9,906 $7,389 $4 $360
11 FirstEnergy Corporation 2026-2047 [14] 4,869 $6,144 $1,262 $6,144 $2,542 $3,602 $0 $25612 Green Mountain Power Corporation 2045 [27] 22 $13 $600 $20 $12 $8 $0 $013 MidAmerican Energy Company 2032 [14] 505 $330 $653 $457 $504 -$47 $2 -$314 NextEra Energy 2030-2043 [15] 6,494 $5,691 $876 $5,878 $5,818 $60 $0 $415 NRG Energy 2027-2028 [9] 1,192 $986 $827 $1,079 $663 $416 $1 $45
16 Pacific Gas and Electric Company 2024-2025 [6] 2,386 $5,341 $2,238 $5,341 $2,808 $2,532 $62 $41617 Pinnacle West Capital Corporation 2045-2047 [28] 1,225 $797 $651 $1,109 $851 $258 $2 $918 Public Service Company of New Mexico 2045-2047 [28] 429 $308 $718 $388 $284 $104 $1 $419 Public Service Enterprise Group 2033-2046 [20] 4,027 $3,046 $757 $3,645 $1,889 $1,756 $0 $8620 San Diego Gas and Electric Company [0] 430 $762 $1,772 $762 $769 -$7 $0 N.A.
21 SCANA Corporation 2042 [24] 687 $739 $1,076 $739 $190 $549 $3 $2322 Southern California Edison 2045-2047 [8] 2,347 $2,724 $1,161 $2,724 $3,507 -$784 $0 -$10023 Southern Company 2034-2049 [22] 3,699 $3,524 $953 $3,524 $1,666 $1,858 $5 $8424 Talen Energy Corporation 2042-2044 [24] 2,336 $1,259 $539 $2,115 $1,125 $989 $0 $4125 Vistra Energy Corporation 2030-2033 [13] 2,430 $1,722 $709 $2,200 $1,081 $1,119 $22 $89
26 Xcel Energy 2030-2034 [14] 1,871 $3,551 $1,898 $3,551 $1,942 $1,609 $20 $116
Investor-Owned Utilities Total 91,447 $82,777 $905 $94,229 $60,422 $33,807 $192 $2,136

6
Public Power Utilities
See page 21 for endnotes on specific utilities.
Decommissioning Cost Estimate ($mm)
Fund Balance($mm)
Pro Forma Fund Shortfall
($mm)
Annual Contribution ($mm)
Company Lic Exp [Avg Yrs]MW Nuclear
Capacity Cost Est Amt/KWCost or
$905/KWCurrent Amount
Pro Forma Amt Shortfall/Avg Yrs
1 Allegheny Electric Cooperative 2042-2044 [24] 260 $140 $538 $235 $137 $98 $0 $42 Austin Energy (City of Austin, TX) 2027-2028 [9] 433 $359 $828 $392 $221 $171 $0 $183 Central Iowa Power Cooperative 2034 [15] 136 $191 $1,404 $191 $120 $71 $0 $54 Corn Belt Power Cooperative 2034 [15] 68 $83 $1,226 $83 $50 $33 $0 $25 CPS Energy (City of San Antonio, TX) 2027-2028 [9] 1,083 $897 $828 $980 $589 $391 $0 $42
6 Energy Northwest 2043 [25] 1,200 $593 $494 $1,086 $314 $772 $1 $317 Florida Municipal Power Agency 2043 [24] 95 $65 $684 $86 $82 $4 $0 $08 Kansas Electric Power Cooperative 2045 [26] 76 $46 $604 $69 $25 $44 $1 $29 Long Island Power Authority 2046 [28] 227 $177 $779 $205 $125 $80 $0 $3
10 Los Angeles Department of Water and Power 2045-2047 [28] 240 $172 $717 $217 $137 $80 $0 $3
11 Massachusetts Muni Wholesale Electric Co 2030-2045 [16] 204 $145 $709 $185 $119 $65 $2 $412 Municipal Electric Authority of Georgia 2034-2049 [25] 831 $758 $912 $758 $472 $287 $0 $1213 Nebraska Public Power District 2034 [15] 801 $636 $794 $725 $600 $125 $0 $814 N Carolina Electric Membership Corp 2043 [25] 741 $598 $807 $671 $231 $440 $3 $1815 N Carolina Muni Power Agency No 1 2043 [25] 904 $667 $737 $818 $346 $472 $4 $19
16 Oglethorpe Power Corporation 2034-2049 [24] 1,213 $1,128 $930 $1,128 $510 $618 $5 $2617 Old Dominion Electric Cooperative 2038-2040 [20] 211 $130 $616 $191 $174 $17 $0 $118 Omaha Public Power District [0] 484 $1,213 $2,507 $1,213 $543 $670 $156 N.A.19 Orlando Utilities Commission 2043 [24] 66 $53 $802 $60 $43 $16 $0 $120 Piedmont Municipal Power Agency 2043 [25] 301 $222 $738 $272 $79 $193 $1 $8
21 Riverside Public Utilities [0] 38 $55 $1,459 $55 $65 -$10 $2 N.A.22 Salt River Project 2045-2047 [28] 736 $427 $580 $666 $402 $264 $0 $1023 South Carolina Public Service Authority 2042 [24] 343 $335 $978 $335 $209 $126 $0 $524 South Mississippi Electric Power Assoc 2044 [26] 144 $123 $855 $130 $75 $55 $4 $225 Southern Calif Public Power Authority 2045-2047 [28] 249 $162 $650 $225 $178 $47 $0 $2
26 Tennessee Valley Authority 2033-2055 [21] 8,476 $4,045 $477 $7,672 $1,874 $5,799 $0 $275
Public Power Utilities Total 19,560 $13,419 $686 $18,652 $7,722 $10,931 $177 $499
7
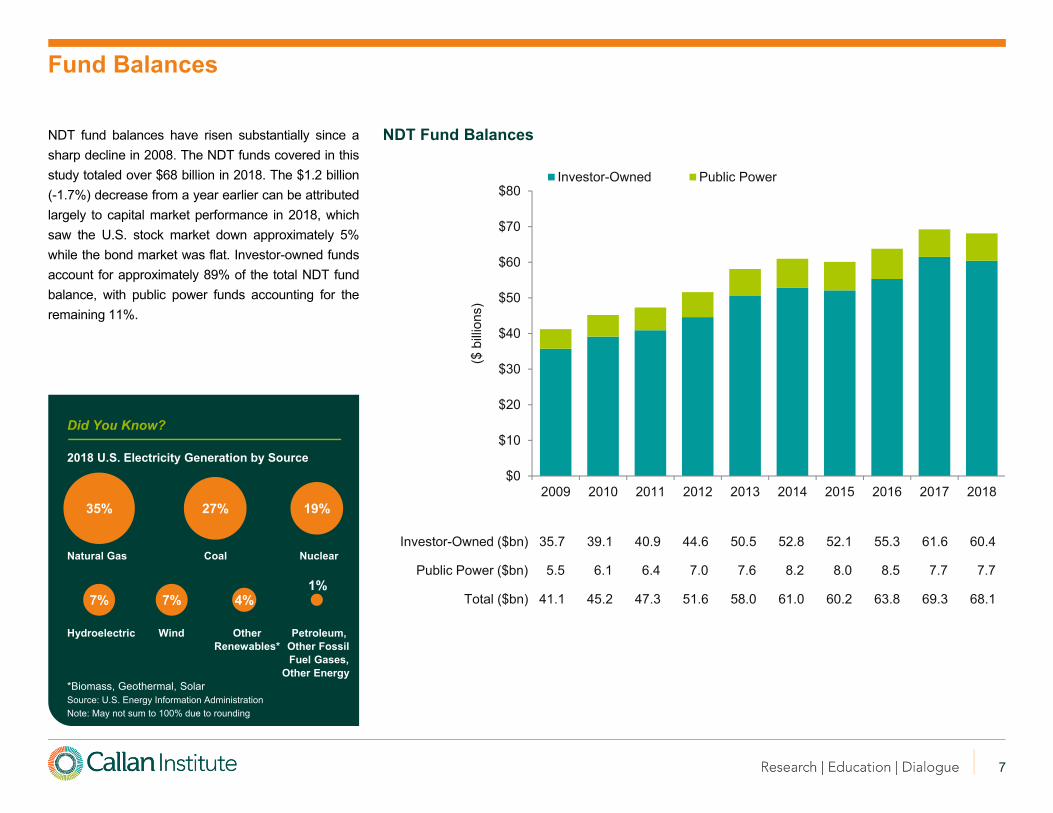
Did You Know?
2018 U.S. Electricity Generation by Source
Natural Gas Coal Nuclear
Hydroelectric Wind Other Petroleum,Renewables* Other Fossil
Fuel Gases,Other Energy
*Biomass, Geothermal, SolarSource: U.S. Energy Information AdministrationNote: May not sum to 100% due to rounding
NDT fund balances have risen substantially since asharp decline in 2008. The NDT funds covered in thisstudy totaled over $68 billion in 2018. The $1.2 billion(-1.7%) decrease from a year earlier can be attributedlargely to capital market performance in 2018, whichsaw the U.S. stock market down approximately 5%while the bond market was flat. Investor-owned fundsaccount for approximately 89% of the total NDT fundbalance, with public power funds accounting for theremaining 11%.
$0
$10
$20
$30
$40
$50
$60
$70
$80
2009 2010 2011 2012 2013 2014 2015 2016 2017 2018($
bill
ions
)
Investor-Owned Public Power
Fund Balances
NDT Fund Balances
Investor-Owned ($bn) 35.7 39.1 40.9 44.6 50.5 52.8 52.1 55.3 61.6 60.4
Public Power ($bn) 5.5 6.1 6.4 7.0 7.6 8.2 8.0 8.5 7.7 7.7
Total ($bn) 41.1 45.2 47.3 51.6 58.0 61.0 60.2 63.8 69.3 68.1
35% 27% 19%
7% 7% 4%1%

8
Total contributions rose in 2018 after falling for threestraight years. The $111 million (43%) increase from$258 million in 2017 to $369 million in 2018 is largelydue to a $156 million contribution by Omaha PublicPower District (OPPD) on behalf of its Fort Calhounplant, which closed in 2016. Total contributions wouldhave fallen by $45 million without the OPPDcontribution. In 2018, investor-owned contributionswere roughly 50% of their 2009 level while publicpower contributions were almost 4x their 2009 level(though less than half when excluding the OPPDcontribution).
$0
$100
$200
$300
$400
$500
$600
2009 2010 2011 2012 2013 2014 2015 2016 2017 2018($
mill
ions
)
Investor-Owned Public Power
Contributions
Annual Contributions to NDT Funds
Investor-Owned ($mm) 407 429 424 388 315 344 335 271 230 192
Public Power ($mm) 46 57 20 18 18 25 27 27 28 177
Total ($mm) 453 486 444 406 333 369 362 298 258 369
Did You Know?
The top five U.S. states in terms of number of operating nuclear power reactors:
1. Illinois (11)
2. Pennsylvania (9)
3. South Carolina (7)
4. New York (6)
5. Alabama and North Carolina (tie 5 each)
Source: Nuclear Energy Institute

9
Total decommissioning cost estimates have risensince a low of $55 billion in 2008. After hovering closeto $90 billion for several years, cost estimates rose$7.4 billion (8.4%) from a year earlier to over $96billion in 2018. The rise is largely a combination ofnew and updated cost figures.
Similar to NDT fund balances, investor-owned costshave accounted for over four-fifths of total costs overthe past decade, with public power costs accountingfor less than one-fifth.
$0
$20
$40
$60
$80
$100
$120
2009 2010 2011 2012 2013 2014 2015 2016 2017 2018($
bill
ions
)
Investor-Owned Public Power
Cost Estimates
Cost Estimates of Decommissioning in Current Dollars
Investor-Owned ($bn) 50.8 57.7 59.3 64.0 66.6 74.4 76.3 76.0 75.9 82.8
Public Power ($bn) 10.6 11.7 11.2 12.1 12.8 13.6 13.5 15.1 13.0 13.4
Total ($bn) 61.5 69.4 70.5 76.2 79.4 88.1 89.9 91.0 88.8 96.2
Did You Know?
Of the U.S. operating nuclear power plants:
Largest: Palo Verde in Arizona (4,209 MW)
Smallest: R.E. Ginna in New York (614 MW)
Oldest: Nine Mile Point 1 in New York (1969)
Newest: Watts Bar in Tennessee (2016)
Source: Nuclear Energy Institute
10
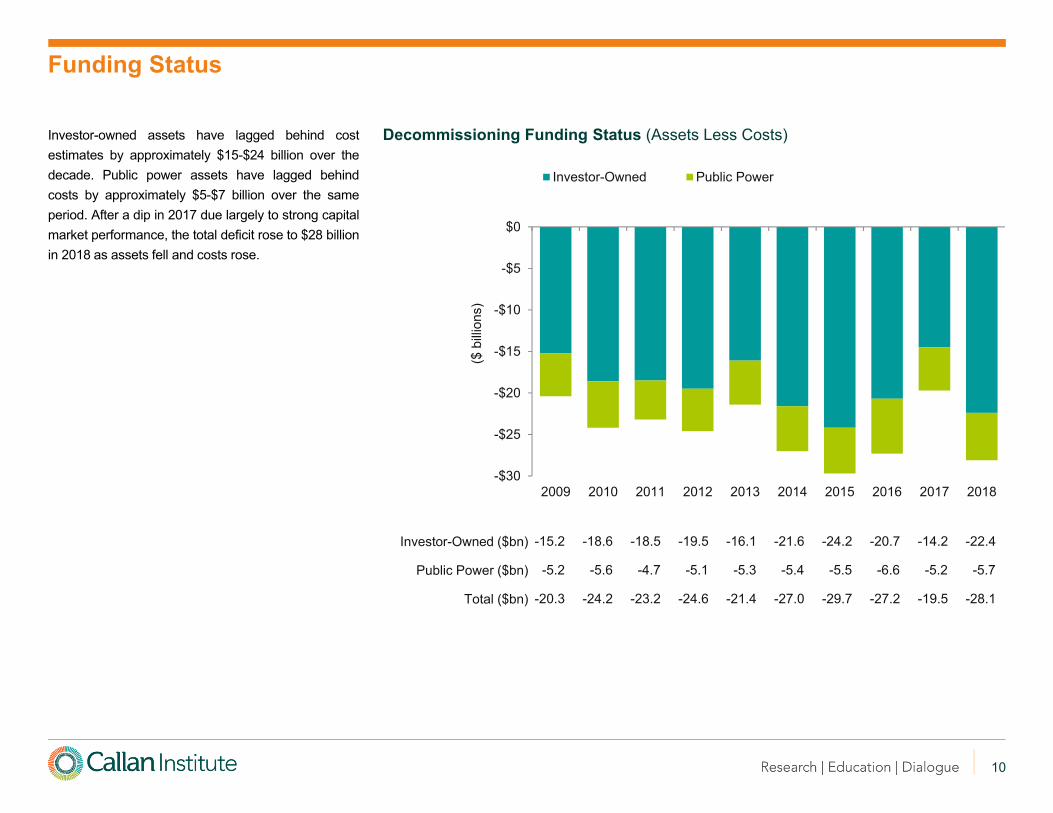
Investor-owned assets have lagged behind costestimates by approximately $15-$24 billion over thedecade. Public power assets have lagged behindcosts by approximately $5-$7 billion over the sameperiod. After a dip in 2017 due largely to strong capitalmarket performance, the total deficit rose to $28 billionin 2018 as assets fell and costs rose.
-$30
-$25
-$20
-$15
-$10
-$5
$0
2009 2010 2011 2012 2013 2014 2015 2016 2017 2018($
bill
ions
)
Investor-Owned Public Power
Funding Status
Decommissioning Funding Status (Assets Less Costs)
Investor-Owned ($bn) -15.2 -18.6 -18.5 -19.5 -16.1 -21.6 -24.2 -20.7 -14.2 -22.4
Public Power ($bn) -5.2 -5.6 -4.7 -5.1 -5.3 -5.4 -5.5 -6.6 -5.2 -5.7
Total ($bn) -20.3 -24.2 -23.2 -24.6 -21.4 -27.0 -29.7 -27.2 -19.5 -28.1

11
40%
50%
60%
70%
80%
90%
2009 2010 2011 2012 2013 2014 2015 2016 2017 2018
Investor-Owned Public Power Total
Funding Status
Decommissioning Funding Status (Assets as Percentage of Costs)
Investor-Owned 70.2% 67.8% 68.9% 69.6% 75.8% 70.9% 68.3% 72.8% 81.2% 73.0%
Public Power 51.4% 52.2% 57.8% 57.7% 58.8% 60.4% 59.4% 56.5% 59.7% 57.5%
Total 66.9% 65.2% 67.1% 67.7% 73.1% 69.3% 66.9% 70.1% 78.1% 70.8%
Total funding stood at 71% in 2018, a 7 percentagepoint decline from the previous year. The fundedstatus decline is due to a combination of weakcapital market performance in 2018 (U.S. stocksdown over 5% while bonds were flat) and an 8.4%rise in cost estimates. Assets as a percentage ofcosts essentially dropped back to their 2016 levelsfor both investor-owned and public power utilities.
Did You Know?
There are currently 98 nuclear power reactors operating in the U.S. in 30 states.
Watts Bar 2 began commercial operation in 2016, the first nuclear power plant to come online in the U.S. since Watts Bar 1 in 1996.
2018 saw the closure of Oyster Creek in New Jersey.
65 are pressurized water reactors.
33 are boiling water reactors.
While two reactors are currently under construction (Vogtle 3 & 4 in Georgia), a number of plants are expected to close in the coming years absent ratepayer and/or government bailouts.
Source: Nuclear Energy Institute
12
1,49
0
1,13
7
1,15
6
901 1,
003
1,03
5 1,22
5
1,16
0
1,43
0
1,31
4
1,74
8
1,86
5
1,78
0
1,44
6
2,13
6
892
703
564
449
461
407
429
424
388
315
339
335
271
230
192
$0
$400
$800
$1,200
$1,600
$2,000
$2,400
2004 2005 2006 2007 2008 2009 2010 2011 2012 2013 2014 2015 2016 2017 2018
($ m
illio
ns)
Pro Forma Actual
Investor-Owned Pro Forma Contributions vs. Actual Contributions
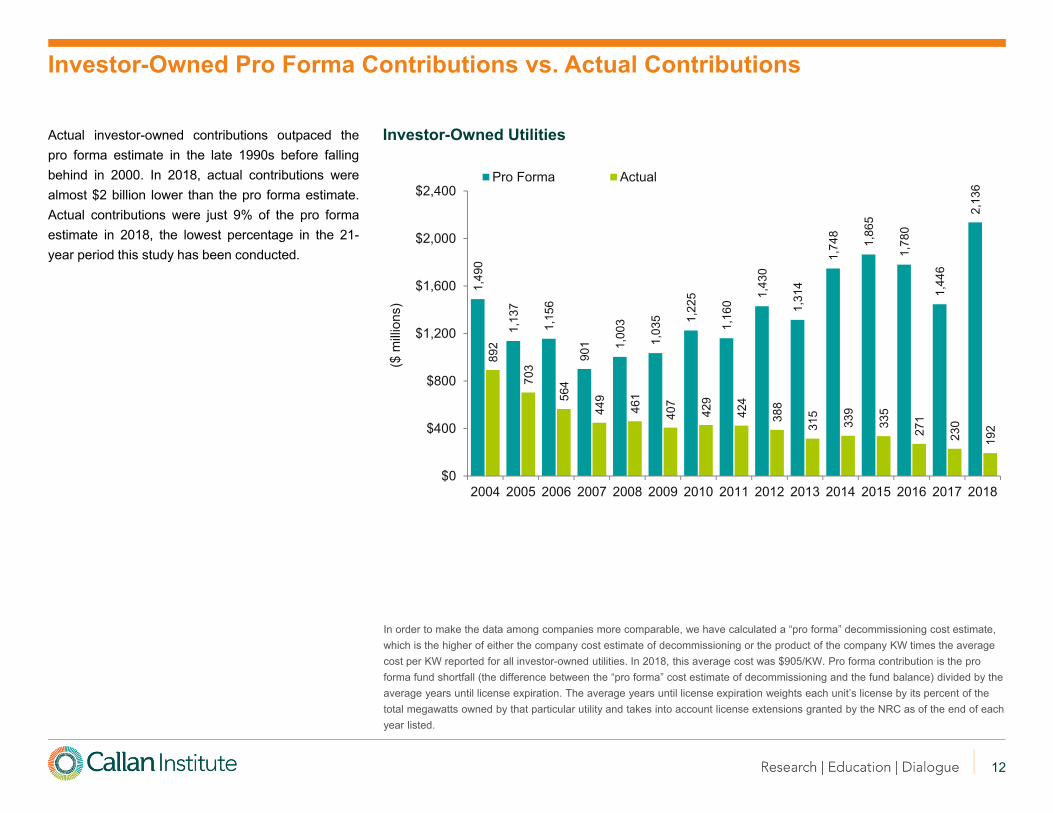
Actual investor-owned contributions outpaced thepro forma estimate in the late 1990s before fallingbehind in 2000. In 2018, actual contributions werealmost $2 billion lower than the pro forma estimate.Actual contributions were just 9% of the pro formaestimate in 2018, the lowest percentage in the 21-year period this study has been conducted.
Investor-Owned Utilities
In order to make the data among companies more comparable, we have calculated a “pro forma” decommissioning cost estimate, which is the higher of either the company cost estimate of decommissioning or the product of the company KW times the averagecost per KW reported for all investor-owned utilities. In 2018, this average cost was $905/KW. Pro forma contribution is the pro forma fund shortfall (the difference between the “pro forma” cost estimate of decommissioning and the fund balance) divided by the average years until license expiration. The average years until license expiration weights each unit’s license by its percent of the total megawatts owned by that particular utility and takes into account license extensions granted by the NRC as of the end of each year listed.

13
402
401
405
376
321
386 40
6
369
426 46
5
543
484 51
4
405
499
84 87 100
109
101
46 57
19 18 18 25 27 27 28
177
$0
$100
$200
$300
$400
$500
$600
2004 2005 2006 2007 2008 2009 2010 2011 2012 2013 2014 2015 2016 2017 2018
($ m
illio
ns)
Pro Forma Actual
Public Power Pro Forma Contributions vs. Actual Contributions
Actual public power contributions have lagged wellbehind the pro forma estimate from 2004 to 2018. Proforma contributions grew from $402 million in 2004 to$499 million in 2018. Actual contributions show aspike in 2018 that is due in large part to the $156million contribution by Omaha Public Power District(OPPD) on behalf of its Fort Calhoun plant, whichclosed in 2016. Actual 2018 public powercontributions are just $21 million when excluding theOPPD contribution. Actual contributions as apercentage of the pro forma estimate were at a high of43% in 1998, but have fallen to just 4% in 2018(excluding the OPPD contribution).
Public Power Utilities
In order to make the data among companies more comparable, we have calculated a “pro forma” decommissioning cost estimate, which is the higher of either the company cost estimate of decommissioning or the product of the company KW times the averagecost per KW reported for all investor-owned utilities. In 2018, this average cost was $905/KW. Pro forma contribution is the proforma fund shortfall (the difference between the “pro forma” cost estimate of decommissioning and the fund balance) divided by the average years until license expiration. The average years until license expiration weights each unit’s license by its percent of the total megawatts owned by that particular utility and takes into account license extensions granted by the NRC as of the end of each year listed.
Did You Know?
Public vs. Investor-Owned Generation Capacity
Source: Nuclear Energy Institute
Investor-owned
82%
Public power
18%

14
0%
100%
200%
300%
Cost Comparisons
We gather both NRC and site-specific total costestimates where possible in order to capture therelative magnitude of the two figures. This page isupdated biennially to coincide with the NRC’s filingschedule.
Site-specific cost estimates totaled approximately $80billion versus $42 billion under the NRC minimumformula in 2018, a difference of $38 billion. Themedian site-specific total cost estimate was 1.86 timesthe NRC minimum formula amount for all plantsregardless of ownership. Assuming licensetermination costs (the NRC portion ofdecommissioning) represent approximately 60% oftotal site-specific costs, the NRC formula amounts areroughly in line with the site-specific estimates forlicense termination. Taking the assumption one stepfurther, if the license termination portions of the site-specific estimates are roughly in line with the NRCformula amounts, then spent fuel management andsite restoration costs are what account for most of theadditional $38 billion in decommissioning costs.
The distributions are positively skewed, which resultsin average cost comparison figures that areapproximately 7%–9% greater in absolute terms thanthe medians.
Decommissioning Cost Comparisons (Site-Specific Total/NRC Minimum)
AllInvestor-Owned
Public Power
25th percentile 219% 220% 208%
Median 186% 186% 180%
75th percentile 157% 157% 162%
Average 193% 194% 189%
Notes
This page is updated biennially to coincide with the NRC’s filing schedule.
Bars depict the 5th to 95th
percentile range of cost comparisons (site-specific total/NRC minimum) while the darker shading represents the 25th to 75th percentiles. The percentages to the left show site-specific cost estimates as a percentage of the NRC minimum formula amounts. The data set includes 2018 cost estimates for 82 reactors (51 plants) owned by 37 utilities.
Source: Nuclear Energy Institute
Total Investor-Owned Public Power
3751
82
Utilities Plants Reactors
Dataset Breakdown
15
0%
1%
2%
3%
4%
5%
6%
Escalation Rates
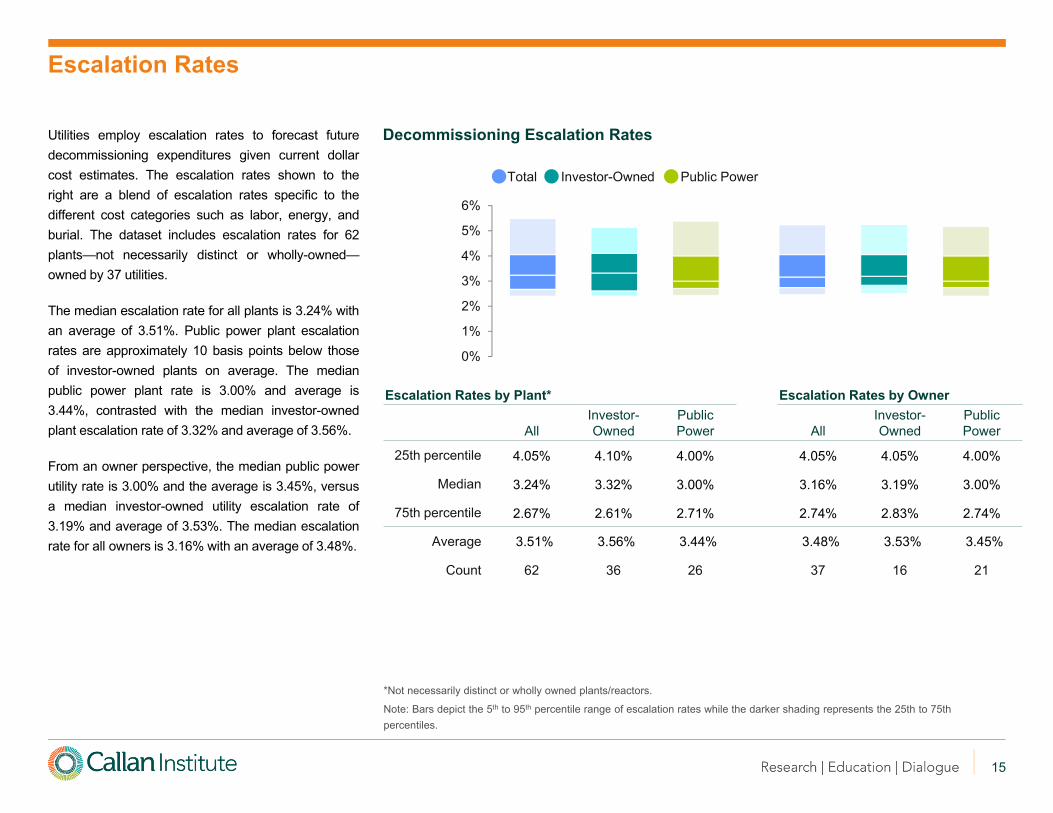
Utilities employ escalation rates to forecast futuredecommissioning expenditures given current dollarcost estimates. The escalation rates shown to theright are a blend of escalation rates specific to thedifferent cost categories such as labor, energy, andburial. The dataset includes escalation rates for 62plants—not necessarily distinct or wholly-owned—owned by 37 utilities.
The median escalation rate for all plants is 3.24% withan average of 3.51%. Public power plant escalationrates are approximately 10 basis points below thoseof investor-owned plants on average. The medianpublic power plant rate is 3.00% and average is3.44%, contrasted with the median investor-ownedplant escalation rate of 3.32% and average of 3.56%.
From an owner perspective, the median public powerutility rate is 3.00% and the average is 3.45%, versusa median investor-owned utility escalation rate of3.19% and average of 3.53%. The median escalationrate for all owners is 3.16% with an average of 3.48%.
Decommissioning Escalation Rates
Escalation Rates by Plant* Escalation Rates by Owner
AllInvestor-Owned
Public Power All
Investor-Owned
Public Power
25th percentile 4.05% 4.10% 4.00% 4.05% 4.05% 4.00%
Median 3.24% 3.32% 3.00% 3.16% 3.19% 3.00%
75th percentile 2.67% 2.61% 2.71% 2.74% 2.83% 2.74%
Average 3.51% 3.56% 3.44% 3.48% 3.53% 3.45%
Count 62 36 26 37 16 21
*Not necessarily distinct or wholly owned plants/reactors.
Note: Bars depict the 5th to 95th percentile range of escalation rates while the darker shading represents the 25th to 75th percentiles.
Total Investor-Owned Public Power
16
0%
20%
40%
60%
80%
Asset Allocations
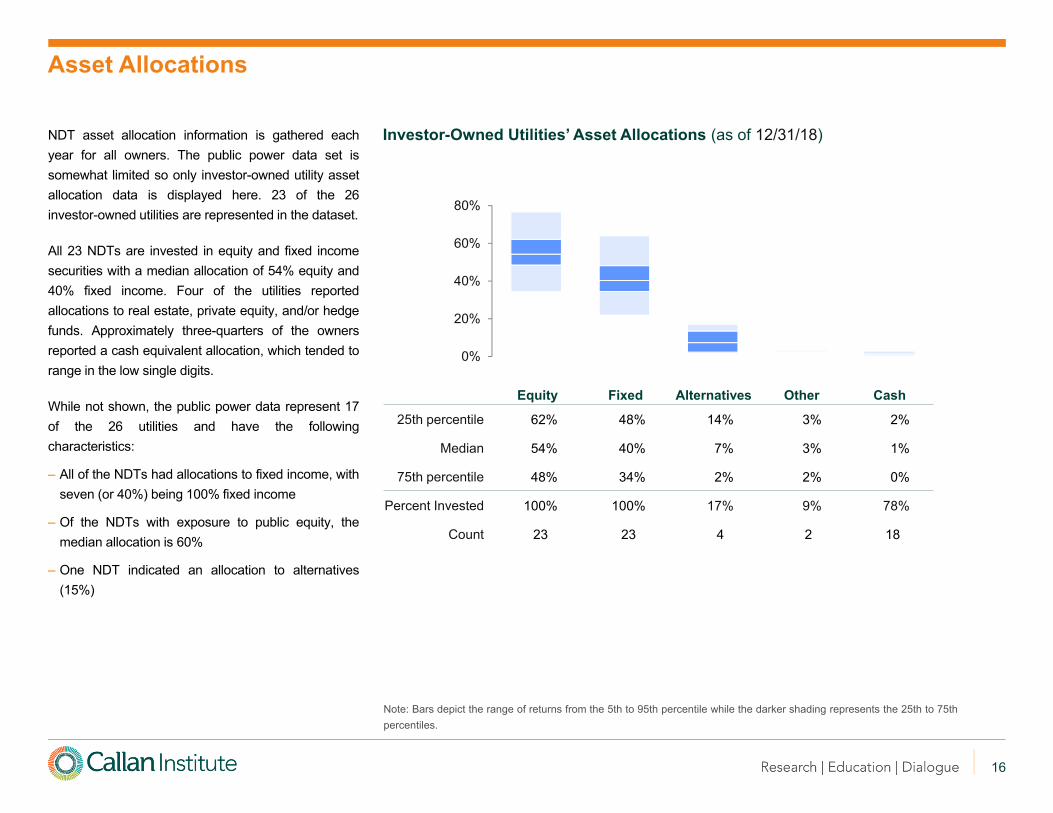
NDT asset allocation information is gathered eachyear for all owners. The public power data set issomewhat limited so only investor-owned utility assetallocation data is displayed here. 23 of the 26investor-owned utilities are represented in the dataset.
All 23 NDTs are invested in equity and fixed incomesecurities with a median allocation of 54% equity and40% fixed income. Four of the utilities reportedallocations to real estate, private equity, and/or hedgefunds. Approximately three-quarters of the ownersreported a cash equivalent allocation, which tended torange in the low single digits.
While not shown, the public power data represent 17of the 26 utilities and have the followingcharacteristics:
– All of the NDTs had allocations to fixed income, withseven (or 40%) being 100% fixed income
– Of the NDTs with exposure to public equity, themedian allocation is 60%
– One NDT indicated an allocation to alternatives(15%)
Investor-Owned Utilities’ Asset Allocations (as of 12/31/18)
Note: Bars depict the range of returns from the 5th to 95th percentile while the darker shading represents the 25th to 75th percentiles.
Equity Fixed Alternatives Other Cash
25th percentile 62% 48% 14% 3% 2%
Median 54% 40% 7% 3% 1%
75th percentile 48% 34% 2% 2% 0%
Percent Invested 100% 100% 17% 9% 78%
Count 23 23 4 2 18

17
-8%
-6%
-4%
-2%
0%
2%
4%
NDT Investment Returns
NDT investment returns are shown for the one-yearperiod ended December 31, 2018. The data setincludes gross returns for 25 owners covering 39plants and 69 units—not necessarily distinct or wholly-owned. Returns for trusts of closed units are omittedfrom the data shown here.
The vast majority of returns are clustered in thenegative single-digits. The median return for all trustsis -3.2% with an average of -3.1%. Not a single trustreported a double-digit return either on the upside ordownside.
Public power trust returns are 81 basis points abovethose of investor-owned trusts on average and exhibita much wider range of results due to a number oftrusts being 100% fixed income.
The median investor-owned return is -3.1% with anaverage of -3.4%, contrasted with the median publicpower return of -3.7% and average of -2.6%.
Investment Returns (year ended 12/31/18)
Note: Bars depict the range of returns from the 5th to 95th percentile while the darker shading represents the 25th to 75th percentiles.
AllInvestor-Owned
Public Power
25th percentile -2.3% -2.7% 1.6%
Median -3.2% -3.1% -3.7%
75th percentile -4.6% -4.2% -5.3%
Average -3.1% -3.4% -2.6%
Dataset Breakdown
1225
451314
24
2539
69
Utilities Plants Reactors
Total
Public Power
Investor-Owned

18
-50%
-25%
0%
25%
50%
Investment Returns of Investor-Owned Utilities
We show the range of returns for 23 of the 26investor-owned utility parent organizations for periodsended December 31, 2018. The median investor-owned utility corporation with nuclear power reactorsoutperformed the S&P 500 Utilities Index over allperiods while outperforming the broad market S&P500 Index in four of the five periods.
Investor-Owned Utilities’ Returns (as of 12/31/18)
Last Quarter Last YearLast 3Years
Last 5 Years
Last 10 Years
25th percentile 6.0% 14.3% 15.1% 14.5% 14.7%
Median 3.9% 5.4% 13.2% 11.4% 11.9%
75th percentile -4.1% 2.8% 7.5% 7.1% 6.7%
S&P 500 Utilities 1.4% 4.1% 10.7% 10.7% 10.5%
S&P 500 -13.5% -4.4% 9.3% 8.5% 13.1%
Count 23 23 22 22 22
Note: Bars depict the range of returns from the 5th to 95th percentile while the darker shading represents the 25th to 75th percentiles.

19
Global Nuclear Power Generation
Source: International Atomic Energy Agency; 2018 data
#1 United States807.1 bn kWh19.3% total electricity98 operating units
#2 France395.9 bn kWh71.7% total electricity58 operating units
#3 China277.1 bn kWh4.2% total electricity46 operating units
#4 Russia191.3 bn kWh17.9% total electricity36 operating units
#5 South Korea127.1 bn kWh23.7% total electricity24 operating units
#6 Canada94.5 bn kWh14.9% total electricity19 operating units
#7 Ukraine79.5 bn kWh53.0% total electricity15 operating units
#8 Germany71.9 bn kWh11.7% total electricity7 operating units
#9 Sweden65.9 bn kWh40.3% total electricity8 operating units
#10 United Kingdom59.1 bn kWh17.7% total electricity15 operating units
Top 10 Countries by Nuclear Power as a Percentage of Total Electricity Generation
CountryShare of Total
Electricity
France 71.7%
Slovakia 55.0%
Ukraine 53.0%
Hungary 50.6%
Sweden 40.3%
Belgium 39.0%
Switzerland 37.7%
Slovenia 35.9%
Bulgaria 34.7%
Czech Republic 34.5%
20
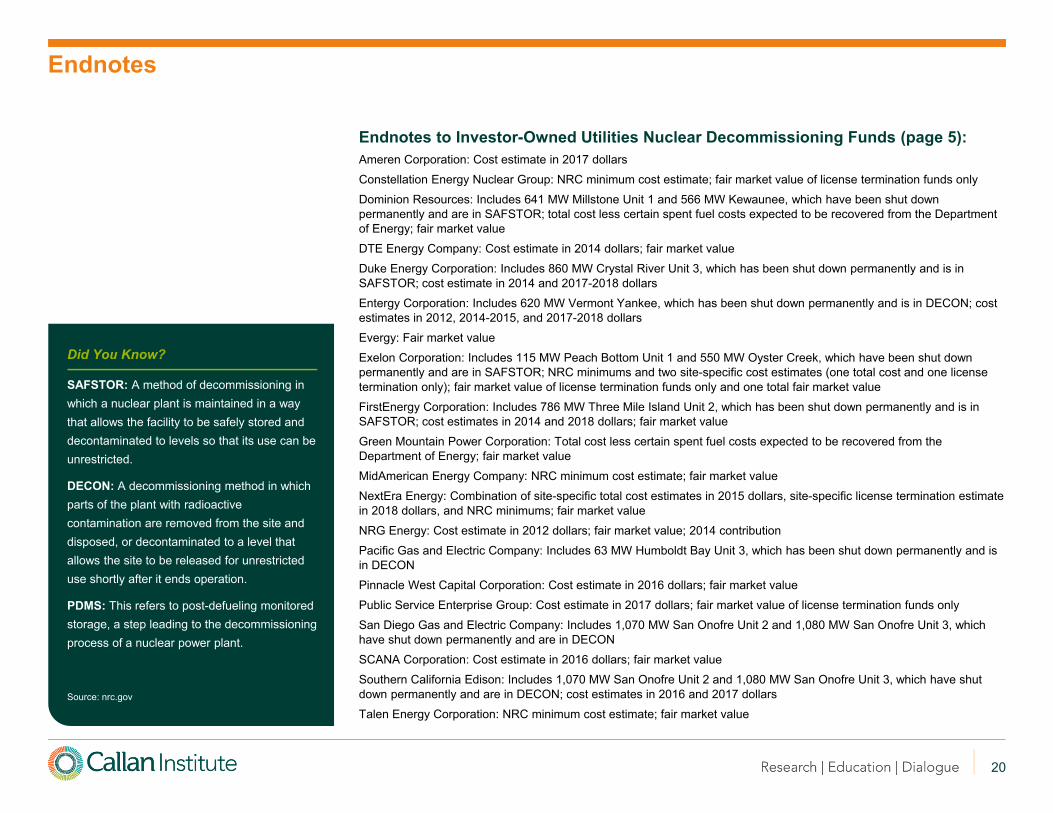
Endnotes
Endnotes to Investor-Owned Utilities Nuclear Decommissioning Funds (page 5):Ameren Corporation: Cost estimate in 2017 dollars
Constellation Energy Nuclear Group: NRC minimum cost estimate; fair market value of license termination funds only
Dominion Resources: Includes 641 MW Millstone Unit 1 and 566 MW Kewaunee, which have been shut down permanently and are in SAFSTOR; total cost less certain spent fuel costs expected to be recovered from the Department of Energy; fair market value
DTE Energy Company: Cost estimate in 2014 dollars; fair market value
Duke Energy Corporation: Includes 860 MW Crystal River Unit 3, which has been shut down permanently and is in SAFSTOR; cost estimate in 2014 and 2017-2018 dollars
Entergy Corporation: Includes 620 MW Vermont Yankee, which has been shut down permanently and is in DECON; cost estimates in 2012, 2014-2015, and 2017-2018 dollars
Evergy: Fair market value
Exelon Corporation: Includes 115 MW Peach Bottom Unit 1 and 550 MW Oyster Creek, which have been shut down permanently and are in SAFSTOR; NRC minimums and two site-specific cost estimates (one total cost and one license termination only); fair market value of license termination funds only and one total fair market value
FirstEnergy Corporation: Includes 786 MW Three Mile Island Unit 2, which has been shut down permanently and is in SAFSTOR; cost estimates in 2014 and 2018 dollars; fair market value
Green Mountain Power Corporation: Total cost less certain spent fuel costs expected to be recovered from the Department of Energy; fair market value
MidAmerican Energy Company: NRC minimum cost estimate; fair market value
NextEra Energy: Combination of site-specific total cost estimates in 2015 dollars, site-specific license termination estimate in 2018 dollars, and NRC minimums; fair market value
NRG Energy: Cost estimate in 2012 dollars; fair market value; 2014 contribution
Pacific Gas and Electric Company: Includes 63 MW Humboldt Bay Unit 3, which has been shut down permanently and is in DECON
Pinnacle West Capital Corporation: Cost estimate in 2016 dollars; fair market value
Public Service Enterprise Group: Cost estimate in 2017 dollars; fair market value of license termination funds only
San Diego Gas and Electric Company: Includes 1,070 MW San Onofre Unit 2 and 1,080 MW San Onofre Unit 3, which have shut down permanently and are in DECON
SCANA Corporation: Cost estimate in 2016 dollars; fair market value
Southern California Edison: Includes 1,070 MW San Onofre Unit 2 and 1,080 MW San Onofre Unit 3, which have shut down permanently and are in DECON; cost estimates in 2016 and 2017 dollars
Talen Energy Corporation: NRC minimum cost estimate; fair market value
Did You Know?
SAFSTOR: A method of decommissioning in which a nuclear plant is maintained in a way that allows the facility to be safely stored and decontaminated to levels so that its use can be unrestricted.
DECON: A decommissioning method in which parts of the plant with radioactive contamination are removed from the site and disposed, or decontaminated to a level that allows the site to be released for unrestricted use shortly after it ends operation.
PDMS: This refers to post-defueling monitored storage, a step leading to the decommissioning process of a nuclear power plant.
Source: nrc.gov
21
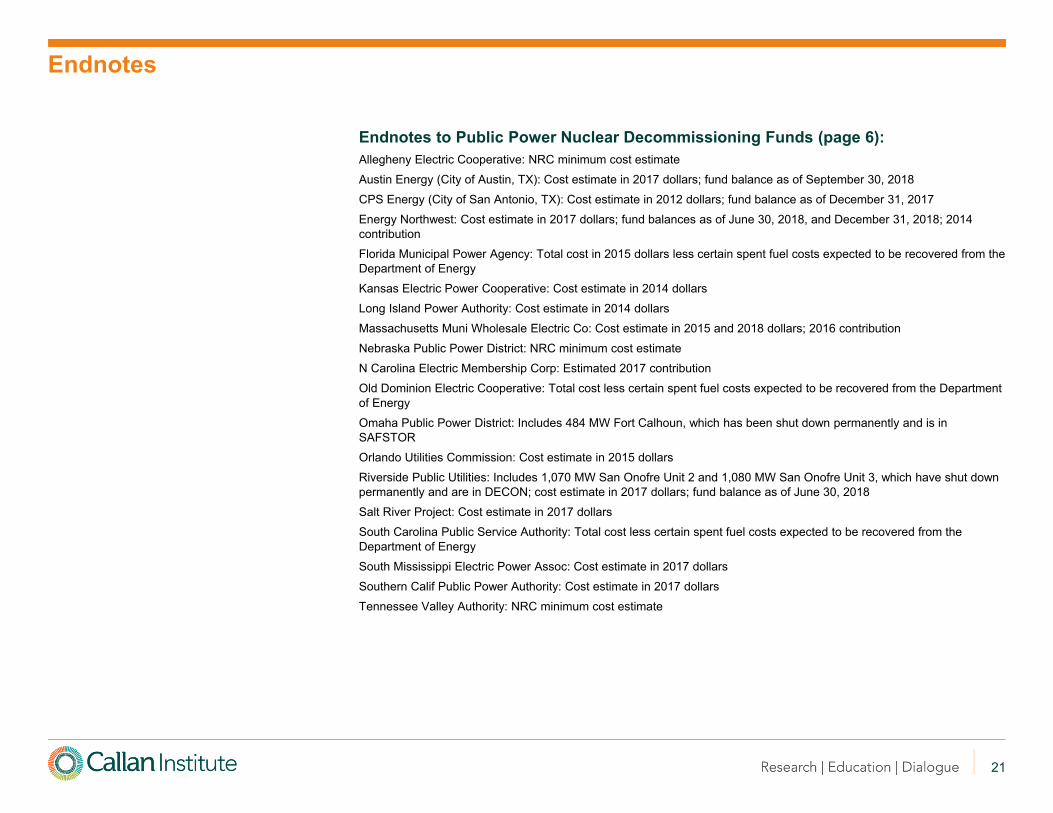
Endnotes
Endnotes to Public Power Nuclear Decommissioning Funds (page 6):Allegheny Electric Cooperative: NRC minimum cost estimate
Austin Energy (City of Austin, TX): Cost estimate in 2017 dollars; fund balance as of September 30, 2018
CPS Energy (City of San Antonio, TX): Cost estimate in 2012 dollars; fund balance as of December 31, 2017
Energy Northwest: Cost estimate in 2017 dollars; fund balances as of June 30, 2018, and December 31, 2018; 2014 contribution
Florida Municipal Power Agency: Total cost in 2015 dollars less certain spent fuel costs expected to be recovered from the Department of Energy
Kansas Electric Power Cooperative: Cost estimate in 2014 dollars
Long Island Power Authority: Cost estimate in 2014 dollars
Massachusetts Muni Wholesale Electric Co: Cost estimate in 2015 and 2018 dollars; 2016 contribution
Nebraska Public Power District: NRC minimum cost estimate
N Carolina Electric Membership Corp: Estimated 2017 contribution
Old Dominion Electric Cooperative: Total cost less certain spent fuel costs expected to be recovered from the Department of Energy
Omaha Public Power District: Includes 484 MW Fort Calhoun, which has been shut down permanently and is in SAFSTOR
Orlando Utilities Commission: Cost estimate in 2015 dollars
Riverside Public Utilities: Includes 1,070 MW San Onofre Unit 2 and 1,080 MW San Onofre Unit 3, which have shut down permanently and are in DECON; cost estimate in 2017 dollars; fund balance as of June 30, 2018
Salt River Project: Cost estimate in 2017 dollars
South Carolina Public Service Authority: Total cost less certain spent fuel costs expected to be recovered from the Department of Energy
South Mississippi Electric Power Assoc: Cost estimate in 2017 dollars
Southern Calif Public Power Authority: Cost estimate in 2017 dollars
Tennessee Valley Authority: NRC minimum cost estimate

22
Julia A. Moriarty, CFA, is a senior vice president and co-manager of Callan’s Capital Markets Research group. The Capital Markets group helps Callan’s institutional investor clients with their strategic planning, conducting asset/liability studies, developing optimal investment manager structures, and providing custom research on a variety of investment topics. The group consults to a wide range of clients, including defined benefit and defined contribution employee-benefit plans (corporate, public, and Taft-Hartley), endowments, foundations, insurance companies, hospitals, health-care systems, and nuclear decommissioning trusts. Julia also conducts target date and diversified real return manager research and publishes Callan’s annual Nuclear Decommissioning Funding Study. Julia is a shareholder of the firm.
Julia earned an MBA from the University of California at Berkeley’s Haas School of Business and a BS in finance from California Polytechnic State University at San Luis Obispo. She earned the right to use the Chartered Financial Analyst designation and is a member of the CFA Society of San Francisco and CFA Institute.
Research assistance was provided by Soumeya Kerrar and Nicholas Katsinis, analysts in Callan’s Client Report Services group.
About the Author
23
Disclosure
© 2020 Callan LLC
Certain information herein has been compiled by Callan and is based on information provided by a variety of sources believed to be reliable for which Callan has not necessarily
verified the accuracy or completeness of this publication. This report is for informational purposes only and should not be construed as legal or tax advice on any matter. Any
investment decision you make on the basis of this report is your sole responsibility. You should consult with legal and tax advisers before applying any of this information to your
particular situation. Reference in this report to any product, service or entity should not be construed as a recommendation, approval, affiliation or endorsement of such product,
service or entity by Callan. Past performance is no guarantee of future results. This report may consist of statements of opinion, which are made as of the date they are expressed
and are not statements of fact. Reference to or inclusion in this report of any product, service or entity should not be construed as a recommendation, approval, affiliation or
endorsement of such product, service or entity by Callan.
Callan is, and will be, the sole owner and copyright holder of all material prepared or developed by Callan. No party has the right to reproduce, revise, resell, disseminate externally,
disseminate to subsidiaries or parents, or post on internal web sites any part of any material prepared or developed by Callan without permission. Callan’s clients only have the right
to utilize such material internally in their business.
About Callan
Callan was founded as an employee-owned investment consulting firm in 1973. Ever since, we have empowered institutional clients with creative, customized investment solutions that are backed by proprietary research, exclusive data, and ongoing education. Today, Callan advises on more than $2 trillion in total fund sponsor assets, which makes it among the largest independently owned investment consulting firms in the U.S. Callan uses a client-focused consulting model to serve pension and defined contribution plan sponsors, endowments, foundations, independent investment advisers, investment managers, and other asset owners. Callan has six offices throughout the U.S. For more information, please visit www.callan.com.
About the Callan Institute
The Callan Institute, established in 1980, is a source of continuing education for those in the institutional investment community. The Institute conducts conferences and workshops and provides published research, surveys, and newsletters. The Institute strives to present the most timely and relevant research and education available so our clients and our associates stay abreast of important trends in the investments industry.
For more information about this report, please contact: Your Callan consultant or Julia Moriarty at [email protected]

Corporate Headquarters
600 Montgomery StreetSuite 800San Francisco, CA 94111800.227.3288415.974.5060
www.callan.com
Regional Offices
Atlanta800.522.9782
Chicago800.999.3536
Denver855.864.3377
New Jersey800.274.5878
@CallanLLC Callan
Portland800.227.3288