2019 industry breeding report - hrnsw.com.au
TRANSCRIPT

1 | P a g e
2019 INDUSTRY BREEDING
REPORT

2 | P a g e
Contents
1. Introduction ................................................................................................................................. 3
2. Total Services .............................................................................................................................. 5
3. Foals Born in NSW ....................................................................................................................... 6
4. Foals Born in Australia & NZ ....................................................................................................... 8
5. Stallions ........................................................................................................................................ 9
6. Stallion Incentive Scheme ....................................................................................................... 11
7. Colonial Stallion Bonus ............................................................................................................. 14
8. Foals Offered at Sales .............................................................................................................. 17
9. Breeders Challenge Nominations .......................................................................................... 18
10. Breeders Challenge Certificates ............................................................................................ 19
11. Owners Bonus Certificate Winners ......................................................................................... 20
12. NSW Live Foal & Starters Summary ......................................................................................... 21
13. Imports & Exports ...................................................................................................................... 23
14. Series’, Schemes & Incentives ................................................................................................ 24
15. Graphical Representations ..................................................................................................... 31
Front Cover: Betting Line USA x Lombo La Shelley Colt, photo taken by Norman Valdez

3 | P a g e
1. Introduction
The NSW Standardbred Breeding Industry and for that matter the Australasian Standardbred
Breeding Industry has been in decline for the past three decades. This continues to be a
world-wide problem.
There has been a significant drop in the number of foals born, particularly in the last decade.
This has come about due to a number of factors, which are now consistent:
a) Breeders are predominately in the older quartile with disposable income, they are not
being replaced by younger breeders. Natural attrition takes a toll on the number of
broodmares bred each season.
b) The cost of living means that it is difficult for parents with children to afford the costs
associated with breeding horses, therefore there are next to nil breeders to replace
those that are lost.
c) There are fewer stud/agistment farms operating to put downward pressure on agistment
fees, meaning that the cost of agisting horses becomes more expensive.
d) The use of stallion and mare mating’s in the paddock (by rural participants) has virtually
stopped.
e) There is a genuine feeling that the best sires dominate racing and that if you do not
patronise them you cannot compete. Accordingly breeders are either having one mare
served as opposed to two or three or they are not breeding at all.
f) NSW has been ravaged with drought the past two breeding seasons.
Despite the above negatives, there is no doubt that the quality of the Standardbred in
Australasia has improved dramatically over the past decade with the widespread use of
semen transport and artificial insemination. This has allowed breeders to have their mare(s)
served by the stallion of their choice regardless of the stallion’s physical location.
The percentage of juvenile horses that have raced in the past two (2) seasons has increased
as a percentage in comparison to the previous four (4). However, numerically in the 2013/14
racing season there were 445 individual 2YO starters and this number dropped to 382 in the
2017/18 season.
Of major concern is the number of broodmares served in the 2018/19 season, which
dropped to 1,372 and based on the foals born to mares served percentage the expected
crop number in 2019/20 is between 900 and 925. This means it will be the first time that less
than 1,000 live foals will be born in NSW.
The effects of the continual decreases in live foals will most likely take five (5) to seven (7)
years to be realised in the horse population, however if foal numbers continue to drop then
the current number of meetings and races in NSW may not be able to be maintained.

4 | P a g e
Handicapping changes have recently been made by Harness Racing Australia with the
implementation of a National Rating Points System. This system aims to group horses of equal
ability at any given time of their careers. A system which provides opportunities for all horses
to be competitive and viable is essential given the drop in foal numbers and it is imperative
that every sound and capable horse in the system is competing on the race track.
The following Breeding Report provides statistical information over a number of breeding
seasons. It covers the following key indicators:
mares served in NSW, foals born in NSW
foals born in Australia & New Zealand
the number of stallions standing in NSW and their total services
the HRNSW Stallion Incentive Scheme
the HRNSW Colonial Stallion Bonus
the percentage of Foals offered at sales
Breeders Challenge nominations and horses sustained
how recipients of Breeders Challenge Owners Bonus Scheme Certificates are
redeeming the Certificates
the age of horses when they are winning Owners Bonus Certificates
a summary of NSW registered foals and the percentage of 2YO’s and 3YO’s making
it to the track
a summary of all NSW race series, schemes and initiatives, and;
a graphical representation of the above statistics.

5 | P a g e
2. Total Services The following tables show the number and percentage of services to mares served over the
past five (5) Breeding Seasons and how those mares were served (in NSW):
Season ST to NSW ST within
NSW
by NSW
Sire
AI Hand Paddock NSW
TOTAL
Year on
Year
%
AUS
TOTAL
NZ
TOTAL
2014/15 # 930 368 293 144 27 1,762 (2.4%) 5,857 2,821
2015/16 1,062 184 238 130 20 1,634 (7.3%) 5,618 2,670
2016/17 ^ 1,240 138 188 149 21 1,736 6.2% 5,394 2,702
2017/18 1,103 174 220 141 32 1,670 (3.8%) 5,312 2,544
2018/19 958 183 201 88 6 1,436 (14.0%) 4,845 2,437
Variance
%
3.0% (50.3%) (31.3%) (38.9%) (77.8%) (18.5%) (10.2%) (17.3%) (13.6%)
# NSW Breeders Challenge Owners Bonus Certificates increase from $2,500 to $3,000.
^ True Blue bonus for 100% NSW Bred horses announced.
Variance is last reported season against 2014/15.
Season ST to NSW ST within NSW
by NSW Sire
AI Hand Paddock TOTAL
2014/15 53% 21% 16% 8% 2% 100%
2015/16 66% 11% 14% 8% 1% 100%
2016/17 71% 8% 11% 9% 1% 100%
2017/18 66% 10% 13% 8% 2% 100%
2018/19 67% 13% 14% 6% 0% 100%
ST to NSW means semen transported from another state or country to be
inseminated into a NSW based mare
ST to NSW by NSW Sire means semen transported from a NSW based sire to be inseminated
into a NSW based mare
AI means semen artificially inseminated into a mare from a sire standing
at the same property
Hand means the mare is naturally served by a sire under the supervision of a
handler
Paddock means the mare and sire are placed in a paddock to naturally mate
under no supervision
Comment
The number of broodmares served in NSW decreased by 14% year on year. While in part this
decrease may be attributed to drought, it is a worrying statistic for future horse populations.

6 | P a g e
3. Foals Born in NSW The following table shows the number of foals born in NSW over the past five (5) Breeding
Seasons and where the foals were born:
Foals born Region
Hunter Far
West
Goulburn/
Menangle
North
West
South
Coast
Riverina Metro Western
Districts
Total
2014/15 # 137 0 40 38 54 382 81 431 1,163
2015/16 135 0 36 38 61 379 61 433 1,143
2016/17 116 0 59 44 65 329 45 344 1,004
2017/18 ^ 110 0 92 17 50 429 40 381 1,119
2018/19 109 1 138 46 16 404 43 291 1,048
Total 607 1 365 183 246 1,923 270 1,880 5,477
% of Total 11.0% 0.0% 6.7% 3.3% 4.5% 35.1% 4.9% 34.3% 100.0%
Variance % + (9.1%) (100%) 119.0% (63.0%) (27.5%) (4.7%) (56.0%) (25.6%) (16.0%)
# NSW Breeders Challenge Owners Bonus Certificates increase from $2,500 to $3,000.
^ True Blue bonus for 100% NSW Bred horses announced.
+ Variance is foals born in 2018/19 against foals born in 2014/15
The following table shows the percentage of foals born against mares served.
Season of
Service
Total
Services
Mares
Served
Mares served by
more than one (1)
Stallion
Foals Born
Next Season
Foals Born/
Mares
Served
%
2013/14 * 1,806 1,715 91 1,163 67.8%
2014/15 # 1,762 1,699 63 1,143 67.3%
2015/16 1,634 1,560 74 1,004 64.4%
2016/17 ^ 1,704 1,606 90 1,119 69.7%
2017/18 1,670 1,566 96 1,048 66.9%
2018/19 1,436 1,372 64 N/A N/A
AVERAGE 1,669 1,586 80 1,095 67.2%
* Foal Nominators Bonus of $3,000 cash commences
# NSW Breeders Challenge Owners Bonus Certificates increase from $2,500 to $3,000.
^ True Blue bonus for 100% NSW Bred horses announced.
Comment
Due to the drought situation in NSW there were a number of broodmares which relocated
to Victoria for the season. This has impacted the number of Foals born in NSW.
7 | P a g e
Comment
The Western Districts and Riverina have accounted for 69.4% of all foals born in the last five
(5) breeding seasons. Their role in the breeding industry in NSW is critical.
Of note, the number of foals born in the South West & Riverina in 2017/18 and 2018/19 has
increased to in excess of 400. This increase coincides with the opening of the Riverina
Paceway. A similar trend was seen in the Western Districts when the Gold Crown Paceway
was opened, where in 2014/15 and 2015/16 there were in excess of 400 foals born in the
Region.
Further to the above observation foals in the North West increased in 2018/19 from 17 to 46.
It was reported last year “HRNSW has invested heavily in the region through the purchase
of the Tamworth Showground and an increase of race meetings allocated to the Tamworth
Club. While the Region has typically been an importer of horses from other Regions and
States, it is expected that the local breeding industry should spike significantly in the coming
seasons due to the support HRNSW has shown”, and this has proven to be true.
While heavy investment in a Region has seen spikes in foal numbers it is evident in the
Western Districts that the spike has not been maintained, this trend is an ongoing concern.
The Hunter has dropped by 28 foals from its five year peak in 2014/15 to a low of 109 in
2018/19. Lochend Stud and Medowie Lodge continue to build their stallion rosters therefore
it is hoped that the current number of foals can be maintained.
With the introduction of Benstud to NSW the Goulburn & Menangle foal numbers increased
from 92 to 138, and increase of 46 season on season and a gain of almost 100 foals since
2014/15.
The Metro Region has remained consistent the last three seasons however the South Coast
dropped from 50 to 16 foals the most recent season.
The number of live foals to services has been quite consistent in the range of 64-71%
(averaging 67.2%), this figure dropped to 64.4% for foals born in 2016/17, which was a
concern given the improvements in veterinary reproduction practices in modern times,
however it increased again for foals born in 2017/18 to 69.7%. There was an almost 3% drop
in the 2018/19 season (down to 66.9%), however this is to be expected due to the ongoing
drought conditions in NSW.
It is hoped that with modern technology the percentage of foals born to mares served is to
continue to increase (pending periods of drought).
It is noted that there were 194 fewer mares served in 2018/19 compared to 2017/18. This was
expected due to the drought conditions being experienced in NSW. Due to the drought the
live foal percentage is also expected to be lower than average. As such the forecast
number of live foals in the 2019/20 season is in the vicinity of 900. This will be the first time that
fewer than 1,000 live foals will be born in NSW.

8 | P a g e
4. Foals Born in Australia & NZ 2018/19 Foals Notified in Australia as at 24/07/2019.
Season of Foaling
All Foals
Alive Foals
Deceased
Foals
Alive Foal
%
Alive Foal
Population
%
NSW 1,048 1,025 23 97.8% 31.6%
VIC 1,475 1,447 28 98.1% 44.6%
WA 412 406 6 98.5% 12.5%
QLD 231 227 4 98.3% 7.0%
SA 66 64 2 97.0% 2.0%
TAS 78 78 0 100.0% 2.3%
TOTAL 3,310 3,247 61 98.1% 100%
Alive Foals Notified (5 year comparison)
State 2014/15 2015/16 2016/17 2017/18 2018/19 Var
since
2014/15
(Total)
Var
since
2014/15
(%)
NSW 1,148 1,123 1,029 1,112 1,025 (123) (10.7%)
VIC 1,620 1,500 1,473 1,337 1,447 (173) (10.7%)
WA 426 419 410 390 406 (20) (4.7%)
QLD 324 352 291 269 227 (97) (29.9%)
SA 134 126 106 89 64 (70) (52.2%)
TAS 137 123 98 93 78 (59) (43.1%)
AUS 3,789 3,643 3,407 3,290 3,247 (542) (11.7%)
NZ 2,200 2,003 1,810 1,783 1,554 (646) (29.4%)
# Variances based on 2014/15 foal numbers.
Comment
The percentage of NSW foals as an Alive Foal Population percentage of all Foals born in
Australia decreased from 33.8% in 2017/18 to 31.6%.
NSW and VIC have provided 76.1% of Alive Foals born in Australia in 2018/19; this is up from
73.0% in 2014/15.
Over the last five (5) seasons the foal numbers in NSW, VIC and WA have decreased by a
maximum of 11%, while the foal numbers in other States have excessively decreased.
It is no doubt inevitable that there will be a time in the foreseeable future where race date
allocations across the Country will need to be tailored to meet the diminishing demands of
the horse population.

9 | P a g e
5. Stallions The following table shows the number of stallions registered in NSW, the number of stallions
standing in NSW and the number of Studs that stood stallions in NSW over the past five (5)
seasons.
Season Stallions Registered in
NSW
Stallions Standing in
NSW
Studs
(Stood Stallion in NSW)
2014/15 + 57 42 25
2015/16 40 36 23
2016/17 ^ 41 35 29
2017/18 45 38 24
2018/19 49 40 32
+ Colonial Stallion Bonus commenced
^ True Blue bonus for 100% NSW Bred horses announced.
The following table shows the services by NSW registered stallions over the past five (5)
seasons.
Season Services by NSW Stallions Foals by NSW Stallions
Standing in NSW
(Stallion
Incentive
Scheme Cost)
International
Registered
by HRNSW
Standing in NSW International
Registered
thru NSW
2014/15 ^ + 1,360 ($69,750) 260 854 126
2015/16 # 837 ($38,000) 65 546 35
2016/17 546 ($60,000) 175 358 62
2017/18 660 ($75,000) 78 398 40
2018/19 520 ($35,000) 81
^ Nevele R Stud registered through HRNSW
+ Colonial Stallion Bonus commenced
# Nevele R Stud no longer registered through HRNSW due to the $750 Sire Registration Fee
Comment
The number of stallions standing in NSW has decreased over the past five (5) breeding
seasons and services by stallions standing in NSW have steadily decreased.
Of note, Pepper Tree Farm discontinued standing stallions after the 2015/16 season. Their
roster had been world class and from a peak of 1,360 services to NSW domiciled stallions in
2014/15 there were only 520 services to NSW domiciled stallions in 2018/19 (a 61% decrease).
This statistic is of major concern with respect to the NSW Breeders Challenge Blue Series. Due
to the trend of Services to NSW domiciled stallions there will continually be a minimal pool
of horses eligible to compete in the Series as the number of eligible foals significantly
decreases.
Notwithstanding the above, Lazarus will stand his opening season in NSW, though any
increases in broodmares served will take three (3) years to enter the racing system.
10 | P a g e
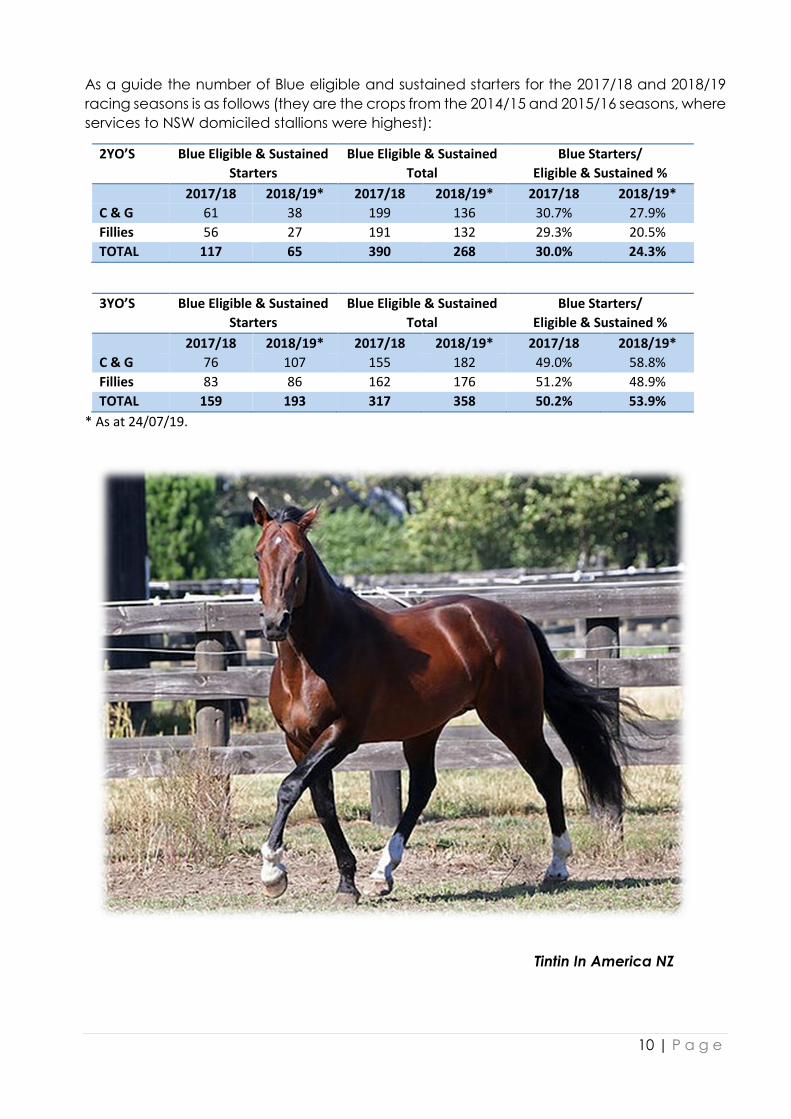
As a guide the number of Blue eligible and sustained starters for the 2017/18 and 2018/19
racing seasons is as follows (they are the crops from the 2014/15 and 2015/16 seasons, where
services to NSW domiciled stallions were highest):
2YO’S Blue Eligible & Sustained
Starters
Blue Eligible & Sustained
Total
Blue Starters/
Eligible & Sustained %
2017/18 2018/19* 2017/18 2018/19* 2017/18 2018/19*
C & G 61 38 199 136 30.7% 27.9%
Fillies 56 27 191 132 29.3% 20.5%
TOTAL 117 65 390 268 30.0% 24.3%
3YO’S Blue Eligible & Sustained
Starters
Blue Eligible & Sustained
Total
Blue Starters/
Eligible & Sustained %
2017/18 2018/19* 2017/18 2018/19* 2017/18 2018/19*
C & G 76 107 155 182 49.0% 58.8%
Fillies 83 86 162 176 51.2% 48.9%
TOTAL 159 193 317 358 50.2% 53.9%
* As at 24/07/19.
Tintin In America NZ

11 | P a g e
6. Stallion Incentive Scheme HRNSW introduced the Stallion Incentive Scheme in 2009/10. It was introduced to
encourage owners of highly credentialed stallions to stand them in NSW by offering an
advertising subsidy which provides coverage on Trots TV, in the e- Gazette, on the HRNSW
website, in the National Trotguide and Trotting Weekly and last last year it was expanded to
include radio and television advertising on the Sky Racing Channels.
The amount of subsidy for each individual Stallion is based on criteria which were developed
in consultation with Harness Breeders NSW (HBNSW).
To be eligible, Stallions must stand for a minimum of $2,000 (ex GST). HRNSW will monitor the
discounts offered by Studs which bring the advertised Stallion Fee below the minimum of
$2,000 to ascertain whether the discounts are in the spirit of the Stallion Incentive Terms and
Conditions.
The full incentive was formally paid to Studs the first year the Stallion stood in NSW and the
subsidy was then matched dollar for dollar in the second year (i.e. a Stallion receives an
incentive of $15,000 the first year, HRNSW and the Stud will contribute $7,500 in the second
year).
In 2017/18 this changed as Studs are now afforded a subsidy for the first three (3) years, with
the first and second season fully subsidised and the third year on a 50/50 basis.
The Stallions, Studs, Subsidy Incentives and Stallion Services for the past 5 years are as follows:
2014/15 # (shaded is second season sire) – Total Incentive Cost $69,750
Stallion Stud Services
Pet Rock USA Yirribee Pacing Stud 157
Caribbean Blaster ^ Yirribee Pacing Stud 110
Shoobees Place USA Lochend Stud 38
Major In Art USA Medowie Lodge 28
Christian Fire NZ Rosswood Stud 6
Gomeo Romeo NZ ^ Rosswood Stud 3
Lombo Pocket Watch ̂ Yirribee Pacing Stud 22
TOTAL NSW SERVICES 1,360 364 26%
# Colonial Stallion Bonus commenced
^ Colonial Stallion Bonus eligible
2015/16 (shaded is second season sire) – Total Incentive Cost $38,000
Stallion Stud Services
Fly Like An Eagle NZ ^ Yirribee Pacing Stud 50
Caribbean Blaster ^ Yirribee Pacing Stud 67
Shoobees Place USA Lochend Stud 19
Major In Art USA Medowie Lodge 19
TOTAL NSW SERVICES 837 155 18%

12 | P a g e
2016/17 (shaded is second season sire) – Total Incentive Cost $60,000
^ Colonial Stallion Bonus eligible
2017/18 (shaded is second season sire) – Total Incentive Cost $75,000
Stallion Stud Services
Tintin In America NZ ^ Yirribee Pacing Stud 92
Bling It On ^ Cobbitty Equine Farm 92
Courage Under Fire NZ ^ Yirribee Pacing Stud 18
Yankee Rockstar ^ Yirribee Pacing Stud 14
Stunin Cullen NZ ^ Yirribee Pacing Stud 11
My High Expectations USA Medowie Lodge 11
Tiger Tara NZ ^ Pizzuto Stud 6
Warrawee Needy USA Yirribee Pacing Stud 39
Sebastian K SWE Select Genetics 38
Smiling Shard NZ ^ Medowie Lodge 31
TOTAL NSW SERVICES 660 352 53%
^ Colonial Stallion Bonus eligible
2018/19 (shaded is second season sire) – Total Incentive Cost $35,000
Stallion Stud Services
Fear The Dragon (US) Yirribee Pacing Stud 42
Tintin In America NZ ^ Yirribee Pacing Stud 94
Bling It On ^ Cobbitty Equine Farm 73
My High Expectations USA Medowie Lodge 13
TOTAL NSW SERVICES 520 222 42%
^ Colonial Stallion Bonus eligible
Shoobees Place USA
Stallion Stud Services
Warrawee Needy USA Yirribee Pacing Stud 63
Smiling Shard NZ ^ Medowie Lodge 32
Sebastian K SWE Select Genetics 19
For A Reason ^ Yirribee Pacing Stud 132
Fly Like An Eagle NZ ^ Yirribee Pacing Stud 29
TOTAL NSW SERVICES 546 275 50%
13 | P a g e
Comment
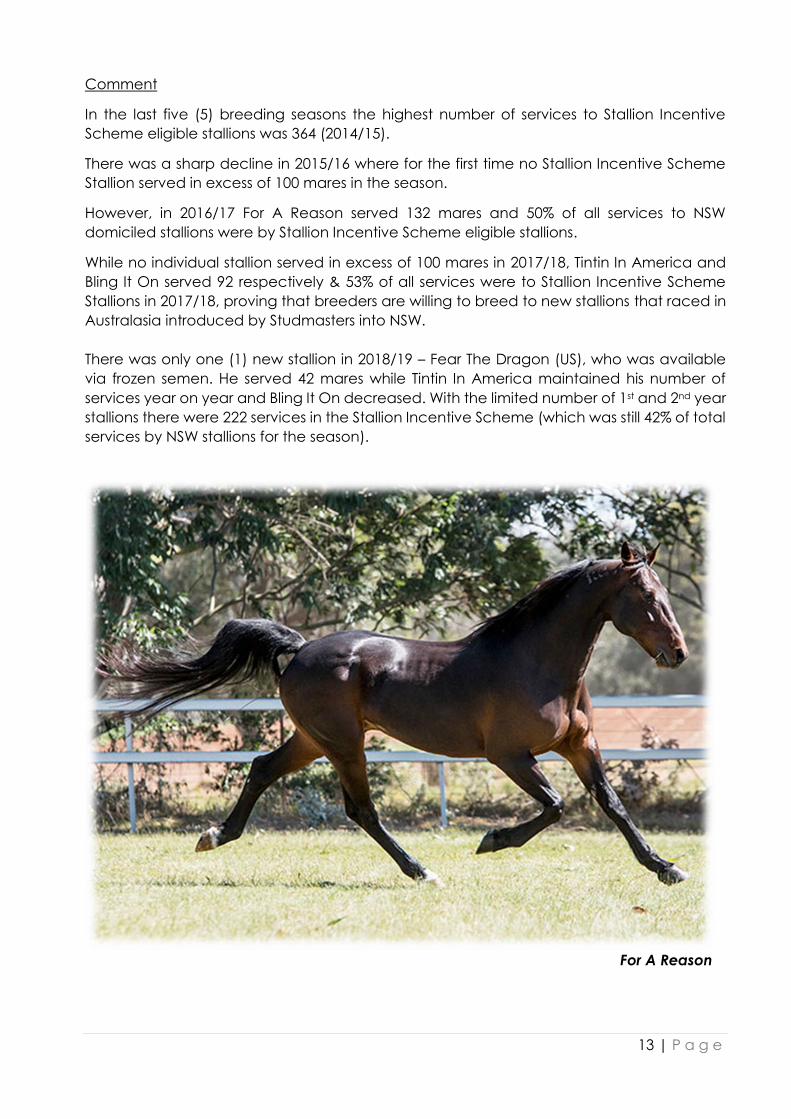
In the last five (5) breeding seasons the highest number of services to Stallion Incentive
Scheme eligible stallions was 364 (2014/15).
There was a sharp decline in 2015/16 where for the first time no Stallion Incentive Scheme
Stallion served in excess of 100 mares in the season.
However, in 2016/17 For A Reason served 132 mares and 50% of all services to NSW
domiciled stallions were by Stallion Incentive Scheme eligible stallions.
While no individual stallion served in excess of 100 mares in 2017/18, Tintin In America and
Bling It On served 92 respectively & 53% of all services were to Stallion Incentive Scheme
Stallions in 2017/18, proving that breeders are willing to breed to new stallions that raced in
Australasia introduced by Studmasters into NSW.
There was only one (1) new stallion in 2018/19 – Fear The Dragon (US), who was available
via frozen semen. He served 42 mares while Tintin In America maintained his number of
services year on year and Bling It On decreased. With the limited number of 1st and 2nd year
stallions there were 222 services in the Stallion Incentive Scheme (which was still 42% of total
services by NSW stallions for the season).
For A Reason

14 | P a g e
7. Colonial Stallion Bonus
HRNSW introduced the Colonial Stallion Bonus in the 2014/15 Breeding Season. It was
initiated to provide well performed and bred Australasian horses (Colonial Stallions) the
opportunity to attract strong books of mares and to provide breeders with an incentive to
send their mares to such Stallions.
There had been a negative bias by Breeders to using Colonial Stallions over the prior
decade, however, with better tracks producing quick times it is clear that Colonial Stallions
are on par with imported Stallions.
Colonial Stallion Bonus
Upon the birth and registration of a live foal, the foal nominators of progeny by the following
Stallions are eligible to claim the $500 Colonial Stallion Bonus rebate:
a) In the breeding season of conception the Stallion must have physically and
exclusively stood at a HRNSW registered stud located in NSW.
b) The stallion must have been bred in Australasia.
c) The stallion must have won a Group 1 race.
d) The sire of the stallion must have won a Group 1 or equivalent race.
e) In the breeding season of conception the stallion must have been nominated for the
NSW Breeders Challenge.
The inclusion of an eligible stallion commences from the inaugural year physically standing
at a HRNSW registered stud in NSW and ceases six (6) years thereafter (For example 2014/15
to 2019/20).
a) If a stallion returns to racing or stands at an interstate Stud, but then returns to Stud
in NSW, the Colonial Stallion Bonus rebate will still cease six (6) years after the first
season standing at a HRNSW registered stud in NSW.
The registered foal rebate for the first three (3) year term (For example 2014/15 to 2016/17)
will be $500 per live and registered foal irrespective of the ownership (mares owned by the
stud, stallion owner or non-associated persons)
The registered foal rebate for the second three (3) year term (For example 2017/18 to
2019/20) will be $500 per live and registered foal based on a one (1) for one (1) application.
That is for every one (1) application received from a foal nominator who is not an associate
or related party to the stud or the stallion owner, the stud or stallion owner will be able to
claim one (1) rebate.
Each breeding season HRNSW advise via Official Notice the stallions eligible for the Colonial
Stallion Bonus.

15 | P a g e
Foal Nominators may use the $500 to offset NSW Breeders Challenge fees at the time of Foal
Notification.
The number of services and live foals for the 2014/15 season was as follows:
Stallion 2014/15 Services 2015/16 Live Foals
Caribbean Blaster 110 62 (56%)
The Warp Drive 25 9 (36%)
Lombo Pocket Watch 22 17 (77%)
Robin Hood 16 8 (50%)
Flightpath 9 8 (89%)
Mister Swinger 7 7 (100%)
Sir Galvinator 7 5 (71%)
TOTAL 196 116 (59%)
There were 1,360 services by Stallions that stood in NSW in 2014/15. The Colonial Stallion
Bonus equated to 14% of total services.
The number of services and live foals for the 2015/16 season was as follows:
Stallion 2015/16 Services 2016/17 Live Foals
Caribbean Blaster 67 43 (64%)
Fly Like An Eagle NZ 50 36 (72%)
Maffioso 28 19 (67%)
Lombo Pocket Watch 18 13 (72%)
Soho Valencia 13 9 (69%)
Mister Swinger 9 8 (89%)
Robin Hood 8 5 (63%)
TOTAL 193 133 (69%)
There were 837 services by Stallions that stood in NSW in 2015/16. The Colonial Stallion Bonus
equated to 23% of total services.
The number of services and live foals for the 2016/17 season is as follows:
Stallion 2016/17 Services 2017/18 Live Foals
For A Reason 132 92 (70%)
Caribbean Blaster 66 44 (67%)
Smiling Shard NZ 32 21 (66%)
Fly Like An Eagle NZ 29 19 (66%)
Maffioso 27 14 (52%)
Lombo Pocket Watch 20 11 (55%)
Soho Valencia 16 12 (75%)
Sir Galvinator 10 8 (80%)
Mister Swinger 3 2 67%)
Robin Hood 1 0 (0%)
TOTAL 336 223 (66%)
There were 546 services by Stallions that stood in NSW in 2016/17. The Colonial Stallion Bonus
equated to 62% of total services.
16 | P a g e
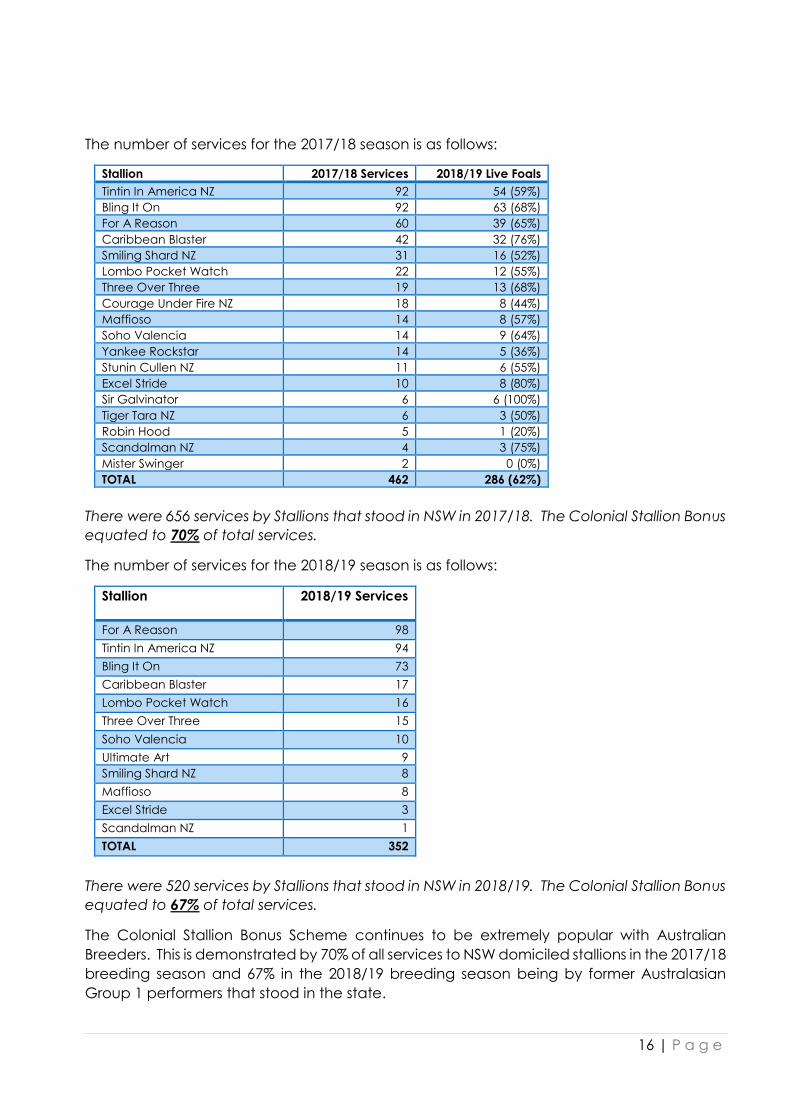
The number of services for the 2017/18 season is as follows:
Stallion 2017/18 Services 2018/19 Live Foals
Tintin In America NZ 92 54 (59%)
Bling It On 92 63 (68%)
For A Reason 60 39 (65%)
Caribbean Blaster 42 32 (76%)
Smiling Shard NZ 31 16 (52%)
Lombo Pocket Watch 22 12 (55%)
Three Over Three 19 13 (68%)
Courage Under Fire NZ 18 8 (44%)
Maffioso 14 8 (57%)
Soho Valencia 14 9 (64%)
Yankee Rockstar 14 5 (36%)
Stunin Cullen NZ 11 6 (55%)
Excel Stride 10 8 (80%)
Sir Galvinator 6 6 (100%)
Tiger Tara NZ 6 3 (50%)
Robin Hood 5 1 (20%)
Scandalman NZ 4 3 (75%)
Mister Swinger 2 0 (0%)
TOTAL 462 286 (62%)
There were 656 services by Stallions that stood in NSW in 2017/18. The Colonial Stallion Bonus
equated to 70% of total services.
The number of services for the 2018/19 season is as follows:
Stallion 2018/19 Services
For A Reason 98
Tintin In America NZ 94
Bling It On 73
Caribbean Blaster 17
Lombo Pocket Watch 16
Three Over Three 15
Soho Valencia 10
Ultimate Art 9
Smiling Shard NZ 8
Maffioso 8
Excel Stride 3
Scandalman NZ 1
TOTAL 352
There were 520 services by Stallions that stood in NSW in 2018/19. The Colonial Stallion Bonus
equated to 67% of total services.
The Colonial Stallion Bonus Scheme continues to be extremely popular with Australian
Breeders. This is demonstrated by 70% of all services to NSW domiciled stallions in the 2017/18
breeding season and 67% in the 2018/19 breeding season being by former Australasian
Group 1 performers that stood in the state.

17 | P a g e
8. Foals Offered at Sales The table below shows the number of live foals notified to NSW and the number of horses
offered for sale at NSW based yearling sales – it aims to give an indication of the percentage
of breeders that breed to sell against breeders who breed to race.
Foaled Foals
notified
to NSW
Yearlings
offered at
NSW Sales
%
offered at
NSW Sales
2012/13 1,312 355 27.1%
2013/14 1,238 404 32.6%
2014/15 1,148 329 28.7%
2015/16 1,123 336 29.9%
2016/17 1,029 320 31.1%
2017/18 1,112 307 27.6%
TOTAL 6,962 2,051 29.5%
On average over the last six (6) years 29.5% of live foals notified to NSW have been offered
at NSW sales.
These numbers are only a guide as horses that are notified to NSW may be sold in Victoria
and vice versa.
The table below provides statistical information concerning the Australian Pacing Gold
Sales focusing on NSW Breeders Challenge Eligible Yearlings, NSW Vendors and NSW
Buyers.
APG Sale Review 2015 2016 2017 2018 2019
Var 2019/2015
#
Var 2019/2018
#
Var 2019/2015
%
Var 2019/2018
%
Yearlings offered at NSW Sale 180 189 184 183 184 4 1 2.2% 0.5%
NSWBC Eligible Yearlings offered at NSW Sale 163 178 174 169 163 0 (6) 0.0% (3.6%)
VIC Branded Yearlings at NSW Sale 28 21 9 33 18 (10) (15) (35.7%) (45.5%)
Other Branded Yearlings at NSW Sale 2 2 2 1 3 1 2 50.0% 200.0%
Yearlings Passed In at NSW Sale 29 31 36 26 21 (8) (5) (27.6%) (19.2%)
Yearlings purchased by NSW Buyers at NSW Sale 77 95 94 97 125 48 28 62.3% 28.9%
Yearlings purchased by Interstate/Overseas Buyers at NSW Sale 74 63 54 60 38 (36) (22) (48.6%) (36.7%)
Yearlings offered by NSW Vendors at VIC Sale 16 11 18 24 25 9 1 56.3% 4.2%
Yearlings purchased by NSW Buyers at VIC Sale 17 21 23 17 32 15 15 88.2% 88.2%
Yearlings offered by NSW Vendors at QLD Sale 6 2 2 2 0 (6) (2) (100.0%) (100.0%)
Yearlings purchased by NSW Buyers at QLD Sale 7 6 8 8 13 6 5 85.7% 62.5%
Of note:
The number of horses Passed In at the NSW sale has decreased the last two (2) years
with the lowest amount of passed in horses in 2019.
In 2019 there was an increase in the number of yearlings purchased by NSW buyers
at the NSW Sale and a decline in the number of yearlings purchased by
Interstate/Overseas buyers.
The number of horses purchased by NSW Buyers at the VIC and QLD sale has
increased and was the highest of the five (5) years in 2019.
These statistics point to NSW buyers being the more active in the market.

18 | P a g e
9. Breeders Challenge Nominations The following table provides the number of eligible horses for the NSW Breeders Challenge
and the number and percentage sustained for each Series.
Series Foaled Live Foals
notified to
NSW
Foal
Nominations
Eligible
Horses
2YOs
Sustained
%
Sustained
3YOs
Sustained
%
Sustained
1 2005/06 1,713 N/A 1,713 771 45% 771 45%
2 2006/07 1,617 N/A 1,617 842 52% 842 52%
3 2007/08 1,220 N/A 1,220 709 58% 709 58%
4 2008/09 1,174 N/A 1,174 858 73% 598 51%
5 2009/10 1,226 94 1,320 784 59% 584 44%
6 2010/11 1,405 90 1,495 811 54% 580 39%
7 ^ 2011/12 1,402 97 1,499 818 55% 759 51%
8 2012/13 1,312 115 1,427 898 63% 721 51%
9 2013/14 1,238 143 1,381 760 55% 809 59%
10 # 2014/15 1,148 118 1,266 801 63% 743 59%
11 2015/16 1,123 174 1,297 945 73% 903 70%
12 2016/17 1,029 79 1,108 882 80%
13 2017/18 1,112 25 1,137
14* 2018/19 1,025 54 1,079
There was an Equine Influenza outbreak in 2007, the effects were felt for three (3) seasons.
^ Nominators Bonus ($3,000 cash) announced to commence for foals born in 2011/12 and NSW
Breeders Challenge Owners Bonus Certificates increase from $2,000 to $2,500.
# NSW Breeders Challenge Owners Bonus Certificates increase from $2,500 to $3,000.
* Series 14 Foal Nominations are not due until 31 August 2019.
Comment
The NSW Breeders Challenge eligibility conditions have changed over the years. Up to Series
3 sustainability was based on one payment, with the take up rate averaging 51%. It is
evident that allowing owners to sustain per year has had an increase in the overall amount
of horses that sustain.
There is a continual decline in eligible horses for the NSW Breeders Challenge. This has
resulted in recent times due to less Stallions domiciled in NSW. However the percentage of
horses sustained for the NSW Breeders Challenge in Series 11 and 12 has increased and is
the highest percentage of 2YO and 3YO horses to sustain.
It must be noted that the NSW Breeders Challenge 3YO sustaining rate has increased since
Series 9 and the margin between 2YO sustainiers and 3YO sustainers has decreased.
These statistics are positive and are on the back of HRNSW’s increased communication with
stakeholders and the race series’ and bonuses associated with the NSW Breeders
Challenge.

19 | P a g e
10. Breeders Challenge Certificates The table below shows the number of certificates issued each racing season and how they
have been redeemed or in some cases have not been used and expired.
Racing/Breeding
Season
Issued Redeemed Expired /
Outstanding
Service % Yearling % Cash %
2008/09 226 134 59% 74 33% 12 5% 6 (exp)
2009/10 199 141 71% 32 16% 13 7% 13 (exp)
2010/11 240 188 78% 38 16% N/A N/A 14 (exp)
2011/12 244 179 73% 50 20% N/A N/A 15 (exp)
2012/13 282 226 80% 47 17% N/A N/A 9 (exp)
2013/14 353 260 74% 66 19% N/A N/A 27 (exp)
2014/15 473 324 68% 114 24% N/A N/A 35 (exp)
2015/16 398 262 66% 97 24% N/A N/A 38 (exp) / 1
2016/17 451 227 50% 116 26% N/A N/A 33 (exp) / 25
2017/18 427 210 49% 107 25% N/A N/A 110
2018/19 398 70 18% 42 10% N/A N/A 286
Total 3,691 2,221 60% 783 21% 25 1% 190/422
* As at 17 July 2019.
Comment
There is evidence that the Breeders Challenge Owners Bonus Certificates are a valued tool
for breeders and yearling buyers. Minimal certificates issued have expired since 2008/09.
As the conditions of the Certificates have changed on numerous occasions since their
inception, there have been differing trends of redemption.
For instance certificates could be cashed for half their value. However, looking at the cash
redemptions it can be said that they were minimal, meaning the Certificates were
predominately used for breeding or a yearling purchase.
There has been a continual increase of redemptions for yearling purchases since the
2014/15 season. In recent times yearling purchases nearly consist of close to one quarter of
redemptions. This is a result of current owners choosing to reinvest in a yearling rather than
breed themselves. Nonetheless the proportion of certificates used for services to mares still
remains high, which has helped to enhance the number of broodmares bred annually.
Nominators Bonus: The NSW Breeders Challenge Foal Nominators Bonus is a cash payment.
The funds distributed cannot be tracked to confirm whether Foal Nominators reinvested the
money back into breeding or to purchase yearlings at sales.

20 | P a g e
11. Owners Bonus Certificate Winners The table below shows the number and percentage of winners of NSW Breeders
Challenge Owners Bonus Certificates for the period 01/09/09 to 17/07/2019.
Breeders Challenge Owners Bonus certificates are redeemable against the purchase price
of a Breeders Challenge eligible yearling at any Australian Public Yearling Sale or against
the service fees of stallions nominated for the NSW Breeding Schemes and associated
breeding fees.
Comment
The above table shows that almost two (2) in every three (3) (62.6%) NSW Breeders
Challenge eligible winning horse wins its Bonus as a juvenile (2YO and/or 3YO).
Of the juvenile winners:
393 horses won as a 2YO and did not win as a 3YO (20.8%)
1,142 horses won as a 3YO and did not win as a 2YO (60.5%)
352 horses won as a 2YO and also as a 3YO (18.6%)
The above table also shows that just over one (1) in every three (3) (37.4%) NSW Breeders
Challenge eligible winning horse wins its bonus as a 4YO or older horse.
Of the 4yo or older winners:
771 won as a 4YO (68.5%)
240 won as a 5YO (21.3%)
75 won as a 6YO (6.7%)
40 won as a 7YO or older horse (3.5%)
Age of Winner Number Percentage
2YO Only 393 13.0%
3YO Only 1,142 37.9%
2YO & 3YO 352 11.7%
4YO 771 25.6%
5YO 240 8.0%
6YO 75 2.5%
7YO 28 0.9%
8YO 9 0.3%
9YO 3 0.1%
TOTAL 3,013 100%
Winners Number Percentage
2YO or 3YO 1,887 62.6%
4YO or older 1,126 37.4%
The first foal born by Bling It On, a
Colt out of Joyces Desire

21 | P a g e
12. NSW Live Foal & Starters Summary The table below shows the current live foal totals and the percentage of 2YO and 3YO
starters.
Foaling Season Live Foals Notified 2YO % 3YO %
2006/07 1,617 451 27.9% 737 45.6%
2007/08 1,220 416 34.1% 685 56.1%
2008/09 1,174 460 39.2% 655 55.8%
2009/10 1,226 454 37.0% 688 56.1%
2010/11 1,405 442 31.5% 707 50.3%
2011/12 1,402 418 29.8% 654 46.6%
2012/13 1,360 356 27.1% 574 43.8%
2013/14 1,332 361 29.2% 609 45.7%
2014/15 1,163 327 28.1% 572 49.2%
2015/16 ^ 3YO 1,143 362 31.7% 588 51.4%
2016/17 ^ 2YO 1,004 305 30.4% N/A N/A
2017/18 1,119 N/A N/A N/A N/A
2018/19 1,048 N/A N/A N/A N/A
N.B. 2yo and 3yo starters include all Australian bred starters. NZ and USA bred starters have been
excluded, therefore the percentage is only a guide.
^ as at 24 July 2019
* Total is live foals notified to NSW
Comment
There was a significant increase in the percentage of 2YO’s and 3YO’s that made the race
track in the 2009/10 through to 2013/14 racing seasons.
It was a concerning trend that less than 30% of 2YO’s and less than 50% of 3YO’s had raced
in from the 2011/12 foaling season to the 2014/15 foaling season, however from the 2015/16
foaling season this percentage has again increased, albeit within a smaller horse
population, meaning the total number of starters has continued to be far less than 400 per
season.
Going forward, if the current number of race meetings are to be maintained then a larger
percentage of horses will be required to race as there is an ongoing smaller pool of foals.

22 | P a g e
The table below shows the total number of starts, races, total starts and starts per starter by
2YO’s and 3YO’s.
Starters
Foaling
Season
2YO
Total
Starters
2YO
Total
Races
2YO
Total
Starts
2YO
Starts/
Starter
3YO
Total
Starters
3YO
Total
Races
3YO
Total
Starts
3YO
Starts/
Starter
2006/07 470 259 2,138 4.55 808 616* 5,936 7.35
2007/08 429 238 1,935 4.51 739 759* 5,032 6.81
2008/09 478 263 2,156 4.51 767 976* 5,850 7.63
2009/10 491 263 2,144 4.37 809 1,023* 6,094 7.53
2010/11 467 287 2,308 4.94 800 998* 6,513 8.14
2011/12 445 253 2,052 4.35 738 1,160* 5,393 7.31
2012/13 377 199 1,633 4.33 660 949* 4,868 7.38
2013/14 377 204 1,654 4.39 692 887* 5,007 7.24
2014/15 348 195 1,586 4.56 658 796* 4,769 7.25
2015/16 ^
3YO 382 227 1,778 4.65 641 743* 4,359 6.80
2016/17 ^
2YO 319 180 1,397 4.38
N.B. Starters include all starters regardless of state/country of birth
^ as at 24 July 2019
* includes 3YO+ races
Comment
The total number of 2YO races conducted increased in the 2017/18 racing season to 227
races, there also were significantly more starters and each horse on average had more
starts than the previous four (4) seasons. However, of concern is the trend of the number of
3YO starters and total starts per season, where there has consistently been less than 700
horses compete and furthermore they are not having as many starts per season as was
previously the case.
The 2018/19 season still had a month to run when this report was written.
Black Silhouette

23 | P a g e
13. Imports & Exports The table below shows the number of imports and exports from NSW to New Zealand and
the USA and to NSW from New Zealand and the USA.
Imports from Exports to
Racing
Season
NZ USA NZ USA
2006/07 118 2 12 13
2007/08 78 2 1 2
2008/09 119 3 9 5
2009/10 194 3 13 8
2010/11 265 5 13 0
2011/12 292 5 35 0
2012/13 284 4 47 8
2013/14 255 9 38 7
2014/15 248 5 39 17
2015/16 225 0 34 46
2016/17 191 1 25 23
2017/18 186 1 26 41
TOTAL 2,455 40 266 129
AVERAGE 205 3 24 12
USA Imports are predominately Stallions and not race horses.
When considering the movement of horses between NSW, New Zealand and the USA, on
average over the last eleven (11) racing seasons there have been 205 imports into NSW and
36 exports out of NSW.
The number of imports into NSW from New Zealand had increased significantly between the
2010/11 and 2015/16 racing seasons with over 200 horses consistently being imported,
however this number dropped to under 200 for the first time in seven (7) years in 2016/17
and this trend continued in 2017/18.
Due to dollar parity there was a stoppage of exports to the USA in 2010/11, however in
2014/15 there were 17 horses exported and a further 46 exported in 2015/16. This number
normalised to 23 during the 2016/17 season, however increased again to 41 in 2017/18.
With the success of exported horses increasing and the Australian Dollar decreasing it is
expected that the number of exported horses to the USA will continue to increase.
Shartin NZ

24 | P a g e
14. Series’, Schemes & Incentives The following race series’, bonus schemes and incentives are available in NSW.
RACE SERIES
NSW Breeders Challenge Major Race Series
Chasing The Wind
The aim of the Breeders Challenge Race Series is to promote improvement in the quality of
the Standardbred breed in NSW, provide an incentive to domicile more mares in NSW and
to reward NSW breeders through the development of a lucrative race series and bonus
scheme in their home state.
For Breeders Challenge eligible 2YO and 3YOs, heats of $15,000 are conducted at
racetracks throughout NSW, with $25,000 semi-finals and $125,000 finals (2YO) and $150,000
finals (3YO) held at Tabcorp Park Menangle
All Finals are held at Tabcorp Park Menangle on the last Sunday in June.
Prizemoney for all NSW Breeders Challenge events is split 80% to the owners (1st to last), 5%
each to the trainer, driver, the foal nominator and the stallion nominator of all runners.

25 | P a g e
NSW Breeders Challenge Blue
HRNSW in conjunction with the NSW Harness Racing Club introduced a new race series for
horses that are 100% NSW Bred. Scheduled to run between the Major Race series and the
Regional Finals in July, these races are designed to give 100% NSW bred horses another
opportunity at earning prizemoney.
The races are restricted to Breeders Challenge eligible horses that have been sustained for
their respective season that also meet the following criteria:
- Sire physically stood in NSW in the season of conception, and;
- Dam served or inseminated in NSW, and;
- Foal born in NSW and notified to HRNSW.
Tabcorp Park Menangle host both 2YO & 3YO feature events worth $50,000 each for each
gender with performance based eligibility restrictions.
It must be acknowledged that there is a prizemoney contribution of $150,000 by Club
Menangle for this series.
NSW Breeders Challenge Regional Finals
Wagga, Parkes, Newcastle, Goulburn, Young & Bathurst have conducted successful
Breeders Challenge Regional Finals since their inception in 2010.
In 2019 for the first time there were $10,000 Qualifying Divisions for 2YOs & 3YOs of each
genders.
The NSW Breeders Challenge Regional Finals feature four (4) Group 2 $50,000 Finals for NSW
Breeders Challenge eligible horses.

26 | P a g e
Trot NSW Race Series
A Trotters Race Series was added from Series 7 (foals born from the 2011/12 season) onwards
and from 2017 does not form part of the NSW Breeders Challenge. Eligibility criteria along
with nomination and sustaining fees are the same as those already in place for the pacers.
The Trotters Race Series has been introduced to create more opportunity for owners and
breeders of square gaiters to earn more prizemoney while encouraging more participants
to breed trotters in NSW.
The series comprises one off Group 2 $30,000 races for 2YO, 3YO and 4YO/5YO and all finals
are run at Tabcorp Park Menangle at that same meeting in May each year.
Emerald Stride

27 | P a g e
BONUS SCHEMES
Breeders Challenge Owners Bonus Scheme
The Breeders Challenge Owners Bonus Scheme rewards owners of Breeders Challenge
eligible horses and encourages reinvestment in the breeding industry. Certificates are
applied to all NSW races valued at $5,000 or more.
It was first introduced in 1998/99 (as the State Bred Bonus Scheme) and certificates were
valued at $1,500. They have since increased in value three times (2000/01 to $2,000, 2010/11
to $2,500 and in 2014/15 to $3,000).
The owners of Breeders Challenge eligible and sustained 2YO and 3YOs each win a $3,000
bonus certificate for a horse’s first win in NSW for the season in a race valued at $5,000 or
more.
Breeders Challenge eligible and sustained 4YO or older horses also win a $3,000 Bonus
Certificate for their first win in NSW in a race valued at $5,000 or more provided they have
not won a bonus certificate as a 2YO or 3YO.
Breeders Challenge Owners Bonus certificates are redeemable against:
the purchase price of a Breeders Challenge eligible yearling at any Australian Public
Yearling Sale
the purchase price of a Breeders Challenge eligible horse at a trialling sale
the service fees of stallions nominated for the NSW Breeding Schemes
the fees associated with getting a broodmare in foal
NSW Breeders Challenge Fees
Bathurst Gold Crown Fees
Phil Thurston with “Cheeky”

28 | P a g e
NSW Breeders Challenge Nominators Bonus
The NSW Breeders Challenge Nominators Bonus was introduced to reward nominators of
foals conceived from the 2010/11 season (Series 7) onwards.
The nominators of Breeders Challenge eligible and sustained 2YO and 3YOs win a $3,000
cash bonus for a horse’s first win in NSW for the season in a race valued at $5,000 or more.
Breeders Challenge eligible and sustained 4YO, 5YO, 6YO & 7YO horses also win a $3,000
cash bonus for their first win in NSW in a race valued at $5,000 or more (provided they have
not won a cash bonus previously).
Eligible and sustained 8YO’s will be eligible to win certificates from the 2019/20 season, 9YO’s
in 2020/21 and so on.
NSW Breeders Challenge Owners and Nominators Bonuses raise the value of an eligible
horse’s first NSW Career Penalty win to a minimum of $9,000 (includes base prizemoney).
In addition, except for NSW Breeders Challenge Finals (as there is already a prizemoney
percentage for nominators built into these events), should a NSW Breeders Challenge
eligible and sustained 2YO, 3YO or 4YO win a Group 1 race in Australia, the nominator of
the horse shall receive 10% of the race's total advertised 1st placegetter's prizemoney.
Pelosi with Owner/Breeder Wayne Honan and Trainer Anna Woodmansey

29 | P a g e
MARE & STALLION INCENTIVES
Trot NSW Incentive Certificate
Trot NSW Incentive Certificates provide a $500 subsidy to breeders that patronise Trotting
Gait Stallions.
In order to be eligible, the mare must be served or inseminated in NSW, the sire must be
nominated for the Trot NSW Series and the service fee must be related to the conception of
a foal during the current breeding season.
Breeders are provided with a $500 Certificate upon providing proof that their mare is in foal
by way of a 45 day pregnancy test.
The Certificate can be used to offset the stallion fee.
Stallion Nominations
Nomination for the NSW Breeding Schemes allows stallions to have Owners Bonus
Certificates used against their service fees, and their nominators are paid 5% of Breeders
Challenge prizemoney.
In order to participate in the NSW Breeding Schemes, a stallion must be nominated by a
stud which agrees to pay foal fees to HRNSW. The fees for both NSW and Non-NSW based
stallions are charged on a live-foal basis for all Alabar Breeders Challenge eligible foals
registered in NSW, or registered elsewhere but nominated for the NSW Breeding Schemes.
Foal eligibility for the NSW Breeding Schemes is not determined by interstate or international
stallion nominations, as a foal by any stallion may be eligible for inclusion should they be out
of a NSW based mare.
Stallion fees for foals nominated for NSW Breeders Challenge are subsidised by HRNSW
through Tax Parity for NSW domiciled stallions and are $110 per live foal for interstate stallions.
Stallion nominator payments apply in the Alabar Breeders Challenge series for which stallion
fees were charged.

30 | P a g e
Stallion Incentive Scheme
HRNSW announced the Stallion Incentive Scheme in 2009/10. It was introduced to
encourage owners of highly credentialed stallions to stand them in NSW by offering an
advertising subsidy which provides coverage on Trots TV, in the e- Gazette, HRNSW website,
the National Trotguide and through the Sky Racing platforms.
The amount of subsidy for each individual Stallion is based on criteria which were developed
in consultation with Harness Breeders NSW (HBNSW).
The full incentive was formally paid to Studs the first year the Stallion stood in NSW and the
subsidy was then matched dollar for dollar in the second year (i.e. a Stallion receives an
incentive of $15,000 the first year, HRNSW and the Stud will contribute $7,500 in the second
year).
In 2017/18 this changed as studs are now afforded a subsidy for the first three (3) years, with
the first and second season fully subsidised and the third year on a 50/50 basis.
Colonial Stallion Bonus
$500 is payable upon a live foal to the Foal Nominator of a mare served by an eligible
Colonial Bred Stallion conceived from the 2014/15 breeding season.
The Conditions are as follows:
The stallion must have been bred in Australasia.
The stallion must have won a Group 1 race and must be standing at a NSW stud.
The sire of the stallion must have won a Group 1 or equivalent race.
The stallion must be nominated for the NSW Breeders Challenge.
Foal nominators may use the $500 to offset NSW Breeders Challenge fees at the time of Foal
Notification.
Lazurus NZ

31 | P a g e
15. Graphical Representations
0
500
1000
1500
ST to NSW ST within NSW by
NSW Sire
AI Hand Paddock
Total Services in NSW2014/15 2015/16 2016/17 2017/18 2018/19
5,8575,618 5,394 5,312
4,845
2,821 2,670 2,702 2,544 2,437
0
1,000
2,000
3,000
4,000
5,000
6,000
7,000
2014/15 2015/16 2016/17 2017/18 2018/19
Total Services in Australia & New Zealand
AUS TOTAL NZ TOTAL
0
50
100
150
200
250
300
350
400
450
500
Far West North West South
Coast
Metro Goulburn/
Menangle
Hunter Western
Districts
Riverina
Foals Born by Region
2014/15 2015/16 2016/17 2017/18 2018/19

32 | P a g e
67.8%67.3%
64.4%
69.7%
66.9%
2014/15 2015/16 2016/17 2017/18 2018/19
NSW Foals Born/NSW Mares Served %
0
200
400
600
800
1,000
1,200
1,400
1,600
1,800
NSW VIC WA QLD SA TAS
Alive Foals Born by State
2014/15 2015/16 2016/17 2017/18 2018/19
42
3635
38
40
2014/15 2015/16 2016/17 2017/18 2018/19
Stallions Standing in NSW

33 | P a g e
1,360
837
546656
520
2014/15 2015/16 2016/17 2017/18 2018/19
Services by NSW Stallions
32
23
1617
13
2014/15 2015/16 2016/17 2017/18 2018/19
Average Services by NSW Stallions
364
155
275
348
222
2014/15 2015/16 2016/17 2017/18 2018/19
Services by Incentive Scheme Stallions

34 | P a g e
196 193
336
458
352
2014/15 2015/16 2016/17 2017/18 2018/19
Services by Colonial Stallion Bonus
Stallions
329
336
320
336
2014 2015 2016 2017
Yearlings offered at NSW Sales
0
50
100
150
200
250
300
350
2006/072007/082008/092009/102010/112011/122012/132013/142014/152015/162016/172017/18
Imports/Exports
NZ Imports NZ Exports USA Exports

35 | P a g e
0
500
1,000
1,500
2,000
1 2 3 4 5 6 7 8 9 10 11 12 13 14
NSW Breeders Challenge Nominations
Live Foals notified to NSW Foal Nominations Eligible Horses
2YOs Sustained 3YOs Sustained
0
100
200
300
400
500
2008/09 2009/10 2010/11 2011/12 2012/13 2013/14 2014/15 2015/16 2016/17 2017/18 2018/19
NSW Breeders Challenge Certificates Redeemed
Issued Reedeemed Service Redeemed Yearling Redeemed Cash
13%
38%
12%
26%
8%4%
Age of Certificate Winners
2YO Only 3YO Only 2YO & 3YO 4YO 5YO 6YO+
