2019 hsa survey - psca.org · to the hsa, 91 percent do so up to a maximum dollar amount based on...
TRANSCRIPT

PSCA’s Benchmarking Survey of Health Savings Accounts
SURVEY FEATURES
Executive SummaryThe Executive Summary provides a detailed summary of the results and includes detailed charts and graphs to illustrate the data.
Data HighlightsFive key data points for benchmarking your plan are included in the Executive Summary.
Detailed TablesIn addition to the Executive Summary section, the report includes 38 tables of HSA benchmarking data.
Highlights
11 ParticipationNearly ninety percent of employees enrolled in the HSA-qualifying health option contributed to their accounts in 2018.
13 Employer ContributionsMore than 80 percent of employers contribute to the HSA.
15 InvestmentsThe majority of organizations (85.6 percent) offer investment options for HSA contributions.
19 HSA FeesMore than half of organizations pay the HSA maintenance fee for employers.
21 Automatic EnrollmentThirty percent of organizations automatically enroll employees in the HSA if they enroll in the HSA-qualifying health option.
21 EducationEmployee education was the dominant concern of employers regarding their HSA.
HSA Survey2019
PSCA’s Benchmarking Survey of Health Savings Accounts
HSA Survey2019
Contents | Index

PSCA’s 2019 Health Savings Account Surveyii
Plan Sponsor Council of America 200 S. Wacker Drive, Suite 3100 Chicago, IL 60606 312-419-1863 [email protected] http://www.psca.org
2019 HSA Plan Survey.
Copyright ©2019 by the Plan Sponsor Council of America.
All rights reserved. Nothing may be reprinted in whole or in part without express permission from the publisher.
Contents | Index

Plan Sponsor Council of America • PSCA.org iii
AcknowledgementsThe Plan Sponsor Council of America gratefully acknowledges the assistance provided by PSCA’s HSA Committee in the production of this survey.
PSCA’s HSA Committee:
Chair Tom Gordon
Vice Chair Karin Rettger, President, Principal Resource Group, Inc.
Sara Caddy, Benefits Manager, Dimensional Fund Advisors
Heather Cambray, Corporate Human Resources Manager, Greatland Corporation
Shelby George, Interim CEO, Perspective Partners
Matt Gulseth, Retirement Plan Consultant, Channel Financial
Kimberly Hanlon, Director of Total Rewards, Regional Management Corporation
Mercedes Ikard, Director, Retirement Planning, Atrium Health
Pat Jarrett, Co-founder, HealthSavings Administrators
Kelley Long, Senior Financial Planner, Financial Finesse
Cherie Moser, Head of HSA Product and Strategy, PayFlex
Kenneth Raskin, Partner, King & Spalding LLP
Thank you to everyone who took the time to respond to this inaugural HSA survey. Your contributions made this report possible.
PSCA would like to thank Empower Retirement and Optum for sponsoring this survey.
This material was prepared by the Plan Sponsor Council of America (PSCA). PSCA is not affiliated with Great-West Life & Annuity Insurance Company (GWLA), GLWA of New York, or their subsidiaries or affiliates. Empower is a marketing name of GWLA. Empower contributed financially to the creation of this material but is not responsible for its content.
Contents | Index

PSCA’s 2019 Health Savings Account Surveyiv
Contents
Executive Summary ........................................................................................................................................................................................ 1
Full Data Tables ..................................................................................................................................................................................................... 8
Demographics .......................................................................................................................................................................................................... 9Table 1 Respondent demographics by organization size (number of total employees) .............................................................................. 9
Table 2 Respondents by industry type ................................................................................................................................................................... 9
Table 3 Length of time employer has offered an HSA to employees ............................................................................................................. 10
Table 4 Percentage of organizations that offer health options other than the HSA-qualifying option ................................................... 10
Table 5 Other individual health account options offered to employees ....................................................................................................... 10
Eligibility and Participation ...................................................................................................................................................................... 11
Table 6 Percentage of total employees eligible to participate in the HSA program in 2018 (enrolled in the HSA-capable health option) ............................................................................................................................................................................................. 11
Table 7 Percentage of eligible employees that had an HSA in 2018 ............................................................................................................. 11
Table 8 Percentage of employees with an HSA that contributed to it in 2018 ............................................................................................ 11
Table 9 Average participant contribution in 2018 ............................................................................................................................................. 12
Table 10 Average HSA balance in 2018 ................................................................................................................................................................. 12
Table 11 Percentage of participants that spent their entire HSA balance in 2018 ....................................................................................... 12
Table 12 Percentage of participants that contributed the maximum to the HSA in 2018 ............................................................................ 12
Employer Contributions .............................................................................................................................................................................. 13
Table 13 Percentage of organizations that contribute to the HSA ................................................................................................................... 13
Table 14 Formula used to calculate the organization’s contribution to the HSA .......................................................................................... 13
Table 15 Timing of employer contributions to the HSA ....................................................................................................................................... 13
Table 16 Amount contributed per employee for companies that use a per-employee formula ................................................................. 14
Table 17 Single coverage contribution range for organizations that use a coverage-level formula ....................................................... 14
Table 18 Contribution range for coverage other than single ............................................................................................................................ 14
Investments ............................................................................................................................................................................................................... 15
Table 19 Percentage of organizations that offer investment options for HSA contributions ..................................................................... 15
Table 20 Party who determined the investment options ................................................................................................................................... 15
Table 21 Minimum balance requirements before participants can invest assets ....................................................................................... 15
Table 22 Types of investment options offered ...................................................................................................................................................... 16
Table 23 Percentage of organizations that have the same investment lineup for the HSA as in the 401(k)/other DC plan .................. 16
Table 24 Percentage of organizations that charge an investment management fee (other than asset management fees) separate from the HSA maintenance fee ............................................................................................................................................. 16
Contents | Index

Plan Sponsor Council of America • PSCA.org v
Contents
Education .................................................................................................................................................................................................................... 17
Table 25 Timing of HSA education ......................................................................................................................................................................... 17
Table 26 Resources used to educate employees about the HSA ..................................................................................................................... 17
Table 27 Percentage of organizations that provide education or advice to employees on choosing between the 401(k)/403(b) and the HSA ............................................................................................................................................................................................... 17
Table 28 Percentage of organizations that use a default or otherwise suggest an savings amount to employees during annual enrollment ..................................................................................................................................................................................... 18
Table 29 Percentage of organizations that encourage or offer additional education to employees who do not contribute to the HSA or only contribute a nominal amount ................................................................................................................................ 18
Plan Administration ......................................................................................................................................................................................... 19
Table 30 Percentage of organizations that solicit rollovers from health savings accounts for newly-hired participants .................. 19
Table 31 Payer of HSA maintenance fees ............................................................................................................................................................ 19
Table 32 Average cost per participant to administer the HSA plan ................................................................................................................ 19
Table 33 Resources used in the development of the HSA program ................................................................................................................. 20
Table 34 HSA provider types ................................................................................................................................................................................... 20
Table 35 Percentage of organizations that offer pre-tax payroll deductions of HSA contributions through your cafeteria plan ....... 20
Table 36 Percentage of organizations that automatically enroll employees in the HSA if they enroll in the HSA-qualifying health option .............................................................................................................................................................................................. 21
Table 37 Primary HSA concern ............................................................................................................................................................................... 21
Table 38 Secondary HSA concern ......................................................................................................................................................................... 21
Survey Questionnaire ................................................................................................................................................................................. 22
Index ................................................................................................................................................................................................................................... 28
Contents | Index

Plan Sponsor Council of America • PSCA.org 1
Executive Summary
BackgroundWhile the Medicare Modernization Act of 2003 created Health Savings Accounts, their popularity has skyrocketed in recent years. Subsequent legislation contributed mightily to HSA expansion and growth (once the HSA maximum contributions were limited not by the deductible, but by the out-of-pocket expense maximum). Other factors that contributed to increases in HSA utilization include the employer-mandate and Cadillac Tax provisions of the Patient Protection and Affordable Care Act. In the 13 years from 2006 to 2018, HSA assets surged from approximately $1.7 Billion to $53.8 Billion (33.3 percent growth per year)! While industry surveys found that enrollment in employer-sponsored, HSA-qualifying health options more than tripled during that same period — from 5 percent (2005) to 19 percent (2018), 19 percent of HSA accounts were not funded.
IntroductionAcknowledging the significant expansion in availability and its potential role as a retirement savings vehicle, in 2016, PSCA created a new committee to focus on Health Savings Accounts (HSAs) and how they can be used as part of a holistic retirement savings strategy. PSCA conducted a snapshot survey of companies that offer HSA-qualifying health plans to employees in the spring of 2017 to establish a baseline on HSA plan design and use. This snapshot served as the basis for this instrument, PSCA’s first comprehensive benchmarking survey of HSAs. PSCA conducted the survey in early 2019 (reflecting 2018 plan data) and received responses from 216 employers, of which 189 current-ly sponsor an HSA-qualifying Health Plan. The data on the pages that follow is from the 189 employers that offered an HSA-qualifying health option in 2018. Where sample size permits, the data is broken out by company size (total number of US employees).
Data Highlights 1. The average participant contribution in 2018 was $2,595 and the average account balance at the end of 2018
was $5,239.
2. The vast majority of responding organizations (85.6 percent) offer investment options for HSA contributions, though three-quarters require a minimum balance of at least $1,000 to invest assets beyond money market funds or cash.
3. Suggesting a growing convergence of health and retirement savings, more than half of respondents currently educate employees on choosing between contributing to the 401(k)/403(b) plan and the HSA.
4. Employee education was the dominant concern of employers regarding their HSA. Difficulty of administration was a distant second.
5. Fewer than ten percent of organizations use or suggest a default savings rate to employees for their HSA.
Contents | Index
PSCA’s 2019 Health Savings Account Survey2
Executive Summary
Detailed Summary of Results
Demographics (Full data tables: page 9)
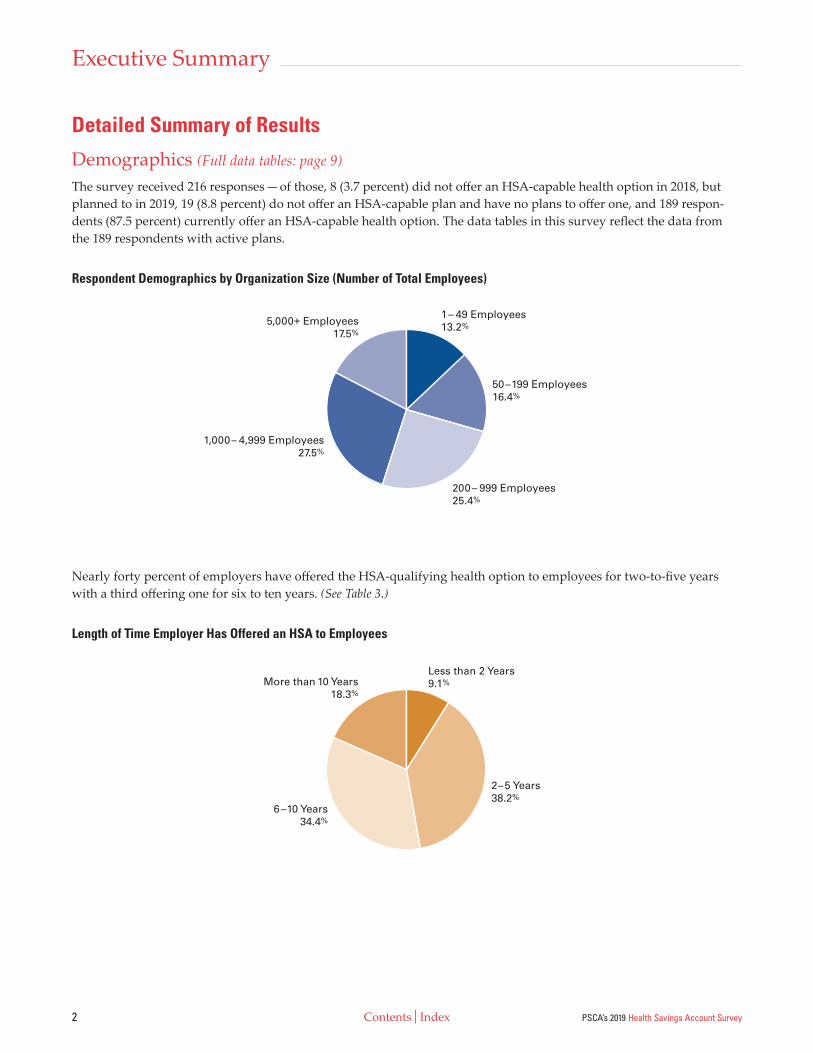
The survey received 216 responses — of those, 8 (3.7 percent) did not offer an HSA-capable health option in 2018, but planned to in 2019, 19 (8.8 percent) do not offer an HSA-capable plan and have no plans to offer one, and 189 respon-dents (87.5 percent) currently offer an HSA-capable health option. The data tables in this survey reflect the data from the 189 respondents with active plans.
Respondent Demographics by Organization Size (Number of Total Employees)
1– 49 Employees13.2%
50–199 Employees16.4%
200– 999 Employees25.4%
1,000– 4,999 Employees27.5%
5,000+ Employees17.5%
Nearly forty percent of employers have offered the HSA-qualifying health option to employees for two-to-five years with a third offering one for six to ten years. (See Table 3.)
Length of Time Employer Has Offered an HSA to Employees
Less than 2 Years9.1%
2– 5 Years38.2%
6 –10 Years34.4%
More than 10 Years18.3%
Contents | Index

Plan Sponsor Council of America • PSCA.org 3
Executive Summary
Three-fourths of employers offer health plan options in addition to the HSA-qualifying option, though there is variability by organization size. (See Table 4.)
Percentage of Organizations That Offer Health Options Other than the HSA-Qualifying Option, by Plan Size
0%
20%
40%
60%
80%
100%
5,000+1,000–4,999200–99950–1991– 49
Percentage of Organizations
Plan Size
58.3%
69.0%66.7%
78.8%
90.6%
The majority of employers also offer Flexible Spending Accounts (FSAs) to employees, though less than half of small organizations do while ninety percent of large organizations do. (See Table 5.)
Other Individual Health Account Options Offered to Employees
0% 10% 20% 30% 40% 50% 60% 70% 80% 90% 100%
Flexible Spending Account — General
Flexible Spending Account — Limited
Flexible Spending Account — Dependent Care Only
Health Reimbursement Arrangement
None 12.4%
15.1%
2.2%
62.4%
78.5%
Contents | Index

PSCA’s 2019 Health Savings Account Survey4
Executive Summary
Eligibility and Participation (Full data tables: page 11)
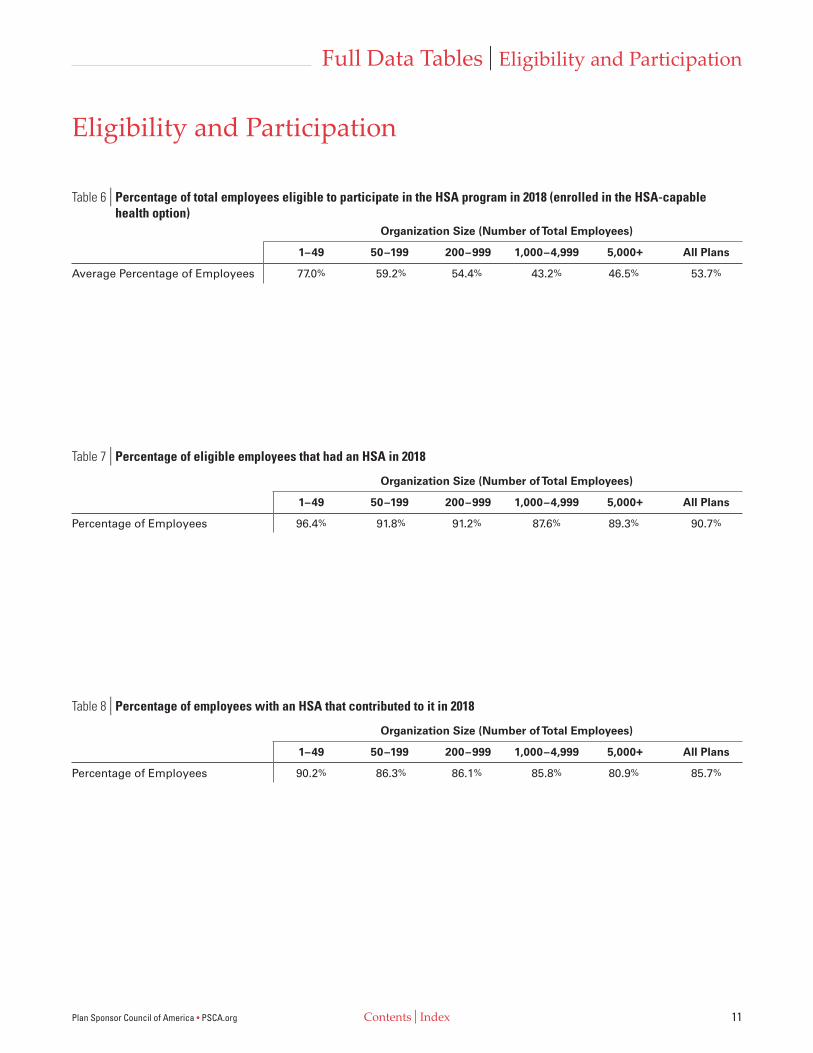
About half (53.7 percent) of eligible employees enrolled in the HSA-qualifying health plan option when offered the opportunity. (See Table 6.) Of those that did, 90 percent actually opened an account and 85 percent made contributions to their account. (See Tables 7 and 8.)
Eligibility and Participation by Plan Size
Organization Size (Number of Total Employees)
1–49 50–199 200–999 1,000–4,999 5,000+ All Plans
Average Percentage of Employees Eligible 77.0% 59.2% 54.4% 43.2% 46.5% 53.7%
Percentage of Eligible Employees with Accounts 96.4% 91.8% 91.2% 87.6% 89.3% 90.7%
Percentage of Employees that Contributed to the HSA 90.2% 86.3% 86.1% 85.8% 80.9% 85.7%
The average participant contribution in 2018 was $2,595 and the average account balance at the end of 2018 was $5,239. (See Tables 9 and 10.)
Nearly thirty percent of respondents stated that fewer than a quarter of employees spent their entire HSA balance in 2018, though nearly two-thirds of respondents (63.1 percent) are unsure how participants are using their accounts. (See Table 11.)
Percentage of Participants that Spent their Entire HSA Balance in 2018
0%–25% of Participants (28.5% of respondents)
26%–50% of Participants (5.0% of respondents)
Unknown(63.1% of respondents)
51%–75% of Participants (2.8% of respondents)
76%–100% of Participants (0.6% of respondents)
Contents | Index
Plan Sponsor Council of America • PSCA.org 5
Executive Summary
Employer Contributions (Full data tables: page 13)
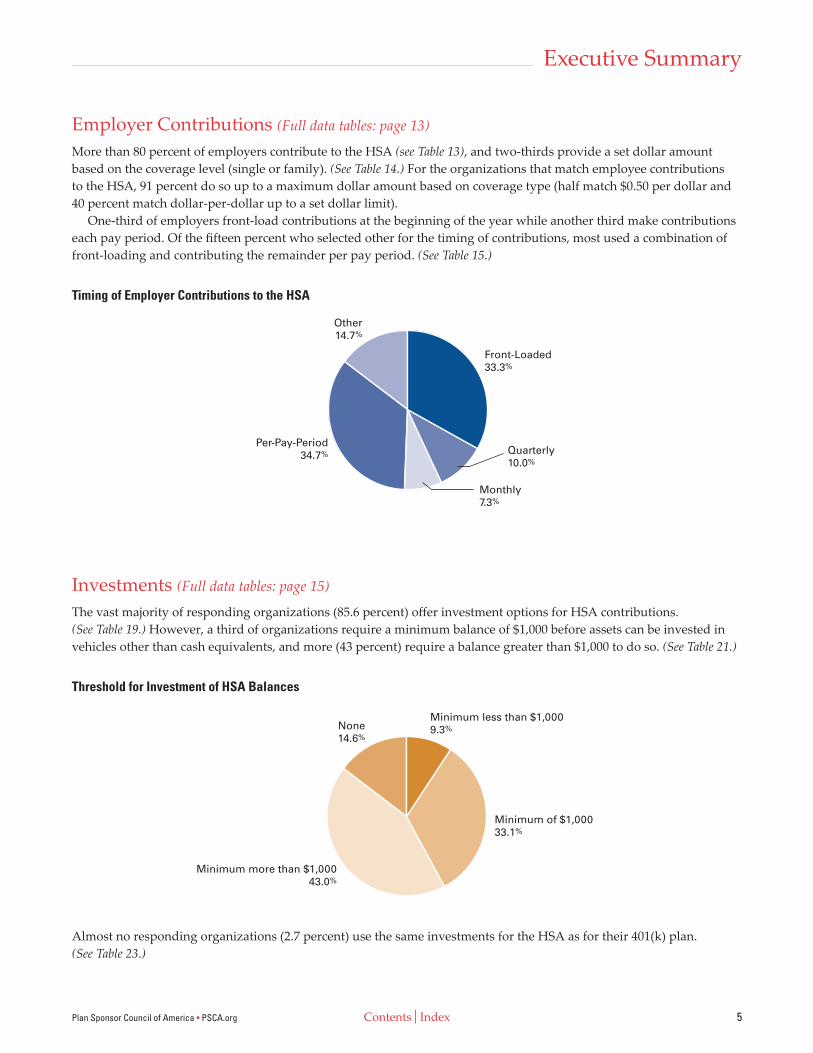
More than 80 percent of employers contribute to the HSA (see Table 13), and two-thirds provide a set dollar amount based on the coverage level (single or family). (See Table 14.) For the organizations that match employee contributions to the HSA, 91 percent do so up to a maximum dollar amount based on coverage type (half match $0.50 per dollar and 40 percent match dollar-per-dollar up to a set dollar limit).
One-third of employers front-load contributions at the beginning of the year while another third make contributions each pay period. Of the fifteen percent who selected other for the timing of contributions, most used a combination of front-loading and contributing the remainder per pay period. (See Table 15.)
Timing of Employer Contributions to the HSA
Front-Loaded 33.3%
Quarterly 10.0%
Monthly 7.3%
Per-Pay-Period34.7%
Other14.7%
Investments (Full data tables: page 15)
The vast majority of responding organizations (85.6 percent) offer investment options for HSA contributions. (See Table 19.) However, a third of organizations require a minimum balance of $1,000 before assets can be invested in vehicles other than cash equivalents, and more (43 percent) require a balance greater than $1,000 to do so. (See Table 21.)
Threshold for Investment of HSA Balances
Minimum less than $1,000 9.3%
Minimum of $1,000 33.1%
Minimum more than $1,00043.0%
None14.6%
Almost no responding organizations (2.7 percent) use the same investments for the HSA as for their 401(k) plan. (See Table 23.)
Contents | Index

PSCA’s 2019 Health Savings Account Survey6
Executive Summary
Education (Full data tables: page 17)
The majority of organizations (76.4 percent) primarily educate employees about the HSA annually, at open enrollment. (See Table 25.) Suggesting a growing convergence of health and retirement savings, more than half of respondents edu-cate employees on choosing between contributing to the 401(k)/403(b) plan and the HSA. (See Table 27.)
Percentage of Organizations that Provide Education or Advice to Employees on Choosing Between the 401(k)/403(b) and the HSA Plan Size by Number of Participants
1 – 49 50 – 199 200 – 999 1,000–4,999 5,000+
Percentage of Organizations 75.0% 74.2% 55.6% 50.0% 45.2%
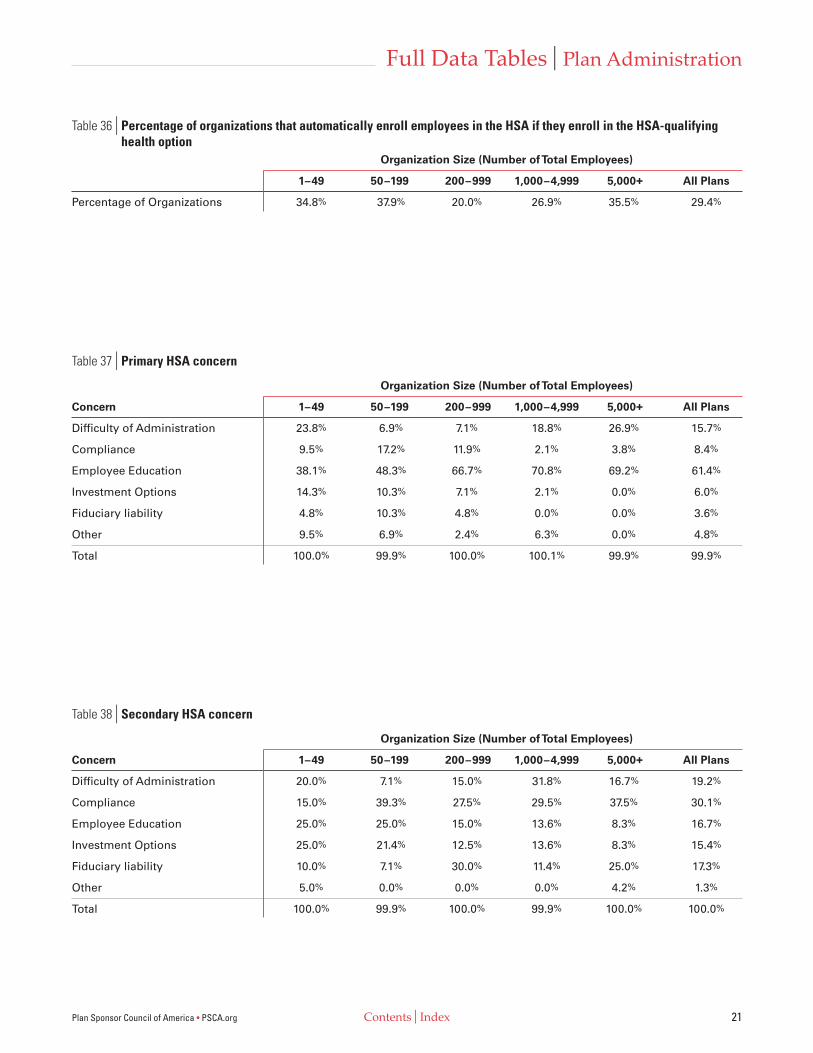
In fact, respondents overwhelmingly indicated that their primary concern regarding HSAs was educating employees. (See Tables 37 and 38.)
Primary and Secondary HSA Concerns
Concern Priority
Concern Primary Secondary
Difficulty of Administration 15.7% 19.2%
Compliance 8.4% 30.1%
Employee Education 61.4% 16.7%
Investment Options 6.0% 15.4%
Fiduciary Liability 3.6% 17.3%
Other 4.8% 1.3%
Primary and Secondary HSA Concerns
Concern PriorityConcern
0% 10% 20% 30% 40% 50% 60% 70% 80%
Secondary
Primary
Other
Fiduciary Liability
Investment Options
Employee Education
Compliance
Difficulty of Administration
4.8% 1.3%
3.6% 17.3%
6.0% 15.4%
61.4% 16.7%
8.4% 30.1%
15.7% 19.2%
Contents | Index

Plan Sponsor Council of America • PSCA.org 7
Executive Summary
Plan Administration Practices (Full data tables: page 19)
The survey found a great deal of variety in administrative practices, perhaps reflective of one dominant characteristic — three-fourths of organizations relied on their benefits broker to develop their HSA program. Beyond that:
• More than half of organizations pay the HSA maintenance fees for active employees (54.7 percent), though at more than a third of responding organizations the participant is responsible for those fees. (See Table 31.)
• Thirty percent of organizations automatically enroll employees in the HSA if they enroll in the HSA-qualifying health option. (See Table 36.)
• Fewer than ten percent of organizations use or suggest a default savings rate to employees for their HSA. (See Table 28.)
• Fewer than one-in-five organizations solicit rollovers from HSAs for newly hired employees. (See Table 30.)
Payer of HSA Maintenance Fees
Employer — Active Employees Only 54.7%
Employer — Active and Terminated Employees5.0%
Shared Between Employer and Participant1.1%
Participant35.9%
No Fees3.3%
Contents | Index

PSCA’s 2019 Health Savings Account Survey8
Full Data Tables
Following are the full data tables by section that support and expand on the data found in the Executive Summary. These tables are in line with the tables from previous survey reports.
Demographics ................................................................................................................................................................................................................ 9
Eligibility and Participation ............................................................................................................................................................................ 11
Employer Contributions .................................................................................................................................................................................... 13
Investments ..................................................................................................................................................................................................................... 15
Education .......................................................................................................................................................................................................................... 17
Plan Administration ............................................................................................................................................................................................... 19
Contents | Index

Plan Sponsor Council of America • PSCA.org 9
Full Data Tables | Demographics
Demographics
Table 1 | Respondent demographics by organization size (number of total employees)
Organization Size by Number of Total Employees
1– 49 50 –199 200 – 999 1,000 – 4,999 5,000+ All Plans
Number of Plans 25 31 48 52 33 189
Percentage of Plans 13.2% 16.4% 25.4% 27.5% 17.5% 100.0%
Table 2 | Respondents by industry type
All Plans
Industry Number of Plans Percentage of Plans
Construction 4.2% 8
Durable Goods Manufacturing 9.5% 18
Engineering 1.6% 3
Financial 32.8% 62
Healthcare 5.3% 10
Insurance/Real Estate 9.0% 17
Non-durable Goods Manufacturing 3.2% 6
Non-Profit Organization 6.9% 13
Retail Trade 3.2% 6
Services 10.1% 19
Technology or Telecommunications 7.9% 15
Transportation 2.1% 4
Utility or Energy 3.2% 6
Wholesale Distribution 1.1% 2
Total 100.1% 189
Contents | Index
PSCA’s 2019 Health Savings Account Survey10
Full Data Tables | Demographics
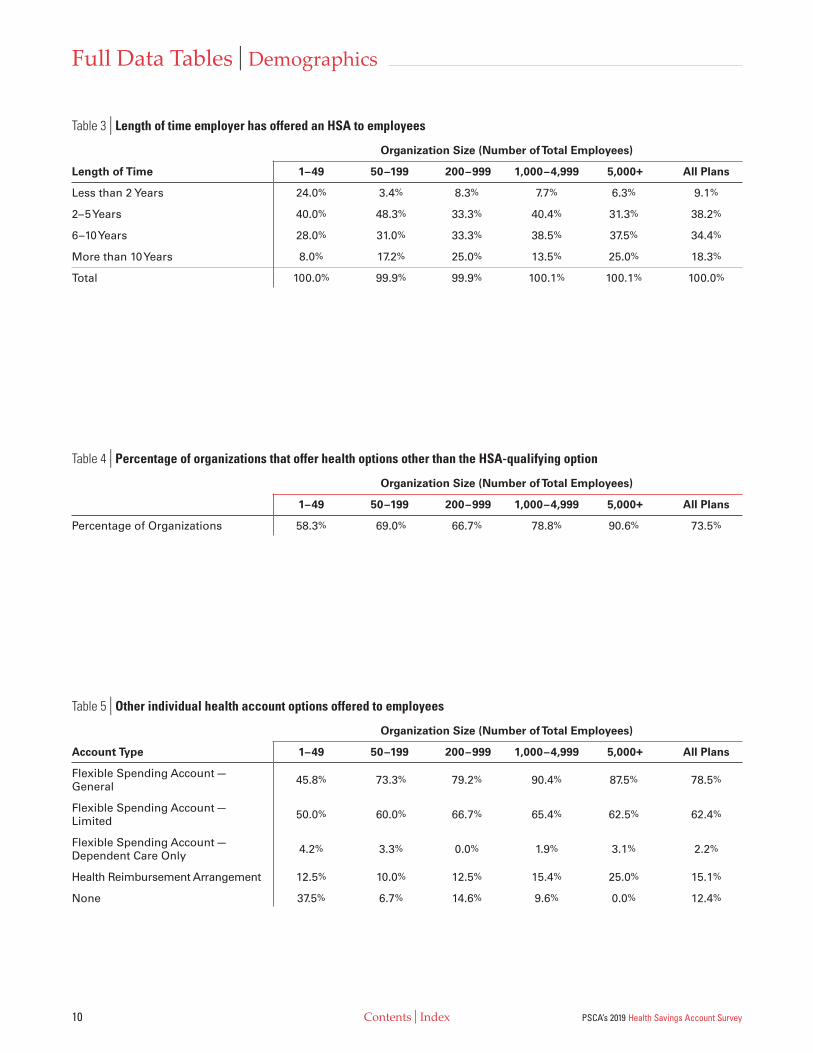
Table 4 | Percentage of organizations that offer health options other than the HSA-qualifying option
Organization Size (Number of Total Employees)
1–49 50–199 200–999 1,000–4,999 5,000+ All Plans
Percentage of Organizations 58.3% 69.0% 66.7% 78.8% 90.6% 73.5%
Table 3 | Length of time employer has offered an HSA to employees
Organization Size (Number of Total Employees)
Length of Time 1–49 50–199 200–999 1,000–4,999 5,000+ All Plans
Less than 2 Years 24.0% 3.4% 8.3% 7.7% 6.3% 9.1%
2–5 Years 40.0% 48.3% 33.3% 40.4% 31.3% 38.2%
6–10 Years 28.0% 31.0% 33.3% 38.5% 37.5% 34.4%
More than 10 Years 8.0% 17.2% 25.0% 13.5% 25.0% 18.3%
Total 100.0% 99.9% 99.9% 100.1% 100.1% 100.0%
Table 5 | Other individual health account options offered to employees
Organization Size (Number of Total Employees)
Account Type 1–49 50–199 200–999 1,000–4,999 5,000+ All Plans
Flexible Spending Account — General 45.8% 73.3% 79.2% 90.4% 87.5% 78.5%
Flexible Spending Account — Limited 50.0% 60.0% 66.7% 65.4% 62.5% 62.4%
Flexible Spending Account — Dependent Care Only 4.2% 3.3% 0.0% 1.9% 3.1% 2.2%
Health Reimbursement Arrangement 12.5% 10.0% 12.5% 15.4% 25.0% 15.1%
None 37.5% 6.7% 14.6% 9.6% 0.0% 12.4%
Contents | Index
Plan Sponsor Council of America • PSCA.org 11
Full Data Tables | Eligibility and Participation
Table 7 | Percentage of eligible employees that had an HSA in 2018
Organization Size (Number of Total Employees)
1–49 50–199 200–999 1,000–4,999 5,000+ All Plans
Percentage of Employees 96.4% 91.8% 91.2% 87.6% 89.3% 90.7%
Table 8 | Percentage of employees with an HSA that contributed to it in 2018
Organization Size (Number of Total Employees)
1–49 50–199 200–999 1,000–4,999 5,000+ All Plans
Percentage of Employees 90.2% 86.3% 86.1% 85.8% 80.9% 85.7%
Table 6 | Percentage of total employees eligible to participate in the HSA program in 2018 (enrolled in the HSA-capable health option)
Organization Size (Number of Total Employees)
1–49 50–199 200–999 1,000–4,999 5,000+ All Plans
Average Percentage of Employees 77.0% 59.2% 54.4% 43.2% 46.5% 53.7%
Eligibility and Participation
Contents | Index

PSCA’s 2019 Health Savings Account Survey12
Full Data Tables | Eligibility and Participation
Table 9 | Average participant contribution in 2018
All Plans
Average Contribution $2,595
Median Contribution $2,476
Table 10 | Average HSA balance in 2018
All Plans
Average Balance $5,239
Median Balance $3,480
Table 11 | Percentage of participants that spent their entire HSA balance in 2018
Organization Size (Number of Total Employees)
Percentage of Participants 1–49 50–199 200–999 1,000–4,999 5,000+ All Plans
0 – 25% 43.5% 20.0% 23.9% 28.0% 33.3% 28.5%
26 – 50% 4.3% 6.7% 4.3% 6.0% 3.3% 5.0%
51 – 75% 4.3% 6.7% 2.2% 0.0% 3.3% 2.8%
76 – 100% 0.0% 0.0% 0.0% 2.0% 0.0% 0.6%
Unknown 47.8% 66.7% 69.6% 64.0% 60.0% 63.1%
Total 99.9% 100.1% 100.0% 100.0% 99.9% 100.0%
Table 12 | Percentage of participants that contributed the maximum to the HSA in 2018
Organization Size (Number of Total Employees)
Percentage of Participants 1–49 50–199 200–999 1,000–4,999 5,000+ All Plans
Less than 5% 12.0% 21.4% 15.2% 32.0% 23.3% 21.8%
5–9.9% 0.0% 17.9% 21.7% 14.0% 6.7% 13.4%
10–14.9% 8.0% 17.9% 17.4% 14.0% 6.7% 13.4%
15–19.9% 16.0% 10.7% 4.3% 12.0% 10.0% 10.1%
More than 20% 44.0% 21.4% 23.9% 8.0% 3.3% 18.4%
Unknown 20.0% 10.7% 17.4% 20.0% 50.0% 22.9%
Total 100.0% 100.0% 99.9% 100.0% 100.0% 100.0%
Contents | Index

Plan Sponsor Council of America • PSCA.org 13
Full Data Tables | Employer Contributions
Table 13 | Percentage of organizations that contribute to the HSA
Organization Size (Number of Total Employees)
1–49 50–199 200–999 1,000–4,999 5,000+ All Plans
Percentage of Organizations 75.0% 73.3% 81.3% 94.2% 75.0% 81.7%
Table 14 | Formula used to calculate the organization’s contribution to the HSA
Organization Size (Number of Total Employees)
Formula 1–49* 50–199 200–999 1,000–4,999 5,000+ All Plans
Set Dollar Amount per Employee 61.1% 22.7% 13.2% 12.5% 25.0% 22.0%
Set Dollar Amount per Coverage Level 38.9% 77.3% 81.6% 72.9% 58.3% 69.3%
Match Employee’s Contribution 0.0% 0.0% 2.6% 4.2% 4.2% 2.7%
Other 0.0% 0.0% 2.6% 10.4% 12.5% 6.0%
Total 100.0% 100.0% 100.0% 100.0% 100.0% 100.0%
* Small sample size.
Table 15 | Timing of employer contributions to the HSA
Organization Size (Number of Total Employees)
Timing 1–49* 50–199 200–999 1,000–4,999 5,000+ All Plans
Front-Loaded (Made at the beginning of the year.) 17.6% 36.4% 21.1% 42.9% 41.7% 33.3%
Quarterly 23.5% 9.1% 15.8% 4.1% 4.2% 10.0%
Monthly 23.5% 4.5% 5.3% 6.1% 4.2% 7.3%
Per Pay-Period 29.4% 40.9% 39.5% 28.6% 37.5% 34.7%
Other 5.9% 9.1% 18.4% 18.4% 12.5% 14.7%
Total 99.9% 100.0% 100.1% 100.1% 100.1% 100.0%
* Small sample size.
Employer Contributions
Contents | Index

PSCA’s 2019 Health Savings Account Survey14
Full Data Tables | Employer Contributions
Table 16 | Amount contributed per employee for companies that use a per-employee formula
Contribution Range Percentage
$1 – $500 24.3%
$501 – $1,000 41.9%
$1,001 – $1,250 5.4%
More than $1,251 28.4%
Total 100.0%
Table 17 | Single coverage contribution range for organizations that use a coverage-level formula
Contribution Range Percentage
$1 – $250 11.6%
$251 – $500 38.0%
$501 – $750 23.1%
$751 – $1,000 9.1%
$1,001 – $1 ,349 6.6%
$1,350 or more 11.6%
Total 100.0%
Table 18 | Contribution range for coverage other than single
Contribution Range Percentage
$1 – $500 9.2%
$501 – $1,000 42.9%
$1,001 – $1,500 22.7%
$1,501 – $2,000 7.6%
$2,001 – $2,500 5.0%
$2,501 – $2,699 2.5%
$2,700 or more 10.1%
Total 100.0%
Contents | Index

Plan Sponsor Council of America • PSCA.org 15
Full Data Tables | Investments
Table 19 | Percentage of organizations that offer investment options for HSA contributions
Organization Size (Number of Total Employees)
1–49 50–199 200–999 1,000–4,999 5,000+ All Plans
Percentage of Organizations 84.0% 66.7% 80.9% 95.9% 96.7% 85.6%
Table 20 | Party who determined the investment options
Organization Size (Number of Total Employees)
Party 1–49 50–199 200–999 1,000–4,999 5,000+ All Plans
HSA Provider 95.2% 85.0% 91.9% 91.5% 92.6% 91.4%
Plan Sponsor 0.0% 5.0% 2.7% 6.4% 3.7% 3.9%
Other 4.8% 10.0% 5.4% 2.1% 3.7% 4.6%
Total 100.0% 100.0% 100.0% 100.0% 100.0% 99.9%
Table 21 | Minimum balance requirements before participants can invest assets
Organization Size (Number of Total Employees)
Minimum 1–49 50–199 200–999 1,000–4,999 5,000+ All Plans
Minimum less than $1,000 4.8% 15.8% 8.1% 8.5% 11.1% 9.3%
Minimum of $1,000 38.1% 26.3% 27.0% 36.2% 37.0% 33.1%
Minimum more than $1,000 38.1% 52.6% 51.4% 38.3% 37.0% 43.0%
None 19.0% 5.3% 13.5% 17.0% 14.8% 14.6%
Total 100.0% 100.0% 100.0% 100.0% 99.9% 100.0%
Investments
Contents | Index

PSCA’s 2019 Health Savings Account Survey16
Full Data Tables | Investments
Table 22 | Types of investment options offered
Organization Size (Number of Total Employees)
Investment Type 1–49 50–199 200–999 1,000–4,999 5,000+ All Plans
Mutual Funds 90.5% 100.0% 93.9% 97.8% 100.0% 96.5%
Self-directed Brokerage 23.8% 26.3% 21.2% 13.0% 16.0% 18.8%
CDs 4.8% 5.3% 6.1% 2.2% 0.0% 3.5%
Table 24 | Percentage of organizations that charge an investment management fee (other than asset management fees) separate from the HSA maintenance fee
Charges an Investment Organization Size (Number of Total Employees)
Management Fee 1–49 50–199 200–999 1,000–4,999 5,000+ All Plans
Yes 28.6% 26.3% 45.9% 34.8% 30.8% 34.9%
No 52.4% 42.1% 32.4% 47.8% 42.3% 43.0%
Unsure 19.0% 31.6% 21.6% 17.4% 26.9% 22.1%
Total 100.0% 100.0% 99.9% 100.0% 100.0% 100.0%
Table 23 | Percentage of organizations that have the same investment lineup for the HSA as in the 401(k)/other DC plan
Organization Size (Number of Total Employees)
1–49* 50–199 200–999 1,000–4,999 5,000+ All Plans
Percentage of Organizations 10.0% 0.0% 5.6% 0.0% 0.0% 2.7%
* Small sample size.
Contents | Index

Plan Sponsor Council of America • PSCA.org 17
Full Data Tables | Education
Table 27 | Percentage of organizations that provide education or advice to employees on choosing between the 401(k)/403(b) and the HSA
Organization Size (Number of Total Employees)
1–49 50–199 200–999 1,000–4,999 5,000+ All Plans
Percentage of Organizations 75.0% 74.2% 55.6% 50.0% 45.2% 57.9%
Table 25 | Timing of HSA education
Organization Size (Number of Total Employees)
Timing 1–49 50–199 200–999 1,000–4,999 5,000+ All Plans
Primarily at Open Enrollment 78.3% 83.9% 77.8% 75.0% 67.7% 76.4%
Multiple Times Throughout the Year 21.7% 12.9% 17.8% 23.1% 32.3% 21.4%
Other 0.0% 3.2% 4.4% 1.9% 0.0% 2.2%
Total 100.0% 100.0% 100.0% 100.0% 100.0% 100.0%
Table 26 | Resources used to educate employees about the HSA
Organization Size (Number of Total Employees)
Resource 1–49 50–199 200–999 1,000–4,999 5,000+ All Plans
HSA “How-to” Guide 56.5% 58.1% 53.3% 57.7% 58.1% 56.6%
Written Materials Only 26.1% 35.5% 24.4% 34.6% 38.7% 31.9%
Flyers 21.7% 41.9% 42.2% 65.4% 35.5% 45.1%
Mobile Technology 8.7% 9.7% 22.2% 17.3% 12.9% 15.4%
Videos 17.4% 12.9% 15.6% 42.3% 38.7% 26.9%
Webinars 13.0% 16.1% 24.4% 48.1% 32.3% 29.7%
Group Presentations 52.2% 67.7% 75.6% 57.7% 38.7% 59.9%
Other 4.3% 6.5% 13.3% 3.8% 6.5% 7.1%
Education
Contents | Index

PSCA’s 2019 Health Savings Account Survey18
Full Data Tables | Education
Table 28 | Percentage of organizations that use a default or otherwise suggest an savings amount to employees during annual enrollment
Organization Size (Number of Total Employees)
1–49 50–199 200–999 1,000–4,999 5,000+ All Plans
Percentage of Organizations 20.8% 16.1% 4.4% 3.8% 12.9% 9.8%
Table 29 | Percentage of organizations that encourage or offer additional education to employees who do not contribute to the HSA or only contribute a nominal amount
Organization Size (Number of Total Employees)
1–49 50–199 200–999 1,000–4,999 5,000+ All Plans
Percentage of Organizations 25.0% 32.3% 15.6% 25.0% 32.3% 25.1%
Contents | Index

Plan Sponsor Council of America • PSCA.org 19
Full Data Tables | Plan Administration
Table 30 | Percentage of organizations that solicit rollovers from health savings accounts for newly-hired participants
Organization Size (Number of Total Employees)
1–49 50–199 200–999 1,000–4,999 5,000+ All Plans
Percentage of Organizations 20.8% 25.8% 17.4% 23.5% 6.5% 19.1%
Plan Administration
Table 31 | Payer of HSA maintenance fees
Organization Size (Number of Total Employees)
Payer of Fees 1–49 50–199 200–999 1,000–4,999 5,000+ All Plans
Employer — Active Employees Only 29.2% 51.6% 47.8% 62.7% 75.9% 54.7%
Employer — Active and Terminated Employees 16.7% 6.5% 2.2% 2.0% 3.4% 5.0%
Shared Between Employer and Participant 0.0% 0.0% 0.0% 3.9% 0.0% 1.1%
Participant 50.0% 41.9% 43.5% 29.4% 17.2% 35.9%
No Fees 4.2% 0.0% 6.5% 2.0% 3.4% 3.3%
Total 100.1% 100.0% 100.0% 100.0% 99.9% 100.0%
Table 32 | Average cost per participant to administer the HSA plan
Fee Type
Monthly Annual
Average $2.80 $33.14
Median $2.75 $33.00
Contents | Index

PSCA’s 2019 Health Savings Account Survey20
Full Data Tables | Plan Administration
Table 33 | Resources used in the development of the HSA program
Organization Size (Number of Total Employees)
Resource 1–49 50–199 200–999 1,000–4,999 5,000+ All Plans
Benefits Broker/Consultant 47.6% 76.7% 83.7% 81.6% 72.4% 75.6%
Lawyer 0.0% 3.3% 2.3% 4.1% 10.3% 4.1%
Retirement Advisor 19.0% 3.3% 4.7% 2.0% 0.0% 4.7%
None/Self-Designed 14.3% 13.3% 7.0% 6.1% 10.3% 9.3%
Other 19.0% 3.3% 2.3% 6.1% 6.9% 6.4%
Total 99.9% 99.9% 100.0% 99.9% 99.9% 100.1%
Table 34 | HSA provider types
Organization Size (Number of Total Employees)
Provider 1–49 50–199 200–999 1,000–4,999 5,000+ All Plans
Bank 37.5% 50.0% 62.2% 40.4% 32.3% 45.6%
Credit Union 0.0% 0.0% 0.0% 1.9% 0.0% 0.5%
HSA Administrator 50.0% 36.7% 28.9% 51.9% 61.3% 45.1%
Investment Firm 4.2% 0.0% 2.2% 5.8% 0.0% 2.7%
Non-bank Trustee 8.3% 0.0% 2.2% 0.0% 3.2% 2.2%
Other 0.0% 13.3% 4.4% 0.0% 3.2% 3.8%
Total 100.0% 100.0% 99.9% 100.0% 100.0% 99.9%
Table 35 | Percentage of organizations that offer pre-tax payroll deductions of HSA contributions through your cafeteria plan
Organization Size (Number of Total Employees)
1–49 50–199 200–999 1,000–4,999 5,000+ All Plans
Percentage of Organizations 83.3% 96.7% 93.3% 94.2% 93.1% 92.8%
Contents | Index
Plan Sponsor Council of America • PSCA.org 21
Full Data Tables | Plan Administration
Table 37 | Primary HSA concern
Organization Size (Number of Total Employees)
Concern 1–49 50–199 200–999 1,000–4,999 5,000+ All Plans
Difficulty of Administration 23.8% 6.9% 7.1% 18.8% 26.9% 15.7%
Compliance 9.5% 17.2% 11.9% 2.1% 3.8% 8.4%
Employee Education 38.1% 48.3% 66.7% 70.8% 69.2% 61.4%
Investment Options 14.3% 10.3% 7.1% 2.1% 0.0% 6.0%
Fiduciary liability 4.8% 10.3% 4.8% 0.0% 0.0% 3.6%
Other 9.5% 6.9% 2.4% 6.3% 0.0% 4.8%
Total 100.0% 99.9% 100.0% 100.1% 99.9% 99.9%
Table 38 | Secondary HSA concern
Organization Size (Number of Total Employees)
Concern 1–49 50–199 200–999 1,000–4,999 5,000+ All Plans
Difficulty of Administration 20.0% 7.1% 15.0% 31.8% 16.7% 19.2%
Compliance 15.0% 39.3% 27.5% 29.5% 37.5% 30.1%
Employee Education 25.0% 25.0% 15.0% 13.6% 8.3% 16.7%
Investment Options 25.0% 21.4% 12.5% 13.6% 8.3% 15.4%
Fiduciary liability 10.0% 7.1% 30.0% 11.4% 25.0% 17.3%
Other 5.0% 0.0% 0.0% 0.0% 4.2% 1.3%
Total 100.0% 99.9% 100.0% 99.9% 100.0% 100.0%
Table 36 | Percentage of organizations that automatically enroll employees in the HSA if they enroll in the HSA-qualifying health option
Organization Size (Number of Total Employees)
1–49 50–199 200–999 1,000–4,999 5,000+ All Plans
Percentage of Organizations 34.8% 37.9% 20.0% 26.9% 35.5% 29.4%
Contents | Index
PSCA’s 2019 Health Savings Account Survey22
Survey Questionnaire
Following is the 5-page survey questionnaire used to collect data for PSCA’s 2019 HSA Survey. The questionnaire was distributed online only.
Contents | Index

1
2019HealthSavingsAccounts
BenchmarkingSurveyQuestionnaire1. Pleaseselectthecategorythatmostcloselymatchestheindustryofyourcompany
oConstructionoDurableGoodsManufacturingoEngineeringoFinancialoHealthcareoInsurance/RealEstateoNon-DurableGoodsManufacturingoNon-ProfitOrganizationoRetailTrade
oServicesoTechnology/TelecommunicationsoTransportationoTribaloUtility/EnergyoWholesaleDistributionoOther
2. HowmanytotalUSemployeesdoesyourcompanyhave?_____________
3. Whatisyourtitle?______________________
Availability
4. DidyouofferaHealthSavingsAccount(HSA)–qualifyinghealthoptiontoemployeesin2018?oYes oNo
Ifnot,didyouofferonefor2019?oYes(skiptoendofsurvey) oNo(Skiptoendofsurvey)
a)Ifyes,forhowmanyyearshaveyouofferedanHSA?
oLessthan2yearso2-5yearso6-10yearsoMorethan10years
b)DoyouhavehealthplanoptionsotherthantheHSA-qualifyinghealthoption?oYes oNo
c.)DoyouofferanyoftheseindividualhealthaccountoptionsotherthanHSAs?Checkallthatapply. oFlexibleSpendingAccount(FSA)–GeneraloFlexibleSpendingAccount(FSA)–LimitedoHealthReimbursementArrangementoNoneoOther
2
Participation
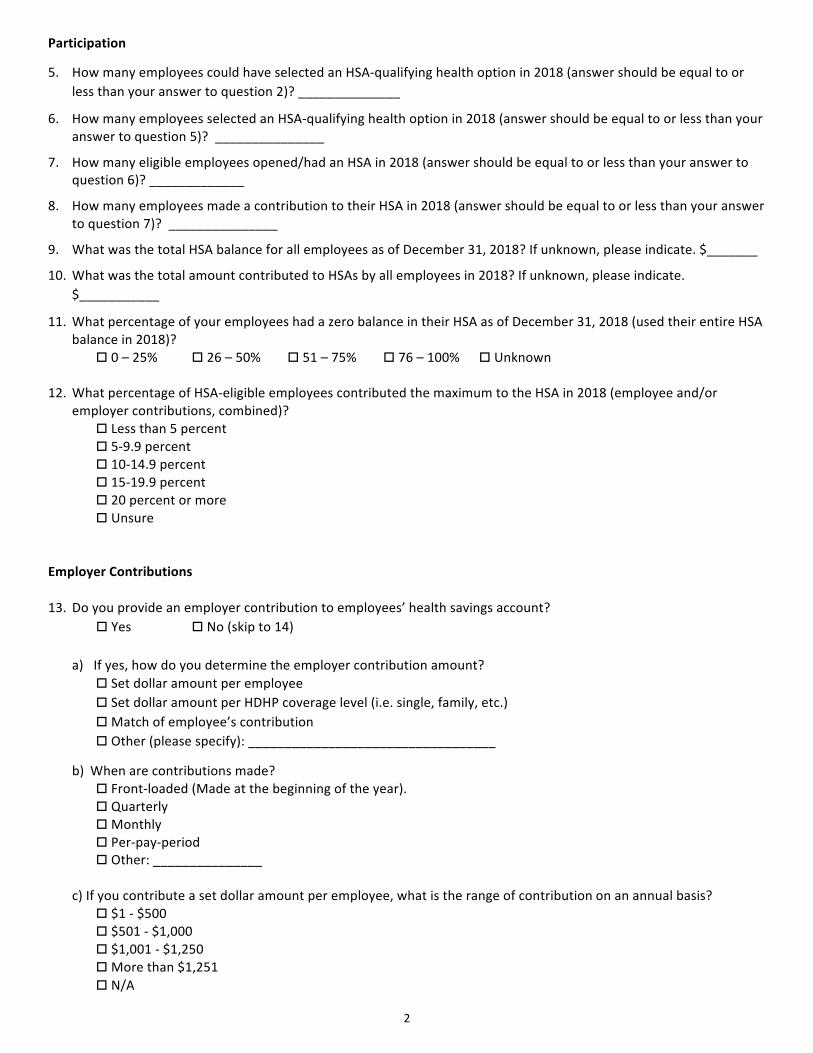
5. HowmanyemployeescouldhaveselectedanHSA-qualifyinghealthoptionin2018(answershouldbeequaltoorlessthanyouranswertoquestion2)?______________
6. HowmanyemployeesselectedanHSA-qualifyinghealthoptionin2018(answershouldbeequaltoorlessthanyouranswertoquestion5)?_______________
7. Howmanyeligibleemployeesopened/hadanHSAin2018(answershouldbeequaltoorlessthanyouranswertoquestion6)?_____________
8. HowmanyemployeesmadeacontributiontotheirHSAin2018(answershouldbeequaltoorlessthanyouranswertoquestion7)?_______________
9. WhatwasthetotalHSAbalanceforallemployeesasofDecember31,2018?Ifunknown,pleaseindicate.$_______
10. WhatwasthetotalamountcontributedtoHSAsbyallemployeesin2018?Ifunknown,pleaseindicate.$___________
11. WhatpercentageofyouremployeeshadazerobalanceintheirHSAasofDecember31,2018(usedtheirentireHSAbalancein2018)?
o0–25% o26–50% o51–75% o76–100% oUnknown
12. WhatpercentageofHSA-eligibleemployeescontributedthemaximumtotheHSAin2018(employeeand/oremployercontributions,combined)?
oLessthan5percent o5-9.9percent o10-14.9percent o15-19.9percent o20percentormoreoUnsure
EmployerContributions13. Doyouprovideanemployercontributiontoemployees’healthsavingsaccount?
oYes oNo(skipto14)a) Ifyes,howdoyoudeterminetheemployercontributionamount?
oSetdollaramountperemployeeoSetdollaramountperHDHPcoveragelevel(i.e.single,family,etc.)oMatchofemployee’scontributionoOther(pleasespecify):__________________________________
b) Whenarecontributionsmade?oFront-loaded(Madeatthebeginningoftheyear).oQuarterlyoMonthlyoPer-pay-periodoOther:_______________
c)Ifyoucontributeasetdollaramountperemployee,whatistherangeofcontributiononanannualbasis?
o$1-$500o$501-$1,000o$1,001-$1,250oMorethan$1,251oN/A
3
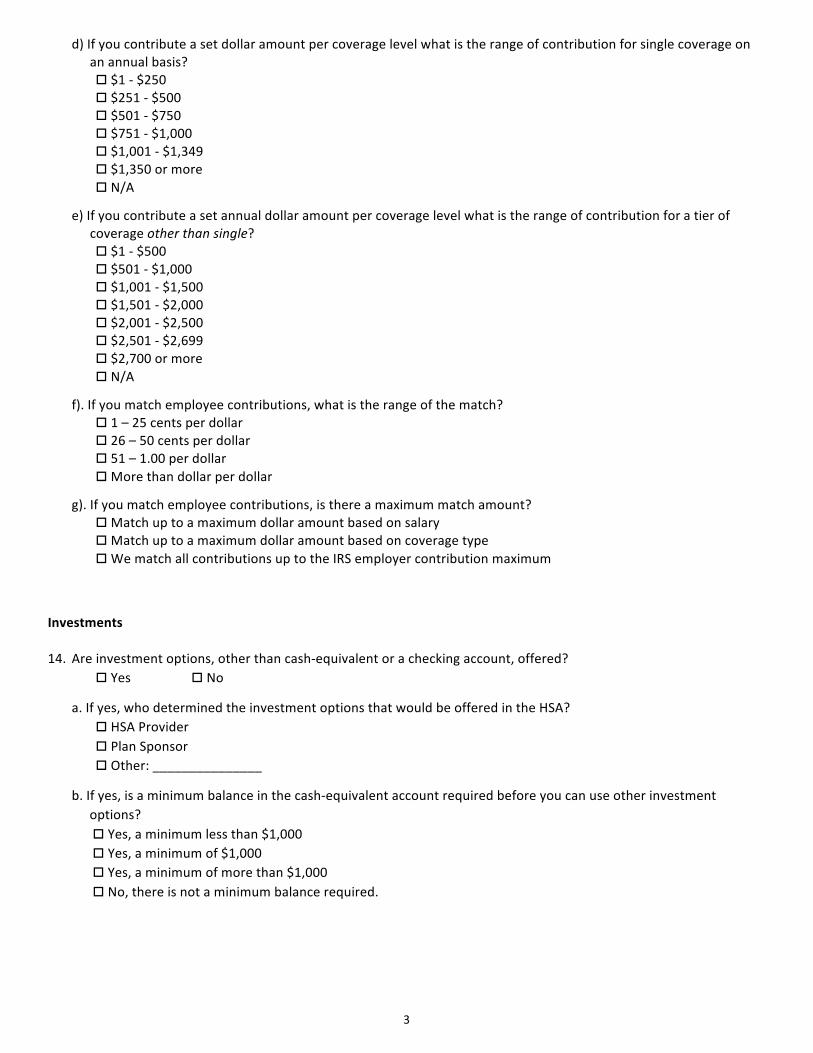
d)Ifyoucontributeasetdollaramountpercoveragelevelwhatistherangeofcontributionforsinglecoverageonanannualbasis?o$1-$250o$251-$500o$501-$750o$751-$1,000o$1,001-$1,349o$1,350ormoreoN/A
e)Ifyoucontributeasetannualdollaramountpercoveragelevelwhatistherangeofcontributionforatierofcoverageotherthansingle?o$1-$500o$501-$1,000o$1,001-$1,500o$1,501-$2,000o$2,001-$2,500o$2,501-$2,699o$2,700ormoreoN/A
f).Ifyoumatchemployeecontributions,whatistherangeofthematch?o1–25centsperdollaro26–50centsperdollaro51–1.00perdollaroMorethandollarperdollar
g).Ifyoumatchemployeecontributions,isthereamaximummatchamount?oMatchuptoamaximumdollaramountbasedonsalaryoMatchuptoamaximumdollaramountbasedoncoveragetypeoWematchallcontributionsuptotheIRSemployercontributionmaximum
Investments14. Areinvestmentoptions,otherthancash-equivalentoracheckingaccount,offered?
oYes oNo
a.Ifyes,whodeterminedtheinvestmentoptionsthatwouldbeofferedintheHSA?oHSAProvideroPlanSponsoroOther:_______________
b.Ifyes,isaminimumbalanceinthecash-equivalentaccountrequiredbeforeyoucanuseotherinvestmentoptions?oYes,aminimumlessthan$1,000oYes,aminimumof$1,000oYes,aminimumofmorethan$1,000oNo,thereisnotaminimumbalancerequired.

4
c.Ifyes,whatareyourinvestmentoptions,checkallthatapply:oMutualFundsoSelf-directedBrokerageoCDsoother
IfMutualFunds,howmanyareoffered?_____________
d.Whatpercentageofparticipantschosesomethingotherthanmoneymarket/cashequivalentfunds?Ifunknown,pleaseindicateso.$__________
e.Whatpercentageofassetsareinsomethingotherthanmoneymarket/cashequivalentfunds.Ifunknown,pleaseindicateso.$___________
h.Istheinvestmentlineupthesameasinyour401(k)/otherDCplan?oYes oNo
f.Excludingassetmanagementfees,areparticipantschargedafeeforinvestmentmanagementseparatefromtheHSAmaintenancefee?oYes oNo
PlanAdministration 15. DoyousolicitrolloversfromHealthSavingsAccountsfornewlyhiredparticipants?
oYes No
16. DoesyourcompanycoverthemaintenancefeesoftheHSAsforemployees?oYes,foractiveemployeesonly.oYes,foractiveandterminatedemployees.oSharedcostbetweencompanyandemployee.oNooOther____________
17. WhatistheaveragecostperparticipanttoadministertheHSAplan?_____________
18. WhatresourcesdidyouuseforthedevelopmentofyourHSAplan?oBenefitsbroker/Consultant oRetirementAdvisoroCPA oLawyeroOther:_____________
19. IsyourHSAProvidera:oBankoCreditUnionoInvestmentFirmoNon-bankTrusteeoHSAAdministratoroOther:______________
20. Doyouofferpre-taxpayrolldeductionsofHSAcontributionsthroughyourcafeteriaplan?oYes oNo

5
21. Similartoautomaticenrollmentina401(k)or403(b)plan,doyouautomaticallyenrollemployeesintheHSAiftheyenrollintheHSA-qualifyinghealthoption?
oYes oNo
22. PleaserankyourtoptwoHSAconcerns:oDifficultyofadministrationoComplianceoEmployeeEducationoInvestmentOptionsoFiduciaryliabilityoOther:_______________
Education23. HowoftendoyoueducateemployeesabouttheHSA?
oPrimarilyatopenenrollmentoMultipletimesthroughouttheyearoOther
24. WhichofthefollowingresourcesorcommunicationoptionsdoyouusetoeducateemployeesabouttheHSA?Checkallthatapply.
oHSA“how-to”GuideoWrittenmaterialsonlyoFlyersoPresentationsoMobileTechnologyoVideosoWebinarsoGroupPresentationsoOther(pleasespecify):
25. Doyouprovideeducationoradvicetoemployeesonhowtochoosebetweenthe401(k)/403(b)ortheHSA?oYes oNo
26. Duringannualenrollment,doyouuseadefaultorotherwisesuggestanamountemployeesshouldcontributetotheirHSA?
oYes oNo
27. DoesyourorganizationencourageorofferadditionaleducationtoemployeeswhodonotcontributetotheHSAor
onlycontributeanominalamount?oYes oNo
PSCA’s 2019 Health Savings Account Survey28
Index of Full Data Tables
Term Page
Default Usage ........................................................................................ 18
Employer Contribution
Amounts ............................................................................................. 14
Formulas ............................................................................................ 13
Frequency .......................................................................................... 13
Employer HSA Concerns ..................................................................... 21
Flexible Spending Accounts .............................................................. 10
Health Reimbursement Arrangement ............................................... 10
HSA Balance
Usage .................................................................................................. 12
Average .............................................................................................. 12
HSA Education ...................................................................................... 17
HSA Maintenance Fees ....................................................................... 19
HSA Providers ....................................................................................... 20
Investment Option Fees ....................................................................... 16
Investment Options ............................................................................... 15
Participant Contributions, Average ................................................... 12
Participants with Accounts ................................................................ 11
Rollovers ................................................................................................ 19
Contents | Index

Plan Sponsor Council of America 200 S. Wacker Drive, Suite 3100 Chicago, IL 60606
312-419-1863
[email protected] http://www.psca.org