2018 wisconsin agricultural statistics - nass.usda.gov · in 2017, wisconsin maintained its...
TRANSCRIPT

2018
WISCONSINAGRICULTURAL
STATISTICS

Price $10.00
2018AgStatsBulletin.indd 10/18

Sincerely,
Greg A. Bussler State Statistician
September 2018
United States Department of AgricultureNational Agricultural Statistics Service
Cooperating with the Wisconsin Department of Agriculture, Trade and Consumer ProtectionWisconsin Field Office 2811 Agriculture Dr. · Madison, WI 53718-6777
(608) 224-4848 · (855) 271-9802 FAX · www.nass.usda.gov/wi E-mail: [email protected]
A Cooperative Function of:WISCONSIN DEPARTMENT OF AGRICULTURE, TRADEAND CONSUMER PROTECTIONSheila Harsdorf, SecretaryLaurie Lawrence, Art Director
UNITED STATES DEPARTMENT OF AGRICULTURENational Agricultural Statistics ServiceHubert Hamer, AdministratorJay Johnson, Director for Western Field Operations
Compiled by:USDA NASS, WISCONSIN FIELD OFFICE Greg Bussler, State StatisticianAudra Hubbell, Adrien Joyner, Heidi Woodstock
Wisconsin 2018 Agricultural Statistics
2018 Wisconsin Agricultural Statistics
The USDA’s National Agricultural Statistics Service (NASS), Wisconsin Field Office is pleased to team with Wisconsin Department of Agriculture, Trade, and Consumer Protection (DATCP) to provide you with the 2018 edition of Wisconsin Agricultural Statistics. This publication is a statistical profile of Wisconsin’s agriculture and includes information at the county level.
First off, I want to personally thank all the Wisconsin farmers that completed the 2017 Census of Agriculture. Wisconsin ranked 6th for returning the Census of Agriculture questionnaires. Farmers’ efforts at completing the Census will help tell how important agriculture is to Wisconsin’s economy and the contribution of the state’s agriculture to U.S. agriculture. Many decisions about farm policy and programs, infrastructure funding, and other important agribusiness decisions will be made from the results of the Census. The results of the 2017 Census of Agriculture will be released around February 19, 2019 and can be found at www.nass.usda.gov/AgCensus.
In 2017, Wisconsin maintained its position as the number one state in American cheese, cheddar cheese and total cheese production, dry whey for human consumption, milk goat inventory, mink pelts produced, corn harvested for silage, snap beans and cranberry production. Wisconsin cows produced 14 percent of the nation’s milk supply. Wisconsin also ranked second in the number of organic farms. Although farmers in 2017 had above average yields and good growing conditions they faced some economic challenges with low commodity prices. Throughout this publication you will find many interesting statistics about Wisconsin’s diverse and dynamic agriculture industry.
Publication and dissemination of agricultural statistics is only possible with cooperation of farmers, agribusiness, commodity groups, and countless others who gave their valuable time to provide the information for the content within this publication. Without their cooperation and support in providing timely and accurate data, this information would not be available to the agricultural community in Wisconsin.
I also want to thank the National Association of State Department of Agriculture enumerators for their outstanding effort in collecting and providing quality statistics for Wisconsin. In addition, the Wisconsin Field Office has a dedicated staff that helped put this publication together. Everyone is committed to the work they do, and I am thankful for their dedication to Wisconsin agriculture.
I hope you find this information beneficial for your agricultural interests. This publication, along with the many other reports NASS releases throughout the year, are available for free at www.nass.usda.gov. Please contact me anytime with your comments, questions, or requests for assistance.

Wisconsin 2018 Agricultural Statistics
Sincerely,
Sheila Harsdorf
Secretary
Greetings,
Thank you for taking time to review the 2018 Wisconsin Agricultural Statistics booklet. This publication contains a wealth of information that we at the Department of Agriculture, Trade and Consumer Protection rely on as we work with and serve our state’s farmers, processors and the agricultural industry. We are pleased to provide this valuable resource of up-to-date Wisconsin agricultural information to the public as well.
This booklet highlights Wisconsin’s diverse and productive agriculture industry providing data on everything from acreage, yield and production of various crops to the number of livestock raised to the level of milk production and other dairy products. It also contains information on land values, cash rents, farm income and farm expenses, just to name a few.
Agriculture continues to be one of our state’s top industries, generating over 88 billion dollars in sales in our state economy and employing one out of every 9 workers. In 2017, our state’s roughly 68,500 farms operated 14.3 million acres of land, and lead the nation in the production of cheese, cranberries, snap beans, milk goats and mink pelts. Our almost 8,500 dairy farms, 96 percent of which are family owned, produced 14 percent of our country’s total milk production and 27 percent of all U.S. cheese.
I want to thank all those who were instrumental in putting together this publication, particularly the National Agricultural Statistics Service (NASS). Farmers and other members of the agricultural community work with NASS every year to compile this information, which helps identify the importance and significance of agriculture to our state’s economy and allows us to plan for future needs.
I hope you find the 2018 Wisconsin Agricultural Statistics booklet to be a great resource!

Wisconsin 2018 Agricultural Statistics 1
Index
WISCONSIN AGRICULTURE AND ECONOMICS Agricultural Cash Rents, County and State................. 4, 5 Agricultural Land Sales, County and State.................. 10, 11 Agricultural Land Values.............................................. 4 Cash Receipts............................................................. 7 Farms by Economic Sales Class................................ 4 Farm Computer Usage................................................ 4 Farm Income Indications............................................. 6 Farms and Land in Farms........................................... 4 Farm Production Expenditures.................................... 8, 9 Farm Worker Wage Rates........................................... 4 Summary..................................................................... 2 Wisconsin’s Rank in Nation’s Agriculture.................... 3
CROPS Apples.......................................................................... 35 Beans, Dry Edible........................................................ 33 Biotechnology, Corn and Soybeans............................ 16 Cabbage..................................................................... 34 Carrots........................................................................ 34 Cherries....................................................................... 35 Corn for Grain, County and State................................ 18, 19 Corn for Silage, County and State.............................. 20, 21 Cranberries.................................................................. 35 Crops: Field Crops Acreage, Production, and Value......... 16 Record Highs and Lows......................................... 13 Cucumbers.................................................................. 34 Green Peas…….......................................................... 34 Grain Stocks, Quarterly............................................... 17 Hay: Alfalfa Hay (Dry), County and State....................... 28, 29 Forage & Hay, Acreage, Production, & Value........ 32 Other Hay (Dry), County and State........................ 30, 31 Seedings of Alfalfa................................................. 17 Stocks.................................................................... 17 Maple Syrup................................................................ 35 Mint for Oil................................................................... 33 Oats, County and State............................................... 24, 25 Onions......................................................................... 34 Potatoes, Acreage, Production, and Value.................. 33 Precipitation, Selected Stations................................... 14 Prices Received: Corn, Oats, Soybeans........................................... 17 Hay........................................................................ 32 Potatoes................................................................ 33 Pumpkins…………...................................................... 34 Snap Beans………….................................................. 34 Soybeans, County and State...................................... 22, 23 Strawberries................................................................ 35 Summary..................................................................... 12 Sweet Corn……………………………………………… 34 Temperatures, Selected Stations................................ 15 Wheat, Winter, County and State................................ 26, 27
LIVESTOCK AND DAIRY Cattle and Calves: Number by County................................................. 51 Number by Class................................................... 50 Production, Disposition, and Income..................... 50 Dairy Products: Cheese Production, by Variety............................... 46, 47 Number of Plants................................................... 48 Per Capita Consumption, U.S............................... 49 Price Averages, U.S.............................................. 48 Whey Production.................................................... 46 Goats: Number of Herds.................................................... 41 Number on Farms.................................................. 52 Hogs and Pigs: Number on Farms.................................................. 52 Production, Disposition, and Income..................... 52 Honey: Production and Value............................................. 54 Bee Colonies and Colony Health………………….. 54 Livestock: Number and Value by Species.............................. 37 Meat, Per Capita Consumption, U.S...................... 49 Record Highs and Lows......................................... 37 Milk Cows: Herds by Type of Milk Produced, County............... 40, 41 Herd Numbers by Month........................................ 41 Herd Size, DHI and All........................................... 42 Number and Production, County and State........... 38, 39 Number and Production, U.S................................. 42 Number and Production by Month......................... 42 Prices Received..................................................... 43 Milk Prices and Test.................................................... 43 Milk Production: Cost and Returns, Wisconsin and U.S.................. 45 DHI Data................................................................ 44 Disposition of Milk Sold, Historical......................... 43 Hauling Charges.................................................... 43 Production by County............................................. 38, 39 Production by Month.............................................. 42 Mink............................................................................ 54 Poultry: Broilers................................................................... 55 Chickens, Number on Farms................................. 55 Eggs, Production and Value................................... 55 Layers, Number, Production, and Value................ 55 Sheep and Lambs: Number on Farms.................................................. 52 Slaughter..................................................................... 53 Summary..................................................................... 36 Trout............................................................................ 54 Wool........................................................................... 52

2 Wisconsin 2018 Agricultural Statistics
Wisconsin Agriculture and EconomicsWisconsin cash receipts from farm marketings totaled $11.4 billion in 2017, a 6 percent increase from 2016. Receipts from livestock, dairy, and poultry comprised 70 percent of the total marketings of all commodities, compared to 68 percent the previous year. Milk sales totaled $5.44 billion in 2017, up 9 percent from the previous year’s total. During the same period, sales of meat animals rose 12 percent and poultry and eggs sales rose 9 percent. Miscellaneous livestock sales fell less than one percent overall. This included a 9 percent increase in trout sales, a 1 percent decrease in mink pelt sales and an 8 percent decrease in honey sales.
In 2017, cash receipts for all Wisconsin crops totaled $3.44 billion, down less than one percent from 2016. Sales of feed crops rose 5 percent from 2016. Corn sales were up 5 percent, to $1.37 billion. Soybean receipts, at $913 million, were down 7 percent. Total vegetable marketings rose 6 percent. Potato sales were up 11 percent while snap beans were down 12 percent. Sweet corn for processing receipts were down 3 percent while fresh sweet corn receipts were down 22 percent. Fruit and nut receipts were down 9 percent overall, with apples up 21 percent, tart cherries down 48 percent, and cranberries down 12 percent.
Wisconsin farm production expenditures totaled $11.6 billion in 2017, up 6 percent from the previous year. Feed expenses dropped 3 percent to $1.89 billion. This represented the largest single production expense for Wisconsin farmers in 2017, accounting for 16 percent of the total. Farm services were the second largest expense, totaling $1.63 billion and 14 percent of the total. Expenditures for farm services were up 5 percent from 2016. Expenditures fell modestly for labor and farm supplies and repairs while all other categories of expenditures rose from the previous year. Miscellaneous capital expenses more than doubled, spending on trucks and autos was up 60 percent, spending on tractors and self-propelled farm machinery was up 28 percent and spending on other farm machinery rose 40 percent. Expenditures per Wisconsin farm averaged $168,686 in 2017, 4 percent less than the national average of $176,352 per farm.
In 2017, the total number of agricultural land sales in Wisconsin decreased 2 percent and the total acreage sold decreased 10 percent. The average value of all agricultural land sold rose 4 percent to $5,759 per acre. The average value of land continuing in agricultural use fell 1 percent to $5,445 per acre, while land being diverted to other uses rose 41 percent to $10,007 per acre. The total number of transactions fell to 1,527 in 2017. The number of transactions where the land continued in agricultural use fell by 85 while the number of transactions where the land was diverted to other uses rose by 51. The total number of acres sold dropped 10 percent to 90,872.
There were 68,500 farms in Wisconsin in 2017, down 200 from 2016. The number of farms with sales over $1,000,000 increased by 100 farms. The number of farms with sales of $500,000 to $999,999 decreased by 100 and the number of farms with sales of $1,000 to 9,999 decreased by 200. The numbers of farms with sales of $10,000 to $99,999, $100,000 to $249,999 and $250,000 to $499,999 all stayed the same. Land in farms totaled 14.3 million acres, down 100,000 from the previous year. The average size of a Wisconsin farm decreased 1 acre to 209 acres.

Wisconsin 2018 Agricultural Statistics 3
WISCONSIN’S RANK IN THE NATION’S AGRICULTURAL PRODUCTION, 2017
CommodityRank
among states
Unit Wisconsin (Thousands)
Percent of U.S.
United States (Thousands) Leading state
DAIRY Milk production 2 Lbs. 30,320,000 14.1 215,466,000 CaliforniaCheese, total (excluding cottage cheese) 1 Lbs. 3,365,897 26.6 12,659,091 Wisconsin American 1 Lbs. 1,016,569 20.0 5,071,991 Wisconsin Cheddar 1 Lbs. 703,960 18.9 3,721,334 Wisconsin Hispanic 2 Lbs. 91,407 31.9 286,943 California Italian 1 Lbs. 1,702,351 31.6 5,383,864 Wisconsin Mozzarella 2 Lbs. 1,109,289 26.7 4,160,599 CaliforniaDry whey, human food 1 Lbs. 345,567 34.0 1,017,269 Wisconsin
LIVESTOCK AND POULTRY Cattle and calves, all 1/ 9 Head 3,500 3.7 94,399 Texas Milk cows 1/ 2 Head 1,275 13.6 9,400 CaliforniaHogs and pigs, all 2/ 19 Head 305 0.4 73,695 IowaSheep 1/ 3/ 20 Head 75 1.4 5,230 TexasMilk goats 1/ 1 Head 47 12.4 380 WisconsinChickens 2/ 17 Head 8,514 1.7 504,536 IowaBroilers 20 Head 53,800 0.6 8,913,000 GeorgiaEggs 17 Eggs 1,759,400 1.7 105,688,700 IowaMink pelts 1 Pelts 1,091 33.0 3,305 WisconsinTrout, sold 12” or longer 7 Lbs. 378 0.7 53,286 IdahoHoney 15 Lbs. 2,968 2.0 147,638 North Dakota
CROPS Corn for grain 10 Bu. 509,820 3.5 14,604,067 IowaCorn for silage 1 Tons 16,720 13.0 128,356 WisconsinOats 2 Bu. 5,015 10.2 49,391 MinnesotaSoybeans 14 Bu. 100,580 2.3 4,391,553 IllinoisWheat, winter 20 Bu. 11,560 0.9 1,269,437 KansasForage (dry equivalent), all 2 Tons 7,598 8.8 86,692 TexasHay (dry only), all 16 Tons 3,477 2.6 131,455 TexasPotatoes, all 3 Cwt. 29,145 6.6 441,307 IdahoApples 10 Lbs. 49,000 0.4 11,406,000 WashingtonCherries, tart 4 Lbs. 11,300 4.4 259,500 MichiganCranberries 1 Barrels 5,372 64.2 8,372 WisconsinMaple syrup 4 Gals. 200 4.7 4,271 VermontPeppermint for oil 5 Lbs. 197 3.4 5,778 OregonCabbage, all 3 Cwt. 3,300 14.0 23,491 CaliforniaCarrots, all 3 Cwt. 2,520 8.3 30,319 CaliforniaCucumbers, all 8 Cwt. 688 3.4 19,928 MichiganGreen peas, all 3 Cwt. 968 18.0 5,367 MinnesotaPumpkins, all 15 Cwt. 135 0.9 15,660 IllinoisSnap beans, all 1 Cwt. 6,563 36.4 18,032 WisconsinSweet corn, all 3 Cwt. 9,592 12.1 79,266 Minnesota1/January 1, 2018 inventory. 2/December 1, 2017. 3/ Tied with Virginia.

4 Wisconsin 2018 Agricultural Statistics
AGRICULTURAL CASH RENTS: WISCONSIN, 2014-2018
Year Cropland rented for cash
Pasture rented for cash
Dollars per acre2014 135.00 34.002015 134.00 34.002016 137.00 35.002017 139.00 40.002018 140.00 40.00
AGRICULTURAL LAND VALUES: AVERAGE VALUE PER ACRE, WISCONSIN, 2014-2018 1/
Year Farm real estate 2/ Cropland Pasture
Dollars per acre2014 4,400 4,350 2,1502015 4,700 4,700 2,2502016 4,750 4,900 2,3002017 5,200 5,200 2,3502018 5,320 5,150 2,4501/Value at which the land could be sold under current market conditions. 2/Value includes land and buildings.
FARM COMPUTER USAGE: WISCONSIN, 2007-2017
YearFarms with computer access
Farms using computer for
farm business
Farms with Internet access
Percent2007 69 38 582009 73 41 672011 73 42 672013 76 46 722015 77 47 722017 77 49 73
HIRED WORKERS: ANNUAL AVERAGE WAGE RATES, GREAT LAKES REGION, 2013-2017 1/ 2/
Year All hired Field Field and livestock
Dollars per hour2013 12.15 11.96 11.492014 12.18 11.73 11.562015 12.86 12.11 12.022016 13.30 13.17 12.752017 13.79 13.02 13.061/The annual average wage rates are averages of the published wage rates from each quarter's reference week weighted by the total hours worked during the week. 2/The Great Lakes Region consists of Wisconsin, Minnesota, and Michigan.
FARMS AND LAND IN FARMS, WISCONSIN, BY SALES CLASS, 2013-2017 1/Year $1,000-
$9,999$10,000-$99,999
$100,000-$249,999
$250,000-$499,999
$500,000 - $999,999
$1,000,000 & over Total
NUMBER OF FARMSNumber
2013 31,000 21,200 7,500 5,000 2,800 2,300 69,8002014 30,500 21,000 7,400 4,900 2,900 2,300 69,0002015 30,500 21,000 7,300 4,900 2,850 2,350 68,9002016 30,400 20,900 7,300 4,800 2,900 2,400 68,7002017 30,200 20,900 7,300 4,800 2,800 2,500 68,500
LAND IN FARMS1,000 acres
2013 2,100 2,900 2,000 2,100 2,000 3,500 14,6002014 2,000 2,900 1,950 2,050 2,050 3,550 14,5002015 1,950 2,900 1,900 2,050 2,050 3,550 14,4002016 1,950 2,850 1,950 2,050 2,050 3,550 14,4002017 1,850 2,850 1,900 2,150 2,050 3,500 14,300
AVERAGE FARM SIZEAcres
2013 68 137 267 420 714 1,522 2092014 66 138 264 418 707 1,543 2102015 64 138 260 418 719 1,511 2092016 64 136 267 427 707 1,479 2102017 61 136 260 448 732 1,400 209(NA) Not available. 1/ A farm is defined as “any establishment from which $1,000 or more of agricultural products were sold or would normally be sold during the year.”

Wisconsin 2018 Agricultural Statistics 5
NON-IRRIGATED CROPLAND CASH RENT: VALUE, BY COUNTIES, WISCONSIN, 2016 & 2017 1/County 2016 2017 County 2016 2017
Dollars per acre Dollars per acreBarron 72.00 83.50 Crawford 124.00 134.00Bayfield 25.00 - Grant 192.00 185.00Burnett 44.00 46.00 Iowa 199.00 169.00Chippewa 95.00 117.00 Lafayette 227.00 230.00Douglas 15.00 - Richland 103.00 107.00Polk 73.50 77.00 Sauk 125.00 127.00Rusk 66.00 70.00 Vernon 129.00 140.00Sawyer 35.00 41.50 Southwest 172.00 167.00Washburn 56.00 51.00 Columbia 179.00 189.00Other counties - 26.00 Dane 172.00 180.00Northwest 71.00 84.50 Dodge 176.00 199.00Ashland 18.00 - Green 169.00 164.00Clark 87.00 105.00 Jefferson 156.00 148.00Iron - - Rock 182.00 161.00Lincoln 44.00 56.00 South Central 173.00 175.00Marathon 79.50 95.50 Kenosha 152.00 139.00Oneida - - Milwaukee - -Price 28.00 35.00 Ozaukee - -Taylor 83.00 78.00 Racine 133.00 128.00Vilas - - Walworth 190.00 184.00Other counties 38.00 29.50 Washington 120.00 108.00North Central 77.00 90.00 Waukesha 114.00 128.00Florence - - Other counties 103.00 95.50Forest - - Southeast 144.00 135.00Langlade 82.00 79.00Marinette 96.00 66.50 Wisconsin 131.00 133.00Menominee - - 1/ Some counties were not published to avoid disclosure
of individual operations. Unpublished data is included in “other counties.”
Oconto 110.00 119.00Shawano 97.00 99.00Other counties 19.00 15.50Northeast 97.00 95.50Buffalo 121.00 131.00Dunn 99.50 102.00Eau Claire 86.00 88.50Jackson 99.50 108.00La Crosse 132.00 152.00Monroe 132.00 130.00Pepin 130.00 144.00Pierce 135.00 152.00St Croix 103.00 98.00Trempealeau 130.00 124.00West Central 116.00 120.00Adams 74.00 77.00Green Lake 143.00 133.00Juneau 91.50 90.50Marquette 53.00 75.50Portage 52.00 66.00Waupaca 87.00 79.00Waushara 56.00 53.00Wood 65.00 104.00Central 83.00 88.50Brown 181.00 165.00Calumet 155.00 134.00Door 81.00 -Fond du Lac 156.00 173.00Kewaunee 144.00 -Manitowoc 159.00 158.00Outagamie 108.00 124.00Sheboygan 107.00 108.00Winnebago 98.00 91.50Other counties - 134.00East Central 143.00 143.00
Price
Clark
Dane
Polk
Grant
Vilas
Bayfield
Iron
Sawyer
Rusk
Oneida
Marathon
Douglas
Forest
Taylor
Sauk
Dunn
Iowa
Rock
Dodge
Wood
BarronLincoln
Jackson
Ashland
Burnett
Monroe
Vernon
Chippewa
Buffalo
Langlade
Green
Pierce
St. Croix
Waushara
Marinette
Oconto
Juneau
Portage
Shawano
Adams
Door
Washburn
Columbia
Waupaca Brown
Lafayette
RichlandCrawford
Jefferson
Fond du Lac
Walworth
Eau Claire
OutagamieTrempealeau
Florence
Manitowoc
Waukesha
Winnebago
Racine
La Crosse
Calumet
SheboyganMarquette
Pepin
Washington
Green Lake
Kewaunee
Menominee
Kenosha
Ozaukee
Milwaukee
NON-IRRIGATED CROPLANDCASH RENT BY COUNTY - 2017
Dollars per Acre
Not Published
Less than 80
80 to 119
120 to 159
160 or more

6 Wisconsin 2018 Agricultural Statistics
FARM INCOME INDICATIONS: WISCONSIN, 2013-2017 1/Commodity 2013 2014 2015 2016 2017
1,000 dollarsValue of crop production 4,123,863 3,610,826 3,171,503 3,431,485 3,125,140Crop cash receipts 4,124,671 3,354,304 3,260,967 3,443,607 3,439,318
Feed crops 2,005,722 1,577,730 1,467,082 1,396,351 1,468,173Food grains 103,976 91,825 70,620 72,391 61,124Fruits and nuts 224,814 180,650 176,800 203,242 184,547Oil crops 874,420 689,426 725,898 983,902 912,579Vegetables and melons 548,005 456,972 467,525 438,938 463,909All other crops 367,734 357,702 353,042 348,783 348,986
Home consumption 3,013 2,846 3,082 2,635 6,863Inventory adjustment 2/ -3,821 253,675 -92,546 -14,757 -321,040Value of animals and products production 7,759,108 9,560,469 8,043,040 7,387,687 7,932,138Animals and products cash receipts 7,865,502 9,401,629 8,029,123 7,304,501 7,972,042
Dairy products, Milk 5,541,494 6,745,095 5,121,238 5,014,800 5,443,756Meat animals 1,698,958 1,990,709 2,234,309 1,737,302 1,952,288Miscellaneous livestock 320,862 331,105 297,622 297,024 296,401Poultry and eggs 304,188 334,719 375,953 255,375 279,597
Home consumption 17,750 14,429 14,764 14,730 18,633Inventory adjustment 2/ -124,144 144,411 -846 68,456 -58,537Farm-related income 1,923,497 1,557,424 1,755,851 1,381,166 1,611,675Forest products sold 9,138 18,937 20,631 28,885 27,073Gross imputed rental value of farm dwellings 736,954 678,255 670,126 688,550 727,175Machine hire and customwork 67,246 105,696 302,921 141,301 251,813Other farm income 1,110,159 754,536 762,173 522,431 605,615
Total commodity insurance indemnities 544,656 323,969 238,632 84,169 170,749Federal commodity insurance indemnities 477,525 298,705 206,318 42,648 80,491Net cash rent received by operator landlords 3/ 72,613 114,820 96,669 103,007 98,334
Value of agricultural sector production 13,806,467 14,728,718 12,970,394 12,200,338 12,668,953Intermediate product expenses 4/ 7,332,853 7,898,342 6,890,296 6,904,949 7,158,474Farm origin 2,937,465 3,321,883 2,740,153 2,778,344 2,916,597
Feed purchases 2,060,000 2,350,000 1,880,000 1,950,000 1,890,000Livestock and poultry purchases 137,465 181,883 190,153 178,344 316,597Seed purchases 740,000 790,000 670,000 650,000 710,000
Manufactured inputs 1,993,965 2,080,894 1,709,436 1,642,279 1,716,176Electricity 214,777 245,239 208,796 237,000 230,132Fertilizer, lime, and soil conditioners 880,000 890,000 780,000 710,000 720,000Pesticides 350,000 340,000 320,000 330,000 360,000Fuel and oils 549,188 605,655 400,640 365,279 406,044
Other intermediate expenses 4/ 2,401,422 2,495,565 2,440,707 2,484,326 2,525,701Machine hire and custom work 211,841 206,041 233,943 210,167 234,874Marketing, storage, and transportation 232,896 321,149 357,763 347,064 363,002Repair and maintenance 4/ 684,353 752,821 675,609 745,287 723,833Miscellaneous expenses 4/ 1,272,333 1,215,555 1,173,392 1,181,808 1,203,992Total insurance premiums 5/ 327,851 336,485 329,114 310,241 314,893Federal commodity insurance premiums 103,561 95,245 88,080 76,944 81,227Irrigation 199 504 517 821 686
Contract labor 15,282 27,555 26,761 22,903 30,830Net government transactions -194,025 -437,641 -157,862 -112,004 -291,812Direct government payments 221,822 92,142 305,627 285,304 134,422Property taxes and fees 4/ 415,847 529,783 463,489 397,308 426,234
Motor vehicle registration and licensing fees 15,847 19,783 13,489 17,308 16,234Gross value added 6,264,308 6,365,180 5,895,476 5,160,482 5,187,838Capital consumption 4/ 1,193,061 1,570,087 1,369,993 1,429,609 1,282,082Net value added 5,071,247 4,795,093 4,525,483 3,730,874 3,905,756Factor payments to stakeholders 1,907,608 2,036,688 1,834,441 2,091,979 2,093,184Hired labor and non-cash employee compensation 924,718 1,012,445 853,239 1,047,097 999,170Net rent paid to operator landlords 77,780 118,736 98,447 105,505 103,817Net rent paid to nonoperator landlords 312,087 278,430 230,853 247,405 243,447Total interest expenses 4/ 593,022 627,077 651,902 691,972 746,749Net farm income 3,163,639 2,758,405 2,691,042 1,638,895 1,812,5731/Value of agricultural sector production is the gross value of the commodities and services produced within a year. Net value-added is the sector’s contribution to the National economy and is the sum of the income from production earned by all factors-of-production, regardless of ownership. Net farm income is the farm operators’ share of income from the sector’s production activities. The concept presented is consistent with that employed by the Organization for Economic Cooperation and Development. 2/A positive value of inventory change represents current-year production not sold by December 31. A negative value is an offset to production from prior years included in current-year sales. 3/ Share rent income is included in cash receipts. 4/ Including expenses associated with operator dwellings. 5/ Includes federal and private crop and livestock insurance premiums as well as casualty, hail, motor vehicle and all other insurance premiums. Source: Economic Research Service, USDA

Wisconsin 2018 Agricultural Statistics 7
CASH RECEIPTS FROM FARM MARKETINGS, BY COMMODITIES, WISCONSIN, 2013-2017 1/Commodity 2013 2014 2015 2016 2017
1,000 dollars
% of total
1,000 dollars
% of total
1,000 dollars
% of total
1,000 dollars
% of total
1,000 dollars
% of total
All commodities 11,990,173 12,755,933 11,290,089 10,748,108 11,411,360Animals and products 7,865,502 65.6 9,401,629 73.7 8,029,123 71.1 7,304,501 68.0 7,972,042 69.9Meat animals 1,698,958 14.2 1,990,709 15.6 2,234,309 19.8 1,737,302 16.2 1,952,288 17.1
Cattle and calves 1,562,064 13.0 1,854,396 14.5 2,128,331 18.9 1,639,375 15.3 1,829,566 16.0Hogs 136,894 1.1 136,313 1.1 105,978 0.9 97,927 0.9 122,722 1.1
Dairy products, Milk 5,541,494 46.2 6,745,095 52.9 5,121,238 45.4 5,014,800 46.7 5,443,756 47.7Poultry and eggs 304,188 2.5 334,719 2.6 375,953 3.3 255,375 2.4 279,597 2.5
Broilers 130,809 1.1 142,879 1.1 121,803 1.1 108,602 1.0 122,944 1.1Chicken eggs 115,879 1.0 129,992 1.0 187,719 1.7 79,083 0.7 103,278 0.9Farm chickens 312 * 504 * 529 * 351 * 162 *Turkeys 57,188 0.5 61,344 0.5 65,902 0.6 67,339 0.6 53,213 0.5
Misc. animals and products 320,862 2.7 331,105 2.6 297,622 2.6 297,024 2.8 296,401 2.6Trout 1,679 * 1,537 * 1,462 * 1,558 * 1,694 *Honey 8,425 0.1 6,812 0.1 8,466 0.1 8,939 0.1 8,221 0.1Mohair 18 * 20 * 19 * 18 * 16 *Other animals and products 310,460 2.6 322,473 2.5 287,402 2.5 286,272 2.7 286,255 2.5
Mink pelts 63,617 0.5 73,207 0.6 42,132 0.4 39,812 0.4 39,610 0.3Wool 280 * 263 * 274 * 238 * 215 *
Crops 4,124,671 34.4 3,354,304 26.3 3,260,967 28.9 3,443,607 32.0 3,439,318 30.1Food grains 103,976 0.9 91,825 0.7 70,620 0.6 72,391 0.7 61,124 0.5
Rye 2,971 * 4,397 * 5,285 * 5,626 0.1 6,831 0.1Wheat 101,005 0.8 87,428 0.7 65,336 0.6 66,765 0.6 54,293 0.5
Feed crops 2,005,722 16.7 1,577,730 12.4 1,467,082 13.0 1,396,351 13.0 1,468,173 12.9Barley 1,398 * 1,128 * 1,033 * (NA) (NA) (NA) (NA)Corn 1,816,705 15.2 1,378,247 10.8 1,343,143 11.9 1,305,917 12.2 1,365,691 12.0Hay 176,909 1.5 183,098 1.4 109,063 1.0 84,447 0.8 94,774 0.8Oats 10,711 0.1 15,256 0.1 13,842 0.1 5,987 0.1 7,709 0.1
Oil crops 874,420 7.3 689,426 5.4 725,898 6.4 983,902 9.2 912,579 8.0Soybeans 874,420 7.3 689,426 5.4 725,898 6.4 983,902 9.2 912,579 8.0
Vegetables and melons 548,005 4.6 456,972 3.6 467,525 4.1 438,938 4.1 463,909 4.1Dry beans 5,737 * 8,521 0.1 9,824 0.1 (NA) (NA) (NA) (NA)Potatoes, Fall 249,390 2.1 257,078 2.0 259,566 2.3 281,359 2.6 311,394 2.7Beans, Green lima, Processing 1,808 * 1,867 * 1,892 * 3,335 * 4,231 *Beans, Snap 2/ 101,452 0.8 57,633 0.5 66,472 0.6 45,634 0.4 40,115 0.4Cabbage 3/ 14,235 0.1 10,295 0.1 15,786 0.1 13,750 0.1 16,467 0.1Carrots 2/ 12,362 0.1 9,569 0.1 9,652 0.1 10,588 0.1 8,820 0.1Corn, Sweet 100,119 0.8 62,212 0.5 57,061 0.5 48,958 0.5 44,537 0.4
Corn, Sweet, Fresh 12,550 0.1 10,035 0.1 13,976 0.1 15,960 0.1 12,409 0.1Corn, Sweet, Processing 87,569 0.7 52,177 0.4 43,085 0.4 32,998 0.3 32,128 0.3
Cucumbers 2/ 11,062 0.1 10,039 0.1 9,538 0.1 8,166 0.1 9,817 0.1Onions, Storage 12,480 0.1 13,073 0.1 10,624 0.1 10,624 0.1 10,624 0.1Peas, Green 2/ 39,360 0.3 26,685 0.2 27,110 0.2 13,007 0.1 14,363 0.1Pumpkins (NA) (NA) (NA) (NA) (NA) (NA) 3,517 * 3,542 *
Fruits and nuts 224,814 1.9 180,650 1.4 176,800 1.6 203,242 1.9 184,547 1.6Apples 23,382 0.2 31,202 0.2 27,825 0.2 21,819 0.2 26,297 0.2Cherries, Tart 4,318 * 4,808 * 3,049 * 4,076 * 2,109 *Cranberries 190,679 1.6 138,370 1.1 140,146 1.2 177,347 1.7 156,141 1.4Strawberries 6,435 0.1 6,270 * 5,780 0.1 (NA) (NA) (NA) (NA)
All other crops 367,734 3.1 357,702 2.8 353,042 3.1 348,783 3.2 348,986 3.1Maple products 9,911 0.1 6,680 0.1 7,117 0.1 7,873 0.1 6,280 0.1Mint 4,648 * 5,289 * 5,093 * 4,557 * 3,645 *
Peppermint oil 4,207 * 3,542 * 3,507 * 4,557 * 3,645 *Spearmint oil 441 * 1,746 * 1,586 * (NA) (NA) (NA) (NA)
Mushrooms 2,647 * 2,675 * 2,856 * 2,856 * 2,930 *Miscellaneous crops 350,528 2.9 343,058 2.7 337,975 3.0 333,497 3.1 336,131 2.9
* = Less than .05 percent of all commodities. (NA) = Not available. 1/USDA estimates and publishes individual cash receipt values only for major commodities. The U.S. receipts for individual commodities may understate the value of sales for some commodities, with the balance included in the appropriate category labeled “other” or “miscellaneous.” The degree of estimation error in some of the minor commodities can be substantial. Percents of total may not add due to machine rounding. 2/Estimates for 2016 and earlier include processing only. Estimates for 2017 and later include both fresh market and processing. 3/Estimates for 2016 and earlier include fresh market only. Estimates for 2017 and later include both processing and fresh market. Source: Economic Research Service, USDA.

8 Wisconsin 2018 Agricultural Statistics
FARM PRODUCTION EXPENDITURES: WISCONSIN, 2014-2017Expenditure - farm share Total expenditures Percent of production expenses
2014 2015 2016 2017 2014 2015 2016 2017Million dollars Percent
Total farm production expenditures 1/ 13,035 10,910 10,910 11,555 100.0 100.0 100.0 100.0Livestock, poultry & related expenses 2/ 480 450 460 510 3.7 4.1 4.2 4.4Feed 2,350 1,880 1,950 1,890 18.0 17.2 17.9 16.4Farm services 3/ 1,620 1,530 1,550 1,630 12.4 14.0 14.2 14.1Rent 4/ 680 590 590 600 5.2 5.4 5.4 5.2Agricultural chemicals 5/ 340 320 330 360 2.6 2.9 3.0 3.1Fertilizer, lime & soil conditioners 5/ 890 780 710 720 6.8 7.1 6.5 6.2Interest 440 430 420 470 3.4 3.9 3.8 4.1Taxes (real estate & property) 510 450 380 410 3.9 4.1 3.5 3.5Labor 1,040 880 1,070 1,030 8.0 8.1 9.8 8.9Fuels 570 380 330 380 4.4 3.5 3.0 3.3Farm supplies & repairs 6/ 850 800 840 830 6.5 7.3 7.7 7.2Farm improvements & construction 7/ 1,180 900 910 1,020 9.1 8.2 8.3 8.8Tractors and self-propelled farm machinery 660 400 360 460 5.1 3.7 3.3 4.0Other farm machinery 470 310 250 350 3.6 2.8 2.3 3.0Seeds & plants 8/ 790 670 650 710 6.1 6.1 6.0 6.1Trucks & autos 130 120 100 160 1.0 1.1 0.9 1.4Misc capital expenses 9/ 35 20 10 25 0.3 0.2 0.1 0.2
Average per farm 10/ Farms reporting 11/2014 2015 2016 2017 2014 2015 2016 2017
Dollars PercentTotal farm production expenditures 1/ 188,913 158,345 158,806 168,686 100.0 100.0 100.0 100.0Livestock, poultry & related expenses 2/ 6,957 6,531 6,696 7,445 28.9 27.3 27.3 31.1Feed 34,058 27,286 28,384 27,591 57.3 51.5 55.4 56.2Farm services 3/ 23,478 22,206 22,562 23,796 94.7 93.9 94.5 95.8Rent 4/ 9,855 8,563 8,588 8,759 34.3 34.1 33.9 34.7Agricultural chemicals 5/ 4,928 4,644 4,803 5,255 49.2 50.6 51.5 50.3Fertilizer, lime & soil conditioners 5/ 12,899 11,321 10,335 10,511 61.3 59.5 54.7 54.2Interest 6,377 6,241 6,114 6,861 45.7 41.1 48.4 44.4Taxes (real estate & property) 7,391 6,531 5,531 5,985 100.0 100.0 100.0 100.0Labor 15,072 12,772 15,575 15,036 24.7 19.7 22.6 24.2Fuels 8,261 5,515 4,803 5,547 86.4 88.5 83.5 84.9Farm supplies & repairs 6/ 12,319 11,611 12,227 12,117 87.3 82.8 87.4 86.0Farm improvements & construction 7/ 17,101 13,062 13,246 14,891 55.3 52.9 61.4 58.5Tractors and self-propelled farm machinery 9,565 5,806 5,240 6,715 15.9 15.5 11.0 18.3Other farm machinery 6,812 4,499 3,639 5,109 25.4 21.4 23.3 24.1Seeds & plants 8/ 11,449 9,724 9,461 10,365 62.4 58.1 56.7 56.2Trucks & autos 1,884 1,742 1,456 2,336 12.1 11.9 11.0 14.7Misc capital expenses 9/ 507 290 146 365 2.0 5.3 1.6 6.31/Includes landlord and contractor share of farm production expenses. 2/Includes purchases and leasing of livestock and poultry. 3/Includes all crop custom work, veterinary custom services, transportation costs, marketing charges, insurance, leasing of machinery and equipment, general and miscellaneous business expenses, and utilities. 4/Includes public and private grazing fees. 5/Includes material and application costs. 6/Includes bedding/litter, marketing containers, power farm-shop equipment, oils and lubricants, temporary fencing, miscellaneous non-capital equipment and supplies, repairs and maintenance of equipment not depreciated, and other small, non-capital equipment. 7/Includes all expenditures related to new construction or repairs of buildings, fences, operator dwelling (if owned by operation), and any improvements to physical structures of the land. 8/Excludes bedding plants, nursery stock, and seed purchased for resale. Includes seed treatment. 9/Includes any capital expense not recorded in specific items on the questionnaires. 10/Total expenditures divided by total number of farms. Items may not sum to total due to rounding. 11/Number of farms reporting item divided by total number of farms.

Wisconsin 2018 Agricultural Statistics 9
FARM PRODUCTION EXPENDITURES: UNITED STATES 1/, 2014-2017Expenditure - farm share Total expenditures Percent of production expenses
2014 2015 2016 2017 2014 2015 2016 2017Million dollars Percent
Total farm production expenditures 2/ 397,600 362,800 346,900 359,800 100.0 100.0 100.0 100.0Livestock, poultry & related expenses 3/ 45,100 45,400 40,000 42,100 11.3 12.5 11.5 11.7Feed 63,700 58,500 55,600 55,200 16.0 16.1 16.0 15.3Farm services 4/ 45,300 41,600 41,700 43,800 11.4 11.5 12.0 12.2Rent 5/ 32,600 31,000 29,800 29,700 8.2 8.5 8.6 8.3Agricultural chemicals 6/ 15,800 14,600 15,200 15,500 4.0 4.0 4.4 4.3Fertilizer, lime & soil conditioners 6/ 28,000 25,500 23,500 22,000 7.0 7.0 6.8 6.1Interest 9,700 9,500 9,100 9,900 2.4 2.6 2.6 2.8Taxes (real estate & property) 13,600 12,800 11,900 13,000 3.4 3.5 3.4 3.6Labor 34,200 31,800 34,100 35,100 8.6 8.8 9.8 9.8Fuels 16,700 12,300 11,300 12,000 4.2 3.4 3.3 3.3Farm supplies & repairs 7/ 19,900 18,700 17,600 18,300 5.0 5.2 5.1 5.1Farm improvements & construction 8/ 18,200 16,100 14,500 16,400 4.6 4.4 4.2 4.6Tractors and self-propelled farm machinery 16,900 11,900 10,600 12,600 4.3 3.3 3.1 3.5Other farm machinery 9,000 6,100 5,000 5,900 2.3 1.7 1.4 1.6Seeds & plants 9/ 22,100 21,300 21,800 22,200 5.6 5.9 6.3 6.2Trucks & autos 6,200 5,000 4,400 5,500 1.6 1.4 1.3 1.5Misc capital expenses 10/ 600 700 800 600 0.2 0.2 0.2 0.2
Average per farm 11/ Farms reporting 12/2014 2015 2016 2017 2014 2015 2016 2017
Dollars PercentTotal farm production expenditures 2/ 191,500 176,181 169,035 176,352 100.0 100.0 100.0 100.0Livestock, poultry & related expenses 3/ 21,722 22,047 19,491 20,635 24.7 25.3 25.7 27.7Feed 30,680 28,408 27,092 27,056 53.3 56.8 57.3 56.7Farm services 4/ 21,818 20,202 20,319 21,468 90.1 92.3 91.1 91.5Rent 5/ 15,701 15,054 14,521 14,557 28.7 29.4 30.0 27.2Agricultural chemicals 6/ 7,610 7,090 7,407 7,597 39.8 41.6 45.4 40.8Fertilizer, lime & soil conditioners 6/ 13,486 12,383 11,451 10,783 50.1 51.4 50.4 47.8Interest 4,672 4,613 4,434 4,852 32.4 32.7 32.0 32.8Taxes (real estate & property) 6,550 6,216 5,799 6,372 99.8 99.5 99.5 99.6Labor 16,472 15,443 16,616 17,204 25.7 27.4 25.8 24.0Fuels 8,043 5,973 5,506 5,882 82.0 85.1 83.6 84.4Farm supplies & repairs 7/ 9,585 9,081 8,576 8,970 78.7 80.7 80.4 81.2Farm improvements & construction 8/ 8,766 7,818 7,065 8,038 49.7 50.9 48.8 49.6Tractors and self-propelled farm machinery 8,140 5,779 5,165 6,176 16.5 14.5 13.0 13.3Other farm machinery 4,335 2,962 2,436 2,892 17.9 16.3 15.1 15.2Seeds & plants 9/ 10,644 10,344 10,623 10,881 39.9 39.2 36.3 38.5Trucks & autos 2,986 2,428 2,144 2,696 15.1 13.3 11.6 13.9Misc capital expenses 10/ 289 340 390 294 1.8 4.9 5.2 4.81/ Excluding Alaska and Hawaii. 2/Includes landlord and contractor share of farm production expenses. 3/Includes purchases and leasing of livestock and poultry. 4/Includes all crop custom work, veterinary custom services, transportation costs, marketing charges, insurance, leasing of machinery and equipment, general and miscellaneous business expenses, and utilities. 5/Includes public and private grazing fees. 6/Includes material and application costs. 7/ Includes bedding/litter, marketing containers, power farm-shop equipment, oils and lubricants, temporary fencing, miscellaneous non-capital equipment and supplies, repairs and maintenance of equipment not depreciated, and other small, non-capital equipment. 8/Includes all expenditures related to new construction or repairs of buildings, fences, operator dwelling (if owned by operation), and any improvements to physical structures of the land. 9/Excludes bedding plants, nursery stock, and seed purchased for resale. Includes seed treatment. 10/Includes any capital expense not recorded in specific items on the questionnaires. 11/Total expenditures divided by total number of farms. Items may not sum to total due to rounding. 12/Number of farms reporting item divided by total number of farms.

10 Wisconsin 2018 Agricultural Statistics
AGRICULTURAL LAND SALES: WISCONSIN, 2013-2017 1/
Year
Agricultural land continuing in agricultural use
Agricultural land being diverted to other uses Total of all agricultural land
Number of transactions
Acres sold
Dollars per acre
Number of transactions
Acres sold
Dollars per acre
Number of transactions
Acres sold
Dollars per acre
LAND WITHOUT BUILDINGS AND IMPROVEMENTS2013 1,112 62,982 4,442 56 1,989 5,670 1,168 64,971 4,4802014 872 48,550 5,037 72 3,238 5,880 944 51,788 5,0902015 854 49,760 5,131 58 2,266 6,057 912 52,026 5,1712016 817 45,413 5,221 61 1,720 7,558 878 47,133 5,3062017 807 42,621 4,960 94 4,222 10,794 901 46,843 5,485
LAND WITH BUILDINGS AND IMPROVEMENTS2013 705 53,997 5,198 42 2,430 7,431 747 56,427 5,2942014 639 48,869 5,775 45 1,479 5,771 684 50,348 5,7752015 603 43,851 5,669 57 2,068 8,138 660 45,919 5,7802016 646 52,604 5,708 37 1,507 6,544 683 54,111 5,7322017 571 41,997 5,937 55 2,032 8,373 626 44,029 6,050
TOTAL2013 1,817 116,979 4,791 98 4,419 6,638 1,915 121,398 4,8592014 1,511 97,419 5,407 117 4,717 5,846 1,628 102,136 5,4282015 1,457 93,611 5,383 115 4,334 7,050 1,572 97,945 5,4572016 1,463 98,017 5,483 98 3,227 7,085 1,561 101,244 5,5342017 1,378 84,618 5,445 149 6,254 10,007 1,527 90,872 5,7591/ Land sales figures reported in these tables include only averages of ‘arm’s length’ transactions. Sales made under other than normal market conditions (such as family sales or foreclosures) are not included in this report. Sales are reviewed by the Wisconsin Department of Revenue, Bureau of Equalization. With each sale of a parcel of land, the buyer is required to file a Wisconsin Real Estate Transfer Return, documenting the parcel size, sale price, present use, and intended use of the property. State appraisers inspect the site and verify the transfer return. The sales data in this report are a summary of the Wisconsin Real Estate Transfer Returns. Specifics on land sales transactions within a certain county can be obtained by contacting the Department of Revenue directly or at www.revenue.wi.gov/retr. This report was compiled in cooperation with the Wisconsin Department of Revenue, Bureau of Equalization.
AGRICULTURAL LAND SALES: LAND WITHOUT BUILDINGS AND IMPROVEMENTS, WISCONSIN, 2017 1/
County
Agricultural land continuing in agricultural use
Agricultural land being diverted to other uses Total of all agricultural land Range for land
continuing in ag useNumber of
transactionsAcres sold
Dollars per acre
Number of transactions
Acres sold
Dollars per acre
Number of transactions
Acres sold
Dollars per acre
Lowest price
Highest price
Adams 3 161 3,437 2 37 2,173 5 198 3,201 2,150 4,551Ashland 10 207 1,219 2 52 1,575 12 259 1,291 740 1,500Barron 32 2,121 3,563 - - - 32 2,121 3,563 1,320 5,595Bayfield 8 267 975 - - - 8 267 975 615 1,326Brown 22 1,111 10,326 1 22 4,800 23 1,133 10,219 3,400 13,900Buffalo 10 485 4,198 1 37 3,100 11 522 4,120 3,500 5,000Burnett 6 373 1,755 - - - 6 373 1,755 1,324 2,121Calumet 2 136 10,918 2 97 18,865 4 233 14,226 10,300 11,500Chippewa 32 1,448 3,053 2 52 4,142 34 1,500 3,091 1,000 5,555Clark 20 1,041 3,653 4 294 10,833 24 1,335 5,234 2,500 6,750Columbia 18 1,169 6,556 1 70 6,676 19 1,239 6,562 2,626 13,826Crawford 7 320 3,479 1 16 3,500 8 336 3,480 3,000 4,300Dane 20 1,176 8,458 18 1,317 16,122 38 2,493 12,507 4,630 14,259Dodge 15 1,054 7,053 - - - 15 1,054 7,053 5,200 9,500Door 5 304 3,945 1 11 2,200 6 315 3,884 3,900 4,100Douglas 3 59 1,010 - - - 3 59 1,010 864 1,250Dunn 31 1,722 3,150 - - - 31 1,722 3,150 1,550 5,051Eau Claire 13 673 4,445 2 105 6,742 15 778 4,755 3,300 5,600Florence 2 55 1,145 - - - 2 55 1,145 1,130 1,209Fond du Lac 31 1,819 6,495 3 24 5,942 34 1,843 6,487 4,000 10,100Forest - - - 1 40 1,325 1 40 1,325 - -Grant 10 592 5,662 10 592 5,662 3,000 9,715Green 20 1,415 5,745 1 54 19,950 21 1,469 6,267 3,750 8,077Green Lake 10 482 5,369 1 20 4,000 11 502 5,315 2,308 8,000

Wisconsin 2018 Agricultural Statistics 11
AGRICULTURAL LAND SALES: LAND WITHOUT BUILDINGS AND IMPROVEMENTS, WISCONSIN, 2017 1/
County
Agricultural land continuing in agricultural use
Agricultural land being diverted to other uses Total of all agricultural land Range for land
continuing in ag useNumber of
transactionsAcres sold
Dollars per acre
Number of transactions
Acres sold
Dollars per acre
Number of transactions
Acres sold
Dollars per acre
Lowest price
Highest price
Iowa 20 1,341 4,794 - - - 20 1,341 4,794 2,600 7,500Iron - - - - - - - - - - -Jackson 8 581 2,889 4 248 13,018 12 829 5,919 1,940 3,757Jefferson 6 273 5,826 - - - 6 273 5,826 3,751 7,500Juneau 7 489 2,999 2 67 3,825 9 556 3,098 2,450 5,500Kenosha 4 137 7,380 - - - 4 137 7,380 6,300 9,251Kewaunee 9 763 6,865 1 8 5,000 10 771 6,845 5,800 8,000La Crosse 5 198 4,037 3 121 9,140 8 319 5,973 3,145 4,976Lafayette 13 952 6,614 - - - 13 952 6,614 4,250 8,200Langlade 4 303 3,706 3 38 2,671 7 341 3,591 2,300 4,251Lincoln 4 96 2,023 - - - 4 96 2,023 1,233 2,500Manitowoc 9 515 6,738 - - - 9 515 6,738 3,150 9,000Marathon 22 1,099 3,975 5 90 2,868 27 1,189 3,892 1,500 5,075Marinette 4 159 3,082 1 17 3,553 5 176 3,128 1,939 4,508Marquette 16 683 3,602 - - - 16 683 3,602 2,700 5,795Milwaukee - - - - - - - - - - -Monroe 15 642 4,196 - - - 15 642 4,196 2,700 7,550Oconto 11 609 4,112 2 31 3,432 13 640 4,079 2,900 7,463Oneida 2 96 1,456 - - - 2 96 1,456 1,451 1,460Outagamie 16 659 6,675 - - - 16 659 6,675 3,400 13,427Ozaukee 8 357 6,985 - - - 8 357 6,985 4,600 9,200Pepin 1 38 3,850 2 104 3,714 3 142 3,751 3,850 3,850Pierce 18 851 4,189 - - - 18 851 4,189 3,100 6,476Polk 29 1,620 3,126 1 35 4,251 30 1,655 3,150 1,124 6,100Portage 11 398 3,184 4 71 4,275 15 469 3,349 2,050 4,800Price 2 45 1,542 - - - 2 45 1,542 1,500 1,550Racine 10 406 7,724 - - - 10 406 7,724 5,760 10,600Richland 9 457 3,515 1 21 3,000 10 478 3,493 2,424 4,800Rock 16 1,006 6,093 7 488 11,566 23 1,494 7,881 3,800 7,495Rusk 13 566 1,540 - - - 13 566 1,540 967 2,176Sauk 18 864 4,073 1 40 3,100 19 904 4,030 3,300 6,000Sawyer - - - - - - - - - - -Shawano 18 853 5,158 - - - 18 853 5,158 3,100 9,473Sheboygan 20 893 6,588 1 77 4,851 21 970 6,450 4,479 9,380St. Croix 21 1,087 4,336 1 53 4,464 22 1,140 4,341 2,650 7,210Taylor 11 574 3,583 - - - 11 574 3,583 2,000 7,000Trempealeau 14 763 4,244 3 198 4,867 17 961 4,373 2,500 7,000Vernon 16 912 4,021 - - - 16 912 4,021 2,900 5,150Vilas 1 30 1,700 - - - 1 30 1,700 1,700 1,700Walworth 13 718 7,524 - - - 13 718 7,524 6,850 8,900Washburn 3 251 3,004 - - - 3 251 3,004 1,241 4,027Washington 12 387 10,088 2 54 20,459 14 441 11,358 6,300 18,300Waukesha 4 215 11,406 3 126 10,300 7 341 10,997 4,340 18,281Waupaca 11 471 3,784 2 56 3,907 13 527 3,797 2,750 5,300Waushara 9 427 3,502 - - - 9 427 3,502 2,500 4,200Winnebago 8 278 6,317 - - - 8 278 6,317 3,431 11,042Wood 6 369 3,608 2 31 3,045 8 400 3,565 1,751 5,126
Wisconsin 807 42,621 4,960 94 4,222 10,794 901 46,843 5,485 615 18,3001/ Land sales figures reported in these tables include only averages of ‘arm’s length’ transactions. Sales made under other than normal market conditions (such as family sales or foreclosures) are not included in this report. Sales are reviewed by the Wisconsin Department of Revenue, Bureau of Equalization. With each sale of a parcel of land, the buyer is required to file a Wisconsin Real Estate Transfer Return, documenting the parcel size, sale price, present use, and intended use of the property. State appraisers inspect the site and verify the transfer return. The sales data in this report are a summary of the Wisconsin Real Estate Transfer Returns. Specifics on land sales transactions within a certain county can be obtained by contacting the Department of Revenue directly or at www.revenue.wi.gov/retr. This report was compiled in cooperation with the Wisconsin Department of Revenue, Bureau of Equalization.

12 Wisconsin 2018 Agricultural Statistics
CropsThe 2017 crop season opened with widespread concern for overwintered crops. This was due to unusually warm weather in February followed by low snow cover and fluctuating temperatures in March. Waterlogged soils and frequent rains left a total of 10.4 days suitable for fieldwork in the month of April. Early May saw a window of drier conditions, allowing spring fieldwork to surge before heavy rains, flooding, and severe storms stalled fieldwork mid-month. Continued wet conditions caused planting to drag on through May and well into June. Reporters noted some fields were drowned out or washed away by the frequent rains, forcing farmers to replant. Wet conditions also delayed or prevented weed control and nitrogen applications in some areas. This difficult start affected crops throughout the summer, with crop conditions mixed and crop development trailing behind the 5-year average. June and July were very wet; frequent rains, flooding and severe thunderstorms damaged some crops, and prevented timely haying in many areas. Below normal temperatures in August and early September kept crop development behind average. Unseasonably warm and dry weather in late September helped to push late-planted crops toward maturity and dried out the soil for fieldwork, although tillage and planting activities continued to trend behind normal throughout the fall. October brought even more rain and a return of soggy field conditions with temperatures swinging between summer-like and wintry. Some areas of northern Wisconsin received their first frost during the week ending October 15 and a hard freeze hit statewide during the week ending October 29. Drizzle, fog and overcast skies kept grain moistures high throughout November, especially in late-planted crops. Fall tillage was 68 percent complete on November 26, well below 85 percent complete the previous year.
Statewide, February temperatures averaged 8.2 degrees above normal while March temperatures averaged 0.4 degree below normal. April, September and October had above normal temperatures; June and July had averages within 1 degree of normal; May, August and November had below normal temperatures. The average temperature for June through September was 65.2 degrees, compared with 67.0 degrees in 2016 and a normal of 64.9 degrees.
The statewide precipitation total for April through September was 25.94 inches, 1.08 inches less than the previous year but 3.51 inches more than normal. Statewide, September and November had below normal precipitation. July precipitation totals ranged from 1.41 inches below normal in the North Central District to 3.76 inches above normal in the Southwest District. August precipitation ranged from 2.67 inches below normal in the Southwest District to 1.84 inches above normal in the Northwest District. April, May, June, and October had above normal precipitation across the state.
Corn planted for all purposes totaled 3.90 million acres in 2017, down 4 percent from the previous year. There were 2.93 million acres harvested for grain, down 9 percent from 2016. Grain yield fell to 174 bushels per acre, down 4 bushels per acre from the previous year. Acres harvested for silage rose 11 percent to 880,000 acres while silage production rose less than 1 percent to 16.7 million tons.
Planted acres of soybeans increased by 190,000 acres to 2.15 million acres. Harvested acres also increased 190,000 acres to 2.14 million acres statewide. The average yield for soybeans in Wisconsin was 47.0 bushels per acre, 8.0 bushels per acre less than the previous year. Total production fell 6 percent to 101 million bushels.
Wisconsin produced 5.02 million bushels of oats in 2017, a 24 percent decrease from 2016. This was due to 15,000 fewer harvested acres and a decrease in yields. Average yield was 59 bushels per acre in 2017 compared to 66 bushels per acre in 2016.
There were 210,000 acres of winter wheat planted in 2017, down 60,000 acres from 2016. Acres harvested fell 80,000 acres to 170,000 acres and yields fell 11 bushels per acre. This caused production to decrease 41 percent to 11.6 million bushels.
As of May 21, winter freeze damage to alfalfa was rated 5 percent severe, 10 percent moderate and 26 percent light. There were reportedly no damages to the remaining 59 percent of hay stands, down from 77 percent undamaged the previous year. The first cutting of hay was delayed but rapidly caught up to and moved ahead of the five-year average during early June. Cool temperatures and frequent rains throughout the spring and summer meant abundant hay but few windows of good weather for baling. Reporters commented that producers were making more haylage than usual in an effort to harvest forage at optimal maturity. Dry, warm weather in September offered excellent conditions for making dry hay, allowing the fourth cutting to exceed the average harvest pace. Abundant moisture and some above normal temperatures during October and November left hay stands in good condition to overwinter. Hay condition was 77 percent good to excellent on average for May through mid-September, compared with 87 percent good to excellent in 2016.
Potato harvested acreage was up 3,000 acres in 2017, with 67,000 acres harvested in total. The average yield was the same as the previous year at 435 cwt. per acre. Overall production was 29.1 million cwt., up 5 percent from the previous year.
Wisconsin remained the top producer in the nation for snap beans, contributing 36 percent of the national production. The state also ranked third for total production of cabbage, carrots, green peas and sweet corn.
There were 20,600 acres of cranberries harvested in 2017, down 500 acres from the previous year. Cranberry production was 5.37 million barrels, a decrease of 758,000 barrels from 2016, with yields averaging 259.5 barrels per acre. Wisconsin remained the top cranberry producing state, with 64 percent of the national production. Bearing apple acreage in Wisconsin was 4,000 acres, the same as the previous year. Apple production was 49.0 million pounds, up 8.0 million pounds from 2016. Tart cherry production was down 2.3 million pounds to 11.3 million pounds. Tart cherry bearing acres fell 12 percent to 1,500 acres.

Wisconsin 2018 Agricultural Statistics 13
CROP RECORDS IN WISCONSIN AGRICULTURECommodity Unit 2017 Record high Record low Year estimate
startedQuantity Year 1/ Quantity Year 1/Corn for grain Harvested Acres 2,930,000 3,500,000 1981 478,000 1927 1866 Yield Bu. 174.0 178.0 2016 21.0 1883 1866 Production Bu. 509,820,000 573,160,000 2016 13,862,000 1927 1866Corn for silage Harvested Acres 880,000 1,450,000 1988 570,000 1991 1919 Yield Tons 19.0 21.0 2016 4.2 1936 1919 Production Tons 16,720,000 18,915,000 2015 5,085,000 1920 1919Oats Harvested Acres 85,000 2,987,000 1945 85,000 2017 1866 Yield Bu. 59.0 72.0 2015 22.0 1907 1866 Production Bu. 5,015,000 156,221,000 1958 5,015,000 2017 1866Soybeans Harvested Acres 2,140,000 2,140,000 2017 1,000 1927 1924 Yield Bu. 47.0 55.0 2016 9.0 1925 1924 Production Bu. 100,580,000 107,250,000 2016 10,000 1927 1924Wheat, all Harvested Acres 170,000 2,050,000 1878 27,000 1973 1866 Yield Bu. 68.0 79.0 2016 8.0 1876 1866 Production Bu. 11,560,000 26,250,000 1873 890,000 1973 1866Forage, all (dry equivalent) Harvested Acres 2,190,000 4,400,000 1989 2,190,000 2017 1981 Yield Tons 3.47 4.91 1986 2.19 1988 1981 Production Tons 7,598,000 18,402,000 1986 6,647,000 2012 1981Hay, all (dry only) Harvested Acres 1,250,000 4,263,000 1944 1,330,000 2016 1909 Yield Tons 2.78 3.49 1982 0.94 1934 1909 Production Tons 3,477,000 12,770,000 1984 2,846,000 1910 1909Potatoes, all Harvested Acres 67,000 325,000 1922 45,500 1972 1866 Yield Cwt. 435.0 460 2012 25.8 1894 1866 Production Cwt. 29,145,000 34,000,000 1999 2,306,000 1870 1866Cranberries Harvested Acres 20,600 21,100 2016 1,200 1900 1900 Yield Barrels 259.5 288.2 2016 7.5 1908 1900 Production Barrels 5,372,000 6,130,000 2016 12,000 1908 1900Sweet corn, processing Production Tons 458,977 1,001,750 1994 5,500 1932 1918Green peas, processing Production Tons 47,746 177,550 1979 35,620 1932 1918Snap beans, processing Production Tons 322,875 363,552 2016 1,900 1921 1918Maple syrup Production Gal. 200,000 265,000 2013 50,000 2005 19921/These are the latest years that records were achieved. In some cases, these records were equaled in several earlier years.

14 Wisconsin 2018 Agricultural Statistics
MONTHLY AND ANNUAL PRECIPITATION: BY SELECTED STATIONS AND DISTRICTS, WISCONSIN, 2017
Station Jan. Feb. Mar. Apr. May Jun. Jul. Aug. Sep. Oct. Nov. Dec.
Annual
TotalChange
from station normal 1/
InchesNORTHWESTBloomer 1.59 1.41 0.93 4.62 5.00 4.54 3.30 4.73 1.65 5.15 0.48 0.77 34.17 +2.62Gordon 1.17 0.85 1.30 2.91 5.35 2.29 5.67 6.53 3.40 4.91 0.98 1.39 36.75 +4.84Spooner 0.77 0.59 0.96 2.59 6.46 4.37 2.48 6.32 2.16 3.89 0.75 1.13 32.47 +1.47 District 1.23 1.15 1.02 3.29 5.74 4.75 3.39 5.85 2.64 4.53 0.80 1.25 35.64 +3.80 Normal 0.95 0.88 1.64 2.65 3.36 4.08 4.08 4.01 3.97 3.06 1.95 1.20 31.84NORTH CENTRALMedford 2.00 1.57 1.67 4.62 5.64 6.93 2.52 3.48 1.27 4.37 0.99 1.07 36.13 +3.05Rhinelander 1.87 1.17 1.38 6.17 5.88 7.38 2.32 4.74 2.11 4.89 1.09 1.62 40.62 +9.22Wausau 2.34 1.60 2.18 5.79 3.88 5.34 4.57 3.62 1.95 3.61 1.23 1.16 37.27 +4.86 District 1.83 1.52 1.62 4.98 5.51 6.45 2.54 4.35 2.34 4.58 1.06 1.62 38.40 +6.30 Normal 1.09 0.94 1.68 2.62 3.39 4.04 3.95 3.81 4.01 3.10 2.08 1.37 32.10NORTHEASTFlorence 1.30 1.45 1.22 7.01 3.86 9.47 3.02 3.22 2.42 3.54 1.23 2.25 39.99 +10.86Marinette 1.94 0.75 2.01 3.13 3.23 9.07 4.85 4.63 1.79 3.61 1.96 1.50 38.47 +5.88Shawano 2.58 1.06 2.20 3.25 3.29 8.05 2.95 6.20 1.89 3.24 0.99 1.51 37.21 +5.88 District 1.85 1.14 1.85 5.06 4.36 6.93 3.53 4.48 2.25 3.21 1.35 1.58 37.59 +6.88 Normal 1.12 0.96 1.72 2.57 3.23 3.77 3.68 3.46 3.61 3.03 2.13 1.43 30.71WEST CENTRALLa Crosse 2.69 1.17 1.76 4.87 7.20 5.38 7.63 1.06 0.95 6.01 0.35 0.53 39.60 +6.54Menomonie 1.80 1.77 1.27 5.19 6.57 4.71 3.85 5.96 1.74 4.04 0.70 0.61 38.21 +6.96Mondovi 2.40 2.04 2.46 4.63 6.53 6.28 4.04 4.57 1.36 4.59 0.80 0.67 40.37 +5.68 District 2.24 1.49 1.69 4.63 6.03 5.27 5.30 4.05 1.46 4.80 0.52 0.72 38.20 +4.76 Normal 0.95 0.90 1.81 3.13 3.78 4.44 4.25 4.49 3.87 2.56 2.06 1.22 33.44CENTRALMarshfield 2.34 1.45 2.68 5.96 5.70 6.86 4.12 2.89 1.19 4.22 0.79 0.80 39.00 +6.28Montello 2.67 1.23 2.79 5.83 3.63 6.20 5.85 1.97 0.84 3.43 0.48 0.75 35.67 +1.20Waupaca 2.28 1.04 2.39 4.10 2.84 3.89 3.39 5.82 2.13 3.84 0.66 0.73 33.11 -0.38 District 2.39 1.19 2.40 4.76 4.15 6.00 4.13 3.62 1.82 4.08 0.64 0.86 36.04 +3.63 Normal 1.01 1.00 1.76 3.00 3.60 4.35 4.04 4.03 3.61 2.54 2.12 1.34 32.41EAST CENTRALGreen Bay 2.43 0.82 2.30 4.48 2.97 3.78 4.56 4.05 1.01 3.12 1.14 1.29 31.95 +2.43Oshkosh 2.56 0.88 2.65 4.61 2.89 7.08 2.22 4.05 3.33 3.25 1.12 0.80 35.44 +3.85Plymouth 2.93 1.58 3.03 5.34 3.46 4.52 4.10 6.11 1.79 3.32 0.97 0.77 37.92 +3.03 District 2.57 1.19 2.48 4.64 3.39 6.52 3.36 4.31 2.18 3.48 1.24 1.03 36.39 +5.10 Normal 1.27 1.12 1.78 2.86 3.26 3.87 3.67 3.59 3.38 2.69 2.27 1.53 31.29SOUTHWESTLancaster 2.08 1.00 1.95 4.27 4.86 4.80 9.65 0.71 2.25 5.91 0.81 0.64 38.93 +3.56Lone Rock 1.96 1.58 1.88 5.71 2.90 6.08 7.82 0.56 0.57 2.69 0.05 0.46 32.26 -2.74Viroqua 2.37 1.44 3.47 4.78 6.20 7.43 9.45 1.28 2.68 5.45 0.48 0.44 45.47 +10.94 District 2.42 1.47 2.54 4.75 4.50 5.70 8.20 1.85 1.38 4.87 0.59 0.54 38.81 +3.31 Normal 1.10 1.15 2.00 3.56 4.02 4.83 4.44 4.52 3.46 2.56 2.36 1.50 35.50SOUTH CENTRALBeloit 1.91 1.04 4.10 5.09 7.45 5.26 6.02 1.52 0.18 5.82 1.13 0.44 39.96 +3.62Madison 2.76 1.94 2.83 5.30 2.83 6.73 6.52 3.85 0.55 3.56 0.68 0.73 38.28 +3.80Portage 2.66 1.63 2.86 5.87 4.56 6.90 4.13 4.13 0.68 2.83 0.75 0.71 37.71 +1.57 District 2.37 1.47 2.99 5.11 4.50 6.58 6.80 3.22 0.76 4.31 0.92 0.59 39.62 +4.75 Normal 1.23 1.31 2.02 3.37 3.71 4.63 4.09 4.18 3.50 2.69 2.43 1.70 34.87SOUTHEASTHartford 2.70 1.26 2.83 4.98 4.26 7.03 3.52 4.81 0.78 3.80 1.10 0.66 37.73 +4.84Kenosha 2.10 2.38 4.99 5.93 2.76 5.09 9.89 2.54 0.18 6.65 1.84 0.26 44.61 +8.47Milwaukee 2.16 1.85 3.72 6.23 2.83 5.21 3.69 1.63 0.85 4.09 1.37 0.46 34.09 -0.67 District 2.35 1.52 3.42 5.27 4.34 6.00 6.46 2.72 0.59 4.27 1.30 0.50 38.74 +4.44 Normal 1.47 1.41 1.98 3.42 3.61 4.04 3.78 4.02 3.42 2.74 2.54 1.86 34.30STATE 2.02 1.34 1.99 4.60 4.94 5.94 4.46 4.10 1.90 4.30 0.91 1.07 37.57 +4.87 Normal 1.09 1.02 1.79 2.93 3.53 4.21 4.02 4.01 3.73 2.82 2.16 1.40 32.701/ Normal 1981-2010. Source: Wisconsin State Climatology Office.

Wisconsin 2018 Agricultural Statistics 15
MONTHLY AND ANNUAL PRECIPITATION: BY SELECTED STATIONS AND DISTRICTS, WISCONSIN, 2017
Station Jan. Feb. Mar. Apr. May Jun. Jul. Aug. Sep. Oct. Nov. Dec.
Annual
TotalChange
from station normal 1/
InchesNORTHWESTBloomer 1.59 1.41 0.93 4.62 5.00 4.54 3.30 4.73 1.65 5.15 0.48 0.77 34.17 +2.62Gordon 1.17 0.85 1.30 2.91 5.35 2.29 5.67 6.53 3.40 4.91 0.98 1.39 36.75 +4.84Spooner 0.77 0.59 0.96 2.59 6.46 4.37 2.48 6.32 2.16 3.89 0.75 1.13 32.47 +1.47 District 1.23 1.15 1.02 3.29 5.74 4.75 3.39 5.85 2.64 4.53 0.80 1.25 35.64 +3.80 Normal 0.95 0.88 1.64 2.65 3.36 4.08 4.08 4.01 3.97 3.06 1.95 1.20 31.84NORTH CENTRALMedford 2.00 1.57 1.67 4.62 5.64 6.93 2.52 3.48 1.27 4.37 0.99 1.07 36.13 +3.05Rhinelander 1.87 1.17 1.38 6.17 5.88 7.38 2.32 4.74 2.11 4.89 1.09 1.62 40.62 +9.22Wausau 2.34 1.60 2.18 5.79 3.88 5.34 4.57 3.62 1.95 3.61 1.23 1.16 37.27 +4.86 District 1.83 1.52 1.62 4.98 5.51 6.45 2.54 4.35 2.34 4.58 1.06 1.62 38.40 +6.30 Normal 1.09 0.94 1.68 2.62 3.39 4.04 3.95 3.81 4.01 3.10 2.08 1.37 32.10NORTHEASTFlorence 1.30 1.45 1.22 7.01 3.86 9.47 3.02 3.22 2.42 3.54 1.23 2.25 39.99 +10.86Marinette 1.94 0.75 2.01 3.13 3.23 9.07 4.85 4.63 1.79 3.61 1.96 1.50 38.47 +5.88Shawano 2.58 1.06 2.20 3.25 3.29 8.05 2.95 6.20 1.89 3.24 0.99 1.51 37.21 +5.88 District 1.85 1.14 1.85 5.06 4.36 6.93 3.53 4.48 2.25 3.21 1.35 1.58 37.59 +6.88 Normal 1.12 0.96 1.72 2.57 3.23 3.77 3.68 3.46 3.61 3.03 2.13 1.43 30.71WEST CENTRALLa Crosse 2.69 1.17 1.76 4.87 7.20 5.38 7.63 1.06 0.95 6.01 0.35 0.53 39.60 +6.54Menomonie 1.80 1.77 1.27 5.19 6.57 4.71 3.85 5.96 1.74 4.04 0.70 0.61 38.21 +6.96Mondovi 2.40 2.04 2.46 4.63 6.53 6.28 4.04 4.57 1.36 4.59 0.80 0.67 40.37 +5.68 District 2.24 1.49 1.69 4.63 6.03 5.27 5.30 4.05 1.46 4.80 0.52 0.72 38.20 +4.76 Normal 0.95 0.90 1.81 3.13 3.78 4.44 4.25 4.49 3.87 2.56 2.06 1.22 33.44CENTRALMarshfield 2.34 1.45 2.68 5.96 5.70 6.86 4.12 2.89 1.19 4.22 0.79 0.80 39.00 +6.28Montello 2.67 1.23 2.79 5.83 3.63 6.20 5.85 1.97 0.84 3.43 0.48 0.75 35.67 +1.20Waupaca 2.28 1.04 2.39 4.10 2.84 3.89 3.39 5.82 2.13 3.84 0.66 0.73 33.11 -0.38 District 2.39 1.19 2.40 4.76 4.15 6.00 4.13 3.62 1.82 4.08 0.64 0.86 36.04 +3.63 Normal 1.01 1.00 1.76 3.00 3.60 4.35 4.04 4.03 3.61 2.54 2.12 1.34 32.41EAST CENTRALGreen Bay 2.43 0.82 2.30 4.48 2.97 3.78 4.56 4.05 1.01 3.12 1.14 1.29 31.95 +2.43Oshkosh 2.56 0.88 2.65 4.61 2.89 7.08 2.22 4.05 3.33 3.25 1.12 0.80 35.44 +3.85Plymouth 2.93 1.58 3.03 5.34 3.46 4.52 4.10 6.11 1.79 3.32 0.97 0.77 37.92 +3.03 District 2.57 1.19 2.48 4.64 3.39 6.52 3.36 4.31 2.18 3.48 1.24 1.03 36.39 +5.10 Normal 1.27 1.12 1.78 2.86 3.26 3.87 3.67 3.59 3.38 2.69 2.27 1.53 31.29SOUTHWESTLancaster 2.08 1.00 1.95 4.27 4.86 4.80 9.65 0.71 2.25 5.91 0.81 0.64 38.93 +3.56Lone Rock 1.96 1.58 1.88 5.71 2.90 6.08 7.82 0.56 0.57 2.69 0.05 0.46 32.26 -2.74Viroqua 2.37 1.44 3.47 4.78 6.20 7.43 9.45 1.28 2.68 5.45 0.48 0.44 45.47 +10.94 District 2.42 1.47 2.54 4.75 4.50 5.70 8.20 1.85 1.38 4.87 0.59 0.54 38.81 +3.31 Normal 1.10 1.15 2.00 3.56 4.02 4.83 4.44 4.52 3.46 2.56 2.36 1.50 35.50SOUTH CENTRALBeloit 1.91 1.04 4.10 5.09 7.45 5.26 6.02 1.52 0.18 5.82 1.13 0.44 39.96 +3.62Madison 2.76 1.94 2.83 5.30 2.83 6.73 6.52 3.85 0.55 3.56 0.68 0.73 38.28 +3.80Portage 2.66 1.63 2.86 5.87 4.56 6.90 4.13 4.13 0.68 2.83 0.75 0.71 37.71 +1.57 District 2.37 1.47 2.99 5.11 4.50 6.58 6.80 3.22 0.76 4.31 0.92 0.59 39.62 +4.75 Normal 1.23 1.31 2.02 3.37 3.71 4.63 4.09 4.18 3.50 2.69 2.43 1.70 34.87SOUTHEASTHartford 2.70 1.26 2.83 4.98 4.26 7.03 3.52 4.81 0.78 3.80 1.10 0.66 37.73 +4.84Kenosha 2.10 2.38 4.99 5.93 2.76 5.09 9.89 2.54 0.18 6.65 1.84 0.26 44.61 +8.47Milwaukee 2.16 1.85 3.72 6.23 2.83 5.21 3.69 1.63 0.85 4.09 1.37 0.46 34.09 -0.67 District 2.35 1.52 3.42 5.27 4.34 6.00 6.46 2.72 0.59 4.27 1.30 0.50 38.74 +4.44 Normal 1.47 1.41 1.98 3.42 3.61 4.04 3.78 4.02 3.42 2.74 2.54 1.86 34.30STATE 2.02 1.34 1.99 4.60 4.94 5.94 4.46 4.10 1.90 4.30 0.91 1.07 37.57 +4.87 Normal 1.09 1.02 1.79 2.93 3.53 4.21 4.02 4.01 3.73 2.82 2.16 1.40 32.701/ Normal 1981-2010. Source: Wisconsin State Climatology Office.
AVERAGE MONTHLY AND ANNUAL TEMPERATURE: BY SELECTED STATIONS AND DISTRICTS, WISCONSIN, 2017
Station Jan. Feb. Mar. Apr. May Jun. Jul. Aug. Sep. Oct. Nov. Dec.
Annual
AverageChange
from station normal 1/
Degrees F.NORTHWESTBloomer 16.7 25.7 29.1 45.9 55.0 66.4 70.3 64.8 62.4 48.9 29.1 15.4 44.1 +0.5Gordon 14.7 22.7 25.5 42.0 51.5 63.0 66.9 62.0 59.5 46.2 25.8 11.6 40.9 -0.1Spooner 16.3 25.2 28.1 44.8 53.0 64.5 68.1 63.6 61.3 48.0 27.8 13.6 42.9 +0.4 District 16.7 25.1 28.0 43.8 51.9 63.3 67.2 62.4 60.6 47.5 28.0 13.6 42.3 +0.8 Normal 11.6 16.6 28.3 42.4 54.1 63.2 68.0 65.9 57.1 44.7 30.4 16.3 41.6NORTH CENTRALMedford 14.9 23.8 28.3 44.6 52.0 63.9 67.8 63.4 60.8 47.3 27.9 13.2 42.3 +0.2Rhinelander 16.0 22.4 24.6 42.2 49.7 62.8 66.0 61.2 58.9 46.9 28.1 12.7 41.0 -0.7Wausau 17.9 26.3 29.7 46.1 53.7 65.6 69.5 64.3 61.8 50.0 31.1 15.4 44.3 +0.8 District 16.3 24.0 26.8 43.5 50.8 63.0 66.5 61.6 59.8 47.3 28.2 13.4 41.8 +0.6 Normal 12.3 16.7 27.5 41.6 53.4 62.5 66.8 64.9 56.4 44.1 30.6 16.9 41.1NORTHEASTFlorence 18.2 22.9 24.7 41.7 48.8 62.6 65.3 61.1 58.1 47.6 28.8 13.8 41.1 +0.8Marinette 22.2 27.2 28.3 44.4 52.0 65.3 68.4 65.8 62.9 52.3 34.0 19.3 45.2 +0.5Shawano 18.4 26.3 29.5 46.7 54.6 66.7 69.4 65.0 62.5 51.4 31.9 16.5 44.9 +1.1 District 18.7 25.2 27.4 44.1 51.4 63.8 66.8 62.3 60.2 48.8 30.4 15.2 42.9 +0.8 Normal 14.1 18.2 28.4 42.0 53.4 62.9 67.2 65.4 57.0 44.8 32.0 18.9 42.0WEST CENTRALLa Crosse 24.0 33.3 35.7 52.5 58.9 72.4 76.0 71.0 68.8 54.1 36.5 21.9 50.4 +3.0Menomonie 18.5 27.1 29.9 46.3 54.4 65.7 70.3 65.2 63.3 49.7 30.6 17.6 44.9 +0.9Mondovi 20.2 30.9 34.0 50.0 57.6 68.8 72.7 67.2 65.7 52.4 33.7 19.5 47.7 +2.7 District 18.8 28.9 31.4 47.9 55.2 66.9 70.7 65.6 63.9 50.0 31.8 17.8 45.7 +1.3 Normal 14.8 19.8 31.6 45.7 56.8 66.2 70.6 68.3 59.7 47.3 33.1 18.9 44.4CENTRALMarshfield 17.6 26.1 28.5 46.6 53.4 65.9 69.7 64.7 62.1 49.4 30.0 16.2 44.2 +0.2Montello 21.0 29.4 32.2 49.5 55.6 67.2 70.0 66.1 63.5 51.9 33.6 20.7 46.7 +1.3Waupaca 19.5 27.0 30.1 47.8 54.4 66.7 70.3 66.2 62.9 51.1 32.3 17.8 45.5 +0.9 District 20.1 28.7 31.0 48.2 54.5 66.6 69.9 65.4 63.0 50.8 32.8 18.7 45.8 +1.3 Normal 16.1 20.8 31.6 45.2 56.3 65.7 69.9 67.8 59.4 47.1 34.0 20.3 44.5EAST CENTRALGreen Bay 23.5 29.7 31.7 48.5 55.1 67.7 70.6 65.6 63.9 52.9 35.4 18.7 46.9 +2.6Oshkosh 21.7 29.2 31.8 49.0 55.6 68.5 71.8 68.1 66.0 54.6 35.2 21.1 47.7 +1.3Plymouth 22.9 29.7 31.1 47.5 53.7 67.6 70.0 65.8 63.1 53.2 34.3 21.4 46.7 +1.0 District 22.3 29.2 31.0 47.2 53.2 66.5 69.4 65.7 63.0 52.6 34.6 20.0 46.2 +1.5 Normal 17.8 21.6 31.5 44.1 54.8 64.8 69.4 67.8 59.8 47.7 35.3 22.4 44.8SOUTHWESTLancaster 22.0 31.4 34.0 50.1 55.8 69.0 71.0 66.4 65.0 52.4 33.7 21.6 47.7 +2.0Lone Rock 24.2 33.4 35.9 50.8 57.2 69.2 71.9 66.8 64.8 52.8 35.2 21.9 48.7 +2.2Viroqua 18.7 28.1 30.1 47.1 53.3 66.3 69.0 64.7 62.8 49.7 31.1 18.4 44.9 +1.2 District 22.4 32.1 34.4 50.0 56.1 68.5 71.3 66.4 64.5 52.5 34.6 21.8 47.9 +1.6 Normal 17.8 22.8 34.1 46.9 57.7 67.3 71.4 69.3 61.1 48.9 35.6 21.9 46.2SOUTH CENTRALBeloit 23.6 32.9 34.4 49.2 54.1 67.5 69.0 65.2 63.8 52.5 33.5 22.3 47.3 -0.7Madison 23.7 32.3 34.2 50.0 56.1 69.0 71.2 66.8 64.7 53.8 35.6 22.1 48.3 +1.8Portage 22.5 31.2 32.8 49.9 56.0 68.4 71.1 66.8 63.8 52.7 34.9 21.9 47.7 +1.1 District 23.4 32.2 34.2 50.0 55.4 68.4 70.8 66.6 64.5 53.5 34.9 22.0 48.0 +1.4 Normal 18.8 23.4 34.1 46.8 57.7 67.4 71.5 69.4 61.3 49.2 36.5 23.0 46.6SOUTHEASTHartford 22.3 29.1 30.4 47.9 52.5 65.8 68.5 64.5 62.0 50.2 32.5 15.8 45.1 -0.2Kenosha 27.8 35.3 36.1 49.1 54.6 67.3 71.0 68.8 66.1 55.9 38.9 25.7 49.7 +1.7Milwaukee 27.9 35.5 36.1 50.9 55.1 70.3 72.1 70.2 67.2 57.1 39.2 25.8 50.6 +2.7 District 25.4 33.1 34.2 49.6 54.3 67.9 70.4 66.8 64.6 54.3 36.0 23.2 48.3 +1.5 Normal 20.2 24.4 34.3 46.1 56.6 66.6 71.2 69.6 61.7 49.7 37.4 24.5 46.9STATE 19.4 27.8 30.1 46.4 53.3 65.5 68.8 64.2 62.2 50.0 31.4 17.3 44.7 +1.1 Normal 15.0 19.6 30.5 44.0 55.3 64.7 69.1 67.1 58.7 46.5 33.1 19.4 43.61/ Normal 1981-2010. Source: Wisconsin State Climatology Office.

16 Wisconsin 2018 Agricultural Statistics
FIELD CROP SUMMARY: ACREAGE, YIELD, PRODUCTION, AND VALUE, WISCONSIN, 2013-2017
Year Planted Harvested Yield per acre ProductionValue
Per bushel TotalAcres Bushels 1,000 bushels Dollars 1,000 dollars
CORN FOR GRAIN 1/ 2013 4,100,000 3,030,000 145.0 439,350 4.38 1,924,3532014 4,000,000 3,110,000 156.0 485,160 3.67 1,780,5372015 4,000,000 3,000,000 164.0 492,000 3.46 1,702,3202016 4,050,000 3,220,000 178.0 573,160 3.28 1,879,9652017 3,900,000 2,930,000 174.0 509,820 3.25 1,656,915
SOYBEANS FOR BEANS2013 1,580,000 1,550,000 39.0 60,450 12.80 773,7602014 1,800,000 1,790,000 44.0 78,760 10.00 787,6002015 1,880,000 1,870,000 49.5 92,565 8.73 808,0922016 1,960,000 1,950,000 55.0 107,250 9.36 1,003,8602017 2,150,000 2,140,000 47.0 100,580 9.35 940,423
OATS2013 255,000 105,000 65.0 6,825 4.07 27,7782014 255,000 140,000 62.0 8,680 3.52 30,5542015 280,000 195,000 72.0 14,040 1.81 25,4122016 210,000 100,000 66.0 6,600 1.86 12,2762017 180,000 85,000 59.0 5,015 2.60 13,039
WHEAT, ALL2013 315,000 265,000 58.0 15,370 6.12 94,0642014 295,000 250,000 65.0 16,250 4.75 77,1882015 230,000 210,000 74.0 15,540 4.40 68,3762016 270,000 250,000 79.0 19,750 3.51 69,3232017 210,000 170,000 68.0 11,560 4.05 46,818
WHEAT, WINTER2013 315,000 265,000 58.0 15,370 6.12 94,0642014 295,000 250,000 65.0 16,250 4.75 77,1882015 230,000 210,000 74.0 15,540 4.40 68,3762016 270,000 250,000 79.0 19,750 3.51 69,3232017 210,000 170,000 68.0 11,560 4.05 46,818
BARLEY 2/2013 33,000 16,000 49.0 784 6.49 5,0882014 26,000 16,000 47.0 752 5.25 3,9482015 28,000 15,000 55.0 825 5.49 4,5292016 (NA) (NA) (NA) (NA) (NA) (NA)2017 (NA) (NA) (NA) (NA) (NA) (NA)(NA) Not available. 1/Corn acres planted is for all purposes. 2/ As of 2016, NASS will no longer set state-level estimates for Wisconsin barley production.
BIOTECHNOLOGY CORN VARIETIES AS A PERCENT OF ALL CORN PLANTED, WISCONSIN, 2014-2018
Year Insect resistant (Bt)
Herbicide resistant 1/
Stacked gene 2/ All biotech
Percent2014 3 17 72 922015 3 19 70 922016 3 17 70 902017 2 14 71 872018 3 13 72 881/ Does not include conventionally bred herbicide resistant varieties. 2/ Stacked gene varieties contain biotech traits for both herbicide and insect resistance.
BIOTECHNOLOGY SOYBEAN VARIETIES AS A PERCENT OF ALL SOYBEANS PLANTED, WISCONSIN, 2014-2018
Year Herbicide resistant 1/Percent
2014 952015 932016 942017 922018 921/ Does not include conventionally bred herbicide resistant varieties.

Wisconsin 2018 Agricultural Statistics 17
GRAIN STOCKS: (ON-FARMS AND OFF-FARMS), BY QUARTER, WISCONSIN, 2013-2017Year March 1 June 1 September 1 December 1
1,000 bushelsCORN
2013 227,356 136,168 43,901 338,9022014 221,390 144,522 55,899 405,3232015 266,357 171,079 67,276 409,5582016 303,233 190,562 72,250 443,5702017 346,918 225,370 112,185 443,383
SOYBEANS2013 26,305 13,931 4,839 48,3582014 20,022 7,773 2,503 52,7732015 29,529 16,970 7,408 63,6162016 38,693 22,612 5,733 66,9492017 48,042 30,718 9,061 74,031
NEW SEEDINGS OF ALFALFA AND ALFALFA MIXTURES: WISCONSIN, 2013-2017
Year Acres seeded1,000 acres
2013 4602014 4502015 4402016 3202017 300
HAY STOCKS: WISCONSIN, 2013-2017Year Dec. 1
stocks 1/Percent of
production 2/May 1 stocks
Percent of production 2/
1,000 tons Percent 1,000 tons Percent2013 2,010 60 410 122014 2,900 77 435 122015 2,960 61 730 152016 2,900 71 810 202017 3,200 82 820 211/Refers to December 1 of previous year. 2/ Previous year’s production.
PRICES RECEIVED BY FARMERS FOR CROPS: BY MONTHS, WISCONSIN, 2013-2017Year Jan. Feb. March April May June July Aug. Sept. Oct. Nov. Dec.
Dollars per bushelCORN
2013 6.93 7.03 7.06 6.95 6.77 6.80 6.80 6.18 5.68 4.68 4.38 4.312014 4.40 4.30 4.47 4.55 4.72 4.56 4.28 3.80 3.53 3.72 3.61 3.692015 3.74 3.75 3.72 3.73 3.48 3.48 3.78 3.67 3.58 3.57 3.42 3.412016 3.51 3.44 3.43 3.49 3.57 3.75 3.52 3.12 3.13 3.23 3.16 3.152017 3.27 3.36 3.42 3.39 3.35 3.42 3.45 3.32 3.25 3.26 3.12 3.13
SOYBEANS2013 13.90 14.40 14.40 14.10 14.60 14.90 15.10 14.40 12.90 12.20 12.70 13.102014 12.80 13.20 13.40 14.00 14.70 14.40 13.40 12.50 11.20 10.10 10.10 10.002015 10.20 10.00 9.72 9.63 9.40 9.44 9.79 9.57 8.62 8.56 8.36 8.442016 8.69 8.55 8.53 8.98 9.69 10.30 10.30 9.84 9.34 9.24 9.38 9.492017 9.55 9.86 9.75 9.33 9.34 9.19 9.41 9.34 9.27 9.22 9.40 9.43
OATS2013 4.07 4.33 4.59 4.33 4.39 4.23 4.16 3.87 3.89 4.05 4.20 4.192014 4.00 4.61 4.61 4.72 4.52 4.52 4.01 3.47 3.61 3.59 3.86 3.232015 3.30 3.58 3.29 3.03 2.93 2.82 2.22 1.79 1.91 1.82 1.89 1.902016 1.48 1.67 1.62 1.65 1.64 1.66 1.69 1.47 1.37 1.68 1.85 1.922017 2.54 2.64 2.43 2.55 2.57 2.97 2.57 2.34 2.59 2.88 2.99 2.59

18 Wisconsin 2018 Agricultural Statistics
CORN FOR GRAIN: ACREAGE, YIELD AND PRODUCTION, BY COUNTY, WISCONSIN, 2016-2017 1/County and
district
2016 2017All corn planted
Harvested for grain
Yield per acre Production All corn
plantedHarvested for grain
Yield per acre Production
Acres Bushels 1,000 bushels Acres Bushels 1,000 bushelsBarron 94,400 66,700 164.4 10,966 90,900 62,700 152.4 9,553Bayfield – – – – – – – –Burnett 14,500 12,200 143.9 1,755 13,200 9,950 148.6 1,479Chippewa 96,800 75,900 161.9 12,290 88,700 72,800 162.9 11,859Douglas – – – – – – – –Polk 66,100 54,100 169.3 9,159 63,000 51,100 158.7 8,108Rusk 23,800 18,600 145.8 2,712 – – – –Sawyer 7,100 5,510 139.2 767 – – – –Washburn 11,100 8,470 154.3 1,307 12,200 11,300 152.3 1,721Combined counties 3,200 2,520 115.1 290 33,000 19,150 126.6 2,425Northwest 317,000 244,000 160.8 39,246 301,000 227,000 154.8 35,145Ashland – – – – 3,000 880 82.6 73Clark 88,000 49,900 154.7 7,721 75,500 33,600 144.9 4,868Iron – – – – – – – –Lincoln – – – – 8,000 4,360 128.7 561Marathon 106,000 66,500 148.2 9,856 98,300 51,200 157.2 8,051Oneida – – – – – – – –Price – – – – – – – –Taylor 48,100 32,400 152.7 4,946 44,200 24,600 111.9 2,752Vilas – – – – – – – –Combined counties 16,900 9,300 134.3 1,249 6,000 860 121.3 104North Central 259,000 158,100 150.4 23,772 235,000 115,500 142.1 16,409Florence – – – – – – – –Forest – – – – – – – –Langlade – – – – – – – –Marinette – – – – – – – –Menominee – – – – – – – –Oconto 61,100 48,300 153.4 7,411 60,700 33,500 146.5 4,907Shawano 83,100 52,500 164.5 8,638 77,800 41,500 166.6 6,914Combined counties 52,800 39,600 144.2 5,711 53,500 32,000 133.8 4,283Northeast 197,000 140,400 155.0 21,760 192,000 107,000 150.5 16,104Buffalo 67,700 58,600 169.5 9,934 65,300 54,200 167.8 9,094Dunn 102,500 84,700 169.3 14,336 102,500 76,600 180.5 13,829Eau Claire 44,900 39,800 162.0 6,446 44,500 40,800 162.6 6,635Jackson 51,200 38,600 175.1 6,760 48,700 43,000 166.5 7,158La Crosse 32,700 27,200 172.0 4,679 33,500 27,600 166.5 4,596Monroe 60,300 47,200 162.4 7,667 60,100 44,800 161.8 7,247Pepin 29,900 24,200 170.3 4,121 28,700 21,800 176.0 3,837Pierce 87,200 79,100 189.2 14,967 86,300 72,000 194.7 14,017St Croix 102,000 83,800 178.9 14,992 98,200 73,300 174.8 12,813Trempealeau 92,600 78,800 170.0 13,399 87,200 75,900 162.9 12,365West Central 671,000 562,000 173.1 97,301 655,000 530,000 172.8 91,591Adams 26,200 23,700 132.2 3,132 28,800 26,300 114.3 3,005Green Lake 49,400 44,500 184.3 8,202 50,900 38,200 182.6 6,977Juneau 46,900 44,700 177.4 7,932 42,900 37,200 164.5 6,119Marquette 35,900 31,500 150.8 4,750 36,100 27,400 145.9 3,998Portage 53,700 39,100 162.7 6,362 52,200 40,300 162.7 6,556Waupaca 65,000 44,300 157.9 6,993 58,600 34,600 165.7 5,733Waushara 33,900 29,800 165.4 4,930 27,800 21,300 161.5 3,439Wood 43,000 31,400 157.1 4,932 35,700 9,700 138.5 1,343Central 354,000 289,000 163.4 47,233 333,000 235,000 158.2 37,170Brown 62,900 33,800 174.0 5,881 – – – –Calumet – – – – 45,400 17,700 173.1 3,064Door – – – – 26,800 15,900 146.9 2,336Fond Du Lac 110,500 87,000 186.1 16,187 106,000 67,400 182.7 12,312Kewaunee 52,900 24,200 170.6 4,128 – – – –Manitowoc 70,100 35,000 178.0 6,229 72,500 27,300 177.7 4,852Outagamie 85,200 73,000 185.2 13,519 80,600 63,900 166.7 10,655Sheboygan 47,300 32,200 168.4 5,424 47,900 34,900 169.3 5,908Winnebago 49,200 36,200 156.2 5,656 49,400 35,600 164.0 5,840

Wisconsin 2018 Agricultural Statistics 19
CORN FOR GRAIN: ACREAGE, YIELD AND PRODUCTION, BY COUNTY, WISCONSIN, 2016-2017 1/County and
district
2016 2017All corn planted
Harvested for grain
Yield per acre Production All corn
plantedHarvested for grain
Yield per acre Production
Acres Bushels 1,000 bushels Acres Bushels 1,000 bushelsCombined counties 70,900 40,600 167.5 6,802 112,400 42,300 166.6 7,049East Central 549,000 362,000 176.3 63,826 541,000 305,000 170.5 52,016Crawford 37,700 32,600 168.1 5,480 35,800 30,200 167.9 5,070Grant 163,500 135,400 202.4 27,401 162,500 132,800 191.3 25,399Iowa 75,200 61,100 187.2 11,435 77,000 67,200 169.4 11,382Lafayette 139,500 123,900 203.0 25,151 138,000 124,700 206.0 25,694Richland 43,400 37,600 159.4 5,993 43,900 33,900 158.0 5,356Sauk 86,100 73,800 181.8 13,420 88,000 69,200 169.7 11,746Vernon 67,600 51,600 174.8 9,019 62,800 48,000 159.6 7,663Southwest 613,000 516,000 189.7 97,899 608,000 506,000 182.4 92,310Columbia 130,000 109,200 200.9 21,934 122,500 111,400 193.5 21,557Dane 197,500 176,500 192.5 33,982 193,500 157,300 191.4 30,115Dodge 143,500 117,700 187.4 22,058 135,000 120,100 187.7 22,540Green 114,000 97,500 199.0 19,403 111,000 96,000 192.5 18,477Jefferson 90,000 82,300 195.3 16,073 78,000 69,900 173.4 12,118Rock 166,000 147,800 201.6 29,800 159,000 145,300 194.8 28,298South Central 841,000 731,000 196.0 143,250 799,000 700,000 190.2 133,105Kenosha 30,200 22,800 157.6 3,593 29,800 24,200 168.1 4,067Milwaukee 1,100 1,000 145.0 145 – – – –Ozaukee 16,500 11,600 174.7 2,026 – – – –Racine 37,000 34,500 184.6 6,370 33,400 31,300 175.6 5,495Walworth 106,500 99,000 182.0 18,021 103,000 94,800 175.8 16,665Washington 33,300 25,700 178.8 4,596 30,600 21,200 177.8 3,769Waukesha 24,400 22,900 180.0 4,122 21,900 20,900 181.5 3,794Combined counties – – – – 17,300 12,100 180.2 2,180Southeast 249,000 217,500 178.7 38,873 236,000 204,500 175.9 35,970Wisconsin 4,050,000 3,220,000 178.0 573,160 3,900,000 2,930,000 174.0 509,8201/ Some counties were not published to avoid disclosure of individual operations. Unpublished data is included in “combined counties.”
Price
Clark
Dane
Grant
Polk
Vilas
Bayfield
Iron
Sawyer
Rusk
Marathon
Oneida
Douglas
Forest
Taylor
Sauk
Dunn
Iowa
Oconto
Dodge
Rock
Wood
BarronLincoln
Jackson
Ashland
Burnett
Monroe
Vernon
Chippewa
Buffalo
Langlade
Green
Pierce
St. Croix
Lafayette
Waushara
Eau Claire
Racine
Marinette
Juneau
Portage
Shawano
Adams
Door
Washburn
Columbia
Waupaca Brown
RichlandCrawford
Jefferson
Fond du Lac
Walworth
OutagamieTrempealeau
Florence
Manitowoc
Waukesha
Winnebago
La CrosseCalumet
SheboyganMarquette
Pepin
Washington
Green Lake
Kewaunee
Menominee
Kenosha
Ozaukee
Milwaukee
Million BushelsNot published
Less than 5.0
5.0 - 9.9
10.0 - 14.9
15.0 or more
CORN FOR GRAINProduction by County - 2017
0
100
200
300
400
500
600
700
2008 2009 2010 2011 2012 2013 2014 2015 2016 2017
CORN GRAIN PRODUCTIONWisconsin, 2008-2017
MillionBushels

20 Wisconsin 2018 Agricultural Statistics
CORN FOR SILAGE: ACREAGE, YIELD, AND PRODUCTION, BY COUNTY, WISCONSIN, 2016-2017 1/County and
district2016 2017
Harvested Yield per acre Production Harvested Yield per acre ProductionAcres Tons Acres Tons
Barron – – – – – –Bayfield – – – – – –Burnett 2,100 19.0 40,200 3,190 23.0 74,000Chippewa 19,200 21.5 412,000 14,900 19.0 280,000Douglas – – – – – –Polk 10,500 22.0 231,000 11,200 19.5 220,000Rusk 4,100 19.0 78,000 – – –Sawyer 1,460 21.5 31,100 1,890 17.5 33,000Washburn 2,570 18.5 48,000 850 22.0 18,700Combined counties 28,070 22.0 615,700 33,970 18.0 603,300Northwest 68,000 21.5 1,456,000 66,000 18.5 1,229,000Ashland 2,040 14.5 29,400 – – –Clark 37,400 20.0 741,000 36,600 15.0 542,000Iron – – – – – –Lincoln 1,570 18.5 28,700 2,960 16.5 48,200Maration 37,800 18.5 701,000 42,200 16.5 692,000Oneida – – – – – –Price – – – 4,080 14.5 59,000Taylor – – – – – –Vilas – – – – – –Combined counties 17,590 17.5 304,900 17,660 16.5 289,800North Central 96,400 18.5 1,805,000 103,500 16.0 1,631,000Florence 170 17.0 2,900 – – –Forest – – – – – –Langlade – – – 6,150 17.5 109,000Marinette 6,590 18.0 120,000 7,850 18.0 142,000Menominee – – – – – –Oconto – – – – – –Shawano 29,800 19.5 580,000 34,000 18.0 616,000Combined counties 16,540 17.5 293,100 22,900 16.5 376,000Northeast 53,100 19.0 996,000 70,900 17.5 1,243,000Buffalo – – – 10,500 20.0 211,000Dunn 17,100 18.5 317,000 – – –Eau Claire – – – 3,440 17.0 58,000Jackson – – – 5,470 21.0 114,000La Crosse – – – – – –Monroe 12,700 19.0 239,000 14,100 20.5 288,000Pepin 5,650 23.0 130,000 6,860 24.0 165,000Pierce 7,500 21.0 159,000 – – –St Croix – – – – – –Trempealeau 13,500 24.0 321,000 – – –Combined counties 48,550 21.5 1,038,000 79,230 20.5 1,640,000West Central 105,000 21.0 2,204,000 119,600 20.5 2,476,000Adams – – – – – –Green Lake – – – – – –Juneau – – – – – –Marquette 3,570 20.5 74,000 – – –Portage – – – – – –Waupaca 19,900 18.0 359,000 – – –Waushara – – – – – –Wood – – – – – –Combined counties 36,530 19.5 711,000 90,900 19.0 1,743,000Central 60,000 19.0 1,144,000 90,900 19.0 1,743,000Brown 27,000 19.0 518,000 33,600 18.0 602,000Calumet 19,000 20.5 393,000 25,400 17.5 442,000Door – – – – – –Fond du Lac 22,400 21.5 487,000 – – –Kewaunee 26,500 22.5 599,000 28,900 19.5 561,000Manitowoc 33,900 22.0 747,000 42,800 18.0 779,000Outagamie 11,900 22.0 260,000 13,800 20.5 285,000Sheboygan – – – – – –
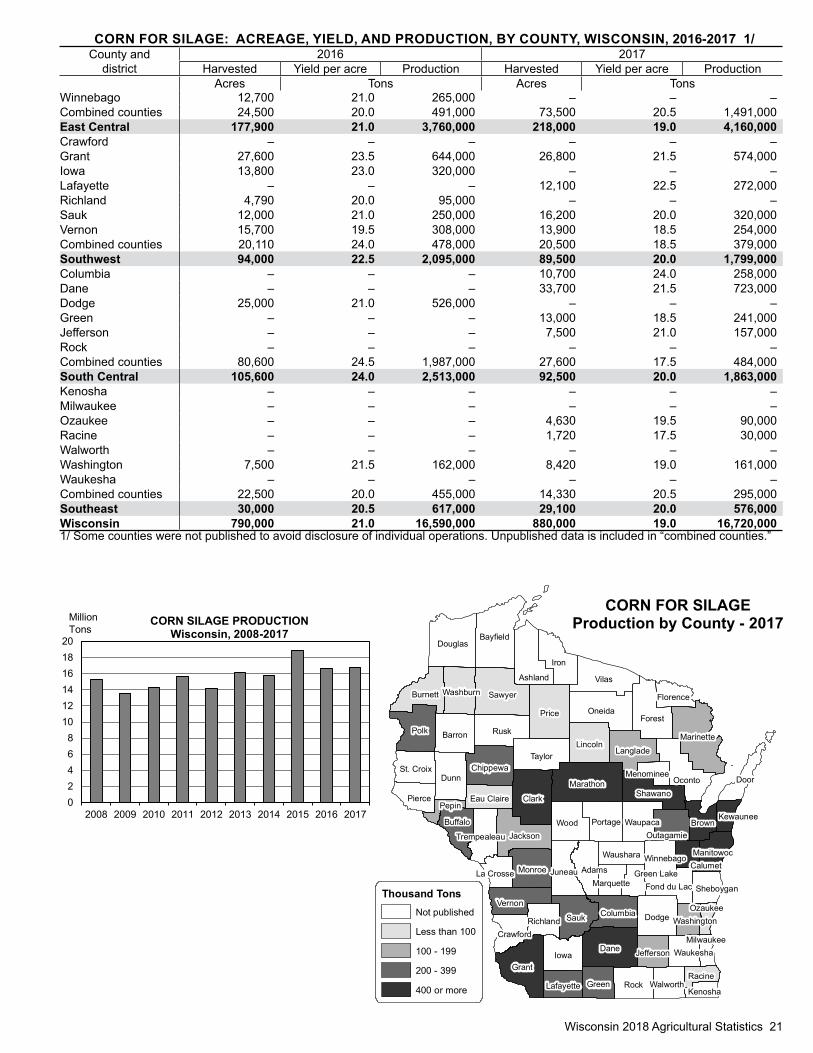
Wisconsin 2018 Agricultural Statistics 21
CORN FOR SILAGE: ACREAGE, YIELD, AND PRODUCTION, BY COUNTY, WISCONSIN, 2016-2017 1/County and
district2016 2017
Harvested Yield per acre Production Harvested Yield per acre ProductionAcres Tons Acres Tons
Winnebago 12,700 21.0 265,000 – – –Combined counties 24,500 20.0 491,000 73,500 20.5 1,491,000East Central 177,900 21.0 3,760,000 218,000 19.0 4,160,000Crawford – – – – – –Grant 27,600 23.5 644,000 26,800 21.5 574,000Iowa 13,800 23.0 320,000 – – –Lafayette – – – 12,100 22.5 272,000Richland 4,790 20.0 95,000 – – –Sauk 12,000 21.0 250,000 16,200 20.0 320,000Vernon 15,700 19.5 308,000 13,900 18.5 254,000Combined counties 20,110 24.0 478,000 20,500 18.5 379,000Southwest 94,000 22.5 2,095,000 89,500 20.0 1,799,000Columbia – – – 10,700 24.0 258,000Dane – – – 33,700 21.5 723,000Dodge 25,000 21.0 526,000 – – –Green – – – 13,000 18.5 241,000Jefferson – – – 7,500 21.0 157,000Rock – – – – – –Combined counties 80,600 24.5 1,987,000 27,600 17.5 484,000South Central 105,600 24.0 2,513,000 92,500 20.0 1,863,000Kenosha – – – – – –Milwaukee – – – – – –Ozaukee – – – 4,630 19.5 90,000Racine – – – 1,720 17.5 30,000Walworth – – – – – –Washington 7,500 21.5 162,000 8,420 19.0 161,000Waukesha – – – – – –Combined counties 22,500 20.0 455,000 14,330 20.5 295,000Southeast 30,000 20.5 617,000 29,100 20.0 576,000Wisconsin 790,000 21.0 16,590,000 880,000 19.0 16,720,0001/ Some counties were not published to avoid disclosure of individual operations. Unpublished data is included in “combined counties.”
Price
Clark
Dane
Grant
Polk
Vilas
Bayfield
Iron
Sawyer
Rusk
Marathon
Oneida
Douglas
Forest
Taylor
Sauk
Dunn
Iowa
Oconto
Dodge
Rock
Wood
BarronLincoln
Jackson
Ashland
Burnett
Monroe
Vernon
Chippewa
Buffalo
Langlade
Green
Pierce
St. Croix
Lafayette
Waushara
Eau Claire
Racine
Marinette
Juneau
Portage
Shawano
Adams
Door
Washburn
Columbia
Waupaca Brown
RichlandCrawford
Jefferson
Fond du Lac
Walworth
OutagamieTrempealeau
Florence
Manitowoc
Waukesha
Winnebago
La CrosseCalumet
SheboyganMarquette
Pepin
Washington
Green Lake
Kewaunee
Menominee
Kenosha
Ozaukee
Milwaukee
Thousand TonsNot published
Less than 100
100 - 199
200 - 399
400 or more
CORN FOR SILAGEProduction by County - 2017
02468
101214161820
2008 2009 2010 2011 2012 2013 2014 2015 2016 2017
CORN SILAGE PRODUCTIONWisconsin, 2008-2017
MillionTons

22 Wisconsin 2018 Agricultural Statistics
SOYBEANS: ACREAGE, YIELD, AND PRODUCTION, BY COUNTY, WISCONSIN, 2016-2017 1/County and
district2016 2017
Planted Harvested Yield per acre Production Planted Harvested Yield per acre ProductionAcres Bushels 1,000 bushels Acres Bushels 1,000 bushels
Barron 49,600 49,600 51.8 2,567 53,800 53,600 41.2 2,209Bayfield – – – – – – – –Burnett 8,600 8,500 48.9 416 9,600 9,540 39.2 374Chippewa 52,600 52,200 49.4 2,577 59,800 59,400 42.1 2,498Douglas – – – – – – – –Polk 32,900 32,800 54.0 1,770 37,800 37,600 41.3 1,553Rusk 14,900 14,600 44.2 646 14,800 14,700 39.3 577Sawyer 2,200 2,200 40.6 89 3,000 2,980 31.8 95Washburn 7,700 7,600 44.7 340 7,500 7,440 38.8 289Combined counties 1,500 1,500 37.7 57 1,700 1,640 28.1 46Northwest 170,000 169,000 50.1 8,462 188,000 186,900 40.9 7,641Ashland – – – – – – – –Clark 38,000 37,700 50.5 1,903 41,300 40,900 44.3 1,813Iron – – – – – – – –Lincoln – – – – – – – –Marathon 50,900 50,800 50.6 2,571 55,000 54,400 46.9 2,553Oneida – – – – – – – –Price – – – – – – – –Taylor 28,300 28,000 47.8 1,337 30,200 30,100 36.4 1,095Vilas – – – – – – – –Combined counties 7,800 7,500 48.0 360 8,000 7,600 33.6 255North Central 125,000 124,000 49.8 6,171 134,500 133,000 43.0 5,716Florence – – – – – – – –Forest – – – – – – – –Langlade – – – – – – – –Marinette 8,500 8,400 45.4 381 8,500 8,390 40.2 337Menominee – – – – – – – –Oconto 26,600 26,500 47.6 1,261 26,000 26,000 42.3 1,100Shawano 27,600 27,500 53.3 1,466 31,800 31,700 44.1 1,397Combined counties 7,300 7,100 43.2 307 7,700 7,510 36.5 274Northeast 70,000 69,500 49.1 3,415 74,000 73,600 42.2 3,108Buffalo 29,700 29,400 52.7 1,550 33,300 33,200 47.1 1,564Dunn 63,000 62,800 49.1 3,081 67,600 67,500 45.3 3,060Eau Claire 26,800 26,700 48.8 1,303 28,300 28,200 41.3 1,165Jackson 26,700 26,600 55.2 1,468 31,000 30,900 47.5 1,468La Crosse 15,900 15,700 55.4 870 – – – –Monroe 24,900 24,800 53.3 1,322 26,800 26,600 41.0 1,090Pepin 14,400 14,300 56.4 806 – – – –Pierce 40,900 40,800 59.2 2,414 43,800 43,800 49.9 2,186St. Croix 53,900 53,700 53.4 2,870 62,500 62,400 46.3 2,888Trempealeau 37,800 37,700 53.2 2,004 43,200 43,100 46.4 2,000Combined counties – – – – 33,500 33,300 46.2 1,539West Central 334,000 332,500 53.2 17,688 370,000 369,000 46.0 16,960Adams 11,600 11,500 50.3 578 11,200 11,100 43.0 477Green Lake 18,600 18,500 58.8 1,087 – – – –Juneau 29,400 29,300 51.4 1,506 – – – –Marquette – – – – 11,100 11,000 38.5 423Portage – – – – 19,400 19,300 44.1 852Waupaca 26,500 26,300 53.0 1,394 30,000 29,800 46.3 1,381Waushara 13,300 13,200 48.5 640 15,400 15,300 41.9 641Wood 18,300 18,200 50.7 922 20,700 20,100 42.9 863Combined counties 29,800 29,500 45.8 1,352 51,200 50,900 47.5 2,418Central 147,500 146,500 51.1 7,479 159,000 157,500 44.8 7,055Brown 22,400 22,300 54.5 1,215 – – – –Calumet 25,100 25,000 59.7 1,492 29,900 29,800 45.7 1,363Door 11,900 11,800 47.2 557 – – – –Fond Du Lac 49,100 48,900 58.5 2,863 55,400 55,000 49.9 2,743Kewaunee 11,700 11,600 54.1 627 15,000 15,000 48.7 731Manitowoc 27,200 27,100 56.8 1,540 30,300 29,800 48.7 1,450Outagamie 55,100 55,000 50.1 2,754 58,400 58,200 46.3 2,696Sheboygan 28,200 28,100 54.8 1,541 34,400 34,300 50.9 1,747

Wisconsin 2018 Agricultural Statistics 23
SOYBEANS: ACREAGE, YIELD, AND PRODUCTION, BY COUNTY, WISCONSIN, 2016-2017 1/County and
district2016 2017
Planted Harvested Yield per acre Production Planted Harvested Yield per acre ProductionAcres Bushels 1,000 bushels Acres Bushels 1,000 bushels
Winnebago 39,800 39,700 53.8 2,137 43,200 43,100 47.3 2,039Combined counties – – – – 43,400 43,300 47.0 2,033East Central 270,500 269,500 54.6 14,726 310,000 308,500 48.0 14,802Crawford 20,300 20,200 52.1 1,053 22,800 22,600 44.1 997Grant 62,700 62,500 62.4 3,900 73,500 73,400 55.6 4,083Iowa 41,100 41,000 59.9 2,457 49,100 49,000 52.2 2,557Lafayette 57,000 56,900 64.0 3,640 59,700 59,300 56.4 3,345Richland 16,200 15,500 47.2 732 18,300 18,200 43.6 793Sauk 35,900 35,800 57.3 2,051 36,400 36,300 44.6 1,618Vernon 31,300 31,100 51.4 1,598 34,200 34,200 44.4 1,517Southwest 264,500 263,000 58.7 15,431 294,000 293,000 50.9 14,910Columbia 49,000 48,800 58.0 2,832 51,300 51,200 51.8 2,650Dane 80,600 80,400 60.4 4,855 86,900 86,800 51.6 4,480Dodge 76,300 76,200 60.4 4,599 77,900 77,600 52.5 4,073Green 55,900 55,700 63.4 3,529 61,300 61,200 49.2 3,014Jefferson 52,800 52,700 58.5 3,081 56,100 55,900 45.6 2,548Rock 93,400 92,200 58.9 5,435 103,000 102,800 50.1 5,150South Central 408,000 406,000 59.9 24,331 436,500 435,500 50.3 21,915Kenosha – – – – 25,600 25,000 45.4 1,136Milwaukee 2,300 2,300 47.8 110 2,000 2,000 35.5 71Ozaukee – – – – 12,200 12,200 51.8 632Racine 35,900 35,800 55.1 1,974 38,700 38,600 42.8 1,654Walworth 54,000 53,900 56.5 3,048 60,900 60,800 48.3 2,934Washington 22,500 22,400 53.8 1,204 23,400 23,300 47.6 1,108Waukesha 20,600 20,500 58.0 1,188 21,200 21,100 44.5 938Combined counties 35,200 35,100 57.6 2,023 – – – –Southeast 170,500 170,000 56.2 9,547 184,000 183,000 46.3 8,473Wisconsin 1,960,000 1,950,000 55.0 107,250 2,150,000 2,140,000 47.0 100,5801/ Some counties were not published to avoid disclosure of individual operations. Unpublished data is included in “combined counties.”
Price
Clark
Dane
Grant
Polk
Vilas
Bayfield
Iron
Sawyer
Rusk
Marathon
Oneida
Douglas
Forest
Taylor
Sauk
Dunn
Iowa
Oconto
Dodge
Rock
Wood
BarronLincoln
Jackson
Ashland
Burnett
Monroe
Vernon
Chippewa
Buffalo
Langlade
Green
Pierce
St. Croix
Lafayette
Waushara
Eau Claire
Racine
Marinette
Juneau
Portage
Shawano
Adams
Door
Washburn
Columbia
Waupaca Brown
RichlandCrawford
Jefferson
Fond du Lac
Walworth
OutagamieTrempealeau
Florence
Manitowoc
Waukesha
Winnebago
La CrosseCalumet
SheboyganMarquette
Pepin
Washington
Green Lake
Kewaunee
Menominee
Kenosha
Ozaukee
Milwaukee
Million BushelsNot published
Less than 1.0
1.0 - 1.9
2.0 - 2.9
3.0 or more
SOYBEANSProduction by County - 2017
0
20
40
60
80
100
120
2008 2009 2010 2011 2012 2013 2014 2015 2016 2017
SOYBEAN PRODUCTIONWisconsin, 2008-2017
MillionBushels

24 Wisconsin 2018 Agricultural Statistics
OATS: ACREAGE, YIELD, AND PRODUCTION, BY COUNTY, WISCONSIN, 2016-2017 1/County and
district2016 2017
Planted Harvested Yield per acre Production Planted Harvested Yield per acre ProductionAcres Bushels Acres Bushels
Barron 3,900 450 47.8 21,500 2,700 890 47.8 42,500Bayfield – – – – 800 690 49.6 34,200Burnett 700 490 79.4 38,900 – – – –Chippewa 4,600 1,750 50.0 87,500 3,500 1,800 55.3 99,500Douglas – – – – – – – –Polk 1,800 370 48.6 18,000 1,800 710 68.6 48,700Rusk 1,100 440 45.0 19,800 700 250 37.6 9,400Sawyer – – – – – – – –Washburn – – – – – – – –Combined counties 2,400 1,280 53.4 68,300 2,300 1,560 53.7 83,700Northwest 14,500 4,780 53.1 254,000 11,800 5,900 53.9 318,000Ashland – – – – – – – –Clark 7,800 5,570 53.9 300,000 5,700 3,970 42.1 167,000Iron – – – – – – – –Lincoln 800 650 50.9 33,100 – – – –Marathon 9,700 5,800 58.3 338,000 – – – –Oneida – – – – – – – –Price 600 310 36.8 11,400 – – – –Taylor 3,600 1,780 29.8 53,100 – – – –Vilas – – – – – – – –Combined counties 1,800 1,090 66.4 72,400 14,600 8,830 55.0 486,000North Central 24,300 15,200 53.2 808,000 20,300 12,800 51.0 653,000Florence – – – – – – – –Forest – – – – – – – –Langlade 10,000 7,860 83.1 653,000 10,100 9,060 74.7 677,000Marinette – – – – 1,200 720 56.8 40,900Menominee – – – – – – – –Oconto 2,200 900 62.8 56,500 1,200 410 53.7 22,000Shawano 4,200 1,360 74.3 101,000 2,800 1,960 61.2 120,000Combined counties 3,000 2,180 62.6 136,500 600 550 69.3 38,100Northeast 19,400 12,300 77.0 947,000 15,900 12,700 70.7 898,000Buffalo 5,300 1,570 57.5 90,300 – – – –Dunn – – – – 5,000 1,710 57.3 98,000Eau Claire 2,800 1,630 55.7 90,800 2,100 1,260 49.0 61,700Jackson – – – – 2,000 1,400 42.5 59,500La Crosse 1,800 560 62.5 35,000 – – – –Monroe – – – – 2,500 1,660 48.3 80,200Pepin – – – – – – – –Pierce 4,100 2,540 58.7 149,000 3,700 2,320 50.9 118,000St Croix 4,100 2,520 53.2 134,000 2,900 1,830 59.6 109,000Trempealeau – – – – 3,600 1,070 48.7 52,100Combined counties 17,800 10,280 54.1 555,900 7,100 2,050 53.4 109,500 West Central 35,900 19,100 55.2 1,055,000 28,900 13,300 51.7 688,000Adams 700 100 49.0 4,900 – – – –Green Lake 900 330 74.5 24,600 – – – –Juneau 1,700 250 60.4 15,100 1,400 300 53.3 16,000Marquette 1,200 210 45.2 9,500 – – – –Portage 3,900 760 64.9 49,300 3,700 900 44.3 39,900Waupaca 3,100 1,200 67.1 80,500 1,700 380 57.1 21,700Waushara 1,500 610 38.9 23,700 600 130 56.9 7,400Wood 3,500 760 65.0 49,400 2,400 1,200 42.1 50,500Combined counties 2,900 490 45.9 22,500Central 16,500 4,220 60.9 257,000 12,700 3,400 46.5 158,000Brown – – – – 3,800 1,700 50.0 85,000Calumet 1,700 1,130 85.5 96,600 1,900 750 60.5 45,400Door 4,900 3,260 62.6 204,000 3,800 2,490 70.3 175,000Fond Du Lac 3,400 1,260 78.4 98,800 – – – –Kewaunee 5,300 2,230 76.2 170,000 6,200 1,160 74.7 86,700Manitowoc 6,800 1,580 75.3 119,000 7,000 3,130 58.1 182,000Outagamie – – – – – – – –Sheboygan 1,900 1,360 75.7 103,000 2,500 810 74.7 60,500

Wisconsin 2018 Agricultural Statistics 25
OATS: ACREAGE, YIELD, AND PRODUCTION, BY COUNTY, WISCONSIN, 2016-2017 1/County and
district2016 2017
Planted Harvested Yield per acre Production Planted Harvested Yield per acre ProductionAcres Bushels Acres Bushels
Winnebago – – – – 700 120 57.5 6,900Combined counties 7,500 4,380 78.9 345,600 5,600 1,940 53.4 103,500East Central 31,500 15,200 74.8 1,137,000 31,500 12,100 61.6 745,000Crawford – – – – – – – –Grant 13,400 7,200 71.5 515,000 11,800 5,200 67.1 349,000Iowa 5,800 3,390 67.6 229,000 5,800 2,960 67.9 201,000Lafayette 6,600 1,510 78.1 118,000 – – – –Richland 3,200 910 56.0 51,000 2,700 620 45.2 28,000Sauk 4,400 2,120 71.2 151,000 4,100 1,190 60.3 71,800Vernon – – – – 5,100 1,470 53.5 78,700Combined counties 10,000 4,870 68.6 334,000 10,400 4,160 69.6 289,500Southwest 43,400 20,000 69.9 1,398,000 39,900 15,600 65.3 1,018,000Columbia 2,800 1,140 68.6 78,200 1,000 340 60.9 20,700Dane 3,100 1,090 68.3 74,500 2,500 850 60.2 51,200Dodge 3,200 1,290 69.1 89,100 3,200 1,630 60.2 98,200Green – – – – – – – –Jefferson – – – – 800 160 48.8 7,800Rock – – – – – – – –Combined counties 9,800 2,150 78.7 169,200 6,700 3,620 60.5 219,100South Central 18,900 5,670 72.5 411,000 14,200 6,600 60.2 397,000Kenosha – – – – – – – –Milwaukee – – – – – – – –Ozaukee 1,100 890 62.4 55,500 1,000 770 55.2 42,500Racine – – – – – – – –Walworth – – – – – – – –Washington 2,200 2,000 115.0 230,000 2,100 1,420 49.9 70,900Waukesha – – – – – – – –Combined counties 2,300 640 74.2 47,500 1,700 410 64.9 26,600Southeast 5,600 3,530 94.3 333,000 4,800 2,600 53.8 140,000Wisconsin 210,000 100,000 66.0 6,600,000 180,000 85,000 59.0 5,015,0001/ Some counties were not published to avoid disclosure of individual operations. Unpublished data is included in “combined counties.”
Price
Clark
Dane
Grant
Polk
Vilas
Bayfield
Iron
Sawyer
Rusk
Marathon
Oneida
Douglas
Forest
Taylor
Sauk
Dunn
Iowa
Oconto
Dodge
Rock
Wood
BarronLincoln
Jackson
Ashland
Burnett
Monroe
Vernon
Chippewa
Buffalo
Langlade
Green
Pierce
St. Croix
Lafayette
Waushara
Eau Claire
Racine
Marinette
Juneau
Portage
Shawano
Adams
Door
Washburn
Columbia
Waupaca Brown
RichlandCrawford
Jefferson
Fond du Lac
Walworth
OutagamieTrempealeau
Florence
Manitowoc
Waukesha
Winnebago
La CrosseCalumet
SheboyganMarquette
Pepin
Washington
Green Lake
Kewaunee
Menominee
Kenosha
Ozaukee
Milwaukee
Thousand BushelsNot published
Less than 50
50 - 99
100 - 199
200 or more
OATSProduction by County - 2017
0
2
4
6
8
10
12
14
16
2008 2009 2010 2011 2012 2013 2014 2015 2016 2017
OAT PRODUCTIONWisconsin, 2008-2017
MillionBushels

26 Wisconsin 2018 Agricultural Statistics
WINTER WHEAT: ACREAGE, YIELD, AND PRODUCTION, BY COUNTY, WISCONSIN, 2016-2017 1/County and
district2016 2017
Planted Harvested Yield per acre Production Planted Harvested Yield per acre Production Acres Bushels Acres Bushels
Barron – – – – 1,600 1,490 66.1 98,500Bayfield – – – – – – – –Burnett – – – – – – – –Chippewa – – – – 900 810 54.2 43,900Douglas – – – – – – – –Polk – – – – – – – –Rusk – – – – – – – –Sawyer – – – – – – – –Washburn – – – – – – – –Combined counties – – – – 600 480 63.8 30,600Northwest – – – – 3,100 2,780 62.2 173,000Ashland – – – – – – – –Clark 1,600 1,350 66.8 90,200 1,100 840 55.7 46,800Iron – – – – – – – –Lincoln – – – – – – – –Marathon 3,000 2,780 66.2 184,000 – – – –Oneida – – – – – – – –Price – – – – – – – –Taylor – – – – – – – –Vilas – – – – – – – –Combined counties 2,100 2,040 67.1 136,800 2,800 1,870 50.9 95,200North Central 6,700 6,170 66.6 411,000 3,900 2,710 52.4 142,000Florence – – – – – – – –Forest – – – – – – – –Langlade – – – – – – – –Marinette – – – – 2,600 2,360 57.2 135,000Menominee – – – – – – – –Oconto 5,400 5,250 71.8 377,000 – – – –Shawano 4,700 4,570 79.6 364,000 3,700 3,180 63.8 203,000Combined counties 5,500 4,780 68.2 326,000 5,300 4,860 58.2 283,000Northeast 15,600 14,600 73.1 1,067,000 11,600 10,400 59.7 621,000Buffalo – – – – – – – –Dunn – – – – – – – –Eau Claire – – – – – – – –Jackson – – – – – – – –La Crosse – – – – – – – –Monroe – – – – – – – –Pepin – – – – – – – –Pierce – – – – – – – –St Croix – – – – – – – –Trempealeau – – – – – – – –Combined counties – – – – 4,000 2,170 59.4 129,000 West Central – – – – 4,000 2,170 59.4 129,000Adams – – – – 500 410 69.5 28,500Green Lake – – – – 3,600 3,320 72.6 241,000Juneau 2,100 2,000 53.0 106,000 1,000 620 66.5 41,200Marquette 1,700 1,540 56.4 86,900 900 840 57.9 48,600Portage – – – – 20,100 100 42.0 4,200Waupaca 3,400 3,270 64.5 211,000 2,200 2,050 70.7 145,000Waushara 1,800 1,780 54.9 97,800 1,300 1,200 46.6 55,900Wood 2,100 2,000 67.5 135,000 700 600 74.3 44,600Combined counties 7,100 6,010 72.3 434,300 – – – –Central 18,200 16,600 64.5 1,071,000 30,300 9,140 66.6 609,000Brown – – – – 8,300 7,530 59.0 444,000Calumet 10,200 7,420 92.6 687,000 6,100 5,480 65.3 358,000Door 12,300 11,800 69.0 814,000 8,300 7,630 59.1 451,000Fond Du Lac 14,400 13,800 84.9 1,172,000 10,700 9,660 69.2 668,000Kewaunee 12,600 11,400 84.5 963,000 10,100 9,360 63.9 598,000Manitowoc 17,800 17,000 81.3 1,382,000 13,800 12,800 61.5 787,000Outagamie – – – – 4,700 4,330 71.8 311,000Sheboygan 12,100 11,700 86.2 1,009,000 7,900 6,330 63.8 404,000

Wisconsin 2018 Agricultural Statistics 27
WINTER WHEAT: ACREAGE, YIELD, AND PRODUCTION, BY COUNTY, WISCONSIN, 2016-2017 1/County and
district2016 2017
Planted Harvested Yield per acre Production Planted Harvested Yield per acre Production Acres Bushels Acres Bushels
Winnebago 11,100 10,600 75.1 796,000 7,100 6,280 63.4 398,000Combined counties 19,500 18,680 83.3 1,556,000 – – – –East Central 110,000 102,400 81.8 8,379,000 77,000 69,400 63.7 4,419,000Crawford 1,000 960 63.2 60,700 – – – –Grant – – – – 2,500 2,000 60.5 121,000Iowa 2,400 2,120 81.1 172,000 1,700 1,470 78.9 116,000Lafayette – – – – – – – –Richland – – – – 1,100 1,020 60.6 61,800Sauk 5,500 5,320 73.5 391,000 4,700 4,360 75.5 329,000Vernon 900 520 52.5 27,300 1,000 860 51.9 44,600Combined counties 6,900 6,580 84.5 556,000 2,400 2,190 72.4 158,600Southwest 16,700 15,500 77.9 1,207,000 13,400 11,900 69.8 831,000Columbia 7,400 7,160 90.1 645,000 6,400 5,900 73.4 433,000Dane 14,800 13,600 88.7 1,206,000 10,000 9,230 83.2 768,000Dodge 14,100 13,800 87.5 1,208,000 10,200 9,230 70.9 654,000Green – – – – 4,900 4,550 75.4 343,000Jefferson 6,600 6,370 75.4 480,000 4,700 4,360 70.0 305,000Rock – – – – 5,300 4,930 80.7 398,000Combined counties 13,000 11,370 80.0 910,000 – – – –South Central 55,900 52,300 85.1 4,449,000 41,500 38,200 75.9 2,901,000Kenosha 4,900 4,770 78.6 375,000 4,100 3,800 77.1 293,000Milwaukee – – – – – – – –Ozaukee 4,700 4,540 84.8 385,000 3,600 3,350 60.6 203,000Racine 7,500 7,290 84.9 619,000 6,200 5,700 78.2 446,000Walworth – – – – 4,400 4,000 78.8 315,000Washington 5,600 5,430 85.6 465,000 4,500 4,200 69.5 292,000Waukesha – – – – – – – –Combined counties 9,400 9,070 82.5 748,000 2,400 2,250 82.7 186,000Southeast 32,100 31,100 83.3 2,592,000 25,200 23,300 74.5 1,735,000Combined districts 14,800 11,330 50.7 574,000 – – – –Wisconsin 270,000 250,000 79.0 19,750,000 210,000 170,000 68.0 11,560,0001/ Some districts/counties were not published to avoid disclosure of individual operations. Unpublished data is included in “combined districts/counties.”
0
5
10
15
20
25
2008 2009 2010 2011 2012 2013 2014 2015 2016 2017
WINTER WHEAT PRODUCTIONWisconsin, 2008-2017
MillionBushels
Price
Clark
Dane
Grant
Polk
Vilas
Bayfield
Iron
Sawyer
Rusk
Marathon
Oneida
Douglas
Forest
Taylor
Sauk
Dunn
Iowa
Oconto
Dodge
Rock
Wood
BarronLincoln
Jackson
Ashland
Burnett
Monroe
Vernon
Chippewa
Buffalo
Langlade
Green
Pierce
St. Croix
Lafayette
Waushara
Eau Claire
Racine
Marinette
Juneau
Portage
Shawano
Adams
Door
Washburn
Columbia
Waupaca Brown
RichlandCrawford
Jefferson
Fond du Lac
Walworth
OutagamieTrempealeau
Florence
Manitowoc
Waukesha
Winnebago
La CrosseCalumet
SheboyganMarquette
Pepin
Washington
Green Lake
Kewaunee
Menominee
Kenosha
Ozaukee
Milwaukee
Thousand BushelsNot published
Less than 100
100 - 199
200 - 399
400 or more
WINTER WHEATProduction by County - 2017

28 Wisconsin 2018 Agricultural Statistics
ALFALFA HAY (DRY): ACREAGE, YIELD, AND PRODUCTION, BY COUNTY, WISCONSIN, 2016-2017 1/County and
district2016 2017
Harvested Yield per acre Production Harvested Yield per acre ProductionAcres Tons Acres Tons
Barron 20,500 2.65 54,200 17,300 3.10 53,900Bayfield 5,430 1.60 8,600 3,460 2.35 8,200Burnett 8,030 2.80 22,500 7,110 2.00 14,100Chippewa 24,600 3.25 79,900 19,200 2.90 55,600Douglas – – – 3,170 2.85 9,000Polk 17,000 2.85 48,200 14,400 2.65 38,500Rusk – – – – – –Sawyer 2,540 2.60 6,600 2,600 2.15 5,600Washburn 6,020 2.95 17,700 – – –Combined counties 11,680 3.35 38,900 13,060 2.55 33,200Northwest 95,800 2.90 276,600 80,300 2.70 218,100Ashland 2,370 2.00 4,700 1,740 1.45 2,560Clark 27,600 2.75 75,800 21,000 2.40 50,200Iron – – – – – –Lincoln – – – 4,190 1.70 7,100Marathon 23,300 2.25 52,100 19,200 3.00 57,300Oneida 1,100 2.20 2,400 1,100 2.00 2,220Price 5,100 1.90 9,700 – – –Taylor – – – – – –Vilas – – – – – –Combined counties 15,930 2.05 32,400 12,870 2.50 32,220North Central 75,400 2.35 177,100 60,100 2.50 151,600Florence – – – 1,280 1.45 1,830Forest 3,290 1.80 6,000 – – –Langlade – – – 3,690 2.65 9,800Marinette 11,400 3.15 35,900 – – –Menominee – – – – – –Oconto 15,300 2.90 44,000 10,500 2.60 27,500Shawano 26,700 3.40 91,400 20,500 2.55 51,800Combined counties 6,810 2.55 17,500 10,130 2.20 22,370Northeast 63,500 3.05 194,800 46,100 2.45 113,300Buffalo 21,000 3.25 68,100 16,100 3.45 55,200Dunn 26,900 3.80 102,800 17,200 3.50 59,800Eau Claire 15,400 2.75 42,700 13,100 3.05 40,200Jackson 17,400 3.45 60,400 16,200 3.35 53,900La Crosse 14,800 2.50 37,200 – – –Monroe 27,600 3.15 87,200 23,000 2.55 59,200Pepin 7,600 3.75 28,500 – – –Pierce 16,000 4.25 67,800 15,000 4.10 61,800St. Croix 20,500 3.25 66,900 17,300 3.00 52,000Trempealeau 15,500 3.55 55,100 16,400 3.20 52,400Combined counties – – – 16,200 2.75 44,400West Central 182,700 3.40 616,700 150,500 3.20 478,900Adams 6,410 2.35 15,000 4,680 2.70 12,700Green Lake – – – – – –Juneau 8,160 3.55 28,900 – – –Marquette 10,800 3.00 32,400 – – –Portage 21,900 3.05 67,000 16,200 2.70 43,600Waupaca 23,000 3.05 69,900 15,600 3.55 55,600Waushara – – – 7,350 2.70 19,900Wood 12,300 2.90 35,400 – – –Combined counties 18,630 2.95 54,700 32,470 2.85 92,100Central 101,200 3.00 303,300 76,300 2.95 223,900Brown – – – – – –Calumet – – – – – –Door – – – 13,200 2.65 35,300Fond Du Lac 22,400 2.40 53,600 – – –Kewaunee – – – – – –Manitowoc 19,300 3.45 66,900 36,400 2.60 94,600Outagamie – – – – – –Sheboygan – – – 17,500 3.40 59,200

Wisconsin 2018 Agricultural Statistics 29
ALFALFA HAY (DRY): ACREAGE, YIELD, AND PRODUCTION, BY COUNTY, WISCONSIN, 2016-2017 1/County and
district2016 2017
Harvested Yield per acre Production Harvested Yield per acre ProductionAcres Tons Acres Tons
Winnebago – – – – – –Combined counties 85,100 3.05 261,000 82,200 3.00 248,300East Central 126,800 3.00 381,500 149,300 2.95 437,400Crawford 15,100 3.00 45,600 13,000 3.35 43,600Grant 42,200 3.80 159,700 33,300 3.60 119,900Iowa 29,700 3.90 115,400 18,000 4.00 72,400Lafayette 26,000 4.20 109,400 – – –Richland 23,900 3.40 80,800 – – –Sauk 30,800 3.70 114,200 23,600 2.80 66,600Vernon 36,300 3.05 109,900 30,200 2.85 85,400Combined counties – – – 35,000 3.30 115,900Southwest 204,000 3.60 735,000 153,100 3.30 503,800Columbia 19,800 3.95 77,900 17,400 2.80 48,800Dane 25,200 3.70 92,900 24,300 3.00 72,300Dodge 22,500 3.45 78,000 15,300 3.40 52,300Green 22,900 3.10 70,900 28,400 3.50 99,600Jefferson 11,300 3.55 40,300 – – –Rock 11,600 3.70 43,000 – – –Combined counties – – – 26,900 3.45 93,400South Central 113,300 3.55 403,000 112,300 3.25 366,400Kenosha – – – – – –Milwaukee – – – – – –Ozaukee – – – 4,460 3.50 15,500Racine 5,630 2.95 16,500 5,560 2.90 16,000Walworth – – – – – –Washington 9,930 2.65 26,100 8,280 2.35 19,500Waukesha 5,360 3.10 16,500 4,590 2.80 12,800Combined counties 16,380 3.25 52,900 9,110 2.50 22,800Southeast 37,300 3.00 112,000 32,000 2.70 86,600Wisconsin 1,000,000 3.20 3,200,000 860,000 3.00 2,580,0001/ Some counties were not published to avoid disclosure of individual operations. Unpublished data is included in “combined counties.”
Price
Clark
Dane
Polk
Grant
Vilas
Iron
Bayfield
Sawyer
Rusk
Oneida
Marathon
Douglas
Forest
Taylor
Sauk
Dunn
Iowa
Oconto
Rock
Dodge
Wood
BarronLincoln
Jackson
Ashland
Burnett
Monroe
Vernon
Chippewa
PortageBuffalo
Langlade
Green
Pierce
St. Croix
Columbia
Brown
Lafayette
Waushara
Eau Claire
Racine
Marinette
Juneau
Shawano
Adams
Door
Washburn
Waupaca
RichlandCrawford
Jefferson
Fond du Lac
Walworth
OutagamieTrempealeau
Florence
Manitowoc
Waukesha
Winnebago
La CrosseCalumet
MarquetteSheboygan
Pepin
Washington
Green Lake
Kewaunee
Menominee
Kenosha
Ozaukee
Milwaukee
Thousand TonsNot published
Less than 20.0
20.0 - 39.9
40.0 - 59.9
60.0 or more
ALFALFA HAY (DRY)Production by County - 2017
0.0
0.5
1.0
1.5
2.0
2.5
3.0
3.5
4.0
4.5
2008 2009 2010 2011 2012 2013 2014 2015 2016 2017
HAY ALFALFA (DRY) PRODUCTIONWisconsin, 2008-2017
MillionTons

30 Wisconsin 2018 Agricultural Statistics
OTHER HAY (DRY): ACREAGE, YIELD, AND PRODUCTION, BY COUNTY, WISCONSIN, 2016-2017 1/County and
district2016 2017
Harvested Yield per acre Production Harvested Yield per acre ProductionAcres Tons Acres Tons
Barron – – – – – –Bayfield 7,720 1.25 9,700 13,500 1.95 26,000Burnett 1,500 1.50 2,220 3,190 1.70 5,400Chippewa – – – – – –Douglas 5,880 1.40 8,100 9,100 1.85 16,800Polk 3,040 2.15 6,500 – – –Rusk – – – 17,100 2.05 35,100Sawyer 2,840 1.70 4,840 4,510 1.95 8,700Washburn 2,450 1.80 4,440 3,950 1.85 7,300Combined counties 24,770 2.10 51,800 20,950 2.15 44,700Northwest 48,200 1.80 87,600 72,300 2.00 144,000Ashland 6,640 1.65 11,100 10,000 1.85 18,400Clark – – – – – –Iron – – – 2,550 1.35 3,500Lincoln 4,510 1.80 8,100 7,290 2.00 14,700Marathon – – – – – –Oneida 2,380 1.60 3,800 3,620 1.50 5,500Price 10,800 2.10 22,500 14,000 1.85 26,000Taylor – – – – – –Vilas 600 1.15 700 740 1.10 800Combined counties 53,270 2.25 120,100 52,200 2.60 135,600North Central 78,200 2.15 166,300 90,400 2.25 204,500Florence – – – 2,400 1.25 3,050Forest 1,910 1.40 2,660 2,860 1.70 4,810Langlade – – – – – –Marinette 3,310 1.50 4,960 – – –Menominee – – – – – –Oconto 4,770 2.45 11,700 – – –Shawano – – – – – –Combined counties 12,610 2.25 28,380 18,140 2.20 40,140Northeast 22,600 2.10 47,700 23,400 2.05 48,000Buffalo – – – – – –Dunn – – – – – –Eau Claire – – – – – –Jackson – – – – – –La Crosse – – – – – –Monroe – – – – – –Pepin – – – – – –Pierce – – – – – –St. Croix 4,550 2.70 12,300 – – –Trempealeau – – – – – –Combined counties 30,850 2.20 67,300 42,500 2.40 102,300West Central 35,400 2.25 79,600 42,500 2.40 102,300Adams – – – – – –Green Lake 1,590 2.70 4,300 – – –Juneau – – – – – –Marquette – – – – – –Portage – – – – – –Waupaca – – – – – –Waushara 1,620 2.60 4,210 – – –Wood 7,090 2.25 15,800 – – –Combined counties 15,400 2.10 32,090 31,200 2.30 72,000Central 25,700 2.20 56,400 31,200 2.30 72,000Brown – – – – – –Calumet – – – – – –Door – – – – – –Fond Du Lac – – – – – –Kewaunee – – – – – –Manitowoc – – – – – –Outagamie – – – – – –Sheboygan – – – – – –Winnebago 2,150 3.50 7,500 – – –

Wisconsin 2018 Agricultural Statistics 31
OTHER HAY (DRY): ACREAGE, YIELD, AND PRODUCTION, BY COUNTY, WISCONSIN, 2016-2017 1/County and
district2016 2017
Harvested Yield per acre Production Harvested Yield per acre ProductionAcres Tons Acres Tons
Combined counties 37,150 2.55 94,400 42,600 2.45 104,500East Central 39,300 2.60 101,900 42,600 2.45 104,500Crawford – – – – – –Grant – – – – – –Iowa – – – – – –Lafayette – – – – – –Richland – – – – – –Sauk – – – – – –Vernon – – – 8,720 2.15 18,700Combined counties 40,900 2.30 94,200 37,080 2.65 98,400Southwest 40,900 2.30 94,200 45,800 2.55 117,100Columbia – – – – – –Dane – – – – – –Dodge – – – – – –Green – – – – – –Jefferson – – – – – –Rock – – – – – –South Central 29,100 2.30 67,200 30,700 2.55 78,300Kenosha – – – 950 2.55 2,400Milwaukee – – – – – –Ozaukee – – – – – –Racine – – – – – –Walworth – – – – – –Washington – – – – – –Waukesha 860 1.55 1,330 580 1.80 1,050Combined counties 9,740 2.45 23,770 9,570 2.40 22,850Southeast 10,600 2.35 25,100 11,100 2.35 26,300Wisconsin 330,000 2.20 726,000 390,000 2.30 897,0001/ Some counties were not published to avoid disclosure of individual operations. Unpublished data is included in “combined counties.”
Price
Clark
Dane
Polk
Grant
Vilas
Iron
Bayfield
Sawyer
Rusk
Oneida
Marathon
Douglas
Forest
Taylor
Sauk
Dunn
Iowa
Oconto
Rock
Dodge
Wood
BarronLincoln
Jackson
Ashland
Burnett
Monroe
Vernon
Chippewa
PortageBuffalo
Langlade
Green
Pierce
St. Croix
Columbia
Brown
Lafayette
Waushara
Eau Claire
Racine
Marinette
Juneau
Shawano
Adams
Door
Washburn
Waupaca
RichlandCrawford
Jefferson
Fond du Lac
Walworth
OutagamieTrempealeau
Florence
Manitowoc
Waukesha
Winnebago
La CrosseCalumet
MarquetteSheboygan
Pepin
Washington
Green Lake
Kewaunee
Menominee
Kenosha
Ozaukee
Milwaukee
Thousand TonsNot published
Less than 5.0
5.0 - 9.9
10.0 - 19.9
20.0 or more
ALL OTHER HAY (DRY)Production by County - 2017
0100200300400500600700800900
1,000
2008 2009 2010 2011 2012 2013 2014 2015 2016 2017
ALL OTHER HAY (DRY) PRODUCTIONWisconsin, 2008-2017
ThousandTons

32 Wisconsin 2018 Agricultural Statistics
FORAGE AND HAY SUMMARY: ACREAGE, YIELD, PRODUCTION, AND VALUE, WISCONSIN, 2013-2017
Year Harvested Yield per acre ProductionValue
Per ton Total1,000 acres Tons 1,000 tons Dollars 1,000 dollars
ALL FORAGE 1/ (DRY EQUIVALENT)
2013 2,650 2.65 7,022 – –2014 2,700 3.54 9,570 – –2015 2,600 3.45 8,967 – –2016 2,400 3.59 8,607 – –2017 2,190 3.47 7,598 – –
ALL ALFALFA FORAGE 1/ (DRY EQUIVALENT)2013 2,000 2.88 5,766 – –2014 2,200 3.84 8,455 – –2015 2,150 3.57 7,685 – –2016 1,950 3.80 7,406 – –2017 1,700 3.75 6,369 – –
ALL HAY (DRY ONLY)2013 1,600 2.35 3,760 192.00 722,6802014 1,640 2.97 4,866 143.00 697,7162015 1,510 2.70 4,073 92.50 375,6252016 1,330 2.95 3,926 85.00 332,5822017 1,250 2.78 3,477 105.00 361,955
ALFALFA HAY (DRY ONLY)2013 1,100 2.60 2,860 208.00 594,880 2014 1,250 3.30 4,125 151.00 622,875 2015 1,200 2.80 3,360 98.00 329,280 2016 1,000 3.20 3,200 91.00 291,200 2017 860 3.00 2,580 113.00 291,540
ALL OTHER HAY 2/ (DRY ONLY)2013 500 1.80 900 142.00 127,8002014 390 1.90 741 101.00 74,8412015 310 2.30 713 65.00 46,3452016 330 2.20 726 57.00 41,382 2017 390 2.30 897 78.50 70,415 1/Includes all acreage harvested for dry hay and/or haylage and all production from those acres on a dry equivalent basis. 2/Includes clover, timothy, and other types.
PRICES RECEIVED BY FARMERS FOR HAY: BY MONTH, WISCONSIN, 2013-2017Year Jan. Feb. March April May June July Aug. Sept. Oct. Nov. Dec.
Dollars per tonALFALFA HAY (BALED)
2013 240.00 260.00 255.00 260.00 275.00 275.00 195.00 160.00 200.00 200.00 200.00 205.002014 200.00 195.00 190.00 170.00 175.00 185.00 135.00 140.00 148.00 159.00 170.00 165.002015 133.00 125.00 125.00 124.00 136.00 96.00 88.00 111.00 107.00 102.00 101.00 98.002016 107.00 83.00 92.00 99.00 101.00 95.00 80.00 79.00 88.00 117.00 100.00 94.002017 82.00 92.00 91.00 93.00 120.00 113.00 103.00 97.00 119.00 121.00 138.00 127.00
ALL OTHER HAY (BALED)2013 160.00 170.00 175.00 175.00 215.00 215.00 155.00 120.00 120.00 120.00 130.00 135.002014 132.00 129.00 128.00 108.00 115.00 128.00 105.00 100.00 103.00 90.00 95.00 95.002015 100.00 88.00 88.00 79.00 86.00 69.00 76.00 54.00 64.00 57.00 73.00 68.002016 74.00 54.00 58.00 65.00 59.00 64.00 46.00 46.00 59.00 51.00 70.00 67.002017 58.00 67.00 66.00 70.00 66.00 74.00 70.00 79.00 70.00 92.00 103.00 94.00

Wisconsin 2018 Agricultural Statistics 33
PRICES RECEIVED BY FARMERS FOR POTATOES: BY MONTHS, WISCONSIN, 2013-2017 Year Jan. Feb. March April May June July August Sept. Oct. Nov. Dec
Dollars per hundredweightALL POTATOES 1/
2013 7.80 8.60 10.20 9.30 8.65 9.45 3/ 14.70 10.30 9.70 9.90 10.302014 9.55 9.45 10.60 10.20 9.45 11.60 3/ 10.50 9.50 8.95 9.20 9.652015 10.00 11.20 11.20 12.00 10.90 10.30 3/ 10.80 9.25 8.60 9.60 9.102016 9.20 9.65 10.80 9.70 10.10 10.20 3/ 13.90 13.30 12.90 12.90 12.402017 9.00 9.15 10.20 10.70 9.10 8.30 3/ 4/ 4/ 4/ 4/ 4/
POTATOES, FRESH 2/2013 6.20 7.00 6.65 5.40 5.20 3/ 3/ 19.50 12.40 10.50 10.70 10.00 2014 10.00 11.20 11.00 11.00 10.50 10.70 3/ 11.00 10.30 9.20 9.40 9.50 2015 9.85 10.50 9.90 10.60 10.70 10.70 3/ 11.00 9.50 8.90 9.70 9.002016 8.90 8.95 8.70 8.80 10.85 11.30 3/ 15.70 14.50 14.50 14.50 14.502017 10.30 9.10 8.45 9.50 9.70 9.70 3/ 4/ 4/ 4/ 4/ 4/
POTATOES, PROCESSING2013 10.80 9.20 12.10 9.85 10.40 3/ 3/ 7.75 8.05 9.15 9.20 10.60 2014 9.40 7.90 9.60 9.10 8.60 12.00 3/ 10.00 8.80 8.60 9.00 9.80 2015 10.20 9.45 8.90 9.55 9.65 9.65 3/ 9.90 8.55 8.05 9.35 8.90 2016 9.30 9.35 9.35 9.45 9.50 9.60 3/ 10.00 10.00 8.20 8.20 8.00 2017 7.95 7.95 7.95 7.95 7.95 7.95 3/ 4/ 4/ 4/ 4/ 4/1/Average price of potatoes sold for all uses, including table stock, processing, seed, and livestock feed. 2/Fresh market prices only. 3/Insufficient sales data to establish price. 4/State-level estimates for potato prices were discontinued as of August 2017.
POTATOES: ACREAGE, YIELD, PRODUCTION, AND VALUE, WISCONSIN, 2013-2017Year Planted Harvested Yield per acre Production Value
Per cwt. TotalAcres Cwt. 1,000 cwt. Dollars 1,000 dollars
2013 62,500 62,000 420 26,040 10.40 270,8162014 65,000 64,000 410 26,240 10.40 272,8962015 63,000 62,500 445 27,813 9.70 269,786 2016 65,000 64,000 435 27,840 11.60 322,944 2017 68,000 67,000 435 29,145 12.10 352,655
DRY EDIBLE BEANS: ACREAGE, YIELD, PRODUCTION, AND VALUE, WISCONSIN, 2013-2017 1/Year Planted Harvested Yield per acre Production Value
Per cwt. TotalAcres Pounds 1,000 cwt Dollars/cwt 1,000 dollars
2013 5,400 5,400 1,810 98 55.00 5,3902014 7,900 7,900 2,480 196 54.00 10,5842015 7,900 7,900 2,030 160 58.00 9,280 2016 (NA) (NA) (NA) (NA) (NA) (NA) 2017 (NA) (NA) (NA) (NA) (NA) (NA) (NA) Not available. 1/ As of 2016, NASS will no longer set state-level estimates for Wisconsin dry bean production.
PEPPERMINT FOR OIL: HARVESTED ACREAGE, YIELD, PRODUCTION, AND VALUE, WISCONSIN, 2013-2017Year Harvested Yield per acre Production Value
Per pound TotalAcres Pounds 1,000 lbs Dollars 1,000 dollars
2013 3,000 57 171 24.60 4,2072014 (D) (D) (D) (D) (D)2015 (D) (D) (D) (D) (D)2016 3,100 59 183 24.90 4,557 2017 2,700 73 197 18.50 3,645 (D) Withheld to avoid disclosing data for individual operations.

34 Wisconsin 2018 Agricultural Statistics
VEGETABLES: ACREAGE, YIELD, PRODUCTION, AND VALUE, WISCONSIN, 2013-2015Year Planted Harvested Yield per acre Production Value 1/
Per Ton TotalAcres Tons Dollars 1,000 dollars
SWEET CORN, PROCESSING2013 70,800 66,500 8.78 583,960 150.00 87,5692014 69,900 65,800 8.24 542,160 96.20 52,1772015 64,700 60,700 8.08 490,230 87.90 43,085
SNAP BEANS, PROCESSING2013 65,500 59,800 4.99 298,570 340.00 101,4522014 66,000 64,100 4.87 312,280 185.00 57,6332015 69,200 65,300 5.05 329,530 202.00 66,472
GREEN PEAS, PROCESSING2013 37,800 36,000 2.10 75,550 521.00 39,3602014 37,700 36,600 1.93 70,640 378.00 26,6852015 36,000 34,300 2.37 81,120 334.00 27,110
CARROTS, PROCESSING2013 4,200 4,100 28.50 116,850 106.00 12,3622014 3,800 3,700 28.95 107,100 89.30 9,5692015 3,900 3,800 25.72 97,730 98.80 9,652
CUCUMBERS FOR PICKLES2013 6,000 5,900 6.51 38,410 288.00 11,0622014 5,600 5,400 6.26 33,800 297.00 10,0392015 5,600 5,400 6.09 32,890 290.00 9,538
Acres Cwt. 1,000 cwt. Dollars 1,000 DollarsCABBAGE, FRESH
2013 3,200 3,100 280 868 16.40 14,2352014 3,000 2,900 250 725 14.20 10,2952015 (D) (D) (D) (D) (D) (D)
ONIONS 2/2013 1,800 1,800 450 810 16.40 12,4802014 1,800 1,700 465 791 17.50 13,0732015 1,600 1,500 430 645 16.60 10,624
SWEET CORN, FRESH2013 4,700 4,200 101 424 29.60 12,5502014 3,900 3,500 112 392 25.60 10,0352015 3,900 3,700 129 477 29.30 13,976(D) Withheld to avoid disclosing data for individual operations. 1/Value per unit is defined as "all payments to growers, plus the costs of materials and services provided to get the raw commodity to the plant receiving door." 2/ Summer storage onions only.
VEGETABLES ACREAGE, YIELD, PRODUCTION, AND PRICE BY UTILIZATION, WISCONSIN: 2016-2017
Year Planted Harvested Yield per acre Utilized production Price Value of utilized production
All All All Fresh Processed All Fresh Processed All Fresh Processed All
Acres Cwt. 1,000 cwt. Tons 1,000
cwt.Dollars per cwt.
Dollars per ton
Dollars per cwt. 1,000 dollars
CABBAGE2016 6,100 6,000 665 (D) (D) 3,990 (D) (D) 11.90 (D) (D) 47,5832017 6,100 6,000 550 (D) (D) 3,300 (D) (D) 15.30 (D) (D) 50,490
CARROTS2016 4,600 4,500 500 14 111,825 2,250 110.00 81.40 4.71 1,485 9,103 10,5882017 4,500 4,500 560 3 125,622 2,515 111.00 68.00 3.51 278 8,542 8,820
CUCUMBERS2016 5,600 5,500 125 15 33,619 688 51.00 220.00 11.90 770 7,396 8,1662017 5,700 5,500 125 (D) (D) 686 (D) (D) 15.70 (D) (D) 10,749
GREEN PEAS2016 28,700 27,100 47 3 63,558 1,274 169.00 198.00 10.20 423 12,584 13,0072017 23,800 22,500 43 13 47,746 968 326.00 215.00 14.80 4,145 10,218 14,363
PUMPKINS2016 2,100 1,800 110 186 - 186 18.90 - 18.90 3,517 - 3,5172017 1,300 900 150 127 - 127 27.80 - 27.80 3,542 - 3,542
SNAP BEANS2016 71,800 66,600 110 7 365,934 7,326 35.30 124.00 6.23 258 45,376 45,6342017 66,600 62,500 105 105 322,875 6,563 43.80 110.00 6.11 4,599 35,516 40,115
SWEET CORN2016 61,500 60,300 170 574 483,847 10,251 27.80 68.20 4.78 15,960 32,998 48,9582017 56,700 54,500 176 403 458,977 9,582 30.80 70.00 4.65 12,409 32,128 44,537- Represents zero. (D) Withheld to avoid disclosing data for individual operations.

Wisconsin 2018 Agricultural Statistics 35
APPLES AND CHERRIES: ACREAGE, YIELD, AND VALUE, WISCONSIN, 2013-2017Year Bearing
acreageYield per acre 1/
Production Price per pound Value of productionTotal Utilized Fresh Processed All Fresh Processed All
Acres Pounds Million pounds Dollars 1,000 dollarsAPPLES
2013 4,000 12,000 48.0 46.0 0.557 0.109 0.508 22,837 545 23,3822014 4,000 13,500 54.0 51.0 0.718 0.096 0.612 30,371 831 31,2022015 4,000 12,900 51.5 48.1 0.680 0.125 0.578 26,724 1,101 27,8252016 4,000 10,300 41.0 39.5 0.636 0.207 0.552 20,225 1,594 21,8192017 4,000 12,300 49.0 47.9 0.668 0.145 0.549 24,716 1,581 26,297
CHERRIES, TART2013 2,000 6,150 12.3 12.1 1.570 0.326 0.357 471 3,847 4,3182014 1,800 6,830 12.3 12.2 1.020 0.332 0.394 1,122 3,686 4,8082015 1,700 5,470 9.3 9.2 0.738 0.308 0.331 369 2,680 3,0492016 1,700 8,000 13.6 13.5 0.963 0.297 0.302 96 3,980 4,0762017 1,500 7,530 11.3 9.4 1.380 0.212 0.224 138 1,971 2,1091/Yield is based on total on total production, which includes unharvested production and fruit harvested but not sold due to marketing conditions.
CRANBERRIES: ACREAGE, YIELD, PRODUCTION AND VALUE, WISCONSIN, 2013-2017Year Harvested Yield per
acreProduction Utilization Value
Total Utilized Fresh Processed Per barrel 1/ TotalAcres Barrels Dollars 1,000 dollars
2013 21,100 282.8 6,015,600 5,967,600 192,600 5,775,000 32.00 190,6792014 20,700 239.5 5,022,000 4,957,000 165,000 4,792,000 27.90 138,3702015 20,200 237.3 4,856,000 4,793,000 185,000 4,608,000 29.20 140,1462016 21,100 288.2 6,130,000 6,081,000 202,000 5,879,000 29.20 177,3472017 20,600 259.5 5,372,000 5,345,000 134,000 5,211,000 29.20 156,1411/Weighted average of co-op and independent sales. Co-op prices represent pool proceeds less returns for processing non-cranberry products, capital stock dividends, capital stock retains, and other retains.
STRAWBERRIES: ACREAGE, YIELD, PRODUCTION, AND VALUE, WISCONSIN, 2013-2017 1/Year Planted Harvested Yield per
acre Production ValuePer cwt. Total
Acres Cwt. Dollars 1,000 dollars2013 840 720 54 39,000 165.00 6,4352014 820 630 60 38,000 165.00 6,2702015 790 610 55 34,000 170.00 5,7802016 (NA) (NA) (NA) (NA) (NA) (NA) 2017 (NA) (NA) (NA) (NA) (NA) (NA) (NA) Not available. 1/ As of 2016, NASS will no longer set state-level estimates for Wisconsin strawberry production.
MAPLE SYRUP: TAPS, YIELD, PRODUCTION, AND VALUE, WISCONSIN, 2013-2017
Year Taps Yield per tap Production
Average price per
gallon
Value of Production
Method of sale Average season length Retail Wholesale
container Bulk
1,000 taps Gallons 1,000 gallons Dollars 1,000 dollars Percent Days2013 740 0.358 265 37.40 9,911 21 17 62 292014 700 0.286 200 33.40 6,680 18 19 63 232015 760 0.283 215 33.10 7,117 19 12 69 232016 765 0.307 235 33.50 7,873 22 11 67 292017 735 0.272 200 31.40 6,280 16 13 71 29
36 Wisconsin 2018 Agricultural Statistics
Livestock & DairyIn 2017, Wisconsin produced 30.3 billion pounds of milk, a 1 percent increase over the previous year. The number of milk cows declined slightly, averaging 1.28 million head. Milk per cow rose from 23,542 pounds in 2016 to 23,725 in 2017. Milk prices began the year at $19.30 per hundredweight (cwt.) in January, before declining gradually to $17.10 in July. Prices then rose to $19.10 per cwt by November, but fell sharply in December and ended the year at $17.80 per cwt.
Wisconsin maintained its status as the nation’s largest cheese producer in 2017, with 27 percent of the nation’s production. From 2016 to 2017, the state’s total cheese production rose 4 percent to 3.37 billion pounds. Italian cheese production was up 4 percent to 1.70 billion pounds, comprising 51 percent of Wisconsin’s total production. Production of American cheeses rose 6 percent to 1.02 billion pounds. Specialty cheese production grew from 774 million pounds in 2016 to 799 million pounds in 2017, accounting for 24 percent of the state’s total cheese production.
The total inventory of cattle and calves on January 1, 2018 was 3.50 million head, down 50,000 head from the previous year. The number of milk cows fell 5,000 head from the previous year, to 1,275,000 head. The number of beef cows were also down 5,000 head to 285,000 head. On the U.S. level, slaughter prices stayed at $120.00 per cwt. for cattle and rose to $165.00 per cwt. for calves. As a result, Wisconsin’s value of production rose 5 percent to $1.69 billion.
As of December 1, 2017, hog inventory totaled 305,000 head, 30,000 less than a year earlier. Pork production totaled 165 million pounds (live weight basis), up 16 percent. Average price per cwt. on the U.S. level increased 8 percent to $53.60. Wisconsin’s value of production rose 27 percent, from $85 million in 2016 to $108 million in 2017.
Sheep and lamb inventory was 75,000 head as of January 1, 2018, down 1,000 head from the previous year. Wool production fell 10,000 pounds to 330,000 pounds total, and the average price for wool fell to $0.65 per pound. Milk goat inventory rose 3,000 head to 47,000 head in total. Wisconsin continues to have the largest number of milk goats in the nation.
Egg production increased 9 percent to 1.76 billion eggs for the year ending November 30, 2017. There were 6.08 million layers, with an average of 289 eggs per layer. Egg prices rose 20 percent to $0.71 per dozen in 2017. The value of production was up 31 percent to $103 million.
In 2017, broiler production was 53.8 million head, down less than one percent. The price of broilers was up 13 percent to 54 cents per pound. The increase in broiler price led to a 13 percent increase in value of production.
The total sales value of trout rose 9 percent in 2017 to 1.69 million dollars. Trout distributed for restoration, conservation, or recreational purposes were valued at 2.20 million dollars, down 19 percent from the previous year.
Wisconsin produced 1.09 million mink pelts in 2017, down 5 percent from 2016. Wisconsin produced more mink pelts than any other state, with 33 percent of the nation’s total production. The U.S. average price per pelt rose 5 percent to $36.30. The total value of pelts produced in Wisconsin was $39.6 million.
Honey production fell 11 percent, from 3.35 million pounds in 2016 to 2.97 million pounds in 2017. Honey-producing colonies fell by 1,000 to 53,000. Yield per colony decreased 10 percent, from an average of 62 pounds in 2016 to an average of 56 pounds in 2017. The average price of honey rose 10 cents to $2.77 per pound.

Wisconsin 2018 Agricultural Statistics 37
LIVESTOCK AND DAIRY RECORDS IN WISCONSIN AGRICULTURE
Commodity Unit 2017 Record high Record low Year
estimate startedQuantity Year 1/ Quantity Year 1/
Cattle, all, Jan. 1 Head 3,500,000 2/ 4,640,000 1975 642,000 1867 1867Milk cows, Jan. 1 Head 1,275,000 2/ 2,585,000 1946 245,000 1867 1867Beef cows, Jan. 1 Head 285,000 2/ 350,000 1976 16,000 1939 1920 Milk production Mil. lbs. 30,320 30,320 2017 2,612 1889 1889Milk per cow per year Pounds 23,725 23,725 2017 5,100 1934 1933
Hogs, all, Dec. 1 Head 305,000 2,516,000 1943 300,000 2014 1866 Sheep & lambs, Jan. 1 Head 75,000 2/ 543,000 1932 75,000 2017 1920
Milk goats, Jan. 1 Head 47,000 2/ 50,000 2011 35,000 2008 2008 Layers, annual average Head 6,080,000 18,848,000 1944 3,175,000 1993 1924Egg production Mil. eggs 1,759 2,411 1944 820 1993 1925
Total cheese Thous. lbs. 3,365,897 3,365,897 2017 275,528 1922 1920American cheese Thous. lbs. 1,016,569 1,158,909 1983 215,400 1922 1920Italian cheese Thous. lbs. 1,702,351 1,702,351 2017 124 1925 1920Hispanic cheese Thous. lbs. 91,407 91,407 2017 14,447 1997 1997Muenster cheese Thous. lbs. 61,690 81,957 1987 5,044 1931 1931Swiss cheese Thous. lbs. 16,664 53,581 1988 16,651 2015 19701/These are the latest years that records were achieved. In some cases, these records were equaled in several earlier years. 2/Inventory as of January 1, 2017.
LIVESTOCK: NUMBER OF HEAD AND VALUE, WISCONSIN, JANUARY 1, 2018
Commodity Head Value per head Total value
1,000 Dollars 1,000 dollarsCattle and calves, all 3,500 1,140.00 3,990,000Hogs and pigs, all 1/ 305 100.00 30,000Sheep and lambs, all 75 210.00 15,750Chickens, total 1/ 2/ 8,514 2.40 20,4341/December 1 previous year. 2/Does not include commercial broilers.

38 Wisconsin 2018 Agricultural Statistics
MILK COWS: PRODUCTION PER COW AND TOTAL MILK PRODUCTION, BY COUNTY, WISCONSIN, 2016-2017County 2016 2017
Number of cows 1/ Milk per cow Production Number of cows 1/ Milk per cow ProductionNumber Pounds 1,000 lbs. Number Pounds 1,000 lbs.
Adams 2/ - - - - - -Ashland 2,200 22,200 48,840 2,200 22,300 49,060Barron 22,500 18,600 418,500 22,000 18,700 411,400Bayfield 1,600 17,800 28,480 1,500 18,300 27,450Brown 45,500 27,700 1,260,350 45,500 27,800 1,264,900Buffalo 17,500 20,700 362,250 17,400 20,800 361,920Burnett 3,500 18,300 64,050 3,500 18,400 64,400Calumet 31,000 27,200 843,200 30,500 27,300 832,650Chippewa 26,000 19,400 504,400 26,000 19,600 509,600Clark 68,000 22,400 1,523,200 68,000 22,600 1,536,800Columbia 16,000 26,100 417,600 16,300 26,300 428,690Crawford 7,000 18,000 126,000 7,000 18,200 127,400Dane 55,000 27,400 1,507,000 55,000 27,500 1,512,500Dodge 40,000 24,900 996,000 39,500 25,200 995,400Door 12,000 20,900 250,800 12,000 21,000 252,000Douglas 300 16,800 5,040 400 16,900 6,760Dunn 19,600 20,700 405,720 19,500 21,000 409,500Eau Claire 9,100 18,200 165,620 9,000 18,300 164,700Florence 2/ - - - - - -Fond du Lac 59,000 26,000 1,534,000 59,000 26,300 1,551,700Forest 2/ - - - - - -Grant 44,000 21,500 946,000 43,500 21,800 948,300Green 29,000 23,700 687,300 29,000 23,700 687,300Green Lake 7,800 22,700 177,060 8,000 23,000 184,000Iowa 22,500 19,600 441,000 22,500 19,800 445,500Iron 2/ - - - - - -Jackson 13,400 20,700 277,380 13,300 20,800 276,640Jefferson 14,300 24,600 351,780 14,300 24,800 354,640Juneau 11,000 21,200 233,200 11,000 21,300 234,300Kenosha 3,500 23,700 82,950 3,500 23,900 83,650Kewaunee 48,000 26,500 1,272,000 48,000 26,600 1,276,800La Crosse 8,800 18,500 162,800 8,700 18,600 161,820Lafayette 30,500 20,800 634,400 30,500 21,000 640,500Langlade 7,500 22,400 168,000 7,400 22,700 167,980Lincoln 3,900 20,800 81,120 4,000 20,900 83,600Manitowoc 54,000 27,700 1,495,800 55,000 27,800 1,529,000Marathon 61,000 22,200 1,354,200 61,000 22,400 1,366,400Marinette 13,800 24,600 339,480 14,000 24,900 348,600Marquette 5,500 25,600 140,800 5,500 25,900 142,450Menominee 2/ - - - - - -Milwaukee 2/ - - - - - -Monroe 23,500 20,800 488,800 23,500 21,000 493,500Oconto 20,000 24,900 498,000 20,000 25,100 502,000Oneida 2/ - - - - - -Outagamie 37,000 27,500 1,017,500 36,500 27,500 1,003,750Ozaukee 10,000 25,500 255,000 10,000 25,600 256,000Pepin 7,700 24,900 191,730 7,600 25,000 190,000Pierce 15,100 20,900 315,590 15,000 21,200 318,000Polk 14,600 19,300 281,780 14,500 19,400 281,300Portage 12,600 22,200 279,720 12,500 22,300 278,750Price 4,800 19,800 95,040 4,800 19,900 95,520Racine 3,500 25,400 88,900 3,400 25,600 87,040

Wisconsin 2018 Agricultural Statistics 39
MILK COWS: PRODUCTION PER COW AND TOTAL MILK PRODUCTION, BY COUNTY, WISCONSIN, 2016-2017County 2016 2017
Number of cows 1/ Milk per cow Production Number of cows 1/ Milk per cow ProductionNumber Pounds 1,000 lbs. Number Pounds 1,000 lbs.
Richland 14,500 20,200 292,900 14,600 20,500 299,300Rock 17,700 24,500 433,650 17,600 24,800 436,480Rusk 9,800 19,400 190,120 9,700 19,500 189,150Sauk 24,000 21,000 504,000 24,000 21,200 508,800Sawyer 3,300 20,100 66,330 3,200 20,400 65,280Shawano 36,000 24,800 892,800 37,000 25,100 928,700Sheboygan 28,500 26,600 758,100 28,000 26,700 747,600St. Croix 18,200 23,300 424,060 18,100 23,600 427,160Taylor 16,100 19,400 312,340 16,000 19,500 312,000Trempealeau 20,500 21,300 436,650 20,700 21,400 442,980Vernon 21,000 18,300 384,300 21,000 18,400 386,400Vilas 2/ - - - - - -Walworth 13,800 27,100 373,980 14,000 27,200 380,800Washburn 2,400 23,000 55,200 2,500 23,300 58,250Washington 15,200 26,000 395,200 15,500 26,200 406,100Waukesha 2,000 25,600 51,200 2,000 25,700 51,400Waupaca 22,500 23,600 531,000 22,000 23,800 523,600Waushara 6,400 24,500 156,800 6,500 24,800 161,200Winnebago 14,700 24,600 361,620 14,700 24,900 366,030Wood 18,000 21,800 392,400 17,900 22,000 393,800
Wisconsin 1,279,000 23,542 30,110,000 1,278,000 23,725 30,320,000 1/Average number of milk cows on farms during year, excluding heifers not yet fresh. 2/Not published, but included in state total. Source: Wisconsin Department of Agriculture, Trade, and Consumer Protection
Price
Clark
Dane
Grant
Polk
Vilas
Bayfield
Iron
Sawyer
Rusk
Marathon
Oneida
Douglas
Forest
Taylor
Sauk
Dunn
Iowa
Oconto
Dodge
Rock
Wood
BarronLincoln
Jackson
Ashland
Burnett
Monroe
Vernon
Chippewa
Buffalo
Langlade
Green
Pierce
St. Croix
Lafayette
Waushara
Eau Claire
Racine
Marinette
Juneau
Portage
Shawano
Adams
Door
Washburn
Columbia
Waupaca Brown
RichlandCrawford
Jefferson
Fond du Lac
Walworth
OutagamieTrempealeau
Florence
Manitowoc
Waukesha
Winnebago
La CrosseCalumet
SheboyganMarquette
Pepin
Washington
Green Lake
Kewaunee
Menominee
Kenosha
Ozaukee
Milwaukee
Million Lbs.Not published
Less than 200
200 - 399
400 - 599
600 or more
MILK PRODUCTIONby County - 2017
0
5
10
15
20
25
30
35
1927 1937 1947 1957 1967 1977 1987 1997 2007 2017
MILK PRODUCTIONWisconsin, 1927-2017
Billion pounds

40 Wisconsin 2018 Agricultural Statistics
WISCONSIN MILK COW HERDS BY TYPE OF MILK PRODUCED: NUMBER AND PERCENT BY COUNTY, 2018 1/
CountyTotal Grade A Total Grade B
Total herdsHerds Percent of total
Herds Percent of totalBulk Can Total
Adams 14 93% 1 0 1 7% 15Ashland 10 77% 3 0 3 23% 13Barron 162 94% 11 0 11 6% 173Bayfield 18 86% 3 0 3 14% 21Brown 138 98% 3 0 3 2% 141Buffalo 99 96% 1 3 4 4% 103Burnett 22 88% 2 1 3 12% 25Calumet 90 99% 1 0 1 1% 91Chippewa 249 97% 6 2 8 3% 257Clark 653 81% 25 133 158 19% 811Columbia 86 76% 0 27 27 24% 113Crawford 82 98% 2 0 2 2% 84Dane 226 98% 4 1 5 2% 231Dodge 222 100% 1 0 1 0% 223Door 60 94% 4 0 4 6% 64Douglas 6 100% 0 0 0 0% 6Dunn 131 96% 5 0 5 4% 136Eau Claire 63 56% 5 45 50 44% 113Florence 1 100% 0 0 0 0% 1Fond du Lac 222 100% 1 0 1 0% 223Forest 1 100% 0 0 0 0% 1Grant 341 94% 21 0 21 6% 362Green 163 73% 60 0 60 27% 223Green Lake 40 58% 1 28 29 42% 69Iowa 163 92% 14 0 14 8% 177Iron 4 100% 0 0 0 0% 4Jackson 87 67% 6 36 42 33% 129Jefferson 86 100% 0 0 0 0% 86Juneau 60 100% 0 0 0 0% 60Kenosha 21 100% 0 0 0 0% 21Kewaunee 137 95% 7 0 7 5% 144La Crosse 70 96% 3 0 3 4% 73Lafayette 205 90% 24 0 24 10% 229Langlade 39 95% 2 0 2 5% 41Lincoln 36 100% 0 0 0 0% 36Manitowoc 202 99% 3 0 3 1% 205Marathon 485 93% 35 0 35 7% 520Marinette 55 96% 2 0 2 4% 57Marquette 24 75% 0 8 8 25% 32Milwaukee 0 0% 1 0 1 100% 1Monroe 150 55% 2 120 122 45% 272Oconto 108 96% 5 0 5 4% 113Oneida 0 100% 0 0 0 0% 0Outagamie 162 96% 7 0 7 4% 169Ozaukee 40 98% 1 0 1 2% 41Pepin 50 98% 1 0 1 2% 51Pierce 115 97% 3 0 3 3% 118Polk 103 91% 10 0 10 9% 113Portage 87 93% 7 0 7 7% 94Price 45 88% 6 0 6 12% 51Racine 23 100% 0 0 0 0% 23Richland 90 89% 5 6 11 11% 101Rock 78 99% 1 0 1 1% 79Rusk 96 97% 3 0 3 3% 99Sauk 159 92% 14 0 14 8% 173Sawyer 15 100% 0 0 0 0% 15Shawano 254 96% 10 0 10 4% 264Sheboygan 125 97% 4 0 4 3% 129St. Croix 113 86% 6 13 19 14% 132Taylor 182 88% 20 4 24 12% 206Trempealeau 126 91% 11 2 13 9% 139Vernon 169 50% 8 158 166 50% 335

Wisconsin 2018 Agricultural Statistics 41
WISCONSIN MILK COW HERDS BY TYPE OF MILK PRODUCED: NUMBER AND PERCENT BY COUNTY, 2018 1/
CountyTotal Grade A Total Grade B
Total herdsHerds Percent of total
Herds Percent of totalBulk Can Total
Walworth 67 99% 1 0 1 1% 68Washburn 15 94% 1 0 1 6% 16Washington 84 100% 0 0 0 0% 84Waukesha 21 100% 0 0 0 0% 21Waupaca 135 94% 9 0 9 6% 144Waushara 34 94% 2 0 2 6% 36Winnebago 65 94% 4 0 4 6% 69Wood 169 94% 11 0 11 6% 180
Wisconsin 7,653 88% 409 587 996 12% 8,649 1/ Based on data from the Dairy Producer License list as of April 1, 2018, Division of Food and Recreational Safety, Wisconsin Department of Agriculture, Trade and Consumer Protection.
NUMBER OF MILK GOAT AND SHEEP HERDS: BY MONTHS, WISCONSIN, 2015-2018 1/
Month 2015 2016 2017 2018January 214 267 344 353February 248 268 350 372March 236 279 360 376April 245 299 369 369May 256 339 379 399June 288 311 381 397July 263 345 389 394August 269 341 389 392September 289 346 391October 264 345 386November 294 348 381December 291 340 3781/Based on data from the Dairy Producer License list as of the beginning of the month, Division of Food Recreational Safety, Wisconsin Department of Agriculture, Trade and Consumer Protection.
NUMBER OF MILK COW HERDS: BY MONTHS, WISCONSIN, 2015-2018 1/
Month 2015 2016 2017 2018January 10,081 9,695 9,304 8,801February 10,051 9,678 9,288 8,760March 10,028 9,618 9,261 8,719April 9,992 9,601 9,236 8,649May 9,929 9,566 9,167 8,595June 9,900 9,517 9,106 8,517July 9,878 9,494 9,046 8,463August 9,848 9,470 9,021 8,419September 9,825 9,447 8,970October 9,793 9,406 8,938November 9,737 9,360 8,877December 9,711 9,343 8,8391/Based on data from the Dairy Producer License list as of the beginning of the month, Division of Food and Recreational Safety, Wisconsin Department of Agriculture, Trade and consumer Protection.
Price
Clark
Dane
Grant
Polk
Vilas
Bayfield
Iron
Sawyer
Rusk
Marathon
Oneida
Douglas
Forest
Taylor
Sauk
Dunn
Iowa
Oconto
Dodge
Rock
Wood
BarronLincoln
Jackson
Ashland
Burnett
Monroe
Vernon
Chippewa
Buffalo
Langlade
Green
Pierce
St. Croix
Lafayette
Waushara
Eau Claire
Racine
Marinette
Juneau
Portage
Shawano
Adams
Door
Washburn
Columbia
Waupaca Brown
RichlandCrawford
Jefferson
Fond du Lac
Walworth
OutagamieTrempealeau
Florence
Manitowoc
Waukesha
Winnebago
La CrosseCalumet
SheboyganMarquette
Pepin
Washington
Green Lake
Kewaunee
Menominee
Kenosha
Ozaukee
Milwaukee
Total HerdsNone
Less than 100
100 - 199
200 - 299
300 or more
LICENSED MILK COW HERDSInventory by County
April 1, 2018

42 Wisconsin 2018 Agricultural Statistics
MILK COW NUMBERS: BY MONTHS, WISCONSIN, 2013-2017 1/Year Jan. Feb. March April May June July Aug. Sept. Oct. Nov. Dec. Average
1,000 head2013 1,270 1,270 2/ 2/ 2/ 2/ 1,272 1,272 1,272 1,272 1,271 1,270 1,2712014 1,270 1,270 1,270 1,269 1,269 1,270 1,271 1,271 1,272 1,272 1,273 1,274 1,2712015 1,275 1,275 1,276 1,278 1,280 1,280 1,280 1,280 1,279 1,279 1,280 1,280 1,2792016 1,280 1,280 1,280 1,279 1,279 1,278 1,278 1,278 1,277 1,277 1,278 1,279 1,2792017 1,280 1,280 1,280 1,279 1,279 1,278 1,278 1,278 1,277 1,277 1,277 1,276 1,2781/Excludes heifers not yet fresh. 2/ Data not collected due to sequestration.
MILK PRODUCTION PER COW: BY MONTHS, WISCONSIN, 2013-2017Year Jan. Feb. March April May June July Aug. Sept. Oct. Nov. Dec. Total
Pounds2013 1,870 1,705 1/ 1/ 1/ 1/ 1,820 1,835 1,745 1,795 1,725 1,805 21,693 2014 1,825 1,665 1,850 1,815 1,885 1,830 1,870 1,865 1,800 1,840 1,770 1,855 21,8692015 1,890 1,715 1,905 1,875 1,975 1,915 1,960 1,940 1,845 1,905 1,845 1,935 22,6972016 1,965 1,855 2,000 1,965 2,065 1,985 2,010 1,990 1,910 1,950 1,895 1,960 23,5422017 1,980 1,820 2,030 1,985 2,050 1,980 2,025 2,025 1,930 1,995 1,910 1,990 23,7251/ Data not collected due to sequestration.
MILK PRODUCTION: BY MONTHS, WISCONSIN, 2013-2017Year Jan. Feb. March April May June July Aug. Sept. Oct. Nov. Dec. Total
Million pounds2013 2,375 2,165 2,400 2,309 2,385 2,302 2,315 2,334 2,220 2,283 2,192 2,292 27,572 2014 2,318 2,115 2,350 2,303 2,392 2,324 2,377 2,370 2,290 2,340 2,253 2,363 27,795 2015 2,410 2,187 2,431 2,396 2,528 2,451 2,509 2,483 2,360 2,436 2,362 2,477 29,030 2016 2,515 2,374 2,560 2,513 2,641 2,537 2,569 2,543 2,439 2,490 2,422 2,507 30,1102017 2,534 2,330 2,598 2,539 2,622 2,530 2,588 2,588 2,465 2,548 2,439 2,539 30,320
MILK COWS AND PRODUCTION: UNITED STATES, 2013-2017
Year Milk cows 1/ Milk per cow 2/ Total production 2/1,000 head Pounds Million pounds
2013 9,224 21,816 201,2312014 9,257 22,259 206,0542015 9,314 22,396 208,5972016 9,325 22,778 212,4052017 9,392 22,941 215,4661/Average number of milk cows on farms during year, excluding heifers not yet fresh. 2/Excludes milk sucked by calves.
AVERAGE HERD SIZE: ALL DAIRY FARMS & DHI FARMS, WISCONSIN, SELECTED YEARS
Year All herds 1/ DHI herds 2/Number
1970 28.3 37.71975 34.2 43.41980 40.3 49.01985 45.8 50.11990 50.9 52.81995 53.2 60.22000 64.0 78.32005 80.8 98.82010 99.3 137.42015 129.2 180.62017 140.6 211.21/Prior to 2008, average herd size was calculated as number of milk cows divided by number of operations having at least one milk cow during the year. Starting in 2009, average herd size is calculated as number of milk cows divided by licensed milk cow herds. 2/ Source: AgSource Cooperative Services.

Wisconsin 2018 Agricultural Statistics 43
DISPOSITION OF MILK SOLD: WISCONSIN, SELECTED YEARS
Year Grade A Percent Grade B Percent TotalMil. lbs. Mil. lbs. Mil. lbs.
1955 4,950 32 10,509 68 15,4591960 6,334 37 10,576 63 16,9101965 7,688 42 10,450 58 18,1381970 9,667 54 8,189 46 17,8561975 11,652 63 6,703 37 18,3551980 15,425 71 6,433 29 21,8581985 18,265 75 5,965 25 24,2301990 20,512 86 3,338 14 23,8501995 20,818 92 1,854 8 22,6722000 21,598 94 1,379 6 22,9772005 21,709 96 905 4 22,6142010 25,244 98 515 2 25,7592015 28,483 99 288 1 28,7712017 29,775 99 301 1 30,076
MILK COW PRICES RECEIVED BY FARMERS: WISCONSIN, 2013-2017
Year Jan. April July Oct.Dollars per head
2013 1,480 1/ 1/ 1,4902014 1,570 1,900 2,100 2,2202015 2,160 2,080 2,090 2,0502016 1,910 1,910 1,820 1,7602017 1,730 1,710 1,650 1,6101/ Data not collected due to sequestration.
MILK PRICES AND MILKFAT CONTENT: WISCONSIN, 2017
Month Milk, all usesPrice Milkfat
Dollars per cwt. PercentJanuary 19.30 3.90February 19.00 3.85March 18.00 3.85April 17.20 3.81May 17.40 3.77June 17.90 3.70July 17.10 3.67August 18.20 3.70September 18.20 3.78October 18.50 3.83November 19.10 3.97December 17.80 3.98Annual 18.10 3.82
MILK PRICES AND MILKFAT CONTENT: WISCONSIN, 2013-2017
Year Milk, all usesPrice Milkfat
Dollars per cwt. Percent2013 20.30 3.792014 24.50 3.782015 17.80 3.762016 16.80 3.782017 18.10 3.82
UPPER MIDWEST MARKET ORDER AVERAGE HAULING CHARGES: BY COUNTY, WISCONSIN, MAY 2017County Dollars per cwt. County Dollars per cwt. County Dollars per cwt.
Adams 0.24 Iowa 0.27 Portage 0.21Ashland 0.43 Iron 0.56 Price 0.39Barron 0.41 Jackson 0.27 Racine 0.51Bayfield 0.48 Jefferson 0.36 Richland 0.47Brown 0.26 Juneau 0.29 Rock 0.32Buffalo 0.26 Kenosha 0.49 Rusk 0.37Burnett 0.29 Kewaunee 0.29 Sauk 0.36Calumet 0.26 La Crosse 0.42 Sawyer 0.35Chippewa 0.23 Lafayette 0.25 Shawano 0.26Clark 0.17 Langlade 0.21 Sheboygan 0.22Columbia 0.36 Lincoln 0.20 St. Croix 0.26Crawford 0.56 Manitowoc 0.32 Taylor 0.18Dane 0.33 Marathon 0.17 Trempealeau 0.28Dodge 0.37 Marinette 0.39 Vernon 0.40Door 0.38 Marquette 0.27 Walworth 0.36Douglas 0.51 Milwaukee (D) Washburn 0.32Dunn 0.32 Monroe 0.35 Washington 0.24Eau Claire 0.31 Oconto 0.26 Waukesha 0.56Florence 1.12 Oneida (D) Waupaca 0.23Fond du Lac 0.26 Outagamie 0.22 Waushara 0.26Forest (D) Ozaukee 0.18 Winnebago 0.25Grant 0.31 Pepin 0.17 Wood 0.20Green 0.27 Pierce 0.30Green Lake 0.32 Polk 0.37 Wisconsin 0.28
(D) Not published to avoid disclosing individual operations. Source: Agricultural Marketing Service, FMMO 30

44 Wisconsin 2018 Agricultural Statistics
NUMBERS AND AVERAGE PRODUCTION OF COWS ON DHI TEST, WISCONSIN AND UNITED STATES, 2016-2017
Area and kindHerds Milk Cows Production per cow
2016 2017 2016 2017 2016 1/ 2017 1/Milk Fat Protein Milk Fat Protein
Number PoundsWISCONSIN Official 2,487 2,338 616,737 639,138 26,965 1,011 832 26,694 1,010 830 Non-official (management) 1,417 1,375 144,540 145,346 23,240 919 716 23,127 917 716 Total 3,904 3,713 761,277 784,484 26,258 994 810 26,033 993 809UNITED STATES Official 12,470 11,612 3,760,843 3,738,482 24,651 934 773 24,776 951 783 Non-official (management) 4,869 4,815 622,222 602,289 22,300 853 689 22,336 862 696 Total 17,339 16,427 4,383,065 4,340,771 24,317 923 761 24,437 939 7711/ Milk, fat, and protein totals are weighted based on number of milk cows.
DHI COMPONENT DATA FOR TOP 10 MILK PRODUCING COUNTIES, WISCONSIN, 2017
Counties ranked by production
Total number of herds tested
Butterfat average percent
Protein average percent
Fond du Lac 94 3.71 3.13Clark 203 3.91 3.09Manitowoc 147 3.74 3.06Dane 111 3.70 3.04Marathon 151 3.88 3.09Kewaunee 21 3.79 3.10Brown 60 3.72 3.12Outagamie 13 3.73 3.12Dodge 129 3.84 3.09Grant 141 3.85 3.07Source: AgSource Cooperative Services
WEIGHTED AVERAGE LEVELS OF COMPONENTS & SOMATIC CELL COUNT IN MILK ASSOCIATED WITH THE UPPER MIDWEST MILK
MARKETING ORDER, 2017Month Protein Other
solidsSolids not-fat
Somatic cell count
Percent AverageJanuary 3.17 5.75 8.92 193February 3.13 5.75 8.88 190March 3.14 5.75 8.89 190April 3.10 5.76 8.86 190May 3.08 5.76 8.84 189June 3.04 5.77 8.81 199July 3.03 5.76 8.79 208August 3.07 5.78 8.85 205September 3.10 5.79 8.89 196October 3.13 5.75 8.88 182November 3.21 5.73 8.94 168December 3.21 5.74 8.95 164Average 3.12 5.76 8.88 190Source: Agricultural Marketing Service, Dairy Division, FMMO 30.
DHI PRODUCTION AVERAGES BY BREED:WISCONSIN, 2016-2017Breeds 2016 2017
Herds Milk Fat Test Protein Test Herds Milk Fat Test Protein TestAyrshire 23 18,014 699 3.88 562 3.12 21 19,168 740 3.86 595 3.10Brown Swiss 69 20,981 879 4.19 717 3.42 69 20,840 871 4.18 709 3.40Guernsey 32 17,857 810 4.54 609 3.41 33 18,096 820 4.53 617 3.41Holstein 2,733 26,411 998 3.78 813 3.08 2,509 26,105 992 3.80 807 3.09Jersey 165 17,870 885 4.95 656 3.67 148 17,911 898 5.01 658 3.67Milking Shorthorn 12 13,905 543 3.91 436 3.14 11 12,539 503 4.01 397 3.17Red and White 7 19,109 741 3.88 595 3.11 5 19,624 783 3.99 617 3.14All breeds 3,041 26,099 992 3.80 807 3.09 2,796 25,810 987 3.82 801 3.10

Wisconsin 2018 Agricultural Statistics 45
MILK PRODUCTION COSTS AND RETURNS: WISCONSIN AND UNITED STATES, 2016-2017Item Wisconsin United States
2016 2017 2016 2017Dollars per cwt.
Gross value of production: Milk sold 16.94 18.31 16.17 17.52 Cattle 1.45 1.34 1.44 1.33 Other income 1/ 0.62 0.59 0.69 0.65 Total, gross value of production 19.01 20.24 18.30 19.50
Operating costs: Feed-- Purchased feed 5.78 5.44 9.80 9.21 Homegrown harvested feed 6.26 7.26 4.34 4.51 Grazed feed 0.11 0.13 0.10 0.10 Total, feed costs 12.15 12.83 14.24 13.82 Other-- Veterinary and medicine 1.15 1.11 0.90 0.86 Bedding and litter 0.38 0.36 0.27 0.26 Marketing 0.25 0.24 0.26 0.25 Custom services 0.41 0.39 0.62 0.60 Fuel, lube, and electricity 0.58 0.68 0.47 0.55 Repairs 0.67 0.69 0.63 0.64 Cost for third party organic certification 0.01 0.01 0.00 0.00 Interest on operating capital 0.04 0.09 0.04 0.09 Total, operating cost 15.64 16.40 17.43 17.07
Allocated overhead: Hired labor 1.94 2.01 1.75 1.79 Opportunity cost of unpaid labor 3.37 3.47 2.31 2.39 Capital recovery of machinery and equipment 2/ 4.75 4.88 3.75 3.85 Opportunity cost of land (rental rate) 0.03 0.04 0.02 0.02 Taxes and insurance 0.29 0.28 0.21 0.20 General farm overhead 0.82 0.84 0.63 0.64 Total, allocated overhead 11.20 11.52 8.67 8.89
Total costs listed 26.84 27.92 26.10 25.96
Value of production less total costs listed -7.83 -7.68 -7.80 -6.46Value of production less operating costs 3.37 3.84 0.87 2.43
Supporting information: Milk cows (head per farm) 118 118 183 183 Output per cow (pounds) 20,133 20,133 20,724 20,724 Milking frequency more than twice per day (percent of farms) 11.25 11.25 9.73 9.73 Milk cows injected with bST (percent of cows) 22.07 22.07 8.79 8.79 Organic milk sold (percent of sales) 3.84 3.84 2.77 2.771/ Income from renting or leasing dairy stock to other operations; renting space to other dairy operations; co-op patronage dividends associated with the dairy; assessment rebates, refunds, and other dairy-related resources; and the fertilizer value of manure production. 2/ Machinery and equipment, housing, manure handling, feed storage structures, and dairy breeding herd. Source: USDA, Economic Research Service.

46 Wisconsin 2018 Agricultural Statistics
CHEESE PRODUCTION: WISCONSIN, 2013-2017Year Total Cheese 1/ Total American 2/ Hispanic Muenster Italian Mozzarella Swiss
1,000 pounds2013 2,855,881 837,517 70,906 52,982 1,422,393 961,016 33,6952014 2,912,144 848,879 71,790 57,250 1,459,655 990,654 22,7412015 3,069,641 909,749 77,197 60,935 1,537,095 1,051,136 16,6512016 3,248,440 963,413 85,403 60,232 1,642,286 1,092,440 18,2012017 3,365,897 1,016,569 91,407 61,690 1,702,351 1,109,289 16,6641/ Includes cream cheese and other miscellaneous types of cheese. Does not include cottage cheese. 2/ Includes Cheddar, Colby, washed curd, stirred curd, Monterey, and Jack. (D) Not published to avoid disclosing individual operations.
AMERICAN CHEESE PRODUCTION, BY STYLE: WISCONSIN, 2017
Style Production Percent of total1,000 lbs.
American Cheddar40-lb block 246,724 24.3640-lb block 281,519 27.7Other types 1/ 175,717 17.3Colby 78,349 7.7Monterey Jack 234,260 23.0Total American types 1,016,569 100.01/ Includes Barrels.
ITALIAN CHEESE PRODUCTION, BY STYLE: WISCONSIN, 2017
Style Production Percent of total1,000 lbs.
Hard Asiago 31,941 1.9 Parmesan 217,597 12.8 Provolone 210,361 12.4 Romano 33,631 2.0Soft Mozzarella 1,109,289 65.2All other 99,532 5.8All Italian 1,702,351 100.0
PROCESSED CHEESE AND CHEESE FOODS: WISCONSIN, 2013-2017
Year Processed cheese
Processed cheese foods
& spreads
Cold pack cheese &
cheese food1,000 pounds
2013 622,401 295,658 34,4432014 644,814 311,307 36,2242015 665,900 264,920 29,1352016 703,388 184,271 21,8672017 716,886 161,199 25,613(D) Not published to avoid disclosing individual operations.
WHEY PRODUCTS: WISCONSIN, 2013-2017
YearDry whey Total
lactose
Whey protein concentrate human food
Human food Animal
1,000 pounds solids2013 302,843 3,539 219,496 102,1992014 280,339 3,211 237,557 115,0022015 308,562 4,076 221,184 107,4102016 312,946 4,390 259,609 103,9492017 345,567 3,795 278,454 107,971(D) Not published to avoid disclosing individual operations.
600
800
1,000
1,200
1,400
1,600
1,800
1992 1997 2002 2007 2012 2017
Million pounds
AMERICAN & ITALIAN CHEESE PRODUCTIONWisconsin, 1992-2017
American Italian

Wisconsin 2018 Agricultural Statistics 47
TOTAL CHEESE, EXCLUDING COTTAGE CHEESE: WISCONSIN, 2017
Ranges of annual production State plants Production
No. 1,000 lbs.Less than 1 million lbs. 35 5,4811 to 4.99 million lbs. 23 63,6005 to 9.99 million lbs. 16 113,72110 to 24.99 million lbs. 17 246,07325 million lbs. and over 41 2,937,022Total 132 3,365,897
CHEDDAR CHEESE: WISCONSIN, 2017Ranges of annual
production 1/ State plants Production
No. 1,000 lbs.Less than 1 million lbs. 42 7,4541 to 9.99 million lbs. 12 30,05710 million lbs. and over 16 666,449Total 70 703,9601/ Plant qualifies for a certain range based only on its Cheddar production.
SPECIALTY CHEESE PRODUCTION, WISCONSIN, 2016 AND 2017
Type 2016 number of plants
2016 revised production
2017 number of plants 2017 Production
Change in production from 2016
1,000 pounds 1,000 pounds PercentAsiago 12 29,269 13 31,941 9Cheddar 1/ 39 30,444 40 29,036 -5Colby 1/ 10 8,008 10 7,792 -3Farmers 13 1,009 12 1,342 33Feta 10 91,506 8 97,990 7Gorgonzola 10 18,385 10 18,102 -2Gouda 21 12,991 26 18,684 44Italian Fontina 10 9,306 12 12,198 31Havarti 13 37,884 12 42,685 13Hispanic 13 85,403 12 91,407 7Limburger 1 491 1 447 -9Parmesan Wheel 5 61,358 6 67,116 9Romano Wheel 6 10,794 6 10,655 -1All Other 2/ 56 377,580 59 369,255 -2Total 3/ 93 774,428 99 798,650 31/ Includes only specialty types of this variety. 2/ Combined to avoid disclosure of individual plant data. Includes: Alpine, American Grana, Auribella, Blue, Brie and Camembart, Butterkase, Caerphilly, Edam, Fior di Latte, Fontiago, Fontinella, Gruyere, other specialty Italian, Italico, Juustoleipa, Kefalograviera Sagana, Kasseri, Kreme Kaese, Mascarpone, Middle Eastern cheeses, specialty Monterey Jack, Morning Sun, specialty Mozzarella, other specialty Parmesan, Pepato, Peperon, specialty Provolone, Raclette, other specialty Romano, Soft-ripened, Swedish style Fontina, specialty Swiss, Tvarog Polish, and Yogurt cheese. 3/ Total cheese plants producing one or more specialty cheeses.
ITALIAN CHEESE: WISCONSIN, 2017Ranges of annual
production 1/ State plants Production
No. 1,000 lbs.Less than 1 million lbs. 27 4,5571 to 19.99 million lbs. 8 59,59220 million lbs. and over 28 1,638,202Total 63 1,702,3511/ Plant qualifies for a certain range based only on its Italian production.
MOZZARELLA CHEESE: WISCONSIN, 2017Ranges of annual
production 1/ State plants Production
No. 1,000 lbs.Less than 1 million lbs. 16 2,781 1 to 19.99 million lbs. 7 55,479 20 million lbs. and over 16 1,051,029 Total 39 1,109,289 1/ Plant qualifies for a certain range based only on its Mozzarella production.

48 Wisconsin 2018 Agricultural Statistics
DAIRY PLANTS MAKING SELECTED PRODUCTS: WISCONSIN, SELECTED YEARS 1/Product 1970 1980 1985 1990 1995 2000 2005 2010 2015 2017
Number of dairy plantsButter 74 35 25 15 14 12 10 (D) (D) (D)Cheese American 368 250 198 117 85 71 63 60 64 70 Cheddar 330 209 180 99 79 65 62 59 64 70 Hispanic (NA) (NA) (NA) (NA) (NA) 8 20 17 13 12 Italian 66 57 58 51 52 48 53 56 63 63 Mozzarella (NA) 44 48 43 42 35 40 41 39 39 Muenster 51 43 48 34 31 26 25 26 19 19 Swiss 41 20 22 14 11 10 (D) (D) 9 11 Total cheese 2/ 481 334 284 188 142 125 114 128 127 132Dry whey, human food 19 14 16 12 11 10 9 9 10 10Ice cream mix (regular) 41 21 23 17 12 10 12 (D) 14 13Total manufacturing one or more dairy products 667 425 400 286 230 205 196 210 203 2061/ Includes only plants actually making specified product, rather than all plants licensed to make specified product. 2/ Excludes cottage and processed cheese. (D) Not published to avoid disclosing individual operations. (NA) Not available.
DAIRY PRODUCT PRICE AVERAGES: BY MONTHS, UNITED STATES, 2013-2017 1/Year Jan. Feb. March April May June July August Sept. Oct. Nov. Dec.
Dollars per poundBUTTER (GRADE AA, 80% BUTTERFAT, SALTED, FRESH, OR STORAGE)
2013 1.507 1.544 1.615 1.677 1.648 1.542 1.467 1.419 1.426 1.545 1.521 1.631 2014 1.648 1.832 1.856 1.923 2.048 2.187 2.347 2.521 2.853 2.526 1.989 1.9052015 1.563 1.682 1.695 1.736 1.873 1.907 1.916 2.044 2.445 2.573 2.800 2.5712016 2.076 2.135 1.991 2.019 2.058 2.162 2.316 2.225 2.078 1.864 1.909 2.1002017 2.257 2.176 2.168 2.116 2.164 2.407 2.604 2.658 2.530 2.372 2.281 2.232
NONFAT DRY MILK, (EXTRA GRADE AND USPH GRADE A, NONFORTIFIED)2013 1.560 1.556 1.521 1.531 1.637 1.688 1.727 1.771 1.809 1.837 1.889 1.954 2014 2.034 2.078 2.090 2.019 1.877 1.863 1.862 1.789 1.472 1.490 1.390 1.2552015 1.020 1.031 1.022 0.968 0.946 0.928 0.837 0.744 0.801 0.895 0.837 0.7892016 0.778 0.769 0.752 0.731 0.761 0.789 0.836 0.859 0.885 0.922 0.912 0.9582017 1.023 0.993 0.849 0.839 0.870 0.914 0.899 0.873 0.850 0.810 0.755 0.724
CHEDDAR CHEESE (NATURAL, UNAGED) 2/2013 1.749 1.662 1.647 1.731 1.827 1.781 1.714 1.773 1.796 1.803 1.861 1.8762014 2.084 2.286 2.269 2.355 2.170 2.036 2.048 2.107 2.347 2.291 2.131 1.7362015 1.581 1.545 1.575 1.612 1.656 1.722 1.700 1.739 1.715 1.679 1.650 1.5722016 1.518 1.517 1.516 1.504 1.410 1.448 1.642 1.812 1.751 1.583 1.760 1.7992017 1.701 1.687 1.555 1.496 1.539 1.629 1.543 1.666 1.661 1.725 1.762 1.648
DRY WHEY (EXTRA GRADE, EDIBLE, NONHYGROSCOPIC)2013 0.650 0.639 0.605 0.574 0.577 0.574 0.580 0.578 0.579 0.573 0.583 0.5712014 0.603 0.631 0.655 0.677 0.675 0.679 0.689 0.688 0.673 0.653 0.637 0.5872015 0.588 0.517 0.482 0.461 0.445 0.425 0.394 0.311 0.244 0.231 0.234 0.2342016 0.235 0.247 0.248 0.247 0.251 0.260 0.274 0.285 0.306 0.330 0.369 0.3992017 0.442 0.489 0.524 0.524 0.509 0.492 0.451 0.435 0.417 0.379 0.359 0.3031/ The commodity prices are AMS Dairy Product Price Averages used in the Federal Milk Order Price Formulas for Class II (butterfat), Class III, and Class IV. 2/ Cheddar cheese price is a combinatin of the 40-lb. cheddar block and 500-lb. cheddar barrel as used in the AMS formulas. Source: Agricultural Marketing Service (AMS).
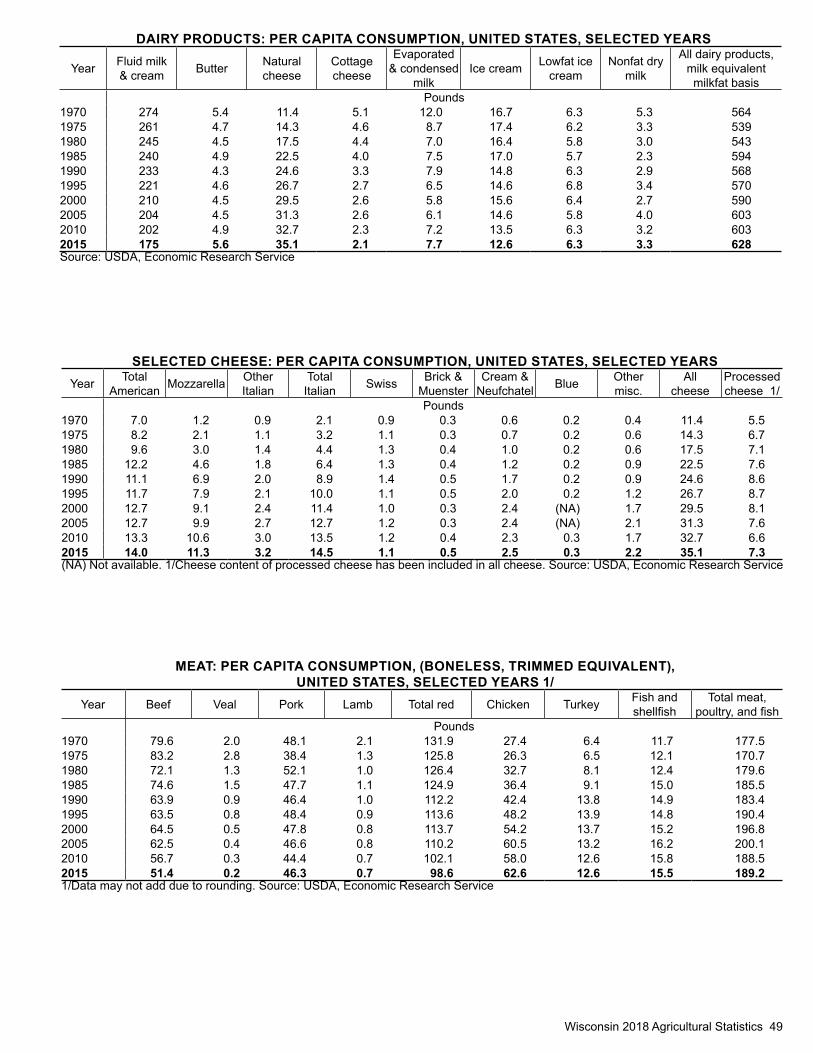
Wisconsin 2018 Agricultural Statistics 49
DAIRY PRODUCTS: PER CAPITA CONSUMPTION, UNITED STATES, SELECTED YEARS
Year Fluid milk & cream Butter Natural
cheeseCottage cheese
Evaporated & condensed
milkIce cream Lowfat ice
creamNonfat dry
milk
All dairy products, milk equivalent
milkfat basisPounds
1970 274 5.4 11.4 5.1 12.0 16.7 6.3 5.3 5641975 261 4.7 14.3 4.6 8.7 17.4 6.2 3.3 5391980 245 4.5 17.5 4.4 7.0 16.4 5.8 3.0 5431985 240 4.9 22.5 4.0 7.5 17.0 5.7 2.3 5941990 233 4.3 24.6 3.3 7.9 14.8 6.3 2.9 5681995 221 4.6 26.7 2.7 6.5 14.6 6.8 3.4 5702000 210 4.5 29.5 2.6 5.8 15.6 6.4 2.7 5902005 204 4.5 31.3 2.6 6.1 14.6 5.8 4.0 6032010 202 4.9 32.7 2.3 7.2 13.5 6.3 3.2 6032015 175 5.6 35.1 2.1 7.7 12.6 6.3 3.3 628Source: USDA, Economic Research Service
SELECTED CHEESE: PER CAPITA CONSUMPTION, UNITED STATES, SELECTED YEARSYear Total
American Mozzarella Other Italian
TotalItalian Swiss Brick &
MuensterCream &
Neufchatel Blue Other misc.
All cheese
Processed cheese 1/
Pounds1970 7.0 1.2 0.9 2.1 0.9 0.3 0.6 0.2 0.4 11.4 5.51975 8.2 2.1 1.1 3.2 1.1 0.3 0.7 0.2 0.6 14.3 6.71980 9.6 3.0 1.4 4.4 1.3 0.4 1.0 0.2 0.6 17.5 7.11985 12.2 4.6 1.8 6.4 1.3 0.4 1.2 0.2 0.9 22.5 7.61990 11.1 6.9 2.0 8.9 1.4 0.5 1.7 0.2 0.9 24.6 8.61995 11.7 7.9 2.1 10.0 1.1 0.5 2.0 0.2 1.2 26.7 8.72000 12.7 9.1 2.4 11.4 1.0 0.3 2.4 (NA) 1.7 29.5 8.12005 12.7 9.9 2.7 12.7 1.2 0.3 2.4 (NA) 2.1 31.3 7.62010 13.3 10.6 3.0 13.5 1.2 0.4 2.3 0.3 1.7 32.7 6.62015 14.0 11.3 3.2 14.5 1.1 0.5 2.5 0.3 2.2 35.1 7.3(NA) Not available. 1/Cheese content of processed cheese has been included in all cheese. Source: USDA, Economic Research Service
MEAT: PER CAPITA CONSUMPTION, (BONELESS, TRIMMED EQUIVALENT), UNITED STATES, SELECTED YEARS 1/
Year Beef Veal Pork Lamb Total red Chicken Turkey Fish and shellfish
Total meat, poultry, and fish
Pounds1970 79.6 2.0 48.1 2.1 131.9 27.4 6.4 11.7 177.51975 83.2 2.8 38.4 1.3 125.8 26.3 6.5 12.1 170.71980 72.1 1.3 52.1 1.0 126.4 32.7 8.1 12.4 179.61985 74.6 1.5 47.7 1.1 124.9 36.4 9.1 15.0 185.51990 63.9 0.9 46.4 1.0 112.2 42.4 13.8 14.9 183.41995 63.5 0.8 48.4 0.9 113.6 48.2 13.9 14.8 190.42000 64.5 0.5 47.8 0.8 113.7 54.2 13.7 15.2 196.82005 62.5 0.4 46.6 0.8 110.2 60.5 13.2 16.2 200.12010 56.7 0.3 44.4 0.7 102.1 58.0 12.6 15.8 188.52015 51.4 0.2 46.3 0.7 98.6 62.6 12.6 15.5 189.21/Data may not add due to rounding. Source: USDA, Economic Research Service

50 Wisconsin 2018 Agricultural Statistics
CATTLE AND CALVES: NUMBER ON FARMS, WISCONSIN, JANUARY 1, 2014-2018Year All cattle and
calvesMilk cows
Beef cows
Bulls 500 lbs. +
Replacement heifers 500 lbs. + Other heifers 500 lbs. +
Steers 500 lbs. +
Calves under 500 lbs.Dairy Beef
1,000 head2014 3,400 1,270 250 30 680 70 70 380 6502015 3,500 1,275 275 35 730 75 45 375 6902016 3,500 1,280 270 30 735 80 45 380 6802017 3,550 1,280 290 30 710 80 50 400 7102018 3,500 1,275 285 30 700 80 50 380 700
CATTLE AND CALVES: INVENTORY, SUPPLY AND DISPOSITION, WISCONSIN, 2013-2017Year All cattle and
calves January 1 Calf crop Inshipment Marketings Farm slaughter DeathsCattle Calves Cattle and calves Cattle Calves
1,000 head2013 3,500 1,350 115 899 465 6 60 1352014 3,400 1,400 107 836 370 4 62 1352015 3,500 1,380 110 890 401 6 63 1302016 3,500 1,420 143 905 403 5 65 1352017 3,550 1,430 163 1,068 378 5 62 130
CATTLE AND CALVES: PRODUCTION, AVERAGE PRICE, AND INCOME, WISCONSIN, 2013-2017Year Production Marketings Cash receipts Value of home
consumption Gross income
1,000 pounds 1,000 dollars2013 1,242,105 1,331,400 1,562,064 38,181 1,600,2452014 1,271,071 1,235,200 1,854,396 38,003 1,892,3992015 1,366,367 1,394,950 2,128,331 49,110 2,177,4412016 1,393,843 1,422,783 1,639,375 35,644 1,675,0192017 1,519,997 1,646,915 1,829,566 28,238 1,857,804
Milk cows37%
Beef cows8%
Bulls 500 lbs. +1%
Dairy heifers20%
Beef heifers2%
Other heifers1%
Steers 500 lbs. +11%
Calves under 500 lbs.20%
CATTLE INVENTORYWisconsin, January 1, 2018

Wisconsin 2018 Agricultural Statistics 51
County 2017 2018Head
Adams 18,700 18,400Ashland 7,600 7,400Barron 62,000 61,000Bayfield 7,800 7,700Brown 125,000 125,000Buffalo 66,000 65,000Burnett 11,800 11,600Calumet 73,000 72,000Chippewa 73,000 72,000Clark 160,000 160,000Columbia 53,000 52,000Crawford 33,000 32,500Dane 135,000 135,000Dodge 105,000 100,000Door 25,000 23,500Douglas 7,000 6,800Dunn 64,000 63,000Eau Claire 32,500 32,000Florence 800 800Fond Du Lac 125,000 125,000Forest 2,100 2,000Grant 175,000 175,000Green 75,000 74,000Green Lake 24,000 23,500Iowa 93,000 91,000Iron 1,900 1,900Jackson 45,000 44,000Jefferson 40,500 40,000Juneau 25,000 24,500Kenosha 11,500 11,300
County 2017 2018Head
Kewaunee 99,000 97,000La Crosse 27,000 26,500Lafayette 110,000 105,000Langlade 20,000 19,900Lincoln 12,300 12,100Manitowoc 115,000 115,000Marathon 145,000 145,000Marinette 39,000 38,500Marquette 14,700 14,400Menominee (D) (D)Milwaukee (D) (D)Monroe 70,000 69,000Oconto 55,000 54,000Oneida 600 600Outagamie 100,000 99,000Ozaukee 19,100 18,300Pepin 28,500 28,000Pierce 48,000 47,000Polk 43,500 42,500Portage 51,000 50,000Price 15,400 15,100Racine 9,200 9,000Richland 44,500 43,500Rock 46,500 45,500Rusk 29,500 29,500Sauk 82,000 81,000Sawyer 7,100 6,900Shawano 88,000 87,000Sheboygan 71,000 70,000St Croix 51,000 50,000
ALL CATTLE AND CALVES: BY COUNTY, WISCONSIN, JANUARY 1, 2017-2018 1/County 2017 2018
HeadTaylor 52,000 51,000Trempealeau 61,000 60,000Vernon 70,000 69,000Vilas 100 100Walworth 38,500 38,000Washburn 8,500 8,300Washington 43,000 42,500Waukesha 8,700 8,500Waupaca 54,000 53,000Waushara 14,000 13,800Winnebago 36,000 35,500Wood 44,000 43,000
Other Counties 100 100
Wisconsin 3,550,000 3,500,000(D) Withheld to avoid disclosure of individual operations. Included in ‘other counties.’ 1/ Livestock county estimates are being set using raking. This process utilizes county level livestock information from the census of agriculture, administrative data, and current year state-level Agricultural statistics Board (ASB) inventory and production estimates. Full details on this new methodology are available at: www.
nass.usda.gov/Data_and_Statistics/County_Data_Files/Livestock_County_
Estimates/
Price
Clark
Dane
Grant
Polk
Vilas
Bayfield
Iron
Sawyer
Rusk
Marathon
Oneida
Douglas
Forest
Taylor
Sauk
Dunn
Iowa
Oconto
Dodge
Rock
Wood
BarronLincoln
Jackson
Ashland
Burnett
Monroe
Vernon
Chippewa
Buffalo
Langlade
Green
Pierce
St. Croix
Lafayette
Waushara
Eau Claire
Racine
Marinette
Juneau
Portage
Shawano
Adams
Door
Washburn
Columbia
Waupaca Brown
RichlandCrawford
Jefferson
Fond du Lac
Walworth
OutagamieTrempealeau
Florence
Manitowoc
Waukesha
Winnebago
La CrosseCalumet
SheboyganMarquette
Pepin
Washington
Green Lake
Kewaunee
Menominee
Kenosha
Ozaukee
Milwaukee
Thousand HeadNot published
Less than 25.0
25.0 - 49.9
50.0 - 99.9
100.0 or more
ALL CATTLE AND CALVESInventory by County
January 1, 2018

52 Wisconsin 2018 Agricultural Statistics
HOGS: PRODUCTION AND INCOME, WISCONSIN, 2013-2017Year Production Marketings Value of
production Cash receipts Value of home consumption Gross income All hogs December 1
current year1,000 pounds 1,000 dollars 1,000 head
2013 167,000 173,169 128,999 136,894 893 137,787 2952014 143,496 150,723 122,464 136,313 630 136,943 3102015 146,130 149,745 96,792 105,978 599 106,577 3202016 142,431 150,758 84,912 97,927 667 98,594 3352017 164,587 175,911 107,515 122,722 572 123,294 305
HOGS: INVENTORY, SUPPLY AND DISPOSITION, WISCONSIN, 2013-2017Year Beginning
inventory Pig crop Inshipment Marketings Farm slaughter Deaths
1,000 head2013 320 791 93 881 1 272014 295 650 155 762 1 272015 310 673 150 785 1 272016 320 661 195 814 1 262017 335 772 193 961 1 34
HOGS: NUMBER ON FARMS, WISCONSIN, DECEMBER 1, 2013-2017Year All hogs
and pigsBreeding
hogsMarket hogs
Total < 50 lbs. 50-119 lbs. 120-179 lbs. 180 lbs. +1,000 head
2013 295 40 255 89 53 53 602014 310 41 269 102 56 57 542015 320 43 277 89 63 65 602016 335 45 290 102 67 61 602017 305 45 260 89 53 59 59
GOATS: NUMBER ON FARMS, BY CLASS, WISCONSIN, JANUARY 1, 2014-2018
Year Angora goats
Milk goats
Meat and other goats
Total goats
Head2014 900 46,000 22,000 68,9002015 (NA) 44,000 (NA) (NA)2016 (NA) 44,000 (NA) (NA)2017 (NA) 44,000 (NA) (NA)2018 (NA) 47,000 (NA) (NA)(NA) Not available.
SHEEP AND LAMBS: NUMBER ON FARMS, WISCONSIN, JANUARY 1, 2014-2018
Year All sheep and lambs Market
Breeding sheep and lambsOne year and over Replacement
lambsEwes Rams1,000 head
2014 83 14 52 3 142015 77 12 50 3 122016 76 13 49 2 122017 76 13 48 3 122018 75 12 48 3 12
WOOL: PRODUCTION AND VALUE, WISCONSIN, 2013-2017
Year Number of sheep shorn
Weight per fleece
Total production
Price per pound
Value of production
1,000 hd. Pounds 1,000 lbs. Cents $1,000 2013 59 6.8 400 0.70 2802014 50 7.0 350 0.75 2632015 51 7.2 365 0.75 2742016 51 6.7 340 0.70 2382017 50 6.6 330 0.65 215

Wisconsin 2018 Agricultural Statistics 53
COMMERCIAL LIVESTOCK SLAUGHTER: BY MONTHS, WISCONSIN, 2013-2017Year Jan. Feb. March April May June July Aug. Sept. Oct. Nov. Dec. Annual 1/
BEEF CATTLE 2/Number (thousand head)
2013 143.4 120.1 127.9 141.0 136.4 126.0 133.2 129.6 124.6 139.8 128.8 128.1 1,578.92014 126.3 109.6 117.9 122.3 109.8 108.7 118.4 98.6 104.9 105.6 97.6 107.6 1,327.32015 103.8 88.8 96.4 96.8 88.5 91.9 94.9 88.2 99.2 99.6 98.6 102.4 1,149.12016 100.1 95.7 103.2 92.7 92.4 100.4 94.8 105.3 102.1 108.3 110.8 115.1 1,220.82017 112.9 106.1 117.3 107.2 110.0 116.6 101.3 117.3 104.5 113.6 114.7 106.8 1,328.5
Average liveweight (pounds)2013 1,361 1,359 1,367 1,366 1,365 1,376 1,369 1,363 1,361 1,363 1,370 1,379 1,3672014 1,383 1,384 1,383 1,386 1,381 1,390 1,377 1,378 1,380 1,381 1,385 1,379 1,3822015 1,388 1,396 1,390 1,387 1,396 1,390 1,382 1,372 1,380 1,385 1,401 1,397 1,389 2016 1,410 1,405 1,404 1,387 1,390 1,388 1,376 1,368 1,373 1,390 1,392 1,398 1,390 2017 1,406 1,410 1,401 1,395 1,394 1,391 1,382 1,382 1,394 1,389 1,394 1,402 1,395
Total liveweight (million pounds)2013 194.0 162.3 173.9 191.5 185.2 172.5 181.3 175.6 168.6 189.4 175.5 175.7 2,145.62014 173.6 150.8 162.1 168.6 150.9 150.1 162.0 135.2 143.9 145.1 134.5 147.6 1,824.42015 143.3 123.2 133.1 133.4 122.8 127.0 130.4 120.3 136.0 137.1 137.3 142.2 1,586.02016 140.3 133.6 144.1 127.7 127.7 138.6 129.7 143.1 139.3 149.6 153.3 160.0 1,686.92017 157.9 148.7 163.5 148.6 152.5 161.4 139.2 161.2 144.8 156.8 159.1 148.9 1,842.5
CALVES 3/Number (thousand head)
2013 6.8 5.6 5.9 5.7 6.6 6.0 6.6 6.4 6.1 7.2 6.9 7.5 77.22014 7.2 6.2 6.4 6.8 6.0 5.7 6.0 5.4 6.0 6.4 5.3 6.5 73.92015 5.6 4.6 5.3 5.3 4.8 5.2 5.6 5.4 5.7 5.2 5.6 5.4 63.92016 5.4 4.6 5.8 4.9 4.8 5.6 4.7 4.9 5.3 5.3 5.1 5.2 61.62017 5.0 4.3 5.1 4.6 5.3 5.3 4.2 4.9 4.4 4.4 5.3 5.0 57.9
Average liveweight (pounds)2013 463 460 461 457 456 454 451 447 447 449 456 458 4552014 454 457 461 464 460 466 461 459 459 458 470 472 4622015 472 463 459 463 483 470 472 474 471 487 489 487 4742016 474 480 484 487 481 482 469 474 463 459 463 460 4732017 451 457 452 452 467 469 472 455 472 490 493 488 468
Total liveweight (million pounds)2013 3.1 2.6 2.7 2.6 3.0 2.7 3.0 2.9 2.7 3.2 3.1 3.4 35.02014 3.3 2.8 3.0 3.1 2.8 2.7 2.7 2.5 2.7 2.9 2.5 3.1 34.02015 2.7 2.1 2.4 2.5 2.3 2.4 2.6 2.5 2.7 2.5 2.7 2.6 30.22016 2.5 2.2 2.8 2.4 2.3 2.7 2.2 2.3 2.5 2.4 2.4 2.4 29.12017 2.2 2.0 2.3 2.1 2.5 2.5 2.0 2.2 2.1 2.2 2.6 2.4 27.0
HOGSNumber (thousand head)
2013 45.3 40.9 45.1 54.2 58.0 49.3 56.4 57.9 50.7 52.3 46.8 46.2 603.22014 49.6 49.3 56.4 55.5 49.5 50.1 53.8 47.8 49.4 53.4 44.3 53.9 613.12015 51.2 49.4 56.5 55.4 45.3 44.7 43.8 42.8 44.6 41.0 36.6 37.4 548.72016 40.7 39.7 41.3 38.1 41.6 46.1 48.3 59.1 57.9 57.8 57.9 57.6 586.12017 62.0 56.3 69.9 58.3 64.8 62.9 59.9 68.1 60.2 64.2 59.7 56.9 743.0
Average liveweight (pounds)2013 449 450 447 449 459 459 448 444 448 449 444 444 4492014 442 442 442 441 450 460 452 445 456 459 451 453 4492015 455 452 453 458 459 459 440 429 431 425 428 435 4452016 441 436 437 447 449 456 457 439 435 437 441 438 4422017 441 445 443 443 448 457 438 429 426 435 441 436 440
Total liveweight (million pounds)2013 20.3 18.3 20.1 24.3 26.5 22.6 25.2 25.6 22.7 23.4 20.7 20.5 270.32014 21.8 21.8 24.9 24.4 22.3 23.0 24.2 21.3 22.5 24.5 19.9 24.4 275.02015 23.3 22.2 25.5 25.3 20.8 20.5 19.2 18.3 19.2 17.4 15.7 16.2 243.62016 17.9 17.2 18.0 17.0 18.6 21.0 22.0 25.9 25.1 25.2 25.5 25.2 258.62017 27.3 25.0 30.9 25.8 29.0 28.7 26.2 29.2 25.6 27.9 26.3 24.8 326.31/Months will not necessarily add to total due to rounding. 2/Slaughter cows, steers and heifers combined. 3/Includes slaughter “bobs” and special fed veal calves weighing less than 500 pounds.

54 Wisconsin 2018 Agricultural Statistics
TROUT: DISTRIBUTION AND SALES, WISCONSIN, 2016-2017
Item Unit 2016 2017Trout 12” or longerNumber sold 1,000 (D) 390Pounds sold 1,000 (D) 378Value of sales $1,000 (D) 1,569 Average price per pound Dollars (D) 4.15
Trout 6” - 12”Number sold 1,000 65 (D)Pounds sold 1,000 21 (D)Value of sales $1,000 86 (D)Average price per pound Dollars 4.10 (D)
Trout 1” - 6”Number sold 1,000 (D) (D)Pounds sold 1,000 (D) (D)Value of sales $1,000 (D) (D)Average price per thousand fish Dollars (D) (D)
Total sales (excluding eggs) $1,000 1,558 1,694
Trout lost to various causesTotal number 1,000 140 191Total pounds 1,000 40 90
Distributed for conservation & restorationTrout 12” or longer 1,000 15 (D)Trout 6” - 12” 1,000 2,770 2,820 Trout 1” - 6” 1,000 (D) (D)Total value $1,000 2,699 2,196 (D) Not published to avoid disclosure of individual operations.
MINK: FEMALES BRED, PELTS PRODUCED, AND VALUE, WISCONSIN, 2013-2017
Year Females bred
Pelts produced
Average price 1/ Value of pelts
Number Dollars Million dollars2013 2/ 1,129,960 56.30 63.62014 276,990 1,268,760 57.70 73.22015 268,690 1,316,610 32.00 42.12016 254,490 1,147,310 34.70 39.82017 246,620 1,091,180 36.30 39.61/Average market price, U.S. 2/ Data not collected due to sequestration.
HONEY: PRODUCTION AND VALUE, WISCONSIN, 2013-2017
Year Colonies of bees
Yield per colony
Honey
Production Price per pound
Value of production
1,000 colonies Pounds 1,000
pounds Cents 1,000 dollars
2013 59 60 3,540 238 8,4252014 53 54 2,862 238 6,8122015 52 67 3,484 243 8,4662016 54 62 3,348 267 8,939 2017 53 56 2,968 277 8,221
HONEY BEE COLONIES: WISCONSIN, 2017-2018 1/
PeriodFirst of the
quarter number of colonies 2/
Maximum colonies 3/ Lost colonies Percent lost 4/ Added colonies Renovated
colonies 5/Percent
renovated 6/
Number Percent Number PercentJan-Mar 2017 17,000 22,000 4,400 20 450 70 (Z)Apr-Jun 2017 18,000 65,000 4,000 6 13,000 6,500 10Jul-Sep 2017 74,000 75,000 12,500 17 6,000 9,000 12Oct-Dec 2017 51,000 55,000 8,500 15 530 3,000 5Jan-Mar 2018 21,000 29,000 4,600 16 2,800 1,560 5Apr-Jun 2018 24,000 50,000 6,000 12 12,500 6,600 13(Z) Less than half of the unit shown. 1/ Operations with 5 or more colonies. 2/ Number of colonies in the state as of the first day of the quarter. 3/ Number of colonies in the state on the first day of the quarter plus all colonies moved into state during the quarter. 4/ Percent lost is the number of lost colonies divided by the maximum colonies. 5/ Defined as any surviving colony that was requeened or received new honey bees through nuc or package. 6/ Percent renovated is the number of renovated colonies divided by the maximum colonies.
HONEY BEE COLONY HEALTH: WISCONSIN, 2017-2018 1/Period Varroa mites Other pests and
parasites 2/ Disease 3/ Pesticide Other 4/ Unknown
PercentJan-Mar 2017 19.0 1.9 1.1 2.0 4.0 10.5Apr-Jun 2017 13.8 1.7 1.7 2.2 3.2 0.3Jul-Sep 2017 61.6 21.0 18.5 21.8 13.0 12.1Oct-Dec 2017 53.1 36.9 33.1 22.8 15.3 15.2Jan-Mar 2018 14.1 3.7 1.2 1.5 3.6 3.7Apr-Jun 2018 32.8 16.2 17.8 26.6 29.1 0.91/ Operations with 5 or more colonies, percent of colonies affected by stressor. A colony may be affected by multiple stressors during the quarter. 2/ Tracheal mites, nosema, hive beetle, wax moths, etc. 3/ Includes American and European foulbrood, chalkbrood, stonebrood, paralysis (acute and chronic), kashmir, deformed wing, sacbrood, IAPV, Lake Sinai II, etc. 4/ Includes weather, starvation, insufficient forage, queen failure, hive damage/destroyed, etc.

Wisconsin 2018 Agricultural Statistics 55
CHICKENS: NUMBER ON FARMS, WISCONSIN, DECEMBER 1, 2013-2017
Year Total chickens 1/
Value per head Total value Total layers
Thousands Dollars 1,000 dollars Thousands2013 6,939 3.30 22,899 5,6192014 6,969 2.70 18,816 5,5862015 6,366 2.70 17,188 4,8942016 6,603 2.40 15,847 5,6152017 8,514 2.40 20,434 6,8361/Excludes commercial broilers.
EGGS: PRODUCTION AND VALUE, WISCONSIN, 2013-2017 1/
Year Avg. layers during year
Total eggs produced
Eggs per layer
Price per dozen
Value of production
1,000 hd. Million Number Cents 1,000 dollars2013 5,377 1,532 285 90.8 115,8792014 5,104 1,449 284 107.7 129,9922015 4,918 1,406 286 160.2 187,7192016 5,616 1,619 288 58.6 79,0832017 6,080 1,759 289 70.5 103,2781/Year is for the period December 1 - November 30.
EGG PRODUCTION: WISCONSIN, 2013-2017Year Jan. Feb. Mar. Apr. May June July Aug. Sept. Oct. Nov. Dec.
Million eggs2013 132.0 114.0 131.0 122.0 120.0 121.0 126.0 128.0 128.0 138.0 137.0 140.02014 131.0 105.0 112.0 118.0 119.0 113.0 119.0 120.0 118.0 124.0 130.0 136.92015 132.3 117.1 128.5 118.7 107.4 96.9 106.1 111.3 109.8 121.1 120.2 123.62016 131.4 134.2 143.0 132.3 135.3 132.5 130.8 133.3 139.4 142.9 140.1 146.52017 140.5 125.4 142.7 146.4 153.3 143.2 153.8 155.3 144.8 150.8 156.7 172.0
LAYERS: AVERAGE NUMBER, WISCONSIN, 2013-2017Year Jan. Feb. Mar. Apr. May June July Aug. Sept. Oct. Nov. Dec.
1,000 head2013 5,396 5,359 5,369 5,295 5,129 5,223 5,324 5,378 5,423 5,564 5,650 5,4972014 5,231 5,048 4,997 5,027 4,957 4,810 4,892 5,028 5,121 5,221 5,415 5,5692015 5,486 5,326 5,316 5,114 4,499 4,110 4,267 4,559 4,714 5,004 5,055 5,1412016 5,464 5,604 5,562 5,615 5,796 5,723 5,445 5,617 5,973 5,817 5,638 5,6512017 5,691 5,662 5,752 6,013 6,053 5,992 6,006 6,154 6,463 6,706 6,821 6,798
BROILERS: PRODUCTION AND GROSS INCOME, WISCONSIN, 2013-2017 1/
Year Production Price per pound
Value of productionNumber Quantity
1,000 head 1,000 pounds Cents 1,000 dollars2013 51,300 215,500 61 130,8092014 53,400 224,300 64 142,8792015 53,900 226,400 54 121,8032016 54,100 227,200 48 108,6022017 53,800 226,000 54 122,9441/Year is for the period December 1 - November 30.
LAYERS: PRODUCTION AND VALUE, WISCONSIN, 2013-2017 1/
Year Number of chickens Price per pound Value of salesLost Sold
1,000 head Cents 1,000 dollars2013 546 2,799 3.1 3122014 378 3,495 3.9 5042015 1,653 4,204 3.4 5292016 1,097 2,772 3.3 3512017 1,045 2,462 1.7 1621/Includes an allowance for roosters. Year is for the period December 1 - November 30.
56 Wisconsin 2018 Agricultural Statistics
National Association of State Departments of Agriculture (NASDA) enumerators collect data for the Wisconsin Field Office of USDA NASS. Some NASDA workers who gathered information for this publication are shown on these two pages.
Back Row:Lynda Cain, Kevin Larson, Bob Samplawski, Carl Peterson
Front Row:John Vanderhoof, Tony Zimmer, Shirley Conley
Not pictured: Russell Miller, Luanne Rehse, Jean Schroeder
Back Row:Kermit Traska, Mark Solverson, Art Post Jr., Jeff Stauffacher
Front Row: Dennis Boland, Janis Yoose, Rita Montgomery
Not pictured:Morten Reser
Back Row: Russ Sternweis, Nancy Lato, Judith Hasse, Steve Prissel
Front Row: John Timura, Bonnie Swan, Keith Watson
Not pictured:Joe Grabko, Dave Gunderson, John Jarvis, Terry Johannes, Linda Overbey, Allen Stea, Roger Williams
Back row:Diane Qualmann, Mary Bogenschneider, Vicki Coughlin, Phyllis Westenberg
Front row:Glen Sjoerdsma, Kim Seiler, Larry Bischoff, Archie Hafer, Jon Kerr
Not pictured: Dorothy Davidson

Wisconsin 2018 Agricultural Statistics 57
Back Row: Laurie Groskopf, Fred Schmoock, Marie Graupner
Front Row: Jim Dean, Ernie Anderson, Joe Pribek
Not pictured: Ken Matyas, Tasha Schleis
Marshall Brinkman, Debbie Taylor
Beth Zondag-Traska, Linda Netzloff

58 Wisconsin 2018 Agricultural Statistics
PEPPERMINT TART CHERRIES SWEET CORN CHEDDAR
CHEESE CRANBERRIES FORAGE
DRY WHEY CABBAGE ITALIAN CHEESE MINK PELTS MILK
PRODUCTION MAPLE SYRUP
CARROTS CORN SILAGE SNAP BEANS GREEN PEAS OATS POTATOES
COVER PRODUCT KEY

WISCONSIN CROPS: Usual Planting and Harvesting Dates
CropsUsual planting dates Usual harvesting dates Principal producing areasBegins Ends Begins Most active Ends Districts Counties
FIELD CROPSCorn for grain April 26 June 4 Oct. 2 Oct. 14 - Nov. 17 Nov. 28 SC Dane, Rock, GrantCorn for silage April 26 June 4 Sept. 8 Sept. 13 - Oct. 13 Oct. 19 EC, SC Dane, Fond du Lac,
MarathonSoybeans May 7 June 14 Sept. 29 Oct. 4 - Oct. 29 Nov. 8 SC Rock, Dane, DodgeOats, spring April 11 May 18 July 22 July 28 - Aug. 24 Aug. 30 WC, EC, SW Langlade, Grant,
MarathonBarley, spring April 5 April 30 Aug. 1 Aug. 5 - Aug. 15 Aug. 20 NC, NW Marathon, Manitowoc,
Clark,Winter wheat Sept. 30 Oct. 15 July 17 July 21 - Aug. 11 Aug. 19 EC, SC, SE Manitowoc,
Fond du Lac, DanePotatoes Mar. 25 May 5 July 20 Aug. 15 - Oct. 1 Oct. 10 C, NE Portage, Waushara,
AdamsAlfalfa hay May 20 Oct. 10 SW, WC Grant, Marathon, IowaAll other hay May 27 Sept. 15 NC, NW Marathon, Clark, Rusk
VEGETABLESCarrots for processing
April 25 June 15 Aug. 15 Sept. 1 - Oct. 31 Nov. 15 C, EC Waushara, Manitowoc, Portage
Snap beans for processing
May 1 July 10 July 10 July 15 - Sept. 15 Sept. 30 C Portage, Adams, Waushara
Sweet corn for processing
April 1 July 1 Aug. 1 Aug. 15 - Sept. 25 Oct. 15 C, EC Portage, Waushara, Fond du Lac
Green peas for processing
April 15 June 10 June 20 July 1 - July 20 July 31 EC, C Fond du Lac, Portage, Green Lake
Cucumbers for pickles
May 1 June 20 July 15 July 25 - Sept. 15 Oct. 15 C Waupaca, Waushara, Portage
• One quart of milk weighs 2.15 pounds• One gallon of milk weighs 8.6 pounds• 46.5 quarts of milk weighs 100 pounds. • Specific gravity of milk at 60 degrees F is 1.032.
100 pounds of 4% milk will yield approximately: 10 pounds cheese and 90 pounds whey or 5 pounds butter and 90 pounds skim milk or 13 pounds dried whole and 1-1/4 pounds 40% cream
100 pounds skim milk will yield approximately: 16 pounds cottage cheese and 84 pounds whey or 3 pounds casein and 94 pounds whey or 9 pounds nonfat dry milk
100 pounds whey will yield approximately: 5 pounds lactose and 1 pound protein and 1/3 pound milkfat
CONVERSION FACTORS
To make one pound of:Requires:
Butter 21.2 pounds whole milkWhole milk cheese 10.0 pounds whole milkEvaporated milk 2.1 pounds whole milkCondensed milk 2.3 pounds whole milkWhole powdered milk 7.4 pounds whole milkPowdered cream 13.5 pounds whole milkIce cream (1 gal.) 12.0 pounds whole milk
(15 pounds when including butter and concentrated milks)
Cottage cheese 6.25 pounds skim milkNonfat dry milk 11.0 pounds skim milk

Department of Agriculture,Trade and Consumer Protection
Wisconsin Agricultural Statistics ServicePO Box 8911Madison WI 53708-8911