2018 trends in investing survey report - onefpa.org trends in... · financial planning association...
TRANSCRIPT

Trends in Investing Survey
2018
Where financial advisers are investing today and tomorrow
oFinancial Planning®
f
An annual survey by:

MUTUAL FUNDS | EXCHANGE-TRADED FUNDS | CASH | EQUIVALENTS | STOCKS | BONDS | OPTIONS | PRIVATE EQUITY FUNDS | REAL ESTATE INVESTMENT TRUSTS | VARIABLE ANNUITIES | INSURANCE | DEPOSITS | COMMODITIES | INTERNATIONAL INVESTMENTS | ALTERNATIVES | CLOSED-END MUTUAL FUNDS | LIFE INSURANCE | FIXED ANNUITIES | WRAP
Financial Planning Association (FPA) | Journal of Financial Planning | FPA Research and Practice Institute™
Table of Contents
Executive Summary 1
Investments Used 2-5
Cryptocurrencies 6
Seeking Returns 7-9Economic Outlook 10
About the Respondents 11
About Us 12
About the 2018 Trends in Investing Survey
The 2018 Trends in Investing Survey, conducted by the Journal of Financial Planning and the FPA Research and Practice InstituteTM, was fielded in late April and early May 2018 and received 265 online responses from financial advisers who offer clients investment advice and/or implement investment recommendations.

When it comes to investing, financial advisers appear to have solidified their preference for ETFs over mutual funds. Meanwhile, although most advisers are fielding questions from clients about investing in cryptocurrencies, advisers have shown nearly no commitment to using or recommending cryptocurrencies in client portfolios.
The 2018 Trends in Investing Survey, conducted by the Journal of Financial Planning and the FPA Research and Practice InstituteTM, showed that 87 percent of advisers surveyed currently use or recommend ETFs with clients, and 73 percent currently use or recommend mutual funds (non wrap). This is the widest gap between ETFs and mutual fund usage reported since ETFs overtook mutual funds in recommendation/usage in 2015.
ETF usage has continued to climb over the last eight years when survey respondents first showed a significant jump in using ETFs, with 72 percent of advisers using/recommending them in 2010 compared to just 44 percent in 2008.
The 2018 survey also showed that only one-percent of advisers are using/recommending cryptocurrencies. When asked what they think of cryptocurrencies as an investment, nearly 30 percent agreed with the statement that cryptocurrencies are “an interesting concept to keep an eye on, but not invest in yet.” However, the low usage of cryptocurrencies in client portfolios is likely to continue for the next year, as only two-percent plan to increase their usage/recommendation of cryptocurrencies over the next 12 months.
Financial Planning Association (FPA) | Journal of Financial Planning | FPA Research and Practice Institute™
Executive Summary
ETF usage has continued to climb over the last eight years, when survey respondents first showed a significant jump in using ETFs.
1
Key Finding
FPA’s annual Trends in Investing survey was first conducted in 2006. Looking at results from 2006 to 2018, one can see the effects of the 2007–2008 financial crisis. By 2010, advisers had clearly shifted out of individual stocks and into index products including ETFs and mutual funds. In 2010, advisers also showed a significant shift into cash and equivalents and fixed annuities (the bar graph on page 3 illustrates this in two-year increments).
As the economy has recovered since the 2007–2008 financial crisis, advisers have showed a modest return to individual stocks, but not to pre-2010 levels, while the use or recommendation of fixed annuities has nearly dropped to pre-2010 levels.

Investments Used
Financial Planning Association (FPA) | Journal of Financial Planning | FPA Research and Practice Institute™
2016 2017 2018
Exchange-traded funds (ETFs) 83% 88% 87%
Cash and equivalents 74% 85% 83%
Mutual funds (non-wrap) 80% 80% 73%
Individual stocks 56% 61% 56%
Individual bonds 52% 52% 46%
Mutual fund wrap program(s) 38% 33% 32%
Variable annuities (immediate and/or deferred) 39% 32% 28%
Fixed annuities (immediate and/or deferred) 30% 32% 26%
Fixed permanent life insurance products 34% 28% 23%
Individually traded REITs (not held in mutual fund) 24% 27% 22%
Other alternatives (bought directly, not included in other investment vehicles) 17% 25% 17%
Variable permanent life insurance 20% 21% 18%
Indexed annuities 15% 16% 16%
Options 8% 16% 13%
Non-traded REITs 16% 15% 13%
Private equity funds 8% 15% 12%
Hedge funds (directly, not through mutual funds) 7% 9% 9%
ESG Funds N/A N/A 26%*
Cryptocurencies N/A N/A 1%*
Other 1% 6% 9%**
Which investment vehicles do you currently use/recommend with your clients? (By percentage)
* These options were not included prior to the 2018 survey. ** When asked to specify “other,” 2018 survey respondents most commonly answered: separately managed accounts, interval funds, structured notes, and physical assets such as collectibles.
2

Investments Used
Financial Planning Association (FPA) | Journal of Financial Planning | FPA Research and Practice Institute™
Changes to Investment Usage, 2006–2018
Source: FPA Trends in Investing Surveys (not all options are displayed here, only ones comparable year-over-year; respondents could select all that apply).
A Return to Safety After the Financial Crisis: Year-over-year survey data from 2006 through 2018 indicates that 2010 was a pivotal year for investment preferences. Results suggest that the 2007–2008 financial crisis spurred advisers into “safety” with a significant shift into cash and equivalents and fixed annuities in 2010. Although use/recommendation of fixed annuities appears to be returning to pre-2010 levels, the use/recommendation of cash and equivalents remains high, with 83 percent of advisers using/recommending this category with clients in 2018.
3
Key Finding

Investments Used
2017 2018
Exchange-traded funds (ETFs) 50% 46%
Cash and equivalents 16% 24%
None. I do not plan to increase the use/recommendation of any investment vehicles. 25% 21%
ESG funds N/A 20%*
Mutual funds (non-wrap) 20% 19%
Individual stocks 19% 19%
Individual bonds 16% 15%
Mutual fund wrap program(s) 15% 15%
Other alternatives (bought directly, not included in other investment vehicles) 8% 11%
Fixed annuities (immediate or deferred) 10% 9%
Variable annuities (immediate or deferred) 5% 9%
Fixed permanent life insurance products 9% 7%
Indexed annuities 5% 7%
Private equity funds 4% 7%
Other 1% 7%**
Individually traded REITs (not held in mutual funds) 6% 6%
Hedge funds (directly, not through mutual funds) 2% 5%
Options 1% 4%
Non-traded REITS 2% 3%
Variable permanent life insurance 1% 3%
Cryptocurrencies N/A 2%*
* These options were not included prior to the 2018 survey. ** When asked to specify “other,” 2018 survey respondents most commonly answered: exchange-traded notes; CDs; and precious metals.
Which investment vehicles do you expect to increase your use/recommendation of over the next 12 months? (By percentage)
Financial Planning Association (FPA) | Journal of Financial Planning | FPA Research and Practice Institute™ 4

Investments Used
2017 2018
None. I do not plan to decrease the use/recommendation of any investment vehicles. 41% 41%
Individual stocks 16% 18%
Mutual funds (non-wrap) 20% 17%
Individual bonds 13% 13%
Variable annuities (immediate or deferred) 14% 8%
Mutual fund wrap program(s) 8% 8%
Exchange-traded funds (ETFs) 5% 8%
Non-traded REITS 11% 7%
Fixed annuities (immediate or deferred) 4% 7%
Cash and equivalents 9% 6%
Indexed annuities 1% 4%
Other 1% 4%
Variable permanent life insurance 5% 2%
Options 1% 2%
Other alternatives (bought directly, not included in other investment vehicles) 1% 2%
Individually traded REITs (not held in mutual funds) 3% 1%
Hedge funds (directly, not through mutual funds) 3% 1%
Fixed permanent life insurance products 2% 1%
Private equity funds 2% 1%
ESG funds N/A 1%*
Cryptocurrencies N/A 1%*
* These options were not included prior to the 2018 survey.
Which investment vehicles do you expect to decrease your use/recommendation of over the next 12 months? (By percentage)
Financial Planning Association (FPA) | Journal of Financial Planning | FPA Research and Practice Institute™
ESG Funds on the Radar: The 2018 survey questionnaire asked advisers about their use/recommendation of ESG funds for the first time in the survey’s 12-year history. Results indicate that about one-quarter (26 percent) of advisers surveyed currently use/recommend ESG funds, and one in five advisers (20 percent) plan to increase their use/recommendation of them over the next 12 months.
5
Key Finding

Cryptocurrencies
Financial Planning Association (FPA) | Journal of Financial Planning | FPA Research and Practice Institute™
The 2018 survey asked about cryptocurrencies—a topic not covered by previous Trends in Investing Surveys. Although most advisers surveyed (53 percent) are fielding questions from clients about investing in cryptocurrencies, just 1 percent are currently using/recommending them with clients, and only 2 percent plan to increase their use/recommendation of cryptocurrencies over the next 12 months.
26%
18%29%
24%
2%
A viable investment option that has a place in a portfolioA gamble; only worth investing money you can stand to loseAn interesting concept to keep an eye on, but not invest in yetA fad that is best avoidedNot a viable investment option
What do you think of cryptocurrencies as an investment?
Effects of volatility on their portfolio 76%
Effects of tax reform (Tax Cuts and Jobs Act) on their portfolio 68%
Investing in cryptocurrencies 53%
Fees and other costs of investments 49%
ESG/socially responsible investing 38%
Other* 6%
Which topics have clients inquired about in the past 6 months?
* When asked to specify “other,” 2018 survey respondents most commonly answered: effects of political environment; effects of rising interest rates; and level of equity exposure.
Additional Resource:
The Journal of Financial Planning article, “The Wild, Wild, West: Understanding Cryptocurrencies and Their Implications on Financial Planning” (June 2018 issue) educates readers on the basics of cryptocurrencies and blockchain technology, and explores the tax and estate planning implications of cryptocurrencies as an investment. Access the article here.
6
Key Finding

Seeking Returns
Financial Planning Association (FPA) | Journal of Financial Planning | FPA Research and Practice Institute™
5%11%
21%
12% 22%
20%
9%
Very confident ConfidentSomewhat confident NeutralSomewhat doubtful DoubtfulVery doubtful
How confident are you in the ability of the traditional 60/40 stocks and bonds portfolio to provide similar returns as it has historically?
Many Advisers Say a 60/40 Portfolio Is Still Viable
Survey respondents were asked how confident they were that a 60/40 portfolio could provide similar returns as it has historically. A slight majority (51%) are somewhat to very confident in the traditional 60/40 portfolio, consistent with the 2017 results.
Meanwhile, slightly fewer advisers were neutral on this in 2018 (12 percent) than in 2017 (14 percent), and only five-percent were “very doubtful” that the traditional 60/40 mix could continue to provide historical returns, compared to 10 percent who were very doubtful in 2017.
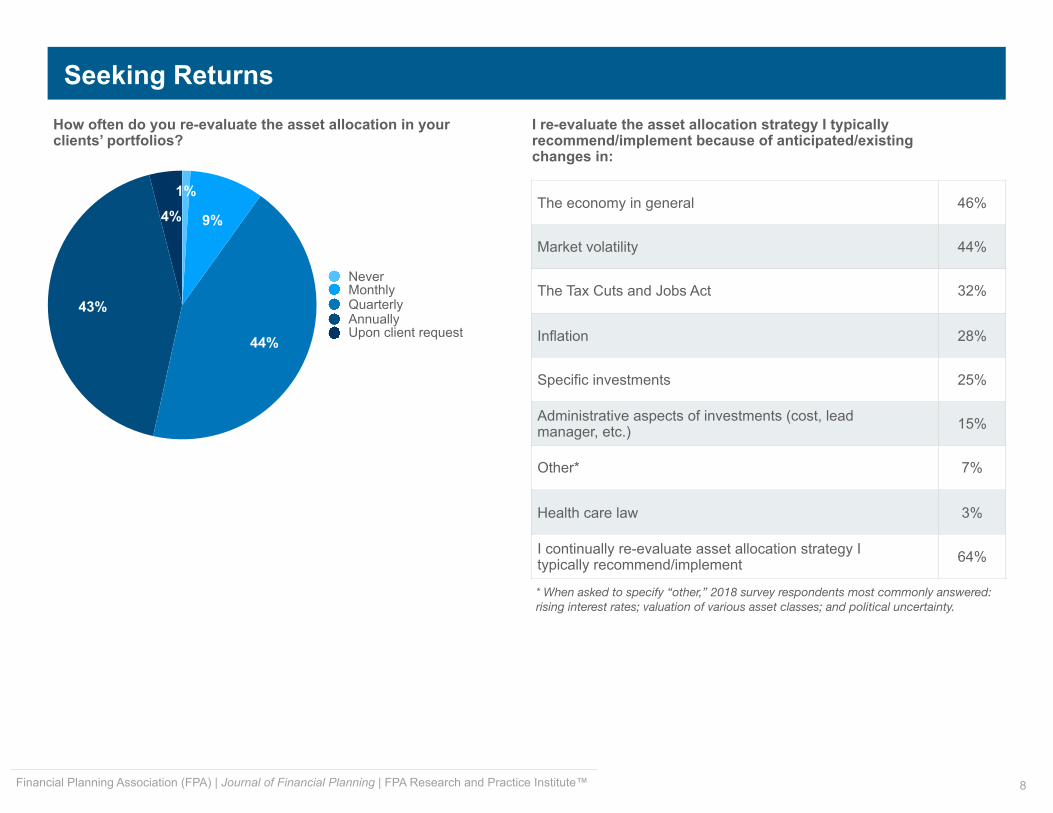
Taking Another Look at Asset Allocation
Survey results show that most advisers (68 percent) were either currently re-evaluating the asset allocation they typically recommend and/or implement, or they had done so within the last three months, compared to 30 percent who had not and 2 percent who did not know.
Advisers who indicated they were re-evaluating asset allocation were asked about the reasons why. Many were spurred to re-evaluate because of anticipated or existing changes to the economy in general and/or market volatility. About one-third of survey respondents said tax reform (Tax Cuts and Jobs Act) is cause to re-evaluate, and one-third also indicated that anticipated changes in inflation is making them take another look at asset allocation. Meanwhile, 64 percent of survey respondents said they continually re-evaluate their asset allocation strategy.
7
Key Finding
Key Finding
Seeking Returns
Financial Planning Association (FPA) | Journal of Financial Planning | FPA Research and Practice Institute™
The economy in general 46%
Market volatility 44%
The Tax Cuts and Jobs Act 32%
Inflation 28%
Specific investments 25%
Administrative aspects of investments (cost, lead manager, etc.) 15%
Other* 7%
Health care law 3%
I continually re-evaluate asset allocation strategy I typically recommend/implement 64%
I re-evaluate the asset allocation strategy I typically recommend/implement because of anticipated/existing changes in:
* When asked to specify “other,” 2018 survey respondents most commonly answered: rising interest rates; valuation of various asset classes; and political uncertainty.
4%
43%
44%
9%
1%
NeverMonthlyQuarterlyAnnuallyUpon client request
How often do you re-evaluate the asset allocation in your clients’ portfolios?
8

0
20
40
60
80
2014 2015 2016 2017 2018
65%
77%
64%61%
57%
22%
15%19%
24%25%
12%7%
15%15%18%
Active management Passive management A blend of the two
Seeking Returns
In general, which type of management do you think provides the best overall investment performance taking into account costs associated with each management style?
Active vs. Passive: Advisers continue to favor a blend of active and passive management style. This has been a consistent trend over the last five years, however, results suggest a slight shift in 2018 to a bit more preference for a passive approach to investment management (note the increase in passive management from 15 percent in 2017 to 22 percent in 2018).
Financial Planning Association (FPA) | Journal of Financial Planning | FPA Research and Practice Institute™ 9
Key Finding

Economic Outlook
Financial Planning Association (FPA) | Journal of Financial Planning | FPA Research and Practice Institute™
Next 6 Months
1 2 3 4 5
20% 37% 33% 10% 1%
Next 12 Months
1 2 3 4 5
12% 33% 41% 11% 3%
Next 2 Years
1 2 3 4 5
7% 22% 42% 21% 8%
Next 5 Years
1 2 3 4 5
18% 25% 31% 18% 8%
What is your economic outlook for the… (1=Bullish, 5=Bearish)
Advisers Are Bullish for the Short Term
Advisers were asked about their economic outlook for the next six months, 12 months, two years, and five years. Results show advisers are generally bullish for the next six months, but their longer-term expectations for the economy are waning, with a slight uptick in bearish sentiment for their two-year and five-year outlook.
10
Key Finding

About the Respondents
Financial Planning Association (FPA) | Journal of Financial Planning | FPA Research and Practice Institute™
Fee-Only 60%
Fee and Commission 39%
Commission Only 1%
How are you compensated by your clients for your investment services?
Independent IAR/RIA 55%
Dually registered adviser 15%
Registered rep, independent adviser affiliated with a B-D 13%
Registered rep, employee for a B-D 5%
Unregistered planner/adviser 4%
Registered rep working for a bank, credit union, or savings & loan 4%
Other 4%
What is your primary practice model/registration status?
34%
13%10%
19%
23%
5 or less6 to 1011 to1516 to 2021 or more
How many years have you been in the financial services profession?
What designations do you hold?
11
CFP® 78%
FINRA registered representative 33%
ChFC® 12%
None 12%
CFA 6%
AIF® 5%

About Us
Financial Planning Association (FPA) | Journal of Financial Planning | FPA Research and Practice Institute™
oFinancial Planning®
f
About the Journal of Financial Planning
First published in 1979, the mission of the Journal of Financial Planning is to expand the body of knowledge of the financial planning profession. With monthly feature articles, interviews, columns, and peer-reviewed technical contributions, the Journal's content is dynamic, innovative, thought-provoking, and directly beneficial to financial advisers in their work. Learn more at www.FPAJournal.org.
About the Financial Planning Association
The Financial Planning Association® (FPA®) is the principal professional organization for CERTIFIED FINANCIAL PLANNERTM (CFP®) professionals, educators, financial services professionals and students who are committed to elevating the profession that transforms lives through the power of financial planning. Through a collaborative effort to provide members with tools and resources for professional education, business support, advocacy and community, FPA is the indispensable resource in the advancement of today’s CFP® professional. Learn more about at www.OneFPA.org and follow on Twitter at twitter.com/fpassociation.
About the FPA Research and Practice Institute™
The FPA Research and Practice Institute™ provides CFP® professionals with access to practice and business management insights to help them achieve business success. A program of the Financial Planning Association® (FPA®), the Institute conducts original research on business-centric topics and issues, including operations, personnel, human resources, marketing and technology. Detailed analyses, reports, white papers and resources, based on the research, are made available to financial planning professionals to help them identify their business gaps and address them. Learn more here.
12

Trends in Investing Survey2018
To speak with a representative of the Financial Planning Association or the Journal of Financial Planning, please contact:
Ben Lewis Director of Public Relations
Financial Planning Association 303.867.7190
oFinancial Planning®
f
Where financial advisers are investing today and tomorrow
An annual survey by:
iiiiiiiiiiiiiiiiiiiiiiiiiiiiiiiiiiiiiiiiiiiiiiiiiiiiiiiiiiiiiiiiiiiiiiiiiiiiiiii
iiiiiiiiiiiiiiiiiiiiiiiiiiiiiiiiiiiiiiiiiiiiiiiiiiiiiiiiiiiiiiiiiiiiiiiiiiiiiiii
iiiiiiiiiiiiiiiiiiiiiiiiiiiiiiiiiiiiiiiiiiiiiiiiiiiiiiiiiiiiiiiiiiiiiiiiiiiiiiii
iiiiiiiiiiiiiiiiiiiiiiiiiiiiiiiiiiiiiiiiiiiiiiiiiiiiiiiiiiiiiiiiiiiiiiiiiiiiiiii