2018 traffic safety report - larimer county
TRANSCRIPT

2018Traffic Safety Report 1
2018 TRAFFIC SAFETY
REPORT
200 W. Oak St. ● Fort Collins, CO 80521 ● 970.498.5700 ● Larimer.org
LARIMER COUNTY
ENGINEERING DEPARTMENT
2 2018 Traffic Safety Report
Table of Contents
Introduction 3
2018 Crash Trends 4
Overall Crashes 5
Crash Rates 7
Crashes Caused By Distracted Drivers 8
Crashes Caused By Impaired Drivers 9
Serious Crash Review 10
12 Roadway Departure Crashes
Motorcycle Crashes 13
Bicycle and Pedestrian Crashes 14
Animal Related Crashes 15
Traffic Safety Mitigation 16
2018 Low Cost Safety Improvements 17
Traffic Safety Mitigation 2019 18
Safety Improvement Monitoring and Evaluation 19
Appendix A — 2018 Fatal Crash Descriptions/Locations 20
Appendix B — Monitoring of Low Cost Safety Improve-
ments at Seven Intersections
21

2018Traffic Safety Report 3
Introduction
This report covers the unincorpo-
rated roadways in Larimer County
that the County has responsibility
to maintain. Unincorporated Lar-
imer County has nearly 890 miles
of roadways - 105 miles in subdi-
visions, 82 in urban areas sur-
rounding communities, and 703 in
rural portions of the county.
Larimer County strives to make
roadways as safe as possible. The
Traffic Safety Program Goal is to
reduce the number and severity
of crashes on our roadways.
Crashes are categorized into three classes by severi-
ty: Property Damage Only (PDO), Injury, and Fatal.
A property damage only crash indicates that no one
was injured or killed in the crash. In an injury crash
at least one person was injured in the crash but no
one was killed. In a fatal crash at least one person
lost their life although there may also have been in-
juries sustained by other persons.
Property damage only crashes were up nearly 18%
over 2017. Injury crashes were up slightly in 2018
compared to 2017. However, fatal crashes decreased
to the lowest level since 2012, contrary to state and
national trends. Larimer County saw 3 fatal crashes
resulting in 3 fatalities in 2018.
Crashes and crash severity are often influenced by
the choices people make. Examples of these choices
include speeding, distracted driving, driving under
the influence of alcohol or drugs, and seat belt or
helmet use.
This report summarizes crashes in unincorporated
Larimer County by a variety of factors that are fo-
cused on areas of interest and identification of
trends to be addressed through safety improve-
ments and education.
2017 Colorado Deaths
Caused by…
Cardiovascular Disease1
9,661
Influenza & Pneumonia1
576
Motor Vehicle Crash1
672
All Larimer County Roadway
Fatalities, 20172
37
Unincorporated Larimer County
Roadway Fatalities, 2018
3
Sources: 1www.www.colorado.gov/pacific/coepht/death-data-statistics 2www.larimer.org/coroner/annual-reports
4 2018 Traffic Safety Report
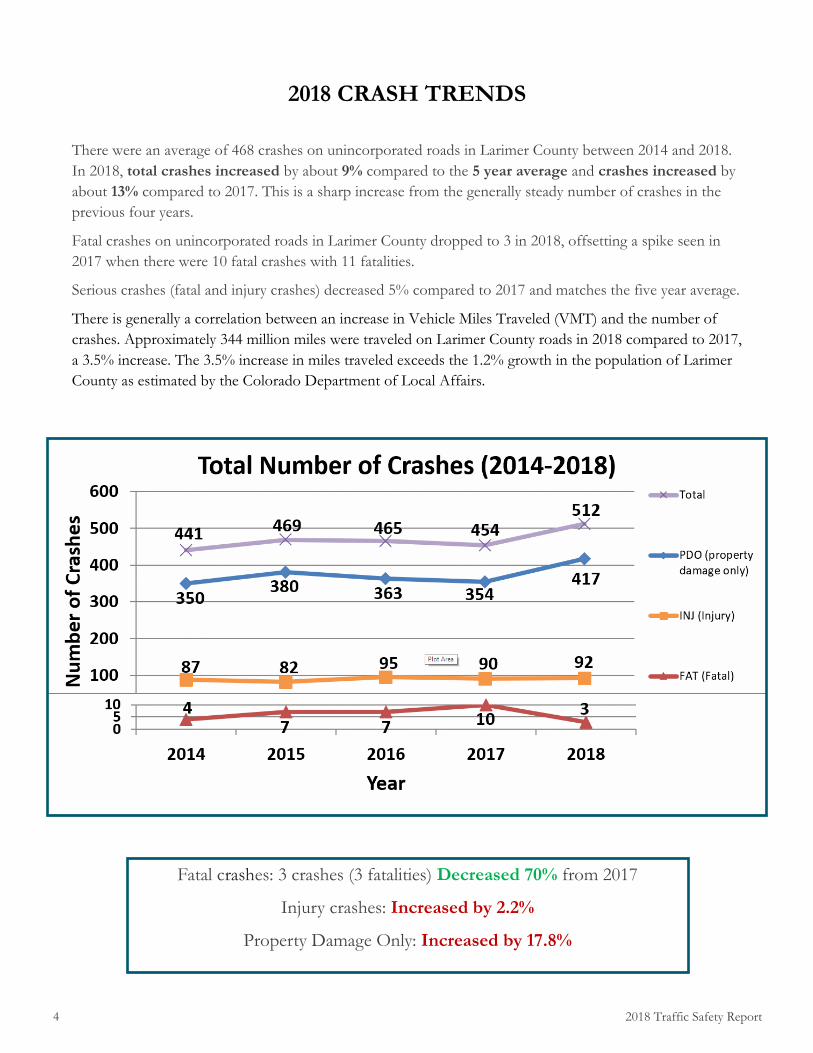
Fatal crashes: 3 crashes (3 fatalities) Decreased 70% from 2017
Injury crashes: Increased by 2.2%
Property Damage Only: Increased by 17.8%
2018 CRASH TRENDS
There were an average of 468 crashes on unincorporated roads in Larimer County between 2014 and 2018.
In 2018, total crashes increased by about 9% compared to the 5 year average and crashes increased by
about 13% compared to 2017. This is a sharp increase from the generally steady number of crashes in the
previous four years.
Fatal crashes on unincorporated roads in Larimer County dropped to 3 in 2018, offsetting a spike seen in
2017 when there were 10 fatal crashes with 11 fatalities.
Serious crashes (fatal and injury crashes) decreased 5% compared to 2017 and matches the five year average.
There is generally a correlation between an increase in Vehicle Miles Traveled (VMT) and the number of
crashes. Approximately 344 million miles were traveled on Larimer County roads in 2018 compared to 2017,
a 3.5% increase. The 3.5% increase in miles traveled exceeds the 1.2% growth in the population of Larimer
County as estimated by the Colorado Department of Local Affairs.
2018Traffic Safety Report 5
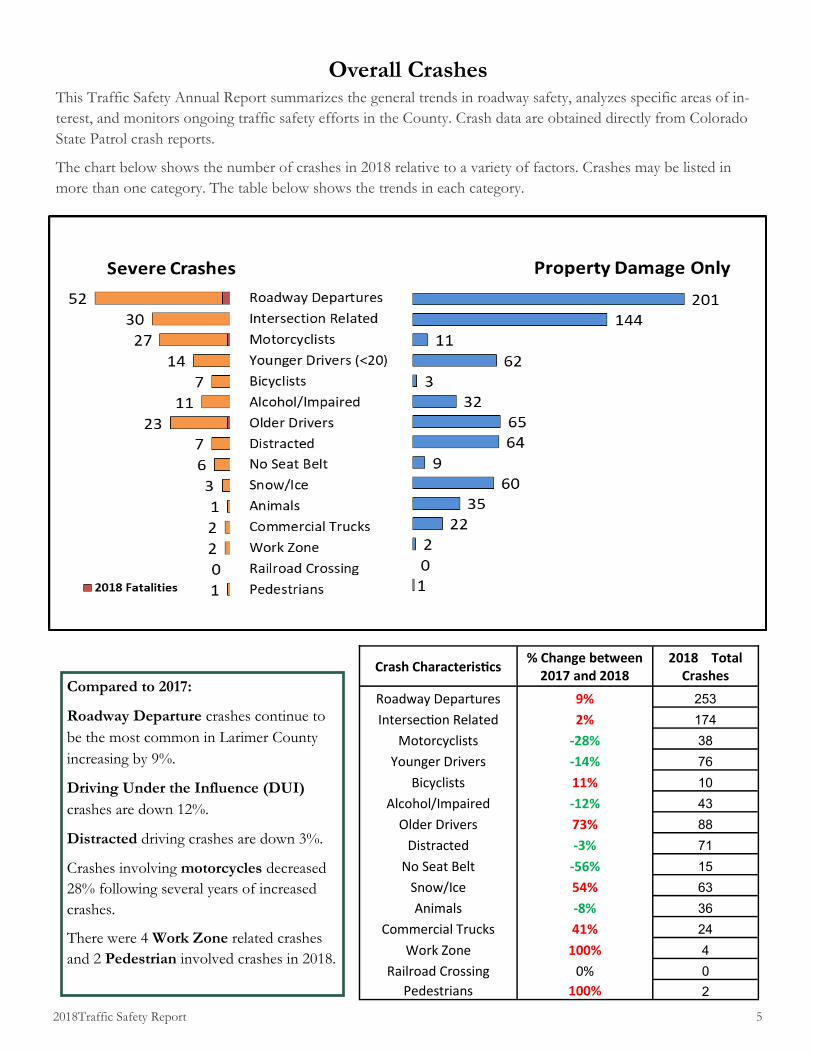
Overall Crashes This Traffic Safety Annual Report summarizes the general trends in roadway safety, analyzes specific areas of in-
terest, and monitors ongoing traffic safety efforts in the County. Crash data are obtained directly from Colorado
State Patrol crash reports.
The chart below shows the number of crashes in 2018 relative to a variety of factors. Crashes may be listed in
more than one category. The table below shows the trends in each category.
Compared to 2017:
Roadway Departure crashes continue to
be the most common in Larimer County
increasing by 9%.
Driving Under the Influence (DUI)
crashes are down 12%.
Distracted driving crashes are down 3%.
Crashes involving motorcycles decreased
28% following several years of increased
crashes.
There were 4 Work Zone related crashes
and 2 Pedestrian involved crashes in 2018.
Crash Characteristics % Change between
2017 and 2018 2018 Total
Crashes
Roadway Departures 9% 253
Intersection Related 2% 174
Motorcyclists -28% 38
Younger Drivers -14% 76
Bicyclists 11% 10
Alcohol/Impaired -12% 43
Older Drivers 73% 88
Distracted -3% 71
No Seat Belt -56% 15
Snow/Ice 54% 63
Animals -8% 36
Commercial Trucks 41% 24
Work Zone 100% 4
Railroad Crossing 0% 0
Pedestrians 100% 2

6 2018 Traffic Safety Report
Driving is about human interaction with the
vehicle, the natural elements and with other
drivers on the roads.
In 2018, 65% of all crashes in unincorpo-
rated Larimer County had a human contrib-
uting factor.
Overall Crashes (continued)
Out of 297 crashes with Human Contributing
Factors, 1 was fatal and 59 had injuries. The five
leading causes of injury or death are:
• Driving Under the Influence (11)
• Drivers Inexperience (10)
• Aggressive driving (9)
• Distracted (7)
• Driver unfamiliar with area (7)
2018Traffic Safety Report 7
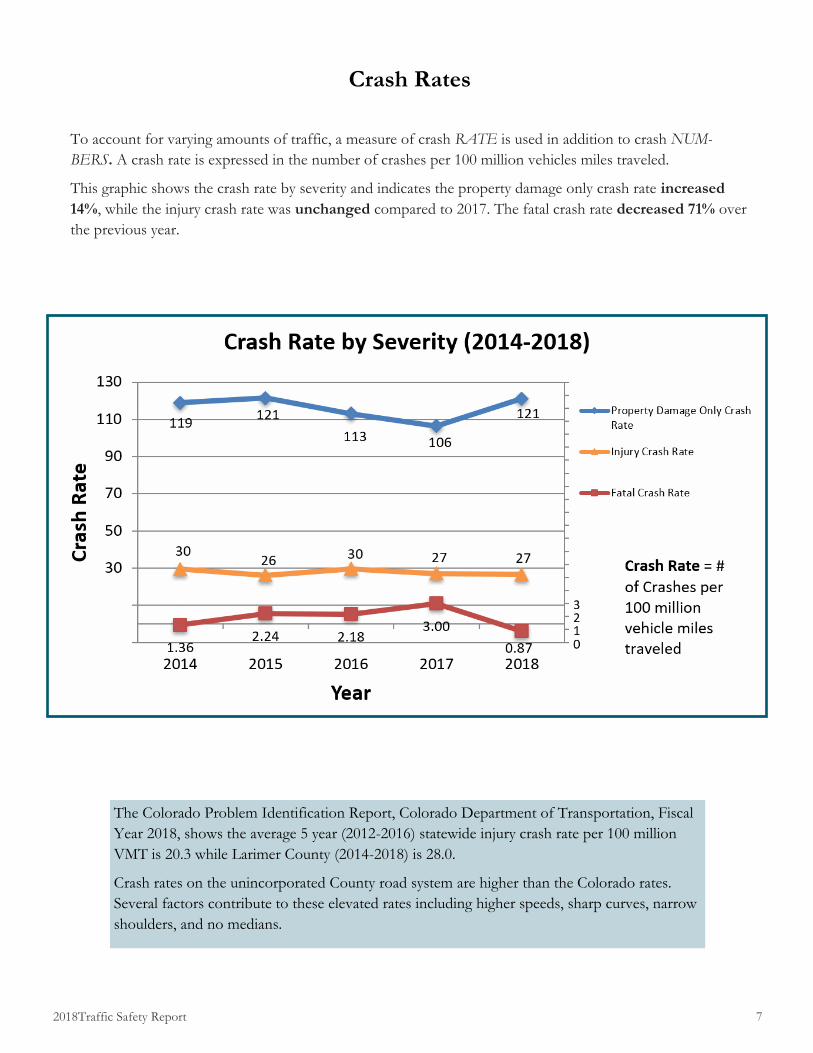
Crash Rates
To account for varying amounts of traffic, a measure of crash RATE is used in addition to crash NUM-
BERS. A crash rate is expressed in the number of crashes per 100 million vehicles miles traveled.
This graphic shows the crash rate by severity and indicates the property damage only crash rate increased
14%, while the injury crash rate was unchanged compared to 2017. The fatal crash rate decreased 71% over
the previous year.
The Colorado Problem Identification Report, Colorado Department of Transportation, Fiscal
Year 2018, shows the average 5 year (2012-2016) statewide injury crash rate per 100 million
VMT is 20.3 while Larimer County (2014-2018) is 28.0.
Crash rates on the unincorporated County road system are higher than the Colorado rates.
Several factors contribute to these elevated rates including higher speeds, sharp curves, narrow
shoulders, and no medians.

8 2018 Traffic Safety Report
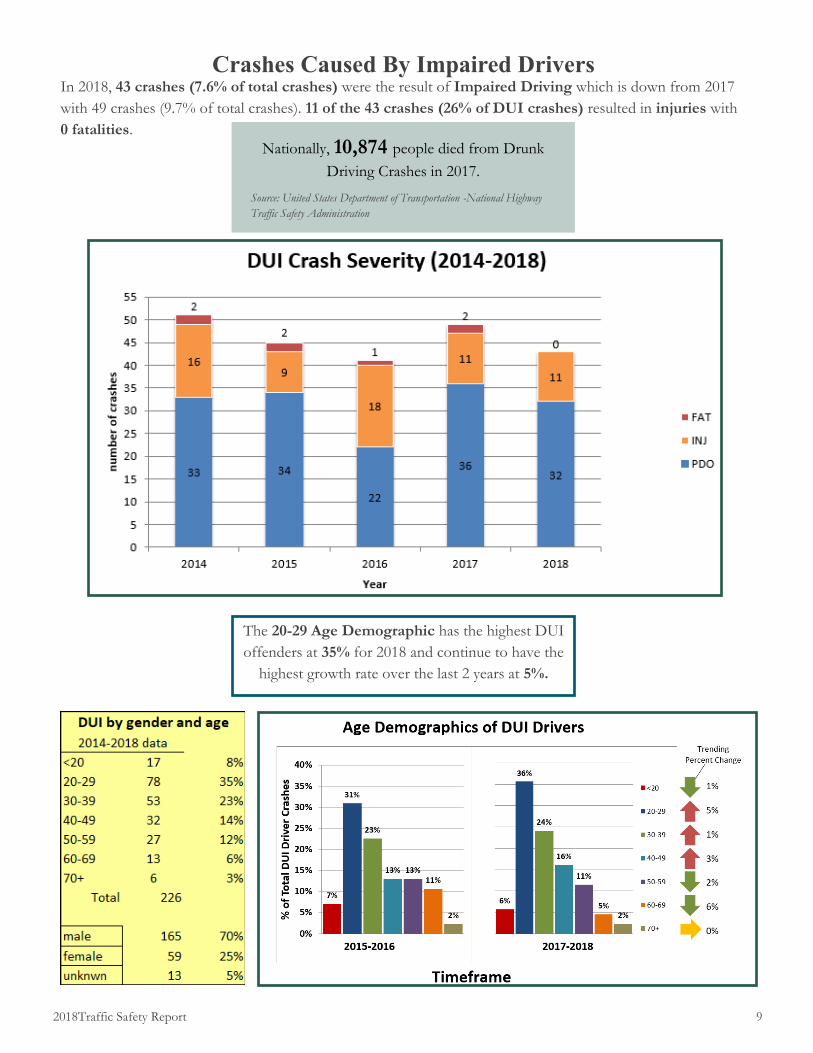
Crashes Caused By Distracted Drivers Distracted Drivers accounted for 71 crashes (12.5% of total crashes) in 2018; 7 of the 71 (9.8%)
were injury crashes with 0 fatalities. The demographic committing the most offenses continues to be
20-29 year olds at 33.8%.
Nationally, 3,166 people died
from crashes caused by distracted
driving in 2017.
Source: United States Department of Transportation -
National Highway Traffic Safety Administration
Cell phone use has been steadily
growing over the past 6 years.
2018 was no exception - 19 acci-
dents compared to 15 in 2017.
2018Traffic Safety Report 9
Crashes Caused By Impaired Drivers
Nationally, 10,874 people died from Drunk
Driving Crashes in 2017.
Source: United States Department of Transportation -National Highway
Traffic Safety Administration
In 2018, 43 crashes (7.6% of total crashes) were the result of Impaired Driving which is down from 2017
with 49 crashes (9.7% of total crashes). 11 of the 43 crashes (26% of DUI crashes) resulted in injuries with
0 fatalities.
The 20-29 Age Demographic has the highest DUI
offenders at 35% for 2018 and continue to have the
highest growth rate over the last 2 years at 5%.
10 2018 Traffic Safety Report
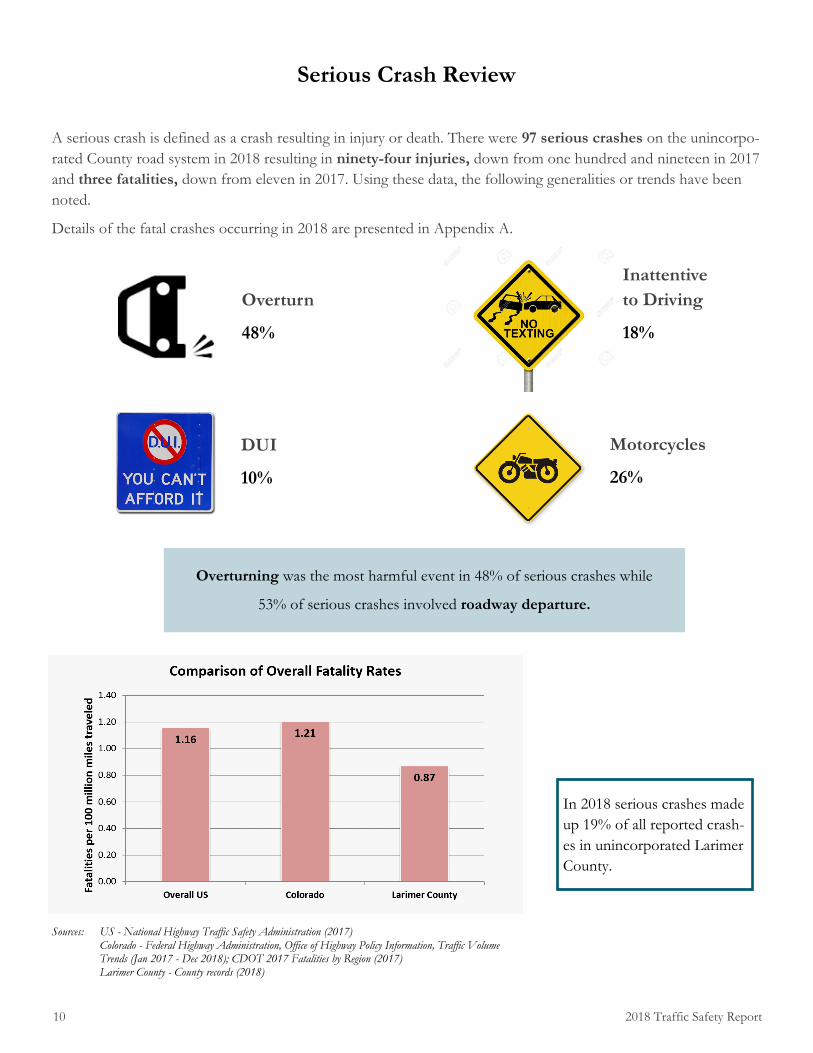
Serious Crash Review
A serious crash is defined as a crash resulting in injury or death. There were 97 serious crashes on the unincorpo-
rated County road system in 2018 resulting in ninety-four injuries, down from one hundred and nineteen in 2017
and three fatalities, down from eleven in 2017. Using these data, the following generalities or trends have been
noted.
Details of the fatal crashes occurring in 2018 are presented in Appendix A.
Sources: US - National Highway Traffic Safety Administration (2017) Colorado - Federal Highway Administration, Office of Highway Policy Information, Traffic Volume
Trends (Jan 2017 - Dec 2018); CDOT 2017 Fatalities by Region (2017) Larimer County - County records (2018)
Overturn
48%
Motorcycles
26%
Inattentive
to Driving
18%
Overturning was the most harmful event in 48% of serious crashes while
53% of serious crashes involved roadway departure.
In 2018 serious crashes made
up 19% of all reported crash-
es in unincorporated Larimer
County.
DUI
10%
2018Traffic Safety Report 11
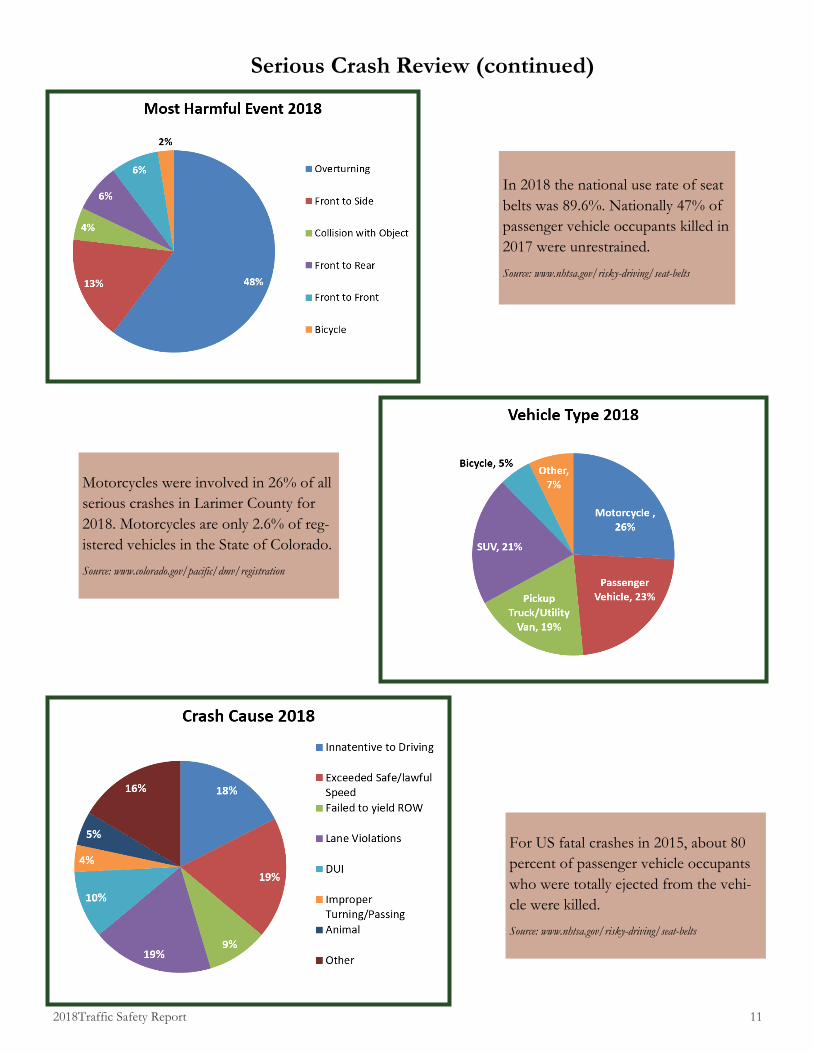
In 2018 the national use rate of seat
belts was 89.6%. Nationally 47% of
passenger vehicle occupants killed in
2017 were unrestrained.
Source: www.nhtsa.gov/risky-driving/seat-belts
Serious Crash Review (continued)
Motorcycles were involved in 26% of all
serious crashes in Larimer County for
2018. Motorcycles are only 2.6% of reg-
istered vehicles in the State of Colorado.
Source: www.colorado.gov/pacific/dmv/registration
For US fatal crashes in 2015, about 80
percent of passenger vehicle occupants
who were totally ejected from the vehi-
cle were killed.
Source: www.nhtsa.gov/risky-driving/seat-belts

12 2018 Traffic Safety Report
Roadway Departure Crashes Two-lane rural roads are the most dangerous part of the road
system. In 2018, 45% of all crashes involved a vehicle leaving
the roadway (roadway departure crash). Here’s what we know
about those crashes:
Road Condition: 72% of the crashes occurred on dry
roads
Light Condition: 55% occurred during daylight hours
56% of all roadway departure
crashes in 2018 were reported
to be on straight sections of
roadway. 29% were reported to
be on curvilinear sections of
road with a grade.
11% of all roadway
departure crashes in
2018 were DUI related.
According to the 2018 data, 43% of roadway departure crashes occurred at curves in the roadway, either
level or on a grade. Larimer County is in the process of reviewing all horizontal curves and turns on the
Larimer County road system. Safe advisory speeds are being reviewed and adjusted. Locations that would
benefit from additional signing are being upgraded with additional chevron or large arrow warning signs at
the curve locations.

2018Traffic Safety Report 13
Motorcycles Crashes Motorcycles were involved in 38 accidents (6.7% of total accidents) in 2018, down from 53 accidents (12%
of total accidents) in 2017. However, the chance of injury or death is disproportionally higher. In 2018, 71%
of motorcycle crashes resulted in injury or death compared to 19% in other vehicles.
In 2018, 84% of the reported
motorcycle crashes listed the
motorcyclist as the cause of the
accident.
The majority of motorcycle crashes are
caused by Inattentive Driving, Speed,
or Lane Violations, accounting for
75% between these three causes.
Coloradoan, 2014

14 2018 Traffic Safety Report
Bicycle and Pedestrian Crashes
Bicycle Crashes
Bicycling is a popular activity in Larimer County whether riding for commuting or pleasure. Fort Collins is
listed as the 11th highest city in the nation for bicycle commuters at 5.3%¹. Many of the cities and towns ac-
tively promote bicycling and many special events are requested
and held on county roads in the summertime.
11 crashes in 2018 involved a bicycle, in 5 of those the bicyclist
was reported at-fault.
¹Source: The League of American Bicyclists - Analysis of bicycle commuting in American Cities Report
Pedestrian Crashes
The number of crashes involving pedestrians is low in Larimer County with 7 during the last five years. This re-
flects the general rural character of Larimer County roads. Locations with significant pedestrian traffic include
parks, open spaces, trails, or near city development.
In 2018 there were 2 crashes in-
volving pedestrians. One serious
accident was caused by a driver
that disobeyed work zone traffic
laws by swerv-
ing around
stopped traffic
& hitting a
road construc-
tion crew
member.
72% of bicycle crashes in 2018
were at or related to an intersec-
tion or roundabout.

2018Traffic Safety Report 15
Animal Related Crashes
77% of reported animal crashes were
with wild animals. 18% of the crashes
involved domestic cows.
The most common animal crash was
with deer, 72% of all animal crashes
2/3 of all wild animal crashes in 2018
were at dawn, dusk or at night.
The total number of reported animal collisions in
2018 was 39, the same number of animal crashes as
reported in 2017. Again, all but one of the crashes
involved large animals, both wild and domestic, that
cause more damage and injury. These numbers do
not include crashes where an animal was not hit but
may have caused the crash.
44% of all animal crashes in
2018 occurred during the
months of October and
November.
16 2018 Traffic Safety Report
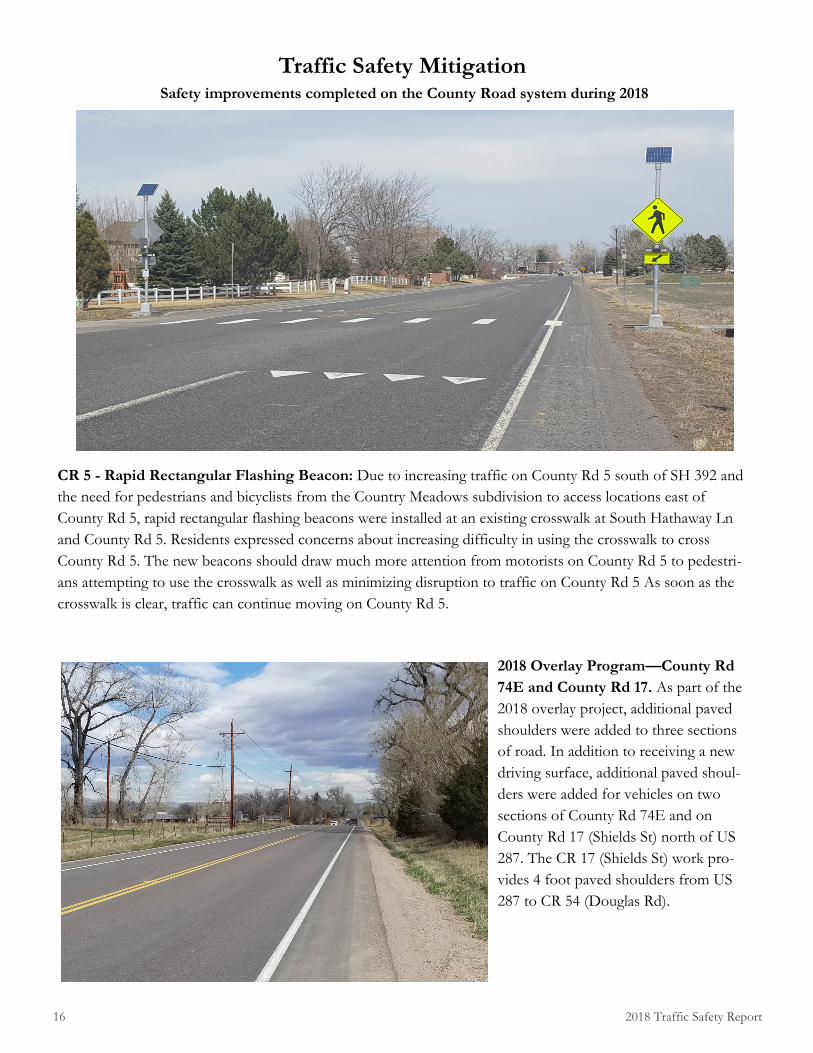
Traffic Safety Mitigation Safety improvements completed on the County Road system during 2018
CR 5 - Rapid Rectangular Flashing Beacon: Due to increasing traffic on County Rd 5 south of SH 392 and
the need for pedestrians and bicyclists from the Country Meadows subdivision to access locations east of
County Rd 5, rapid rectangular flashing beacons were installed at an existing crosswalk at South Hathaway Ln
and County Rd 5. Residents expressed concerns about increasing difficulty in using the crosswalk to cross
County Rd 5. The new beacons should draw much more attention from motorists on County Rd 5 to pedestri-
ans attempting to use the crosswalk as well as minimizing disruption to traffic on County Rd 5 As soon as the
crosswalk is clear, traffic can continue moving on County Rd 5.
2018 Overlay Program—County Rd
74E and County Rd 17. As part of the
2018 overlay project, additional paved
shoulders were added to three sections
of road. In addition to receiving a new
driving surface, additional paved shoul-
ders were added for vehicles on two
sections of County Rd 74E and on
County Rd 17 (Shields St) north of US
287. The CR 17 (Shields St) work pro-
vides 4 foot paved shoulders from US
287 to CR 54 (Douglas Rd).
2018Traffic Safety Report 17
2018 Low Cost Safety Improvements
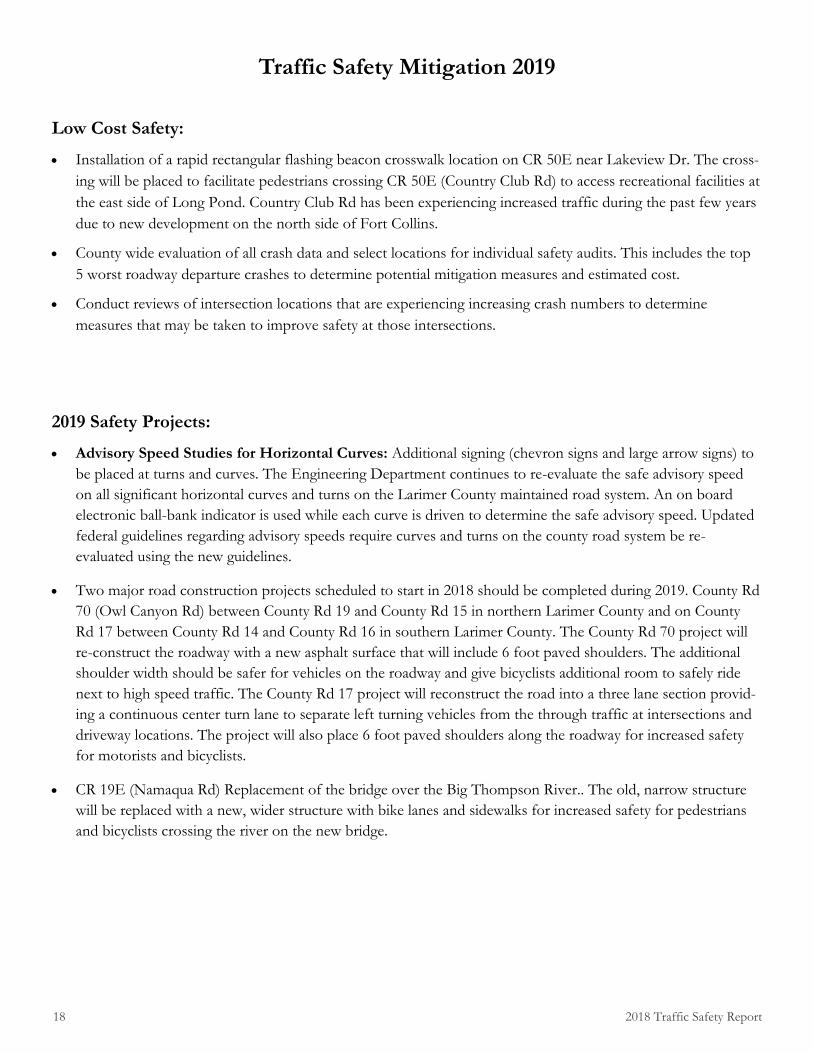
CR 30 eastbound at CR 13 on the side of Donath Lake. There
have been a few run off the road crashes at the T-intersection of CR
30 at CR 13. A Stop Ahead Symbol sign and a Large Double Arrow
sign were added in an effort to reduce these type of crashes. A ther-
moplastic Stop Bar was also placed on CR 30.
•
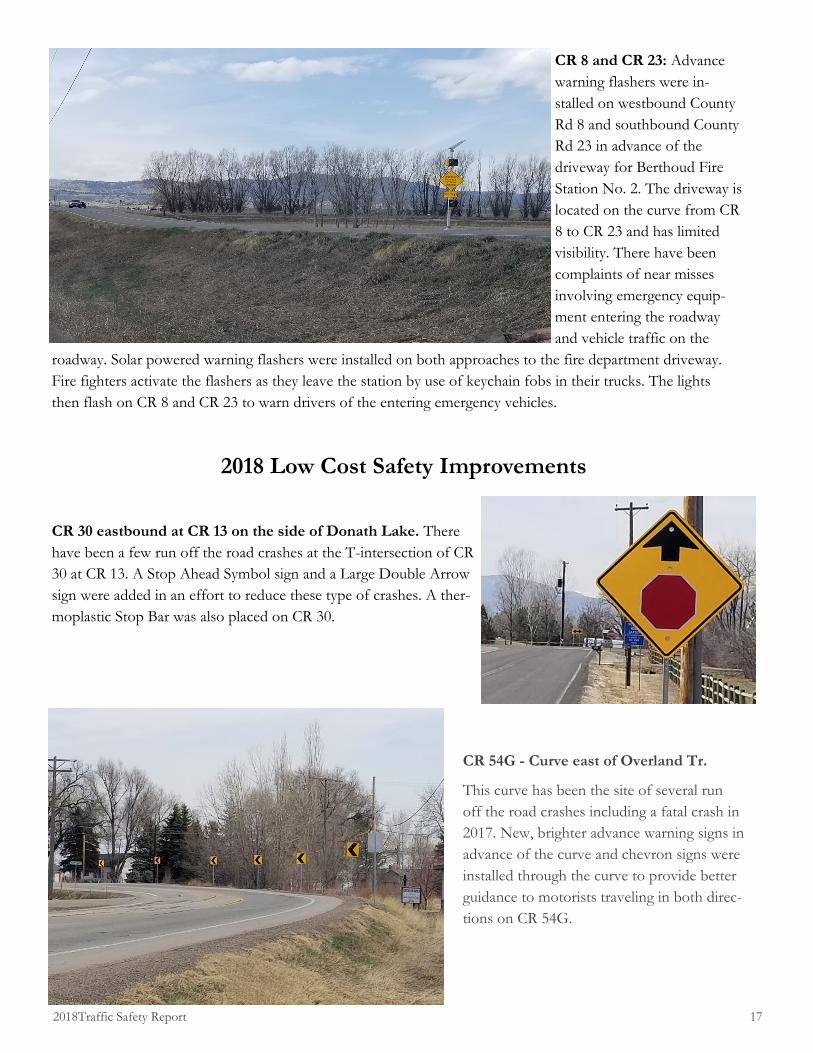
CR 8 and CR 23: Advance
warning flashers were in-
stalled on westbound County
Rd 8 and southbound County
Rd 23 in advance of the
driveway for Berthoud Fire
Station No. 2. The driveway is
located on the curve from CR
8 to CR 23 and has limited
visibility. There have been
complaints of near misses
involving emergency equip-
ment entering the roadway
and vehicle traffic on the
roadway. Solar powered warning flashers were installed on both approaches to the fire department driveway.
Fire fighters activate the flashers as they leave the station by use of keychain fobs in their trucks. The lights
then flash on CR 8 and CR 23 to warn drivers of the entering emergency vehicles.
CR 54G - Curve east of Overland Tr.
This curve has been the site of several run
off the road crashes including a fatal crash in
2017. New, brighter advance warning signs in
advance of the curve and chevron signs were
installed through the curve to provide better
guidance to motorists traveling in both direc-
tions on CR 54G.
18 2018 Traffic Safety Report
Traffic Safety Mitigation 2019
Low Cost Safety:
• Installation of a rapid rectangular flashing beacon crosswalk location on CR 50E near Lakeview Dr. The cross-
ing will be placed to facilitate pedestrians crossing CR 50E (Country Club Rd) to access recreational facilities at
the east side of Long Pond. Country Club Rd has been experiencing increased traffic during the past few years
due to new development on the north side of Fort Collins.
• County wide evaluation of all crash data and select locations for individual safety audits. This includes the top
5 worst roadway departure crashes to determine potential mitigation measures and estimated cost.
• Conduct reviews of intersection locations that are experiencing increasing crash numbers to determine
measures that may be taken to improve safety at those intersections.
2019 Safety Projects:
• Advisory Speed Studies for Horizontal Curves: Additional signing (chevron signs and large arrow signs) to
be placed at turns and curves. The Engineering Department continues to re-evaluate the safe advisory speed
on all significant horizontal curves and turns on the Larimer County maintained road system. An on board
electronic ball-bank indicator is used while each curve is driven to determine the safe advisory speed. Updated
federal guidelines regarding advisory speeds require curves and turns on the county road system be re-
evaluated using the new guidelines.
• Two major road construction projects scheduled to start in 2018 should be completed during 2019. County Rd
70 (Owl Canyon Rd) between County Rd 19 and County Rd 15 in northern Larimer County and on County
Rd 17 between County Rd 14 and County Rd 16 in southern Larimer County. The County Rd 70 project will
re-construct the roadway with a new asphalt surface that will include 6 foot paved shoulders. The additional
shoulder width should be safer for vehicles on the roadway and give bicyclists additional room to safely ride
next to high speed traffic. The County Rd 17 project will reconstruct the road into a three lane section provid-
ing a continuous center turn lane to separate left turning vehicles from the through traffic at intersections and
driveway locations. The project will also place 6 foot paved shoulders along the roadway for increased safety
for motorists and bicyclists.
• CR 19E (Namaqua Rd) Replacement of the bridge over the Big Thompson River.. The old, narrow structure
will be replaced with a new, wider structure with bike lanes and sidewalks for increased safety for pedestrians
and bicyclists crossing the river on the new bridge.
2018Traffic Safety Report 19
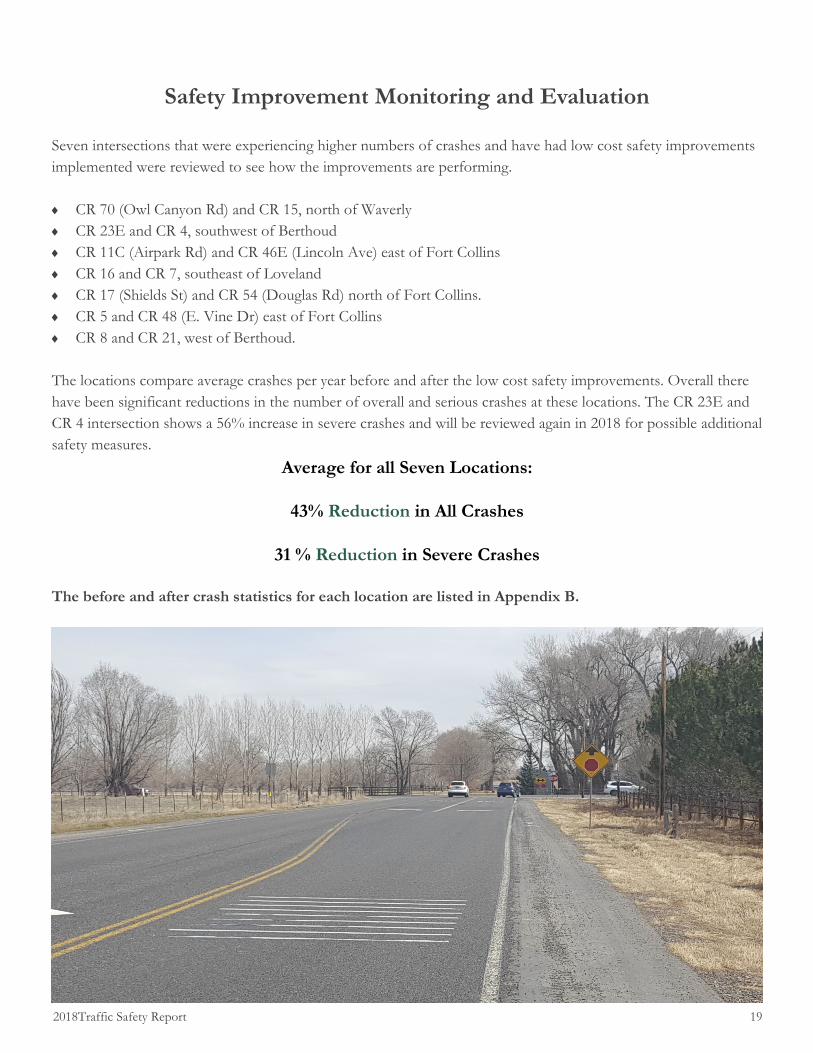
Safety Improvement Monitoring and Evaluation
Seven intersections that were experiencing higher numbers of crashes and have had low cost safety improvements
implemented were reviewed to see how the improvements are performing.
CR 70 (Owl Canyon Rd) and CR 15, north of Waverly
CR 23E and CR 4, southwest of Berthoud
CR 11C (Airpark Rd) and CR 46E (Lincoln Ave) east of Fort Collins
CR 16 and CR 7, southeast of Loveland
CR 17 (Shields St) and CR 54 (Douglas Rd) north of Fort Collins.
CR 5 and CR 48 (E. Vine Dr) east of Fort Collins
CR 8 and CR 21, west of Berthoud.
The locations compare average crashes per year before and after the low cost safety improvements. Overall there
have been significant reductions in the number of overall and serious crashes at these locations. The CR 23E and
CR 4 intersection shows a 56% increase in severe crashes and will be reviewed again in 2018 for possible additional
safety measures.
Average for all Seven Locations:
43% Reduction in All Crashes
31 % Reduction in Severe Crashes
The before and after crash statistics for each location are listed in Appendix B.
20 2018 Traffic Safety Report
Appendix A
2018 Fatal Crash Descriptions/Locations
County Rd 54G: 469 Feet west of Indigo Hills Ln on Jan 1, 2018. An eastbound Volkswagen sedan entered a
left curve. The vehicle ran off the right side of the road steered, attempted to correct and rotated in both
directions for over 200 feet. The vehicle ran off the road again slid broadside and collided with a traffic sign.
The vehicle continued sliding and then began rolling down a steep embankment. The vehicle collided with a
power pole and wire fence and continued rolling and collided with bushes and trees coming to rest on it’s
roof. During the roll, the driver was ejected from the vehicle and came to rest 25 feet from the final vehicle
location. Vehicle rolled a total of 3 1/2 times. According to the crash report, safety equipment (seat belt) was
not in use. Estimated vehicle speed was 60 MPH in a 35 MPH speed zone. Crash occurred on a dry road-
way at 9:30 PM.
County Rd 69: 161 feet south of mile marker 2 on May 20, 2018. A northbound pickup truck ran off the right
side of the road and continued down a steep embankment. The pickup travelled approximately 45 feet and
then rolled 1 1/2 times eastbound. The pickup then collided with a tree and the driver was ejected. The
pickup then continued to roll over an unknown amount of times eastbound. The driver came to rest 93 feet
east of the road edge. Estimated vehicle speed was 40 MPH in a 15 MPH speed zone. According to the
crash report, safety equipment (seat belt) was not in use. Crash occurred on a non-paved wet roadway at
9:49 PM.
County Rd 23: 305 feet north of mile marker 2 (near Dixon Dam) on June, 13, 2018. A northbound motorcy-
cle failed to negotiate a left hand curve and drove off the right side of the road. The motorcycle collided
with a traffic sign and the driver collided with the same sign. The driver was ejected from the vehicle and
then collided with a rock formation. The motorcycle continued up the rock formation and then rolled back
down overturning. The motorcycle driver died on scene. According to the crash report, a motorcycle helmet
was not in use at the time of the crash. Estimated speed of the motorcycle was 90 MPH in a 35 MPH speed
zone. Driver action was listed as reckless driving. Most apparent human contributing factor listed as driver
unfamiliar with area. The crash occurred on a dry roadway at 11:34 PM.

2018Traffic Safety Report 21
Number Crashes Per Year
Segment Time Frame PDO INJ FAT
Total
Avg Minor Severe
Date Im-
proved Notes
Intersection
of CR 70
(Owl Can-
yon) and CR
15
Type of
Improvement 4-way stop with flashing beacons, added signing, and rumble strips
Average of 3
years before
improvements
and 10 years
after
Before
Improvements 1.00 2.00 0.00 3.00 1.00 2.00
March, 2008 After
Improvements 0.00 0.00 0.00 0.00 0.00 0.00
Change -100% -100% 0% -100% -100% -100%
Intersection
of CR 23E
and CR 4
Type of
Improvement Added pavement markings, cross street warning signs, and speed limit signs
Average of 5
years before
improvements
and 8 years after
Before
Improvements 1.20 0.40 0.00 1.60 1.20 0.40
2/5/2010 After
Improvements 0.63 0.63 0.00 1.25 0.63 0.63
Change -48% 56% 0% -22% -48% 56%
Intersection
of CR 11C
(Airpark)
and CR 46E
(Lincoln)
Type of
Improvement
Relocated signs, upgraded material, added cross street warning signs, pavement
markings, and painted minor street centerline
Average of 4.5
years before
improvements
and 8 years after
Before
Improvements 4.00 0.67 0.00 4.67 4.00 0.67
11/19/2010 After
Improvements 2.00 0.50 0.00 2.50 2.00 0.50
Change -50% -25% 0% -46% -50% -25%
Intersection
of CR 16
and CR 7
Type of
Improvement Upgraded sign materials and added stop ahead pavement markings
Average of 6
year before im-
provements and
9 years after
Before
Improvements 1.78 0.67 0.00 2.44 1.78 0.67
11/19/2009 After
Improvements 0.89 0.33 0.00 1.22 0.89 0.33
Change -50% -51% 0% -50% -50% -51%
Intersection
of CR 17
(Shields) and
CR 54
(Douglas)
Type of
Improvement Upgrade sign materials and added pavement markings
Average of 5
years before
improvements
and 9 years after
Before
Improvements 1.20 0.20 0.00 1.40 1.20 0.20
11/1/2009 After
Improvements 1.00 0.22 0.00 1.22 1.00 0.22
Change -17% 10% 0% -13% -17% 10%
Intersection
of CR 5 and
CR 48 (Vine)
Type of
Improvement Upgraded sign materials and added stop ahead pavement markings
Average of 4
years before
improvements
and 9 years after
Before
Improvements 0.20 0.40 0.00 0.60 0.20 0.40
10/25/2009 After
Improvements 0.22 0.11 0.00 0.33 0.22 0.11
Change 10% -73% 0% -44% 10% -73%
Appendix B
Monitoring of Low Cost Safety Improvements at
Seven Intersections

22 2018 Traffic Safety Report
Contact Information
Larimer County Engineering Department
Address
200 West Oak Street Suite 3000 Fort Collins, CO 80521
Mailing Address
PO Box 1190
Fort Collins, CO 80522-1190
Phone
(970) 498-5700
(970) 498-7986 (Fax)
Office Hours
8:00 a.m. - 4:30 p.m.
Monday - Friday
On The Web At:
www.larimer.org/engineering
Appendix B (continued)
Monitoring of Low Cost Safety Improvements at
Seven Intersections
Number Crashes Per Year
Segment Time Frame PDO INJ FAT
Total
Avg Minor Severe
Date Im-
proved Notes
Intersection
of CR 21
and CR 8
Type of
Improvement Upgraded sign materials and added stop ahead pavement markings
Average of 6
years before
improvements
and 9 years after
Before
Improvements 1.50 1.00 0.00 2.50 1.50 1.00
11/19/2009 After
Improvements 1.11 0.44 0.10 1.78 1.11 0.66
Change -26% -56% 100% -29% -26% -34%