2018 semi-annual report (unaudited) - exchange … · 2018-06-29 · the fund invests in a...
TRANSCRIPT

APRIL 30, 2018
2018 SEMI-ANNUAL REPORT (UNAUDITED)
iShares Trust
� iShares J.P. Morgan USD Emerging Markets Bond ETF | EMB | NASDAQ


Table of Contents
Fund Performance Overview . . . . . . . . . . . . . . . . . . . . . . . . . . . . . . . . . . . . . . . . . . . . . . . . . . . . . . . . . . . . . . . . . . . . . . . . . . . . . . . . . 5
About Fund Performance . . . . . . . . . . . . . . . . . . . . . . . . . . . . . . . . . . . . . . . . . . . . . . . . . . . . . . . . . . . . . . . . . . . . . . . . . . . . . . . . . . . . 6
Shareholder Expenses . . . . . . . . . . . . . . . . . . . . . . . . . . . . . . . . . . . . . . . . . . . . . . . . . . . . . . . . . . . . . . . . . . . . . . . . . . . . . . . . . . . . . . 6
Schedule of Investments . . . . . . . . . . . . . . . . . . . . . . . . . . . . . . . . . . . . . . . . . . . . . . . . . . . . . . . . . . . . . . . . . . . . . . . . . . . . . . . . . . . . . 7
Financial Statements . . . . . . . . . . . . . . . . . . . . . . . . . . . . . . . . . . . . . . . . . . . . . . . . . . . . . . . . . . . . . . . . . . . . . . . . . . . . . . . . . . . . . . . . 17
Financial Highlights . . . . . . . . . . . . . . . . . . . . . . . . . . . . . . . . . . . . . . . . . . . . . . . . . . . . . . . . . . . . . . . . . . . . . . . . . . . . . . . . . . . . . . . . . 20
Notes to Financial Statements . . . . . . . . . . . . . . . . . . . . . . . . . . . . . . . . . . . . . . . . . . . . . . . . . . . . . . . . . . . . . . . . . . . . . . . . . . . . . . . . 21
Supplemental Information . . . . . . . . . . . . . . . . . . . . . . . . . . . . . . . . . . . . . . . . . . . . . . . . . . . . . . . . . . . . . . . . . . . . . . . . . . . . . . . . . . . . 28
General Information . . . . . . . . . . . . . . . . . . . . . . . . . . . . . . . . . . . . . . . . . . . . . . . . . . . . . . . . . . . . . . . . . . . . . . . . . . . . . . . . . . . . . . . . . 29

THIS PAGE INTENTIONALLY LEFT BLANK.

Fund Performance OverviewiSHARES® J.P. MORGAN USD EMERGING MARKETS BOND ETFPerformance as of April 30, 2018
The iShares J.P. Morgan USD Emerging Markets Bond ETF (the “Fund”) seeks to track the investment results of an index
composed of U.S. dollar-denominated, emerging market bonds, as represented by the J.P. Morgan EMBI® Global Core Index (the
“Index”). The Fund invests in a representative sample of securities included in the Index that collectively has an investment profile
similar to the Index. Due to the use of representative sampling, the Fund may or may not hold all of the securities that are
included in the Index. For the six-month reporting period ended April 30, 2018, the total return for the Fund was -3.07%, net of
fees, while the total return for the Index was -2.85%.
Average Annual Total Returns Cumulative Total Returns
NAV MARKET INDEX NAV MARKET INDEX
1 Year 0.31% (0.17)% 0.71% 0.31% (0.17)% 0.71%
5 Years 2.81% 2.66% 3.46% 14.88% 14.04% 18.54%
10 Years 5.98% 5.87% 6.75% 78.74% 76.93% 92.25%
Past performance is no guarantee of future results. Performance results do not reflect the deduction of taxes that a shareholder would pay on fund distributions or on
the redemption or sale of fund shares. See “About Fund Performance” on page 6 for more information.
Shareholder Expenses
Actual Hypothetical 5% Return
BeginningAccount Value
(11/1/17)
EndingAccount Value
(4/30/18)Expenses Paid
During Period a
BeginningAccount Value
(11/1/17)
EndingAccount Value
(4/30/18)Expenses Paid
During Period aAnnualized
Expense Ratio
$ 1,000.00 $ 969.30 $ 1.90 $ 1,000.00 $ 1,022.90 $ 1.96 0.39%
a Expenses are calculated using the Fund’s annualized expense ratio (as disclosed in the table), multiplied by the average account value for the period, multipliedby the number of days in the period (181 days) and divided by the number of days in the year (365 days). See “Shareholder Expenses” on page 6 for moreinformation.
ALLOCATION BY CREDIT QUALITY
As of 4/30/18
Moody’s Credit Rating1
Percentage of
Total Investments 2
Aa 0.76%
A 14.47
Baa 33.26
Ba 20.11
B 19.69
Caa 3.92
C 0.94
Not Rated 6.85
TOTAL 100.00%
TEN LARGEST COUNTRIES
As of 4/30/18
Country
Percentage of
Total Investments 2
Mexico 6.06%
Indonesia 4.96
Turkey 4.36
Russia 4.06
Argentina 4.05
Philippines 3.87
China 3.77
Brazil 3.77
Colombia 3.51
Kazakhstan 3.32
TOTAL 41.73%
1 Credit quality ratings shown reflect the ratings assigned by Moody’s Investors Service (“Moody’s”), a widely used independent, nationally recognized statisticalrating organization. Moody’s credit ratings are opinions of the credit quality of individual obligations or of an issuer’s general creditworthiness. Investment graderatings are credit ratings of Baa or higher. Below investment grade ratings are credit ratings of Ba or lower. Unrated investments do not necessarily indicate lowcredit quality. Credit quality ratings are subject to change.
2 Excludes money market funds.
F U N D P E R F O R M A N C E O V E R V I E W 5

About Fund PerformancePast performance is no guarantee of future results. Current performance may be lower or higher than the performance data
quoted. Performance data current to the most recent month-end is available at www.ishares.com. Performance results assume
reinvestment of all dividends and capital gain distributions and do not reflect the deduction of taxes that a shareholder would pay
on fund distributions or on the redemption or sale of fund shares. The investment return and principal value of shares will vary
with changes in market conditions. Shares may be worth more or less than their original cost when they are redeemed or sold in
the market. Performance for certain funds may reflect a waiver of a portion of investment advisory fees. Without such a waiver,
performance would have been lower.
Net asset value or “NAV” is the value of one share of a fund as calculated in accordance with the standard formula for valuing
mutual fund shares. The price used to calculate market return (“Market Price”) is determined by using the midpoint between the
highest bid and the lowest offer on the primary stock exchange on which shares of a fund are listed for trading, as of the time that
such fund’s NAV is calculated. Certain funds may have a NAV which is determined prior to the opening of regular trading on its
listed exchange and their market returns are calculated using the midpoint of the bid/ask spread as of the opening of regular
trading on the exchange. Market and NAV returns assume that dividends and capital gain distributions have been reinvested at
Market Price and NAV, respectively.
An index is a statistical composite that tracks a specified financial market or sector. Unlike a fund, an index does not actually hold
a portfolio of securities and therefore does not incur the expenses incurred by a fund. These expenses negatively impact fund
performance. Also, market returns do not include brokerage commissions that may be payable on secondary market transactions.
If brokerage commissions were included, market returns would be lower.
Shareholder ExpensesAs a shareholder of the Fund, you incur two types of costs: (1) transaction costs, including brokerage commissions on purchases
and sales of fund shares and (2) ongoing costs, including management fees and other fund expenses. The expense example,
which is based on an investment of $1,000 invested on November 1, 2017 and held through April 30, 2018, is intended to help
you understand your ongoing costs (in dollars and cents) of investing in the Fund and to compare these costs with the ongoing
costs of investing in other funds.
Actual Expenses — The table provides information about actual account values and actual expenses. Annualized expense
ratios reflect contractual and voluntary fee waivers, if any. To estimate the expenses that you paid on your account over the
period, simply divide your account value by $1,000 (for example, an $8,600 account value divided by $1,000 = 8.6), then multiply
the result by the number under the heading entitled “Expenses Paid During Period.”
Hypothetical Example for Comparison Purposes — The table also provides information about hypothetical account values and
hypothetical expenses based on the Fund’s actual expense ratio and an assumed rate of return of 5% per year before expenses.
You may use this information to compare the ongoing costs of investing in your Fund and other funds. To do so, compare this 5%
hypothetical example with the 5% hypothetical examples that appear in the shareholder reports of the other funds.
Please note that the expenses shown in the table are5 meant to highlight your ongoing costs only and do not reflect any
transactional costs, such as brokerage commissions paid on purchases and sales of fund shares. Therefore, the hypothetical
examples are useful in comparing ongoing costs only and will not help you determine the relative total costs of owning different
funds. In addition, if these transactional costs were included, your costs would have been higher.
6 2 0 1 8 i S H A R E S S E M I - A N N U A L R E P O R T T O S H A R E H O L D E R S

Schedule of Investments (Unaudited)
iSHARES® J.P. MORGAN USD EMERGING MARKETS BOND ETFApril 30, 2018
SecurityPrincipal
(000s) Value
CORPORATE BONDS & NOTESa — 15.48%
AZERBAIJAN — 0.75%
Southern Gas Corridor CJSC
6.88%, 03/24/26b $ 48,974 $ 84,956,867
84,956,867
CHILE — 1.03%
Corp. Nacional del Cobre de Chile
3.63%, 08/01/27
(Call 05/01/27)b 44,525 42,382,802
4.50%, 09/16/25b 40,459 41,430,016
4.50%, 08/01/47
(Call 02/01/47)b 34,300 33,673,843
117,486,661
CHINA — 3.11%
Amber Circle Funding Ltd.
3.25%, 12/04/22b 15,117 14,784,727
Charming Light Investments Ltd.
4.38%, 12/21/27b 11,200 10,509,199
China Development Bank
2.13%, 06/01/21b 10,744 10,329,349
2.50%, 10/09/20b 3,139 3,078,057
2.63%, 01/24/22b 18,650 18,043,875
China Development Bank Corp./
Hong Kong
(3 mo. LIBOR US + 0.700%)
2.73%, 03/06/22b,c 23,470 23,468,340
China Great Wall International
Holdings III Ltd.
3.13%, 08/31/22b 10,250 9,803,730
China Minmetals Corp.
3.75%, (Call 11/13/22)b,c,d,e 1,600 1,503,336
CNAC HK Finbridge Co. Ltd.
3.50%, 07/19/22b 22,520 21,736,714
4.13%, 07/19/27b 9,163 8,486,337
CNOOC Curtis Funding No. 1
Pty Ltd.
4.50%, 10/03/23b 11,421 11,683,569
Sinochem Overseas Capital
Co. Ltd.
4.50%, 11/12/20b 9,433 9,598,078
Sinopec Group Overseas
Development 2012 Ltd.
3.90%, 05/17/22b 19,052 19,099,630
4.88%, 05/17/42b 14,109 14,725,422
SecurityPrincipal
(000s) Value
Sinopec Group OverseasDevelopment 2013 Ltd.
4.38%, 10/17/23b $ 17,243 $ 17,560,676Sinopec Group Overseas
Development 2014 Ltd.4.38%, 04/10/24b 19,577 19,893,251
Sinopec Group OverseasDevelopment 2015 Ltd.
3.25%, 04/28/25b 18,632 17,592,707Sinopec Group Overseas
Development 2016 Ltd.2.00%, 09/29/21b 14,650 13,942,316
Sinopec Group OverseasDevelopment 2017 Ltd.
2.50%, 09/13/22b 3,000 2,847,6883.00%, 04/12/22b 14,800 14,366,8823.63%, 04/12/27b 15,940 15,234,223
State Grid Overseas Investment2013 Ltd.
3.13%, 05/22/23b 12,685 12,302,497State Grid Overseas Investment
2014 Ltd.4.13%, 05/07/24b 21,166 21,435,270
State Grid Overseas Investment2016 Ltd.
2.75%, 05/04/22b 12,500 12,097,9993.50%, 05/04/27b 25,578 24,368,491
Three Gorges Finance I CaymanIslands Ltd.
3.15%, 06/02/26b 6,834 6,360,335
354,852,698
INDONESIA — 1.01%
Pelabuhan Indonesia II PT4.25%, 05/05/25b 10,628 10,349,015
Pertamina Persero PT4.30%, 05/20/23b 14,042 14,048,6004.88%, 05/03/22b 11,844 12,135,0075.25%, 05/23/21b 8,727 9,054,2625.63%, 05/20/43b 14,171 14,103,4046.00%, 05/03/42b 7,220 7,544,4676.45%, 05/30/44b 16,355 18,051,995
Perusahaan Listrik Negara PT4.13%, 05/15/27b 13,350 12,552,5095.25%, 10/24/42b 4,860 4,640,0855.50%, 11/22/21b 12,560 13,140,900
115,620,244
S C H E D U L E O F I N V E S T M E N T S 7

Schedule of Investments (Unaudited) (Continued)
iSHARES® J.P. MORGAN USD EMERGING MARKETS BOND ETFApril 30, 2018
SecurityPrincipal
(000s) Value
KAZAKHSTAN — 1.72%
Development Bank ofKazakhstan JSC
4.13%, 12/10/22b $ 22,737 $ 22,651,736Kazakhstan Temir Zholy
Finance BV6.95%, 07/10/42b 28,455 31,129,770
KazMunayGas National Co. JSC4.75%, 04/19/27b 31,450 30,936,3195.38%, 04/24/30f 10,125 10,111,4505.75%, 04/19/47b 35,624 34,043,1586.38%, 04/09/21b 26,570 28,429,9006.38%, 10/24/48f 6,050 6,173,5927.00%, 05/05/20b 31,010 33,103,175
196,579,100
MALAYSIA — 0.90%
Petronas Capital Ltd.3.50%, 03/18/25b 37,756 36,708,4754.50%, 03/18/45b 38,486 39,048,7697.88%, 05/22/22b 22,937 26,487,999
102,245,243
MEXICO — 3.52%
Banco Nacional de ComercioExterior SNC/Cayman Islands
4.38%, 10/14/25b 7,124 7,070,570Comision Federal de Electricidad
4.75%, 02/23/27b 8,950 8,894,0634.88%, 05/26/21b 6,356 6,483,1204.88%, 01/15/24b 8,117 8,259,048
Mexico City Airport Trust3.88%, 04/30/28
(Call 01/30/28)b 1,595 1,432,6124.25%, 10/31/26
(Call 07/31/26)b 6,800 6,397,4995.50%, 10/31/46
(Call 04/30/46)b 8,040 7,135,5005.50%, 07/31/47
(Call 01/31/47)b 21,886 19,473,202Petroleos Mexicanos
3.50%, 01/30/23 17,121 16,181,4854.25%, 01/15/25 9,150 8,651,5544.50%, 01/23/26 8,004 7,543,3704.63%, 09/21/23 10,154 10,021,6934.88%, 01/24/22 15,651 15,905,3294.88%, 01/18/24 10,697 10,586,286
SecurityPrincipal
(000s) Value
5.35%, 02/12/28b $ 1,000 $ 952,948
5.38%, 03/13/22 13,196 13,656,049
5.50%, 01/21/21 18,791 19,453,383
5.50%, 06/27/44 17,984 15,163,929
5.63%, 01/23/46 23,186 19,586,373
6.35%, 02/12/48b 2,550 2,340,683
6.38%, 02/04/21 10,324 10,872,462
6.38%, 01/23/45 24,733 22,915,124
6.50%, 03/13/27 40,584 42,045,587
6.50%, 06/02/41 23,959 22,940,742
6.63%, 06/15/35 21,690 21,440,565
6.75%, 09/21/47 40,763 39,256,807
6.88%, 08/04/26 25,731 27,557,901
(3 mo. LIBOR US + 3.650%)
5.72%, 03/11/22c 8,290 9,064,018
401,281,902
OMAN — 0.47%
Lamar Funding Ltd.
3.96%, 05/07/25b 21,175 18,634,000
Oman Sovereign Sukuk SAOC
4.40%, 06/01/24b 36,801 34,433,359
53,067,359
PERU — 0.44%
Petroleos del Peru SA
4.75%, 06/19/32b 25,350 24,127,355
5.63%, 06/19/47b 27,157 26,487,151
50,614,506
PHILIPPINES — 0.21%
Power Sector Assets & Liabilities
Management Corp.
7.39%, 12/02/24b 19,580 23,471,525
23,471,525
RUSSIA — 0.70%
Russian Railways via RZD
Capital PLC
5.70%, 04/05/22b 18,133 18,744,989
Vnesheconombank Via VEB
Finance PLC
5.94%, 11/21/23b 18,800 19,552,000
6.03%, 07/05/22b 13,023 13,478,805
6.80%, 11/22/25b 13,558 14,642,640
6.90%, 07/09/20b 12,878 13,395,824
79,814,258
8 2 0 1 8 i S H A R E S S E M I - A N N U A L R E P O R T T O S H A R E H O L D E R S

Schedule of Investments (Unaudited) (Continued)
iSHARES® J.P. MORGAN USD EMERGING MARKETS BOND ETFApril 30, 2018
SecurityPrincipal
(000s) Value
SOUTH AFRICA — 0.92%
Eskom Holdings SOC Ltd.5.75%, 01/26/21b $ 39,036 $ 38,969,0536.75%, 08/06/23b 17,856 18,043,4887.13%, 02/11/25b 26,462 26,988,594
Transnet SOC Ltd.4.00%, 07/26/22b 21,741 21,088,770
105,089,905
VENEZUELA — 0.70%
Petroleos de Venezuela SA5.38%, 04/12/27b,g 23,222 6,072,4225.50%, 04/12/37b,g 18,673 4,901,6636.00%, 05/16/24b,g 48,883 12,342,9016.00%, 11/15/26b,g 44,068 11,056,6628.50%, 10/27/20b,g 25,679 22,270,3309.00%, 11/17/21b,g 20,413 6,047,3519.75%, 05/17/35b,g 21,518 6,052,003
12.75%, 02/17/22b,g 34,082 10,522,663
79,265,995
TOTAL CORPORATE BONDS & NOTES
(Cost: $1,870,827,052) 1,764,346,263
FOREIGN GOVERNMENT OBLIGATIONSa — 82.86%
ANGOLA — 0.39%
Angolan GovernmentInternational Bond
9.50%, 11/12/25b 39,334 44,201,583
44,201,583
ARGENTINA — 3.98%
Argentine Republic GovernmentInternational Bond
2.50%, 12/31/38h 56,987 36,899,3774.63%, 01/11/23 21,869 20,954,0485.63%, 01/26/22 26,318 26,462,7495.88%, 01/11/28 39,975 36,656,3106.63%, 07/06/28 9,708 9,368,2206.88%, 04/22/21 49,940 52,337,1206.88%, 01/26/27 40,423 40,099,6166.88%, 01/11/48 28,339 25,219,8697.13%, 07/06/36 20,102 19,127,0537.13%, 06/28/17b 28,383 25,343,6767.50%, 04/22/26 67,115 70,068,0607.63%, 04/22/46 28,397 27,388,9078.28%, 12/31/33 60,534 64,139,586
454,064,591
SecurityPrincipal
(000s) Value
AZERBAIJAN — 0.73%
Republic of AzerbaijanInternational Bond
3.50%, 09/01/32b $ 31,284 $ 25,717,1684.75%, 03/18/24b 30,594 30,471,624
State Oil Co. of theAzerbaijan Republic
4.75%, 03/13/23b 27,249 27,146,816
83,335,608
BOLIVIA — 0.24%
Bolivian GovernmentInternational Bond
4.50%, 03/20/28b 29,043 27,008,102
27,008,102
BRAZIL — 3.71%
Banco Nacional deDesenvolvimento Economicoe Social
4.75%, 05/09/24b 14,145 13,972,5855.75%, 09/26/23b 17,458 18,324,091
Brazil Minas SPE via State ofMinas Gerais
5.33%, 02/15/28b 16,231 16,231,000Brazilian Government
International Bond2.63%, 01/05/23 20,123 18,965,9284.25%, 01/07/25 58,825 58,001,4504.63%, 01/13/28
(Call 10/13/27) 42,695 41,154,4374.88%, 01/22/21 34,330 35,445,7255.00%, 01/27/45 40,171 34,697,7015.63%, 01/07/41 29,433 28,034,9325.63%, 02/21/47 43,988 41,304,7326.00%, 04/07/26 32,860 35,455,9407.13%, 01/20/37 29,910 34,321,7258.25%, 01/20/34 22,676 28,095,5648.88%, 04/15/24 14,781 18,513,203
422,519,013
CHILE — 0.75%
Chile GovernmentInternational Bond
3.13%, 01/21/26 5,493 5,300,7453.24%, 02/06/28
(Call 11/06/27) 38,979 37,339,5213.86%, 06/21/47 45,500 43,039,919
85,680,185
S C H E D U L E O F I N V E S T M E N T S 9

Schedule of Investments (Unaudited) (Continued)
iSHARES® J.P. MORGAN USD EMERGING MARKETS BOND ETFApril 30, 2018
SecurityPrincipal
(000s) Value
CHINA — 0.60%
China GovernmentInternational Bond
2.13%, 11/02/22b $ 6,590 $ 6,374,5602.63%, 11/02/27b 11,300 10,847,839
Export-Import Bank of China (The)2.00%, 04/26/21b 10,902 10,467,6142.63%, 03/14/22b 8,650 8,365,8042.88%, 04/26/26b 15,818 14,531,8393.63%, 07/31/24b 17,637 17,326,852
67,914,508
COLOMBIA — 3.46%
Colombia GovernmentInternational Bond
2.63%, 03/15/23(Call 12/15/22) 14,394 13,638,315
3.88%, 04/25/27(Call 01/25/27) 47,344 45,746,140
4.00%, 02/26/24(Call 11/26/23) 31,015 30,976,231
4.38%, 07/12/21 33,232 34,145,8804.50%, 01/28/26
(Call 10/28/25) 30,292 30,859,9755.00%, 06/15/45
(Call 12/15/44) 70,160 69,212,8405.63%, 02/26/44
(Call 08/26/43) 43,246 46,338,0896.13%, 01/18/41 45,059 50,804,0237.38%, 09/18/37 36,413 46,062,4458.13%, 05/21/24 21,619 26,240,061
394,023,999
COSTA RICA — 0.67%
Costa Rica GovernmentInternational Bond
4.25%, 01/26/23b 25,394 24,251,2707.00%, 04/04/44b 27,730 27,591,3507.16%, 03/12/45b 24,690 24,967,762
76,810,382
CROATIA — 1.44%
Croatia GovernmentInternational Bond
5.50%, 04/04/23b 31,917 33,832,0206.00%, 01/26/24b 46,386 50,502,7576.38%, 03/24/21b 43,587 46,692,5746.63%, 07/14/20b 31,102 33,123,630
164,150,981
SecurityPrincipal
(000s) Value
DOMINICAN REPUBLIC — 2.83%
Dominican Republic
International Bond
5.50%, 01/27/25b $ 43,509 $ 43,672,159
5.88%, 04/18/24b 24,686 25,519,152
5.95%, 01/25/27b 46,643 47,750,771
6.50%, 02/15/48b 6,170 6,142,221
6.85%, 01/27/45b 69,820 72,001,875
6.88%, 01/29/26b 42,456 45,852,480
7.45%, 04/30/44b 41,518 45,462,210
7.50%, 05/06/21b 33,931 35,839,619
322,240,487
ECUADOR — 2.94%
Ecuador Government
International Bond
7.88%, 01/23/28b 41,840 37,036,647
7.95%, 06/20/24b 55,170 51,583,950
8.75%, 06/02/23b 34,670 33,917,020
8.88%, 10/23/27b 83,990 79,142,144
9.63%, 06/02/27b 32,789 32,145,359
9.65%, 12/13/26b 44,508 43,729,110
10.75%, 03/28/22b 54,572 57,300,600
334,854,830
EGYPT — 2.95%
Egypt Government
International Bond
5.58%, 02/21/23b 34,489 34,630,132
5.88%, 06/11/25b 43,679 42,805,420
6.13%, 01/31/22b 63,580 65,248,975
6.59%, 02/21/28f 26,706 26,347,234
7.50%, 01/31/27b 52,569 55,394,584
7.90%, 02/21/48b 35,590 36,125,477
8.50%, 01/31/47b 70,330 75,253,100
335,804,922
EL SALVADOR — 0.25%
El Salvador Government
International Bond
7.65%, 06/15/35b 27,311 28,437,579
28,437,579
ETHIOPIA — 0.23%
Ethiopia International Bond
6.63%, 12/11/24b 26,032 26,259,780
26,259,780
10 2 0 1 8 i S H A R E S S E M I - A N N U A L R E P O R T T O S H A R E H O L D E R S

Schedule of Investments (Unaudited) (Continued)
iSHARES® J.P. MORGAN USD EMERGING MARKETS BOND ETFApril 30, 2018
SecurityPrincipal
(000s) Value
GABON — 0.34%
Gabon Government
International Bond
6.38%, 12/12/24b $ 40,041 $ 38,939,873
38,939,873
GHANA — 0.51%
Ghana Government
International Bond
7.88%, 08/07/23b 19,918 21,586,225
8.13%, 01/18/26b 34,562 36,851,732
58,437,957
HUNGARY — 2.53%
Hungary Government
International Bond
5.38%, 02/21/23 49,490 52,954,300
5.38%, 03/25/24 51,114 54,883,657
5.75%, 11/22/23 52,010 56,690,900
6.38%, 03/29/21 73,646 79,261,507
7.63%, 03/29/41 31,454 44,232,188
288,022,552
INDIA — 0.44%
Export-Import Bank of India
3.38%, 08/05/26b 27,250 25,270,707
3.88%, 02/01/28b 26,700 25,398,160
50,668,867
INDONESIA — 3.86%
Indonesia Government
International Bond
2.95%, 01/11/23 6,980 6,721,042
3.38%, 04/15/23b 5,365 5,217,463
3.50%, 01/11/28 8,465 7,949,366
3.75%, 04/25/22b 21,781 21,644,869
3.85%, 07/18/27b 15,400 14,864,806
4.10%, 04/24/28 1,085 1,065,031
4.13%, 01/15/25b 18,544 18,451,280
4.35%, 01/08/27b 18,189 18,189,000
4.35%, 01/11/48 16,059 14,988,129
4.63%, 04/15/43b 12,162 11,629,912
4.75%, 01/08/26b 22,269 22,937,070
4.75%, 07/18/47b 9,850 9,575,022
4.88%, 05/05/21b 15,567 16,092,386
5.13%, 01/15/45b 5,229 5,294,363
5.25%, 01/17/42b 20,600 21,295,250
SecurityPrincipal
(000s) Value
5.25%, 01/08/47b $ 12,117 $ 12,510,8025.38%, 10/17/23b 6,400 6,832,0005.88%, 01/15/24b 16,252 17,653,7355.95%, 01/08/46b 7,355 8,329,5386.63%, 02/17/37b 19,173 22,815,8706.75%, 01/15/44b 21,296 26,353,8007.75%, 01/17/38b 20,654 27,547,2728.50%, 10/12/35b 16,594 23,252,342
Perusahaan Penerbit SBSNIndonesia III
3.30%, 11/21/22b 7,371 7,159,6003.40%, 03/29/22b 16,340 16,013,2004.15%, 03/29/27b 17,700 17,191,1254.33%, 05/28/25b 18,659 18,589,0294.35%, 09/10/24b 11,185 11,254,9064.40%, 03/01/28f 10,605 10,489,0164.55%, 03/29/26b 18,000 18,090,000
439,997,224
IRAQ — 0.83%
Iraq International Bond5.80%, 01/15/28
(Call 06/14/18)b 72,877 68,504,3806.75%, 03/09/23b 25,900 25,895,748
94,400,128
IVORY COAST — 0.90%
Ivory Coast GovernmentInternational Bond
5.75%, 12/31/32(Call 06/30/18)b,h 51,930 49,722,630
6.13%, 06/15/33b 33,706 31,941,9946.38%, 03/03/28b 21,196 21,301,980
102,966,604
JAMAICA — 1.09%
Jamaica GovernmentInternational Bond
6.75%, 04/28/28 47,549 52,303,9007.88%, 07/28/45 27,346 31,951,6748.00%, 03/15/39 34,378 40,222,260
124,477,834
JORDAN — 0.66%
Jordan GovernmentInternational Bond
5.75%, 01/31/27b 33,411 31,656,9226.13%, 01/29/26b 18,574 18,203,5587.38%, 10/10/47b 25,905 25,279,352
75,139,832
S C H E D U L E O F I N V E S T M E N T S 11

Schedule of Investments (Unaudited) (Continued)
iSHARES® J.P. MORGAN USD EMERGING MARKETS BOND ETFApril 30, 2018
SecurityPrincipal
(000s) Value
KAZAKHSTAN — 1.54%
Kazakhstan GovernmentInternational Bond
3.88%, 10/14/24b $ 42,098 $ 42,224,2944.88%, 10/14/44b 32,630 31,977,4005.13%, 07/21/25b 62,091 66,064,8246.50%, 07/21/45b 29,474 35,000,375
175,266,893
KENYA — 0.95%
Kenya GovernmentInternational Bond
6.88%, 06/24/24b 54,276 56,107,8157.25%, 02/28/28b 25,340 26,123,9298.25%, 02/28/48b 25,735 26,533,815
108,765,559
LEBANON — 2.38%
Lebanon GovernmentInternational Bond
6.00%, 01/27/23b 33,041 31,141,1436.10%, 10/04/22b 41,307 39,344,9176.60%, 11/27/26b 45,596 41,093,3956.65%, 02/26/30b 32,065 27,856,4696.75%, 11/29/27b 24,921 22,335,4466.85%, 03/23/27b 32,946 30,036,1167.00%, 03/23/32b 27,122 24,085,0598.25%, 04/12/21b 53,851 54,995,334
270,887,879
LITHUANIA — 0.74%
Lithuania GovernmentInternational Bond
6.13%, 03/09/21b 29,035 31,176,3316.63%, 02/01/22b 47,929 53,321,013
84,497,344
MALAYSIA — 1.16%
1MDB Global Investments Ltd.4.40%, 03/09/23b 94,000 89,182,500
Malaysia Sovereign Sukuk Bhd3.04%, 04/22/25b 23,984 23,211,955
Malaysia Sukuk Global Bhd3.18%, 04/27/26b 20,951 20,232,381
132,626,836
MEXICO — 2.44%
Mexico GovernmentInternational Bond
3.60%, 01/30/25 20,996 20,345,1243.63%, 03/15/22 9,440 9,468,320
SecurityPrincipal
(000s) Value
3.75%, 01/11/28 $ 20,848 $ 19,668,5124.00%, 10/02/23 14,468 14,627,1484.13%, 01/21/26 19,745 19,636,4024.15%, 03/28/27 23,015 22,646,7604.35%, 01/15/47 16,470 14,526,5404.60%, 01/23/46 23,948 21,882,4854.60%, 02/10/48 18,922 17,340,9454.75%, 03/08/44 30,092 28,166,1125.55%, 01/21/45 15,293 16,042,3575.75%, 10/12/10 17,762 17,406,7606.05%, 01/11/40 26,130 28,638,4806.75%, 09/27/34 11,865 14,326,9888.30%, 08/15/31 8,717 12,868,471
277,591,404
MONGOLIA — 0.22%
Mongolia GovernmentInternational Bond
5.13%, 12/05/22b 26,126 25,113,618
25,113,618
MOROCCO — 0.33%
Morocco GovernmentInternational Bond
4.25%, 12/11/22b 37,900 37,994,750
37,994,750
NIGERIA — 1.68%
Nigeria GovernmentInternational Bond
6.50%, 11/28/27b 42,857 43,195,9177.14%, 02/23/30b 33,535 34,344,6187.63%, 11/28/47b 55,749 56,202,0627.70%, 02/23/38b 18,870 19,444,1937.88%, 02/16/32b 36,143 38,808,546
191,995,336
OMAN — 2.52%
Oman GovernmentInternational Bond
3.63%, 06/15/21b 27,006 26,162,0633.88%, 03/08/22b 27,941 26,823,3604.13%, 01/17/23b 200 190,3574.75%, 06/15/26b 61,210 57,078,3255.38%, 03/08/27b 58,441 55,665,0525.63%, 01/17/28b 38,605 36,907,4786.50%, 03/08/47b 52,220 48,434,0506.75%, 01/17/48b 38,195 36,082,967
287,343,652
12 2 0 1 8 i S H A R E S S E M I - A N N U A L R E P O R T T O S H A R E H O L D E R S

Schedule of Investments (Unaudited) (Continued)
iSHARES® J.P. MORGAN USD EMERGING MARKETS BOND ETFApril 30, 2018
SecurityPrincipal
(000s) Value
PAKISTAN — 0.98%
Pakistan GovernmentInternational Bond
6.88%, 12/05/27b $ 37,400 $ 35,047,9598.25%, 04/15/24b 29,765 30,949,052
Third Pakistan InternationalSukuk Co. Ltd. (The)
5.50%, 10/13/21b 19,629 19,285,4925.63%, 12/05/22b 26,973 26,011,398
111,293,901
PANAMA — 1.46%
Panama GovernmentInternational Bond
3.75%, 03/16/25(Call 12/16/24) 28,422 28,173,308
4.00%, 09/22/24(Call 06/22/24) 33,208 33,581,590
4.50%, 05/15/47 31,630 31,025,5004.50%, 04/16/50
(Call 10/16/49) 8,175 7,940,0776.70%, 01/26/36 53,110 65,590,850
166,311,325
PARAGUAY — 0.21%
Paraguay GovernmentInternational Bond
6.10%, 08/11/44b 23,168 24,442,240
24,442,240
PERU — 2.58%
Peruvian GovernmentInternational Bond
4.13%, 08/25/27 33,112 34,022,5805.63%, 11/18/50 66,637 77,881,9946.55%, 03/14/37 29,061 36,544,2087.35%, 07/21/25 47,807 58,683,0928.75%, 11/21/33 59,032 86,777,040
293,908,914
PHILIPPINES — 3.60%
Philippine GovernmentInternational Bond
3.00%, 02/01/28 26,880 25,139,7233.70%, 03/01/41 25,570 23,907,9503.70%, 02/02/42 38,305 35,719,4123.95%, 01/20/40 28,661 27,872,8234.00%, 01/15/21 26,063 26,649,4184.20%, 01/21/24 24,118 24,931,983
SecurityPrincipal
(000s) Value
5.00%, 01/13/37 $ 21,542 $ 23,696,200
5.50%, 03/30/26 18,824 21,012,290
6.38%, 01/15/32 19,814 24,272,150
6.38%, 10/23/34 35,566 44,590,872
7.75%, 01/14/31 32,998 44,423,557
9.50%, 02/02/30 35,836 53,082,075
10.63%, 03/16/25 24,957 35,563,725
410,862,178
POLAND — 2.52%
Republic of Poland Government
International Bond
3.00%, 03/17/23 52,891 51,899,294
3.25%, 04/06/26 46,432 45,097,080
4.00%, 01/22/24 51,890 53,057,525
5.00%, 03/23/22 75,670 80,304,787
5.13%, 04/21/21 53,420 56,358,100
286,716,786
ROMANIA — 1.42%
Romanian Government
International Bond
4.38%, 08/22/23b 40,432 41,038,480
4.88%, 01/22/24b 27,516 28,547,850
6.13%, 01/22/44b 27,072 31,403,520
6.75%, 02/07/22b 55,331 60,864,100
161,853,950
RUSSIA — 3.30%
Russian Foreign Bond-Eurobond
4.25%, 06/23/27b 34,200 33,437,367
4.50%, 04/04/22b 26,200 26,593,000
4.75%, 05/27/26b 36,600 37,149,000
4.88%, 09/16/23b 33,600 34,692,000
5.25%, 06/23/47b 95,600 92,870,231
5.63%, 04/04/42b 23,400 24,558,300
5.88%, 09/16/43b 20,200 21,866,500
7.50%, 03/31/30b,h 44,387 49,614,053
12.75%, 06/24/28b 33,960 54,802,950
375,583,401
SENEGAL — 0.44%
Senegal Government
International Bond
6.25%, 05/23/33b 25,451 24,561,456
6.75%, 03/13/48f 26,440 25,007,887
49,569,343
S C H E D U L E O F I N V E S T M E N T S 13

Schedule of Investments (Unaudited) (Continued)
iSHARES® J.P. MORGAN USD EMERGING MARKETS BOND ETFApril 30, 2018
SecurityPrincipal
(000s) Value
SERBIA — 0.47%
Serbia International Bond7.25%, 09/28/21b $ 48,891 $ 53,963,441
53,963,441
SLOVAKIA — 0.34%
Slovakia GovernmentInternational Bond
4.38%, 05/21/22b 36,789 38,490,491
38,490,491
SOUTH AFRICA — 2.18%
Republic of South AfricaGovernment International Bond
4.30%, 10/12/28 40,994 37,560,7534.67%, 01/17/24 26,939 26,804,3054.85%, 09/27/27 20,061 19,446,5754.88%, 04/14/26 27,750 27,229,6885.00%, 10/12/46 21,879 19,280,8695.38%, 07/24/44 18,323 17,040,3905.65%, 09/27/47 34,385 33,022,8205.88%, 05/30/22 22,567 24,033,8555.88%, 09/16/25 41,547 43,520,482
247,939,737
SRI LANKA — 1.74%
Sri Lanka GovernmentInternational Bond
5.75%, 04/18/23f 7,025 6,993,2885.88%, 07/25/22b 27,069 27,272,0186.20%, 05/11/27b 45,041 43,556,7636.25%, 10/04/20b 19,763 20,376,2466.25%, 07/27/21b 18,966 19,511,2736.75%, 04/18/28f 3,575 3,560,2716.83%, 07/18/26b 34,214 34,641,6756.85%, 11/03/25b 42,011 42,903,734
198,815,268
TRINIDAD AND TOBAGO — 0.26%
Trinidad & Tobago GovernmentInternational Bond
4.50%, 08/04/26b 29,522 29,485,098
29,485,098
TUNISIA — 0.20%
Banque Centrale de TunisieInternational Bond
5.75%, 01/30/25b 24,929 23,059,325
23,059,325
SecurityPrincipal
(000s) Value
TURKEY — 4.28%
Hazine Mustesarligi Varlik
Kiralama AS
4.25%, 06/08/21b $ 13,068 $ 12,953,655
4.49%, 11/25/24b 7,650 7,372,688
5.00%, 04/06/23b 11,310 11,295,863
Turkey Government
International Bond
3.25%, 03/23/23 22,147 20,430,607
4.25%, 04/14/26 13,711 12,408,455
4.88%, 10/09/26 30,572 28,584,820
4.88%, 04/16/43 29,360 23,414,600
5.13%, 03/25/22 9,946 10,045,460
5.13%, 02/17/28 22,160 20,726,650
5.63%, 03/30/21 22,576 23,253,280
5.75%, 03/22/24 24,699 25,038,611
5.75%, 05/11/47 32,998 28,865,558
6.00%, 03/25/27 34,744 34,917,720
6.00%, 01/14/41 27,444 25,214,175
6.25%, 09/26/22 21,401 22,471,050
6.63%, 02/17/45 26,912 26,272,840
6.75%, 05/30/40 18,568 18,637,630
6.88%, 03/17/36 31,989 32,868,697
7.00%, 06/05/20 12,782 13,485,010
7.25%, 03/05/38 12,527 13,388,231
7.38%, 02/05/25 33,333 36,582,967
8.00%, 02/14/34 20,187 23,240,284
11.88%, 01/15/30 11,399 16,728,033
488,196,884
UKRAINE — 3.02%
Ukraine Government
International Bond
7.38%, 09/25/32b 73,210 67,624,534
7.75%, 09/01/20b 34,416 35,758,224
7.75%, 09/01/21b 33,252 34,332,690
7.75%, 09/01/22b 31,705 32,339,100
7.75%, 09/01/23b 37,587 37,887,696
7.75%, 09/01/24b 38,141 38,026,577
7.75%, 09/01/25b 34,591 34,314,272
7.75%, 09/01/26b 31,196 30,759,256
7.75%, 09/01/27b 34,232 33,564,476
344,606,825
14 2 0 1 8 i S H A R E S S E M I - A N N U A L R E P O R T T O S H A R E H O L D E R S

Schedule of Investments (Unaudited) (Continued)
iSHARES® J.P. MORGAN USD EMERGING MARKETS BOND ETFApril 30, 2018
SecurityPrincipal
(000s) Value
URUGUAY — 2.10%
Uruguay Government
International Bond
4.38%, 10/27/27 $ 50,820 $ 51,074,100
4.50%, 08/14/24 38,786 40,201,471
4.98%, 04/20/55 6,435 6,168,615
5.10%, 06/18/50 106,800 104,931,000
7.63%, 03/21/36 28,628 37,116,202
239,491,388
VENEZUELA — 0.67%
Venezuela Government
International Bond
6.00%, 12/09/20b,g 16,275 4,557,000
7.00%, 03/31/38b,g 15,168 4,360,800
7.65%, 04/21/25b,g 18,693 5,187,308
8.25%, 10/13/24b,g 24,917 7,039,109
9.00%, 05/07/23b,g 19,420 5,534,700
9.25%, 09/15/27g 37,102 11,594,375
9.25%, 05/07/28b,g 20,478 5,785,035
9.38%, 01/13/34g 14,199 4,650,173
11.75%, 10/21/26b,g 28,653 8,810,797
11.95%, 08/05/31b,g 37,103 11,316,262
12.75%, 08/23/22b,g 25,747 8,045,781
76,881,340
VIETNAM — 0.25%
Vietnam Government
International Bond
4.80%, 11/19/24b 28,380 28,867,994
28,867,994
ZAMBIA — 0.55%
Zambia Government
International Bond
8.50%, 04/14/24b 27,155 27,392,606
8.97%, 07/30/27b 35,141 35,228,852
62,621,458
TOTAL FOREIGN GOVERNMENT OBLIGATIONS
(Cost: $9,936,292,881) 9,445,401,979
SecurityShares(000s) Value
SHORT-TERM INVESTMENTS — 0.21%
MONEY MARKET FUNDS — 0.21%
BlackRock Cash Funds: Treasury,
SL Agency Shares
1.61%i,j 24,658 $ 24,657,919
24,657,919
TOTAL SHORT-TERM INVESTMENTS
(Cost: $24,657,919) 24,657,919
TOTAL INVESTMENTS
IN SECURITIES — 98.55%
(Cost: $11,831,777,852) 11,234,406,161
Other Assets, Less Liabilities — 1.45% 165,114,008
NET ASSETS — 100.00% $11,399,520,169
a Investments are denominated in U.S. dollars.b This security may be resold to qualified foreign investors and foreign
institutional buyers under Regulation S of the Securities Act of 1933.c Variable or floating rate security. Rate shown is the rate in effect as of
period-end.d Security is perpetual in nature with no stated maturity date.e Security is issued at a fixed coupon rate, which converts to a variable rate at
a specified date. Reference index and spread are provided if the rate iscurrently floating.
f Security exempt from registration pursuant to Rule 144A under the SecuritiesAct of 1933, as amended. These securities may be resold in transactionsexempt from registration to qualified institutional investors.
g Issuer is in default of interest payments.h Step coupon security. Coupon rate will either increase (step-up bond) or
decrease (step-down bond) at regular intervals until maturity. Interest rateshown reflects the rate currently in effect.
i Affiliate of the Fund.j Annualized 7-day yield as of period end.
S C H E D U L E O F I N V E S T M E N T S 15
Schedule of Investments (Unaudited) (Continued)
iSHARES® J.P. MORGAN USD EMERGING MARKETS BOND ETFApril 30, 2018
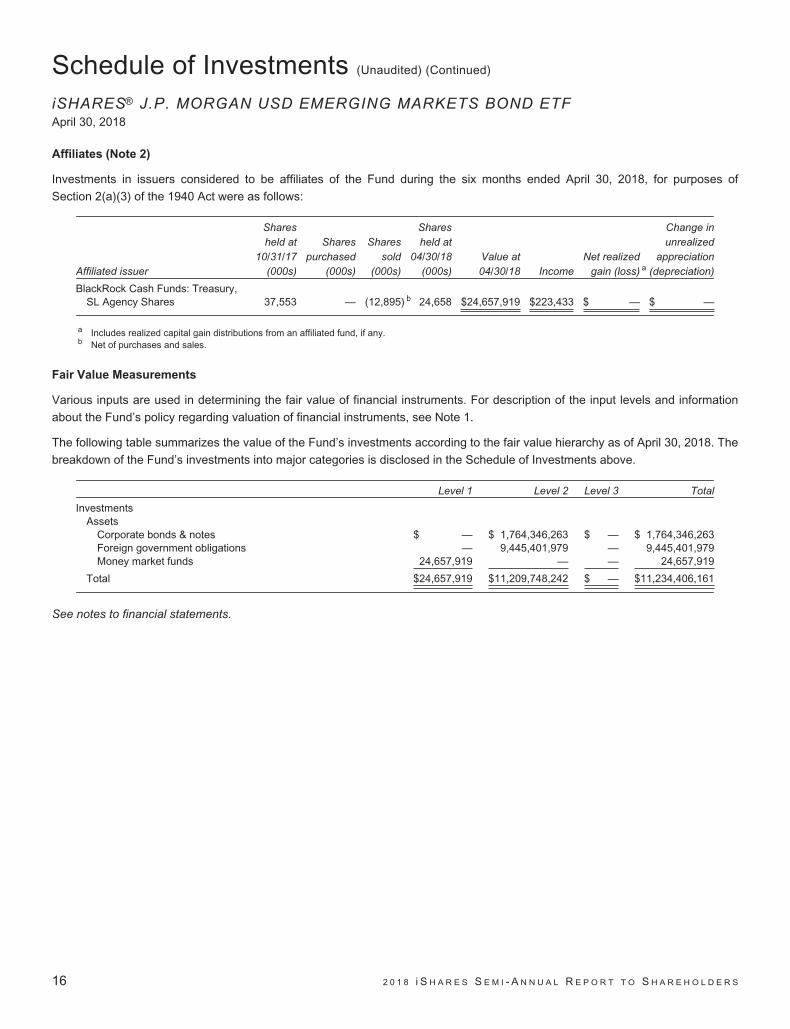
Affiliates (Note 2)
Investments in issuers considered to be affiliates of the Fund during the six months ended April 30, 2018, for purposes of
Section 2(a)(3) of the 1940 Act were as follows:
Affiliated issuer
Sharesheld at
10/31/17(000s)
Sharespurchased
(000s)
Sharessold
(000s)
Sharesheld at
04/30/18(000s)
Value at04/30/18 Income
Net realizedgain (loss) a
Change inunrealized
appreciation(depreciation)
BlackRock Cash Funds: Treasury,SL Agency Shares 37,553 — (12,895) b 24,658 $24,657,919 $223,433 $ — $ —
a Includes realized capital gain distributions from an affiliated fund, if any.b Net of purchases and sales.
Fair Value Measurements
Various inputs are used in determining the fair value of financial instruments. For description of the input levels and information
about the Fund’s policy regarding valuation of financial instruments, see Note 1.
The following table summarizes the value of the Fund’s investments according to the fair value hierarchy as of April 30, 2018. The
breakdown of the Fund’s investments into major categories is disclosed in the Schedule of Investments above.
Level 1 Level 2 Level 3 Total
InvestmentsAssets
Corporate bonds & notes $ — $ 1,764,346,263 $ — $ 1,764,346,263Foreign government obligations — 9,445,401,979 — 9,445,401,979Money market funds 24,657,919 — — 24,657,919
Total $24,657,919 $11,209,748,242 $ — $11,234,406,161
See notes to financial statements.
16 2 0 1 8 i S H A R E S S E M I - A N N U A L R E P O R T T O S H A R E H O L D E R S

Statement of Assets and Liabilities (Unaudited)
iSHARES® J.P. MORGAN USD EMERGING MARKETS BOND ETFApril 30, 2018
ASSETS
Investments in securities, at cost:
Unaffiliated $11,807,119,933
Affiliated (Note 2) 24,657,919
Total cost of investments in securities $11,831,777,852
Investments in securities, at fair value(Note 1):
Unaffiliated $11,209,748,242
Affiliated (Note 2) 24,657,919
Cash 2,069,571
Receivables:
Investment securities sold 19,575,577
Due from custodian (Note 4) 16,242,149
Dividends and interest 149,899,261
Capital shares sold 183,317
Total Assets 11,422,376,036
LIABILITIES
Payables:
Investment securities purchased 16,242,149
Capital shares redeemed 558,775
Securities related to in-kind transactions (Note 4) 2,222,320
Investment advisory fees (Note 2) 3,832,623
Total Liabilities 22,855,867
NET ASSETS $11,399,520,169
Net assets consist of:
Paid-in capital $12,141,860,485
Undistributed net investment income 49,617,630
Accumulated net realized loss (194,586,255)
Net unrealized depreciation (597,371,691)
NET ASSETS $11,399,520,169
Shares outstandinga 103,500,000
Net asset value per share $ 110.14
a No par value, unlimited number of shares authorized.
See notes to financial statements.
F I N A N C I A L S T A T E M E N T S 17

Statement of Operations (Unaudited)
iSHARES® J.P. MORGAN USD EMERGING MARKETS BOND ETFSix months ended April 30, 2018
NET INVESTMENT INCOME
Dividends — affiliated (Note 2) $ 223,433
Interest — unaffiliateda 279,772,865
Total investment income 279,996,298
EXPENSESInvestment advisory fees (Note 2) 23,815,534
Proxy fees 1,192
Total expenses 23,816,726
Net investment income 256,179,572
NET REALIZED AND UNREALIZED GAIN (LOSS)
Net realized gain (loss) from:
Investments — unaffiliated (24,959,940)
In-kind redemptions — unaffiliated 9,808,259
Net realized loss (15,151,681)
Net change in unrealized appreciation/depreciation on:
Investments — unaffiliated (646,393,210)
Net change in unrealized appreciation/depreciation (646,393,210)
Net realized and unrealized loss (661,544,891)
NET DECREASE IN NET ASSETS RESULTING FROM OPERATIONS $(405,365,319)
a Net of foreign withholding tax of $5,893.
See notes to financial statements.
18 2 0 1 8 i S H A R E S S E M I - A N N U A L R E P O R T T O S H A R E H O L D E R S

Statements of Changes in Net AssetsiSHARES® J.P. MORGAN USD EMERGING MARKETS BOND ETF
Six monthsended
April 30, 2018(Unaudited)
Year endedOctober 31, 2017
INCREASE (DECREASE) IN NET ASSETS
OPERATIONS:
Net investment income $ 256,179,572 $ 486,867,268
Net realized gain (loss) (15,151,681) 56,149,030
Net change in unrealized appreciation/depreciation (646,393,210) 11,132,447
Net increase (decrease) in net assets resulting from operations (405,365,319) 554,148,745
DISTRIBUTIONS TO SHAREHOLDERS:
From net investment income (244,126,438) (472,368,085)
Total distributions to shareholders (244,126,438) (472,368,085)
CAPITAL SHARE TRANSACTIONS:
Proceeds from shares sold 4,485,756,404 9,694,660,077
Cost of shares redeemed (4,364,954,250) (7,497,526,529)
Net increase in net assets from capital share transactions 120,802,154 2,197,133,548
INCREASE (DECREASE) IN NET ASSETS (528,689,603) 2,278,914,208
NET ASSETSBeginning of period 11,928,209,772 9,649,295,564
End of period $11,399,520,169 $11,928,209,772
Undistributed net investment income included in net assets at end of period $ 49,617,630 $ 37,564,496
SHARES ISSUED AND REDEEMEDShares sold 39,200,000 85,200,000
Shares redeemed (38,600,000) (66,400,000)
Net increase in shares outstanding 600,000 18,800,000
See notes to financial statements.
F I N A N C I A L S T A T E M E N T S 19

Financial HighlightsiSHARES® J.P. MORGAN USD EMERGING MARKETS BOND ETF(For a share outstanding throughout each period)
Six monthsended
Apr. 30, 2018(Unaudited)
Year endedOct. 31, 2017
Year endedOct. 31, 2016
Year endedOct. 31, 2015
Year endedOct. 31, 2014
Year endedOct. 31, 2013
Net asset value, beginning of period $ 115.92 $ 114.74 $ 108.36 $ 114.15 $ 110.96 $ 120.81
Income from investment operations:
Net investment incomea 2.39 5.33 5.39 5.08 4.86 5.00
Net realized and unrealized
gain (loss)b (5.88) 1.02 6.57 (5.75) 3.17 (9.77)
Total from investment operations (3.49) 6.35 11.96 (0.67) 8.03 (4.77)
Less distributions from:
Net investment income (2.29) (5.17) (5.58) (5.12) (4.84) (5.08)
Total distributions (2.29) (5.17) (5.58) (5.12) (4.84) (5.08)
Net asset value, end of period $ 110.14 $ 115.92 $ 114.74 $ 108.36 $ 114.15 $ 110.96
Total return (3.07)%c 5.74% 11.35% (0.55)% 7.45% (4.01)%
Ratios/Supplemental data:
Net assets, end of period (000s) $11,399,520 $11,928,210 $9,649,296 $4,464,443 $5,147,968 $3,850,273
Ratio of expenses to average
net assetsd 0.39% 0.40% 0.40% 0.40% 0.59% 0.60%
Ratio of expenses to average net
assets prior to waived feesd n/a 0.54% 0.59% 0.60% 0.60% n/a
Ratio of net investment income to
average net assetsd 4.23% 4.69% 4.81% 4.61% 4.35% 4.30%
Portfolio turnover ratee 9%c 26% 32% 24% 52% 32%
a Based on average shares outstanding throughout each period.b The amounts reported for a share outstanding may not accord with the change in aggregate gains and losses in securities for the fiscal period due to the timing of
capital share transactions in relation to the fluctuating market values of the Fund’s underlying securities.c Not annualized.d Annualized for periods of less than one year.e Portfolio turnover rates exclude portfolio securities received or delivered as a result of processing capital share transactions in Creation Units.
See notes to financial statements.
20 2 0 1 8 i S H A R E S S E M I - A N N U A L R E P O R T T O S H A R E H O L D E R S

Notes to Financial Statements (Unaudited)
iSHARES® J.P. MORGAN USD EMERGING MARKETS BOND ETF
iShares Trust (the “Trust”) is registered under the Investment Company Act of 1940, as amended (the “1940 Act”), as an
open-end management investment company. The Trust was established as a Delaware statutory trust pursuant to an Agreement
and Declaration of Trust dated December 16, 1999.
These financial statements relate only to the following fund (the “Fund”):
iShares ETF
Diversification
Classification
J.P. Morgan USD Emerging Markets Bond Non-diversified
The investment objective of the Fund is to seek investment results that correspond generally to the price and yield performance,
before fees and expenses, of its underlying index. The investment adviser uses a “passive” or index approach to try to achieve
the Fund’s investment objective.
Pursuant to the Trust’s organizational documents, the Fund’s officers and trustees are indemnified against certain liabilities that
may arise out of the performance of their duties to the Fund. Additionally, in the normal course of business, the Fund enters into
contracts with service providers that contain general indemnification clauses. The Fund’s maximum exposure under these
arrangements is unknown as this would involve future claims that may be made against the Fund that have not yet occurred.
1. SIGNIFICANT ACCOUNTING POLICIES
The following significant accounting policies are consistently followed by the Fund in the preparation of its financial statements in
conformity with accounting principles generally accepted in the United States of America (“U.S. GAAP”). The preparation of financial
statements in conformity with U.S. GAAP requires management to make certain estimates and assumptions that affect the reported
amounts of assets and liabilities and disclosures of contingent assets and liabilities at the date of the financial statements and the reported
amounts of revenue and expenses during the reporting period. Actual results could differ from those estimates. The Fund is considered an
investment company under U.S. GAAP and follows the accounting and reporting guidance applicable to investment companies.
SECURITY VALUATION
The Fund’s investments are valued at fair value each day that the Fund’s listing exchange is open and, for financial reporting
purposes, as of the report date should the reporting period end on a day that the Fund’s listing exchange is not open. U.S. GAAP
defines fair value as the price a fund would receive to sell an asset or pay to transfer a liability in an orderly transaction between market
participants at the measurement date. The BlackRock Global Valuation Methodologies Committee (the “Global Valuation Committee”)
provides oversight of the valuation of investments for the Fund. The investments of the Fund are valued pursuant to policies and
procedures developed by the Global Valuation Committee and approved by the Board of Trustees of the Trust (the “Board”).
• Fixed income investments are valued using the last available bid price or current market quotations provided by dealers or
prices (including evaluated prices) supplied by approved independent third-party pricing services. The pricing services may
use matrix pricing or valuation models that utilize certain inputs and assumptions to derive values, including transaction
data, credit quality information, perceived market movements, news, and other relevant information and by other methods,
which may include consideration of: yields or prices of securities of comparable quality, coupon, maturity and type;
indications as to values from dealers; general market conditions; and/or other factors and assumptions. Pricing services
generally value fixed income securities assuming orderly transactions of an institutional round lot size, but a fund may hold
or transact in such securities in smaller odd lot sizes. Odd lots may trade at lower prices than institutional round lots.
• Open-end U.S. mutual funds (including money market funds) are valued at that day’s published net asset value (“NAV”).
N O T E S T O F I N A N C I A L S T A T E M E N T S 21

Notes to Financial Statements (Unaudited) (Continued)
iSHARES® J.P. MORGAN USD EMERGING MARKETS BOND ETF
In the event that application of these methods of valuation results in a price for an investment which is deemed not to be
representative of the fair value of such investment or if a price is not available, the investment will be valued by the Global
Valuation Committee, in accordance with policies approved by the Board. The fair valuation approaches that may be utilized by
the Global Valuation Committee to determine fair value include market approach, income approach and the cost approach. The
valuation techniques used under these approaches take into consideration inputs that include but are not limited to (i) attributes
specific to the investment; (ii) the principal market for the investment; (iii) the customary participants in the principal market for the
investment; (iv) data assumptions by market participants for the investment, if reasonably available; (v) quoted prices for similar
investments in active markets; and (vi) other inputs, such as future cash flows, interest rates, yield curves, volatilities, prepayment
speeds, loss severities, credit risks and/or default rates. Valuations based on such inputs are reported to the Board on a quarterly
basis.
The Global Valuation Committee employs various methods for calibrating valuation approaches for investments where an active
market does not exist, including regular due diligence of the Trust’s pricing vendors, a regular review of key inputs and
assumptions, transactional back-testing or disposition analysis to compare unrealized gains and losses to realized gains and
losses, reviews of missing or stale prices, reviews of large movements in market values, and reviews of market related activity.
Fair value pricing could result in a difference between the prices used to calculate the Fund’s NAV and the prices used by the
Fund’s underlying index, which in turn could result in a difference between the Fund’s performance and the performance of the
Fund’s underlying index.
Various inputs are used in determining the fair value of financial instruments. Inputs may be based on independent market data
(“observable inputs”) or they may be internally developed (“unobservable inputs”). These inputs to valuation techniques are
categorized into a fair value hierarchy consisting of three broad levels for financial reporting purposes as follows:
• Level 1 — Unadjusted quoted prices in active markets for identical assets or liabilities;
• Level 2 — Inputs other than quoted prices included within Level 1 that are observable for the asset or liability either directly
or indirectly, including quoted prices for similar assets or liabilities in active markets, quoted prices for identical or similar
assets or liabilities in markets that are not considered to be active, inputs other than quoted prices that are observable for
the asset or liability (such as exchange rates, financing terms, interest rates, yield curves, volatilities, prepayment speeds,
loss severities, credit risks and default rates) or other market-corroborated inputs; and
• Level 3 — Unobservable inputs for the asset or liability based on the best information available in the circumstances, to the
extent observable inputs are not available, including the Global Valuation Committee’s assumptions used in determining the
fair value of investments.
The hierarchy gives the highest priority to unadjusted quoted prices in active markets for identical assets or liabilities (Level 1
measurements) and the lowest priority to unobservable inputs (Level 3 measurements). Accordingly, the degree of judgement
exercised in determining fair value is greatest for instruments categorized in Level 3. The inputs used to measure fair value may
fall into different levels of the fair value hierarchy. In such cases, for disclosure purposes, the fair value hierarchy classification is
determined based on the lowest level input that is significant to the fair value measurement in its entirety. The fair value hierarchy
for the Fund’s investments is included in its schedule of investments.
Changes in valuation techniques may result in transfers in or out of an assigned level within the fair value hierarchy. In
accordance with the Trust’s policy, transfers between different levels of the fair value hierarchy are deemed to have occurred as
of the beginning of the reporting period. The categorization of values determined for financial instruments are based on the pricing
transparency of the financial instruments and are not necessarily an indication of the risks associated with investing in those
securities.
22 2 0 1 8 i S H A R E S S E M I - A N N U A L R E P O R T T O S H A R E H O L D E R S

Notes to Financial Statements (Unaudited) (Continued)
iSHARES® J.P. MORGAN USD EMERGING MARKETS BOND ETF
SECURITY TRANSACTIONS AND INCOME RECOGNITION
Security transactions are accounted for on trade date. Realized gains and losses on investment transactions are determined
using the specific identification method. Interest income, including amortization and accretion of premiums and discounts on debt
securities, and payment-in-kind interest income, if any are recognized daily on the accrual basis. Dividend income and capital
gain distributions, if any, are recognized on the ex-dividend date, net of any foreign taxes withheld at source.
DISTRIBUTIONS TO SHAREHOLDERS
Dividends and distributions paid by the Fund are recorded on the ex-dividend dates. Distributions are determined on a tax basis
and may differ from net investment income and net realized capital gains for financial reporting purposes. Dividends and
distributions are paid in U.S. dollars and cannot be automatically reinvested in additional shares of the Fund.
RECENT ACCOUNTING STANDARD
In March 2017, the Financial Accounting Standards Board issued Accounting Standards Update “Premium Amortization on
Purchase Callable Debt Securities” which amends the amortization period for certain purchased callable debt securities. Under
the new guidance, premium amortization of purchased callable debt securities that have explicit, non-contingent call features and
are callable at fixed prices will be amortized to the earliest call date. The guidance will be applied on a modified retrospective
basis and is effective for fiscal years, and their interim periods, beginning after December 15, 2018. Management is currently
evaluating the impact of this guidance to the Fund.
2. INVESTMENT ADVISORY AGREEMENT AND OTHER TRANSACTIONS WITH AFFILIATES
Pursuant to an Investment Advisory Agreement with the Trust, BlackRock Fund Advisors (“BFA”) manages the investment of the
Fund’s assets. BFA is a California corporation indirectly owned by BlackRock, Inc. (“BlackRock”). Under the Investment Advisory
Agreement, BFA is responsible for substantially all expenses of the Fund, except (i) interest and taxes; (ii) brokerage
commissions and other expenses connected with the execution of portfolio transactions; (iii) distribution fees; (iv) the advisory fee
payable to BFA; and (v) litigation expenses and any extraordinary expenses (in each case as determined by a majority of the
independent trustees).
For its investment advisory services to the Fund, BFA is entitled to an annual investment advisory fee, accrued daily and paid
monthly by the Fund, based on the Fund’s allocable portion of the aggregate of the average daily net assets of the Fund and
certain other iShares funds, as follows:
Investment Advisory Fee Aggregate Average Daily Net Assets
0.4000% First $19 billion
0.3800a Over $19 billion, up to and including $33 billion
0.3610a Over $33 billion, up to and including $47 billion
0.3430a Over $47 billion
a Investment advisory fee level reflects a 5% reduction (rounded to the fourth decimal place) from the investment advisory fee at the prior aggregate averagedaily net asset level.
BlackRock Investments, LLC, an affiliate of BFA, is the distributor for the Fund. Pursuant to the distribution agreement, BFA is
responsible for any fees or expenses for distribution services provided to the Fund.
N O T E S T O F I N A N C I A L S T A T E M E N T S 23

Notes to Financial Statements (Unaudited) (Continued)
iSHARES® J.P. MORGAN USD EMERGING MARKETS BOND ETF
Cross trading is the buying or selling of portfolio securities between funds to which BFA (or an affiliate) serves as investment
adviser. At its regularly scheduled quarterly meetings, the Board reviews such transactions as of the most recent calendar quarter
for compliance with the requirements and restrictions set forth by Rule 17a-7.
For the six months ended April 30, 2018, the purchases and sales transactions executed by the Fund pursuant to Rule 17a-7
under the 1940 Act were $ 6,147,852 and $ 4,877,078, respectively.
The Fund may invest its positive cash balances in certain money market funds managed by BFA or an affiliate. The income
earned on these temporary cash investments is included in “Dividends – affiliated” in the statement of operations.
The PNC Financial Services Group, Inc. is the largest stockholder of BlackRock and is considered to be an affiliate of the Fund
for 1940 Act purposes.
Certain trustees and officers of the Trust are also officers of BlackRock Institutional Trust Company, N.A. and/or BFA.
3. INVESTMENT PORTFOLIO TRANSACTIONS
Purchases and sales of investments (excluding in-kind transactions and short-term investments) for the six months ended
April 30, 2018, were $1,154,608,511 and $1,050,561,303, respectively.
In-kind purchases and sales (see Note 4) for the six months ended April 30, 2018, were $4,382,530,498 and $4,272,919,090,
respectively.
4. CAPITAL SHARE TRANSACTIONS
Capital shares are issued and redeemed by the Fund only in aggregations of a specified number of shares or multiples thereof
(“Creation Units”) at NAV. Except when aggregated in Creation Units, shares of the Fund are not redeemable. Transactions in
capital shares for the Fund are disclosed in detail in the statements of changes in net assets.
The consideration for the purchase of Creation Units of a fund in the Trust generally consists of the in-kind deposit of a
designated portfolio of securities and a specified amount of cash. Certain funds in the Trust may be offered in Creation Units
solely or partially for cash in U.S. dollars. Investors purchasing and redeeming Creation Units may pay a purchase transaction fee
and a redemption transaction fee directly to State Street Bank and Trust Company, the Trust’s administrator, to offset transfer and
other transaction costs associated with the issuance and redemption of Creation Units, including Creation Units for cash.
Investors transacting in Creation Units for cash may also pay an additional variable charge to compensate the relevant fund for
certain transaction costs (i.e., stamp taxes, taxes on currency or other financial transactions, and brokerage costs) and market
impact expenses relating to investing in portfolio securities. Such variable charges, if any, are included in “Proceeds from shares
sold” in the statement of changes in net assets.
From time to time, settlement of securities related to in-kind contributions or in-kind redemptions may be delayed. In such cases,
securities related to in-kind contributions are reflected as “Due from custodian” and securities related to in-kind redemptions are
reflected as “Securities related to in-kind transactions” in the statement of assets and liabilities.
5. PRINCIPAL RISKS
In the normal course of business, the Fund invests in securities or other instruments and may enter into certain transactions, and
such activities subject the Fund to various risks, including, among others, fluctuations in the market (market risk) or failure of an
issuer to meet all of its obligations. The value of securities or other instruments may also be affected by various factors, including,
24 2 0 1 8 i S H A R E S S E M I - A N N U A L R E P O R T T O S H A R E H O L D E R S

Notes to Financial Statements (Unaudited) (Continued)
iSHARES® J.P. MORGAN USD EMERGING MARKETS BOND ETF
without limitation: (i) the general economy; (ii) the overall market as well as local, regional or global political and/or social
instability; (iii) regulation, taxation or international tax treaties between various countries; or (iv) currency, interest rate or price
fluctuations. The Fund’s prospectus provides details of the risks to which the Fund is subject.
BFA uses a “passive” or index approach to try to achieve the Fund’s investment objective following the securities included in its
underlying index during upturns as well as downturns. BFA does not take steps to reduce market exposure or to lessen the
effects of a declining market. Divergence from the underlying index and the composition of the portfolio is monitored by BFA.
MARKET RISK
Market risk arises mainly from uncertainty about future values of financial instruments influenced by price, currency and interest
rate movements. It represents the potential loss a fund may suffer through holding market positions in the face of market
movements. A fund is exposed to market risk by its investment in equity, fixed income and/or financial derivative instruments or
by its investment in underlying funds. The fair value of securities held by a fund may decline due to general market conditions,
economic trends or events that are not specifically related to the issuers of the securities including local, regional or global
political, social or economic instability or to factors that affect a particular industry or group of industries. The extent of a fund’s
exposure to market risk is the market value of the investments held as shown in the fund’s schedule of investments.
A diversified portfolio, where this is appropriate and consistent with a fund’s objectives, minimizes the risk that a price change of a
particular investment will have a material impact on the NAV of a fund. The investment concentrations within the Fund’s portfolio
are disclosed in its schedule of investments.
Investing in the securities of non-U.S. issuers involves certain considerations and risks not typically associated with securities of
U.S. issuers. Such risks include, but are not limited to: differences in accounting, auditing and financial reporting standards; more
substantial governmental involvement in the economy; higher inflation rates, greater social, economic and political uncertainties;
possible nationalization or expropriation of assets; less availability of public information about issuers; imposition of withholding or
other taxes; higher transaction and custody costs and delays in settlement procedures; and lower level of regulation of the
securities markets and issuers. Non-U.S. securities may be less liquid, more difficult to value, and have greater price volatility due
to exchange rate fluctuations. These and other risks are heightened for investments in issuers from countries with less developed
capital markets.
The United States and the European Union, along with the regulatory bodies of a number of countries including Japan, Australia,
Norway, Switzerland and Canada, have imposed economic sanctions, which consist of asset freezes and sectorial sanctions, on
certain Russian individuals and Russian corporate entities. Broader sanctions on Russia could also be instituted. These
sanctions, or even the threat of further sanctions, may result in the decline of the value and liquidity of Russian securities, a
weakening of the ruble or other adverse consequences to the Russian economy. Current or future sanctions may result in Russia
taking counter measures or retaliatory actions, which may further impair the value and liquidity of Russian securities. These
retaliatory measures may include the immediate freeze of Russian assets held by a fund.
Changes in market interest rates or economic conditions may affect the value and/or liquidity of fixed income investments.
Interest rate risk is the risk that prices of bonds and other fixed-income securities will decrease as interest rates rise and increase
as interest rates fall. Securities with longer durations tend to be more sensitive to interest rate changes, usually making their
prices more volatile than those of securities with shorter durations. Given the environment of historically low interest rates, a fund
may be subject to a greater risk of price losses if interest rates rise.
N O T E S T O F I N A N C I A L S T A T E M E N T S 25

Notes to Financial Statements (Unaudited) (Continued)
iSHARES® J.P. MORGAN USD EMERGING MARKETS BOND ETF
CREDIT RISK
Credit risk is the risk that an issuer or guarantor of debt instruments or the counterparty to a financial transaction, including
derivatives contracts, repurchase agreements or loans of portfolio securities, is unable or unwilling to make timely interest and/or
principal payments or to otherwise honor its obligations. BFA and its affiliates manage counterparty credit risk by entering into
transactions only with counterparties that they believe have the financial resources to honor their obligations and by monitoring
the financial stability of those counterparties. Financial assets, which potentially expose a fund to issuer and counterparty credit
risks, consist principally of financial instruments and receivables due from counterparties. The extent of a fund’s exposure to
credit and counterparty risks with respect to those financial assets is approximated by their value recorded in its statement of
assets and liabilities.
High yield securities that are rated below investment-grade (commonly referred to as “junk bonds”) or are unrated may be
deemed speculative, involve greater levels of risk than higher-rated securities of similar maturity and are more likely to default.
High yield securities may be issued by less creditworthy issuers, and issuers of high yield securities may be unable to meet their
interest or principal payment obligations. High yield securities are subject to extreme price fluctuations, may be less liquid than
higher rated fixed-income securities, even under normal economic conditions, and frequently have redemption features.
6. INCOME TAX INFORMATION
The Fund is treated as an entity separate from the Trust’s other funds for federal income tax purposes. It is the policy of the Fund
to qualify as a regulated investment company by complying with the provisions applicable to regulated investment companies, as
defined under Subchapter M of the Internal Revenue Code of 1986, as amended, and to annually distribute substantially all of its
ordinary income and any net capital gains (taking into account any capital loss carryforwards) sufficient to relieve it from all, or
substantially all, federal income and excise taxes. Accordingly, no provision for federal income taxes is required.
For purposes of U.S. GAAP, in-kind redemptions are treated as sales of securities resulting in realized capital gains or losses to
the Fund. Because such gains or losses are not taxable to the Fund and are not distributed to existing Fund shareholders, the
gains or losses are reclassified from accumulated net realized gain (loss) to paid-in capital at the end of the Fund’s tax year.
These reclassifications have no effect on net assets or NAV per share.
The tax character of current year distributions will be determined at the end of the current fiscal year.
As of October 31, 2017, the Funds’ fiscal year-end, the Fund had capital loss carryforwards available to offset future realized
capital gains through the indicated expiration dates as follows:
Non-
Expiring a
Expiring
2018 Total
$141,419,263 $96,030 $141,515,293
a Must be utilized prior to losses subject to expiration.
As of April 30, 2018, the cost of investments (including short positions and derivatives, if any) for federal income tax purposes
was $11,869,697,133. Net unrealized depreciation was $635,290,972, of which $15,138,221 represented gross unrealized
appreciation on securities and $650,429,193 represented gross unrealized depreciation on securities.
Management has analyzed tax laws and regulations and their application to the Fund as of April 30, 2018, inclusive of the open
tax return years, and does not believe there are any uncertain tax positions that require recognition of a tax liability in the Fund’s
financial statements.
26 2 0 1 8 i S H A R E S S E M I - A N N U A L R E P O R T T O S H A R E H O L D E R S

Notes to Financial Statements (Unaudited) (Continued)
iSHARES® J.P. MORGAN USD EMERGING MARKETS BOND ETF
The Tax Cuts and Jobs Act (the “Act”) was enacted on December 22, 2017. Certain provisions of the Act were effective upon
enactment with the remainder becoming effective for tax years beginning after December 31, 2017. Although the Act does not
amend any provisions directly related to the qualification or taxation of regulated investment companies (“RICs”), the Act does
change the taxation of entities in which some RICs invest, the tax treatment of income derived from those entities and the taxation
of RIC shareholders. While management does not anticipate significant impact to the funds or to their shareholders, there is
uncertainty in the application of certain provisions in the Act. Specifically, provisions in the Act may increase the amount of or
accelerate the recognition of taxable income and may limit the deductibility of certain expenses by RICs. Until full clarity around
these provisions is obtained, the impact on the Fund’s financial statements, if any, cannot be fully determined.
7. LEGAL PROCEEDINGS
On June 16, 2016, investors (the “Plaintiffs”) in certain iShares funds (iShares Core S&P Small-Cap ETF, iShares Russell 1000
Growth ETF, iShares Core S&P 500 ETF, iShares Russell Mid-Cap Growth ETF, iShares Russell Mid-Cap ETF, iShares Russell
Mid-Cap Value ETF, iShares Select Dividend ETF, iShares Morningstar Mid-Cap ETF, iShares Morningstar Large-Cap ETF,
iShares U.S. Aerospace & Defense ETF and iShares U.S. Preferred Stock ETF) filed a putative class action lawsuit against
iShares Trust, BlackRock, Inc. and certain of its advisory affiliates, and certain directors/trustees and officers of the Funds
(collectively, “Defendants”) in California State Court. The lawsuit alleges the Defendants violated federal securities laws by failing
to adequately disclose in the prospectuses issued by the funds noted above the risks of using stop-loss orders in the event of a
‘flash crash’, such as the one that occurred on May 6, 2010. On September 18, 2017, the court issued a Statement of Decision
holding that the Plaintiffs lack standing to assert their claims. On October 11, 2017, the court entered final judgment dismissing all
of the Plaintiffs’ claims with prejudice. Plaintiffs have appealed the court’s decision.
8. SUBSEQUENT EVENTS
Management has evaluated the impact of all subsequent events on the Fund through the date the financial statements were
available to be issued and has determined that there were no subsequent events requiring adjustment or disclosure in the
financial statements.
N O T E S T O F I N A N C I A L S T A T E M E N T S 27

Supplemental Information (Unaudited)
iSHARES® J.P. MORGAN USD EMERGING MARKETS BOND ETF
Section 19(a) Notices
The amounts and sources of distributions reported are estimates and are provided pursuant to regulatory requirements and are
not being provided for tax reporting purposes. The actual amounts and sources for tax reporting purposes will depend upon the
Fund’s investment experience during the year and may be subject to changes based on the tax regulations. Shareholders will
receive a Form 1099-DIV each calendar year that will inform them how to report these distributions for federal income tax
purposes.
Total Cumulative Distributionsfor the Fiscal Year-to-Date
% Breakdown of the Total CumulativeDistributions for the Fiscal Year-to-Date
Net
Investment
Income
Net
Realized
Capital
Gains
Return
of
Capital
Total
Per Share
Net
Investment
Income
Net
Realized
Capital
Gains
Return
of
Capital
Total
Per
Share
$2.289096 $ — $ — $2.289096 100% — % — % 100%
28 2 0 1 8 i S H A R E S S E M I - A N N U A L R E P O R T T O S H A R E H O L D E R S

General InformationiSHARES® J.P. MORGAN USD EMERGING MARKETS BOND ETF
Electronic Delivery
Shareholders can sign up for email notifications announcing that the shareholder report or prospectus has been posted on the
iShares website at www.iShares.com. Once you have enrolled, you will no longer receive prospectuses and shareholder reports
in the mail.
To enroll in electronic delivery:
• Go to www.icsdelivery.com.
• If your brokerage firm is not listed, electronic delivery may not be available. Please contact your broker-dealer or financial
advisor.
Householding
Householding is an option available to certain fund investors. Householding is a method of delivery, based on the preference of
the individual investor, in which a single copy of certain shareholder documents can be delivered to investors who share the same
address, even if their accounts are registered under different names. Please contact your broker-dealer if you are interested in
enrolling in householding and receiving a single copy of prospectuses and other shareholder documents, or if you are currently
enrolled in householding and wish to change your householding status.
Availability of Quarterly Schedule of Investments
The iShares Funds file their complete schedule of portfolio holdings with the SEC for the first and third quarters of each fiscal year
on Form N-Q. The iShares Funds’ Forms N-Q are available on the SEC’s website and may be reviewed and copied at the SEC’s
Public Reference Room in Washington, D.C. Information on the operation of the Public Reference Room may be obtained by
calling 1-800-SEC-0330. The iShares Funds also disclose their complete schedule of portfolio holdings on a daily basis on the
iShares website.
Availability of Proxy Voting Policies and Proxy Voting Records
A description of the policies and procedures that the iShares Funds use to determine how to vote proxies relating to portfolio
securities and information about how the iShares Funds voted proxies relating to portfolio securities during the most recent
twelve-month period ending June 30 is available without charge, upon request (1) by calling toll-free 1-800-474-2737; (2) on the
iShares website at www.iShares.com; and (3) on the SEC website at www.sec.gov.
G E N E R A L I N F O R M A T I O N 29

Notes:
30 2 0 1 8 i S H A R E S S E M I - A N N U A L R E P O R T T O S H A R E H O L D E R S


For more information visit www.iShares.com or call 1-800-iShares (1-800-474-2737)
This report is intended for the Fund’s shareholders. It may not be distributed to prospective investors unless it is preceded or accompanied by
the current prospectus.
Investing involves risk, including possible loss of principal.
The iShares Funds are distributed by BlackRock Investments, LLC (together with its affiliates, “BlackRock”).
The iShares Funds are not sponsored, endorsed, issued, sold or promoted by JPMorgan Chase & Co., nor does this company make any representationregarding the advisability of investing in the iShares Funds. BlackRock is not affiliated with the company listed above.
©2018 BlackRock, Inc. All rights reserved. iSHARES and BLACKROCK are registered trademarks of BlackRock, Inc. or its subsidiaries. All other marks arethe property of their respective owners.iS
-SA
R-1
014-
0418