2018 review data digest european fund market · data digest european fund market 2018 review ......
TRANSCRIPT

Data Digest
European Fund Market2018 Review
Data Digest 2018 02072018
Page 123
Broadridge a global fintech leader with over $8billion in market capitalization providescommunications technology data and analyticsWe help drive business transformation for ourclients with solutions for enriching clientengagement navigating risk optimizingefficiency and generating revenue growth
For more information about Broadridge pleasevisit broadridgecom
Jeacuterocircme Couteur - Product Manager jeromecouteurbroadridgecom
Barbara Ferraresi - Product Manager barbaraferraresibroadridgecom
Diana Mackay - Editorial dmmackaywilliamscom
broadridgecom
About BroadridgeAuthor Informaon
Global Market Intelligence (GMI) reflects ourexpertise and understanding of marketsworldwide and of the evolving needs of assetmanagers
To learn more and to schedule a free demo ofGlobal Marketing Intelligence (GMI) visitwwwbroadridgecomGMI
For more information please contactlauracohenbroadridgecom
Database Featured
EUROPEAN FUND MARKET REVIEW 2018 EDITION
Page 223
EUROPEAN FUND MARKET REVIEW 2018 EDITION
2017 was a blockbuster year for European asset managers Buoyed by anunprecedented absence of market volatility accommodative central-bankpolicies and a pent-up demand from savers to get their money back to workfund managers enjoyed net sales volumes on a scale never experienced beforeInvestment funds registered total net inflows of euro729bn a figure that was 80higher than the industryrsquos previous sales record set in 2014 The year beganwith concerns of political risk and inflation but very soon it became clear thatmonetary policy would determine sentiment Investors took the view correctlythat there would be no unpleasant surprises on that front and responded byincreasing their allocations of savings to funds
In many ways the rush to invest took on febrile characteristics In an averageyear net sales flows into long-term funds account for 44 of overall assetgrowth the remainder coming from market performance In 2017 the net salespercentage rose to 71 of asset growth and in the bond arena it completelyoutstripped any market performance contribution This is an early sign of over-heating and a signal not seen since 2005
broadridgecom
TOTAL OF FUND CLOSURES
NET SALES (2017)
1895TOTAL OF MASTER GROUPS
2778TOTAL OF COMPANIES
36557TOTAL OF FUNDS
TOTAL OF FUND LAUNCHES 2378
2593
TOTAL NET ASSETS (DEC 2017)
ASSET GROWTH (2016-2017)
euro9761bn
euro947bn
euro729bn
KEY DATA
FIGURE 1 - CUMULATIVE NET SALES BY YEAR (eurobn)
Jan Feb Mar Apr May Jun Jul Aug Sep Oct Nov Dec
2014 2015 2016 2017
0
200
400
600
In this year of records the net sales of passive funds also entered new territoryeuro163bn was more than double the volume achieved in 2016 and volumes wereequally split between ETFs and traditional trackers However their gains failed tomatch those of active funds The stellar success of the fixed income sectorplayed well for active managers and proved that despite dire warnings of passivepressures there was still a lot of life in the active arena Passive fundsaccounted for just 17 of bond inflows and this pulled the overall passive shareof long-term sales back to just 25 However this headline figure masks thesignificant presence of passives in the net sales of equity funds In this categorypassive funds were the main driver of flows taking a 65 share
With very few exceptions all the larger European markets ended the year inpositive territory Italy and Germany vied for leadership in terms of sales flowsgenerated by local players but with cross-border activity taken into account (seeFig 36) Italy was the outstanding success story of the year Here euro70bn of netsales went to foreign groups alongside euro32bn of inflows registered by domesticgroups In Germany the weight of activity favoured local players but foreigngroups also did particularly well in Spain Here the strategy of local banks todirect their captive clients into third-party funds of funds was pivotal to thesuccess of foreign providers
One exception to the market success stories was Austria which according todomestic data posted redemptions of euro800m In reality Austrian investors weremigrating out of their traditional government bond holdings and moving intohigher yielding products provided mainly by foreign players
Overview
_____________________
Acve funds win out
Market analysis
Appetite for risk was also on the rise Safe-haven government bonds were soldoff in favour of emerging markets and higher yielding sectors Mixed asset fundshad another good year their sales matched by appetite for equities but thesuccess of both was eclipsed by the race into fixed income Both the bond andequity asset classes enjoyed sales volumes that rocketed to record levels Thefixed income category hit the heady heights of more than euro300bn of inflowsEquity funds achieved euro159bn which was their highest point of this millenniumbut failed to match the dotcom exuberance of 1999 Meanwhile the growingmixed asset segment fell slightly short of its 2015 peak even though its appeal toretail investors remained robust Its small step out of the limelight was in part dueto investorsrsquo willingness to take more risk but also linked to reduced fund-launchactivity from the Italian banks that was responsible for the spike of sales in 2015
Page 323
2018 EDITION
International groups are currently having their best year on record Fig 36reveals the most important markets for these groups this year and highlightsItaly as the primary driver with inflows of nearly euro40B going into foreignfunds This figure overwhelms the euro16B of new money taken by localindustry giants Spain follows with ~euro14B of inflows to cross-border groupsagain dominating domestic industry receipts of just euro5B Here funds of fundshave been a crucial distribution conduit and whilst flows look unlikely tomatch the record volumes seen in 2015 the Spanish market remains abuoyant target market
broadridgecom
FIGURE 2 - PASSIVE VS ACTIVE NET SALES IN 2017 (eurobn)
Active ETF Index Tracking
56615661
844844
785785
FIGURE 3 - MARKET SENTIMENT
of funds with negative flows of funds with positive flows
5151
4949
Overview
EUROPEAN FUND MARKET REVIEW
+1075Asset Growth
euro312MAverage fund size
euro729bnNet Sales 2017
The popular narrative of lsquowinner takes allrsquo seemed to hold true in 2017 withthe winning groups taking an even larger share of the net sales total Thetop-five groups took just over one third of the net sales invested in long-termfunds BlackRock registered its fifth consecutive year at the top of the salesleader board but this year the grouprsquos net receipts of euro89bn were nearlydouble its previous best year in 2015 More than 80 of these flows wereattributable to the grouprsquos passive funds However with sales in general soebullient in 2017 many other groups ended the year beating all previoussales records PIMCO ranked second but was the outstanding leader in theactive-management arena Other groups to shine were Amundi benefiting inpart from its acquisition of Italyrsquos Pioneer The acquisition was finalised mid-way through the year and had the effect of promoting Amundi to be Europersquossecond-largest asset-management group In this bumper year 14 groupsgenerated more than euro10bn of new money and 98 boasted over euro1bn
Market success
Group progress
With so much business going into existing funds there was only modestappetite to launch new products The number of fund launches dropped backto its lowest annual total on record (2355) but within this new product setwere some important institutional initiatives that boosted the fund assets ofthe industry as a whole and the UK in particular Specifically a series of fiveACS tracker funds launched by BlackRock made their mark with euro28bn ofnew money These funds were established as vehicles to manage some ofBlackRockrsquos UK institutional mandates and they pushed up the grouprsquosannual sales totals by one third
Products and innovaon
The top-five groups took just over one third ofthe net sales invested in long-term funds
Page 423
2018 EDITION
broadridgecom
FIGURE 4 - EUROPEAN NET SALES IN 2017 (eurobn)
Jan 2017 Feb 2017 Mar 2017 Apr 2017 May 2017 Jun 2017 Jul 2017 Aug 2017 Sep 2017 Oct 2017 Nov 2017 Dec 2017
Bond Equity Mixed Assets Money Market
-33
0
33
66
99
FIGURE 5 - GLOBAL NET SALES IN 2017 (eurobn)
Asia-Pacific Europe International Latin America MEA North America
Bond Equity Mixed Assets Money Market
0
200
400
600
Overview
EUROPEAN FUND MARKET REVIEW
Page 523
2018 EDITION
broadridgecom
Asia-Pacific Europe International Latin America MEA North Amercia
FIGURE 6 - HISTORICAL GLOBAL ASSETS (euroT)
2007 2008 2009 2010 2011 2012 2013 2014 2015 2016 2017
Asia-Pacific Europe International Latin America MEA North America
169169
133133159159
186186 185185207207
226226
271271
302302329329 337337
FIGURE 7 - GLOBAL ASSETS BY INVESTMENT TYPE
Bond Equity Mixed Assets Money Market
Overview
EUROPEAN FUND MARKET REVIEW
Page 623
2018 EDITION
broadridgecom
FIGURE 8 - BEST-SELLING BONDS FUNDS IN 2017 (eurom)
Fund Name Fund Strategy Launch Date Fund Sector Net Sales
PIMCO GIS Income Fund Active 2012-11 Bonds Global Currencies
Deutsche Floating Rate Notes LC Active 1991-07 Bank loanFloating rate
MampG Optimal Income Fund Active 2006-11 Bonds Flexible
Muzinich Enhanced Yield Short-Term Fund Active 2003-11 Bonds EUR Short-Term
Templeton Emerging Markets Bond Fund (Lux) Active 1991-07 Bonds Emerging Markets
AB FCP I Global High Yield Portfolio Active 1997-09 Bonds Global High Yield
42907
6306
5969
4568
4195
3747
Best Sellers
FIGURE 9 - BEST-SELLING MIXED FUNDS IN 2017 (eurom)
Fund Name Fund Strategy Launch Date Fund Sector Net Sales
Allianz Global Investors Fund - Allianz Income and Growth Active 2011-06 Mixed Assets Income
JPMorgan Investment Funds - Global Income Fund Active 2008-12 Mixed Assets Income
PrivatFonds Kontrolliert Active 2010-07 Mixed Assets Conservative
Invesco Perpetual Global Targeted Returns Active 2013-09 Asset Allocation Alternative
First Eagle Amundi Income Builder Fund Active 2014-09 Mixed Assets Income
BlackRock Global Funds - Global Multi-Asset Income Fund Active 2012-06 Mixed Assets Income
5811
5694
4533
4050
4042
3703
FIGURE 10 - BEST-SELLING EQUITY FUNDS IN 2017 (eurom)
Fund Name Fund Strategy Launch Date Fund Sector Net Sales
BlackRock ACS 5050 Global Equity Tracker Passive 2017-06 Equities Global
BlackRock ACS UK Equity Tracker Passive 2017-06 Equities United Kingdom
BlackRock ACS World ex UK Equity Tracker Passive 2017-04 Equities Global
Old Mutual Global Equity Absolute Return Active 2014-05 Equities Alternative
BlackRock ACS 3070 Global Equity Tracker Passive 2017-07 Equities Global
BlackRock ACS 6040 Global Equity Tracker Passive 2017-06 Equities Global
9576
6061
5754
3855
3604
3205
EUROPEAN FUND MARKET REVIEW
EUROPEAN FUND MARKET REVIEW
Page 723
2018 EDITION
broadridgecom
European Sales
FIGURE 11 - EUROPEAN MARKET RANKING BY NET SALES IN 2017 (eurom)
Fund Investment Type Group
Fund Market
Bnd Eq MM MM-Enh Mix Oth
Net Sales Net Sales Net Sales Net Sales Net Sales Net Sales
Sum
Net Sales
International
United Kingdom
Germany
Italy
France
Switzerland
Spain
Sweden
Belgium
Netherlands
Poland
Norway
Russia
Czech Republic
Portugal
Finland
Slovakia
Malta
Bulgaria
Slovenia
Estonia
Turkey
Liechtenstein
Lithuania
Ukraine
Luxembourg
Latvia
Romania
Croatia
Iceland
Greece
Hungary
Denmark
Austria
2667569
165850
57106
87529
82418
101602
-46604
36555
2764
17067
2248
6543
9761
-614
5147
1202
346
449
154
89
1050334
325386
45512
8204
58228
-22036
60250
49555
19815
32270
128
2301
79
2408
-474
-11954
-391
76
273
296
694401
92156
4473
-5199
-111982
6902
-9993
-7477
-8040
6349
13711
7824
-60
122
-3779
5309
-1070
-146
114
-445
110664
7313
34547
-3316
50184
4748
-987
327
7
-11
5107
21
-3
819711
113501
161404
222729
52725
20155
88282
-7206
62465
-11210
2309
611
-42
6776
6257
636
1840
502
194
691
-8841
16452
27373
7008
37908
12758
-15708
2325
-17119
3020
1286
120
-29
-1038
58
4847
561
-7
6
4
-25
-2417
20
151
-20
-62
-582
1669
-819
459
-5574
-21841
-12732
491
960
194
-79
1
-10
213
144
-1495
-565
861
-27252
-3871
-2388
-0
-398
-3494
-2029
-4305
-9402
-2082
-1033
-0
3
471
15
998
-48
3496
-59
-0
-0
-37
374
573
53
-306
1729
38565
5405
571
-0
-12
-113
-48
-124
6990
3510
3211
5333838
720657
330414
316955
169482
124130
75240
73751
60212
47495
19690
17399
9710
7643
7209
5147
1308
875
738
635
466
221
155
59
1
-57
-71
-503
-1156
-4290
-4371
-5380
-8102
-9068
Sum 3155412 1589852 658038 210040 1592125 84967 7290434
EUROPEAN FUND MARKET REVIEW
EUROPEAN FUND MARKET REVIEW
Page 823
2018 EDITION
broadridgecom
All Sector Ranking
FIGURE 12 - TOP SECTORS BY SALES IN 2017 (eurom)
Year
Fund Sector
2016 2017
Net Sales Net Sales Rank Net Sales Net Sales Rank
Bonds Global Currencies
Equities Global
Bonds Emerging Markets
Money Market GBP
Mixed Assets Income
Mixed Assets Conservative
Asset Allocation
Asset Allocation Alternative
Money Market USD
Bonds Flexible
Bank loanFloating rate
Fund of Funds Balanced
Short Term Dynamic
Mixed Assets Balanced
Equities Emerging Markets
Bonds Alternative
Bonds Emerging Markets - Local Currency
Bonds Global Corporates
Bonds EUR Short-Term
Fund of Funds Asset Allocation
Bonds USD Corp Inv Grade
Equities Euroland
15746
10080
12482
45218
2354
10823
16210
39666
24362
-9325
4484
7728
7409
-1269
15379
3350
6851
14379
10322
6785
6
14
9
1
36
11
5
2
4
224
27
17
18
202
7
32
22
8
13
23
80285
55066
40651
34065
33433
30457
30326
29854
28321
26253
25720
24692
21093
20077
19158
18805
18218
18191
17284
16980
1
2
3
4
5
6
7
8
9
10
11
12
13
14
15
16
17
18
19
20
3905
-6704
30
222
15487
15039
21
22
FIGURE 13 - TOP AND BOTTOM FIVE SECTORS BY SALES IN 2017 (eurom)
Bnd
Gl C
urr
Eq G
lobal
Bnd
Em M
kt
MM
GBP
Mix
Inco
me
Bnd
Eur C
orp
HY
Deriv
ative
s
FF H
dge
Eq U
K In
c
Bnd
Eur
0
50
EUROPEAN FUND MARKET REVIEW
Page 923
FIG 15 (REST) TOP MG BY SALES IN 17 - INC ETFs
Values
TOP 25
REST
TOTAL
433537
208698
642236
FIG 14 (REST) TOP MG BY SALES IN 17 (eurom) - EX ETFs
Values
TOP 25
REST
TOTAL
364583
192936
557519
2018 EDITION
broadridgecom
Note Excludes money market funds and ETFs Note Excludes money market funds
Pan-European Master Groups Sales
FIG 14 - TOP MASTER GROUPS BY SALES IN 2017 (eurom) - EX ETFs
Master Groups NAT Funds Net Sales
PIMCO US
BlackRock US
Intesa SP IT
GAM CH
Amundi FR
Allianz GI DE
PrudentialMampG GB
Invesco US
AXA FR
Vanguard US
VRUnion DE
Cr Suisse CH
Natixis FR
Goldman Sachs US
Royal London GB
UBS CH
Schroders GB
Baillie Gifford GB
MMCMercer US
Aviva GB
Old Mutual ZA
JPMorgan AM US
Morgan Stanley US
Jupiter GB
Pictet CH
64
260
701
265
907
372
134
156
356
52
418
347
274
103
51
469
229
48
52
159
58994
58373
22997
16972
16722
15253
14380
12657
11586
11080
10275
10250
9597
9354
8960
8838
8447
8426
8226
8019
114
202
112
54
139
7613
7583
7377
6477
6128
FIG 15 - TOP MASTER GROUPS BY SALES IN 2017 (eurom) - INC ETFs
Master Groups NAT Funds Net Sales
BlackRock US
PIMCO US
Amundi FR
Intesa SP IT
UBS CH
GAM CH
Deutsche AM DE
Vanguard US
Allianz GI DE
PrudentialMampG GB
Invesco US
AXA FR
Cr Suisse CH
VRUnion DE
Natixis FR
Goldman Sachs US
Soc GenLyxor FR
Royal London GB
Schroders GB
Baillie Gifford GB
MMCMercer US
Aviva GB
Old Mutual ZA
JPMorgan AM US
Morgan Stanley US
565
65
1010
701
585
269
633
71
372
134
245
356
348
419
285
103
358
51
229
48
88817
59019
26430
22997
18772
16960
16839
15330
15253
14380
13424
11586
10336
10293
9812
9354
9241
8960
8447
8426
52
159
114
202
119
8226
8019
7613
7583
7421
EUROPEAN FUND MARKET REVIEW
Page 1023
Values
Top 25
REST
TOTAL
152143
490092
642236
2018 EDITION
broadridgecom
Note Excludes money market funds
Pan-European Fund Leaders Sales
FIGURE 16 - TOP 25 FUNDS BY NET SALES IN 2017 (eurom)
Master Groups Fund Name Domicile Strategy Type Launch Date Net Sales
PIMCO PIMCO GIS Income Fund IE Active Bnd 2012-11
BlackRock BlackRock ACS 5050 Global Equity Tracker GB Passive Eq 2017-06
Deutsche AM Deutsche Floating Rate Notes LC LU Active Bnd 1991-07
BlackRock BlackRock ACS UK Equity Tracker GB Passive Eq 2017-06
PrudentialMampG MampG Optimal Income Fund GB Active Bnd 2006-11
Allianz GI Allianz Global Investors Fund - Allianz Income and Growth LU Active Mix 2011-06
BlackRock BlackRock ACS World ex UK Equity Tracker GB Passive Eq 2017-04
JPMorgan AM JPMorgan Investment Funds - Global Income Fund LU Active Mix 2008-12
Muzinich Muzinich Enhanced Yield Short-Term Fund IE Active Bnd 2003-11
VRUnion PrivatFonds Kontrolliert DE Active Mix 2010-07
Fr Templeton Templeton Emerging Markets Bond Fund (Lux) LU Active Bnd 1991-07
Invesco Invesco Perpetual Global Targeted Returns GB Active Mix 2013-09
Amundi First Eagle Amundi Income Builder Fund LU Active Mix 2014-09
Old Mutual Old Mutual Global Equity Absolute Return IE Active Eq 2014-05
AXA AB FCP I Global High Yield Portfolio LU Active Bnd 1997-09
BlackRock BlackRock Global Funds - Global Multi-Asset Income Fund LU Active Mix 2012-06
Invesco Invesco Pan European High Income Fund LU Active Mix 2006-03
PIMCO PIMCO GIS Global Investment Grade Credit IE Active Bnd 2003-07
BlackRock BlackRock ACS 3070 Global Equity Tracker GB Passive Eq 2017-07
Jupiter The Jupiter Global Fund - Jupiter Dynamic Bond LU Active Bnd 2012-05
PrudentialMampG MampG Dynamic Allocation GB Active Mix 2009-12
GAM GAM Star Credit Opportunities (EUR) IE Active Bnd 2011-07
Allianz GI Allianz Global Investors Fund - Allianz Floating Rate Notes Plus LU Active Bnd 2014-09
GAM GAM Multibond - Local Emerging Bond LU Active Bnd 2000-05
Amundi Amundi ETF Floating Rate USD Corporate UCITS ETF FR Passive Bnd 2015-04
42907
9576
6306
6061
5969
5811
5754
5694
4568
4533
4195
4050
4042
3855
3747
3703
3677
3649
3604
3553
3553
3397
3365
3343
3230
EUROPEAN FUND MARKET REVIEW
EUROPEAN FUND MARKET REVIEW
Page 1123
2018 EDITION
broadridgecom
Product ThemesExchange Traded Funds
FIGURE 17 - TOP 10 FUNDS BY SALES IN 2017 (eurom)
Master Groups Fund Name Launch Date Net Sales
Amundi Amundi ETF Floating Rate USD Corporate UCITS ETF 2015-04
UBS UBS ETFs plc - MSCI ACWI SF UCITS ETF 2015-08
BlackRock iShares Core MSCI World UCITS ETF 2009-09
iShares J P Morgan Emerging Markets Local Government Bond UCITS ETF 2011-06
iShares Core MSCI Emerging Markets IMI UCITS ETF 2014-05
Amundi Amundi ETF MSCI Emerging Markets UCITS ETF 2010-12
Deutsche Boumlrse Xetra-Gold 2007-12
BlackRock iShares Core SampP 500 UCITS ETF (USD) 2010-05
Soc GenLyxor Multi Units Luxembourg - Lyxor SampP 500 UCITS ETF 2010-03
Deutsche AM db x-trackers MSCI JAPAN INDEX UCITS ETF (DR) 2007-01
3230
3129
2916
2573
2468
2181
2086
1933
1805
1800
Sum 24121
FIGURE 18 - TOP 10 MASTER GROUPS BY SALES IN 2017 (eurom)
Master Groups NAT Funds Assets Net Sales
BlackRock US
Deutsche AM DE
UBS CH
Amundi FR
Soc GenLyxor FR
State Street US
Vanguard US
Deutsche Boumlrse DE
ETF Securities GB
Invesco US
307
190
116
104
233
99
19
1
15
90
297820
67695
41344
36397
62249
22493
29954
6084
2427
15678
30385
10731
9933
9581
8332
4322
4250
2086
1019
759
Sum 1174 582142 81399
EUROPEAN FUND MARKET REVIEW
Page 1223
2018 EDITION
broadridgecom
Product ThemesIndex Tracking Funds
FIGURE 19 - TOP 10 FUNDS BY SALES IN 2017 (eurom)
Master Groups Fund Name Launch Date Net Sales
BlackRock BlackRock ACS 5050 Global Equity Tracker 2017-06
BlackRock ACS UK Equity Tracker 2017-06
BlackRock ACS World ex UK Equity Tracker 2017-04
BlackRock ACS 3070 Global Equity Tracker 2017-07
BlackRock ACS 6040 Global Equity Tracker 2017-06
Vanguard Vanguard Investment Series Plc - Vanguard Global Bond Index Fund 2008-03
BlackRock iShares Corporate Bond Index 2010-06
iShares Over 15 Years Gilts Index 2017-03
Standard Aberdeen Aberdeen Global Corporate Bond Tracker 2017-08
BlackRock iShares Index Linked Gilt Index 2012-06
9576
6061
5754
3604
3205
2610
2214
1967
1710
1610
Sum 38310
FIGURE 20 - TOP 10 MASTER GROUPS BY SALES IN 2017 (eurom)
Master Groups NAT Funds Assets Net Sales
BlackRock US
Vanguard US
Amundi FR
Legal amp General GB
UBS CH
Northern Trust US
BNY Mellon US
Swisscanto CH
Standard Aberdeen GB
Cr Suisse CH
72
39
32
34
66
33
11
68
3
78
134527
95729
9792
31722
69711
19513
3776
30072
3754
62373
41043
11451
4031
3700
3384
3258
3255
2164
1643
1490
Sum 436 460967 75419
EUROPEAN FUND MARKET REVIEW
Page 1323
2018 EDITION
Note Excludes money market funds
broadridgecom
Product ThemesAcve vs Passive
FIGURE 22 - MARKET SHARE OF PASSIVE FUNDS BY ASSETS IN 2017
Dec 2017
Index Tracking ETF Active
88
77
8484
FIGURE 21 - MARKET SHARE OF PASSIVE FUNDS BY ASSETS IN 2003
Index Tracking ETF Active
3311
9696
EUROPEAN FUND MARKET REVIEW
FIGURE 23 - HISTORICAL NET SALES (eurobn)
2014 2015 2016 2017
Active ETF Index Tracking
310310
4040 4343
211211
64643737 4242 3838 3333
479479
8585 7878
Page 1423
2018 EDITION
broadridgecom
Product ThemesBonds Emerging Markets
FIGURE 24 - TOP 10 FUNDS BY SALES IN 2017 (eurom)
Master Groups Fund Name Launch Date Net Sales
Fr Templeton Templeton Emerging Markets Bond Fund (Lux) 1991-07
GAM GAM Multibond - Local Emerging Bond 2000-05
BlackRock BlackRock Global Funds - Emerging Markets Local Currency Bond Fund 2007-02
Intesa SP Epsilon Fund - Emerging Bond Total Return 2008-04
BlackRock iShares J P Morgan Emerging Markets Local Government Bond UCITS ETF 2011-06
Neuberger Berman Neuberger Berman Short Duration Emerging Market Debt Fund 2013-10
Goldman Sachs GS Emerging Markets Debt Portfolio 2000-05
Amundi Amundi Funds Bond Global Emerging Blended 2015-07
Ashmore Ashmore Sicav Emerging Markets Short Duration 2014-06
Amundi Pioneer Funds - Emerging Markets Bond 2000-06
4195
3343
2811
2639
2573
2013
1825
1762
1693
1498
Sum 24353
FIGURE 25 - TOP 10 MASTER GROUPS BY SALES IN 2017 (eurom)
Master Groups NAT Funds Assets Net Sales
BlackRock US
Amundi FR
Intesa SP IT
Fr Templeton US
Neuberger Berman US
Ashmore GB
GAM CH
Goldman Sachs US
NYL Candriam US
JPMorgan AM US
11
12
13
6
6
18
7
4
5
7
25334
12611
13588
8994
7208
12025
9515
10583
3788
8336
9652
5137
4945
4189
3991
3783
3658
2905
1586
1584
Sum 89 111983 41430
EUROPEAN FUND MARKET REVIEW
EUROPEAN FUND MARKET REVIEW
Page 1523
2018 EDITION
broadridgecom
Product Development
FIGURE 26 - TOP 10 FUNDS BY SALES IN 2017 (eurom)
Master Groups Fund Name Launch Date Net Sales
Allianz GI Allianz Global Investors Fund - Allianz Euroland Equity Growth 2006-10
BlackRock iShares Core EURO STOXX 50 UCITS ETF 2010-01
Schroders Schroder ISF-EURO Equity 1998-09
Deutsche AM db x-trackers MSCI EMU INDEX UCITS ETF (DR) 2012-11
UBS UBS ETF - MSCI EMU UCITS ETF 2002-09
Invesco Invesco Euro Equity Fund 2015-10
BlackRock iShares EURO STOXX 50 UCITS ETF (DE) 2000-12
Amundi Amundi ETF EURO STOXX 50 UCITS ETF 2008-09
La Caixa CaixaBank Bolsa Gestion Euro FI 1995-04
AXA AB FCP I Eurozone Equity Portfolio 1999-02
1673
1519
1427
1171
993
920
688
615
543
529
Sum 10078
FIGURE 27 - TOP 10 MASTER GROUPS BY SALES 2017 (eurom)
Master Groups NAT Funds Assets Net Sales
Amundi FR
BlackRock US
Deutsche AM DE
Allianz GI DE
Schroders GB
UBS CH
Invesco US
KutxaBank ES
NYL Candriam US
Sycomore FR
35
16
9
10
1
20
4
3
8
5
14031
26645
9638
5873
5523
9126
2427
1536
1033
1704
2635
2163
1811
1746
1427
1203
961
615
581
580
Sum 111 77535 13723
EUROPEAN FUND MARKET REVIEW
Equies Euroland
Page 1623
2018 EDITION
broadridgecom
Product Development
FIGURE 28 - FUND LAUNCHES amp CLOSURES
Jan 2017 Feb 2017 Mar 2017 Apr 2017 May 2017 Jun 2017 Jul 2017 Aug 2017 Sep 2017 Oct 2017 Nov 2017 Dec 2017
Fund Launches Fund Closures Fund Mergers
4545
148148
208208
8181
143143
213213
8484
135135
235235
6262
132132
160160
6363
136136
211211
5454
179179
272272
5353
197197
197197
3636
8787
111111
102102
126126
181181
4949
161161
196196
164164
147147
227227
7979
130130
167167
FIGURE 29 - TOP SELLING NEW FUND LAUNCHES IN 2017 (eurom)
Fund Name Fund Domicile Launch Date Net Sales
BlackRock ACS 5050 Global Equity Tracker United Kingdom 2017-06
BlackRock ACS UK Equity Tracker United Kingdom 2017-06
BlackRock ACS World ex UK Equity Tracker United Kingdom 2017-04
AXA Money Market France 2017-06
BlackRock ACS 3070 Global Equity Tracker United Kingdom 2017-07
BlackRock ACS 6040 Global Equity Tracker United Kingdom 2017-06
Royal London UK Real Estate United Kingdom 2017-10
Eurizon Top Selection Dicembre 2022 Italy 2017-09
Baillie Gifford Long Term Global Growth Investment United Kingdom 2017-04
UBS (Lux) Bond Sicav - USD Investment Grade Corporates (USD) Luxembourg 2017-01
9576
6061
5754
4010
3604
3205
3177
2664
2477
2466
EUROPEAN FUND MARKET REVIEW
Page 1723
2018 EDITION
broadridgecom
Product Development
FIGURE 30 - FUND LAUNCHES BY GROUP IN 2017 (eurom)
Master Group Funds Net Sales
BlackRock
Intesa SP
Amundi
AXA
UBS
BP Cooperativa
Cr Suisse
BNY Mellon
Royal London
KBC
43
117
90
33
37
14
33
43
5
56
35331
25107
10413
9873
8559
7765
7559
6161
5111
4743
Sum 471 120621
FIGURE 33 - NUMBER OF FUND LAUNCHES BY STRATEGY in 2017
Active ETF Index Tracking
21802180
117117
8181
FIGURE 32 - FUND LAUNCHES BY REGION IN 2017 (eurom)
Fund Region Funds Net Sales
Europe
International
1402
976
164293
70492
Sum 2378 234785
EUROPEAN FUND MARKET REVIEW
FIGURE 31 - NUMBER OF FUND LAUNCHES BY MAIN ASSET CLASS
2014 2015 2016 2017
Bond Equity Mixed Assets
611611
805805
557557596596
948948
681681
541541
737737
592592518518
709709
588588
Page 1823
FIG 35 (REST) TOP INT MAST GR BY ENS 17(eurom) - INCETF
Values
TOP 25
REST
TOTAL
349015
103863
452877
FIG 34 (REST) TOP MASTER GROUPS BY SALES IN H1 2017 (eurom) - EX ETFs
Values
TOP 25
REST
TOTAL
277554
93866
371420
broadridgecom
Note exclude money market funds and ETFs Note exclude money market funds
2018 EDITION
Cross-Border ProgressGroup Winners
FIG 34 - TOP CROSS-BORDER GROUPS BY SALES IN 2017 (eurom) - Ex ETFs
Master Groups NAT Funds Net Sales
PIMCO US
BlackRock US
GAM CH
PrudentialMampG GB
Invesco US
Amundi FR
AXA FR
Allianz GI DE
Goldman Sachs US
JPMorgan AM US
Natixis FR
Cr Suisse CH
MMCMercer US
Schroders GB
Deutsche AM DE
Vanguard US
Morgan Stanley US
Pictet CH
UBS CH
Old Mutual ZA
AQR Capital US
Aviva GB
Neuberger Berman US
Jupiter GB
Muzinich US
64
177
137
91
103
239
206
89
103
159
110
123
52
144
167
39
104
104
244
40
58994
18793
17363
16895
12786
12417
10966
10387
9354
8554
8507
8454
8226
8092
8067
7881
7322
6768
6435
5880
17
31
45
22
20
5818
5494
5306
4402
4393
FIG 35 - TOP CROSS-BORDER GROUPS BY SALES IN 17 (eurom) - INC ETFs
Master Groups NAT Funds Net Sales
PIMCO US
BlackRock US
Amundi FR
Deutsche AM DE
GAM CH
PrudentialMampG GB
UBS CH
Invesco US
Vanguard US
AXA FR
Allianz GI DE
Soc GenLyxor FR
Goldman Sachs US
Natixis FR
JPMorgan AM US
Cr Suisse CH
MMCMercer US
Schroders GB
Morgan Stanley US
Pictet CH
Old Mutual ZA
AQR Capital US
Aviva GB
Neuberger Berman US
State Street US
65
469
342
352
137
91
337
192
58
206
89
287
103
121
159
123
52
144
111
104
59019
49733
22125
18791
17363
16895
15547
13553
12131
10966
10387
9652
9354
8722
8554
8454
8226
8092
7366
6768
40
17
31
45
157
5880
5818
5494
5306
4819
EUROPEAN FUND MARKET REVIEW
Page 1923
broadridgecom
- Excludes money market funds amp ETFs
- Cross-border activity is actual sales asmeasured by the Broadridge SalesWatchConfidential Service
- The 66 members are estimated toaccount for 75-80 of the total cross-border sales activity
Cross-Border ProgressCross-Border Share of Sales in Europe
FIGURE 36 - NET SALES OF CROSS-BORDER GROUPS BY MARKET IN 2017 - ALL FUNDS (eurobn)
0 20 40 60 80
ItalySpain
SwitzerlandGermany
United KingdomFrance
BelgiumNetherlands
SwedenAustria
FIGURE 37 - NET SALES OF CROSS-BORDER GROUPS BY MARKET IN 2017 - EQUITY ONLY (eurobn)
0 3 5 8
ItalySpain
United KingdomSwitzerland
FranceBelgiumAustria
SwedenGermany
Netherlands
FIGURE 38 - NET SALES OF CROSS-BORDER GROUPS BY MARKET IN 2017 - BOND ONLY (eurobn)
0 10 20 30 40
ItalySwitzerland
SpainGermany
United KingdomFrance
NetherlandsSwedenAustria
Belgium
Note to data
Cross-Border Progress
2018 EDITIONEUROPEAN FUND MARKET REVIEW
Page 2023
FIGURE 39 - DOM GERMANY in 2017
Domestic Net Sales
Mixed Assets Conservative
Asset Allocation Alternative
Bank loanFloating rate
Equities Global Income
Mixed Assets Income
6254
4036
3378
2247
2035
FIGURE 39 - SW SECTOR GERMANY in 2017
Cross-Border Real Sales
Bank loanFloating rate
Asset Allocation Alternative
Mixed Assets Income
Bonds Global Currencies
Bonds Flexible
Confidential
Confidential
Confidential
Confidential
Confidential
FIGURE 39 - SW SECTOR ITALY 2017
Cross-Border Real Sales
Mixed Assets Income
Bonds Global Currencies
Asset Allocation
Bonds Emerging Markets
Bonds Flexible
Confidential
Confidential
Confidential
Confidential
Confidential
FIGURE 39 - DOM SWITZERLAND in 2017
Domestic Net Sales
Bonds Global Currencies
Bonds Global Corporates
Equities North America
Equities Real Estate
Bonds Emerging Markets
3828
2462
1219
1143
885
FIGURE 39 - SW SECTOR UK 2017
Cross-Border Real Sales
Bonds Global Currencies
Bonds Global Corporates
Bonds Emerging Markets - Local Currency
Equities Europe Ex UK
Bonds Emerging Markets
Confidential
Confidential
Confidential
Confidential
Confidential
Cross-Border Real Sales
Bonds Global Currencies
Equities Euroland
Asset Allocation Alternative
Bonds Emerging Markets
Asset Allocation
Confidential
Confidential
Confidential
Confidential
Confidential
Domestic Net Sales
Real Estate
Bonds EUR Short-Term
Asset Allocation
Equities France MidSmall Caps
Equities Euroland MidSmall Caps
3962
3576
2992
1611
1523
FIGURE 39 - SW SECTOR SWITZWELAND 2017
Cross-Border Real Sales
Bonds Global Currencies
Bonds USD Corp Inv Grade
Bonds Emerging Markets - Local Currency
Bonds Flexible
Bank loanFloating rate
Confidential
Confidential
Confidential
Confidential
Confidential
FIGURE 39 - DOM UNITED KINGDOM in 2017
Domestic Net Sales
Equities Global
Bonds Target Maturity
Equities Europe Ex UK
Asset Allocation Alternative
Asset Allocation
27349
4700
4359
3002
2445
FIGURE 36 - DOM ITALY
Domestic Net Sales
Bonds Global Currencies
Mixed Assets Target Maturity
Mixed Assets Conservative
Bonds Emerging Markets
Mixed Assets Balanced
8267
6408
3639
2541
2068
broadridgecom
FRANCE
FIGURE 39 - TOP 5 DOMESTIC AND CROSS-BORDERS SECTORS IN THE MAJOR MARKETS IN 2017 (eurom)
GERMANY
ITALY
SWITZERLAND
UNITED KINGDOM
Real Sales dataavailable to SalesWatchmembers only
Domesc vs Cross-Border Sectors
Note to data
Cross-Border Progress
Page 2123
broadridgecom
The following report is based on the unique fund analytics delivered throughBroadridge Global Market Intelligence (GMI) our leading global fundanalytics database The charts and tables in this report reflect only the tip ofthe iceberg in terms of the depth and breadth available from Broadridge GMIThe report offers a high-level overview of European fund flow activity in 2017
Global Market Intelligence (GMI) helps you make more strategic decisionsmore effectively allocate your companyrsquos resources and most importantly bemore responsive to your customersrsquo needs all through the combining thepower of the FundFile and SalesWatch datasets
Broadridge FundFile enables deep fund flows analysis of all keygeographical markets covering Asia Pacific Latin America the Middle Eastand Africa and North America and delivers a truly global fund flows solutionBy gradually building the international reach of its global sales data andmaintaining its high quality and ease of use over the past ten years FundFilehas become the unparalleled source of data and analysis with informationon more than 100000 funds
The cross-border dimension of the European funds industryndashtheldquointernationalrdquo fund marketndashcan truly be assessed only with BroadridgeSalesWatch a unique cooperative and confidential benchmarking servicethat allows leading fund groups to track their cross-border sales and assetsagainst their competitorsrsquo by country distribution channel institutional versusretail activity and both gross and net sales This service now counts 66 ofthe leading asset managers among its members (Some sample data takenfrom the tool can be seen on pages 20 and 21 of the current report)
1 All data is at December 2017 unless otherwise stated
2 lsquoInternationalrsquo fund market Broadridge defines an International fund as afund that sources less than 80 of its assets from any single country Somefund groups have domestic and international funds
3 lsquoDomesticrsquo fund market If a fund sources more than 80 of its assets from asingle country then the fund is allocated to that market regardless of itsdomicile
4 Funds of funds have been excluded from all charts and tables (to avoiddouble counting) unless otherwise stated Therefore a market total is the sumof all the investment categories excluding the three funds of funds categories(in-house ex-house and hedge)
5 The investment category lsquootherrsquo includes a variety of different productcategories For most markets especially Belgium Spain and France the figurecomprises guaranteed funds but there are also derivatives and other specialityfunds in the lsquootherrsquo category
6 Property funds are open-ended property funds only
7 Master group Analysis that aggregates the European mutual fund assetsunder the umbrella of their parent company name
8 ETFs are included in Broadridgersquos database on mutual funds but thisexcludes exchange-traded commodity products that are not mutual funds
9 References to foreign activity relate to actual sales as measured byBroadridgersquos SalesWatch confidential service The 65 SalesWatch membersare estimated to account for 75-80 of total cross-border sales activity
No part of this document may be distributed reproduced or posted without the express written permission of Broadridge Financial Solutions Inc copy2018 Broadridge FinancialSolutions Inc Broadridge and the Broadridge logo are registered trademarks of Broadridge Financial Solutions Inc
Footnotes About the Report
Page 2223
copy Copyright 2018 Broadridge Financial Solutions Inc
Page 2323
- Data Digest 2018
-

2018 EDITION
broadridgecom
European Sales
FIGURE 11 - EUROPEAN MARKET RANKING BY NET SALES IN 2017 (eurom)
Fund Investment Type Group
Fund Market
Bnd Eq MM MM-Enh Mix Oth
Net Sales Net Sales Net Sales Net Sales Net Sales Net Sales
Sum
Net Sales
International
United Kingdom
Germany
Italy
France
Switzerland
Spain
Sweden
Belgium
Netherlands
Poland
Norway
Russia
Czech Republic
Portugal
Finland
Slovakia
Malta
Bulgaria
Slovenia
Estonia
Turkey
Liechtenstein
Lithuania
Ukraine
Luxembourg
Latvia
Romania
Croatia
Iceland
Greece
Hungary
Denmark
Austria
2667569
165850
57106
87529
82418
101602
-46604
36555
2764
17067
2248
6543
9761
-614
5147
1202
346
449
154
89
1050334
325386
45512
8204
58228
-22036
60250
49555
19815
32270
128
2301
79
2408
-474
-11954
-391
76
273
296
694401
92156
4473
-5199
-111982
6902
-9993
-7477
-8040
6349
13711
7824
-60
122
-3779
5309
-1070
-146
114
-445
110664
7313
34547
-3316
50184
4748
-987
327
7
-11
5107
21
-3
819711
113501
161404
222729
52725
20155
88282
-7206
62465
-11210
2309
611
-42
6776
6257
636
1840
502
194
691
-8841
16452
27373
7008
37908
12758
-15708
2325
-17119
3020
1286
120
-29
-1038
58
4847
561
-7
6
4
-25
-2417
20
151
-20
-62
-582
1669
-819
459
-5574
-21841
-12732
491
960
194
-79
1
-10
213
144
-1495
-565
861
-27252
-3871
-2388
-0
-398
-3494
-2029
-4305
-9402
-2082
-1033
-0
3
471
15
998
-48
3496
-59
-0
-0
-37
374
573
53
-306
1729
38565
5405
571
-0
-12
-113
-48
-124
6990
3510
3211
5333838
720657
330414
316955
169482
124130
75240
73751
60212
47495
19690
17399
9710
7643
7209
5147
1308
875
738
635
466
221
155
59
1
-57
-71
-503
-1156
-4290
-4371
-5380
-8102
-9068
Sum 3155412 1589852 658038 210040 1592125 84967 7290434
EUROPEAN FUND MARKET REVIEW
EUROPEAN FUND MARKET REVIEW
Page 823
2018 EDITION
broadridgecom
All Sector Ranking
FIGURE 12 - TOP SECTORS BY SALES IN 2017 (eurom)
Year
Fund Sector
2016 2017
Net Sales Net Sales Rank Net Sales Net Sales Rank
Bonds Global Currencies
Equities Global
Bonds Emerging Markets
Money Market GBP
Mixed Assets Income
Mixed Assets Conservative
Asset Allocation
Asset Allocation Alternative
Money Market USD
Bonds Flexible
Bank loanFloating rate
Fund of Funds Balanced
Short Term Dynamic
Mixed Assets Balanced
Equities Emerging Markets
Bonds Alternative
Bonds Emerging Markets - Local Currency
Bonds Global Corporates
Bonds EUR Short-Term
Fund of Funds Asset Allocation
Bonds USD Corp Inv Grade
Equities Euroland
15746
10080
12482
45218
2354
10823
16210
39666
24362
-9325
4484
7728
7409
-1269
15379
3350
6851
14379
10322
6785
6
14
9
1
36
11
5
2
4
224
27
17
18
202
7
32
22
8
13
23
80285
55066
40651
34065
33433
30457
30326
29854
28321
26253
25720
24692
21093
20077
19158
18805
18218
18191
17284
16980
1
2
3
4
5
6
7
8
9
10
11
12
13
14
15
16
17
18
19
20
3905
-6704
30
222
15487
15039
21
22
FIGURE 13 - TOP AND BOTTOM FIVE SECTORS BY SALES IN 2017 (eurom)
Bnd
Gl C
urr
Eq G
lobal
Bnd
Em M
kt
MM
GBP
Mix
Inco
me
Bnd
Eur C
orp
HY
Deriv
ative
s
FF H
dge
Eq U
K In
c
Bnd
Eur
0
50
EUROPEAN FUND MARKET REVIEW
Page 923
FIG 15 (REST) TOP MG BY SALES IN 17 - INC ETFs
Values
TOP 25
REST
TOTAL
433537
208698
642236
FIG 14 (REST) TOP MG BY SALES IN 17 (eurom) - EX ETFs
Values
TOP 25
REST
TOTAL
364583
192936
557519
2018 EDITION
broadridgecom
Note Excludes money market funds and ETFs Note Excludes money market funds
Pan-European Master Groups Sales
FIG 14 - TOP MASTER GROUPS BY SALES IN 2017 (eurom) - EX ETFs
Master Groups NAT Funds Net Sales
PIMCO US
BlackRock US
Intesa SP IT
GAM CH
Amundi FR
Allianz GI DE
PrudentialMampG GB
Invesco US
AXA FR
Vanguard US
VRUnion DE
Cr Suisse CH
Natixis FR
Goldman Sachs US
Royal London GB
UBS CH
Schroders GB
Baillie Gifford GB
MMCMercer US
Aviva GB
Old Mutual ZA
JPMorgan AM US
Morgan Stanley US
Jupiter GB
Pictet CH
64
260
701
265
907
372
134
156
356
52
418
347
274
103
51
469
229
48
52
159
58994
58373
22997
16972
16722
15253
14380
12657
11586
11080
10275
10250
9597
9354
8960
8838
8447
8426
8226
8019
114
202
112
54
139
7613
7583
7377
6477
6128
FIG 15 - TOP MASTER GROUPS BY SALES IN 2017 (eurom) - INC ETFs
Master Groups NAT Funds Net Sales
BlackRock US
PIMCO US
Amundi FR
Intesa SP IT
UBS CH
GAM CH
Deutsche AM DE
Vanguard US
Allianz GI DE
PrudentialMampG GB
Invesco US
AXA FR
Cr Suisse CH
VRUnion DE
Natixis FR
Goldman Sachs US
Soc GenLyxor FR
Royal London GB
Schroders GB
Baillie Gifford GB
MMCMercer US
Aviva GB
Old Mutual ZA
JPMorgan AM US
Morgan Stanley US
565
65
1010
701
585
269
633
71
372
134
245
356
348
419
285
103
358
51
229
48
88817
59019
26430
22997
18772
16960
16839
15330
15253
14380
13424
11586
10336
10293
9812
9354
9241
8960
8447
8426
52
159
114
202
119
8226
8019
7613
7583
7421
EUROPEAN FUND MARKET REVIEW
Page 1023
Values
Top 25
REST
TOTAL
152143
490092
642236
2018 EDITION
broadridgecom
Note Excludes money market funds
Pan-European Fund Leaders Sales
FIGURE 16 - TOP 25 FUNDS BY NET SALES IN 2017 (eurom)
Master Groups Fund Name Domicile Strategy Type Launch Date Net Sales
PIMCO PIMCO GIS Income Fund IE Active Bnd 2012-11
BlackRock BlackRock ACS 5050 Global Equity Tracker GB Passive Eq 2017-06
Deutsche AM Deutsche Floating Rate Notes LC LU Active Bnd 1991-07
BlackRock BlackRock ACS UK Equity Tracker GB Passive Eq 2017-06
PrudentialMampG MampG Optimal Income Fund GB Active Bnd 2006-11
Allianz GI Allianz Global Investors Fund - Allianz Income and Growth LU Active Mix 2011-06
BlackRock BlackRock ACS World ex UK Equity Tracker GB Passive Eq 2017-04
JPMorgan AM JPMorgan Investment Funds - Global Income Fund LU Active Mix 2008-12
Muzinich Muzinich Enhanced Yield Short-Term Fund IE Active Bnd 2003-11
VRUnion PrivatFonds Kontrolliert DE Active Mix 2010-07
Fr Templeton Templeton Emerging Markets Bond Fund (Lux) LU Active Bnd 1991-07
Invesco Invesco Perpetual Global Targeted Returns GB Active Mix 2013-09
Amundi First Eagle Amundi Income Builder Fund LU Active Mix 2014-09
Old Mutual Old Mutual Global Equity Absolute Return IE Active Eq 2014-05
AXA AB FCP I Global High Yield Portfolio LU Active Bnd 1997-09
BlackRock BlackRock Global Funds - Global Multi-Asset Income Fund LU Active Mix 2012-06
Invesco Invesco Pan European High Income Fund LU Active Mix 2006-03
PIMCO PIMCO GIS Global Investment Grade Credit IE Active Bnd 2003-07
BlackRock BlackRock ACS 3070 Global Equity Tracker GB Passive Eq 2017-07
Jupiter The Jupiter Global Fund - Jupiter Dynamic Bond LU Active Bnd 2012-05
PrudentialMampG MampG Dynamic Allocation GB Active Mix 2009-12
GAM GAM Star Credit Opportunities (EUR) IE Active Bnd 2011-07
Allianz GI Allianz Global Investors Fund - Allianz Floating Rate Notes Plus LU Active Bnd 2014-09
GAM GAM Multibond - Local Emerging Bond LU Active Bnd 2000-05
Amundi Amundi ETF Floating Rate USD Corporate UCITS ETF FR Passive Bnd 2015-04
42907
9576
6306
6061
5969
5811
5754
5694
4568
4533
4195
4050
4042
3855
3747
3703
3677
3649
3604
3553
3553
3397
3365
3343
3230
EUROPEAN FUND MARKET REVIEW
EUROPEAN FUND MARKET REVIEW
Page 1123
2018 EDITION
broadridgecom
Product ThemesExchange Traded Funds
FIGURE 17 - TOP 10 FUNDS BY SALES IN 2017 (eurom)
Master Groups Fund Name Launch Date Net Sales
Amundi Amundi ETF Floating Rate USD Corporate UCITS ETF 2015-04
UBS UBS ETFs plc - MSCI ACWI SF UCITS ETF 2015-08
BlackRock iShares Core MSCI World UCITS ETF 2009-09
iShares J P Morgan Emerging Markets Local Government Bond UCITS ETF 2011-06
iShares Core MSCI Emerging Markets IMI UCITS ETF 2014-05
Amundi Amundi ETF MSCI Emerging Markets UCITS ETF 2010-12
Deutsche Boumlrse Xetra-Gold 2007-12
BlackRock iShares Core SampP 500 UCITS ETF (USD) 2010-05
Soc GenLyxor Multi Units Luxembourg - Lyxor SampP 500 UCITS ETF 2010-03
Deutsche AM db x-trackers MSCI JAPAN INDEX UCITS ETF (DR) 2007-01
3230
3129
2916
2573
2468
2181
2086
1933
1805
1800
Sum 24121
FIGURE 18 - TOP 10 MASTER GROUPS BY SALES IN 2017 (eurom)
Master Groups NAT Funds Assets Net Sales
BlackRock US
Deutsche AM DE
UBS CH
Amundi FR
Soc GenLyxor FR
State Street US
Vanguard US
Deutsche Boumlrse DE
ETF Securities GB
Invesco US
307
190
116
104
233
99
19
1
15
90
297820
67695
41344
36397
62249
22493
29954
6084
2427
15678
30385
10731
9933
9581
8332
4322
4250
2086
1019
759
Sum 1174 582142 81399
EUROPEAN FUND MARKET REVIEW
Page 1223
2018 EDITION
broadridgecom
Product ThemesIndex Tracking Funds
FIGURE 19 - TOP 10 FUNDS BY SALES IN 2017 (eurom)
Master Groups Fund Name Launch Date Net Sales
BlackRock BlackRock ACS 5050 Global Equity Tracker 2017-06
BlackRock ACS UK Equity Tracker 2017-06
BlackRock ACS World ex UK Equity Tracker 2017-04
BlackRock ACS 3070 Global Equity Tracker 2017-07
BlackRock ACS 6040 Global Equity Tracker 2017-06
Vanguard Vanguard Investment Series Plc - Vanguard Global Bond Index Fund 2008-03
BlackRock iShares Corporate Bond Index 2010-06
iShares Over 15 Years Gilts Index 2017-03
Standard Aberdeen Aberdeen Global Corporate Bond Tracker 2017-08
BlackRock iShares Index Linked Gilt Index 2012-06
9576
6061
5754
3604
3205
2610
2214
1967
1710
1610
Sum 38310
FIGURE 20 - TOP 10 MASTER GROUPS BY SALES IN 2017 (eurom)
Master Groups NAT Funds Assets Net Sales
BlackRock US
Vanguard US
Amundi FR
Legal amp General GB
UBS CH
Northern Trust US
BNY Mellon US
Swisscanto CH
Standard Aberdeen GB
Cr Suisse CH
72
39
32
34
66
33
11
68
3
78
134527
95729
9792
31722
69711
19513
3776
30072
3754
62373
41043
11451
4031
3700
3384
3258
3255
2164
1643
1490
Sum 436 460967 75419
EUROPEAN FUND MARKET REVIEW
Page 1323
2018 EDITION
Note Excludes money market funds
broadridgecom
Product ThemesAcve vs Passive
FIGURE 22 - MARKET SHARE OF PASSIVE FUNDS BY ASSETS IN 2017
Dec 2017
Index Tracking ETF Active
88
77
8484
FIGURE 21 - MARKET SHARE OF PASSIVE FUNDS BY ASSETS IN 2003
Index Tracking ETF Active
3311
9696
EUROPEAN FUND MARKET REVIEW
FIGURE 23 - HISTORICAL NET SALES (eurobn)
2014 2015 2016 2017
Active ETF Index Tracking
310310
4040 4343
211211
64643737 4242 3838 3333
479479
8585 7878
Page 1423
2018 EDITION
broadridgecom
Product ThemesBonds Emerging Markets
FIGURE 24 - TOP 10 FUNDS BY SALES IN 2017 (eurom)
Master Groups Fund Name Launch Date Net Sales
Fr Templeton Templeton Emerging Markets Bond Fund (Lux) 1991-07
GAM GAM Multibond - Local Emerging Bond 2000-05
BlackRock BlackRock Global Funds - Emerging Markets Local Currency Bond Fund 2007-02
Intesa SP Epsilon Fund - Emerging Bond Total Return 2008-04
BlackRock iShares J P Morgan Emerging Markets Local Government Bond UCITS ETF 2011-06
Neuberger Berman Neuberger Berman Short Duration Emerging Market Debt Fund 2013-10
Goldman Sachs GS Emerging Markets Debt Portfolio 2000-05
Amundi Amundi Funds Bond Global Emerging Blended 2015-07
Ashmore Ashmore Sicav Emerging Markets Short Duration 2014-06
Amundi Pioneer Funds - Emerging Markets Bond 2000-06
4195
3343
2811
2639
2573
2013
1825
1762
1693
1498
Sum 24353
FIGURE 25 - TOP 10 MASTER GROUPS BY SALES IN 2017 (eurom)
Master Groups NAT Funds Assets Net Sales
BlackRock US
Amundi FR
Intesa SP IT
Fr Templeton US
Neuberger Berman US
Ashmore GB
GAM CH
Goldman Sachs US
NYL Candriam US
JPMorgan AM US
11
12
13
6
6
18
7
4
5
7
25334
12611
13588
8994
7208
12025
9515
10583
3788
8336
9652
5137
4945
4189
3991
3783
3658
2905
1586
1584
Sum 89 111983 41430
EUROPEAN FUND MARKET REVIEW
EUROPEAN FUND MARKET REVIEW
Page 1523
2018 EDITION
broadridgecom
Product Development
FIGURE 26 - TOP 10 FUNDS BY SALES IN 2017 (eurom)
Master Groups Fund Name Launch Date Net Sales
Allianz GI Allianz Global Investors Fund - Allianz Euroland Equity Growth 2006-10
BlackRock iShares Core EURO STOXX 50 UCITS ETF 2010-01
Schroders Schroder ISF-EURO Equity 1998-09
Deutsche AM db x-trackers MSCI EMU INDEX UCITS ETF (DR) 2012-11
UBS UBS ETF - MSCI EMU UCITS ETF 2002-09
Invesco Invesco Euro Equity Fund 2015-10
BlackRock iShares EURO STOXX 50 UCITS ETF (DE) 2000-12
Amundi Amundi ETF EURO STOXX 50 UCITS ETF 2008-09
La Caixa CaixaBank Bolsa Gestion Euro FI 1995-04
AXA AB FCP I Eurozone Equity Portfolio 1999-02
1673
1519
1427
1171
993
920
688
615
543
529
Sum 10078
FIGURE 27 - TOP 10 MASTER GROUPS BY SALES 2017 (eurom)
Master Groups NAT Funds Assets Net Sales
Amundi FR
BlackRock US
Deutsche AM DE
Allianz GI DE
Schroders GB
UBS CH
Invesco US
KutxaBank ES
NYL Candriam US
Sycomore FR
35
16
9
10
1
20
4
3
8
5
14031
26645
9638
5873
5523
9126
2427
1536
1033
1704
2635
2163
1811
1746
1427
1203
961
615
581
580
Sum 111 77535 13723
EUROPEAN FUND MARKET REVIEW
Equies Euroland
Page 1623
2018 EDITION
broadridgecom
Product Development
FIGURE 28 - FUND LAUNCHES amp CLOSURES
Jan 2017 Feb 2017 Mar 2017 Apr 2017 May 2017 Jun 2017 Jul 2017 Aug 2017 Sep 2017 Oct 2017 Nov 2017 Dec 2017
Fund Launches Fund Closures Fund Mergers
4545
148148
208208
8181
143143
213213
8484
135135
235235
6262
132132
160160
6363
136136
211211
5454
179179
272272
5353
197197
197197
3636
8787
111111
102102
126126
181181
4949
161161
196196
164164
147147
227227
7979
130130
167167
FIGURE 29 - TOP SELLING NEW FUND LAUNCHES IN 2017 (eurom)
Fund Name Fund Domicile Launch Date Net Sales
BlackRock ACS 5050 Global Equity Tracker United Kingdom 2017-06
BlackRock ACS UK Equity Tracker United Kingdom 2017-06
BlackRock ACS World ex UK Equity Tracker United Kingdom 2017-04
AXA Money Market France 2017-06
BlackRock ACS 3070 Global Equity Tracker United Kingdom 2017-07
BlackRock ACS 6040 Global Equity Tracker United Kingdom 2017-06
Royal London UK Real Estate United Kingdom 2017-10
Eurizon Top Selection Dicembre 2022 Italy 2017-09
Baillie Gifford Long Term Global Growth Investment United Kingdom 2017-04
UBS (Lux) Bond Sicav - USD Investment Grade Corporates (USD) Luxembourg 2017-01
9576
6061
5754
4010
3604
3205
3177
2664
2477
2466
EUROPEAN FUND MARKET REVIEW
Page 1723
2018 EDITION
broadridgecom
Product Development
FIGURE 30 - FUND LAUNCHES BY GROUP IN 2017 (eurom)
Master Group Funds Net Sales
BlackRock
Intesa SP
Amundi
AXA
UBS
BP Cooperativa
Cr Suisse
BNY Mellon
Royal London
KBC
43
117
90
33
37
14
33
43
5
56
35331
25107
10413
9873
8559
7765
7559
6161
5111
4743
Sum 471 120621
FIGURE 33 - NUMBER OF FUND LAUNCHES BY STRATEGY in 2017
Active ETF Index Tracking
21802180
117117
8181
FIGURE 32 - FUND LAUNCHES BY REGION IN 2017 (eurom)
Fund Region Funds Net Sales
Europe
International
1402
976
164293
70492
Sum 2378 234785
EUROPEAN FUND MARKET REVIEW
FIGURE 31 - NUMBER OF FUND LAUNCHES BY MAIN ASSET CLASS
2014 2015 2016 2017
Bond Equity Mixed Assets
611611
805805
557557596596
948948
681681
541541
737737
592592518518
709709
588588
Page 1823
FIG 35 (REST) TOP INT MAST GR BY ENS 17(eurom) - INCETF
Values
TOP 25
REST
TOTAL
349015
103863
452877
FIG 34 (REST) TOP MASTER GROUPS BY SALES IN H1 2017 (eurom) - EX ETFs
Values
TOP 25
REST
TOTAL
277554
93866
371420
broadridgecom
Note exclude money market funds and ETFs Note exclude money market funds
2018 EDITION
Cross-Border ProgressGroup Winners
FIG 34 - TOP CROSS-BORDER GROUPS BY SALES IN 2017 (eurom) - Ex ETFs
Master Groups NAT Funds Net Sales
PIMCO US
BlackRock US
GAM CH
PrudentialMampG GB
Invesco US
Amundi FR
AXA FR
Allianz GI DE
Goldman Sachs US
JPMorgan AM US
Natixis FR
Cr Suisse CH
MMCMercer US
Schroders GB
Deutsche AM DE
Vanguard US
Morgan Stanley US
Pictet CH
UBS CH
Old Mutual ZA
AQR Capital US
Aviva GB
Neuberger Berman US
Jupiter GB
Muzinich US
64
177
137
91
103
239
206
89
103
159
110
123
52
144
167
39
104
104
244
40
58994
18793
17363
16895
12786
12417
10966
10387
9354
8554
8507
8454
8226
8092
8067
7881
7322
6768
6435
5880
17
31
45
22
20
5818
5494
5306
4402
4393
FIG 35 - TOP CROSS-BORDER GROUPS BY SALES IN 17 (eurom) - INC ETFs
Master Groups NAT Funds Net Sales
PIMCO US
BlackRock US
Amundi FR
Deutsche AM DE
GAM CH
PrudentialMampG GB
UBS CH
Invesco US
Vanguard US
AXA FR
Allianz GI DE
Soc GenLyxor FR
Goldman Sachs US
Natixis FR
JPMorgan AM US
Cr Suisse CH
MMCMercer US
Schroders GB
Morgan Stanley US
Pictet CH
Old Mutual ZA
AQR Capital US
Aviva GB
Neuberger Berman US
State Street US
65
469
342
352
137
91
337
192
58
206
89
287
103
121
159
123
52
144
111
104
59019
49733
22125
18791
17363
16895
15547
13553
12131
10966
10387
9652
9354
8722
8554
8454
8226
8092
7366
6768
40
17
31
45
157
5880
5818
5494
5306
4819
EUROPEAN FUND MARKET REVIEW
Page 1923
broadridgecom
- Excludes money market funds amp ETFs
- Cross-border activity is actual sales asmeasured by the Broadridge SalesWatchConfidential Service
- The 66 members are estimated toaccount for 75-80 of the total cross-border sales activity
Cross-Border ProgressCross-Border Share of Sales in Europe
FIGURE 36 - NET SALES OF CROSS-BORDER GROUPS BY MARKET IN 2017 - ALL FUNDS (eurobn)
0 20 40 60 80
ItalySpain
SwitzerlandGermany
United KingdomFrance
BelgiumNetherlands
SwedenAustria
FIGURE 37 - NET SALES OF CROSS-BORDER GROUPS BY MARKET IN 2017 - EQUITY ONLY (eurobn)
0 3 5 8
ItalySpain
United KingdomSwitzerland
FranceBelgiumAustria
SwedenGermany
Netherlands
FIGURE 38 - NET SALES OF CROSS-BORDER GROUPS BY MARKET IN 2017 - BOND ONLY (eurobn)
0 10 20 30 40
ItalySwitzerland
SpainGermany
United KingdomFrance
NetherlandsSwedenAustria
Belgium
Note to data
Cross-Border Progress
2018 EDITIONEUROPEAN FUND MARKET REVIEW
Page 2023
FIGURE 39 - DOM GERMANY in 2017
Domestic Net Sales
Mixed Assets Conservative
Asset Allocation Alternative
Bank loanFloating rate
Equities Global Income
Mixed Assets Income
6254
4036
3378
2247
2035
FIGURE 39 - SW SECTOR GERMANY in 2017
Cross-Border Real Sales
Bank loanFloating rate
Asset Allocation Alternative
Mixed Assets Income
Bonds Global Currencies
Bonds Flexible
Confidential
Confidential
Confidential
Confidential
Confidential
FIGURE 39 - SW SECTOR ITALY 2017
Cross-Border Real Sales
Mixed Assets Income
Bonds Global Currencies
Asset Allocation
Bonds Emerging Markets
Bonds Flexible
Confidential
Confidential
Confidential
Confidential
Confidential
FIGURE 39 - DOM SWITZERLAND in 2017
Domestic Net Sales
Bonds Global Currencies
Bonds Global Corporates
Equities North America
Equities Real Estate
Bonds Emerging Markets
3828
2462
1219
1143
885
FIGURE 39 - SW SECTOR UK 2017
Cross-Border Real Sales
Bonds Global Currencies
Bonds Global Corporates
Bonds Emerging Markets - Local Currency
Equities Europe Ex UK
Bonds Emerging Markets
Confidential
Confidential
Confidential
Confidential
Confidential
Cross-Border Real Sales
Bonds Global Currencies
Equities Euroland
Asset Allocation Alternative
Bonds Emerging Markets
Asset Allocation
Confidential
Confidential
Confidential
Confidential
Confidential
Domestic Net Sales
Real Estate
Bonds EUR Short-Term
Asset Allocation
Equities France MidSmall Caps
Equities Euroland MidSmall Caps
3962
3576
2992
1611
1523
FIGURE 39 - SW SECTOR SWITZWELAND 2017
Cross-Border Real Sales
Bonds Global Currencies
Bonds USD Corp Inv Grade
Bonds Emerging Markets - Local Currency
Bonds Flexible
Bank loanFloating rate
Confidential
Confidential
Confidential
Confidential
Confidential
FIGURE 39 - DOM UNITED KINGDOM in 2017
Domestic Net Sales
Equities Global
Bonds Target Maturity
Equities Europe Ex UK
Asset Allocation Alternative
Asset Allocation
27349
4700
4359
3002
2445
FIGURE 36 - DOM ITALY
Domestic Net Sales
Bonds Global Currencies
Mixed Assets Target Maturity
Mixed Assets Conservative
Bonds Emerging Markets
Mixed Assets Balanced
8267
6408
3639
2541
2068
broadridgecom
FRANCE
FIGURE 39 - TOP 5 DOMESTIC AND CROSS-BORDERS SECTORS IN THE MAJOR MARKETS IN 2017 (eurom)
GERMANY
ITALY
SWITZERLAND
UNITED KINGDOM
Real Sales dataavailable to SalesWatchmembers only
Domesc vs Cross-Border Sectors
Note to data
Cross-Border Progress
Page 2123
broadridgecom
The following report is based on the unique fund analytics delivered throughBroadridge Global Market Intelligence (GMI) our leading global fundanalytics database The charts and tables in this report reflect only the tip ofthe iceberg in terms of the depth and breadth available from Broadridge GMIThe report offers a high-level overview of European fund flow activity in 2017
Global Market Intelligence (GMI) helps you make more strategic decisionsmore effectively allocate your companyrsquos resources and most importantly bemore responsive to your customersrsquo needs all through the combining thepower of the FundFile and SalesWatch datasets
Broadridge FundFile enables deep fund flows analysis of all keygeographical markets covering Asia Pacific Latin America the Middle Eastand Africa and North America and delivers a truly global fund flows solutionBy gradually building the international reach of its global sales data andmaintaining its high quality and ease of use over the past ten years FundFilehas become the unparalleled source of data and analysis with informationon more than 100000 funds
The cross-border dimension of the European funds industryndashtheldquointernationalrdquo fund marketndashcan truly be assessed only with BroadridgeSalesWatch a unique cooperative and confidential benchmarking servicethat allows leading fund groups to track their cross-border sales and assetsagainst their competitorsrsquo by country distribution channel institutional versusretail activity and both gross and net sales This service now counts 66 ofthe leading asset managers among its members (Some sample data takenfrom the tool can be seen on pages 20 and 21 of the current report)
1 All data is at December 2017 unless otherwise stated
2 lsquoInternationalrsquo fund market Broadridge defines an International fund as afund that sources less than 80 of its assets from any single country Somefund groups have domestic and international funds
3 lsquoDomesticrsquo fund market If a fund sources more than 80 of its assets from asingle country then the fund is allocated to that market regardless of itsdomicile
4 Funds of funds have been excluded from all charts and tables (to avoiddouble counting) unless otherwise stated Therefore a market total is the sumof all the investment categories excluding the three funds of funds categories(in-house ex-house and hedge)
5 The investment category lsquootherrsquo includes a variety of different productcategories For most markets especially Belgium Spain and France the figurecomprises guaranteed funds but there are also derivatives and other specialityfunds in the lsquootherrsquo category
6 Property funds are open-ended property funds only
7 Master group Analysis that aggregates the European mutual fund assetsunder the umbrella of their parent company name
8 ETFs are included in Broadridgersquos database on mutual funds but thisexcludes exchange-traded commodity products that are not mutual funds
9 References to foreign activity relate to actual sales as measured byBroadridgersquos SalesWatch confidential service The 65 SalesWatch membersare estimated to account for 75-80 of total cross-border sales activity
No part of this document may be distributed reproduced or posted without the express written permission of Broadridge Financial Solutions Inc copy2018 Broadridge FinancialSolutions Inc Broadridge and the Broadridge logo are registered trademarks of Broadridge Financial Solutions Inc
Footnotes About the Report
Page 2223
copy Copyright 2018 Broadridge Financial Solutions Inc
Page 2323
- Data Digest 2018
-
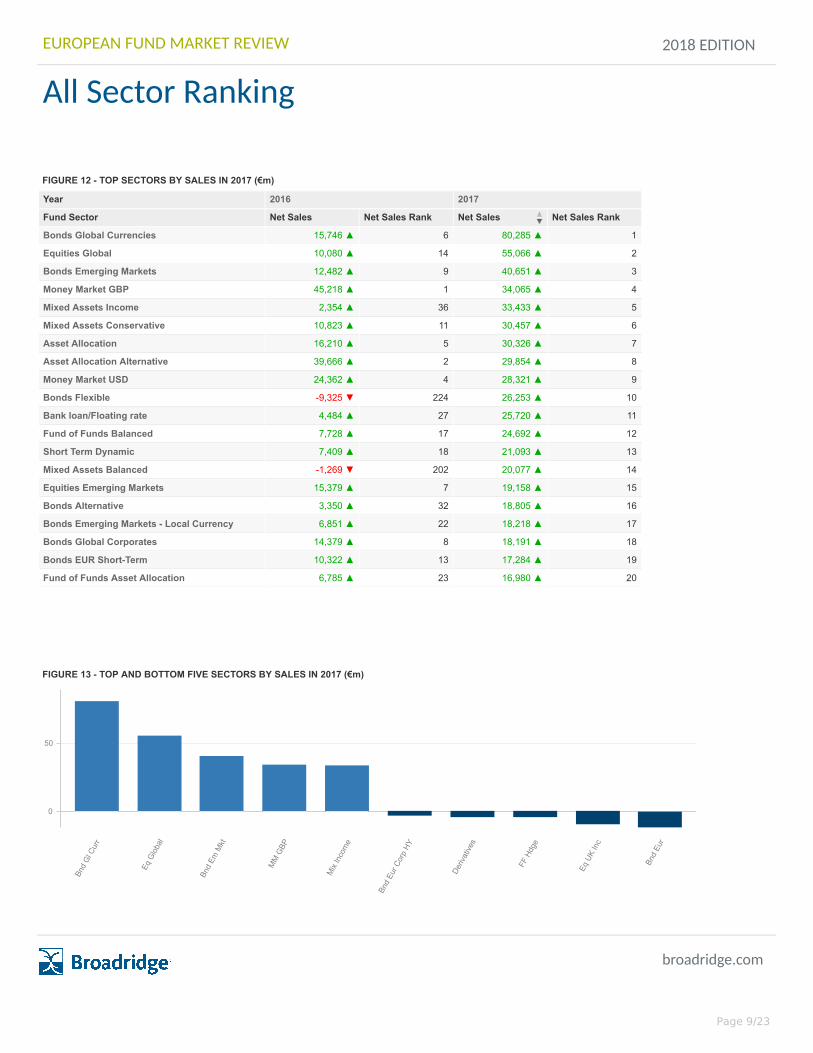
2018 EDITION
broadridgecom
All Sector Ranking
FIGURE 12 - TOP SECTORS BY SALES IN 2017 (eurom)
Year
Fund Sector
2016 2017
Net Sales Net Sales Rank Net Sales Net Sales Rank
Bonds Global Currencies
Equities Global
Bonds Emerging Markets
Money Market GBP
Mixed Assets Income
Mixed Assets Conservative
Asset Allocation
Asset Allocation Alternative
Money Market USD
Bonds Flexible
Bank loanFloating rate
Fund of Funds Balanced
Short Term Dynamic
Mixed Assets Balanced
Equities Emerging Markets
Bonds Alternative
Bonds Emerging Markets - Local Currency
Bonds Global Corporates
Bonds EUR Short-Term
Fund of Funds Asset Allocation
Bonds USD Corp Inv Grade
Equities Euroland
15746
10080
12482
45218
2354
10823
16210
39666
24362
-9325
4484
7728
7409
-1269
15379
3350
6851
14379
10322
6785
6
14
9
1
36
11
5
2
4
224
27
17
18
202
7
32
22
8
13
23
80285
55066
40651
34065
33433
30457
30326
29854
28321
26253
25720
24692
21093
20077
19158
18805
18218
18191
17284
16980
1
2
3
4
5
6
7
8
9
10
11
12
13
14
15
16
17
18
19
20
3905
-6704
30
222
15487
15039
21
22
FIGURE 13 - TOP AND BOTTOM FIVE SECTORS BY SALES IN 2017 (eurom)
Bnd
Gl C
urr
Eq G
lobal
Bnd
Em M
kt
MM
GBP
Mix
Inco
me
Bnd
Eur C
orp
HY
Deriv
ative
s
FF H
dge
Eq U
K In
c
Bnd
Eur
0
50
EUROPEAN FUND MARKET REVIEW
Page 923
FIG 15 (REST) TOP MG BY SALES IN 17 - INC ETFs
Values
TOP 25
REST
TOTAL
433537
208698
642236
FIG 14 (REST) TOP MG BY SALES IN 17 (eurom) - EX ETFs
Values
TOP 25
REST
TOTAL
364583
192936
557519
2018 EDITION
broadridgecom
Note Excludes money market funds and ETFs Note Excludes money market funds
Pan-European Master Groups Sales
FIG 14 - TOP MASTER GROUPS BY SALES IN 2017 (eurom) - EX ETFs
Master Groups NAT Funds Net Sales
PIMCO US
BlackRock US
Intesa SP IT
GAM CH
Amundi FR
Allianz GI DE
PrudentialMampG GB
Invesco US
AXA FR
Vanguard US
VRUnion DE
Cr Suisse CH
Natixis FR
Goldman Sachs US
Royal London GB
UBS CH
Schroders GB
Baillie Gifford GB
MMCMercer US
Aviva GB
Old Mutual ZA
JPMorgan AM US
Morgan Stanley US
Jupiter GB
Pictet CH
64
260
701
265
907
372
134
156
356
52
418
347
274
103
51
469
229
48
52
159
58994
58373
22997
16972
16722
15253
14380
12657
11586
11080
10275
10250
9597
9354
8960
8838
8447
8426
8226
8019
114
202
112
54
139
7613
7583
7377
6477
6128
FIG 15 - TOP MASTER GROUPS BY SALES IN 2017 (eurom) - INC ETFs
Master Groups NAT Funds Net Sales
BlackRock US
PIMCO US
Amundi FR
Intesa SP IT
UBS CH
GAM CH
Deutsche AM DE
Vanguard US
Allianz GI DE
PrudentialMampG GB
Invesco US
AXA FR
Cr Suisse CH
VRUnion DE
Natixis FR
Goldman Sachs US
Soc GenLyxor FR
Royal London GB
Schroders GB
Baillie Gifford GB
MMCMercer US
Aviva GB
Old Mutual ZA
JPMorgan AM US
Morgan Stanley US
565
65
1010
701
585
269
633
71
372
134
245
356
348
419
285
103
358
51
229
48
88817
59019
26430
22997
18772
16960
16839
15330
15253
14380
13424
11586
10336
10293
9812
9354
9241
8960
8447
8426
52
159
114
202
119
8226
8019
7613
7583
7421
EUROPEAN FUND MARKET REVIEW
Page 1023
Values
Top 25
REST
TOTAL
152143
490092
642236
2018 EDITION
broadridgecom
Note Excludes money market funds
Pan-European Fund Leaders Sales
FIGURE 16 - TOP 25 FUNDS BY NET SALES IN 2017 (eurom)
Master Groups Fund Name Domicile Strategy Type Launch Date Net Sales
PIMCO PIMCO GIS Income Fund IE Active Bnd 2012-11
BlackRock BlackRock ACS 5050 Global Equity Tracker GB Passive Eq 2017-06
Deutsche AM Deutsche Floating Rate Notes LC LU Active Bnd 1991-07
BlackRock BlackRock ACS UK Equity Tracker GB Passive Eq 2017-06
PrudentialMampG MampG Optimal Income Fund GB Active Bnd 2006-11
Allianz GI Allianz Global Investors Fund - Allianz Income and Growth LU Active Mix 2011-06
BlackRock BlackRock ACS World ex UK Equity Tracker GB Passive Eq 2017-04
JPMorgan AM JPMorgan Investment Funds - Global Income Fund LU Active Mix 2008-12
Muzinich Muzinich Enhanced Yield Short-Term Fund IE Active Bnd 2003-11
VRUnion PrivatFonds Kontrolliert DE Active Mix 2010-07
Fr Templeton Templeton Emerging Markets Bond Fund (Lux) LU Active Bnd 1991-07
Invesco Invesco Perpetual Global Targeted Returns GB Active Mix 2013-09
Amundi First Eagle Amundi Income Builder Fund LU Active Mix 2014-09
Old Mutual Old Mutual Global Equity Absolute Return IE Active Eq 2014-05
AXA AB FCP I Global High Yield Portfolio LU Active Bnd 1997-09
BlackRock BlackRock Global Funds - Global Multi-Asset Income Fund LU Active Mix 2012-06
Invesco Invesco Pan European High Income Fund LU Active Mix 2006-03
PIMCO PIMCO GIS Global Investment Grade Credit IE Active Bnd 2003-07
BlackRock BlackRock ACS 3070 Global Equity Tracker GB Passive Eq 2017-07
Jupiter The Jupiter Global Fund - Jupiter Dynamic Bond LU Active Bnd 2012-05
PrudentialMampG MampG Dynamic Allocation GB Active Mix 2009-12
GAM GAM Star Credit Opportunities (EUR) IE Active Bnd 2011-07
Allianz GI Allianz Global Investors Fund - Allianz Floating Rate Notes Plus LU Active Bnd 2014-09
GAM GAM Multibond - Local Emerging Bond LU Active Bnd 2000-05
Amundi Amundi ETF Floating Rate USD Corporate UCITS ETF FR Passive Bnd 2015-04
42907
9576
6306
6061
5969
5811
5754
5694
4568
4533
4195
4050
4042
3855
3747
3703
3677
3649
3604
3553
3553
3397
3365
3343
3230
EUROPEAN FUND MARKET REVIEW
EUROPEAN FUND MARKET REVIEW
Page 1123
2018 EDITION
broadridgecom
Product ThemesExchange Traded Funds
FIGURE 17 - TOP 10 FUNDS BY SALES IN 2017 (eurom)
Master Groups Fund Name Launch Date Net Sales
Amundi Amundi ETF Floating Rate USD Corporate UCITS ETF 2015-04
UBS UBS ETFs plc - MSCI ACWI SF UCITS ETF 2015-08
BlackRock iShares Core MSCI World UCITS ETF 2009-09
iShares J P Morgan Emerging Markets Local Government Bond UCITS ETF 2011-06
iShares Core MSCI Emerging Markets IMI UCITS ETF 2014-05
Amundi Amundi ETF MSCI Emerging Markets UCITS ETF 2010-12
Deutsche Boumlrse Xetra-Gold 2007-12
BlackRock iShares Core SampP 500 UCITS ETF (USD) 2010-05
Soc GenLyxor Multi Units Luxembourg - Lyxor SampP 500 UCITS ETF 2010-03
Deutsche AM db x-trackers MSCI JAPAN INDEX UCITS ETF (DR) 2007-01
3230
3129
2916
2573
2468
2181
2086
1933
1805
1800
Sum 24121
FIGURE 18 - TOP 10 MASTER GROUPS BY SALES IN 2017 (eurom)
Master Groups NAT Funds Assets Net Sales
BlackRock US
Deutsche AM DE
UBS CH
Amundi FR
Soc GenLyxor FR
State Street US
Vanguard US
Deutsche Boumlrse DE
ETF Securities GB
Invesco US
307
190
116
104
233
99
19
1
15
90
297820
67695
41344
36397
62249
22493
29954
6084
2427
15678
30385
10731
9933
9581
8332
4322
4250
2086
1019
759
Sum 1174 582142 81399
EUROPEAN FUND MARKET REVIEW
Page 1223
2018 EDITION
broadridgecom
Product ThemesIndex Tracking Funds
FIGURE 19 - TOP 10 FUNDS BY SALES IN 2017 (eurom)
Master Groups Fund Name Launch Date Net Sales
BlackRock BlackRock ACS 5050 Global Equity Tracker 2017-06
BlackRock ACS UK Equity Tracker 2017-06
BlackRock ACS World ex UK Equity Tracker 2017-04
BlackRock ACS 3070 Global Equity Tracker 2017-07
BlackRock ACS 6040 Global Equity Tracker 2017-06
Vanguard Vanguard Investment Series Plc - Vanguard Global Bond Index Fund 2008-03
BlackRock iShares Corporate Bond Index 2010-06
iShares Over 15 Years Gilts Index 2017-03
Standard Aberdeen Aberdeen Global Corporate Bond Tracker 2017-08
BlackRock iShares Index Linked Gilt Index 2012-06
9576
6061
5754
3604
3205
2610
2214
1967
1710
1610
Sum 38310
FIGURE 20 - TOP 10 MASTER GROUPS BY SALES IN 2017 (eurom)
Master Groups NAT Funds Assets Net Sales
BlackRock US
Vanguard US
Amundi FR
Legal amp General GB
UBS CH
Northern Trust US
BNY Mellon US
Swisscanto CH
Standard Aberdeen GB
Cr Suisse CH
72
39
32
34
66
33
11
68
3
78
134527
95729
9792
31722
69711
19513
3776
30072
3754
62373
41043
11451
4031
3700
3384
3258
3255
2164
1643
1490
Sum 436 460967 75419
EUROPEAN FUND MARKET REVIEW
Page 1323
2018 EDITION
Note Excludes money market funds
broadridgecom
Product ThemesAcve vs Passive
FIGURE 22 - MARKET SHARE OF PASSIVE FUNDS BY ASSETS IN 2017
Dec 2017
Index Tracking ETF Active
88
77
8484
FIGURE 21 - MARKET SHARE OF PASSIVE FUNDS BY ASSETS IN 2003
Index Tracking ETF Active
3311
9696
EUROPEAN FUND MARKET REVIEW
FIGURE 23 - HISTORICAL NET SALES (eurobn)
2014 2015 2016 2017
Active ETF Index Tracking
310310
4040 4343
211211
64643737 4242 3838 3333
479479
8585 7878
Page 1423
2018 EDITION
broadridgecom
Product ThemesBonds Emerging Markets
FIGURE 24 - TOP 10 FUNDS BY SALES IN 2017 (eurom)
Master Groups Fund Name Launch Date Net Sales
Fr Templeton Templeton Emerging Markets Bond Fund (Lux) 1991-07
GAM GAM Multibond - Local Emerging Bond 2000-05
BlackRock BlackRock Global Funds - Emerging Markets Local Currency Bond Fund 2007-02
Intesa SP Epsilon Fund - Emerging Bond Total Return 2008-04
BlackRock iShares J P Morgan Emerging Markets Local Government Bond UCITS ETF 2011-06
Neuberger Berman Neuberger Berman Short Duration Emerging Market Debt Fund 2013-10
Goldman Sachs GS Emerging Markets Debt Portfolio 2000-05
Amundi Amundi Funds Bond Global Emerging Blended 2015-07
Ashmore Ashmore Sicav Emerging Markets Short Duration 2014-06
Amundi Pioneer Funds - Emerging Markets Bond 2000-06
4195
3343
2811
2639
2573
2013
1825
1762
1693
1498
Sum 24353
FIGURE 25 - TOP 10 MASTER GROUPS BY SALES IN 2017 (eurom)
Master Groups NAT Funds Assets Net Sales
BlackRock US
Amundi FR
Intesa SP IT
Fr Templeton US
Neuberger Berman US
Ashmore GB
GAM CH
Goldman Sachs US
NYL Candriam US
JPMorgan AM US
11
12
13
6
6
18
7
4
5
7
25334
12611
13588
8994
7208
12025
9515
10583
3788
8336
9652
5137
4945
4189
3991
3783
3658
2905
1586
1584
Sum 89 111983 41430
EUROPEAN FUND MARKET REVIEW
EUROPEAN FUND MARKET REVIEW
Page 1523
2018 EDITION
broadridgecom
Product Development
FIGURE 26 - TOP 10 FUNDS BY SALES IN 2017 (eurom)
Master Groups Fund Name Launch Date Net Sales
Allianz GI Allianz Global Investors Fund - Allianz Euroland Equity Growth 2006-10
BlackRock iShares Core EURO STOXX 50 UCITS ETF 2010-01
Schroders Schroder ISF-EURO Equity 1998-09
Deutsche AM db x-trackers MSCI EMU INDEX UCITS ETF (DR) 2012-11
UBS UBS ETF - MSCI EMU UCITS ETF 2002-09
Invesco Invesco Euro Equity Fund 2015-10
BlackRock iShares EURO STOXX 50 UCITS ETF (DE) 2000-12
Amundi Amundi ETF EURO STOXX 50 UCITS ETF 2008-09
La Caixa CaixaBank Bolsa Gestion Euro FI 1995-04
AXA AB FCP I Eurozone Equity Portfolio 1999-02
1673
1519
1427
1171
993
920
688
615
543
529
Sum 10078
FIGURE 27 - TOP 10 MASTER GROUPS BY SALES 2017 (eurom)
Master Groups NAT Funds Assets Net Sales
Amundi FR
BlackRock US
Deutsche AM DE
Allianz GI DE
Schroders GB
UBS CH
Invesco US
KutxaBank ES
NYL Candriam US
Sycomore FR
35
16
9
10
1
20
4
3
8
5
14031
26645
9638
5873
5523
9126
2427
1536
1033
1704
2635
2163
1811
1746
1427
1203
961
615
581
580
Sum 111 77535 13723
EUROPEAN FUND MARKET REVIEW
Equies Euroland
Page 1623
2018 EDITION
broadridgecom
Product Development
FIGURE 28 - FUND LAUNCHES amp CLOSURES
Jan 2017 Feb 2017 Mar 2017 Apr 2017 May 2017 Jun 2017 Jul 2017 Aug 2017 Sep 2017 Oct 2017 Nov 2017 Dec 2017
Fund Launches Fund Closures Fund Mergers
4545
148148
208208
8181
143143
213213
8484
135135
235235
6262
132132
160160
6363
136136
211211
5454
179179
272272
5353
197197
197197
3636
8787
111111
102102
126126
181181
4949
161161
196196
164164
147147
227227
7979
130130
167167
FIGURE 29 - TOP SELLING NEW FUND LAUNCHES IN 2017 (eurom)
Fund Name Fund Domicile Launch Date Net Sales
BlackRock ACS 5050 Global Equity Tracker United Kingdom 2017-06
BlackRock ACS UK Equity Tracker United Kingdom 2017-06
BlackRock ACS World ex UK Equity Tracker United Kingdom 2017-04
AXA Money Market France 2017-06
BlackRock ACS 3070 Global Equity Tracker United Kingdom 2017-07
BlackRock ACS 6040 Global Equity Tracker United Kingdom 2017-06
Royal London UK Real Estate United Kingdom 2017-10
Eurizon Top Selection Dicembre 2022 Italy 2017-09
Baillie Gifford Long Term Global Growth Investment United Kingdom 2017-04
UBS (Lux) Bond Sicav - USD Investment Grade Corporates (USD) Luxembourg 2017-01
9576
6061
5754
4010
3604
3205
3177
2664
2477
2466
EUROPEAN FUND MARKET REVIEW
Page 1723
2018 EDITION
broadridgecom
Product Development
FIGURE 30 - FUND LAUNCHES BY GROUP IN 2017 (eurom)
Master Group Funds Net Sales
BlackRock
Intesa SP
Amundi
AXA
UBS
BP Cooperativa
Cr Suisse
BNY Mellon
Royal London
KBC
43
117
90
33
37
14
33
43
5
56
35331
25107
10413
9873
8559
7765
7559
6161
5111
4743
Sum 471 120621
FIGURE 33 - NUMBER OF FUND LAUNCHES BY STRATEGY in 2017
Active ETF Index Tracking
21802180
117117
8181
FIGURE 32 - FUND LAUNCHES BY REGION IN 2017 (eurom)
Fund Region Funds Net Sales
Europe
International
1402
976
164293
70492
Sum 2378 234785
EUROPEAN FUND MARKET REVIEW
FIGURE 31 - NUMBER OF FUND LAUNCHES BY MAIN ASSET CLASS
2014 2015 2016 2017
Bond Equity Mixed Assets
611611
805805
557557596596
948948
681681
541541
737737
592592518518
709709
588588
Page 1823
FIG 35 (REST) TOP INT MAST GR BY ENS 17(eurom) - INCETF
Values
TOP 25
REST
TOTAL
349015
103863
452877
FIG 34 (REST) TOP MASTER GROUPS BY SALES IN H1 2017 (eurom) - EX ETFs
Values
TOP 25
REST
TOTAL
277554
93866
371420
broadridgecom
Note exclude money market funds and ETFs Note exclude money market funds
2018 EDITION
Cross-Border ProgressGroup Winners
FIG 34 - TOP CROSS-BORDER GROUPS BY SALES IN 2017 (eurom) - Ex ETFs
Master Groups NAT Funds Net Sales
PIMCO US
BlackRock US
GAM CH
PrudentialMampG GB
Invesco US
Amundi FR
AXA FR
Allianz GI DE
Goldman Sachs US
JPMorgan AM US
Natixis FR
Cr Suisse CH
MMCMercer US
Schroders GB
Deutsche AM DE
Vanguard US
Morgan Stanley US
Pictet CH
UBS CH
Old Mutual ZA
AQR Capital US
Aviva GB
Neuberger Berman US
Jupiter GB
Muzinich US
64
177
137
91
103
239
206
89
103
159
110
123
52
144
167
39
104
104
244
40
58994
18793
17363
16895
12786
12417
10966
10387
9354
8554
8507
8454
8226
8092
8067
7881
7322
6768
6435
5880
17
31
45
22
20
5818
5494
5306
4402
4393
FIG 35 - TOP CROSS-BORDER GROUPS BY SALES IN 17 (eurom) - INC ETFs
Master Groups NAT Funds Net Sales
PIMCO US
BlackRock US
Amundi FR
Deutsche AM DE
GAM CH
PrudentialMampG GB
UBS CH
Invesco US
Vanguard US
AXA FR
Allianz GI DE
Soc GenLyxor FR
Goldman Sachs US
Natixis FR
JPMorgan AM US
Cr Suisse CH
MMCMercer US
Schroders GB
Morgan Stanley US
Pictet CH
Old Mutual ZA
AQR Capital US
Aviva GB
Neuberger Berman US
State Street US
65
469
342
352
137
91
337
192
58
206
89
287
103
121
159
123
52
144
111
104
59019
49733
22125
18791
17363
16895
15547
13553
12131
10966
10387
9652
9354
8722
8554
8454
8226
8092
7366
6768
40
17
31
45
157
5880
5818
5494
5306
4819
EUROPEAN FUND MARKET REVIEW
Page 1923
broadridgecom
- Excludes money market funds amp ETFs
- Cross-border activity is actual sales asmeasured by the Broadridge SalesWatchConfidential Service
- The 66 members are estimated toaccount for 75-80 of the total cross-border sales activity
Cross-Border ProgressCross-Border Share of Sales in Europe
FIGURE 36 - NET SALES OF CROSS-BORDER GROUPS BY MARKET IN 2017 - ALL FUNDS (eurobn)
0 20 40 60 80
ItalySpain
SwitzerlandGermany
United KingdomFrance
BelgiumNetherlands
SwedenAustria
FIGURE 37 - NET SALES OF CROSS-BORDER GROUPS BY MARKET IN 2017 - EQUITY ONLY (eurobn)
0 3 5 8
ItalySpain
United KingdomSwitzerland
FranceBelgiumAustria
SwedenGermany
Netherlands
FIGURE 38 - NET SALES OF CROSS-BORDER GROUPS BY MARKET IN 2017 - BOND ONLY (eurobn)
0 10 20 30 40
ItalySwitzerland
SpainGermany
United KingdomFrance
NetherlandsSwedenAustria
Belgium
Note to data
Cross-Border Progress
2018 EDITIONEUROPEAN FUND MARKET REVIEW
Page 2023
FIGURE 39 - DOM GERMANY in 2017
Domestic Net Sales
Mixed Assets Conservative
Asset Allocation Alternative
Bank loanFloating rate
Equities Global Income
Mixed Assets Income
6254
4036
3378
2247
2035
FIGURE 39 - SW SECTOR GERMANY in 2017
Cross-Border Real Sales
Bank loanFloating rate
Asset Allocation Alternative
Mixed Assets Income
Bonds Global Currencies
Bonds Flexible
Confidential
Confidential
Confidential
Confidential
Confidential
FIGURE 39 - SW SECTOR ITALY 2017
Cross-Border Real Sales
Mixed Assets Income
Bonds Global Currencies
Asset Allocation
Bonds Emerging Markets
Bonds Flexible
Confidential
Confidential
Confidential
Confidential
Confidential
FIGURE 39 - DOM SWITZERLAND in 2017
Domestic Net Sales
Bonds Global Currencies
Bonds Global Corporates
Equities North America
Equities Real Estate
Bonds Emerging Markets
3828
2462
1219
1143
885
FIGURE 39 - SW SECTOR UK 2017
Cross-Border Real Sales
Bonds Global Currencies
Bonds Global Corporates
Bonds Emerging Markets - Local Currency
Equities Europe Ex UK
Bonds Emerging Markets
Confidential
Confidential
Confidential
Confidential
Confidential
Cross-Border Real Sales
Bonds Global Currencies
Equities Euroland
Asset Allocation Alternative
Bonds Emerging Markets
Asset Allocation
Confidential
Confidential
Confidential
Confidential
Confidential
Domestic Net Sales
Real Estate
Bonds EUR Short-Term
Asset Allocation
Equities France MidSmall Caps
Equities Euroland MidSmall Caps
3962
3576
2992
1611
1523
FIGURE 39 - SW SECTOR SWITZWELAND 2017
Cross-Border Real Sales
Bonds Global Currencies
Bonds USD Corp Inv Grade
Bonds Emerging Markets - Local Currency
Bonds Flexible
Bank loanFloating rate
Confidential
Confidential
Confidential
Confidential
Confidential
FIGURE 39 - DOM UNITED KINGDOM in 2017
Domestic Net Sales
Equities Global
Bonds Target Maturity
Equities Europe Ex UK
Asset Allocation Alternative
Asset Allocation
27349
4700
4359
3002
2445
FIGURE 36 - DOM ITALY
Domestic Net Sales
Bonds Global Currencies
Mixed Assets Target Maturity
Mixed Assets Conservative
Bonds Emerging Markets
Mixed Assets Balanced
8267
6408
3639
2541
2068
broadridgecom
FRANCE
FIGURE 39 - TOP 5 DOMESTIC AND CROSS-BORDERS SECTORS IN THE MAJOR MARKETS IN 2017 (eurom)
GERMANY
ITALY
SWITZERLAND
UNITED KINGDOM
Real Sales dataavailable to SalesWatchmembers only
Domesc vs Cross-Border Sectors
Note to data
Cross-Border Progress
Page 2123
broadridgecom
The following report is based on the unique fund analytics delivered throughBroadridge Global Market Intelligence (GMI) our leading global fundanalytics database The charts and tables in this report reflect only the tip ofthe iceberg in terms of the depth and breadth available from Broadridge GMIThe report offers a high-level overview of European fund flow activity in 2017
Global Market Intelligence (GMI) helps you make more strategic decisionsmore effectively allocate your companyrsquos resources and most importantly bemore responsive to your customersrsquo needs all through the combining thepower of the FundFile and SalesWatch datasets
Broadridge FundFile enables deep fund flows analysis of all keygeographical markets covering Asia Pacific Latin America the Middle Eastand Africa and North America and delivers a truly global fund flows solutionBy gradually building the international reach of its global sales data andmaintaining its high quality and ease of use over the past ten years FundFilehas become the unparalleled source of data and analysis with informationon more than 100000 funds
The cross-border dimension of the European funds industryndashtheldquointernationalrdquo fund marketndashcan truly be assessed only with BroadridgeSalesWatch a unique cooperative and confidential benchmarking servicethat allows leading fund groups to track their cross-border sales and assetsagainst their competitorsrsquo by country distribution channel institutional versusretail activity and both gross and net sales This service now counts 66 ofthe leading asset managers among its members (Some sample data takenfrom the tool can be seen on pages 20 and 21 of the current report)
1 All data is at December 2017 unless otherwise stated
2 lsquoInternationalrsquo fund market Broadridge defines an International fund as afund that sources less than 80 of its assets from any single country Somefund groups have domestic and international funds
3 lsquoDomesticrsquo fund market If a fund sources more than 80 of its assets from asingle country then the fund is allocated to that market regardless of itsdomicile
4 Funds of funds have been excluded from all charts and tables (to avoiddouble counting) unless otherwise stated Therefore a market total is the sumof all the investment categories excluding the three funds of funds categories(in-house ex-house and hedge)
5 The investment category lsquootherrsquo includes a variety of different productcategories For most markets especially Belgium Spain and France the figurecomprises guaranteed funds but there are also derivatives and other specialityfunds in the lsquootherrsquo category
6 Property funds are open-ended property funds only
7 Master group Analysis that aggregates the European mutual fund assetsunder the umbrella of their parent company name
8 ETFs are included in Broadridgersquos database on mutual funds but thisexcludes exchange-traded commodity products that are not mutual funds
9 References to foreign activity relate to actual sales as measured byBroadridgersquos SalesWatch confidential service The 65 SalesWatch membersare estimated to account for 75-80 of total cross-border sales activity
No part of this document may be distributed reproduced or posted without the express written permission of Broadridge Financial Solutions Inc copy2018 Broadridge FinancialSolutions Inc Broadridge and the Broadridge logo are registered trademarks of Broadridge Financial Solutions Inc
Footnotes About the Report
Page 2223
copy Copyright 2018 Broadridge Financial Solutions Inc
Page 2323
- Data Digest 2018
-

Values
Top 25
REST
TOTAL
152143
490092
642236
2018 EDITION
broadridgecom
Note Excludes money market funds
Pan-European Fund Leaders Sales
FIGURE 16 - TOP 25 FUNDS BY NET SALES IN 2017 (eurom)
Master Groups Fund Name Domicile Strategy Type Launch Date Net Sales
PIMCO PIMCO GIS Income Fund IE Active Bnd 2012-11
BlackRock BlackRock ACS 5050 Global Equity Tracker GB Passive Eq 2017-06
Deutsche AM Deutsche Floating Rate Notes LC LU Active Bnd 1991-07
BlackRock BlackRock ACS UK Equity Tracker GB Passive Eq 2017-06
PrudentialMampG MampG Optimal Income Fund GB Active Bnd 2006-11
Allianz GI Allianz Global Investors Fund - Allianz Income and Growth LU Active Mix 2011-06
BlackRock BlackRock ACS World ex UK Equity Tracker GB Passive Eq 2017-04
JPMorgan AM JPMorgan Investment Funds - Global Income Fund LU Active Mix 2008-12
Muzinich Muzinich Enhanced Yield Short-Term Fund IE Active Bnd 2003-11
VRUnion PrivatFonds Kontrolliert DE Active Mix 2010-07
Fr Templeton Templeton Emerging Markets Bond Fund (Lux) LU Active Bnd 1991-07
Invesco Invesco Perpetual Global Targeted Returns GB Active Mix 2013-09
Amundi First Eagle Amundi Income Builder Fund LU Active Mix 2014-09
Old Mutual Old Mutual Global Equity Absolute Return IE Active Eq 2014-05
AXA AB FCP I Global High Yield Portfolio LU Active Bnd 1997-09
BlackRock BlackRock Global Funds - Global Multi-Asset Income Fund LU Active Mix 2012-06
Invesco Invesco Pan European High Income Fund LU Active Mix 2006-03
PIMCO PIMCO GIS Global Investment Grade Credit IE Active Bnd 2003-07
BlackRock BlackRock ACS 3070 Global Equity Tracker GB Passive Eq 2017-07
Jupiter The Jupiter Global Fund - Jupiter Dynamic Bond LU Active Bnd 2012-05
PrudentialMampG MampG Dynamic Allocation GB Active Mix 2009-12
GAM GAM Star Credit Opportunities (EUR) IE Active Bnd 2011-07
Allianz GI Allianz Global Investors Fund - Allianz Floating Rate Notes Plus LU Active Bnd 2014-09
GAM GAM Multibond - Local Emerging Bond LU Active Bnd 2000-05
Amundi Amundi ETF Floating Rate USD Corporate UCITS ETF FR Passive Bnd 2015-04
42907
9576
6306
6061
5969
5811
5754
5694
4568
4533
4195
4050
4042
3855
3747
3703
3677
3649
3604
3553
3553
3397
3365
3343
3230
EUROPEAN FUND MARKET REVIEW
EUROPEAN FUND MARKET REVIEW
Page 1123
2018 EDITION
broadridgecom
Product ThemesExchange Traded Funds
FIGURE 17 - TOP 10 FUNDS BY SALES IN 2017 (eurom)
Master Groups Fund Name Launch Date Net Sales
Amundi Amundi ETF Floating Rate USD Corporate UCITS ETF 2015-04
UBS UBS ETFs plc - MSCI ACWI SF UCITS ETF 2015-08
BlackRock iShares Core MSCI World UCITS ETF 2009-09
iShares J P Morgan Emerging Markets Local Government Bond UCITS ETF 2011-06
iShares Core MSCI Emerging Markets IMI UCITS ETF 2014-05
Amundi Amundi ETF MSCI Emerging Markets UCITS ETF 2010-12
Deutsche Boumlrse Xetra-Gold 2007-12
BlackRock iShares Core SampP 500 UCITS ETF (USD) 2010-05
Soc GenLyxor Multi Units Luxembourg - Lyxor SampP 500 UCITS ETF 2010-03
Deutsche AM db x-trackers MSCI JAPAN INDEX UCITS ETF (DR) 2007-01
3230
3129
2916
2573
2468
2181
2086
1933
1805
1800
Sum 24121
FIGURE 18 - TOP 10 MASTER GROUPS BY SALES IN 2017 (eurom)
Master Groups NAT Funds Assets Net Sales
BlackRock US
Deutsche AM DE
UBS CH
Amundi FR
Soc GenLyxor FR
State Street US
Vanguard US
Deutsche Boumlrse DE
ETF Securities GB
Invesco US
307
190
116
104
233
99
19
1
15
90
297820
67695
41344
36397
62249
22493
29954
6084
2427
15678
30385
10731
9933
9581
8332
4322
4250
2086
1019
759
Sum 1174 582142 81399
EUROPEAN FUND MARKET REVIEW
Page 1223
2018 EDITION
broadridgecom
Product ThemesIndex Tracking Funds
FIGURE 19 - TOP 10 FUNDS BY SALES IN 2017 (eurom)
Master Groups Fund Name Launch Date Net Sales
BlackRock BlackRock ACS 5050 Global Equity Tracker 2017-06
BlackRock ACS UK Equity Tracker 2017-06
BlackRock ACS World ex UK Equity Tracker 2017-04
BlackRock ACS 3070 Global Equity Tracker 2017-07
BlackRock ACS 6040 Global Equity Tracker 2017-06
Vanguard Vanguard Investment Series Plc - Vanguard Global Bond Index Fund 2008-03
BlackRock iShares Corporate Bond Index 2010-06
iShares Over 15 Years Gilts Index 2017-03
Standard Aberdeen Aberdeen Global Corporate Bond Tracker 2017-08
BlackRock iShares Index Linked Gilt Index 2012-06
9576
6061
5754
3604
3205
2610
2214
1967
1710
1610
Sum 38310
FIGURE 20 - TOP 10 MASTER GROUPS BY SALES IN 2017 (eurom)
Master Groups NAT Funds Assets Net Sales
BlackRock US
Vanguard US
Amundi FR
Legal amp General GB
UBS CH
Northern Trust US
BNY Mellon US
Swisscanto CH
Standard Aberdeen GB
Cr Suisse CH
72
39
32
34
66
33
11
68
3
78
134527
95729
9792
31722
69711
19513
3776
30072
3754
62373
41043
11451
4031
3700
3384
3258
3255
2164
1643
1490
Sum 436 460967 75419
EUROPEAN FUND MARKET REVIEW
Page 1323
2018 EDITION
Note Excludes money market funds
broadridgecom
Product ThemesAcve vs Passive
FIGURE 22 - MARKET SHARE OF PASSIVE FUNDS BY ASSETS IN 2017
Dec 2017
Index Tracking ETF Active
88
77
8484
FIGURE 21 - MARKET SHARE OF PASSIVE FUNDS BY ASSETS IN 2003
Index Tracking ETF Active
3311
9696
EUROPEAN FUND MARKET REVIEW
FIGURE 23 - HISTORICAL NET SALES (eurobn)
2014 2015 2016 2017
Active ETF Index Tracking
310310
4040 4343
211211
64643737 4242 3838 3333
479479
8585 7878
Page 1423
2018 EDITION
broadridgecom
Product ThemesBonds Emerging Markets
FIGURE 24 - TOP 10 FUNDS BY SALES IN 2017 (eurom)
Master Groups Fund Name Launch Date Net Sales
Fr Templeton Templeton Emerging Markets Bond Fund (Lux) 1991-07
GAM GAM Multibond - Local Emerging Bond 2000-05
BlackRock BlackRock Global Funds - Emerging Markets Local Currency Bond Fund 2007-02
Intesa SP Epsilon Fund - Emerging Bond Total Return 2008-04
BlackRock iShares J P Morgan Emerging Markets Local Government Bond UCITS ETF 2011-06
Neuberger Berman Neuberger Berman Short Duration Emerging Market Debt Fund 2013-10
Goldman Sachs GS Emerging Markets Debt Portfolio 2000-05
Amundi Amundi Funds Bond Global Emerging Blended 2015-07
Ashmore Ashmore Sicav Emerging Markets Short Duration 2014-06
Amundi Pioneer Funds - Emerging Markets Bond 2000-06
4195
3343
2811
2639
2573
2013
1825
1762
1693
1498
Sum 24353
FIGURE 25 - TOP 10 MASTER GROUPS BY SALES IN 2017 (eurom)
Master Groups NAT Funds Assets Net Sales
BlackRock US
Amundi FR
Intesa SP IT
Fr Templeton US
Neuberger Berman US
Ashmore GB
GAM CH
Goldman Sachs US
NYL Candriam US
JPMorgan AM US
11
12
13
6
6
18
7
4
5
7
25334
12611
13588
8994
7208
12025
9515
10583
3788
8336
9652
5137
4945
4189
3991
3783
3658
2905
1586
1584
Sum 89 111983 41430
EUROPEAN FUND MARKET REVIEW
EUROPEAN FUND MARKET REVIEW
Page 1523
2018 EDITION
broadridgecom
Product Development
FIGURE 26 - TOP 10 FUNDS BY SALES IN 2017 (eurom)
Master Groups Fund Name Launch Date Net Sales
Allianz GI Allianz Global Investors Fund - Allianz Euroland Equity Growth 2006-10
BlackRock iShares Core EURO STOXX 50 UCITS ETF 2010-01
Schroders Schroder ISF-EURO Equity 1998-09
Deutsche AM db x-trackers MSCI EMU INDEX UCITS ETF (DR) 2012-11
UBS UBS ETF - MSCI EMU UCITS ETF 2002-09
Invesco Invesco Euro Equity Fund 2015-10
BlackRock iShares EURO STOXX 50 UCITS ETF (DE) 2000-12
Amundi Amundi ETF EURO STOXX 50 UCITS ETF 2008-09
La Caixa CaixaBank Bolsa Gestion Euro FI 1995-04
AXA AB FCP I Eurozone Equity Portfolio 1999-02
1673
1519
1427
1171
993
920
688
615
543
529
Sum 10078
FIGURE 27 - TOP 10 MASTER GROUPS BY SALES 2017 (eurom)
Master Groups NAT Funds Assets Net Sales
Amundi FR
BlackRock US
Deutsche AM DE
Allianz GI DE
Schroders GB
UBS CH
Invesco US
KutxaBank ES
NYL Candriam US
Sycomore FR
35
16
9
10
1
20
4
3
8
5
14031
26645
9638
5873
5523
9126
2427
1536
1033
1704
2635
2163
1811
1746
1427
1203
961
615
581
580
Sum 111 77535 13723
EUROPEAN FUND MARKET REVIEW
Equies Euroland
Page 1623
2018 EDITION
broadridgecom
Product Development
FIGURE 28 - FUND LAUNCHES amp CLOSURES
Jan 2017 Feb 2017 Mar 2017 Apr 2017 May 2017 Jun 2017 Jul 2017 Aug 2017 Sep 2017 Oct 2017 Nov 2017 Dec 2017
Fund Launches Fund Closures Fund Mergers
4545
148148
208208
8181
143143
213213
8484
135135
235235
6262
132132
160160
6363
136136
211211
5454
179179
272272
5353
197197
197197
3636
8787
111111
102102
126126
181181
4949
161161
196196
164164
147147
227227
7979
130130
167167
FIGURE 29 - TOP SELLING NEW FUND LAUNCHES IN 2017 (eurom)
Fund Name Fund Domicile Launch Date Net Sales
BlackRock ACS 5050 Global Equity Tracker United Kingdom 2017-06
BlackRock ACS UK Equity Tracker United Kingdom 2017-06
BlackRock ACS World ex UK Equity Tracker United Kingdom 2017-04
AXA Money Market France 2017-06
BlackRock ACS 3070 Global Equity Tracker United Kingdom 2017-07
BlackRock ACS 6040 Global Equity Tracker United Kingdom 2017-06
Royal London UK Real Estate United Kingdom 2017-10
Eurizon Top Selection Dicembre 2022 Italy 2017-09
Baillie Gifford Long Term Global Growth Investment United Kingdom 2017-04
UBS (Lux) Bond Sicav - USD Investment Grade Corporates (USD) Luxembourg 2017-01
9576
6061
5754
4010
3604
3205
3177
2664
2477
2466
EUROPEAN FUND MARKET REVIEW
Page 1723
2018 EDITION
broadridgecom
Product Development
FIGURE 30 - FUND LAUNCHES BY GROUP IN 2017 (eurom)
Master Group Funds Net Sales
BlackRock
Intesa SP
Amundi
AXA
UBS
BP Cooperativa
Cr Suisse
BNY Mellon
Royal London
KBC
43
117
90
33
37
14
33
43
5
56
35331
25107
10413
9873
8559
7765
7559
6161
5111
4743
Sum 471 120621
FIGURE 33 - NUMBER OF FUND LAUNCHES BY STRATEGY in 2017
Active ETF Index Tracking
21802180
117117
8181
FIGURE 32 - FUND LAUNCHES BY REGION IN 2017 (eurom)
Fund Region Funds Net Sales
Europe
International
1402
976
164293
70492
Sum 2378 234785
EUROPEAN FUND MARKET REVIEW
FIGURE 31 - NUMBER OF FUND LAUNCHES BY MAIN ASSET CLASS
2014 2015 2016 2017
Bond Equity Mixed Assets
611611
805805
557557596596
948948
681681
541541
737737
592592518518
709709
588588
Page 1823
FIG 35 (REST) TOP INT MAST GR BY ENS 17(eurom) - INCETF
Values
TOP 25
REST
TOTAL
349015
103863
452877
FIG 34 (REST) TOP MASTER GROUPS BY SALES IN H1 2017 (eurom) - EX ETFs
Values
TOP 25
REST
TOTAL
277554
93866
371420
broadridgecom
Note exclude money market funds and ETFs Note exclude money market funds
2018 EDITION
Cross-Border ProgressGroup Winners
FIG 34 - TOP CROSS-BORDER GROUPS BY SALES IN 2017 (eurom) - Ex ETFs
Master Groups NAT Funds Net Sales
PIMCO US
BlackRock US
GAM CH
PrudentialMampG GB
Invesco US
Amundi FR
AXA FR
Allianz GI DE
Goldman Sachs US
JPMorgan AM US
Natixis FR
Cr Suisse CH
MMCMercer US
Schroders GB
Deutsche AM DE
Vanguard US
Morgan Stanley US
Pictet CH
UBS CH
Old Mutual ZA
AQR Capital US
Aviva GB
Neuberger Berman US
Jupiter GB
Muzinich US
64
177
137
91
103
239
206
89
103
159
110
123
52
144
167
39
104
104
244
40
58994
18793
17363
16895
12786
12417
10966
10387
9354
8554
8507
8454
8226
8092
8067
7881
7322
6768
6435
5880
17
31
45
22
20
5818
5494
5306
4402
4393
FIG 35 - TOP CROSS-BORDER GROUPS BY SALES IN 17 (eurom) - INC ETFs
Master Groups NAT Funds Net Sales
PIMCO US
BlackRock US
Amundi FR
Deutsche AM DE
GAM CH
PrudentialMampG GB
UBS CH
Invesco US
Vanguard US
AXA FR
Allianz GI DE
Soc GenLyxor FR
Goldman Sachs US
Natixis FR
JPMorgan AM US
Cr Suisse CH
MMCMercer US
Schroders GB
Morgan Stanley US
Pictet CH
Old Mutual ZA
AQR Capital US
Aviva GB
Neuberger Berman US
State Street US
65
469
342
352
137
91
337
192
58
206
89
287
103
121
159
123
52
144
111
104
59019
49733
22125
18791
17363
16895
15547
13553
12131
10966
10387
9652
9354
8722
8554
8454
8226
8092
7366
6768
40
17
31
45
157
5880
5818
5494
5306
4819
EUROPEAN FUND MARKET REVIEW
Page 1923
broadridgecom
- Excludes money market funds amp ETFs
- Cross-border activity is actual sales asmeasured by the Broadridge SalesWatchConfidential Service
- The 66 members are estimated toaccount for 75-80 of the total cross-border sales activity
Cross-Border ProgressCross-Border Share of Sales in Europe
FIGURE 36 - NET SALES OF CROSS-BORDER GROUPS BY MARKET IN 2017 - ALL FUNDS (eurobn)
0 20 40 60 80
ItalySpain
SwitzerlandGermany
United KingdomFrance
BelgiumNetherlands
SwedenAustria
FIGURE 37 - NET SALES OF CROSS-BORDER GROUPS BY MARKET IN 2017 - EQUITY ONLY (eurobn)
0 3 5 8
ItalySpain
United KingdomSwitzerland
FranceBelgiumAustria
SwedenGermany
Netherlands
FIGURE 38 - NET SALES OF CROSS-BORDER GROUPS BY MARKET IN 2017 - BOND ONLY (eurobn)
0 10 20 30 40
ItalySwitzerland
SpainGermany
United KingdomFrance
NetherlandsSwedenAustria
Belgium
Note to data
Cross-Border Progress
2018 EDITIONEUROPEAN FUND MARKET REVIEW
Page 2023
FIGURE 39 - DOM GERMANY in 2017
Domestic Net Sales
Mixed Assets Conservative
Asset Allocation Alternative
Bank loanFloating rate
Equities Global Income
Mixed Assets Income
6254
4036
3378
2247
2035
FIGURE 39 - SW SECTOR GERMANY in 2017
Cross-Border Real Sales
Bank loanFloating rate
Asset Allocation Alternative
Mixed Assets Income
Bonds Global Currencies
Bonds Flexible
Confidential
Confidential
Confidential
Confidential
Confidential
FIGURE 39 - SW SECTOR ITALY 2017
Cross-Border Real Sales
Mixed Assets Income
Bonds Global Currencies
Asset Allocation
Bonds Emerging Markets
Bonds Flexible
Confidential
Confidential
Confidential
Confidential
Confidential
FIGURE 39 - DOM SWITZERLAND in 2017
Domestic Net Sales
Bonds Global Currencies
Bonds Global Corporates
Equities North America
Equities Real Estate
Bonds Emerging Markets
3828
2462
1219
1143
885
FIGURE 39 - SW SECTOR UK 2017
Cross-Border Real Sales
Bonds Global Currencies
Bonds Global Corporates
Bonds Emerging Markets - Local Currency
Equities Europe Ex UK
Bonds Emerging Markets
Confidential
Confidential
Confidential
Confidential
Confidential
Cross-Border Real Sales
Bonds Global Currencies
Equities Euroland
Asset Allocation Alternative
Bonds Emerging Markets
Asset Allocation
Confidential
Confidential
Confidential
Confidential
Confidential
Domestic Net Sales
Real Estate
Bonds EUR Short-Term
Asset Allocation
Equities France MidSmall Caps
Equities Euroland MidSmall Caps
3962
3576
2992
1611
1523
FIGURE 39 - SW SECTOR SWITZWELAND 2017
Cross-Border Real Sales
Bonds Global Currencies
Bonds USD Corp Inv Grade
Bonds Emerging Markets - Local Currency
Bonds Flexible
Bank loanFloating rate
Confidential
Confidential
Confidential
Confidential
Confidential
FIGURE 39 - DOM UNITED KINGDOM in 2017
Domestic Net Sales
Equities Global
Bonds Target Maturity
Equities Europe Ex UK
Asset Allocation Alternative
Asset Allocation
27349
4700
4359
3002
2445
FIGURE 36 - DOM ITALY
Domestic Net Sales
Bonds Global Currencies
Mixed Assets Target Maturity
Mixed Assets Conservative
Bonds Emerging Markets
Mixed Assets Balanced
8267
6408
3639
2541
2068
broadridgecom
FRANCE
FIGURE 39 - TOP 5 DOMESTIC AND CROSS-BORDERS SECTORS IN THE MAJOR MARKETS IN 2017 (eurom)
GERMANY
ITALY
SWITZERLAND
UNITED KINGDOM
Real Sales dataavailable to SalesWatchmembers only
Domesc vs Cross-Border Sectors
Note to data
Cross-Border Progress
Page 2123
broadridgecom
The following report is based on the unique fund analytics delivered throughBroadridge Global Market Intelligence (GMI) our leading global fundanalytics database The charts and tables in this report reflect only the tip ofthe iceberg in terms of the depth and breadth available from Broadridge GMIThe report offers a high-level overview of European fund flow activity in 2017
Global Market Intelligence (GMI) helps you make more strategic decisionsmore effectively allocate your companyrsquos resources and most importantly bemore responsive to your customersrsquo needs all through the combining thepower of the FundFile and SalesWatch datasets
Broadridge FundFile enables deep fund flows analysis of all keygeographical markets covering Asia Pacific Latin America the Middle Eastand Africa and North America and delivers a truly global fund flows solutionBy gradually building the international reach of its global sales data andmaintaining its high quality and ease of use over the past ten years FundFilehas become the unparalleled source of data and analysis with informationon more than 100000 funds
The cross-border dimension of the European funds industryndashtheldquointernationalrdquo fund marketndashcan truly be assessed only with BroadridgeSalesWatch a unique cooperative and confidential benchmarking servicethat allows leading fund groups to track their cross-border sales and assetsagainst their competitorsrsquo by country distribution channel institutional versusretail activity and both gross and net sales This service now counts 66 ofthe leading asset managers among its members (Some sample data takenfrom the tool can be seen on pages 20 and 21 of the current report)
1 All data is at December 2017 unless otherwise stated
2 lsquoInternationalrsquo fund market Broadridge defines an International fund as afund that sources less than 80 of its assets from any single country Somefund groups have domestic and international funds
3 lsquoDomesticrsquo fund market If a fund sources more than 80 of its assets from asingle country then the fund is allocated to that market regardless of itsdomicile
4 Funds of funds have been excluded from all charts and tables (to avoiddouble counting) unless otherwise stated Therefore a market total is the sumof all the investment categories excluding the three funds of funds categories(in-house ex-house and hedge)
5 The investment category lsquootherrsquo includes a variety of different productcategories For most markets especially Belgium Spain and France the figurecomprises guaranteed funds but there are also derivatives and other specialityfunds in the lsquootherrsquo category
6 Property funds are open-ended property funds only
7 Master group Analysis that aggregates the European mutual fund assetsunder the umbrella of their parent company name
8 ETFs are included in Broadridgersquos database on mutual funds but thisexcludes exchange-traded commodity products that are not mutual funds
9 References to foreign activity relate to actual sales as measured byBroadridgersquos SalesWatch confidential service The 65 SalesWatch membersare estimated to account for 75-80 of total cross-border sales activity
No part of this document may be distributed reproduced or posted without the express written permission of Broadridge Financial Solutions Inc copy2018 Broadridge FinancialSolutions Inc Broadridge and the Broadridge logo are registered trademarks of Broadridge Financial Solutions Inc
Footnotes About the Report
Page 2223
copy Copyright 2018 Broadridge Financial Solutions Inc
Page 2323
- Data Digest 2018
-

2018 EDITION
broadridgecom
Product ThemesIndex Tracking Funds
FIGURE 19 - TOP 10 FUNDS BY SALES IN 2017 (eurom)
Master Groups Fund Name Launch Date Net Sales
BlackRock BlackRock ACS 5050 Global Equity Tracker 2017-06
BlackRock ACS UK Equity Tracker 2017-06
BlackRock ACS World ex UK Equity Tracker 2017-04
BlackRock ACS 3070 Global Equity Tracker 2017-07
BlackRock ACS 6040 Global Equity Tracker 2017-06
Vanguard Vanguard Investment Series Plc - Vanguard Global Bond Index Fund 2008-03
BlackRock iShares Corporate Bond Index 2010-06
iShares Over 15 Years Gilts Index 2017-03
Standard Aberdeen Aberdeen Global Corporate Bond Tracker 2017-08
BlackRock iShares Index Linked Gilt Index 2012-06
9576
6061
5754
3604
3205
2610
2214
1967
1710
1610
Sum 38310
FIGURE 20 - TOP 10 MASTER GROUPS BY SALES IN 2017 (eurom)
Master Groups NAT Funds Assets Net Sales
BlackRock US
Vanguard US
Amundi FR
Legal amp General GB
UBS CH
Northern Trust US
BNY Mellon US
Swisscanto CH
Standard Aberdeen GB
Cr Suisse CH
72
39
32
34
66
33
11
68
3
78
134527
95729
9792
31722
69711
19513
3776
30072
3754
62373
41043
11451
4031
3700
3384
3258
3255
2164
1643
1490
Sum 436 460967 75419
EUROPEAN FUND MARKET REVIEW
Page 1323
2018 EDITION
Note Excludes money market funds
broadridgecom
Product ThemesAcve vs Passive
FIGURE 22 - MARKET SHARE OF PASSIVE FUNDS BY ASSETS IN 2017
Dec 2017
Index Tracking ETF Active
88
77
8484
FIGURE 21 - MARKET SHARE OF PASSIVE FUNDS BY ASSETS IN 2003
Index Tracking ETF Active
3311
9696
EUROPEAN FUND MARKET REVIEW
FIGURE 23 - HISTORICAL NET SALES (eurobn)
2014 2015 2016 2017
Active ETF Index Tracking
310310
4040 4343
211211
64643737 4242 3838 3333
479479
8585 7878
Page 1423
2018 EDITION
broadridgecom
Product ThemesBonds Emerging Markets
FIGURE 24 - TOP 10 FUNDS BY SALES IN 2017 (eurom)
Master Groups Fund Name Launch Date Net Sales
Fr Templeton Templeton Emerging Markets Bond Fund (Lux) 1991-07
GAM GAM Multibond - Local Emerging Bond 2000-05
BlackRock BlackRock Global Funds - Emerging Markets Local Currency Bond Fund 2007-02
Intesa SP Epsilon Fund - Emerging Bond Total Return 2008-04
BlackRock iShares J P Morgan Emerging Markets Local Government Bond UCITS ETF 2011-06
Neuberger Berman Neuberger Berman Short Duration Emerging Market Debt Fund 2013-10
Goldman Sachs GS Emerging Markets Debt Portfolio 2000-05
Amundi Amundi Funds Bond Global Emerging Blended 2015-07
Ashmore Ashmore Sicav Emerging Markets Short Duration 2014-06
Amundi Pioneer Funds - Emerging Markets Bond 2000-06
4195
3343
2811
2639
2573
2013
1825
1762
1693
1498
Sum 24353
FIGURE 25 - TOP 10 MASTER GROUPS BY SALES IN 2017 (eurom)
Master Groups NAT Funds Assets Net Sales
BlackRock US
Amundi FR
Intesa SP IT
Fr Templeton US
Neuberger Berman US
Ashmore GB
GAM CH
Goldman Sachs US
NYL Candriam US
JPMorgan AM US
11
12
13
6
6
18
7
4
5
7
25334
12611
13588
8994
7208
12025
9515
10583
3788
8336
9652
5137
4945
4189
3991
3783
3658
2905
1586
1584
Sum 89 111983 41430
EUROPEAN FUND MARKET REVIEW
EUROPEAN FUND MARKET REVIEW
Page 1523
2018 EDITION
broadridgecom
Product Development
FIGURE 26 - TOP 10 FUNDS BY SALES IN 2017 (eurom)
Master Groups Fund Name Launch Date Net Sales
Allianz GI Allianz Global Investors Fund - Allianz Euroland Equity Growth 2006-10
BlackRock iShares Core EURO STOXX 50 UCITS ETF 2010-01
Schroders Schroder ISF-EURO Equity 1998-09
Deutsche AM db x-trackers MSCI EMU INDEX UCITS ETF (DR) 2012-11
UBS UBS ETF - MSCI EMU UCITS ETF 2002-09
Invesco Invesco Euro Equity Fund 2015-10
BlackRock iShares EURO STOXX 50 UCITS ETF (DE) 2000-12
Amundi Amundi ETF EURO STOXX 50 UCITS ETF 2008-09
La Caixa CaixaBank Bolsa Gestion Euro FI 1995-04
AXA AB FCP I Eurozone Equity Portfolio 1999-02
1673
1519
1427
1171
993
920
688
615
543
529
Sum 10078
FIGURE 27 - TOP 10 MASTER GROUPS BY SALES 2017 (eurom)
Master Groups NAT Funds Assets Net Sales
Amundi FR
BlackRock US
Deutsche AM DE
Allianz GI DE
Schroders GB
UBS CH
Invesco US
KutxaBank ES
NYL Candriam US
Sycomore FR
35
16
9
10
1
20
4
3
8
5
14031
26645
9638
5873
5523
9126
2427
1536
1033
1704
2635
2163
1811
1746
1427
1203
961
615
581
580
Sum 111 77535 13723
EUROPEAN FUND MARKET REVIEW
Equies Euroland
Page 1623
2018 EDITION
broadridgecom
Product Development
FIGURE 28 - FUND LAUNCHES amp CLOSURES
Jan 2017 Feb 2017 Mar 2017 Apr 2017 May 2017 Jun 2017 Jul 2017 Aug 2017 Sep 2017 Oct 2017 Nov 2017 Dec 2017
Fund Launches Fund Closures Fund Mergers
4545
148148
208208
8181
143143
213213
8484
135135
235235
6262
132132
160160
6363
136136
211211
5454
179179
272272
5353
197197
197197
3636
8787
111111
102102
126126
181181
4949
161161
196196
164164
147147
227227
7979
130130
167167
FIGURE 29 - TOP SELLING NEW FUND LAUNCHES IN 2017 (eurom)
Fund Name Fund Domicile Launch Date Net Sales
BlackRock ACS 5050 Global Equity Tracker United Kingdom 2017-06
BlackRock ACS UK Equity Tracker United Kingdom 2017-06
BlackRock ACS World ex UK Equity Tracker United Kingdom 2017-04
AXA Money Market France 2017-06
BlackRock ACS 3070 Global Equity Tracker United Kingdom 2017-07
BlackRock ACS 6040 Global Equity Tracker United Kingdom 2017-06
Royal London UK Real Estate United Kingdom 2017-10
Eurizon Top Selection Dicembre 2022 Italy 2017-09
Baillie Gifford Long Term Global Growth Investment United Kingdom 2017-04
UBS (Lux) Bond Sicav - USD Investment Grade Corporates (USD) Luxembourg 2017-01
9576
6061
5754
4010
3604
3205
3177
2664
2477
2466
EUROPEAN FUND MARKET REVIEW
Page 1723
2018 EDITION
broadridgecom
Product Development
FIGURE 30 - FUND LAUNCHES BY GROUP IN 2017 (eurom)
Master Group Funds Net Sales
BlackRock
Intesa SP
Amundi
AXA
UBS
BP Cooperativa
Cr Suisse
BNY Mellon
Royal London
KBC
43
117
90
33
37
14
33
43
5
56
35331
25107
10413
9873
8559
7765
7559
6161
5111
4743
Sum 471 120621
FIGURE 33 - NUMBER OF FUND LAUNCHES BY STRATEGY in 2017
Active ETF Index Tracking
21802180
117117
8181
FIGURE 32 - FUND LAUNCHES BY REGION IN 2017 (eurom)
Fund Region Funds Net Sales
Europe
International
1402
976
164293
70492
Sum 2378 234785
EUROPEAN FUND MARKET REVIEW
FIGURE 31 - NUMBER OF FUND LAUNCHES BY MAIN ASSET CLASS
2014 2015 2016 2017
Bond Equity Mixed Assets
611611
805805
557557596596
948948
681681
541541
737737
592592518518
709709
588588
Page 1823
FIG 35 (REST) TOP INT MAST GR BY ENS 17(eurom) - INCETF
Values
TOP 25
REST
TOTAL
349015
103863
452877
FIG 34 (REST) TOP MASTER GROUPS BY SALES IN H1 2017 (eurom) - EX ETFs
Values
TOP 25
REST
TOTAL
277554
93866
371420
broadridgecom
Note exclude money market funds and ETFs Note exclude money market funds
2018 EDITION
Cross-Border ProgressGroup Winners
FIG 34 - TOP CROSS-BORDER GROUPS BY SALES IN 2017 (eurom) - Ex ETFs
Master Groups NAT Funds Net Sales
PIMCO US
BlackRock US
GAM CH
PrudentialMampG GB
Invesco US
Amundi FR
AXA FR
Allianz GI DE
Goldman Sachs US
JPMorgan AM US
Natixis FR
Cr Suisse CH
MMCMercer US
Schroders GB
Deutsche AM DE
Vanguard US
Morgan Stanley US
Pictet CH
UBS CH
Old Mutual ZA
AQR Capital US
Aviva GB
Neuberger Berman US
Jupiter GB
Muzinich US
64
177
137
91
103
239
206
89
103
159
110
123
52
144
167
39
104
104
244
40
58994
18793
17363
16895
12786
12417
10966
10387
9354
8554
8507
8454
8226
8092
8067
7881
7322
6768
6435
5880
17
31
45
22
20
5818
5494
5306
4402
4393
FIG 35 - TOP CROSS-BORDER GROUPS BY SALES IN 17 (eurom) - INC ETFs
Master Groups NAT Funds Net Sales
PIMCO US
BlackRock US
Amundi FR
Deutsche AM DE
GAM CH
PrudentialMampG GB
UBS CH
Invesco US
Vanguard US
AXA FR
Allianz GI DE
Soc GenLyxor FR
Goldman Sachs US
Natixis FR
JPMorgan AM US
Cr Suisse CH
MMCMercer US
Schroders GB
Morgan Stanley US
Pictet CH
Old Mutual ZA
AQR Capital US
Aviva GB
Neuberger Berman US
State Street US
65
469
342
352
137
91
337
192
58
206
89
287
103
121
159
123
52
144
111
104
59019
49733
22125
18791
17363
16895
15547
13553
12131
10966
10387
9652
9354
8722
8554
8454
8226
8092
7366
6768
40
17
31
45
157
5880
5818
5494
5306
4819
EUROPEAN FUND MARKET REVIEW
Page 1923
broadridgecom
- Excludes money market funds amp ETFs
- Cross-border activity is actual sales asmeasured by the Broadridge SalesWatchConfidential Service
- The 66 members are estimated toaccount for 75-80 of the total cross-border sales activity
Cross-Border ProgressCross-Border Share of Sales in Europe
FIGURE 36 - NET SALES OF CROSS-BORDER GROUPS BY MARKET IN 2017 - ALL FUNDS (eurobn)
0 20 40 60 80
ItalySpain
SwitzerlandGermany
United KingdomFrance
BelgiumNetherlands
SwedenAustria
FIGURE 37 - NET SALES OF CROSS-BORDER GROUPS BY MARKET IN 2017 - EQUITY ONLY (eurobn)
0 3 5 8
ItalySpain
United KingdomSwitzerland
FranceBelgiumAustria
SwedenGermany
Netherlands
FIGURE 38 - NET SALES OF CROSS-BORDER GROUPS BY MARKET IN 2017 - BOND ONLY (eurobn)
0 10 20 30 40
ItalySwitzerland
SpainGermany
United KingdomFrance
NetherlandsSwedenAustria
Belgium
Note to data
Cross-Border Progress
2018 EDITIONEUROPEAN FUND MARKET REVIEW
Page 2023
FIGURE 39 - DOM GERMANY in 2017
Domestic Net Sales
Mixed Assets Conservative
Asset Allocation Alternative
Bank loanFloating rate
Equities Global Income
Mixed Assets Income
6254
4036
3378
2247
2035
FIGURE 39 - SW SECTOR GERMANY in 2017
Cross-Border Real Sales
Bank loanFloating rate
Asset Allocation Alternative
Mixed Assets Income
Bonds Global Currencies
Bonds Flexible
Confidential
Confidential
Confidential
Confidential
Confidential
FIGURE 39 - SW SECTOR ITALY 2017
Cross-Border Real Sales
Mixed Assets Income
Bonds Global Currencies
Asset Allocation
Bonds Emerging Markets
Bonds Flexible
Confidential
Confidential
Confidential
Confidential
Confidential
FIGURE 39 - DOM SWITZERLAND in 2017
Domestic Net Sales
Bonds Global Currencies
Bonds Global Corporates
Equities North America
Equities Real Estate
Bonds Emerging Markets
3828
2462
1219
1143
885
FIGURE 39 - SW SECTOR UK 2017
Cross-Border Real Sales
Bonds Global Currencies
Bonds Global Corporates
Bonds Emerging Markets - Local Currency
Equities Europe Ex UK
Bonds Emerging Markets
Confidential
Confidential
Confidential
Confidential
Confidential
Cross-Border Real Sales
Bonds Global Currencies
Equities Euroland
Asset Allocation Alternative
Bonds Emerging Markets
Asset Allocation
Confidential
Confidential
Confidential
Confidential
Confidential
Domestic Net Sales
Real Estate
Bonds EUR Short-Term
Asset Allocation
Equities France MidSmall Caps
Equities Euroland MidSmall Caps
3962
3576
2992
1611
1523
FIGURE 39 - SW SECTOR SWITZWELAND 2017
Cross-Border Real Sales
Bonds Global Currencies
Bonds USD Corp Inv Grade
Bonds Emerging Markets - Local Currency
Bonds Flexible
Bank loanFloating rate
Confidential
Confidential
Confidential
Confidential
Confidential
FIGURE 39 - DOM UNITED KINGDOM in 2017
Domestic Net Sales
Equities Global
Bonds Target Maturity
Equities Europe Ex UK
Asset Allocation Alternative
Asset Allocation
27349
4700
4359
3002
2445
FIGURE 36 - DOM ITALY
Domestic Net Sales
Bonds Global Currencies
Mixed Assets Target Maturity
Mixed Assets Conservative
Bonds Emerging Markets
Mixed Assets Balanced
8267
6408
3639
2541
2068
broadridgecom
FRANCE
FIGURE 39 - TOP 5 DOMESTIC AND CROSS-BORDERS SECTORS IN THE MAJOR MARKETS IN 2017 (eurom)
GERMANY
ITALY
SWITZERLAND
UNITED KINGDOM
Real Sales dataavailable to SalesWatchmembers only
Domesc vs Cross-Border Sectors
Note to data
Cross-Border Progress
Page 2123
broadridgecom
The following report is based on the unique fund analytics delivered throughBroadridge Global Market Intelligence (GMI) our leading global fundanalytics database The charts and tables in this report reflect only the tip ofthe iceberg in terms of the depth and breadth available from Broadridge GMIThe report offers a high-level overview of European fund flow activity in 2017
Global Market Intelligence (GMI) helps you make more strategic decisionsmore effectively allocate your companyrsquos resources and most importantly bemore responsive to your customersrsquo needs all through the combining thepower of the FundFile and SalesWatch datasets
Broadridge FundFile enables deep fund flows analysis of all keygeographical markets covering Asia Pacific Latin America the Middle Eastand Africa and North America and delivers a truly global fund flows solutionBy gradually building the international reach of its global sales data andmaintaining its high quality and ease of use over the past ten years FundFilehas become the unparalleled source of data and analysis with informationon more than 100000 funds
The cross-border dimension of the European funds industryndashtheldquointernationalrdquo fund marketndashcan truly be assessed only with BroadridgeSalesWatch a unique cooperative and confidential benchmarking servicethat allows leading fund groups to track their cross-border sales and assetsagainst their competitorsrsquo by country distribution channel institutional versusretail activity and both gross and net sales This service now counts 66 ofthe leading asset managers among its members (Some sample data takenfrom the tool can be seen on pages 20 and 21 of the current report)
1 All data is at December 2017 unless otherwise stated
2 lsquoInternationalrsquo fund market Broadridge defines an International fund as afund that sources less than 80 of its assets from any single country Somefund groups have domestic and international funds
3 lsquoDomesticrsquo fund market If a fund sources more than 80 of its assets from asingle country then the fund is allocated to that market regardless of itsdomicile
4 Funds of funds have been excluded from all charts and tables (to avoiddouble counting) unless otherwise stated Therefore a market total is the sumof all the investment categories excluding the three funds of funds categories(in-house ex-house and hedge)
5 The investment category lsquootherrsquo includes a variety of different productcategories For most markets especially Belgium Spain and France the figurecomprises guaranteed funds but there are also derivatives and other specialityfunds in the lsquootherrsquo category
6 Property funds are open-ended property funds only
7 Master group Analysis that aggregates the European mutual fund assetsunder the umbrella of their parent company name
8 ETFs are included in Broadridgersquos database on mutual funds but thisexcludes exchange-traded commodity products that are not mutual funds
9 References to foreign activity relate to actual sales as measured byBroadridgersquos SalesWatch confidential service The 65 SalesWatch membersare estimated to account for 75-80 of total cross-border sales activity
No part of this document may be distributed reproduced or posted without the express written permission of Broadridge Financial Solutions Inc copy2018 Broadridge FinancialSolutions Inc Broadridge and the Broadridge logo are registered trademarks of Broadridge Financial Solutions Inc
Footnotes About the Report
Page 2223
copy Copyright 2018 Broadridge Financial Solutions Inc
Page 2323
- Data Digest 2018
-

2018 EDITION
broadridgecom
Product Development
FIGURE 30 - FUND LAUNCHES BY GROUP IN 2017 (eurom)
Master Group Funds Net Sales
BlackRock
Intesa SP
Amundi
AXA
UBS
BP Cooperativa
Cr Suisse
BNY Mellon
Royal London
KBC
43
117
90
33
37
14
33
43
5
56
35331
25107
10413
9873
8559
7765
7559
6161
5111
4743
Sum 471 120621
FIGURE 33 - NUMBER OF FUND LAUNCHES BY STRATEGY in 2017
Active ETF Index Tracking
21802180
117117
8181
FIGURE 32 - FUND LAUNCHES BY REGION IN 2017 (eurom)
Fund Region Funds Net Sales
Europe
International
1402
976
164293
70492
Sum 2378 234785
EUROPEAN FUND MARKET REVIEW
FIGURE 31 - NUMBER OF FUND LAUNCHES BY MAIN ASSET CLASS
2014 2015 2016 2017
Bond Equity Mixed Assets
611611
805805
557557596596
948948
681681
541541
737737
592592518518
709709
588588
Page 1823
FIG 35 (REST) TOP INT MAST GR BY ENS 17(eurom) - INCETF
Values
TOP 25
REST
TOTAL
349015
103863
452877
FIG 34 (REST) TOP MASTER GROUPS BY SALES IN H1 2017 (eurom) - EX ETFs
Values
TOP 25
REST
TOTAL
277554
93866
371420
broadridgecom
Note exclude money market funds and ETFs Note exclude money market funds
2018 EDITION
Cross-Border ProgressGroup Winners
FIG 34 - TOP CROSS-BORDER GROUPS BY SALES IN 2017 (eurom) - Ex ETFs
Master Groups NAT Funds Net Sales
PIMCO US
BlackRock US
GAM CH
PrudentialMampG GB
Invesco US
Amundi FR
AXA FR
Allianz GI DE
Goldman Sachs US
JPMorgan AM US
Natixis FR
Cr Suisse CH
MMCMercer US
Schroders GB
Deutsche AM DE
Vanguard US
Morgan Stanley US
Pictet CH
UBS CH
Old Mutual ZA
AQR Capital US
Aviva GB
Neuberger Berman US
Jupiter GB
Muzinich US
64
177
137
91
103
239
206
89
103
159
110
123
52
144
167
39
104
104
244
40
58994
18793
17363
16895
12786
12417
10966
10387
9354
8554
8507
8454
8226
8092
8067
7881
7322
6768
6435
5880
17
31
45
22
20
5818
5494
5306
4402
4393
FIG 35 - TOP CROSS-BORDER GROUPS BY SALES IN 17 (eurom) - INC ETFs
Master Groups NAT Funds Net Sales
PIMCO US
BlackRock US
Amundi FR
Deutsche AM DE
GAM CH
PrudentialMampG GB
UBS CH
Invesco US
Vanguard US
AXA FR
Allianz GI DE
Soc GenLyxor FR
Goldman Sachs US
Natixis FR
JPMorgan AM US
Cr Suisse CH
MMCMercer US
Schroders GB
Morgan Stanley US
Pictet CH
Old Mutual ZA
AQR Capital US
Aviva GB
Neuberger Berman US
State Street US
65
469
342
352
137
91
337
192
58
206
89
287
103
121
159
123
52
144
111
104
59019
49733
22125
18791
17363
16895
15547
13553
12131
10966
10387
9652
9354
8722
8554
8454
8226
8092
7366
6768
40
17
31
45
157
5880
5818
5494
5306
4819
EUROPEAN FUND MARKET REVIEW
Page 1923
broadridgecom
- Excludes money market funds amp ETFs
- Cross-border activity is actual sales asmeasured by the Broadridge SalesWatchConfidential Service
- The 66 members are estimated toaccount for 75-80 of the total cross-border sales activity
Cross-Border ProgressCross-Border Share of Sales in Europe
FIGURE 36 - NET SALES OF CROSS-BORDER GROUPS BY MARKET IN 2017 - ALL FUNDS (eurobn)
0 20 40 60 80
ItalySpain
SwitzerlandGermany
United KingdomFrance
BelgiumNetherlands
SwedenAustria
FIGURE 37 - NET SALES OF CROSS-BORDER GROUPS BY MARKET IN 2017 - EQUITY ONLY (eurobn)
0 3 5 8
ItalySpain
United KingdomSwitzerland
FranceBelgiumAustria
SwedenGermany
Netherlands
FIGURE 38 - NET SALES OF CROSS-BORDER GROUPS BY MARKET IN 2017 - BOND ONLY (eurobn)
0 10 20 30 40
ItalySwitzerland
SpainGermany
United KingdomFrance
NetherlandsSwedenAustria
Belgium
Note to data
Cross-Border Progress
2018 EDITIONEUROPEAN FUND MARKET REVIEW
Page 2023
FIGURE 39 - DOM GERMANY in 2017
Domestic Net Sales
Mixed Assets Conservative
Asset Allocation Alternative
Bank loanFloating rate
Equities Global Income
Mixed Assets Income
6254
4036
3378
2247
2035
FIGURE 39 - SW SECTOR GERMANY in 2017
Cross-Border Real Sales
Bank loanFloating rate
Asset Allocation Alternative
Mixed Assets Income
Bonds Global Currencies
Bonds Flexible
Confidential
Confidential
Confidential
Confidential
Confidential
FIGURE 39 - SW SECTOR ITALY 2017
Cross-Border Real Sales
Mixed Assets Income
Bonds Global Currencies
Asset Allocation
Bonds Emerging Markets
Bonds Flexible
Confidential
Confidential
Confidential
Confidential
Confidential
FIGURE 39 - DOM SWITZERLAND in 2017
Domestic Net Sales
Bonds Global Currencies
Bonds Global Corporates
Equities North America
Equities Real Estate
Bonds Emerging Markets
3828
2462
1219
1143
885
FIGURE 39 - SW SECTOR UK 2017
Cross-Border Real Sales
Bonds Global Currencies
Bonds Global Corporates
Bonds Emerging Markets - Local Currency
Equities Europe Ex UK
Bonds Emerging Markets
Confidential
Confidential
Confidential
Confidential
Confidential
Cross-Border Real Sales
Bonds Global Currencies
Equities Euroland
Asset Allocation Alternative
Bonds Emerging Markets
Asset Allocation
Confidential
Confidential
Confidential
Confidential
Confidential
Domestic Net Sales
Real Estate
Bonds EUR Short-Term
Asset Allocation
Equities France MidSmall Caps
Equities Euroland MidSmall Caps
3962
3576
2992
1611
1523
FIGURE 39 - SW SECTOR SWITZWELAND 2017
Cross-Border Real Sales
Bonds Global Currencies
Bonds USD Corp Inv Grade
Bonds Emerging Markets - Local Currency
Bonds Flexible
Bank loanFloating rate
Confidential
Confidential
Confidential
Confidential
Confidential
FIGURE 39 - DOM UNITED KINGDOM in 2017
Domestic Net Sales
Equities Global
Bonds Target Maturity
Equities Europe Ex UK
Asset Allocation Alternative
Asset Allocation
27349
4700
4359
3002
2445
FIGURE 36 - DOM ITALY
Domestic Net Sales
Bonds Global Currencies
Mixed Assets Target Maturity
Mixed Assets Conservative
Bonds Emerging Markets
Mixed Assets Balanced
8267
6408
3639
2541
2068
broadridgecom
FRANCE
FIGURE 39 - TOP 5 DOMESTIC AND CROSS-BORDERS SECTORS IN THE MAJOR MARKETS IN 2017 (eurom)
GERMANY
ITALY
SWITZERLAND
UNITED KINGDOM
Real Sales dataavailable to SalesWatchmembers only
Domesc vs Cross-Border Sectors
Note to data
Cross-Border Progress
Page 2123
broadridgecom
The following report is based on the unique fund analytics delivered throughBroadridge Global Market Intelligence (GMI) our leading global fundanalytics database The charts and tables in this report reflect only the tip ofthe iceberg in terms of the depth and breadth available from Broadridge GMIThe report offers a high-level overview of European fund flow activity in 2017
Global Market Intelligence (GMI) helps you make more strategic decisionsmore effectively allocate your companyrsquos resources and most importantly bemore responsive to your customersrsquo needs all through the combining thepower of the FundFile and SalesWatch datasets
Broadridge FundFile enables deep fund flows analysis of all keygeographical markets covering Asia Pacific Latin America the Middle Eastand Africa and North America and delivers a truly global fund flows solutionBy gradually building the international reach of its global sales data andmaintaining its high quality and ease of use over the past ten years FundFilehas become the unparalleled source of data and analysis with informationon more than 100000 funds
The cross-border dimension of the European funds industryndashtheldquointernationalrdquo fund marketndashcan truly be assessed only with BroadridgeSalesWatch a unique cooperative and confidential benchmarking servicethat allows leading fund groups to track their cross-border sales and assetsagainst their competitorsrsquo by country distribution channel institutional versusretail activity and both gross and net sales This service now counts 66 ofthe leading asset managers among its members (Some sample data takenfrom the tool can be seen on pages 20 and 21 of the current report)
1 All data is at December 2017 unless otherwise stated
2 lsquoInternationalrsquo fund market Broadridge defines an International fund as afund that sources less than 80 of its assets from any single country Somefund groups have domestic and international funds
3 lsquoDomesticrsquo fund market If a fund sources more than 80 of its assets from asingle country then the fund is allocated to that market regardless of itsdomicile
4 Funds of funds have been excluded from all charts and tables (to avoiddouble counting) unless otherwise stated Therefore a market total is the sumof all the investment categories excluding the three funds of funds categories(in-house ex-house and hedge)
5 The investment category lsquootherrsquo includes a variety of different productcategories For most markets especially Belgium Spain and France the figurecomprises guaranteed funds but there are also derivatives and other specialityfunds in the lsquootherrsquo category
6 Property funds are open-ended property funds only
7 Master group Analysis that aggregates the European mutual fund assetsunder the umbrella of their parent company name
8 ETFs are included in Broadridgersquos database on mutual funds but thisexcludes exchange-traded commodity products that are not mutual funds
9 References to foreign activity relate to actual sales as measured byBroadridgersquos SalesWatch confidential service The 65 SalesWatch membersare estimated to account for 75-80 of total cross-border sales activity
No part of this document may be distributed reproduced or posted without the express written permission of Broadridge Financial Solutions Inc copy2018 Broadridge FinancialSolutions Inc Broadridge and the Broadridge logo are registered trademarks of Broadridge Financial Solutions Inc
Footnotes About the Report
Page 2223
copy Copyright 2018 Broadridge Financial Solutions Inc
Page 2323
- Data Digest 2018
-
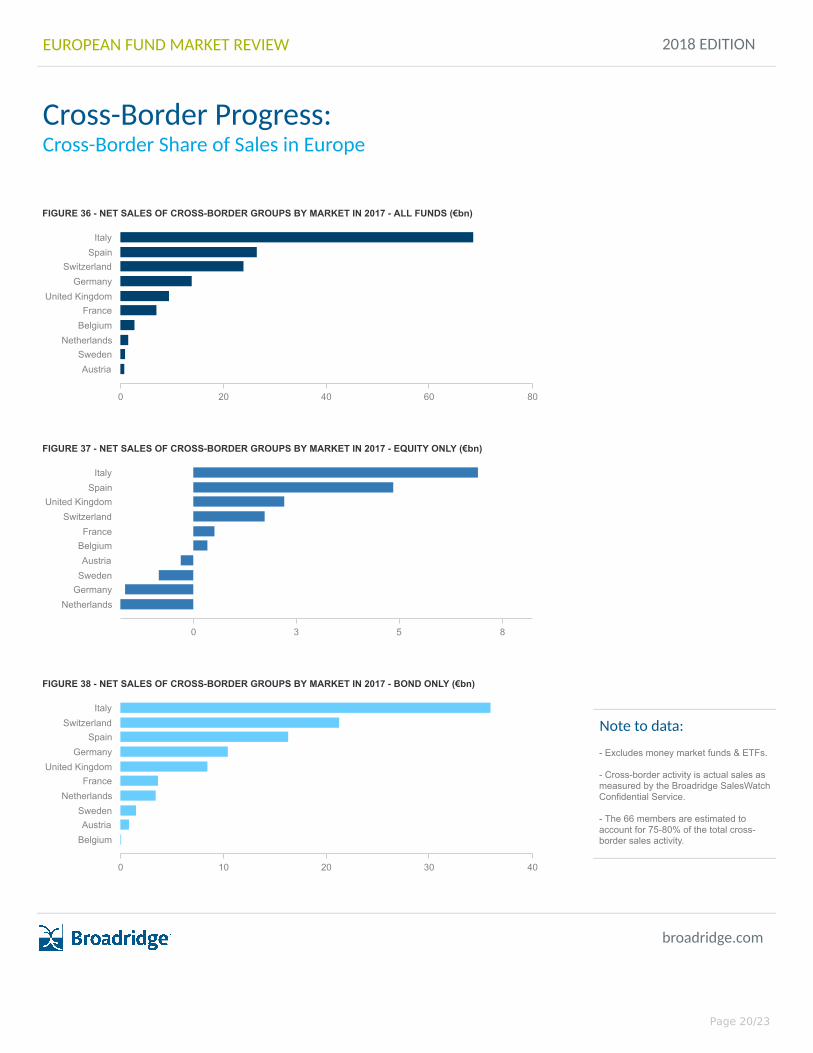
broadridgecom
- Excludes money market funds amp ETFs
- Cross-border activity is actual sales asmeasured by the Broadridge SalesWatchConfidential Service
- The 66 members are estimated toaccount for 75-80 of the total cross-border sales activity
Cross-Border ProgressCross-Border Share of Sales in Europe
FIGURE 36 - NET SALES OF CROSS-BORDER GROUPS BY MARKET IN 2017 - ALL FUNDS (eurobn)
0 20 40 60 80
ItalySpain
SwitzerlandGermany
United KingdomFrance
BelgiumNetherlands
SwedenAustria
FIGURE 37 - NET SALES OF CROSS-BORDER GROUPS BY MARKET IN 2017 - EQUITY ONLY (eurobn)
0 3 5 8
ItalySpain
United KingdomSwitzerland
FranceBelgiumAustria
SwedenGermany
Netherlands
FIGURE 38 - NET SALES OF CROSS-BORDER GROUPS BY MARKET IN 2017 - BOND ONLY (eurobn)
0 10 20 30 40
ItalySwitzerland
SpainGermany
United KingdomFrance
NetherlandsSwedenAustria
Belgium
Note to data
Cross-Border Progress
2018 EDITIONEUROPEAN FUND MARKET REVIEW
Page 2023
FIGURE 39 - DOM GERMANY in 2017
Domestic Net Sales
Mixed Assets Conservative
Asset Allocation Alternative
Bank loanFloating rate
Equities Global Income
Mixed Assets Income
6254
4036
3378
2247
2035
FIGURE 39 - SW SECTOR GERMANY in 2017
Cross-Border Real Sales
Bank loanFloating rate
Asset Allocation Alternative
Mixed Assets Income
Bonds Global Currencies
Bonds Flexible
Confidential
Confidential
Confidential
Confidential
Confidential
FIGURE 39 - SW SECTOR ITALY 2017
Cross-Border Real Sales
Mixed Assets Income
Bonds Global Currencies
Asset Allocation
Bonds Emerging Markets
Bonds Flexible
Confidential
Confidential
Confidential
Confidential
Confidential
FIGURE 39 - DOM SWITZERLAND in 2017
Domestic Net Sales
Bonds Global Currencies
Bonds Global Corporates
Equities North America
Equities Real Estate
Bonds Emerging Markets
3828
2462
1219
1143
885
FIGURE 39 - SW SECTOR UK 2017
Cross-Border Real Sales
Bonds Global Currencies
Bonds Global Corporates
Bonds Emerging Markets - Local Currency
Equities Europe Ex UK
Bonds Emerging Markets
Confidential
Confidential
Confidential
Confidential
Confidential
Cross-Border Real Sales
Bonds Global Currencies
Equities Euroland
Asset Allocation Alternative
Bonds Emerging Markets
Asset Allocation
Confidential
Confidential
Confidential
Confidential
Confidential
Domestic Net Sales
Real Estate
Bonds EUR Short-Term
Asset Allocation
Equities France MidSmall Caps
Equities Euroland MidSmall Caps
3962
3576
2992
1611
1523
FIGURE 39 - SW SECTOR SWITZWELAND 2017
Cross-Border Real Sales
Bonds Global Currencies
Bonds USD Corp Inv Grade
Bonds Emerging Markets - Local Currency
Bonds Flexible
Bank loanFloating rate
Confidential
Confidential
Confidential
Confidential
Confidential
FIGURE 39 - DOM UNITED KINGDOM in 2017
Domestic Net Sales
Equities Global
Bonds Target Maturity
Equities Europe Ex UK
Asset Allocation Alternative
Asset Allocation
27349
4700
4359
3002
2445
FIGURE 36 - DOM ITALY
Domestic Net Sales
Bonds Global Currencies
Mixed Assets Target Maturity
Mixed Assets Conservative
Bonds Emerging Markets
Mixed Assets Balanced
8267
6408
3639
2541
2068
broadridgecom
FRANCE
FIGURE 39 - TOP 5 DOMESTIC AND CROSS-BORDERS SECTORS IN THE MAJOR MARKETS IN 2017 (eurom)
GERMANY
ITALY
SWITZERLAND
UNITED KINGDOM
Real Sales dataavailable to SalesWatchmembers only
Domesc vs Cross-Border Sectors
Note to data
Cross-Border Progress
Page 2123
broadridgecom
The following report is based on the unique fund analytics delivered throughBroadridge Global Market Intelligence (GMI) our leading global fundanalytics database The charts and tables in this report reflect only the tip ofthe iceberg in terms of the depth and breadth available from Broadridge GMIThe report offers a high-level overview of European fund flow activity in 2017
Global Market Intelligence (GMI) helps you make more strategic decisionsmore effectively allocate your companyrsquos resources and most importantly bemore responsive to your customersrsquo needs all through the combining thepower of the FundFile and SalesWatch datasets
Broadridge FundFile enables deep fund flows analysis of all keygeographical markets covering Asia Pacific Latin America the Middle Eastand Africa and North America and delivers a truly global fund flows solutionBy gradually building the international reach of its global sales data andmaintaining its high quality and ease of use over the past ten years FundFilehas become the unparalleled source of data and analysis with informationon more than 100000 funds
The cross-border dimension of the European funds industryndashtheldquointernationalrdquo fund marketndashcan truly be assessed only with BroadridgeSalesWatch a unique cooperative and confidential benchmarking servicethat allows leading fund groups to track their cross-border sales and assetsagainst their competitorsrsquo by country distribution channel institutional versusretail activity and both gross and net sales This service now counts 66 ofthe leading asset managers among its members (Some sample data takenfrom the tool can be seen on pages 20 and 21 of the current report)
1 All data is at December 2017 unless otherwise stated
2 lsquoInternationalrsquo fund market Broadridge defines an International fund as afund that sources less than 80 of its assets from any single country Somefund groups have domestic and international funds
3 lsquoDomesticrsquo fund market If a fund sources more than 80 of its assets from asingle country then the fund is allocated to that market regardless of itsdomicile
4 Funds of funds have been excluded from all charts and tables (to avoiddouble counting) unless otherwise stated Therefore a market total is the sumof all the investment categories excluding the three funds of funds categories(in-house ex-house and hedge)
5 The investment category lsquootherrsquo includes a variety of different productcategories For most markets especially Belgium Spain and France the figurecomprises guaranteed funds but there are also derivatives and other specialityfunds in the lsquootherrsquo category
6 Property funds are open-ended property funds only
7 Master group Analysis that aggregates the European mutual fund assetsunder the umbrella of their parent company name
8 ETFs are included in Broadridgersquos database on mutual funds but thisexcludes exchange-traded commodity products that are not mutual funds
9 References to foreign activity relate to actual sales as measured byBroadridgersquos SalesWatch confidential service The 65 SalesWatch membersare estimated to account for 75-80 of total cross-border sales activity
No part of this document may be distributed reproduced or posted without the express written permission of Broadridge Financial Solutions Inc copy2018 Broadridge FinancialSolutions Inc Broadridge and the Broadridge logo are registered trademarks of Broadridge Financial Solutions Inc
Footnotes About the Report
Page 2223
copy Copyright 2018 Broadridge Financial Solutions Inc
Page 2323
- Data Digest 2018
-
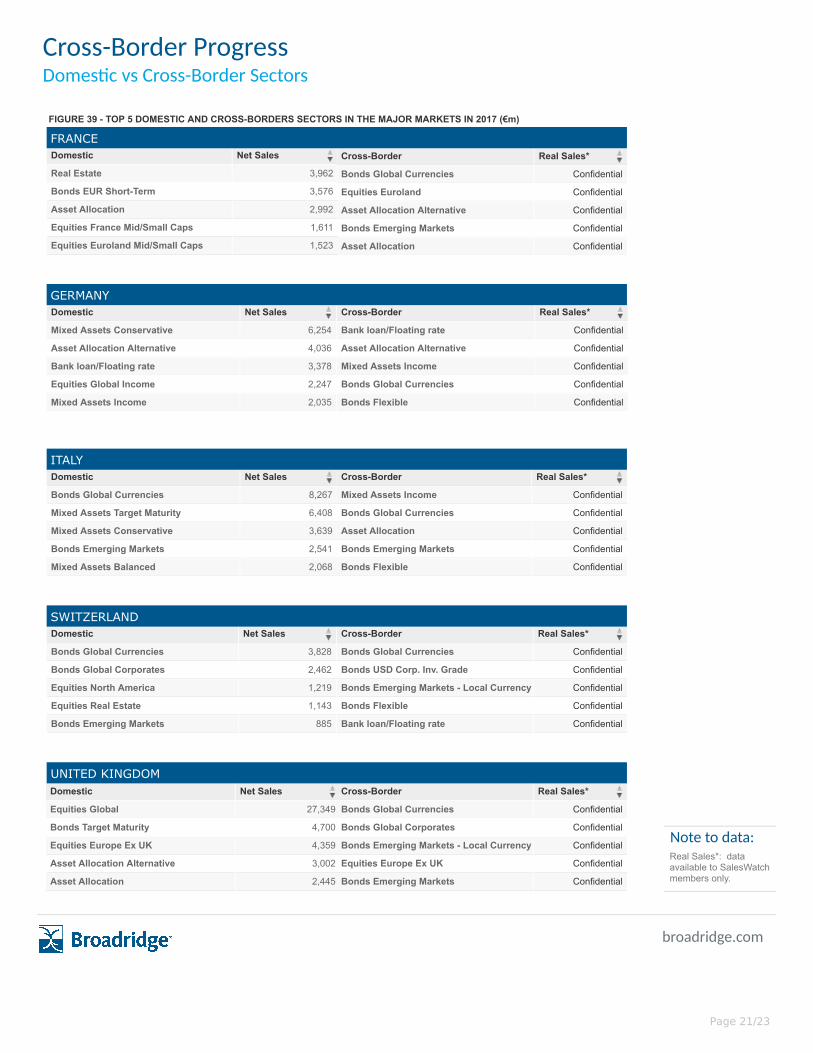

copy Copyright 2018 Broadridge Financial Solutions Inc
Page 2323
- Data Digest 2018
-