2018 real property ratio summary statistics report
TRANSCRIPT

1
2018 Real Property Ratio Summary Statistics Report

2
Direct questions and comments regarding this report to Department of Revenue, Research and Fiscal Analysis Division:
Mark Studer
(360) 534-1507 Email: [email protected]

3
Each year the Department of Revenue, Property Tax Division (DOR) gathers real property sales data from all 39 counties in the State of Washington. Sales, occurring from May 1, 2017, thru April 30, 2018, are determined to be either valid or invalid based on criteria set out in WAC 458-53-070 and WAC 458-53-080. The data from the valid sales is analyzed to determine the general level of assessment and the level of uniformity. Each county’s results are broken down by property type and shown in this report. Other than requiring assessment at 100 percent of market value, Washington has not established appraisal performance standards in state law or by administrative rule. However, the International Association of Assessing Officers (IAAO) suggests performance standards for both the level and uniformity of assessments. This report focuses on three recognized IAAO standards, and two additional statistical measures of vertical equity. The standards promulgated by the IAAO include median ratio, coefficient of dispersion (COD), and price related differential (PRD). Other metrics that measure vertical equity are quintile mean ratios (QMR) and vertical equity index (VEI). It should be noted this report includes all valid sales with no additional trimming of outliers. This report gives the results of each statistical analysis with no consideration given to the number of observations. For this report no binomial test or ‘bootstrap’ analysis was completed to determine the level of confidence in the results. In many cases, with the limited number of observations, it cannot be said with certainty that the standard was or was not met. The median ratio is a measure of the level of assessment. A ratio is calculated for each sale by dividing the assessed value by the sales price. The median ratio is the middle ratio, meaning that half the properties have a ratio greater than the median ratio and half have ratios less than the median ratio. The IAAO standard suggests the median ratio for the jurisdiction being reviewed should be between .90 and 1.10 which on a percentage basis is between 90 and 110 percent. COD is the most common measure of horizontal uniformity used in the assessment community. COD is referred to as a measure of horizontal uniformity because it measures uniformity across the data being reviewed without influences from the value of the properties. It measures, on average, how far each individual ratio is from the median ratio. A smaller COD indicates more uniform assessment. IAAO offers the following guidance for CODs by property types and or other neighborhood influences.

4
General Property Class Jurisdiction Size/Profile/Market Activity COD Range
Residential improved (single family dwelling , condominiums, manuf. Housing, 2-4 family units)
Very large jurisdictions/densely populated/newer properties/active markets 5.0 to 10.0 Large to mid-sized jurisdictions/older & newer properties/less active markets 5.0 to 15.0
Rural or small jurisdictions/older properties/depressed market areas 5.0 to 20.0
Income-producing properties (commercial, industrial, apartments)
Very large jurisdictions/densely populated/newer properties/active markets 5.0 to 15.0 Large to mid-sized jurisdictions/older & newer properties/less active markets 5.0 to 20.0
Rural or small jurisdictions/older properties/depressed market areas 5.0 to 25.0
Residential vacant land
Very large jurisdictions/rapid development/active markets 5.0 to 15.0
Large to mid-sized jurisdictions/slow development/less active markets 5.0 to 20.0
Rural or small jurisdictions/little development/depressed markets 5.0 to 25.0
Other (non-agriculture) vacant land
Very large jurisdictions/rapid development/active markets 5.0 to 20.0
Large to mid-sized jurisdictions/slow development/less active markets 5.0 to 25.0
Rural or small jurisdictions/little development/depressed markets 5.0 to 30.0
IAAO states that “CODs lower than five (5.0) may indicate sales chasing or non-representative samples.” The above chart and quote are from the April 2013 volume of IAAO Standards on Ratio Studies pages 33-37. Although the goal is to assess ‘all’ properties at 100 percent of market value, IAAO believes that due to the many factors of a real estate transaction, it is improbable that assessed values will be within the tight range of the sales price needed to achieve a COD of less than five. IAAO therefore, believes a COD of less than five could be a result of the selective reappraisal of sold properties. The PRD is a measure of the vertical uniformity of the assessment of properties at different price levels. PRD is a statistic used to measure whether high-value properties and low-value properties are assessed at the same ratio to market value. The PRD is calculated by dividing the mean ratio by the weighted mean ratio. A PRD of 1.00 indicates uniform assessment between high and low value properties. A PRD greater than 1.00 indicates that higher valued properties are assessed at a lower ratio to market than lower valued properties. A PRD of less than 1.00 indicates that lower valued properties are assessed at a lower ratio to market than higher valued properties. IAAO suggests the PRD should fall between .98 and 1.03. The sum of the sales price and a sum of the assessed value has been included in this report for informational purposes. The number of observations (number of sales) are shown in this report and should be considered when reviewing the statistical measure. The number of observations can help determine the reliability of the results, as the greater the number of observations the less influence a single outlier will have on the results. On the pages that follow are each county’s results for the above mentioned measures. First are the overall county wide results including all property types. This is followed by each county’s results broken down by four general property types, and then each county’s results broken down by single family residential (residential) and all other property types (non-residential).

5
Statistics by County
Frequency Adj Sale Price Assessed Ratio Weighted Mean Ratio
County N SUM SUM MEAN MEAN Median PRD COD Adams 167 $ 20,749,143 $ 17,135,200 85.56 82.58 83.64 1.04 19.13 Asotin 364 $ 73,703,938 $ 65,176,100 89.12 88.43 88.84 1.01 16.28 Benton 4,078 $ 1,161,985,701 $ 1,021,016,350 87.95 87.87 87.36 1.00 12.37 Chelan 1,977 $ 600,177,012 $ 529,252,343 89.32 88.18 89.57 1.01 14.52 Clallam 1,891 $ 514,194,436 $ 457,046,761 92.30 88.89 91.35 1.04 14.16 Clark 10,059 $ 3,816,275,984 $ 3,740,291,129 99.19 98.01 98.62 1.01 8.23 Columbia 84 $ 13,107,848 $ 12,907,310 99.60 98.47 99.84 1.01 5.93 Cowlitz 2,289 $ 558,003,601 $ 519,121,550 95.32 93.03 93.86 1.02 14.71 Douglas 889 $ 243,503,294 $ 228,652,100 94.94 93.90 94.04 1.01 9.74 Ferry 169 $ 18,786,938 $ 17,401,000 98.25 92.62 96.97 1.06 20.03 Franklin 1,261 $ 331,125,340 $ 310,464,000 93.83 93.76 93.75 1.00 9.56 Garfield 44 $ 5,253,366 $ 4,805,336 98.98 91.47 94.59 1.08 17.86 Grant 1,700 $ 327,541,234 $ 276,979,680 86.36 84.56 87.22 1.02 13.08 Grays Harbor 2,117 $ 369,407,489 $ 342,625,697 93.74 92.75 93.61 1.01 13.13 Island 2,415 $ 878,170,263 $ 829,303,618 96.41 94.44 96.93 1.02 9.44 Jefferson 1,114 $ 331,887,819 $ 310,502,457 94.09 93.56 95.05 1.01 8.14 King 6,796 $ 9,417,101,894 $ 8,584,054,718 94.79 91.15 94.83 1.04 12.52 Kitsap 6,108 $ 2,360,082,036 $ 2,145,199,633 92.14 90.90 92.50 1.01 10.87 Kittitas 1,559 $ 457,987,591 $ 391,728,630 86.34 85.53 87.05 1.01 15.10 Klickitat 475 $ 102,081,680 $ 93,774,060 92.28 91.86 93.36 1.00 7.62 Lewis 1,606 $ 329,035,358 $ 292,829,251 91.54 89.00 89.99 1.03 17.16 Lincoln 371 $ 48,698,817 $ 38,217,670 80.24 78.48 79.35 1.02 22.80 Mason 1,758 $ 377,779,187 $ 359,842,500 97.06 95.25 94.77 1.02 17.19 Okanogan 895 $ 158,052,540 $ 131,595,800 87.32 83.26 84.06 1.05 22.04 Pacific 823 $ 130,507,642 $ 119,986,000 94.86 91.94 93.83 1.03 15.40 Pend Oreille 441 $ 66,266,138 $ 59,238,007 93.10 89.39 92.20 1.04 18.05 Pierce 17,488 $ 6,406,811,484 $ 6,035,880,000 95.43 94.21 95.16 1.01 8.74 San Juan 608 $ 297,053,865 $ 268,835,920 91.15 90.50 92.55 1.01 13.16 Skagit 2,757 $ 954,899,080 $ 886,944,816 94.30 92.88 93.32 1.02 11.73 Skamania 255 $ 70,457,452 $ 61,964,700 91.60 87.95 89.60 1.04 15.12 Snohomish 16,666 $ 8,050,696,328 $ 7,563,280,400 95.52 93.95 95.39 1.02 8.32 Spokane 10,570 $ 2,754,860,694 $ 2,638,431,940 96.69 95.77 96.20 1.01 6.12 Stevens 805 $ 156,792,860 $ 139,488,852 91.25 88.96 92.03 1.03 10.99 Thurston 6,297 $ 1,991,251,517 $ 1,903,167,600 95.57 95.58 95.34 1.00 10.80 Wahkiakum 109 $ 18,253,250 $ 16,098,900 92.99 88.20 88.85 1.05 24.81 Walla Walla 1,005 $ 256,530,439 $ 237,056,970 93.59 92.41 96.00 1.01 8.05 Whatcom 5,332 $ 1,908,343,279 $ 1,652,470,311 87.10 86.59 86.58 1.01 12.61 Whitman 660 $ 164,796,737 $ 125,262,951 77.95 76.01 78.19 1.03 20.54 Yakima 2,881 $ 711,802,684 $ 637,669,800 90.37 89.59 89.72 1.01 13.93
Total 116,883 $46,454,015,958 $43,065,700,060 94.07 92.69 94.46

6
Statistics by County by Property Type
Frequency Adj. Sale Price Assessed Ratio Ratio
Property Type N SUM SUM MEAN Median PRD COD County = Adams AG/Other 17 $1,056,330 $826,400 68.11 76.43 0.87 23.76 Comm/Mfg 11 $1,436,490 $1,266,200 98.28 102.27 1.11 25.92 SFR 139 $18,256,323 $15,042,600 86.69 83.50 1.05 17.05 167 $20,749,143 $17,135,200 85.56 83.64 County = Asotin AG/Other 24 $2,622,560 $1,906,300 87.39 89.36 1.20 23.59 Comm/Mfg 11 $3,510,045 $3,215,100 91.14 95.42 1.00 16.25 MFR 15 $2,718,538 $2,556,500 96.98 88.53 1.03 19.07 SFR 314 $64,852,795 $57,498,200 88.80 88.21 1.00 15.55 364 $73,703,938 $65,176,100 89.12 88.84 County = Benton AG/Other 28 $9,922,333 $9,018,130 88.79 93.12 0.98 19.56 Comm/Mfg 89 $73,646,545 $60,309,470 85.93 84.54 1.05 20.98 MFR 65 $46,981,845 $45,450,070 91.88 90.75 0.95 15.18 SFR 3896 $1,031,434,978 $906,238,680 87.93 87.29 1.00 12.06 4078 $1,161,985,701 $1,021,016,350 87.95 87.36 County = Chelan AG/Other 48 $9,147,500 $7,138,857 89.21 87.86 1.14 24.30 Comm/Mfg 41 $25,773,680 $21,617,256 83.28 79.58 0.99 21.22 MFR 23 $6,309,468 $5,599,593 90.50 93.01 1.02 11.47 SFR 1865 $558,946,364 $494,896,637 89.44 89.58 1.01 14.17 1977 $600,177,012 $529,252,343 89.32 89.57 County = Clallam AG/Other 330 $31,230,733 $28,640,484 96.31 95.67 1.05 19.80 Comm/Mfg 65 $43,797,404 $28,992,906 85.27 92.32 1.29 22.82 MFR 33 $11,339,788 $10,135,115 91.62 93.92 1.03 11.43 SFR 1463 $427,826,511 $389,278,256 91.72 90.77 1.01 12.32 1891 $514,194,436 $457,046,761 92.30 91.35 County = Clark AG/Other 329 $116,318,308 $96,993,597 96.36 96.41 1.16 20.80 Comm/Mfg 87 $127,223,683 $105,828,575 89.23 88.85 1.07 18.88 MFR 133 $71,400,156 $64,584,241 91.78 90.69 1.01 10.94 SFR 9510 $3,501,333,837 $3,472,884,716 99.49 98.80 1.00 7.63 10059 $3,816,275,984 $3,740,291,129 99.19 98.62 SFR = single family residential
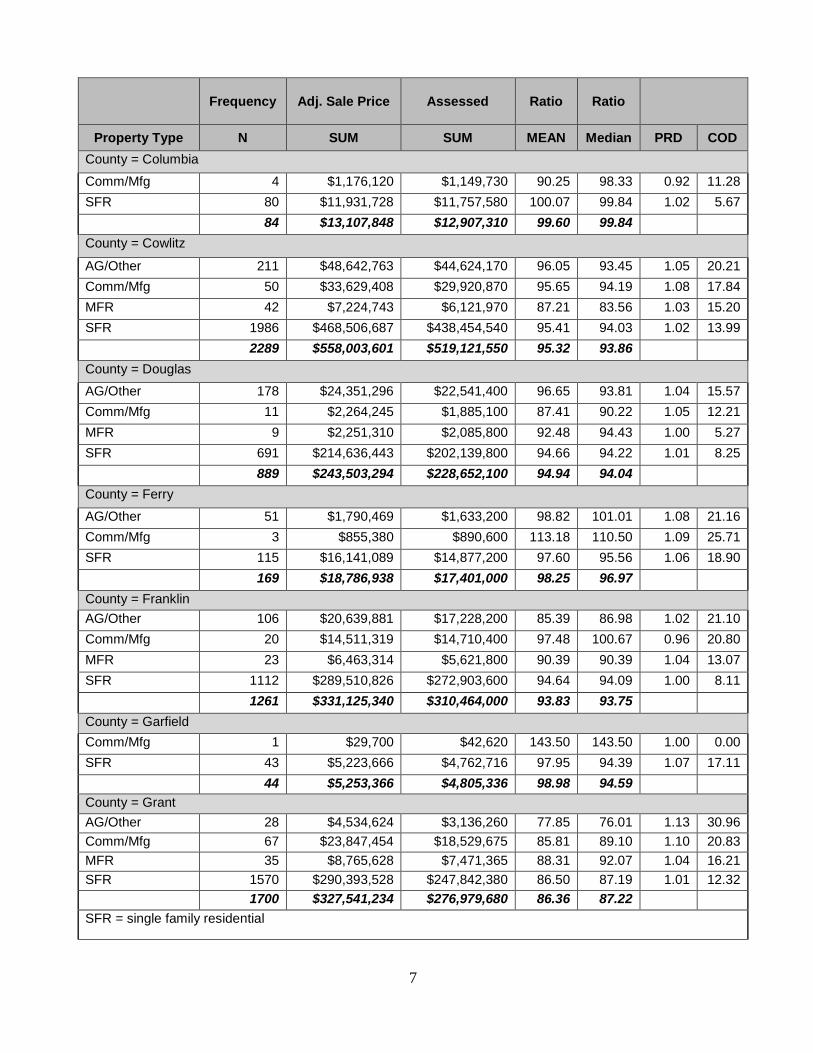
7
Frequency Adj. Sale Price Assessed Ratio Ratio
Property Type N SUM SUM MEAN Median PRD COD County = Columbia
Comm/Mfg 4 $1,176,120 $1,149,730 90.25 98.33 0.92 11.28 SFR 80 $11,931,728 $11,757,580 100.07 99.84 1.02 5.67 84 $13,107,848 $12,907,310 99.60 99.84 County = Cowlitz
AG/Other 211 $48,642,763 $44,624,170 96.05 93.45 1.05 20.21 Comm/Mfg 50 $33,629,408 $29,920,870 95.65 94.19 1.08 17.84 MFR 42 $7,224,743 $6,121,970 87.21 83.56 1.03 15.20 SFR 1986 $468,506,687 $438,454,540 95.41 94.03 1.02 13.99 2289 $558,003,601 $519,121,550 95.32 93.86 County = Douglas AG/Other 178 $24,351,296 $22,541,400 96.65 93.81 1.04 15.57 Comm/Mfg 11 $2,264,245 $1,885,100 87.41 90.22 1.05 12.21 MFR 9 $2,251,310 $2,085,800 92.48 94.43 1.00 5.27 SFR 691 $214,636,443 $202,139,800 94.66 94.22 1.01 8.25 889 $243,503,294 $228,652,100 94.94 94.04 County = Ferry
AG/Other 51 $1,790,469 $1,633,200 98.82 101.01 1.08 21.16 Comm/Mfg 3 $855,380 $890,600 113.18 110.50 1.09 25.71 SFR 115 $16,141,089 $14,877,200 97.60 95.56 1.06 18.90 169 $18,786,938 $17,401,000 98.25 96.97 County = Franklin AG/Other 106 $20,639,881 $17,228,200 85.39 86.98 1.02 21.10 Comm/Mfg 20 $14,511,319 $14,710,400 97.48 100.67 0.96 20.80 MFR 23 $6,463,314 $5,621,800 90.39 90.39 1.04 13.07 SFR 1112 $289,510,826 $272,903,600 94.64 94.09 1.00 8.11 1261 $331,125,340 $310,464,000 93.83 93.75 County = Garfield Comm/Mfg 1 $29,700 $42,620 143.50 143.50 1.00 0.00 SFR 43 $5,223,666 $4,762,716 97.95 94.39 1.07 17.11 44 $5,253,366 $4,805,336 98.98 94.59 County = Grant AG/Other 28 $4,534,624 $3,136,260 77.85 76.01 1.13 30.96 Comm/Mfg 67 $23,847,454 $18,529,675 85.81 89.10 1.10 20.83 MFR 35 $8,765,628 $7,471,365 88.31 92.07 1.04 16.21 SFR 1570 $290,393,528 $247,842,380 86.50 87.19 1.01 12.32 1700 $327,541,234 $276,979,680 86.36 87.22 SFR = single family residential

8
Frequency Adj. Sale Price Assessed Ratio Ratio
Property Type N SUM SUM MEAN Median PRD COD County = Grays Harbor Ag/Other 372 $19,686,947 $17,966,768 96.62 95.42 1.06 19.24 Comm/Mfg 71 $24,838,011 $23,281,287 96.57 97.14 1.03 22.16 Multi Family 58 $17,363,660 $16,297,122 99.15 99.60 1.06 13.28 SFR 1616 $307,518,871 $285,080,520 92.75 93.27 1.00 11.13
2117 $369,407,489 $342,625,697 93.74 93.61 County = Island Ag/Other 332 $41,745,707 $36,898,404 95.64 96.86 1.08 19.21 Comm/Mfg 31 $20,678,097 $20,144,857 101.02 98.71 1.04 10.99 Multi Family 31 $17,307,923 $14,527,474 93.57 95.77 1.11 8.26 SFR 2021 $798,438,536 $757,732,883 96.51 96.97 1.02 7.82
2415 $878,170,263 $829,303,618 96.41 96.93 County = Jefferson
Ag/Other 232 $22,489,106 $20,607,296 92.81 94.51 1.01 12.01 Comm/Mfg 28 $8,931,285 $8,564,391 94.88 95.13 0.99 10.42 Multi Family 3 $5,831,700 $5,352,773 95.71 96.51 1.04 3.22 SFR 851 $294,635,728 $275,977,997 94.41 95.17 1.01 7.04
1114 $331,887,819 $310,502,457 94.09 95.05 County = King
Ag/Other 753 $460,027,734 $406,001,900 96.88 96.92 1.10 22.78 Comm/Mfg 548 $2,569,845,608 $2,194,746,900 87.20 89.19 1.02 17.12 Multi Fam 3303 $4,063,766,347 $3,751,944,718 94.60 94.58 1.02 10.54 SFR 2192 $2,323,462,205 $2,231,361,200 96.25 95.51 1.00 10.68
6796 $9,417,101,894 $8,584,054,718 94.79 94.83 County = Kitsap
Ag/Other 409 $53,423,312 $44,218,570 92.32 91.36 1.12 21.53 Comm/Mfg 80 $90,502,318 $76,591,336 91.67 90.92 1.08 21.22 Multi Family 133 $46,213,547 $41,608,360 91.97 91.88 1.02 12.73 SFR 5486 $2,169,942,859 $1,982,781,367 92.13 92.58 1.01 9.90
6108 $2,360,082,036 $2,145,199,633 92.14 92.50 County = Kittitas
Ag/Other 392 $54,269,284 $43,647,930 84.25 84.14 1.05 19.90 Comm/Mfg 25 $18,363,312 $16,067,750 87.28 93.59 1.00 16.32 Multi Family 19 $7,581,915 $6,996,000 91.56 95.67 0.99 7.04 SFR 1123 $377,773,080 $325,016,950 86.95 87.77 1.01 13.46
1559 $457,987,591 $391,728,630 86.34 87.05 SFR = single family residential

9
Frequency Adj. Sale Price Assessed Ratio Ratio
Property Type N SUM SUM MEAN Median PRD COD County = Klickitat
AG/Other 143 $14,861,091 $13,267,060 91.89 93.40 1.03 9.54 Comm/Mfg 11 $3,305,511 $3,125,940 95.84 99.63 1.01 5.85 MFR 8 $2,194,626 $2,056,970 93.20 93.44 0.99 4.78 SFR 313 $81,720,452 $75,324,090 92.30 93.31 1.00 6.82 475 $102,081,680 $93,774,060 92.28 93.36 County = Lewis Ag/Other 211 $14,379,326 $13,217,000 96.25 95.73 1.05 21.77 Comm/Mfg 48 $19,267,186 $16,200,500 88.11 89.98 1.05 23.26 Multi Family 21 $9,611,218 $8,183,700 97.94 93.14 1.15 21.88 SFR 1326 $285,777,628 $255,228,051 90.82 89.34 1.02 15.87
1606 $329,035,358 $292,829,251 91.54 89.99 County = Lincoln Ag/Other 119 $17,186,715 $12,969,620 75.52 73.58 1.00 24.54 Comm/Mfg 10 $1,298,880 $987,510 75.84 73.09 1.00 35.13 Multi Family 3 $356,400 $230,850 67.57 60.38 1.04 12.35 SFR 239 $29,856,822 $24,029,690 82.93 81.69 1.03 21.08
371 $48,698,817 $38,217,670 80.24 79.35 County = Mason Ag/Other 324 $21,307,792 $20,896,415 102.37 101.09 1.04 22.87 Comm/Mfg 24 $8,979,300 $9,184,980 103.71 101.25 1.01 21.28 Multi Family 15 $2,936,211 $2,804,290 94.93 91.78 0.99 11.27 SFR 1395 $344,555,884 $326,956,815 95.74 93.58 1.01 15.47
1758 $377,779,187 $359,842,500 97.06 94.77 County = Okanogan Ag/Other 315 $29,753,150 $25,212,600 90.78 87.54 1.07 26.07 Comm/Mfg 23 $7,730,694 $6,639,000 85.77 82.61 1.00 22.99 Multi Family 11 $2,619,045 $2,484,100 91.82 90.52 0.97 17.45 SFR 546 $117,949,651 $97,260,100 85.30 82.66 1.03 19.27
895 $158,052,540 $131,595,800 87.32 84.06 County = Pacific Ag/Other 153 $7,633,379 $7,316,500 97.65 98.48 1.02 17.35 Comm/Mfg 23 $7,644,780 $6,741,900 93.00 98.21 1.05 15.49 Multi Family 13 $2,375,574 $2,046,600 92.66 93.51 1.08 13.81 SFR 634 $112,853,909 $103,881,000 94.30 92.93 1.02 14.69
823 $130,507,642 $119,986,000 94.86 93.83 SFR = single family residential

10
Frequency Adj. Sale Price Assessed Ratio Ratio
Property Type N SUM SUM MEAN Median PRD COD County = Pend Oreille Ag/Other 155 $15,122,070 $14,367,407 96.70 94.89 1.02 19.72 Comm/Mfg 13 $1,780,272 $1,778,168 104.13 87.88 1.04 28.99 Multi Family 2 $308,880 $270,483 86.87 86.87 0.99 10.41 SFR 271 $49,054,916 $42,821,949 90.56 90.56 1.04 16.51
441 $66,266,138 $59,238,007 93.10 92.20 County = Pierce Ag/Other 590 $97,255,268 $89,488,700 101.27 100.33 1.10 19.21 Comm/Mfg 280 $271,390,144 $230,824,700 90.43 91.23 1.06 18.35 Multi Family 432 $333,652,657 $284,728,500 92.83 92.90 1.09 10.68 SFR 16186 $5,704,513,415 $5,430,838,100 95.38 95.15 1.00 8.10
17488 $6,406,811,484 $6,035,880,000 95.43 95.16 County = San Juan Ag/Other 149 $31,936,860 $28,766,120 92.23 93.33 1.02 13.59 Comm/Mfg 14 $7,791,142 $6,235,470 82.24 82.28 1.03 13.99 Multi Family 1 $396,000 $399,350 100.85 100.85 1.00 0.00 SFR 444 $256,929,863 $233,434,980 91.05 92.53 1.00 12.91
608 $297,053,865 $268,835,920 91.15 92.55 County = Skagit Ag/Other 164 $26,677,174 $23,585,400 95.67 91.10 1.08 22.79 Comm/Mfg 155 $105,694,768 $95,081,300 94.60 95.64 1.05 13.30 Multi Fam 67 $28,442,800 $26,481,000 93.24 93.23 1.00 9.23 SFR 2371 $794,084,338 $741,797,116 94.22 93.33 1.01 10.93
2757 $954,899,080 $886,944,816 94.30 93.32 County = Skamania Ag/Other 56 $8,476,826 $7,588,900 96.73 96.18 1.08 20.64 Comm/Mfg 5 $1,028,727 $931,200 95.84 86.43 1.06 35.96 Multi Family 1 $197,010 $176,300 89.49 89.49 1.00 0.00 SFR 193 $60,754,889 $53,268,300 90.02 89.14 1.03 12.50
255 $70,457,452 $61,964,700 91.60 89.60 County = Snohomish Ag/Other 397 $189,524,174 $134,670,000 91.33 90.42 1.29 25.78 Comm/Mfg 228 $419,530,762 $381,610,400 93.92 95.92 1.03 12.84 Multi Family 278 $212,136,499 $196,381,900 94.00 94.30 1.02 10.00 SFR 15763 $7,229,504,958 $6,850,618,100 95.68 95.43 1.01 7.81
16666 $8,050,696,328 $7,563,280,400 95.52 95.39 SFR = single family residential

11
Frequency Adj. Sale Price Assessed Ratio Ratio
Property Type N SUM SUM MEAN Median PRD COD County = Spokane Ag/Other 559 $85,323,586 $80,345,410 94.55 94.96 1.00 10.43 Comm/Mfg 241 $187,284,779 $171,994,290 94.03 95.22 1.02 9.59 Multi Family 460 $198,822,527 $183,803,820 96.85 96.11 1.05 7.54 SFR 9310 $2,283,429,802 $2,202,288,420 96.88 96.28 1.00 5.70
10570 $2,754,860,694 $2,638,431,940 96.69 96.20 County = Stevens Ag/Other 129 $7,218,354 $6,821,485 95.52 94.75 1.01 14.65 Comm/Mfg 21 $9,363,549 $8,685,670 94.63 100.36 1.02 10.65 Multi Family 4 $900,900 $849,887 96.90 97.02 1.03 6.92 SFR 651 $139,310,057 $123,131,810 90.26 91.57 1.02 10.04
805 $156,792,860 $139,488,852 91.25 92.03 County = Thurston Ag/Other 203 $27,314,807 $24,873,800 99.76 96.31 1.10 22.86 Comm/Mfg 67 $60,884,738 $55,529,300 96.70 99.43 1.06 11.22 Multi Family 90 $52,641,817 $47,988,000 94.85 93.70 1.04 10.46 SFR 5937 $1,850,410,155 $1,774,776,500 95.42 95.29 0.99 10.37
6297 $1,991,251,517 $1,903,167,600 95.57 95.34 County = Wahkiakum Ag/Other 34 $3,084,741 $2,627,600 94.59 88.43 1.11 30.49 Comm/Mfg 3 $638,550 $433,700 70.72 70.58 1.04 11.43 Multi Family 1 $297,000 $289,100 97.34 97.34 1.00 0.00 SFR 71 $14,232,959 $12,748,500 93.10 88.99 1.04 22.53
109 $18,253,250 $16,098,900 92.99 88.85 County = Walla Walla Ag/Other 51 $7,137,719 $5,089,600 75.78 76.63 1.06 24.64 Comm/Mfg 16 $8,497,071 $6,387,570 89.59 92.40 1.19 25.39 Multi Family 35 $8,230,437 $7,699,120 94.76 96.22 1.01 8.78 SFR 903 $232,665,212 $217,880,680 94.62 96.27 1.01 6.61
1005 $256,530,439 $237,056,970 93.59 96.00 County = Whatcom Ag/Other 546 $84,340,551 $68,698,192 86.56 87.91 1.06 18.00 Comm/Mfg 214 $129,571,347 $108,719,932 86.73 87.46 1.03 11.77 Multi Family 125 $109,967,960 $90,197,649 85.09 84.48 1.04 11.23 SFR 4447 $1,584,463,421 $1,384,854,538 87.24 86.53 1.00 11.99
5332 $1,908,343,279 $1,652,470,311 87.100 86.58 SFR = single family residential

12
Frequency Adj. Sale Price Assessed Ratio Ratio
Property Type N SUM SUM MEAN Median PRD COD County = Whitman Ag/Other 9 $1,815,165 $973,932 67.18 61.19 1.25 40.67 Comm/Mfg 23 $14,525,743 $8,976,515 61.84 54.04 1.00 38.28 Multi Family 29 $14,997,702 $11,169,392 81.11 82.59 1.09 15.00 SFR 599 $133,458,127 $104,143,112 78.58 78.31 1.01 19.84
660 $164,796,737 $125,262,951 77.95 78.19 County = Yakima Ag/Other 251 $29,897,383 $25,803,500 81.20 80.03 0.94 26.45 Comm/Mfg 133 $104,880,254 $93,259,300 88.75 88.41 1.00 18.28 Multi Family 120 $36,893,259 $31,194,700 89.60 88.41 1.06 15.19 SFR 2377 $540,131,788 $487,412,300 91.47 90.27 1.01 12.39
2881 $711,802,684 $637,669,800 90.37 89.72 State Total 116883 $46,454,015,958 $43,065,700,060 94.07

13
Statistics by County by Residential and Non-Residential
Adj. Sale Price Assessed Weighted Ratio
Property Class Frequency (N) SUM SUM MEAN Median PRD COD
County = Adams Non-Residential 28 $2,492,820 $2,092,600 79.96 84.36 0.95 29.29 Residential 139 $18,256,323 $15,042,600 86.69 83.50 1.05 17.05
167 $20,749,143 $17,135,200 85.56
County = Asotin Non-Residential 50 $8,851,143 $7,677,900 91.09 90.69 1.05 21.05 Residential 314 $64,852,795 $57,498,200 88.80 88.21 1.00 15.55
364 $73,703,938 $65,176,100 89.12
County = Benton Non-Residential 50 $8,851,143 $7,677,900 91.09 90.69 1.05 21.05 Residential 314 $64,852,795 $57,498,200 88.80 88.21 1.00 15.55
364 $73,703,938 $65,176,100 89.12
County = Chelan Non-Residential 112 $41,230,648 $34,355,706 87.30 88.74 1.05 20.56 Residential 1865 $558,946,364 $494,896,637 89.44 89.58 1.01 14.17
1977 $600,177,012 $529,252,343 89.32
County = Clallam Non-Residential 428 $86,367,925 $67,768,505 94.27 94.63 1.20 19.73 Residential 1463 $427,826,511 $389,278,256 91.72 90.77 1.01 12.32
1891 $514,194,436 $457,046,761 92.30
County = Clark Non-Residential 549 $314,942,147 $267,406,413 94.12 93.16 1.11 18.58 Residential 9510 $3,501,333,837 $3,472,884,716 99.49 98.80 1.00 7.63
10059 $3,816,275,984 $3,740,291,129 99.19
County = Columbia Non-Residential 4 $1,176,120 $1,149,730 90.25 98.33 0.92 11.28 Residential 80 $11,931,728 $11,757,580 100.07 99.84 1.02 5.67
84 $13,107,848 $12,907,310 99.60
County = Cowlitz Non-Residential 303 $89,496,914 $80,667,010 94.76 91.92 1.05 19.55 Residential 1986 $468,506,687 $438,454,540 95.41 94.03 1.02 13.99
2289 $558,003,601 $519,121,550 95.32
County = Douglas Non-Residential 198 $28,866,851 $26,512,300 95.94 93.53 1.04 14.97 Residential 691 $214,636,443 $202,139,800 94.66 94.22 1.01 8.25
889 $243,503,294 $228,652,100 94.94

14
Adj. Sale Price Assessed Weighted Ratio
Property Class Frequency (N) SUM SUM MEAN Median PRD COD
County = Ferry Non-Residential 54 $2,645,849 $2,523,800 99.62 101.01 1.04 21.72 Residential 115 $16,141,089 $14,877,200 97.60 95.56 1.06 18.90
169 $18,786,938 $17,401,000 98.25
County = Franklin Non-Residential 149 $41,614,514 $37,560,400 87.78 88.89 0.97 20.51 Residential 1112 $289,510,826 $272,903,600 94.64 94.09 1.00 8.11
1261 $331,125,340 $310,464,000 93.83
County = Garfield Non-Residential 1 $29,700 $42,620 143.50 143.50 1.00 0.00 Residential 43 $5,223,666 $4,762,716 97.95 94.39 1.07 17.11
44 $5,253,366 $4,805,336 98.98
County = Grant Non-Residential 130 $37,147,706 $29,137,300 84.77 87.67 1.08 22.23 Residential 1570 $290,393,528 $247,842,380 86.50 87.19 1.01 12.32
1700 $327,541,234 $276,979,680 86.36
County = Grays Harbor Non-Residential 501 $61,888,618 $57,545,177 96.91 96.20 1.04 18.99 Residential 1616 $307,518,871 $285,080,520 92.75 93.27 1.00 11.13
2117 $369,407,489 $342,625,697 93.74
County = Island Non-Residential 394 $79,731,727 $71,570,735 95.90 96.83 1.07 17.73 Residential 2021 $798,438,536 $757,732,883 96.51 96.97 1.02 7.82
2415 $878,170,263 $829,303,618 96.41
County = Jefferson Non-Residential 263 $37,252,091 $34,524,460 93.06 94.54 1.00 11.76 Residential 851 $294,635,728 $275,977,997 94.41 95.17 1.01 7.04
1114 $331,887,819 $310,502,457 94.09
County = King Non-Residential 4604 $7,093,639,689 $6,352,693,518 94.09 94.39 1.05 13.41 Residential 2192 $2,323,462,205 $2,231,361,200 96.25 95.51 1.00 10.68
6796 $9,417,101,894 $8,584,054,718 94.79
County = Kitsap Non-Residential 622 $190,139,177 $162,418,266 92.16 91.54 1.08 19.57 Residential 5486 $2,169,942,859 $1,982,781,367 92.13 92.58 1.01 9.90
6108 $2,360,082,036 $2,145,199,633 92.14

15
Adj. Sale Price Assessed Weighted Ratio
Property Class Frequency (N) SUM SUM MEAN Median PRD COD
County = Kittitas Non-Residential 436 $80,214,511 $66,711,680 84.75 84.71 1.02 19.41 Residential 1123 $377,773,080 $325,016,950 86.95 87.77 1.01 13.46
1559 $457,987,591 $391,728,630 86.34
County = Klickitat Non-Residential 162 $20,361,228 $18,449,970 92.22 94.17 1.02 9.10 Residential 313 $81,720,452 $75,324,090 92.30 93.31 1.00 6.82
475 $102,081,680 $93,774,060 92.28
County = Lewis Non-Residential 280 $43,257,730 $37,601,200 94.98 95.23 1.09 21.92 Residential 1326 $285,777,628 $255,228,051 90.82 89.34 1.02 15.87
1606 $329,035,358 $292,829,251 91.54
County = Lincoln Non-Residential 132 $18,841,995 $14,187,980 75.36 73.35 1.00 25.21 Residential 239 $29,856,822 $24,029,690 82.93 81.69 1.03 21.08
371 $48,698,817 $38,217,670 80.24
County = Mason Non-Residential 363 $33,223,303 $32,885,685 102.15 100.69 1.03 22.40 Residential 1395 $344,555,884 $326,956,815 95.74 93.58 1.01 15.47
1758 $377,779,187 $359,842,500 97.06
County = Okanogan Non-Residential 349 $40,102,889 $34,335,700 90.48 86.58 1.06 25.88 Residential 546 $117,949,651 $97,260,100 85.30 82.66 1.03 19.27
895 $158,052,540 $131,595,800 87.32
County = Pacific Non-Residential 189 $17,653,733 $16,105,000 96.74 98.20 1.06 16.94 Residential 634 $112,853,909 $103,881,000 94.30 92.93 1.02 14.69
823 $130,507,642 $119,986,000 94.86
County = Pend Oreille Non-Residential 170 $17,211,222 $16,416,058 97.15 94.46 1.02 20.28 Residential 271 $49,054,916 $42,821,949 90.56 90.56 1.04 16.51
441 $66,266,138 $59,238,007 93.10
County = Pierce Non-Residential 1302 $702,298,069 $605,041,900 96.14 95.33 1.12 16.69 Residential 16186 $5,704,513,415 $5,430,838,100 95.38 95.15 1.00 8.10
17488 $6,406,811,484 $6,035,880,000 95.43

16
Adj. Sale Price Assessed Weighted Ratio
Property Class Frequency (N) SUM SUM MEAN Median PRD COD
County = San Juan Non-Residential 164 $40,124,002 $35,400,940 91.43 92.56 1.04 13.83 Residential 444 $256,929,863 $233,434,980 91.05 92.53 1.00 12.91
608 $297,053,865 $268,835,920 91.15
County = Skagit Non-Residential 386 $160,814,742 $145,147,700 94.82 93.22 1.05 16.68 Residential 2371 $794,084,338 $741,797,116 94.22 93.33 1.01 10.93
2757 $954,899,080 $886,944,816 94.30
County = Skamania Non-Residential 62 $9,702,563 $8,696,400 96.54 94.05 1.08 21.98 Residential 193 $60,754,889 $53,268,300 90.02 89.14 1.03 12.50
255 $70,457,452 $61,964,700 91.60
County = Snohomish Non-Residential 903 $821,191,370 $712,662,300 92.81 94.06 1.07 17.41 Residential 15763 $7,229,504,958 $6,850,618,100 95.68 95.43 1.01 7.81
16666 $8,050,696,328 $7,563,280,400 95.52
County = Spokane Non-Residential 1260 $471,430,892 $436,143,520 95.29 95.42 1.03 9.22 Residential 9310 $2,283,429,802 $2,202,288,420 96.88 96.28 1.00 5.70
10570 $2,754,860,694 $2,638,431,940 96.69
County = Stevens Non-Residential 154 $17,482,803 $16,357,042 95.44 95.89 1.02 14.00 Residential 651 $139,310,057 $123,131,810 90.26 91.57 1.02 10.04
805 $156,792,860 $139,488,852 91.25
County = Thurston Non-Residential 360 $140,841,362 $128,391,100 97.96 96.16 1.07 17.71 Residential 5937 $1,850,410,155 $1,774,776,500 95.42 95.29 0.99 10.37
6297 $1,991,251,517 $1,903,167,600 95.57
County = Wahkiakum Non-Residential 38 $4,020,291 $3,350,400 92.77 84.70 1.11 30.20 Residential 71 $14,232,959 $12,748,500 93.10 88.99 1.04 22.53
109 $18,253,250 $16,098,900 92.99
County = Walla Walla Non-Residential 102 $23,865,227 $19,176,290 84.46 88.30 1.05 20.96 Residential 903 $232,665,212 $217,880,680 94.62 96.27 1.01 6.61
1005 $256,530,439 $237,056,970 93.59

17
Adj. Sale Price Assessed Weighted Ratio
Property Class Frequency (N) SUM SUM MEAN Median PRD COD
County = Whatcom Non-Residential 885 $323,879,858 $267,615,773 86.39 86.97 1.05 15.69 Residential 4447 $1,584,463,421 $1,384,854,538 87.24 86.53 1.00 11.99
5332 $1,908,343,279 $1,652,470,311 87.10
County = Whitman Non-Residential 61 $31,338,610 $21,119,839 71.79 72.27 1.07 28.78 Residential 599 $133,458,127 $104,143,112 78.58 78.31 1.01 19.84
660 $164,796,737 $125,262,951 77.95 County = Yakima Non-Residential 504 $171,670,896 $150,257,500 85.19 85.41 0.97 21.44 Residential 2377 $540,131,788 $487,412,300 91.47 90.27 1.01 12.39
2881 $711,802,684 $637,669,800 90.37
Total 116883 $46,454,015,958 $43,065,700,060
Like the PRD; QMR and VEI are means of looking at vertical uniformity. QMR is calculated by first arraying the data in order (lowest to highest) by market value. Then the data is divided into five equal groups (quintiles). Then, an average ratio is calculated for each quintile. Looking at the ratio for each quintile, you can visually see if there is a difference in the ratio of each value range. The closer these quintile ratios are, the better the vertical equity. VEI is a method of scoring the QMR results. Noted assessment expert, J. Wayne Moore proposed computing a VEI using quintile ratios as Dr. Moore believes “VEI may be more sensitive to differences in vertical equity than the PRD.” The VEI is calculated by subtracting the lowest quintile ratio from the highest quintile ratio. Then, the results are divided by the average of all five quintile ratios and the results are multiplied by 100.
((Maximum Quintile Ratio – Minimum Quintile Ratio) / Avg. Quintile Ratio)*100 As a guideline, VEI values above 14.0 indicate vertical inequity; values between 14.0 and 7.0 indicate acceptable vertical equity; values below 7.0 indicate good vertical equity, with those below 3.5 indicating excellent vertical equity1. The following tables show the QMR and VEI for residential (single family dwelling) and non-residential (all other types) properties in each county.
1 Property Tax Equity Implications of Assessment Capping and Homestead Exemptions for Owner-Occupied Single-Family Housing. Journal of Property tax Assessment & Administration, Volume 5, Issue 3

18
QMR and VEI for Residential and Non-Residential by County
2018 Real Property Quintile Ratio and VEI
County=Adams Property Class=Residential
County=Adams Property Class=Non-Residential
Quintile Mean Quintile Mean Quintile_1 102.34 Quintile_1 55.88 Quintile_2 93.41 Quintile_2 89.04 Quintile_3 83.65 Quintile_3 77.47 Quintile_4 77.71 Quintile_4 86.76 Quintile_5 76.76 Quintile_5 87.99 VEI (Vertical Equity Index) 29.48 VEI (Vertical Equity Index) 41.75
County=Asotin Property Class=Residential
County=Asotin Property Class=Non-Residential
Quintile Mean Quintile Mean Quintile_1 95.24 Quintile_1 95.22 Quintile_2 80.57 Quintile_2 97.94 Quintile_3 88.09 Quintile_3 88.05 Quintile_4 87.92 Quintile_4 82.10 Quintile_5 92.22 Quintile_5 93.27 VEI (Vertical Equity Index) 16.52 VEI (Vertical Equity Index) 17.35
County=Benton Property Class=Residential
County=Benton Property Class=Non-Residential
Quintile Mean Quintile Mean Quintile_1 90.26 Quintile_1 95.75 Quintile_2 84.88 Quintile_2 89.93 Quintile_3 85.14 Quintile_3 86.67 Quintile_4 89.72 Quintile_4 82.59 Quintile_5 89.64 Quintile_5 87.56 VEI (Vertical Equity Index) 6.12 VEI (Vertical Equity Index) 14.87

19
2018 Real Property Quintile Ratio and VEI
County=Chelan Property Class=Residential
County=Chelan Property Class=Non-Residential
Quintile Mean Quintile Mean Quintile_1 96.86 Quintile_1 92.65 Quintile_2 86.98 Quintile_2 92.06 Quintile_3 86.83 Quintile_3 90.28 Quintile_4 88.02 Quintile_4 79.93 Quintile_5 88.51 Quintile_5 81.25 VEI (Vertical Equity Index) 11.21 VEI (Vertical Equity Index) 14.58
County=Clallam Property Class=Residential
County=Clallam Property Class=Non-Residential
Quintile Mean Quintile Mean Quintile_1 95.81 Quintile_1 110.28 Quintile_2 89.52 Quintile_2 95.67 Quintile_3 90.77 Quintile_3 92.13 Quintile_4 92.13 Quintile_4 86.87 Quintile_5 90.39 Quintile_5 86.38 VEI (Vertical Equity Index) 6.86 VEI (Vertical Equity Index) 25.35
County=Clark Property Class=Residential
County=Clark Property Class=Non-Residential
Quintile Mean Quintile Mean Quintile_1 101.49 Quintile_1 110.93 Quintile_2 98.72 Quintile_2 95.86 Quintile_3 98.42 Quintile_3 91.84 Quintile_4 99.17 Quintile_4 89.38 Quintile_5 99.63 Quintile_5 82.77 VEI (Vertical Equity Index) 3.09 VEI (Vertical Equity Index) 29.91
County=Columbia Property Class=Residential
County=Columbia Property Class=Non-
Residential
Quintile Mean Quintile Mean Quintile_1 106.77 Quintile_1 Quintile_2 99.71 Quintile_2 95.56 Quintile_3 97.73 Quintile_3 62.75 Quintile_4 98.87 Quintile_4 101.57 Quintile_5 97.27 Quintile_5 101.11 VEI (Vertical Equity Index) 9.49 VEI (Vertical Equity Index) 43.02

20
2018 Real Property Quintile Ratio and VEI
County=Cowlitz Property Class=Residential
County=Cowlitz Property Class=Non-Residential
Quintile Mean Quintile Mean Quintile_1 107.71 Quintile_1 107.61 Quintile_2 92.73 Quintile_2 93.99 Quintile_3 90.54 Quintile_3 92.48 Quintile_4 93.59 Quintile_4 87.60 Quintile_5 92.71 Quintile_5 92.33 VEI (Vertical Equity Index) 17.99 VEI (Vertical Equity Index) 21.11
County=Douglas Property Class=Residential
County=Douglas Property Class=Non-
Residential
Quintile Mean Quintile Mean Quintile_1 95.06 Quintile_1 100.05 Quintile_2 95.65 Quintile_2 102.67 Quintile_3 94.08 Quintile_3 93.12 Quintile_4 94.22 Quintile_4 92.17 Quintile_5 94.30 Quintile_5 91.46 VEI (Vertical Equity Index) 1.66 VEI (Vertical Equity Index) 11.69
County=Ferry Property Class=Residential
County=Ferry Property Class=Non-Residential
Quintile Mean Quintile Mean Quintile_1 116.29 Quintile_1 102.44 Quintile_2 98.14 Quintile_2 109.64 Quintile_3 95.47 Quintile_3 99.09 Quintile_4 92.38 Quintile_4 95.20 Quintile_5 85.74 Quintile_5 90.36 VEI (Vertical Equity Index) 31.30 VEI (Vertical Equity Index) 19.41
County=Franklin Property Class=Residential
County=Franklin Property Class=Non-
Residential
Quintile Mean Quintile Mean Quintile_1 94.84 Quintile_1 95.19 Quintile_2 93.21 Quintile_2 82.30 Quintile_3 97.57 Quintile_3 85.40 Quintile_4 95.32 Quintile_4 90.30 Quintile_5 92.26 Quintile_5 85.44 VEI (Vertical Equity Index) 5.61 VEI (Vertical Equity Index) 14.69

21
2018 Real Property Quintile Ratio and VEI
County=Garfield Property Class=Residential
County=Garfield Property Class=Non-Residential
Quintile Mean Quintile Mean Quintile_1 121.85 Quintile_1 Quintile_2 96.31 Quintile_2 Quintile_3 89.02 Quintile_3 143.50 Quintile_4 97.84 Quintile_4 Quintile_5 85.14 Quintile_5 VEI (Vertical Equity Index) 37.45 VEI (Vertical Equity Index) 0.00
County=Grant Property Class=Residential
County=Grant Property Class=Non-Residential
Quintile Mean Quintile Mean Quintile_1 89.51 Quintile_1 92.72 Quintile_2 84.34 Quintile_2 77.19 Quintile_3 86.15 Quintile_3 84.46 Quintile_4 88.15 Quintile_4 87.84 Quintile_5 84.30 Quintile_5 82.23 VEI (Vertical Equity Index) 6.02 VEI (Vertical Equity Index) 18.29
County=Grays Harbor Property Class=Residential
County=Grays Harbor Property Class=Non-
Residential
Quintile Mean Quintile Mean Quintile_1 95.08 Quintile_1 107.48 Quintile_2 91.61 Quintile_2 91.60 Quintile_3 91.34 Quintile_3 95.45 Quintile_4 92.85 Quintile_4 96.52 Quintile_5 92.90 Quintile_5 93.77 VEI (Vertical Equity Index) 4.03 VEI (Vertical Equity Index) 16.38
County=Island Property Class=Residential
County=Island Property Class=Non-Residential
Quintile Mean Quintile Mean Quintile_1 101.55 Quintile_1 100.09 Quintile_2 97.68 Quintile_2 103.28 Quintile_3 95.62 Quintile_3 96.73 Quintile_4 95.19 Quintile_4 89.08 Quintile_5 92.43 Quintile_5 90.20 VEI (Vertical Equity Index) 9.45 VEI (Vertical Equity Index) 14.81

22
2018 Real Property Quintile Ratio and VEI
County=Jefferson Property Class=Residential
County=Jefferson Property Class=Non-
Residential
Quintile Mean Quintile Mean Quintile_1 96.62 Quintile_1 95.73 Quintile_2 93.69 Quintile_2 94.22 Quintile_3 94.37 Quintile_3 90.11 Quintile_4 94.97 Quintile_4 91.67 Quintile_5 92.48 Quintile_5 93.45 VEI (Vertical Equity Index) 4.38 VEI (Vertical Equity Index) 6.04
County=King Property Class=Residential
County=King Property Class=Non-Residential
Quintile Mean Quintile Mean Quintile_1 97.29 Quintile_1 99.64 Quintile_2 94.90 Quintile_2 95.23 Quintile_3 100.12 Quintile_3 95.18 Quintile_4 94.14 Quintile_4 93.99 Quintile_5 94.81 Quintile_5 86.41 VEI (Vertical Equity Index) 6.21 VEI (Vertical Equity Index) 14.06
County=Kitsap Property Class=Residential
County=Kitsap Property Class=Non-Residential
Quintile Mean Quintile Mean Quintile_1 92.17 Quintile_1 108.92 Quintile_2 91.08 Quintile_2 93.28 Quintile_3 92.34 Quintile_3 85.67 Quintile_4 93.65 Quintile_4 88.17 Quintile_5 91.40 Quintile_5 84.27 VEI (Vertical Equity Index) 2.79 VEI (Vertical Equity Index) 26.78
County=Kittitas Property Class=Residential
County=Kittitas Property Class=Non-Residential
Quintile Mean Quintile Mean Quintile_1 91.32 Quintile_1 92.80 Quintile_2 87.35 Quintile_2 85.65 Quintile_3 86.76 Quintile_3 80.28 Quintile_4 84.34 Quintile_4 83.43 Quintile_5 85.05 Quintile_5 81.53 VEI (Vertical Equity Index) 8.03 VEI (Vertical Equity Index) 14.77

23
2018 Real Property Quintile Ratio and VEI
County=Klickitat Property Class=Residential
County=Klickitat Property Class=Non-Residential
Quintile Mean Quintile Mean Quintile_1 95.05 Quintile_1 96.04 Quintile_2 91.58 Quintile_2 94.79 Quintile_3 89.35 Quintile_3 90.54 Quintile_4 91.99 Quintile_4 90.82 Quintile_5 93.51 Quintile_5 88.92 VEI (Vertical Equity Index) 6.18 VEI (Vertical Equity Index) 7.72
County=Lewis Property Class=Residential
County=Lewis Property Class=Non-Residential
Quintile Mean Quintile Mean Quintile_1 99.96 Quintile_1 100.93 Quintile_2 88.08 Quintile_2 103.94 Quintile_3 88.72 Quintile_3 92.62 Quintile_4 88.91 Quintile_4 94.38 Quintile_5 88.48 Quintile_5 82.85 VEI (Vertical Equity Index) 13.08 VEI (Vertical Equity Index) 22.21
County=Lincoln Property Class=Residential
County=Lincoln Property Class=Non-Residential
Quintile Mean Quintile Mean Quintile_1 91.33 Quintile_1 81.86 Quintile_2 82.69 Quintile_2 66.84 Quintile_3 84.73 Quintile_3 76.54 Quintile_4 76.24 Quintile_4 76.59 Quintile_5 79.31 Quintile_5 75.26 VEI (Vertical Equity Index) 18.21 VEI (Vertical Equity Index) 19.92
County=Mason Property Class=Residential
County=Mason Property Class=Non-Residential
Quintile Mean Quintile Mean Quintile_1 102.92 Quintile_1 112.95 Quintile_2 90.67 Quintile_2 109.89 Quintile_3 93.32 Quintile_3 100.61 Quintile_4 94.95 Quintile_4 88.49 Quintile_5 96.9 Quintile_5 98.83 VEI (Vertical Equity Index) 12.79 VEI (Vertical Equity Index) 23.94

24
2018 Real Property Quintile Ratio and VEI
County=Okanogan Property Class=Residential
County=Okanogan Property Class=Non-Residential
Quintile Mean Quintile Mean Quintile_1 97.21 Quintile_1 105.47 Quintile_2 83.23 Quintile_2 93.96 Quintile_3 80.00 Quintile_3 86.48 Quintile_4 83.72 Quintile_4 86.62 Quintile_5 82.45 Quintile_5 80.82 VEI (Vertical Equity Index) 20.17 VEI (Vertical Equity Index) 27.19
County=Pacific Property Class=Residential
County=Pacific Property Class=Non-Residential
Quintile Mean Quintile Mean Quintile_1 102.95 Quintile_1 103.18 Quintile_2 95.97 Quintile_2 97.00 Quintile_3 89.82 Quintile_3 95.13 Quintile_4 90.29 Quintile_4 97.00 Quintile_5 92.55 Quintile_5 91.39 VEI (Vertical Equity Index) 13.92 VEI (Vertical Equity Index) 12.19
County=Pend Oreille Property Class=Residential
County=Pend Oreille Property Class=Non-
Residential
Quintile Mean Quintile Mean Quintile_1 98.92 Quintile_1 105.62 Quintile_2 94.46 Quintile_2 98.92 Quintile_3 88.26 Quintile_3 94.93 Quintile_4 86.68 Quintile_4 95.28 Quintile_5 84.43 Quintile_5 91.12 VEI (Vertical Equity Index) 16.00 VEI (Vertical Equity Index) 14.92
County=Pierce Property Class=Residential
County=Pierce Property Class=Non-Residential
Quintile Mean Quintile Mean Quintile_1 95.21 Quintile_1 109.88 Quintile_2 95.21 Quintile_2 97.57 Quintile_3 95.60 Quintile_3 94.12 Quintile_4 95.47 Quintile_4 93.00 Quintile_5 95.38 Quintile_5 86.14 VEI (Vertical Equity Index) 0.41 VEI (Vertical Equity Index) 24.69

25
2018 Real Property Quintile Ratio and VEI
County=San Juan Property Class=Residential
County=San Juan Property Class=Non-
Residential
Quintile Mean Quintile Mean Quintile_1 90.16 Quintile_1 99.47 Quintile_2 89.20 Quintile_2 94.52 Quintile_3 90.42 Quintile_3 92.75 Quintile_4 92.93 Quintile_4 87.88 Quintile_5 92.57 Quintile_5 82.62 VEI (Vertical Equity Index) 4.10 VEI (Vertical Equity Index) 18.43
County=Skagit Property Class=Residential
County=Skagit Property Class=Non-Residential
Quintile Mean Quintile Mean Quintile_1 99.28 Quintile_1 104.38 Quintile_2 91.94 Quintile_2 96.90 Quintile_3 92.35 Quintile_3 91.05 Quintile_4 93.32 Quintile_4 92.18 Quintile_5 94.21 Quintile_5 89.58 VEI (Vertical Equity Index) 7.79 VEI (Vertical Equity Index) 15.61
County=Skamania Property Class=Residential
County=Skamania Property Class=Non-
Residential
Quintile Mean Quintile Mean Quintile_1 102.49 Quintile_1 101.43 Quintile_2 86.59 Quintile_2 104.57 Quintile_3 89.97 Quintile_3 113.21 Quintile_4 86.09 Quintile_4 83.42 Quintile_5 85.05 Quintile_5 80.48 VEI (Vertical Equity Index) 19.37 VEI (Vertical Equity Index) 33.87
County=Snohomish Property Class=Residential
County=Snohomish Property Class=Non-
Residential
Quintile Mean Quintile Mean Quintile_1 98.90 Quintile_1 101.61 Quintile_2 96.34 Quintile_2 93.46 Quintile_3 95.89 Quintile_3 92.17 Quintile_4 94.63 Quintile_4 89.89 Quintile_5 92.64 Quintile_5 87.02 VEI (Vertical Equity Index) 6.54 VEI (Vertical Equity Index) 15.72

26
2018 Real Property Quintile Ratio and VEI
County=Spokane Property Class=Residential
County=Spokane Property Class=Non-Residential
Quintile Mean Quintile Mean Quintile_1 99.25 Quintile_1 96.72 Quintile_2 96.52 Quintile_2 96.35 Quintile_3 95.92 Quintile_3 95.28 Quintile_4 96.28 Quintile_4 94.52 Quintile_5 96.38 Quintile_5 93.57 VEI (Vertical Equity Index) 3.44 VEI (Vertical Equity Index) 3.31
County=Stevens Property Class=Residential
County=Stevens Property Class=Non-Residential
Quintile Mean Quintile Mean Quintile_1 98.12 Quintile_1 102.23 Quintile_2 92.02 Quintile_2 90.66 Quintile_3 88.16 Quintile_3 95.38 Quintile_4 85.02 Quintile_4 96.50 Quintile_5 87.99 Quintile_5 93.94 VEI (Vertical Equity Index) 14.51 VEI (Vertical Equity Index) 12.08
County=Thurston Property Class=Residential
County=Thurston Property Class=Non-
Residential
Quintile Mean Quintile Mean Quintile_1 93.04 Quintile_1 117.60 Quintile_2 92.95 Quintile_2 97.42 Quintile_3 95.98 Quintile_3 88.71 Quintile_4 97.08 Quintile_4 93.81 Quintile_5 98.09 Quintile_5 92.67 VEI (Vertical Equity Index) 5.39 VEI (Vertical Equity Index) 29.47
County=Wahkiakum Property Class=Residential
County=Wahkiakum Property Class=Non-
Residential
Quintile Mean Quintile Mean Quintile_1 109.02 Quintile_1 98.92 Quintile_2 103.24 Quintile_2 113.86 Quintile_3 80.16 Quintile_3 105.03 Quintile_4 84.80 Quintile_4 64.70 Quintile_5 87.56 Quintile_5 79.72 VEI (Vertical Equity Index) 31.05 VEI (Vertical Equity Index) 53.18

27
2018 Real Property Quintile Ratio and VEI
County=Walla Walla Property Class=Residential
County=Walla Walla Property Class=Non-
Residential
Quintile Mean Quintile Mean Quintile_1 97.14 Quintile_1 86.26 Quintile_2 95.75 Quintile_2 79.84 Quintile_3 93.57 Quintile_3 84.45 Quintile_4 93.90 Quintile_4 87.47 Quintile_5 92.80 Quintile_5 84.37 VEI (Vertical Equity Index) 4.59 VEI (Vertical Equity Index) 9.03
County=Whatcom Property Class=Residential
County=Whatcom Property Class=Non-
Residential
Quintile Mean Quintile Mean Quintile_1 87.50 Quintile_1 92.11 Quintile_2 86.22 Quintile_2 90.60 Quintile_3 86.94 Quintile_3 82.69 Quintile_4 87.16 Quintile_4 84.93 Quintile_5 88.36 Quintile_5 81.64 VEI (Vertical Equity Index) 2.45 VEI (Vertical Equity Index) 12.12
County=Whitman Property Class=Residential
County=Whitman Property Class=Non-
Residential
Quintile Mean Quintile Mean Quintile_1 84.22 Quintile_1 72.88 Quintile_2 73.95 Quintile_2 76.43 Quintile_3 77.61 Quintile_3 80.43 Quintile_4 77.80 Quintile_4 69.56 Quintile_5 79.50 Quintile_5 60.18 VEI (Vertical Equity Index) 13.06 VEI (Vertical Equity Index) 28.17
County=Yakima Property Class=Residential
County=Yakima Property Class=Non-Residential
Quintile Mean Quintile Mean Quintile_1 97.92 Quintile_1 87.05 Quintile_2 92.02 Quintile_2 74.17 Quintile_3 90.08 Quintile_3 87.72 Quintile_4 88.26 Quintile_4 89.94 Quintile_5 89.02 Quintile_5 87.22 VEI (Vertical Equity Index) 10.56 VEI (Vertical Equity Index) 18.51

28
The following tables show the mean ratio, standard deviation, number of observations (N), and median ratio for each property type statewide.
Statewide by Property Type
Property Type=Ag/Other
Mean Std Dev N Median 93.59 25.64 8398 93.00
Property Type=Comm/Mfg
Mean Std Dev N Median 90.26 21.37 2795 92.40
Property Type=Multi Family
Mean Std Dev N Median 93.94 13.81 5641 94.11
Property Type=SFR
Mean Std Dev N Median 94.22 13.68 100049 94.57
Another visual indication of horizontal uniformity is a histogram. On a histogram each ratio contributes to the length of a bar representing the range in which the ratio falls. Good uniformity is indicated when the highest bars are near the median (approximately the same number of observations on each side) with the bars decreasing in length the farther they are from the median (forming the shape of a bell). A histogram indicates a good level of assessment when the top of the bell is at or near 100. The following histogram is for all valid real property sales statewide. The graph shows that the top of the bell is in the range of 95, which is consistent with the 94.46 statewide median ratio shown in the table on page 3. The graph, with the tallest bar in the middle, also shows that statewide the level of assessment is uniform horizontally. Horizontal uniformity means uniformity across the data being reviewed without influences from the value of the properties. Vertical uniformity, a measure of uniformity in the level of assessment of properties at different value levels cannot be illustrated on a histogram.

29
Statewide Ratio Distribution
The following four histograms are for each of the four major property types on a statewide basis. They are followed by a histogram for each county including all property types.

30
Statewide Ratio Distribution by Property Type
Agricultural/Other
Commercial/Manufacturing

31
Multi-Family Residential
Single-Family Residential

32
Ratio Distribution by County
Adams
Asotin

33
Benton
Chelan

34
Clallam
Clark

35
Columbia
Cowlitz

36
Douglas
Ferry

37
Franklin
Garfield

38
Grant
Grays Harbor

39
Island
Jefferson

40
King
Kitsap

41
Kittitas
Klickitat

42
Lewis
Lincoln

43
Mason
Okanogan

44
Pacific
Pend Oreille

45
Pierce
San Juan

46
Skagit
Skamania

47
Snohomish
Spokane

48
Stevens
Thurston

49
Wahkiakum
Walla Walla

50
Whatcom
Whitman

51
Yakima