2018 pig cost of production in selected countries€¦ · introduction welcome to the latest in a...
TRANSCRIPT

1
2018 pig cost of production in selected countries

2
Contents
3 Introduction
3 Methodology
4 Key points
5 Cost of productionAggregate results for 2018 Comparisons with previous years (sterling) Comparisons with previous years (euros)
8 Financial performance summaryFeed prices and costsSummary of financial performanceNet margins in Great Britain
15 Physical performance summaryPigs weaned per sow per yearPigs finished per sow per yearComparison between outdoor herds in GB and Denmark, 2018
21 Appendix 1InterPIG members’ pig industry trends, 2018Additional tables and figuresStandardising the physical resultsComparison GB and EU physical performance
29 Appendix 2List of tables and charts

3
IntroductionWelcome to the latest in a series of annual reports examining the relative costs of pig meat production up to farmgate level in selected countries. All these figures relate to 2018.In comparison with the previous year, EU pig prices were relatively weak during 2018 as supplies increased. Good profitability during 2017 had encouraged herd expansion. On top of this, feed prices were on an upward trend, meaning that producer margins generally worsened as the year progressed. The impact of lower pig prices, particularly during the autumn, was, therefore, exaggerated.EU pig prices started 2018 at an average of €1.40/kg, around 10 euro cents lower than a year earlier. While there was some upswing in February, prices subsequently fell away and remained generally subdued for the rest of the year. In part, this was due to falling Chinese import demand. Indeed, trade with China was worth 13% less than in 2017. Hot weather during the summer, which slowed growth rates and offered some support to demand, failed to offer much relief from low prices. A peak of €1.52/kg was reached in September, but from that point on, prices fell away and ended the year a little below where they started.As in the EU overall, British pig slaughter increased, following an increase in the breeding herd and productivity improvements in 2017. GB pig prices were similarly subdued throughout the year, peaking at only 153p/kg in the summer. The lacklustre prices reflected developments on the wider EU market, where supply levels were increasing. Supplies of British pork were also relatively plentiful.To assist producers in comparing their physical performance with other British pig businesses, AHDB has a Key Performance Indicators (KPIs) section on its website. Updated quarterly and based on Agrosoft data, the section provides average, top third and top 10% performance for indoor and outdoor breeding herds, rearing and finishing herds. Pig production cost calculators can also be found on the main AHDB website.
MethodologyThis report examines the relative costs of production in selected countries. This is a joint project, involving the following organisations in 17 countries, known collectively as InterPIG:
● Great Britain – Agriculture and Horticulture Development Board (AHDB) ● Austria – VLV Upper Austria ● Belgium – Flemish Government and Boerenbond Belgie ● Brazil – Embrapa Swine and Poultry
Brazil submits data for two regions: Mato Grosso (MT) and Santa Catarina (SC) ● Canada – Canadian Pork Council ● Czech Republic – Institute of Agricultural Economics and Information (UZEI) ● Denmark – SEGES ● Finland – Atria ● France – IFIP ● Germany – Thuenen Institute and Interessengemeinschaft der Schweinehalter (ISN) ● Hungary – AKI Research Institute of Agricultural Economics ● Ireland – Teagasc ● Italy – Research Centre for Animal Production (CRPA) ● Netherlands – Wageningen Economic Research ● Spain – SIP Consultors ● Sweden – Svenska Pig ● USA – Iowa State University
Czech Republic is not included due to deadlines. InterPIG continues to work with other countries and organisations wishing to participate in international comparison.

4
Key points
• The cost of pig meat production for indoor pigs in Great Britain increased by 8% in 2018, to £1.47 per kg. The average cost of production in the EU was £1.44 per kg deadweight – a 4% increase in sterling terms compared with 2017
• All sampled EU countries experienced an increase in the costs of production (in sterling terms) compared with 2017
• EU average reference price of £1.26 per kg was lower in 2018 than in 2017, with only Denmark and Spain having production costs lower than the EU average price
• Average feed prices were higher in 2018 than in 2017, increasing across the participating EU countries by an average of just over 9%
• In 2018 as a whole, EU feed costs per kg in sterling terms increased by 6% compared with a year earlier. All InterPIG member countries, except Brazil (SC), experienced an increase in feed costs compared with 2017
• The overall average number of pigs weaned per sow per year in the EU InterPIG countries showed a nearly 1% increase in 2018, up from 27.88 in 2017 to 28.12. Denmark yet again achieved over 33
• There was a 1% increase in pigs weaned per sow per year in Great Britain’s indoor herds to 27.35 – still below the EU InterPIG average. As a consequence of the weather, Great Britain’s outdoor herds’ performance fell by 3% to 23.22 in 2018
• Excluding Great Britain’s outdoor herds, there is a difference of 8.8 pigs weaned per sow per year between the highest- and lowest-performing EU countries
• The average number of pigs finished per sow in Great Britain’s indoor herds again increased in 2018 by 1% to 25.41 pigs – still lower than the EU average of 26.44
• Great Britain’s indoor herds produced over 2 tonnes of carcase meat per sow in 2018 – 1% higher than in 2017 – due to the increase in the number of pigs finished per sow
Cost and performance data relate to average performance data from national recording systems operating in the participating countries. Definitions have been standardised across countries. For example, the definition of a sow is from first insemination to slaughter and the results are based on average present sows (average daily number of sows in the year). The methodology is based on compound feed for sows, rearing and finishing, to ensure consistency of approach. However, this is in the knowledge that there are farmers in the different countries who grow their own crops and home-mix their pig feed. The proportion of farmers in each country who home-mix varies, depending on infrastructure, tradition, ingredient availability and prices.There will inevitably still be some national differences in definition, but where this has occurred, the data is adjusted in the most appropriate way. The results are believed to provide an indication of the relative average costs of production within each country and to deliver an accurate comparison. In an attempt to continue to improve the accuracy of the data provided, the glossary of terms and formulae used in calculations is monitored and updated. In some instances, due to changes in data or participating countries, previous years’ analyses may be updated. As a result, there may be some discrepancies between previous publications as definitions and formulae are realigned.NOTE: In Great Britain, there is a difference between the methodology used for producing the national quarterly cost of production and the methodology used by InterPIG. In Great Britain, abattoir costs (transport to slaughter, meat hygiene, carcase classification and statutory levy) are included in the quarterly published cost of production figures. In InterPIG, these costs are excluded from the cost of production and are deducted from the price received at sale.

5
Cost of productionAggregate results for 2018The production costs of pig meat in 2018 for all of the countries covered in this report are shown below in Figure 1. This data includes all variable and overhead costs, other than transport of pigs to abattoirs and abattoir-related deductions, such as carcase classification and statutory levies paid at slaughter. Overhead costs include depreciation and interest costs for capital items such as buildings and equipment. Costs for regular and casual labour are included but directors’ salaries or partners’ drawings are not.
0.00
0.20
0.40
0.60
0.80
1.00
1.20
1.40
1.60
1.80
AUS BEL BRA(MT)
BRA(SC)
CAN DEN FIN FRA GER GB(IN)
GB(OUT)
HUN IRE ITA NL SPA SWE USA
0.12
0.89 0.84
0.59 0.75 0.69 0.75 0.82 0.80 0.80
0.92 0.95 0.87 0.94 1.12
0.77 0.83 0.91
0.60
0.22 0.18
0.11
0.10 0.12
0.20
0.32 0.23 0.29
0.23 0.29
0.25 0.22
0.21
0.30 0.22 0.17
0.12
0.15
0.10
0.04
0.05 0.14
0.13
0.15
0.12 0.13
0.12 0.14
0.12 0.13
0.15
0.11 0.09 0.14
0.06
0.27
0.17
0.11
0.09 0.09
0.18
0.26
0.18 0.22 0.20
0.15
0.20 0.20
0.22
0.18 0.12
0.31
Oth
er v
aria
ble
cost
s
Feed Other variable costs Labour Depreciation and finance
UK average price EU average price
The average cost of production in the EU in 2018 for the countries above was £1.44 per kg deadweight – a 4% increase on the previous year. Costs of production in Great Britain for pork from indoor sows was near the EU average at £1.47 – an 8% increase on the previous year. In 2018, Italy continued to have the highest costs, at £1.70 per kg deadweight. The countries with the lowest production costs in the EU were Spain and Denmark (£1.25).The average UK reference price was nearly 7% lower during 2018 than in 2017, averaging £1.46 per kg, and 16% above the EU average of £1.26 per kg. On average, margins were negative throughout 2018, with the UK price below the estimated cost of production for the majority of the year. Across the EU countries sampled, there was a technical margin of -2p on every kg of pig meat produced, with only Denmark and Spain having production costs lower than the EU average reference price.
Reference pricesThe UK reference price is gross, before abattoir deductions such as carcase classification. It includes premium pigs (e.g. outdoor bred) and point-of-sale price adjustments, such as those based on probe measurements.The EU reference price is usually after deductions of any abattoir-paid costs, which, in many countries, include transport to abattoir, carcase classification and insurance.
Figure 1. Cost of production in selected countries, 2018

6
Neither price includes any bonus or price adjustment paid later than the point-of-sale transaction, such as end-of-year co-operative bonuses.
Comparisons with previous years (sterling)Costs of production in sterling terms in 2018, compared with results for the five previous years, are shown in Table 1. The average cost of production in sterling terms in the EU countries was 4% higher than 2017 levels for the same countries and stood at £1.44 per kg. All EU countries experienced an increase in the costs of production on this basis, largely due to an increase in feed costs. Exchange rate volatility will also have an impact.
Table 1. Average costs of production, 2013–2018
CountryAverage costs of production (£/kg deadweight)
2013 2014 2015 2016 2017 2018 2017/18% change
Austria 1.56 1.38 1.22 1.37 1.41 1.54 9
Belgium 1.48 1.26 1.08 1.17 1.25 1.30 3
Brazil (MT) 0.96 0.84 0.70 0.91 0.85 0.85 0
Brazil (SC) 1.13 1.04 0.87 1.16 1.12 0.99 -12
Canada 1.20 0.98 0.92 1.01 0.97 1.04 7
Denmark 1.46 1.25 1.10 1.17 1.20 1.25 4
Finland na 1.45 1.26 1.41 1.50 1.54 3
France 1.50 1.31 1.11 1.21 1.30 1.33 3
Germany 1.56 1.33 1.15 1.25 1.36 1.44 6
GB (IN) 1.58 1.42 1.35 1.27 1.37 1.47 8
GB (OUT) 1.62 1.45 1.39 1.30 1.39 1.52 10
Hungary 1.93 1.51 1.35 1.36 1.37 1.44 5
Ireland 1.63 1.40 1.25 1.32 1.44 1.48 3
Italy 1.72 1.59 1.34 1.51 1.66 1.70 3
Netherlands 1.50 1.32 1.18 1.29 1.36 1.36 0
Spain 1.39 1.20 1.06 1.13 1.20 1.25 4
Sweden 1.81 1.51 1.30 1.44 1.49 1.53 2
USA 1.04 0.83 0.80 0.86 0.86 0.89 3
EU 1.60 1.38 1.22 1.30 1.38 1.44 4
7
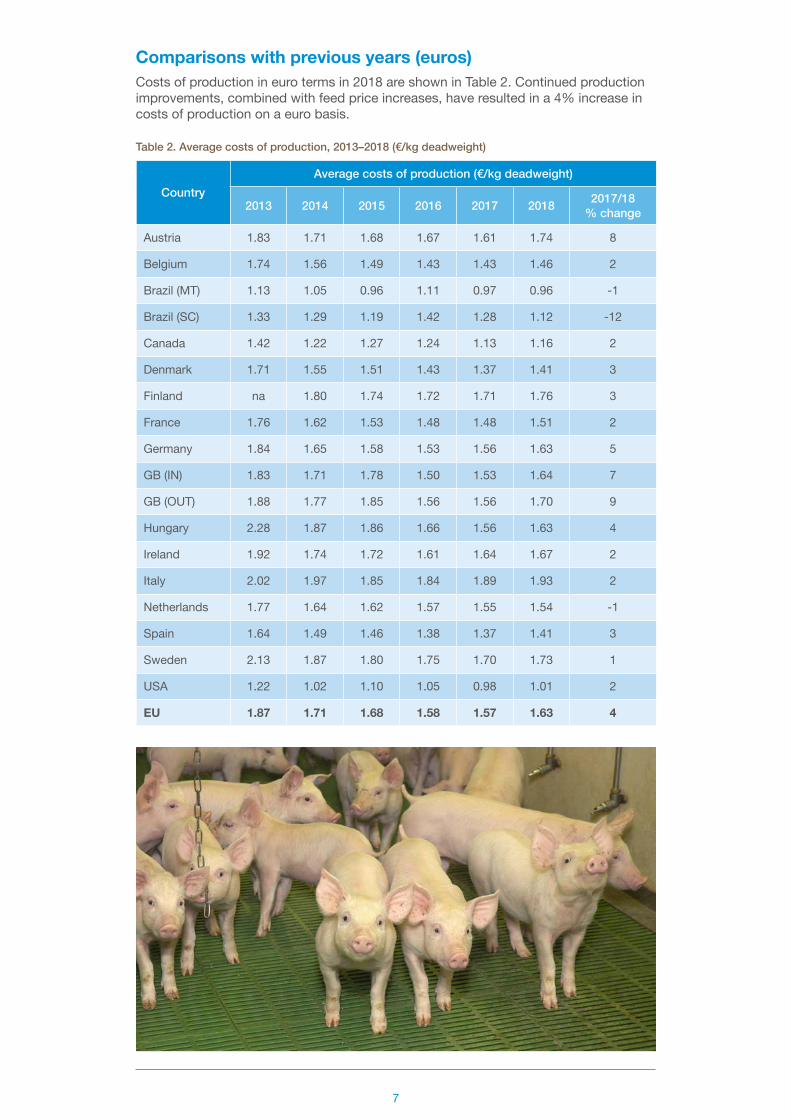
Comparisons with previous years (euros)Costs of production in euro terms in 2018 are shown in Table 2. Continued production improvements, combined with feed price increases, have resulted in a 4% increase in costs of production on a euro basis.
Table 2. Average costs of production, 2013–2018 (€/kg deadweight)
CountryAverage costs of production (€/kg deadweight)
2013 2014 2015 2016 2017 2018 2017/18% change
Austria 1.83 1.71 1.68 1.67 1.61 1.74 8
Belgium 1.74 1.56 1.49 1.43 1.43 1.46 2
Brazil (MT) 1.13 1.05 0.96 1.11 0.97 0.96 -1
Brazil (SC) 1.33 1.29 1.19 1.42 1.28 1.12 -12
Canada 1.42 1.22 1.27 1.24 1.13 1.16 2
Denmark 1.71 1.55 1.51 1.43 1.37 1.41 3
Finland na 1.80 1.74 1.72 1.71 1.76 3
France 1.76 1.62 1.53 1.48 1.48 1.51 2
Germany 1.84 1.65 1.58 1.53 1.56 1.63 5
GB (IN) 1.83 1.71 1.78 1.50 1.53 1.64 7
GB (OUT) 1.88 1.77 1.85 1.56 1.56 1.70 9
Hungary 2.28 1.87 1.86 1.66 1.56 1.63 4
Ireland 1.92 1.74 1.72 1.61 1.64 1.67 2
Italy 2.02 1.97 1.85 1.84 1.89 1.93 2
Netherlands 1.77 1.64 1.62 1.57 1.55 1.54 -1
Spain 1.64 1.49 1.46 1.38 1.37 1.41 3
Sweden 2.13 1.87 1.80 1.75 1.70 1.73 1
USA 1.22 1.02 1.10 1.05 0.98 1.01 2
EU 1.87 1.71 1.68 1.58 1.57 1.63 4

8
Financial performance summaryTable 3 contains financial performance data for 2018, while Table 6 presents comparisons with 2016 and 2017. All comparisons are on a compound-feed basis, with some farmers in most countries opting to grow some feed ingredients and home-mix. Among the EU countries, there was a range of 45p per kg between the highest-cost and the lowest-cost producer, a similar range as observed in 2017. The recorded differences are due to a combination of physical performance and input costs (e.g. feed, depreciation).
Table 3. Summary of financial performance, 2018 (£/kg deadweight)
Financial performance (£/kg deadweight)
AUS BEL BRA(MT)
BRA(SC) CAN DEN FIN FRA GER GB
(IN)
Feed 0.89 0.84 0.59 0.75 0.69 0.75 0.82 0.80 0.80 0.92
Other variable costs 0.22 0.18 0.11 0.10 0.12 0.20 0.32 0.23 0.29 0.23
Total variable costs 1.11 1.02 0.70 0.85 0.81 0.95 1.14 1.03 1.09 1.15
Labour 0.15 0.10 0.04 0.05 0.14 0.13 0.15 0.12 0.13 0.12
Depreciation and finance 0.27 0.17 0.11 0.09 0.09 0.18 0.26 0.18 0.22 0.20
Total fixed costs 0.43 0.28 0.15 0.14 0.23 0.31 0.41 0.30 0.35 0.32
Total 1.54 1.30 0.85 0.99 1.04 1.25 1.54 1.33 1.44 1.47
GB (OUT) HUN IRE ITA NL SPA SWE USA EU
AVERAGE
Feed 0.95 0.87 0.94 1.12 0.77 0.83 0.91 0.60 0.87
Other variable costs 0.29 0.25 0.22 0.21 0.30 0.22 0.17 0.12 0.24
Total variable costs 1.24 1.12 1.16 1.33 1.07 1.05 1.08 0.71 1.11
Labour 0.14 0.12 0.13 0.15 0.11 0.09 0.14 0.06 0.13
Depreciation and finance 0.15 0.20 0.20 0.22 0.18 0.12 0.31 0.12 0.20
Total fixed costs 0.28 0.32 0.32 0.37 0.29 0.20 0.45 0.18 0.33
Total 1.52 1.44 1.48 1.70 1.36 1.25 1.53 0.89 1.44
Note: Totals may not add up due to rounding.

9
Feed prices and costsMarket developments in 2018/19Nearby UK feed wheat futures started 2018 at £136.60 per tonne. This was £2.75 per tonne higher than the same period a year earlier. A relatively large wheat crop harvest in 2017, as well as a global grain surplus, meant prices were pressured to remain somewhat low. A milder winter from 2017 left on-farm feed stocks relatively unaffected. However, the extreme cold weather in March led nearby feed wheat futures to rise to a then year-to-date high of £143.25 per tonne, as demand increased. Drought conditions in the run-up to 2018’s harvest reduced production levels in both the UK and the EU. This was in addition to stock-level tightness, following increased winter demand. Thus, in August 2018, nearby feed wheat futures reached their highest level since May 2013, at £194.65 per tonne. Through winter 2018/19, feed wheat futures crept up as producers sought to fill feed barns. However, a milder winter meant some supplies lasted through until spring 2019. A plentiful cereal crop in 2019 has meant prices have fallen to reflect the greater supply available.Soya beans started 2018 at a low, pressured from a large global supply. The price of imported Brazilian soya meal (48%, ex-store, Liverpool) was at £304.00 per tonne. Widespread feed shortages from the extreme cold weather in March 2018 led imported prices to rise £61.00 from the start of the year, to £365.00 per tonne. In the second half of 2018, soya bean prices recorded declines, as a result of large harvests in the Americas. The developing trade dispute between the US and China meant large supplies of US soya beans had to find alternative homes, which pressured prices.In 2019, prices were again been pressured by ample global supplies and reduced demand in the face of African swine fever across Asian and Eastern European regions. Disruption arising from the US/China trade dispute also continued to exert downward pressure on global prices. In March 2019, imported Brazilian soya meal (48%, ex-store, Liverpool) was at a price of £290.00 per tonne, its lowest since August 2017.With year-on-year price increases recorded for the main components of animal feed during 2018, it was unsurprising that this was reflected in compound-feed prices. The average price for compound pig feed in the final quarter of 2017 was £233 per tonne, while a year later it had risen by £28 per tonne (12%) to £261 per tonne. By the final quarter of 2019, the average price for compound pig feed had dropped by just over 7% to £242 per tonne.Tables 4 and 5 below indicate the annual average compound-feed prices in various countries: Table 4 in sterling, and in Table 5, the same prices converted into euros using an annual exchange rate.In sterling terms, at £230.06 per tonne, the average feed price per tonne increased by just over 9% compared with 2017.

10
Table 4. Compound-feed prices per tonne (sterling), 2018
Compound-feed prices (£/tonne)
AUS BEL BRA(MT)
BRA(SC) CAN DEN FIN FRA GER GB
(IN)
Sow 240.67 232.70 158.45 186.16 165.72 197.15 212.43 221.14 215.54 236.12
Rearer 319.42 334.46 281.41 408.52 266.24 284.80 280.93 314.72 313.49 289.36
Finisher 220.32 227.40 149.79 208.73 170.33 198.34 195.54 197.70 204.04 241.31
Average farm feed price
236.82 238.07 166.22 220.72 180.02 209.95 208.94 215.23 218.40 248.54
GB (OUT) HUN IRE ITA NL SPA SWE USA EU
AVERAGE
Sow 233.39 199.92 249.25 248.63 229.16 210.94 226.02 147.77 225.22
Rearer 274.41 288.89 354.56 337.29 331.80 362.91 331.97 361.41 315.64
Finisher 241.31 197.90 238.01 234.47 212.35 224.97 210.50 132.89 217.44
Average farm feed price
245.01 208.51 261.66 243.87 225.76 232.98 227.15 153.81 230.06
Table 5. Compound-feed prices per tonne (euros), 2018
Compound-feed prices (€/tonne)
AUS BEL BRA(MT)
BRA(SC) CAN DEN FIN FRA GER GB
(IN)
Sow 272.00 263.00 179.08 210.40 187.30 222.82 240.09 249.93 243.60 266.86
Rearer 361.00 378.00 318.04 461.70 300.90 321.88 317.50 355.70 354.30 327.03
Finisher 249.00 257.00 169.29 235.90 192.50 224.16 221.00 223.44 230.60 272.73
Average farm feed price
267.65 269.07 187.86 249.46 203.46 237.28 236.15 243.25 246.84 280.90
GB (OUT) HUN IRE ITA NL SPA SWE USA EU
AVERAGE
Sow 263.78 225.95 281.70 281.00 259.00 238.41 255.44 167.01 254.54
Rearer 310.13 326.50 400.72 381.20 375.00 410.15 375.19 408.46 356.74
Finisher 272.73 223.67 269.00 265.00 240.00 254.26 237.90 150.19 245.75
Average farm feed price
276.90 235.65 295.72 275.62 255.15 263.31 256.72 173.84 260.02

11
Summary of financial performanceThe impact on pig producers’ feed costs in 2018With higher feed prices in 2018 than in 2017, prices for EU members of InterPIG increased (in sterling terms) by an average of 12% in 2018 compared with the previous year. There was a range of feed prices across the EU countries, with a difference of £53 per tonne between the highest and lowest average farm feed price in 2018.
-10.0
-5.0
0.0
5.0
10.0
15.0
20.0
FRA
+4
HUN
+3
NL
+2
GB(IN)
+7
GB(OUT)
+7
FIN
+11
AUS
+14
GER
+7
ITA
+5
CAN
+5
BEL
+5
IRE
+6
USA
+4
SPA
+4
SWE
+8
BRA(MT)
+10
DEN
+5
-8
BRA (SC)
% c
hang
e 20
17/2
018
Figure 2. Changes in feed costs, 2018
The impact of feed prices on the feed cost per kg is also affected by physical performance. As shown in Figure 2, all countries, except Brazil (SC), experienced an increase in feed costs, the highest of which was 14% in Austria. Within the EU countries, 2018 feed costs increased on average by 6% compared with 2017.
0.00
0.20
0.40
0.60
0.80
1.00
1.20
£/kg
2017 2018
BRA(MT)
USA CAN DEN BRA(SC)
NL FRA GER FIN SPA BEL HUN AUS SWE GB(IN)
IRE GB(OUT)
ITA
0.66 0.
69
0.57 0.
60
0.54
0.59
0.75 0.77
0.82
0.75
0.71 0.
75
0.74
0.82
0.75
0.80
0.77 0.
80 0.84 0.
87
0.80 0.
84
0.80 0.
83 0.84
0.91
0.78
0.89
0.88
0.95
1.07 1.
12
0.89 0.
94
0.86
0.92
Figure 3. Feed costs, 2018

12
As shown in Figure 3, feed costs averaged 92p per kg of carcase produced for indoor herds in Great Britain, compared with the 86p recorded in 2017. For outdoor herds in Great Britain, feed costs averaged 95p, compared with 88p in 2017 – an increase of 7% in both cases. This is compared with the average feed cost of 87p per kg across all the participating EU countries – an average increase of 6%.Table 6 summarises the cost of production by country for each of the past three years. Costs are expressed in sterling and, therefore, the actual costs in each country are affected by exchange rates. Table 7 summarises the physical performance by country for each of the past three years.For the first time, Great Britain indoor and outdoor performance are shown separately in both Table 6 and 7.
Table 6. Summary of financial performance, 2016–2018
Financial performance (£/kg deadweight)
AUS BEL BRA (MT)
2016 2017 2018 2016 2017 2018 2016 2017 2018
Feed 0.79 0.78 0.89 0.75 0.80 0.84 0.63 0.54 0.59
Other variable costs 0.20 0.22 0.22 0.17 0.19 0.18 0.12 0.14 0.11
Total variable costs 1.00 0.99 1.11 0.92 0.98 1.02 0.76 0.68 0.70
Labour 0.13 0.15 0.15 0.10 0.10 0.10 0.05 0.06 0.04
Depreciation and finance 0.24 0.27 0.27 0.16 0.17 0.17 0.10 0.11 0.11
Total fixed costs 0.37 0.41 0.43 0.25 0.27 0.28 0.15 0.17 0.15
Total 1.37 1.41 1.54 1.17 1.25 1.30 0.91 0.85 0.85
BRA (SC) CAN DEN
2016 2017 2018 2016 2017 2018 2016 2017 2018
Feed 0.90 0.82 0.75 0.67 0.66 0.69 0.68 0.71 0.75
Other variable costs 0.10 0.12 0.10 0.13 0.09 0.12 0.19 0.19 0.20
Total variable costs 1.00 0.94 0.85 0.80 0.75 0.81 0.87 0.90 0.95
Labour 0.06 0.07 0.05 0.12 0.13 0.14 0.12 0.12 0.13
Depreciation and finance 0.10 0.11 0.09 0.09 0.09 0.09 0.19 0.18 0.18
Total fixed costs 0.16 0.19 0.14 0.21 0.22 0.23 0.30 0.30 0.31
Total 1.16 1.12 0.99 1.01 0.97 1.04 1.17 1.20 1.25
FIN FRA GER
2016 2017 2018 2016 2017 2018 2016 2017 2018
Feed 0.69 0.74 0.82 0.73 0.77 0.80 0.69 0.75 0.80
Other variable costs 0.31 0.33 0.32 0.21 0.23 0.23 0.25 0.27 0.29
Total variable costs 1.00 1.07 1.14 0.94 1.01 1.03 0.94 1.02 1.09
Labour 0.15 0.15 0.15 0.11 0.12 0.12 0.12 0.13 0.13
Depreciation and finance 0.26 0.28 0.26 0.16 0.18 0.18 0.20 0.21 0.22
Total fixed costs 0.41 0.43 0.41 0.28 0.29 0.30 0.32 0.34 0.35
Total 1.41 1.50 1.54 1.21 1.30 1.33 1.25 1.36 1.44
Note: Totals may not add up due to rounding.

13
Table 6. Summary of financial performance, 2016–2018 (continued)
Financial performance (£/kg deadweight)
GB (IN) GB (OUT) HUN
2016 2017 2018 2016 2017 2018 2016 2017 2018
Feed 0.73 0.86 0.92 0.77 0.88 0.95 0.88 0.84 0.87
Other variable costs 0.20 0.20 0.23 0.25 0.24 0.29 0.20 0.23 0.25
Total variable costs 0.94 1.06 1.15 1.02 1.12 1.24 1.08 1.07 1.12
Labour 0.12 0.12 0.12 0.14 0.13 0.14 0.10 0.12 0.12
Depreciation and finance 0.21 0.19 0.20 0.14 0.13 0.15 0.18 0.18 0.20
Total fixed costs 0.33 0.31 0.32 0.28 0.26 0.28 0.28 0.30 0.32
Total 1.27 1.37 1.47 1.30 1.39 1.52 1.36 1.37 1.44
IRE ITA NL
2016 2017 2018 2016 2017 2018 2016 2017 2018
Feed 0.84 0.89 0.94 1.00 1.07 1.12 0.70 0.75 0.77
Other variable costs 0.21 0.23 0.22 0.20 0.22 0.21 0.30 0.30 0.30
Total variable costs 1.05 1.12 1.16 1.20 1.28 1.33 1.00 1.05 1.07
Labour 0.11 0.12 0.13 0.14 0.15 0.15 0.12 0.12 0.11
Depreciation and finance 0.16 0.20 0.20 0.18 0.22 0.22 0.17 0.19 0.18
Total fixed costs 0.27 0.32 0.32 0.31 0.37 0.37 0.29 0.31 0.29
Total 1.32 1.44 1.48 1.51 1.66 1.70 1.29 1.36 1.36
SPA SWE USA
2016 2017 2018 2016 2017 2018 2016 2017 2018
Feed 0.76 0.80 0.83 0.79 0.84 0.91 0.56 0.57 0.60
Other variable costs 0.19 0.20 0.22 0.17 0.17 0.17 0.13 0.11 0.12
Total variable costs 0.94 1.01 1.05 0.96 1.01 1.08 0.69 0.68 0.71
Labour 0.08 0.09 0.09 0.16 0.16 0.14 0.06 0.06 0.06
Depreciation and finance 0.11 0.11 0.12 0.32 0.32 0.31 0.11 0.06 0.12
Total fixed costs 0.19 0.20 0.20 0.48 0.48 0.45 0.17 0.12 0.18
Total 1.13 1.20 1.25 1.44 1.49 1.53 0.86 0.81 0.89
EU average
2016 2017 2018
Feed 0.77 0.82 0.87
Other variable costs 0.22 0.23 0.24
Total variable costs 0.99 1.05 1.11
Labour 0.12 0.13 0.13
Depreciation and finance 0.19 0.20 0.20
Total fixed costs 0.31 0.33 0.33
Total 1.30 1.38 1.44
Note: Totals may not add up due to rounding.

14
Net margins in Great BritainThe net margins shown in Figure 4 are based on the difference between the monthly price and the estimated total cost of producing pig meat (including depreciation costs) for an average producer. The results shown in the chart should only be considered as indicative of general trends, because:
● Physical and financial performance levels can vary greatly between producers ● The assumptions used for feed costs using spot compound prices will not apply
to all producers, due to the range of feed procurement strategies in the industry ● There are various rearing and finishing production systems for weaned piglets,
including fully slatted, semi-slatted, straw barns and outdoor options
The monthly price used to calculate net margins for indoor-bred pigs is the SPP (Standard Pig Price) and the monthly price used to calculate net margins for outdoor-bred pigs is the APP (All Pig Price). Details of these prices can be found on the AHDB Pork website.
-13
-8
-3
+2
+7
+12
+17
2011 201720162015201420132012 2018
-£4
-£7-£5
-£8
£3
-£1
£12
£9
-£3-£4
-£1 -£1
£13 £14
-£4-£6
£/he
ad
Indoor Outdoor
Figure 4. Estimated net margins in Great Britain, 2011–2018
The volatility of net margin returns for pig producers in Great Britain is clearly illustrated in the above chart. From 2011 to 2018 inclusive, indoor pig producers achieved positive margins in only three out of the eight years and outdoor pig producers only achieved positive margins in two of those years.During prolonged periods of negative margins, specialist pig producers with no other farm enterprises or farm diversification are particularly vulnerable and may leave the industry. Many producers make little or no investment during these periods and some depopulate for a period of time.Annual averages can mask volatility within years. In 2014, early higher pig prices were followed by declining prices, resulting in a negative margin in the last month of 2014 and a positive average margin overall. With lower feed costs but continued declining prices, 2015 resulted in an average negative margin for both indoor and outdoor pig producers. In 2016, low prices in the first seven months of the year resulted in negative margins estimated at up to £12 per pig for indoor and outdoor producers. During the rest of 2016, rising prices covered increasing feed costs, with the end of 2016 resulting in positive net margins estimated at around £14 per pig for indoor producers and £13 for outdoor producers. This resulted in an overall small negative margin for 2016. In 2017, despite an increase in the cost of production, rising pig prices resulted in healthy margins throughout the year.

15
In 2018, the combination of increasing costs of production and lower pork prices resulted in significantly lower, but still positive, net margins for indoor producers in the first half of 2018. However, outdoor producers went into negative margins after the first quarter. Estimated negative margins of up to £10 per pig for both indoor and outdoor producers resulted in negative margins on average for the year.The start of 2019, with still relatively high feed prices and low pig prices, was challenging, resulting in both indoor and outdoor pig producers estimated to be losing up to £16 per pig. Falling feed prices, improved performance and rising pig prices have turned this around, with the second half of 2019 looking at returning positive margins, with the third-quarter net margin estimated at £7 per head.
Physical performance summaryTable 7. Summary of physical performance, 2016–2018
Physical performance
AUS BEL BRA (MT)
2016 2017 2018 2016 2017 2018 2016 2017 2018
Pigs weaned/sow/year 24.90 24.90 24.79 30.13 29.83 29.63 25.15 27.40 28.71
Pigs reared/sow/year 24.16 24.15 24.19 28.74 28.64 28.30 25.63 26.86 27.85
Pigs sold/sow/year 23.74 23.71 23.72 27.91 27.75 27.31 25.06 26.27 27.15
Litters/sow/year 2.33 2.29 2.29 2.38 2.34 2.34 2.37 2.41 2.43
Rearing mortality (%) 3.00 3.00 2.40 4.60 4.00 4.50 2.00 2.00 3.00
Finishing mortality (%) 1.74 1.81 1.96 2.90 3.10 3.50 2.20 2.20 2.50
Finishing daily liveweight gain (g/day) 802 810 805 680 694 700 831 831 880
Finishing feed conversion ratio 2.88 2.86 2.87 2.83 2.76 2.78 2.60 2.60 2.50
Average liveweight at slaughter (kg) 121 121 121 114 116 116 123 120 110
Average carcase weight – cold (kg) 94.5 94.7 95.0 91.2 94.4 95.7 91.6 89.3 82.0
Carcase meat production/sow/year (kg) 2,243 2,245 2,252 2,546 2,620 2,615 2,295 2,346 2,226
BRA (SC) CAN DEN
2016 2017 2018 2016 2017 2018 2016 2017 2018
Pigs weaned/sow/year 26.82 27.72 27.87 23.19 26.28 24.66 32.10 33.29 33.57
Pigs reared/sow/year 26.28 27.17 27.27 22.73 25.75 24.17 31.10 32.26 32.49
Pigs sold/sow/year 25.71 26.35 26.66 21.93 24.85 23.32 30.08 31.26 31.42
Litters/sow/year 2.30 2.33 2.33 2.30 2.30 2.30 2.27 2.28 2.26
Rearing mortality (%) 2.00 2.00 2.16 2.00 2.00 2.00 3.10 3.10 3.20
Finishing mortality (%) 2.20 3.00 2.25 3.50 3.50 3.50 3.30 3.10 3.30
Finishing daily liveweight gain (g/day) 820 820 827 876 876 876 950 971 975
Finishing feed conversion ratio 2.60 2.60 2.44 3.00 3.00 3.00 2.69 2.66 2.63
Average liveweight at slaughter (kg) 123 122 121 126 127 128 111 114 113
Average carcase weight – cold (kg) 91.8 90.7 90.1 99.3 100.0 100.8 84.2 85.8 86.0
Carcase meat production/sow/year (kg) 2,361 2,390 2,401 2,178 2,485 2,350 2,531 2,683 2704

16
Table 7. Summary of physical performance, 2016–2018 (continued)
Physical performance
FIN FRA GER
2016 2017 2018 2016 2017 2018 2016 2017 2018
Pigs weaned/sow/year 26.91 27.13 27.46 27.55 28.05 28.49 29.07 29.66 30.10
Pigs reared/sow/year 26.32 26.51 26.80 26.83 27.28 27.69 28.14 28.74 29.22
Pigs sold/sow/year 25.58 25.77 26.07 25.82 26.26 26.62 27.35 27.96 28.49
Litters/sow/year 2.22 2.23 2.23 2.33 2.34 2.34 2.33 2.33 2.32
Rearing mortality (%) 2.20 2.30 2.40 2.63 2.74 2.81 3.20 3.10 2.90
Finishing mortality (%) 2.82 2.80 2.70 3.76 3.74 3.89 2.80 2.70 2.50
Finishing daily liveweight gain (g/day) 967 970 980 800 803 803 824 832 842
Finishing feed conversion ratio 2.70 2.70 2.70 2.78 2.77 2.75 2.81 2.81 2.79
Average liveweight at slaughter (kg) 121 121 124 120 120 120 122 122 122
Average carcase weight – cold (kg) 89.8 90.3 90.7 91.7 91.9 92.0 94.0 94.2 94.6
Carcase meat production/sow/year (kg) 2,296 2,326 2,365 2,368 2,414 2,448 2,571 2,634 2,695
GB (IN) GB (OUT) HUN
2016 2017 2018 2016 2017 2018 2016 2017 2018
Pigs weaned/sow/year 26.24 26.97 27.35 22.77 23.95 23.22 24.91 25.47 25.74
Pigs reared/sow/year 25.30 25.96 26.24 21.96 23.05 22.28 24.43 24.99 25.25
Pigs sold/sow/year 24.54 25.23 25.41 21.29 22.41 21.57 23.62 24.00 24.32
Litters/sow/year 2.29 2.30 2.28 2.26 2.28 2.20 2.23 2.25 2.31
Rearing mortality (%) 3.56 3.78 4.06 3.56 3.78 4.06 1.90 1.90 1.90
Finishing mortality (%) 3.03 2.79 3.19 3.03 2.79 3.19 3.31 3.96 3.68
Finishing daily liveweight gain (g/day) 850 833 866 850 833 866 704 710 696
Finishing feed conversion ratio 2.65 2.86 2.79 2.65 2.86 2.79 3.23 3.04 3.14
Average liveweight at slaughter (kg) 109 110 110 107 109 109 113 111 109
Average carcase weight – cold (kg) 82.8 83.6 83.6 81.9 83.0 83.2 89.6 87.6 86.1
Carcase meat production/sow/year (kg) 2,032 2,110 2,124 1,744 1,859 1,793 2,116 2,103 2,094

17
Table 7. Summary of physical performance, 2016–2018 (continued)
Physical performance
IRE ITA NL
2016 2017 2018 2016 2017 2018 2016 2017 2018
Pigs weaned/sow/year 27.92 28.45 28.48 24.30 24.77 25.08 29.80 30.25 30.55
Pigs reared/sow/year 27.12 27.62 27.65 23.52 23.75 23.93 29.06 29.49 29.76
Pigs sold/sow/year 26.45 27.01 26.98 22.93 23.15 23.33 28.39 28.78 29.01
Litters/sow/year 2.38 2.36 2.34 2.22 2.25 2.24 2.36 2.36 2.35
Rearing mortality (%) 2.85 2.91 2.90 3.20 4.13 4.60 2.50 2.50 2.60
Finishing mortality (%) 2.49 2.21 2.43 2.50 2.50 2.50 2.30 2.40 2.50
Finishing daily liveweight gain (g/day) 860 866 885 687 687 690 808 822 829
Finishing feed conversion ratio 2.69 2.66 2.72 3.79 3.75 3.74 2.59 2.58 2.56
Average liveweight at slaughter (kg) 109 111 113 170 168 170 119 121 121
Average carcase weight – cold (kg) 83.0 84.6 86.2 136.6 135.0 136.6 93.0 94.1 94.4
Carcase meat production/sow/year (kg) 2,195 2,285 2,326 3,132 3,126 3,187 2,640 2,708 2,738
SPA SWE USA
2016 2017 2018 2016 2017 2018 2016 2017 2018
Pigs weaned/sow/year 27.00 26.98 27.45 25.88 26.62 26.83 25.68 26.43 26.80
Pigs reared/sow/year 25.94 25.99 26.18 25.34 26.09 26.29 24.63 25.32 25.70
Pigs sold/sow/year 25.02 25.06 25.19 24.91 25.67 25.82 23.42 24.15 24.54
Litters/sow/year 2.34 2.31 2.31 2.23 2.24 2.23 2.41 2.44 2.44
Rearing mortality (%) 3.94 3.69 4.63 2.10 2.00 2.00 4.10 4.20 4.10
Finishing mortality (%) 3.57 3.56 3.80 1.70 1.60 1.80 4.92 4.64 4.54
Finishing daily liveweight gain (g/day) 706 701 726 926 941 946 826 857 860
Finishing feed conversion ratio 2.48 2.46 2.48 2.90 2.87 2.85 2.72 2.71 2.68
Average liveweight at slaughter (kg) 110 110 112 121 122 124 128 127 127
Average carcase weight – cold (kg) 82.3 83.0 84.5 88.3 89.8 90.6 94.0 94.7 92.9
Carcase meat production/sow/year (kg) 2,060 2,081 2,129 2,199 2,304 2,338 2,202 2,287 2,280

18
Table 7. Summary of physical performance, 2016–2018 (continued)
Physical performance
EU average
2016 2017 2018
Pigs weaned/sow/year 27.11 27.60 27.77
Pigs reared/sow/year 26.28 26.75 26.88
Pigs sold/sow/year 25.54 26.00 26.09
Litters/sow/year 2.30 2.30 2.29
Rearing mortality (%) 3.02 3.07 3.21
Finishing mortality (%) 2.80 2.79 2.92
Finishing daily liveweight Gain (g/day) 815 819 829
Finishing feed conversion ratio 2.83 2.83 2.83
Average liveweight at slaughter (kg) 119 120 120
Average carcase weight – cold (kg) 91.6 92.3 92.8
Carcase meat production/sow/year (kg) 2,334 2,393 2,415
Pigs weaned per sow per year The overall average number of pigs weaned per sow per year in the EU InterPIG countries showed a nearly 1% increase in 2018, up from 27.88 in 2017 to 28.12 in 2018. As shown in Figure 5, performance improved in most EU countries, with Great Britain’s outdoor herds showing a decrease of 3% compared with 2017. Denmark and the Netherlands had the best results for pigs weaned, with Denmark yet again achieving an average of over 33 pigs weaned per sow per year. Most non-EU countries continued to perform below the EU average, but Brazil (MT) increased by 5% to perform just above.Excluding Great Britain’s outdoor herds, there is a difference of 8.8 pigs weaned per sow per year between the worst-performing EU InterPIG member country (Austria at 24.79) and the best-performing country (Denmark at 33.57).The number of pigs weaned per sow per year in Great Britain indoor herds increased by 1% to 27.35, compared with 26.97 in 2017. Great Britain’s outdoor herds were affected by the hot weather and pigs weaned per sow per year decreased to 23.22, compared with 23.95 in 2017.While Great Britain has a significant proportion of sows kept outdoors, the lower number of pigs weaned per sow per year in all systems is still a major cause of the relatively high cost of production compared with many other EU countries and needs to be addressed if Great Britain want to be competitive with the rest of Europe.Pigs weaned per sow per year is a result of three different elements: pigs born alive per litter, litters per sow per year and pre-weaning mortality.
● Great Britain’s indoor herds averaged 2.28 litters per sow per year, compared with 2.30 in 2017. Outdoor herds averaged 2.20 in 2018, compared with 2.28 in 2017, with the weather having an effect. The EU average of 2.29 hides a variation, with a range in indoor herds from 2.23 (Finland and Sweden) to the highest at 2.35 (Netherlands)
● Pre-weaning mortality (indoor sows 11.6%; outdoor sows 12.7%) was lower than in 2017 and lower than the EU average of 13.2%
● A significant impact on pigs weaned per sow per year in Great Britain is the number of pigs born alive per litter. The 2018 average for indoor sows, at 13.6, was an increase, compared with 13.3 in 2017. Outdoor sows performed the same as 2017, with an average of 12.1 pigs alive per litter. The 2018 average for participating EU countries was 14

19
Pigs finished per sow per yearAs shown in Figure 6, the average number of pigs finished per sow in Great Britain increased in indoor herds by 1% to 25.41, compared with 25.23 in 2017. For outdoor sows, pigs finished per sow per year decreased in 2018 by 4% to 21.57, compared with 22.41 in 2017.In 2018, the EU average for pigs finished per sow per year was 26.44 – 1% higher than in 2017. Denmark has the highest numbers, finishing more than 31 pigs per sow per year. Within the InterPIG group, Great Britain outdoor herds have the lowest number of pigs finished per sow per year in 2018.
Figure 5. Pigs weaned per sow per year, 2017–2018
17 18 19 20 21 22 23 24 25 26 27 28 29 30 31 32 33 34 35
Pigs
wea
ned
per s
ow
2017 2018
GB(OUT)
CAN AUS ITA HUN USA SWE GB(IN)
SPA FIN BRA(SC)
IRE FRA BRA(MT)
BEL GER NL DEN
24.9
24
.8
26.3
24
.7
24.0
23
.2
26.4
26
.8
25.5
25
.7
24.8
25
.1
27.0
27
.5
27.0
27
.4
26.6
26
.8
28.5
28
.5
27.7
27
.9
27.1
27
.5
27.4
28.7
28.1
28
.5
30.2
30
.6
33.3 33
.6
29.7
30
.1
29.8
29
.6
Figure 6. Pigs finished per sow per year, 2017–2018
17 16
18 19 20 21 22 23 24 25 26 27 28 29 30 31 32 33 34 35
Pigs
fini
shed
per
sow
2017 2018
23.2
23
.3
24.9
23
.3
22.4
21
.6
24.1
24
.5
24.0
24
.3
23.7
23
.7
25.7
25
.8
25.2
25
.4
25.1
25
.2 26
.4
26.7
26.3
26
.6
25.8
26
.1
26.3
27.2
27.0
27
.0
28.8
29
.0
31.3
31
.4
28.0
28
.5
27.8
27
.3
GB(OUT)
CAN ITA AUS HUN USA SPA GB(IN)
SWE FIN FRA BRA(SC)
IRE BRA(MT)
BEL GER NL DEN

20
Table 8. Physical performance of outdoor herds in GB and Denmark, 2018
Physical performance 2018
GB (OUT) DEN (OUT)*
Pigs weaned/sow/year 23.22 26.22
Pigs weaned/litter 10.54 12
Litters/sow/year 2.20 2.19
Rearing mortality (%) 4.1 3.1
Finishing mortality (%) 3.2 5.0
Transfer weight from rearing to finishing unit (kg) 36.2 30.0
Rearing daily liveweight gain (g/day) 469 504
Rearing feed conversion ratio 1.7 1.96
Finishing daily liveweight gain (g/day) 866 954
Finishing feed conversion ratio 2.8 2.9
Average carcase weight – cold (kg) 83.2 86.8
Sow feed/sow/year (kg) 1,392 1,850
*Small dataset
Comparison between outdoor herds in GB and Denmark, 2018Table 8 is a comparison between GB outdoor herds and a small dataset provided by Denmark. Although Denmark is achieving more pigs weaned per sow per year, the herds in Great Britain perform better in some areas, such as sow feed use and rearing mortality. Denmark moves its piglets on from rearing to the finishing stage at lower weights than Great Britain and carcase weights are higher.The cost of production in Great Britain for outdoor-bred piglets is estimated at £1.52 per deadweight kg. AHDB does not have the cost of production for outdoor herds in Denmark, but if the physical performance figures for Denmark are applied to the GB cost of production model, the cost of production in Denmark is calculated to be £1.55 per deadweight kg.

21
Appendix 1Table 9. InterPIG members’ pig industry trends, 2018
Pig industry trends, 2018
AUS BEL BRA CAN CZE DEN FIN FRA GER
Breeding sow numbers (000 head)
228 408 2,950 1,240 133 1,269 95 979 1,859
Annual pig slaughterings(000 head)
5,152 11,231 40,150 21,562 2,310 18,086 1,811 23,491 56,609
Pig meat production(000 tonnes)
510 1,073 3,763 1,955 211 1,581 167 2,182 5,343
Pig meat imports(000 tonnes cwe)* 181 178 2 225 360 134 38 510 1,143
Pig meat exports(000 tonnes cwe)* 236 823 645 1,045 75 1,381 22 512 2,374
Pig meat consumption(000 tonnes cwe)*
454 428 3,120 1,135 496 335 183 2,179 4,112
Pig meat consumption(kg per head)*
51.5 37.5 14.91 30.2 46.6 59.7 33.2 32.5 49.7
HUN IRE ITA NL POL SP SWE UK USA
Breeding sow numbers (000 head)
260 147 588 1,051 871 2,498 130 491 6,179
Annual pig slaughterings(000 head)
4,705 3,447 11,251 15,915 22,650 52,289 2,646 10,936 124,435
Pig meat production(000 tonnes)
436 303 1,471 1,536 2,082 4,530 249 927 11,943
Pig meat imports(000 tonnes cwe)* 233 159 1,121 319 807 169 116 1,072 482
Pig meat exports(000 tonnes cwe)* 175 283 274 1,205 789 1,907 30 268 2,165
Pig meat consumption(000 tonnes cwe)*
493 178 2,318 650 2,101 2,792 335 1,730 10,260
Pig meat consumption(kg per head)*
50.5 37 38.3 37.8 55.3 59.8 33.1 26.0 31.4
*Estimated figures cwe = carcase weight equivalent Breeding sow numbers are for mid-2018 except for Brazil, Czech Republic, Finland (Dec 18)Sources: AHDB, IHS Maritime & Trade- Global Trade Atlas®, USDA, Eurostat

22
Table 10. Ranking of EU production costs, 2013–2018
Ranking of EU production costs
2013 2014 2015 2016 2017 2018 % of EU average
Spain 1 1 1 1 2 1 87.0
Denmark 2 2 3 3 1 2 87.0
Belgium 3 3 2 2 3 3 90.1
France 4 4 4 4 4 4 92.6
Netherlands 5 5 6 8 6 5 94.7
Hungary 13 12 14 10 9 6 100.1
Germany 8 6 5 6 7 7 100.2
GB (IN) 6 7 10 5 5 8 100.9
Ireland 10 9 8 9 11 9 102.8
GB (OUT) 9 10 13 7 8 10 104.7
Sweden 12 13 11 13 12 11 106.2
Austria 7 8 7 11 10 12 107.0
Finland na 11 9 12 13 13 108.3
Italy 11 14 12 14 14 14 118.5
Note: Rankings – 1 = lowest cost; 14 = highest cost
Additional tables and figuresLabels on bar charts are rounded and may indicate the same results when the bars do not appear equal.
23
UK
penc
e
Euro
Jan-13 Jan-14 Jan-18Jan-17Jan-16Jan-15 Jan-19
9692888480767268
100
64
UK
penc
e
US dollar
Jan-13 Jan-14 Jan-18Jan-17Jan-16Jan-15 Jan-19
76726864605652
8082
UK
penc
e
Canadian dollar
Jan-13 Jan-14 Jan-18Jan-17Jan-16Jan-15 Jan-19
96
92
88
84
80
76
100
64
UK
penc
e
Brazilian real
Jan-13 Jan-14 Jan-18Jan-17Jan-16Jan-15 Jan-19
32
28
24
20
36
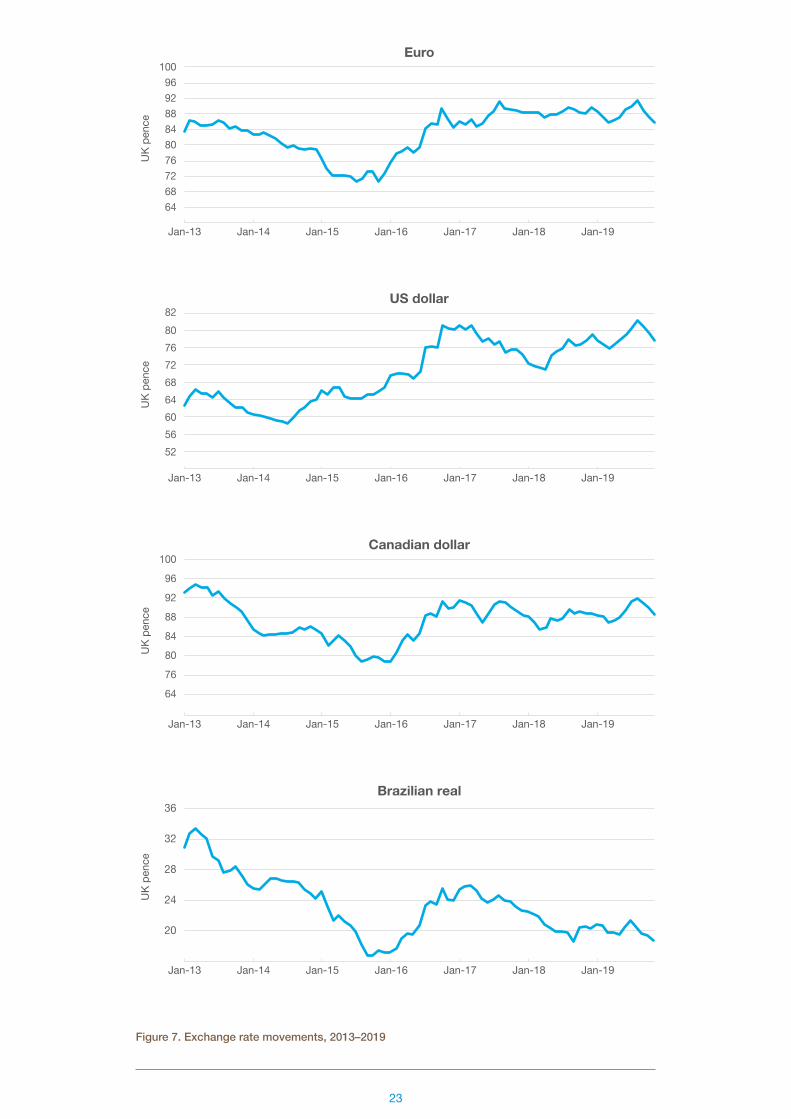
Figure 7. Exchange rate movements, 2013–2019

24
Table 11. Annual exchange rates
Year 1€ = € to £ $US to £ $C to £ Real to £
2013 84.9p 1.177 1.56 1.61 3.36
2014 80.6p 1.240 1.65 1.82 3.87
2015 72.6p 1.377 1.53 1.95 5.01
2016 81.9p 1.221 1.35 1.79 4.66
2017 87.6p 1.141 1.29 1.67 4.11
2018 88.5p 1.130 1.34 1.73 4.87
£/kg
2017 2018
0.11
0.
11
0.11
0.
09
0.09
0.
09
0.13
0.15
0.11
0.
12
0.11
0.
12
0.19
0.
18
0.18
0.
18
0.17
0.
17 0.18
0.20
0.20
0.
20
0.18
0.
18
0.21
0.
22
0.19
0.20
0.27
0.
27
0.32
0.
31
0.28
0.
26
0.22
0.
22
0.00
0.05
0.10
0.15
0.20
0.25
0.30
0.35
CAN BRA(SC)
BRA(MT)
SPA USA GB(OUT)
BEL DEN NL FRA IRE HUN GB(IN)
GER ITA FIN AUS SWE
Figure 8. Depreciation and finance costs, 2017–2018

25
The average Daily Liveweight Gain (DLG) and Feed Conversion Ratio (FCR) figures for indoor- and outdoor-bred piglets in Great Britain are the same because there is significant variation in the range of performance within various rearing and finishing systems (slatted, semi-slatted, straw barn, outdoor options). The available dataset has insufficient detail to split the data into multiple production systems and piglet backgrounds, so the average across the dataset has been used.
gram
s/da
y
2017 2018
500
550
600
650
700
750
800
850
900
950
1,000
HUN BEL SPA FRA AUS BRA(SC)
NL GER USA GB(IN)
GB(OUT)
CAN BRA(MT)
IRE SWE DEN FIN ITA
694 700 71
0 69
6
687
690
810
805
803
803
701
726
832 84
2
822 82
9
820 827 833
866
833
866
857
860
831
880
876
876
971
975
970 98
0
941 946
866 88
5
Figure 9. Daily liveweight gains (finishing herds), 2017–2018
Figure 10. Feed conversion ratios (finishing herds), 2017–2018
2017 2018
3.00
3.
00
3.04
3.14
3.75
3.
74
2.81
2.
79 2.87
2.
85
2.86
2.
87
2.76
2.
78 2.86
2.
79
2.86
2.
79
2.70
2.
70
2.66
2.
72
2.77
2.
75
2.66
2.
63 2.71
2.
68
2.46
2.
48 2.
60
2.44
2.60
2.
50 2.58
2.
56
2.00
2.20
2.40
2.60
2.80
3.00
3.20
3.40
3.60
3.80
4.00
ITA HUN CAN AUS SWE GER GB(IN)
GB(OUT)
BEL FRA IRE FIN USA DEN NL BRA(MT)
SPA BRA(SC)
kg

26
Standardising the physical resultsMethodologyThere is a wide variation in physical performance measures reported by InterPIG countries. Some of these variations could be due to differences between countries in the weight of animals produced. Other things being equal, an increase in slaughter weights and the length of time an animal is in the system will lead to a worsening in both the marginal daily liveweight gain (DLG) and the marginal feed conversion ratio (FCR).Using methodology created by our French InterPIG partner ITP, the figures have been standardised on the basis of three weights:
● Transfer from breeding unit to rearing unit: 8 kg (GB (IN) = 7.1; GB (OUT) = 7.5 kg in 2018) ● Transfer from rearing unit to finishing unit: 30 kg (GB = 36.2 kg) ● Liveweight at slaughter: 120 kg (GB (IN) = 109.6; GB (OUT) = 109.0 kg in 2018)
This section examines the adjustments made to the finishing FCR and DLG figures in the European InterPIG countries to exclude the differences caused by variations in national transfer and slaughter weights.
Figure 11. Carcase meat production per sow per year, 2017–2018
kg/s
ow
2017 2018
2,11
0 2,
124
2,10
3 2,
094
1,85
9 1,
793
2,24
5 2,
252 2,34
6 2,
226
2,08
1 2,
129
2,30
4 2,
338
2,28
5 2,
326
2,28
7 2,
280 2,
390
2,40
1
2,32
6 2,
365 2,
485
2,35
0
2,62
0 2,
615
2,41
4 2,
448
2,70
8 2,
738
3,12
6 3,
187
2,68
3 2,
704
2,63
4 2,
695
1,200
1,400
1,600
1,800
2,000
2,200
2,400
2,600
2,800
3,000
3,200
3,400
GB(OUT)
HUN GB(IN)
SPA BRA(MT)
AUS USA IRE SWE CAN FIN BRA(SC)
FRA BEL GER DEN NL ITA

27
Live
wei
ght g
ains
(gra
ms/
day)
Acual Standardised
500
550
600
650
700
750
800
850
900
950
1,000
880
864
700
787 80
5 820
975
949
876
903
827
821 84
2 849
803
802
980
917
885
696
866
839
866
839
690
814
727
831
946
878
860
825
726 74
1
829 85
3
AUS BEL BRA(MT)
BRA(SC)
CAN DEN FIN FRA GER GB(IN)
GB(OUT)
HUN IRE ITA NL SPA SWE USA
Figure 12. Standardised daily liveweight gains (finishing herds), 2018
Feed
con
vers
ion
ratio
s
Actual Standardised
2.50
2.
76
2.78
2.
57
2.87
2.
75
2.63
2.76
3.00
2.
84
2.44
2.
64
2.79
2.
75
2.75
2.
75
2.70
2.
90
3.14
3.
11
2.79
2.88
2.79
2.88
3.74
3.01
2.72
2.85
2.85
3.
05
2.68
2.
91
2.48
2.
76
2.56
2.
56
AUS BEL BRA(MT)
BRA(SC)
CAN DEN FIN FRA GER GB(IN)
GB(OUT)
HUN IRE ITA NL SPA SWE USA 2.0
2.2
2.4
2.6
2.8
3.0
3.2
3.4
3.6
3.8
4.0
Figure 13. Standardised feed conversion ratios (finishing herds), 2018

28
Table 12. GB and EU physical results, 2018
Physical results – GB and EU
GB indoor
GB outdoor
GB Overall60% indoor: 40% outdoor
EU average
GB overall difference with
EU average
Pigs weaned/sow/year 27.4 23.2 25.7 27.8 -7
Pigs reared/sow/year 26.2 22.3 24.7 26.9 -8
Pigs sold/sow/year 25.4 21.6 23.9 26.1 -9
Pigs born alive/litter 13.6 12.1 13.0 14.0 -7
Pigs weaned/litter 12.0 10.5 11.4 12.1 -6
Litters/sow/year 2.28 2.20 2.2 2.29 -2
Sow mortality (%) 6.1% 5.0% 5.7% 6.6% -14
Pre-weaning mortality (%) 11.6% 12.7% 12.0% 13.2% -9
Rearing mortality (%) 4.1% 3.2% +26
Finishing mortality (%) 3.2% 2.9% +9
Transfer weight from breeding to rearing unit (kg) 7.1 7.5 7.2 7.2 +1
Lactation period (days) 26.3 26.5 26.4 27.3 -3
Transfer weight from rearing to finishing unit (kg) 36.2 36.2 36.2 30.3 +20
Rearing daily liveweight gain (g/day) 469 469 469 424 +11
Rearing feed conversion ratio 1.7 1.7 1.7 1.8 -3
Finishing daily liveweight gain (g/day) 866 866 866 829 +4
Finishing feed conversion ratio 2.8 2.8 2.8 2.8 -1
Average number of days in rearing unit 62 61 62 54 +14
Average number of days in finishing unit 85 84 84 111 -24
Empty finishing unit days per cycle 7 7 7 10 -27
Pigs/pig place/year (finishing) 4.0 4.0 4.0 3.2 +25
Average live weight at slaughter (kg) 109.6 109.0 109.3 120.3 -9
Average carcase weight – cold (kg) 83.6 83.2 83.4 92.8 -10
Killing-out percentage (cold weight) 76.3% 77.1% -1
Carcase meat production/ sow/year (kg) 2,124 1,793 1,992 2,415 -18
Sow feed/sow/year (kg) 1,280 1,392 1,325 1,332 -1
Weaner/rearer feed/reared pig (kg) 50 50 50 41 +21
Finishing pigs feed consumption/slaughter (kg) 207 205 206 260 -21
GB Overall is an average of GB indoor- and outdoor-bred, with a weighting of 60% indoor and 40% outdoor for sow performance.

29
Appendix 2List of tables and charts
6 Table 1. Average costs of production, 2013—2018 (£ per kg dw)
7 Table 2. Average costs of production, 2013—2018 (€ per kg dw)
8 Table 3. Summary of financial performance, 2018 (£ per kg dw)
10 Table 4. Compound feed prices per tonne (sterling), 2018
10 Table 5. Compound feed prices per tonne (euros), 2018
12 Table 6. Summary of financial performance, 2016—2018 (£ per kg dw)
15 Table 7. Summary of physical performance, 2016—2018
20 Table 8. Physical performance of outdoor herds in GB and Denmark, 2018
21 Table 9. InterPIG members’ pig industry trends, 2018
22 Table 10. Ranking of EU production costs, 2013—2018
24 Table 11. Annual exchange rates
28 Table 12. GB and EU physical results, 2018
5 Figure 1. Cost of production in selected countries, 2018
11 Figure 2. Changes in feed costs, 2018
11 Figure 3. Feed costs, 2018
14 Figure 4. Estimated net margins in Great Britain, 2011—2018
19 Figure 5. Pigs weaned per sow per year, 2017—2018
19 Figure 6. Pigs finished per sow per year, 2017—2018
23 Figure 7. Exchange rate movements, 2012—2018
24 Figure 8. Depreciation and finance costs, 2017—2018
25 Figure 9. Daily liveweight gains (finishing herds), 2017—2018
25 Figure 10. Feed conversion ratios (finishing herds), 2017—2018
26 Figure 11. Carcase meat production per sow per year, 2017—2018
27 Figure 12. Standardised daily liveweight gains (finishing herds), 2018
27 Figure 13. Standardised feed conversion ratios (finishing herds), 2018

30
Produced for you by:AHDB Pork Stoneleigh Park Kenilworth Warwickshire CV8 2TL
T 024 7669 2051 E [email protected] W ahdb.org.uk
@AHDB_PorkIf you no longer wish to receive this information, please email us on [email protected]
While the Agriculture and Horticulture Development Board seeks to ensure that the information contained within this document is accurate at the time of printing, no warranty is given in respect thereof and, to the maximum extent permitted by law, the Agriculture and Horticulture Development Board accepts no liability for loss, damage or injury howsoever caused (including that caused by negligence) or suffered directly or indirectly in relation to information and opinions contained in or omitted from this document.
© Agriculture and Horticulture Development Board 2020. All rights reserved.
50011 0221