2018 overseas travel survey · 2018-07-26 · ab-road overseas travel survey 2018 18-29 yrs 30-39...
TRANSCRIPT
2018 Overseas Travel Survey

2
AB-ROAD Overseas Travel Survey 20183
Index
Prologue: Outline of the Report 51) Outline of the Survey 6
2) Profile of the Respondents 7
Reference: Overseas Travel in 2017 111) Outline of the Survey 12
2) Overseas Travel in 2017 13
Part 1: Trends in Overseas Travel Booking in 2017
Chapter 1: Outline of Overseas Travel in 2017 151. Number of Overseas Trips in 2017 16
2. Destinations in 2017 17
【Reference】 Overseas destinations ever visited 20
3. Trigger for Overseas Travel in 2017 21
4. Style of Travel 22
5. Number of Accompanying Travelers 23
6. Travel Expenses 24
7. Number of Days Traveled 28
8. Purpose of Travel 299. Actions at Destination
1) Total 312) What was Included in Package Tours 323) What was Booked Prior to Departure 334) What was Booked at Destinations 34
10. Amount of Money Used at Destinations
1) Total 352) Shopping Costs 363) Meal Costs 374) Sightseeing and Activity Costs 38
11. Use of Airlines 39
Chapter 2: Actions Taken for Prior Consideration of Travel 411. Destinations Considered / Destinations Decided on 42
2. Reason for Deciding on Destinations 45
3. Degree of Involvement in Consideration Process 46
4. Timing of Travel Consideration and Booking 47
5. Sources of Information Used to Compare for Consideration 50
Chapter 3: Process of Package Tour Selection 511. Use of Package Tours 52
2. Reasons for Selection of Package Tour 53
3. Source of Information from Which Package Tour was Found 54
4. Points Considered Important When Selecting Package 55
5. Means of Inquiring to Travel Agencies and Airlines 56
6. Means of Booking with Travel Agencies and Airlines 57
Chapter 4: Process of Arranged Travel Selection 591. Matters Arranged Prior to Departure 60
2. Sources of Information Used to Find Air Tickets 61
3. Key Factors When Choosing Airlines 62
AB-ROAD Overseas Travel Survey 20184
Index
Part 2: Satisfaction with Travel Destinations 631. Satisfaction with Travel Destinations
1) Overall 64
2) Sightseeing / Viewing 65
3) Sports / Hands-on Activities 66
4) Meals 67
5) Shopping 68
6) Relaxation / Beauty Treatments and Massages 69
7) Local Hospitality 70
8) Safety / Hygiene 71
9) Nightlife 72
Part 3: Future Overseas Travel 731. Countries / Areas Wish to Travel to Overseas in Future 74
2. Countries / Areas Wish to Travel to Overseas in 2018 76
3. [Reference] Destination would like to travel to 77
5
Prologue
Outline of the Report
AB-ROAD Overseas Travel Survey 2018
18-29 yrs 30-39 yrs 40-49 yrs 50-59 yrs 60 yrs+
Male 1.10765974 0.91670177 0.80272950 0.78656379 1.02916549
Female 1.12752382 1.10460628 1.10231553 1.13344618 1.15559906
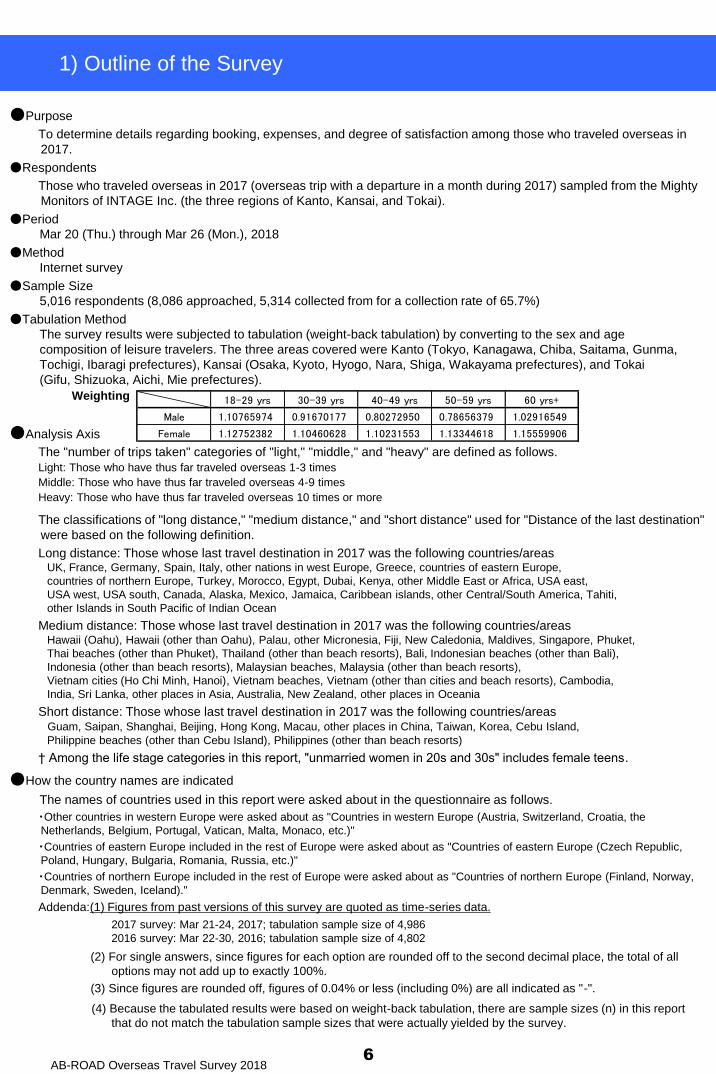
●Purpose
To determine details regarding booking, expenses, and degree of satisfaction among those who traveled overseas in
2017.
●Respondents
Those who traveled overseas in 2017 (overseas trip with a departure in a month during 2017) sampled from the Mighty
Monitors of INTAGE Inc. (the three regions of Kanto, Kansai, and Tokai).
●Period
Mar 20 (Thu.) through Mar 26 (Mon.), 2018
●Method
Internet survey
●Sample Size
5,016 respondents (8,086 approached, 5,314 collected from for a collection rate of 65.7%)
●Tabulation Method
The survey results were subjected to tabulation (weight-back tabulation) by converting to the sex and age
composition of leisure travelers. The three areas covered were Kanto (Tokyo, Kanagawa, Chiba, Saitama, Gunma,
Tochigi, Ibaragi prefectures), Kansai (Osaka, Kyoto, Hyogo, Nara, Shiga, Wakayama prefectures), and Tokai
(Gifu, Shizuoka, Aichi, Mie prefectures).
Weighting
●Analysis Axis
The "number of trips taken" categories of "light," "middle," and "heavy" are defined as follows.
Light: Those who have thus far traveled overseas 1-3 times
Middle: Those who have thus far traveled overseas 4-9 times
Heavy: Those who have thus far traveled overseas 10 times or more
The classifications of "long distance," "medium distance," and "short distance" used for "Distance of the last destination"
were based on the following definition.
Long distance: Those whose last travel destination in 2017 was the following countries/areasUK, France, Germany, Spain, Italy, other nations in west Europe, Greece, countries of eastern Europe,
countries of northern Europe, Turkey, Morocco, Egypt, Dubai, Kenya, other Middle East or Africa, USA east,
USA west, USA south, Canada, Alaska, Mexico, Jamaica, Caribbean islands, other Central/South America, Tahiti,
other Islands in South Pacific of Indian Ocean
Medium distance: Those whose last travel destination in 2017 was the following countries/areasHawaii (Oahu), Hawaii (other than Oahu), Palau, other Micronesia, Fiji, New Caledonia, Maldives, Singapore, Phuket,
Thai beaches (other than Phuket), Thailand (other than beach resorts), Bali, Indonesian beaches (other than Bali),
Indonesia (other than beach resorts), Malaysian beaches, Malaysia (other than beach resorts),
Vietnam cities (Ho Chi Minh, Hanoi), Vietnam beaches, Vietnam (other than cities and beach resorts), Cambodia,
India, Sri Lanka, other places in Asia, Australia, New Zealand, other places in Oceania
Short distance: Those whose last travel destination in 2017 was the following countries/areas Guam, Saipan, Shanghai, Beijing, Hong Kong, Macau, other places in China, Taiwan, Korea, Cebu Island,
Philippine beaches (other than Cebu Island), Philippines (other than beach resorts)
† Among the life stage categories in this report, "unmarried women in 20s and 30s" includes female teens.
●How the country names are indicated
The names of countries used in this report were asked about in the questionnaire as follows.
・Other countries in western Europe were asked about as "Countries in western Europe (Austria, Switzerland, Croatia, the
Netherlands, Belgium, Portugal, Vatican, Malta, Monaco, etc.)"
・Countries of eastern Europe included in the rest of Europe were asked about as "Countries of eastern Europe (Czech Republic,
Poland, Hungary, Bulgaria, Romania, Russia, etc.)"
・Countries of northern Europe included in the rest of Europe were asked about as "Countries of northern Europe (Finland, Norway,
Denmark, Sweden, Iceland)."
Addenda:(1) Figures from past versions of this survey are quoted as time-series data.
2017 survey: Mar 21-24, 2017; tabulation sample size of 4,986
2016 survey: Mar 22-30, 2016; tabulation sample size of 4,802 ;
(2) For single answers, since figures for each option are rounded off to the second decimal place, the total of all
options may not add up to exactly 100%.
(3) Since figures are rounded off, figures of 0.04% or less (including 0%) are all indicated as "-".
(4) Because the tabulated results were based on weight-back tabulation, there are sample sizes (n) in this report
that do not match the tabulation sample sizes that were actually yielded by the survey.
6
1) Outline of the Survey
AB-ROAD Overseas Travel Survey 2018
Sample
Jan. Feb. Mar. Apr. May Jun. Jul. Aug. Sept. Oct. Nov. Dec.
Year-end &New
Year'stotal
GWtotal
Obontotal
SWtotal
2018 survey total 5,016 5.0 5.0 6.2 5.4 6.4 6.2 5.9 11.5 10.4 11.0 11.7 15.2 7.7 3.5 3.3 1.6
2017 survey total 4,986 4.8 4.8 6.0 4.4 6.3 6.2 7.8 11.8 11.8 11.3 9.9 14.9 7.5 3.3 3.2 2.0
0
5
10
15
20
2018 survey total
2017 survey total
(%)
(%)
KitaKanto
4prefectures
KeihanshinOtherKinki
2018 survey total 5,016 61.2 4.1 57.1 13.9 24.9 21.7 3.3
2017 survey total 4,986 60.9 3.9 57.1 14.3 24.8 21.3 3.5
Sample
TokaiKanto
Total
Kansai
Total
Male Female
●Legend
2018 survey total (n=5,016)
2017 survey total (n=4,986)
50.9%
51.3
49.1
48.7
20s and
under30s 40s 50s
60s and
over
●Legend
2018 survey total (n=5,016) 45.7
2017 survey total (n=4,986) 45.5
Average
(yrs)
20.4%
19.6
18.9
19.8
20.7
22.0
18.4
17.0
21.7
21.7
(%)
No children
Youngest
child 6 yrs
or younger
Youngest
child 7 yrs
or older
No children
Youngest
child 6 yrs
or younger
Youngest
child 7 yrs
or older
5,016 16.8 9.4 3.7 21.0 19.0 10.3 3.2 16.6
4,986 16.6 10.4 4.2 20.1 19.1 9.8 3.4 16.5
Male 2,552 33.1 18.4 7.3 41.2 - - - -
Female 2,464 - - - - 38.7 21.0 6.5 33.7
Male 18-29 yrs 371 77.6 12.8 7.5 2.1 - - - -
Male 30-39 yrs 483 44.8 26.8 19.2 9.3 - - - -
Male 40-49 yrs 584 34.8 22.8 9.6 32.7 - - - -
Male 50-59 yrs 513 20.1 20.7 1.1 58.1 - - - -
Male 60 yrs or older 601 5.7 8.9 0.5 84.9 - - - -
Female 18-29 yrs 651 - - - - 70.5 21.0 7.6 0.9
Female 30-39 yrs 465 - - - - 48.7 29.2 16.2 5.9
Female 40-49 yrs 453 - - - - 28.7 32.8 7.3 31.1
Female 50-59 yrs 408 - - - - 19.7 17.5 0.3 62.5
Female 60 yrs or older 488 - - - - 12.1 5.2 0.5 82.2
Unmarried
MaleSample
Sex & age
Sex
Married Male
Unmarried
Female
Married Female
2018 survey total
2017 survey total
7
2) Profile of the Respondents (1)
(%)
Officeworkers/
General(clerical)
Office
workers/General
(researchor
technical)
Officeworkers/
General(sales)
Officeworkers/
General(others)
Office
workers/Manager
class,company
directors
2018 survey total 5,016 20.1 8.3 5.6 6.6 8.3 4.6 4.2 2.7 10.2 4.8 14.0 9.3 1.2
2017 survey total 4,986 19.2 8.5 6.1 6.0 9.1 4.6 4.3 2.3 9.2 5.0 15.3 9.4 1.1
Sample
Office workers
Civil
servants /
Educators
OtherSelf-
employedFreelance
Part-timers
StudentsFull-time
homemakerUnemployed
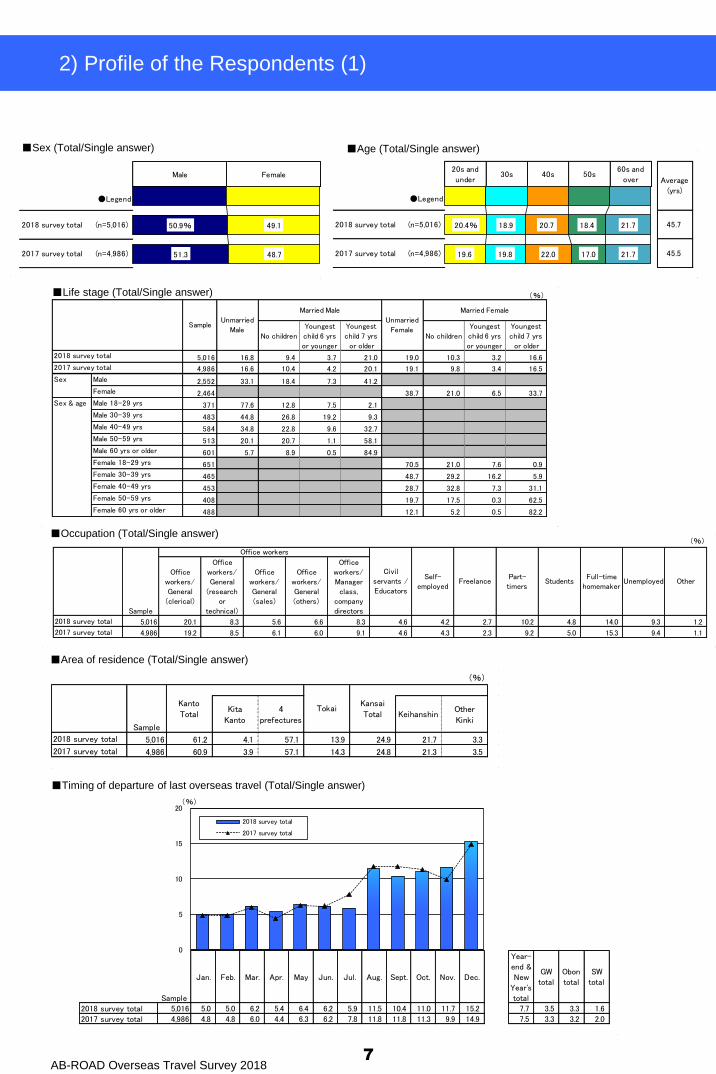
■Age (Total/Single answer)■Sex (Total/Single answer)
■Life stage (Total/Single answer)
■Timing of departure of last overseas travel (Total/Single answer)
■Area of residence (Total/Single answer)
■Occupation (Total/Single answer)
AB-ROAD Overseas Travel Survey 2018
Once 2-3 times 4-6 times 7-9 times10 times or
more
●Legend
2018 survey total (n=5,016) 17.2
2017 survey total (n=4,986) 16.3
Sex Male (n=2,552) 18.1
Female (n=2,464) 16.2
Sex & age Male 18-29 yrs (n=371) 7.0
Male 30-39 yrs (n=483) 10.9
Male 40-49 yrs (n=584) 16.8
Male 50-59 yrs (n=513) 25.6
Male 60 yrs or older (n=601) 25.5
Female 18-29 yrs (n=651) 7.9
Female 30-39 yrs (n=465) 13.7
Female 40-49 yrs (n=453) 19.6
Female 50-59 yrs (n=408) 21.6
Female 60 yrs or older (n=488) 22.1
Area of
residenceKanto (n=3,070) 18.2
Kansai (n=1,251) 15.9
Tokai (n=696) 15.0
Life
stageWorker (child 7 yrs and over) (n=1,882) 19.4
Worker (child 2-6 yrs) (n=215) 13.4
Worker (child 1 yr and under) (n=127) 12.7
Worker (married, no children) (n=987) 17.6
Worker (unmarried) (n=1,564) 16.6
Unmarried male (n=844) 16.1
Unmarried female 20s/30s (n=685) 10.3
Unmarried female 40s and over (n=269) 26.2
Student (n=242) 7.3
Number of
trips takenLight (n=891) 2.0
Middle (n=1,181) 6.0
Heavy (n=2,944) 26.2
Average
(times)
5.8%
5.8
6.6
4.9
20.0
9.7
4.7
2.1
1.4
11.4
5.2
3.4
0.3
1.2
5.4
5.7
7.4
2.1
6.7
10.6
7.1
6.9
10.8
8.2
1.2
17.9
32.4
―
―
12.0
11.3
13.0
11.0
27.5
20.9
11.4
6.1
5.1
24.1
10.5
4.6
4.7
5.2
11.3
13.2
13.0
7.0
13.3
17.0
12.1
14.0
18.2
19.5
3.8
34.2
67.6
―
―
15.0
16.5
15.8
14.1
22.7
20.9
17.7
11.0
9.6
23.1
16.4
8.5
10.3
8.5
14.5
15.2
16.7
13.1
15.2
18.8
13.8
16.5
18.1
20.8
6.2
22.6
―
63.6
―
8.6
8.6
7.7
9.5
6.9
8.3
7.4
8.0
7.7
10.1
10.2
7.3
9.2
10.2
7.9
9.8
9.2
9.2
9.8
10.9
7.8
8.6
7.2
9.5
6.7
4.2
―
36.4
―
58.7
57.8
57.0
60.5
23.0
40.2
58.7
72.7
76.2
31.4
57.7
76.2
75.6
74.9
60.9
56.0
53.7
68.6
55.0
42.7
59.3
54.1
45.6
42.0
82.1
21.1
―
―
100.0
8
2) Profile of the Respondents (2)
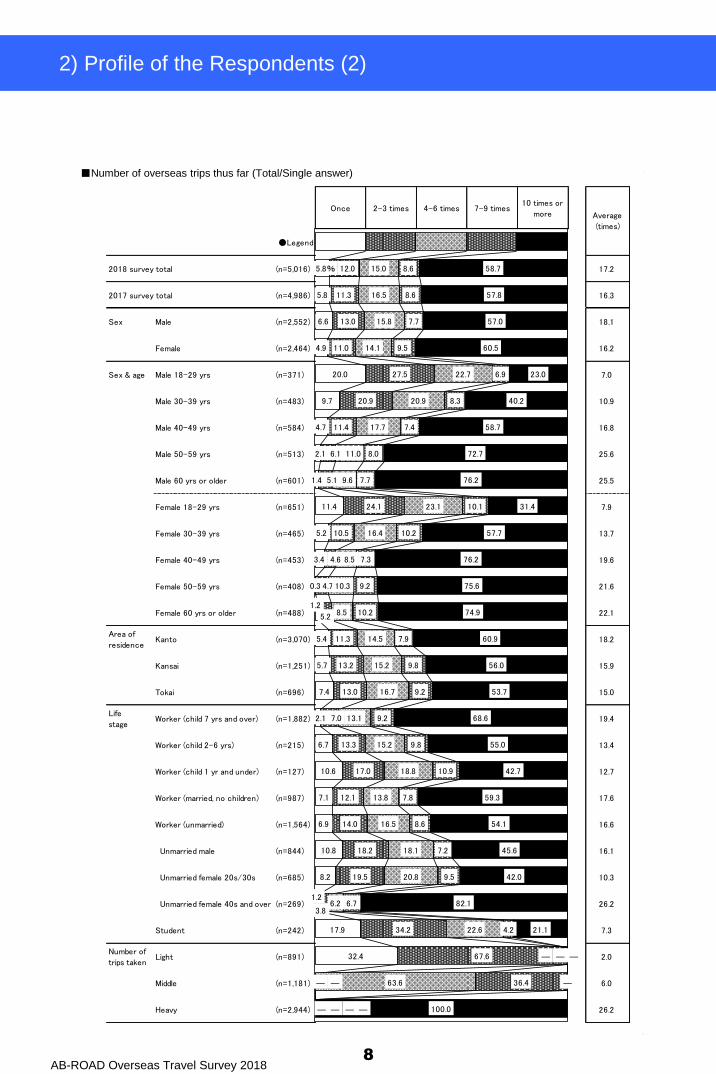
■Number of overseas trips thus far (Total/Single answer)
AB-ROAD Overseas Travel Survey 2018
(%)
TOTAL
Sample
Europe UK France Germany Spain Italy
Other
countries
in western
Europe
Other
places in
Europe
Middle
East
or Africa
Turkey
Other
Middle
East or
Africa
USA
(excluding
Hawaii and
Alaska)
USA east USA westUSA
south
Canada or
AlaskaCanada Alaska
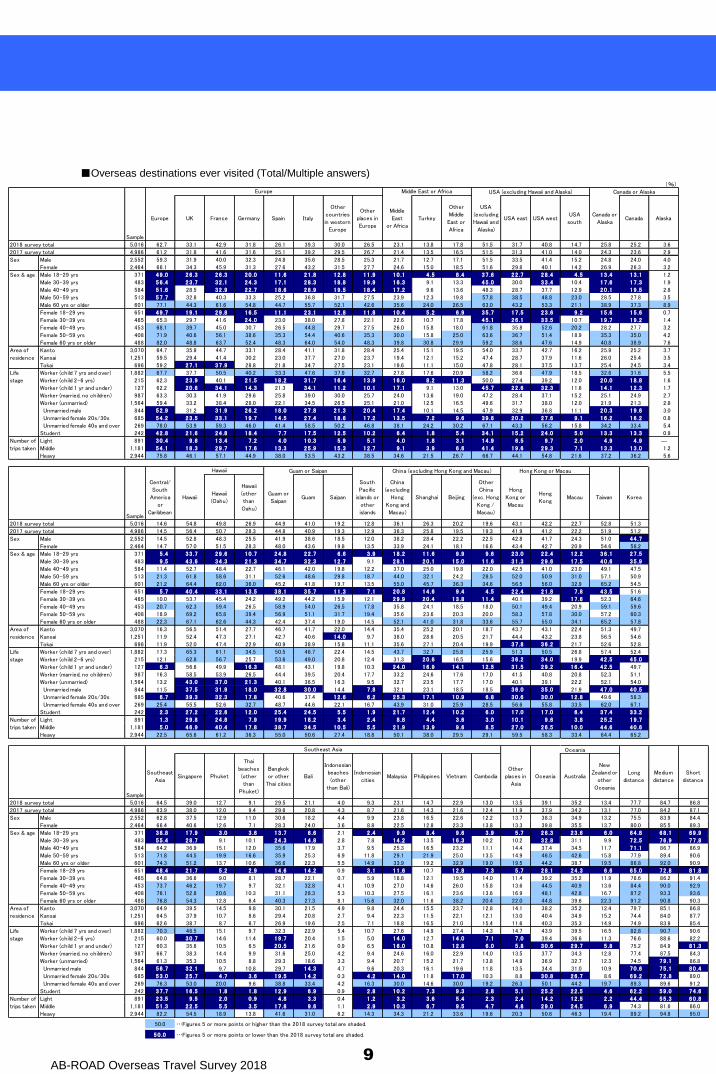
TOTAL2018 survey total 5,016 62.7 33.1 42.9 31.8 26.1 39.3 30.0 26.5 23.1 13.8 17.8 51.5 31.7 40.8 14.7 25.8 25.2 3.6
2017 survey total 4,986 61.2 31.8 41.6 31.6 25.1 39.2 29.5 26.7 21.4 13.5 16.5 51.5 31.3 41.0 14.0 24.3 23.6 2.9
男性 Male 2,552 59.3 31.9 40.0 32.3 24.8 35.6 28.5 25.3 21.7 12.7 17.1 51.5 33.5 41.4 15.2 24.8 24.0 4.0
女性 Female 2,464 66.1 34.3 45.9 31.3 27.6 43.2 31.5 27.7 24.6 15.0 18.5 51.6 29.8 40.1 14.2 26.9 26.3 3.2
男性 18-29歳Male 18-29 yrs 371 49 .0 26 .3 26 .3 20 .0 11 .6 21 .8 12 .8 11 .9 10 .1 4 .5 8 .4 37 .6 22 .7 28 .4 4 .5 13 .4 13 .1 1.2
男性 30-39歳Male 30-39 yrs 483 56 .4 23 .7 32 .1 24 .3 17 .1 28 .3 18 .8 19 .9 16 .3 9.1 13.3 45 .0 30.0 33 .4 10.4 17 .6 17 .3 1.9
男性 40-49歳Male 40-49 yrs 584 51 .6 28.5 32 .9 22 .7 18 .6 28 .9 19 .5 18 .4 17 .2 9.6 13.6 48.3 28.7 37.7 12.9 20 .1 19 .5 2.8
男性 50-59歳Male 50-59 yrs 513 57 .7 32.8 40.3 33.3 25.2 36.8 31.7 27.5 23.9 12.3 19.8 57.8 38.5 48.8 23.0 28.5 27.8 3.5
男性 60歳以上Male 60 yrs or older 601 77.1 44.3 61.6 54.8 44.7 55.7 52.1 42.6 35.6 24.0 26.5 63.0 43.2 53.3 21.1 38.9 37.3 8.9
女性 18-29歳Female 18-29 yrs 651 49 .7 19 .1 29 .8 16 .5 11 .1 23 .1 12 .8 11 .8 10 .4 5 .2 6 .9 35 .7 17 .5 23 .6 9 .2 15 .6 15 .6 0.7
女性 30-39歳Female 30-39 yrs 465 65.3 29.7 41.6 24 .0 23.0 38.0 27.8 22.1 22.6 10.7 17.8 45 .1 26 .1 33 .5 10.7 19 .7 19 .2 1.4
女性 40-49歳Female 40-49 yrs 453 68.1 39.7 45.0 30.7 26.5 44.8 29.7 27.5 26.0 15.8 18.0 61.8 35.8 52.6 20.2 28.2 27.7 3.2
女性 50-59歳Female 50-59 yrs 408 71.9 40.6 56.1 38.6 35.3 54.4 40.6 35.3 30.0 15.8 25.0 63.6 36.7 51.4 18.9 35.3 35.0 4.2
女性 60歳以上Female 60 yrs or older 488 82.0 48.8 63.7 52.4 48.3 64.0 54.0 48.3 39.8 30.8 29.9 59.2 38.6 47.6 14.9 40.8 38.9 7.6
関東 Kanto 3,070 64.7 35.9 44.7 33.1 28.4 41.1 31.8 28.4 25.4 15.1 19.5 54.0 33.7 42.7 16.2 25.9 25.2 3.7
関西 Kansai 1,251 59.5 29.4 41.4 30.2 23.0 37.7 27.0 23.7 19.4 12.1 15.2 47.4 28.7 37.9 11.6 26.0 25.4 3.5
東海 Tokai 696 59.2 27 .1 37 .9 28.8 21.8 34.7 27.5 23.1 19.6 11.1 15.0 47.8 28.1 37.5 13.7 25.4 24.5 3.4
社会人(子供7歳以上)Worker (child 7 yrs and over) 1,882 67.7 37.7 50.5 40.2 33.3 47.6 37.9 32.7 27.8 17.6 20.9 58.2 36.6 47.9 18.5 32.6 31.6 5.5
社会人(子供2~6歳)Worker (child 2-6 yrs) 215 62.3 23 .9 40.1 21 .5 18 .2 31 .7 16 .4 13 .9 16 .0 8 .2 11 .3 50.0 27.4 39.2 12.0 20 .0 18 .8 1.6
社会人(子供1歳以下)Worker (child 1 yr and under) 127 62.2 20 .6 34 .1 14 .3 21.3 34 .1 11 .2 10 .1 17 .1 9.1 13.0 45 .7 22 .6 32 .3 11.6 14 .1 12 .3 1.7
社会人(既婚・子供無)Worker (married, no children) 987 63.3 30.3 41.9 29.6 25.8 39.0 30.0 25.7 24.0 13.6 19.0 47.2 28.4 37.1 15.2 25.1 24.9 2.7
社会人(独身)Worker (unmarried) 1,564 59.4 33.2 38.4 28.0 22.1 34.5 26.5 25.1 21.0 12.5 16.5 49.6 31.7 38.0 12.0 21.9 21.3 2.8
独身男性 Unmarried male 844 52 .9 31.2 31 .9 26 .2 18 .0 27 .8 21 .3 20 .4 17 .4 10.1 14.5 47.9 32.9 36.8 11.1 20 .3 19 .6 3.0
独身女性20・30代 Unmarried female 20s/30s 685 54 .2 23 .5 33 .1 19 .7 14 .5 27 .4 18 .6 17 .2 13 .5 7 .2 9 .6 39 .6 20 .2 27 .6 9 .1 16 .2 16 .2 0.8
独身女性40代以上 Unmarried female 40s and over 269 78.0 53.9 59.3 46.0 41.4 58.5 50.2 46.8 38.1 24.2 30.2 67.1 43.3 56.2 15.8 34.2 33.4 5.4
学生 Student 242 42 .8 21 .6 24 .8 18 .4 7 .7 17 .5 12 .5 10 .2 6 .4 1 .8 5 .4 34 .1 15 .2 24 .0 5 .0 13 .3 13 .3 0.9
ライト Light 891 30 .4 9 .6 13 .4 7 .2 4 .0 10 .3 5 .9 5 .1 4 .0 1 .8 3 .1 14 .9 6 .5 9 .7 2 .0 4 .9 4 .9 ―
ミドル Middle 1,181 54 .1 18 .3 29 .7 17 .6 13 .3 25 .9 15 .3 12 .7 9 .1 3 .9 6 .6 41 .4 19 .6 29 .3 7 .1 13 .3 13 .0 1.2
ヘビー Heavy 2,944 75.8 46.1 57.1 44.9 38.0 53.5 43.2 38.5 34.6 21.5 26.7 66.7 44.1 54.8 21.6 37.2 36.2 5.6
Sample
Central/
South
America
or
Caribbean
HawaiiHawaii
(Oahu)
Hawaii
(other
than
Oahu)
Guam or
SaipanGuam Saipan
South
Pacific
islands or
other
islands
China
(excluding
Hong
Kong and
Macau)
Shanghai Beijing
Other
China
(exc. Hong
Kong /
Macau)
Hong
Kong or
Macau
Hong
KongMacau Taiwan Korea
TOTAL2018 survey total 5,016 14.6 54.8 49.8 26.9 44.9 41.0 19.2 12.8 36.1 26.3 20.2 19.6 43.1 42.2 22.7 52.8 51.3
2017 survey total 4,986 14.5 56.4 50.7 28.3 44.8 40.9 19.3 12.9 36.3 25.8 19.5 19.3 41.9 41.2 22.2 51.9 51.2
男性 Male 2,552 14.5 52.8 48.3 25.5 41.9 38.6 18.5 12.0 38.2 28.4 22.2 22.5 42.8 41.7 24.3 51.0 44 .7
女性 Female 2,464 14.7 57.0 51.5 28.3 48.0 43.6 19.8 13.5 33.9 24.1 18.1 16.6 43.4 42.7 20.9 54.6 58.2
男性 18-29歳Male 18-29 yrs 371 5 .4 33 .7 29 .6 10 .7 24 .8 22 .7 6 .6 3 .9 18 .2 11 .6 9 .9 9 .6 23 .0 22 .4 12 .2 36 .1 27 .5
男性 30-39歳Male 30-39 yrs 483 9 .5 43 .6 34 .3 21 .3 34 .7 32 .3 12 .7 9.1 28 .1 20 .1 15 .0 11 .6 31 .3 29 .6 17 .5 40 .6 35 .9
男性 40-49歳Male 40-49 yrs 584 11.4 52.7 48.4 22.7 46.1 42.0 19.8 12.2 37.0 25.0 19.8 22.0 42.5 41.0 23.0 49.1 47.5
男性 50-59歳Male 50-59 yrs 513 21.3 61.8 58.6 31.1 52.6 48.6 29.8 18.7 44.0 32.1 24.2 28.5 52.0 50.9 31.0 57.1 50.9
男性 60歳以上Male 60 yrs or older 601 21.2 64.4 62.0 36.0 45.2 41.8 19.7 13.5 55.0 45.7 36.3 34.6 56.5 56.0 32.9 65.2 54.5
女性 18-29歳Female 18-29 yrs 651 5 .7 40 .4 33 .1 13 .5 38 .1 35 .7 11 .3 7 .1 20 .8 14 .6 9 .4 4 .5 22 .4 21 .8 7 .8 43 .5 51.6
女性 30-39歳Female 30-39 yrs 465 10.0 53.7 45.4 24.2 49.2 44.2 15.9 12.1 29 .9 20 .4 13 .8 11 .4 40.1 39.2 17 .6 52.3 64.6
女性 40-49歳Female 40-49 yrs 453 20.7 62.3 59.4 26.5 58.9 54.0 26.5 17.8 35.8 24.1 18.5 18.0 50.1 49.4 20.9 59.1 59.6
女性 50-59歳Female 50-59 yrs 408 18.9 69.2 65.8 39.4 56.9 51.1 31.7 19.4 35.6 23.6 20.3 20.0 58.3 57.8 30.0 57.2 60.3
女性 60歳以上Female 60 yrs or older 488 22.3 67.1 62.6 44.3 42.4 37.4 19.0 14.5 52.1 41.0 31.8 33.6 55.7 55.0 34.1 65.2 57.8
関東 Kanto 3,070 16.3 56.5 51.4 27.7 46.7 41.7 22.0 14.4 35.4 25.2 20.1 18.7 43.7 43.1 22.4 51.3 49.7
関西 Kansai 1,251 11.9 52.4 47.3 27.1 42.7 40.6 14 .0 9.7 38.0 28.6 20.5 21.7 44.4 43.2 23.8 56.5 54.6
東海 Tokai 696 11.9 52.0 47.4 22.9 40.9 38.9 15.8 11.1 35.6 27.1 20.4 19.9 37 .8 36 .2 21.7 52.6 52.8
社会人(子供7歳以上)Worker (child 7 yrs and over) 1,882 17.3 65.3 61.1 34.5 50.5 46.7 22.4 14.5 43.7 32.7 25.8 25.9 51.3 50.5 26.8 57.4 52.4
社会人(子供2~6歳)Worker (child 2-6 yrs) 215 12.1 62.8 56.7 25.7 53.6 49.0 20.8 12.4 31.3 20 .6 16.5 15.6 36 .2 34 .0 19.9 42 .5 45 .0
社会人(子供1歳以下)Worker (child 1 yr and under) 127 6 .3 56.6 49.9 16 .3 48.1 43.1 19.8 10.3 24 .0 16 .9 14 .1 12 .5 31 .5 29 .2 16 .4 42 .5 49.7
社会人(既婚・子供無)Worker (married, no children) 987 16.3 58.5 53.9 26.5 44.4 39.5 20.4 17.7 33.2 24.6 17.6 17.0 41.5 40.8 20.8 52.3 51.1
社会人(独身)Worker (unmarried) 1,564 13.2 43 .0 37 .0 21 .3 40.1 36.5 16.3 9.5 32.7 23.5 17.7 17.0 40.1 39.1 22.2 52.1 54.0
独身男性 Unmarried male 844 11.5 37 .5 31 .9 18 .0 32 .8 30 .0 14.4 7 .8 32.1 23.1 18.5 18.5 36 .0 35 .0 21.9 47 .0 40 .5
独身女性20・30代 Unmarried female 20s/30s 685 6 .7 39 .3 32 .3 17 .8 40.6 37.4 12 .6 6 .2 25 .3 17 .1 10 .9 6 .8 30 .6 30 .0 12 .8 49.6 58.3
独身女性40代以上 Unmarried female 40s and over 269 25.4 55.5 52.6 32.7 48.7 44.6 22.1 16.7 43.9 31.0 25.9 28.5 56.6 55.8 33.5 62.0 67.1
学生 Student 242 2 .3 27 .2 22 .6 12 .0 25 .4 24 .5 5 .5 1 .9 21 .7 12 .4 10 .2 6 .0 17 .0 17 .0 6 .4 37 .4 33 .2
ライト Light 891 1 .3 29 .8 24 .8 7 .9 19 .9 18 .2 3 .4 2 .4 8 .8 4 .4 3 .6 3 .0 10 .1 9 .6 3 .8 25 .2 19 .7
ミドル Middle 1,181 5 .0 46 .9 40 .4 17 .8 38 .7 34 .5 10 .5 5 .5 21 .9 13 .9 9 .6 8 .5 27 .0 26 .5 10 .0 44 .6 40 .6
ヘビー Heavy 2,944 22.5 65.6 61.2 36.3 55.0 50.6 27.4 18.8 50.1 38.0 29.5 29.1 59.5 58.3 33.4 64.4 65.2
Sample
Southeast
AsiaSingapore Phuket
Thai
beaches
(other
than
Phuket)
Bangkok
or other
Thai cities
Bali
Indonesian
beaches
(other
than Bali)
Indonesian
citiesMalaysia Philippines Vietnam Cambodia
Other
places in
Asia
Oceania Australia
New
Zealand or
other
Oceania
Long
distance
Medium
distance
Short
distance
TOTAL2018 survey total 5,016 64.5 39.0 12.7 9.1 29.5 21.1 4.0 9.3 23.1 14.7 22.9 13.0 13.5 39.1 35.2 13.4 77.7 84.7 86.8
2017 survey total 4,986 63.9 38.0 12.0 9.4 29.6 20.8 4.3 8.7 21.6 14.3 21.6 12.4 11.9 37.9 34.2 13.1 77.0 84.2 87.1
男性 Male 2,552 62.8 37.5 12.9 11.0 30.6 18.2 4.4 9.9 23.8 16.5 22.6 12.2 13.7 38.3 34.9 13.2 75.5 83.9 84.4
女性 Female 2,464 66.4 40.6 12.6 7.1 28.3 24.0 3.6 8.8 22.5 12.8 23.3 13.8 13.3 39.8 35.5 13.7 80.0 85.5 89.3
男性 18-29歳Male 18-29 yrs 371 38 .8 17 .9 3 .0 3 .6 13 .7 6 .6 2.1 2 .4 9 .9 8 .4 9 .6 3 .9 5 .7 26 .3 23 .6 6 .0 64 .8 68 .1 69 .9
男性 30-39歳Male 30-39 yrs 483 55 .4 28 .7 9.1 10.1 24 .3 14 .8 2.8 7.8 14 .2 13.5 16 .3 10.2 10.2 32 .8 31.1 9.9 72 .5 76 .9 77 .8
男性 40-49歳Male 40-49 yrs 584 64.2 36.9 15.1 12.0 35.6 17.9 3.7 9.5 25.3 16.5 23.2 11.1 14.4 37.4 34.5 11.7 71 .1 86.7 86.9
男性 50-59歳Male 50-59 yrs 513 71.8 44.5 19.9 16.6 35.9 25.3 6.9 11.8 29.1 21.9 25.0 13.5 14.9 46.5 42.6 15.8 77.9 89.4 90.6
男性 60歳以上Male 60 yrs or older 601 74.3 51.2 13.7 10.6 36.6 22.3 5.5 14.9 33.9 19.2 32.9 19.0 19.5 44.2 38.7 19.5 86.8 92.0 90.9
女性 18-29歳Female 18-29 yrs 651 48 .4 21 .7 5 .2 2 .9 14 .6 14 .2 0.9 3 .1 11 .6 10.7 12 .8 7 .3 5 .7 28 .1 24 .3 6 .6 65 .0 72 .8 81 .8
女性 30-39歳Female 30-39 yrs 465 64.8 36.6 9.0 8.1 28.7 22.1 0.7 5.9 18.8 12.1 19.5 14.0 11.4 39.2 35.2 11.9 78.6 86.2 91.4
女性 40-49歳Female 40-49 yrs 453 73.7 46.2 19.7 9.7 32.1 32.8 4.1 10.9 27.0 14.6 26.0 15.8 13.6 44.5 40.9 13.6 84.4 90.0 92.9
女性 50-59歳Female 50-59 yrs 408 76.1 52.8 20.6 10.3 31.1 28.3 5.3 10.3 27.5 16.1 23.6 13.6 16.9 48.1 42.8 16.7 87.2 93.3 93.6
女性 60歳以上Female 60 yrs or older 488 76.8 54.3 12.8 6.4 40.3 27.3 8.1 15.6 32.0 11.6 38.2 20.4 22.0 44.8 39.6 22.3 91.2 90.8 90.3
関東 Kanto 3,070 64.9 39.5 14.5 9.8 30.1 21.5 4.9 9.8 24.4 15.5 23.7 12.8 14.1 38.2 35.2 12.4 79.7 85.1 86.8
関西 Kansai 1,251 64.5 37.9 10.7 8.6 29.4 20.8 2.7 9.4 22.3 11.5 22.1 12.1 13.0 40.4 34.9 15.2 74.4 84.0 87.7
東海 Tokai 696 62.6 38.7 8.7 6.7 26.9 19.6 2.5 7.1 18.8 16.5 21.0 15.4 11.6 40.3 35.3 14.9 74.9 83.9 85.4
社会人(子供7歳以上)Worker (child 7 yrs and over) 1,882 70.3 46.5 15.1 9.7 32.3 22.9 5.4 10.7 27.6 14.9 27.4 14.3 14.7 43.9 39.5 16.5 82.8 90.7 90.6
社会人(子供2~6歳)Worker (child 2-6 yrs) 215 60.0 30 .7 14.6 11.4 19 .7 20.4 1.5 5.0 14 .0 12.7 14 .0 7 .1 7 .0 39.4 36.6 11.3 76.6 88.6 82.2
社会人(子供1歳以下)Worker (child 1 yr and under) 127 60.3 35.6 10.5 6.5 20 .5 21.6 0.9 6.5 16 .0 10.8 12 .8 6 .0 5 .8 30 .6 29 .7 5 .8 75.2 84.9 81 .3
社会人(既婚・子供無)Worker (married, no children) 987 66.7 38.3 14.4 9.9 31.6 25.0 4.2 9.4 24.6 16.0 22.9 14.0 13.5 37.7 34.3 12.8 77.4 87.5 84.3
社会人(独身)Worker (unmarried) 1,564 61.3 35.3 10.5 8.8 29.3 18.6 3.3 9.4 20.7 15.2 21.7 13.8 14.9 36.9 32.7 12.3 74.5 79 .1 86.8
独身男性 Unmarried male 844 56 .7 32 .1 9.7 10.8 29.7 14 .3 4.7 9.6 20.3 16.1 19.6 11.8 13.5 34.4 31.0 10.9 70 .6 75 .1 80 .4
独身女性20・30代 Unmarried female 20s/30s 685 53 .0 25 .7 4 .7 3 .6 19 .5 14 .2 0.3 4 .2 14 .0 11.8 17 .0 10.3 8.8 30 .8 26 .7 8.6 69 .2 72 .8 89.0
独身女性40代以上 Unmarried female 40s and over 269 76.3 53.0 20.0 9.6 38.8 33.4 4.2 16.3 30.0 14.6 30.0 19.2 26.3 50.1 44.2 19.7 89.3 89.6 91.2
学生 Student 242 37 .7 16 .5 1 .8 1 .8 12 .9 6 .9 0.9 2 .8 10 .2 7 .3 9 .3 2 .8 5 .1 25 .2 22 .5 4 .6 62 .2 59 .0 74 .6
ライト Light 891 23 .5 9 .5 2 .0 0 .9 4 .8 3 .3 0.4 1 .2 3 .2 3 .6 5 .4 2 .3 2 .4 14 .2 12 .5 2 .2 44 .4 55 .3 60 .8
ミドル Middle 1,181 51 .3 22 .5 5 .5 3 .5 17 .8 9 .6 1.1 2 .9 10 .3 6 .7 9 .5 4 .7 4 .8 29 .0 24 .5 6 .9 74.3 81.6 86.0
ヘビー Heavy 2,944 82.2 54.5 18.9 13.8 41.6 31.0 6.2 14.3 34.3 21.2 33.6 19.6 20.3 50.6 46.3 19.4 89.2 94.8 95.0
50.0 …Figures 5 or more points or higher than the 2018 survey total are shaded.
50 .0 …Figures 5 or more points or lower than the 2018 survey total are shaded.
Sex & age
Europe Middle East or Africa USA (excluding Hawaii and Alaska) Canada or Alaska
Sex
Oceania
Area of
residence
Life
stage
Hawaii Guam or Saipan China (excluding Hong Kong and Macau) Hong Kong or Macau
Number of
trips taken
Sex
Sex & age
Area of
residence
Life
stage
Number of
trips taken
Southeast Asia
Number of
trips taken
Sex
Sex & age
Area of
residence
Life
stage
9
■Overseas destinations ever visited (Total/Multiple answers)

10
11
Reference
Overseas Travel in 2017
AB-ROAD Overseas Travel Survey 201812
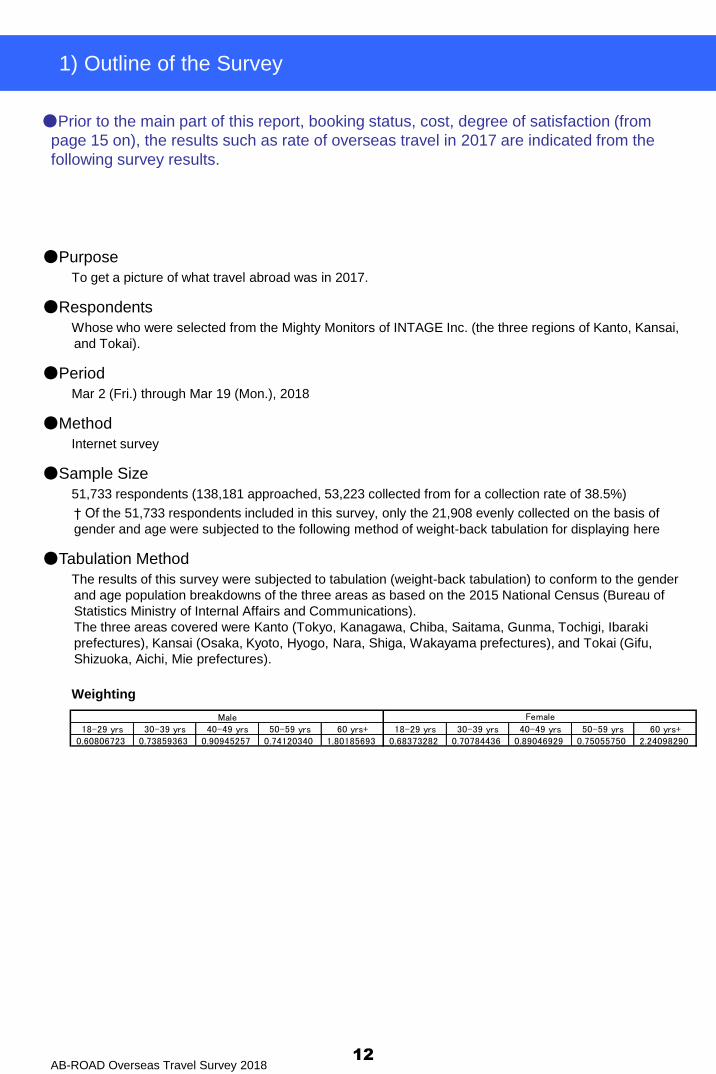
1) Outline of the Survey
●Prior to the main part of this report, booking status, cost, degree of satisfaction (from
page 15 on), the results such as rate of overseas travel in 2017 are indicated from the
following survey results.
●Purpose
To get a picture of what travel abroad was in 2017.
●Respondents
Whose who were selected from the Mighty Monitors of INTAGE Inc. (the three regions of Kanto, Kansai,
and Tokai).
●Period
Mar 2 (Fri.) through Mar 19 (Mon.), 2018
●Method
Internet survey
●Sample Size
51,733 respondents (138,181 approached, 53,223 collected from for a collection rate of 38.5%)
† Of the 51,733 respondents included in this survey, only the 21,908 evenly collected on the basis of
gender and age were subjected to the following method of weight-back tabulation for displaying here
●Tabulation Method
The results of this survey were subjected to tabulation (weight-back tabulation) to conform to the gender
and age population breakdowns of the three areas as based on the 2015 National Census (Bureau of
Statistics Ministry of Internal Affairs and Communications).
The three areas covered were Kanto (Tokyo, Kanagawa, Chiba, Saitama, Gunma, Tochigi, Ibaraki
prefectures), Kansai (Osaka, Kyoto, Hyogo, Nara, Shiga, Wakayama prefectures), and Tokai (Gifu,
Shizuoka, Aichi, Mie prefectures).
Weighting
Male18-29 yrs 30-39 yrs 40-49 yrs 50-59 yrs 60 yrs+ 18-29 yrs 30-39 yrs 40-49 yrs 50-59 yrs 60 yrs+
0.60806723 0.73859363 0.90945257 0.74120340 1.80185693 0.68373282 0.70784436 0.89046929 0.75055750 2.24098290
Female
AB-ROAD Overseas Travel Survey 201813
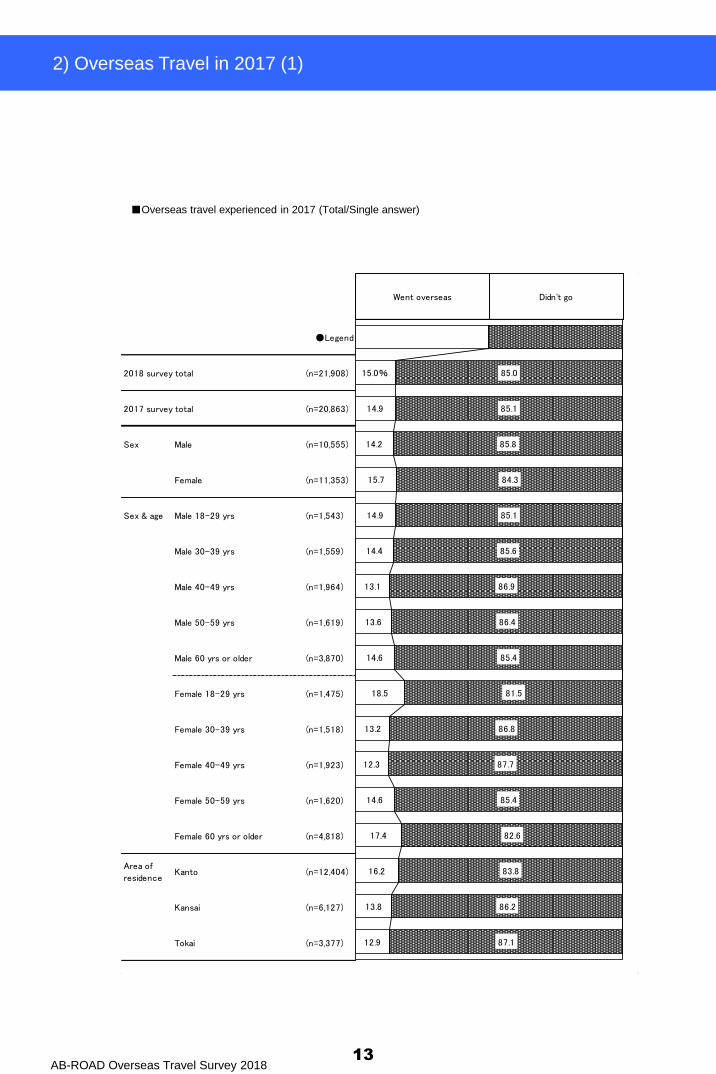
2) Overseas Travel in 2017 (1)
Went overseas Didn't go
●Legend
2018 survey total (n=21,908)
2017 survey total (n=20,863)
Sex Male (n=10,555)
Female (n=11,353)
Sex & age Male 18-29 yrs (n=1,543)
Male 30-39 yrs (n=1,559)
Male 40-49 yrs (n=1,964)
Male 50-59 yrs (n=1,619)
Male 60 yrs or older (n=3,870)
Female 18-29 yrs (n=1,475)
Female 30-39 yrs (n=1,518)
Female 40-49 yrs (n=1,923)
Female 50-59 yrs (n=1,620)
Female 60 yrs or older (n=4,818)
Area of
residenceKanto (n=12,404)
Kansai (n=6,127)
Tokai (n=3,377)
15.0%
14.9
14.2
15.7
14.9
14.4
13.1
13.6
14.6
18.5
13.2
12.3
14.6
17.4
16.2
13.8
12.9
85.0
85.1
85.8
84.3
85.1
85.6
86.9
86.4
85.4
81.5
86.8
87.7
85.4
82.6
83.8
86.2
87.1
■Overseas travel experienced in 2017 (Total/Single answer)
AB-ROAD Overseas Travel Survey 201814
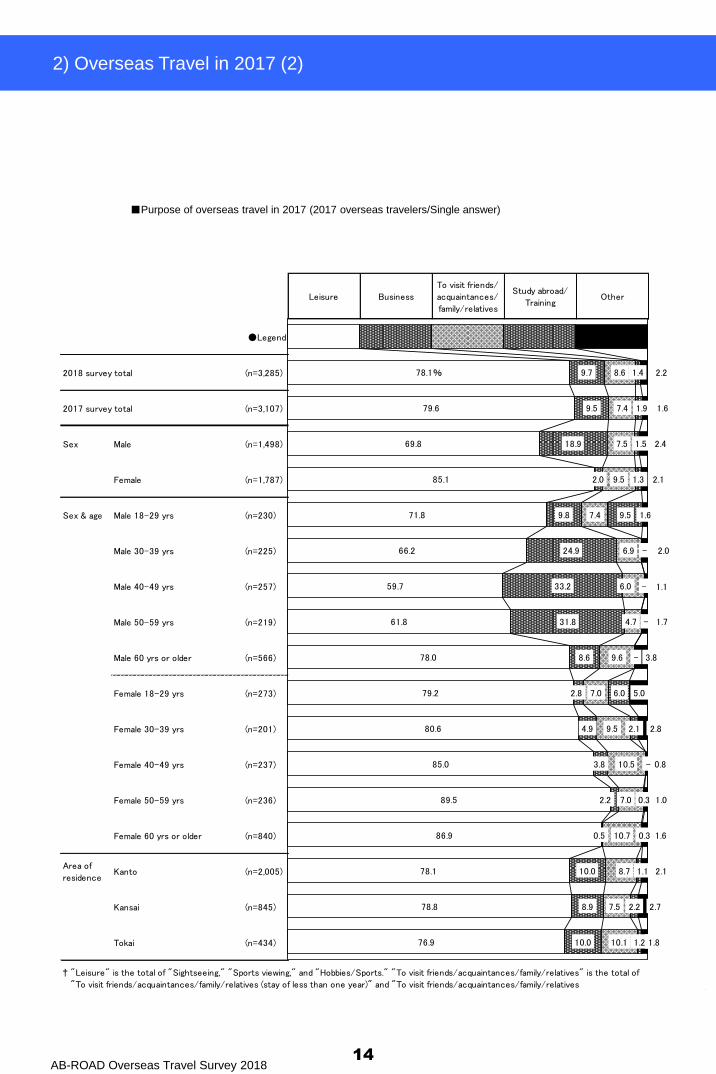
2) Overseas Travel in 2017 (2)
Leisure Business
To visit friends/
acquaintances/
family/relatives
Study abroad/
TrainingOther
●Legend
2018 survey total (n=3,285)
2017 survey total (n=3,107)
Sex Male (n=1,498)
Female (n=1,787)
Sex & age Male 18-29 yrs (n=230)
Male 30-39 yrs (n=225)
Male 40-49 yrs (n=257)
Male 50-59 yrs (n=219)
Male 60 yrs or older (n=566)
Female 18-29 yrs (n=273)
Female 30-39 yrs (n=201)
Female 40-49 yrs (n=237)
Female 50-59 yrs (n=236)
Female 60 yrs or older (n=840)
Area of
residenceKanto (n=2,005)
Kansai (n=845)
Tokai (n=434)
† "Leisure" is the total of "Sightseeing," "Sports viewing," and "Hobbies/Sports." "To visit friends/acquaintances/family/relatives" is the total of
"To visit friends/acquaintances/family/relatives (stay of less than one year)" and "To visit friends/acquaintances/family/relatives
78.1%
79.6
69.8
85.1
71.8
66.2
59.7
61.8
78.0
79.2
80.6
85.0
89.5
86.9
78.1
78.8
76.9
9.7
9.5
18.9
2.0
9.8
24.9
33.2
31.8
8.6
2.8
4.9
3.8
2.2
0.5
10.0
8.9
10.0
8.6
7.4
7.5
9.5
7.4
6.9
6.0
4.7
9.6
7.0
9.5
10.5
7.0
10.7
8.7
7.5
10.1
1.4
1.9
1.5
1.3
9.5
-
-
-
-
6.0
2.1
-
0.3
0.3
1.1
2.2
1.2
2.2
1.6
2.4
2.1
1.6
2.0
1.1
1.7
3.8
5.0
2.8
0.8
1.0
1.6
2.1
2.7
1.8
■Purpose of overseas travel in 2017 (2017 overseas travelers/Single answer)
15
Outline of Overseas Travel in 2017
Chapter 1
Part 1
Trends in Overseas Travel Booking in 2017
Part 1 Trends in Overseas Travel Booking in 2017 Chapter 1 Outline of Overseas Travel in 2017
AB-ROAD Overseas Travel Survey 2018
Once 2 times 3 times 4 times5 times or
moreNo ans.
●Legend
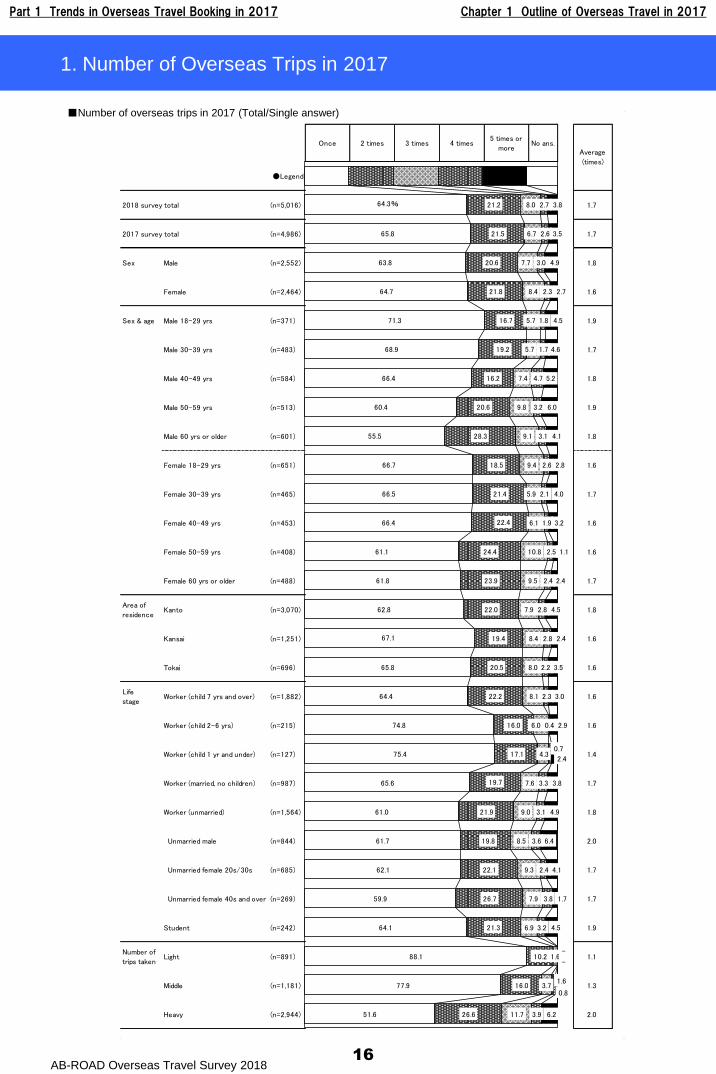
2018 survey total (n=5,016) 1.7
2017 survey total (n=4,986) 1.7
Sex Male (n=2,552) 1.8
Female (n=2,464) 1.6
Sex & age Male 18-29 yrs (n=371) 1.9
Male 30-39 yrs (n=483) 1.7
Male 40-49 yrs (n=584) 1.8
Male 50-59 yrs (n=513) 1.9
Male 60 yrs or older (n=601) 1.8
Female 18-29 yrs (n=651) 1.6
Female 30-39 yrs (n=465) 1.7
Female 40-49 yrs (n=453) 1.6
Female 50-59 yrs (n=408) 1.6
Female 60 yrs or older (n=488) 1.7
Area of
residenceKanto (n=3,070) 1.8
Kansai (n=1,251) 1.6
Tokai (n=696) 1.6
Life
stageWorker (child 7 yrs and over) (n=1,882) 1.6
Worker (child 2-6 yrs) (n=215) 1.6
Worker (child 1 yr and under) (n=127) 1.4
Worker (married, no children) (n=987) 1.7
Worker (unmarried) (n=1,564) 1.8
Unmarried male (n=844) 2.0
Unmarried female 20s/30s (n=685) 1.7
Unmarried female 40s and over (n=269) 1.7
Student (n=242) 1.9
Number of
trips takenLight (n=891) 1.1
Middle (n=1,181) 1.3
Heavy (n=2,944) 2.0
Average
(times)
64.3%
65.8
63.8
64.7
71.3
68.9
66.4
60.4
55.5
66.7
66.5
66.4
61.1
61.8
62.8
67.1
65.8
64.4
74.8
75.4
65.6
61.0
61.7
62.1
59.9
64.1
88.1
77.9
51.6
21.2
21.5
20.6
21.8
16.7
19.2
16.2
20.6
28.3
18.5
21.4
22.4
24.4
23.9
22.0
19.4
20.5
22.2
16.0
17.1
19.7
21.9
19.8
22.1
26.7
21.3
10.2
16.0
26.6
8.0
6.7
7.7
8.4
5.7
5.7
7.4
9.8
9.1
9.4
5.9
6.1
10.8
9.5
7.9
8.4
8.0
8.1
6.0
4.3
7.6
9.0
8.5
9.3
7.9
6.9
1.6
3.7
11.7
2.7
2.6
3.0
2.3
1.8
1.7
4.7
3.2
3.1
2.6
2.1
1.9
2.5
2.4
2.8
2.8
2.2
2.3
0.4
0.7
3.3
3.1
3.6
2.4
3.8
3.2
-
1.6
3.9
3.8
3.5
4.9
2.7
4.5
4.6
5.2
6.0
4.1
2.8
4.0
3.2
1.1
2.4
4.5
2.4
3.5
3.0
2.9
2.4
3.8
4.9
6.4
4.1
1.7
4.5
-
0.8
6.2
16
1. Number of Overseas Trips in 2017
■Number of overseas trips in 2017 (Total/Single answer)
Part 1 Trends in Overseas Travel Booking in 2017 Chapter 1 Outline of Overseas Travel in 2017
AB-ROAD Overseas Travel Survey 201817
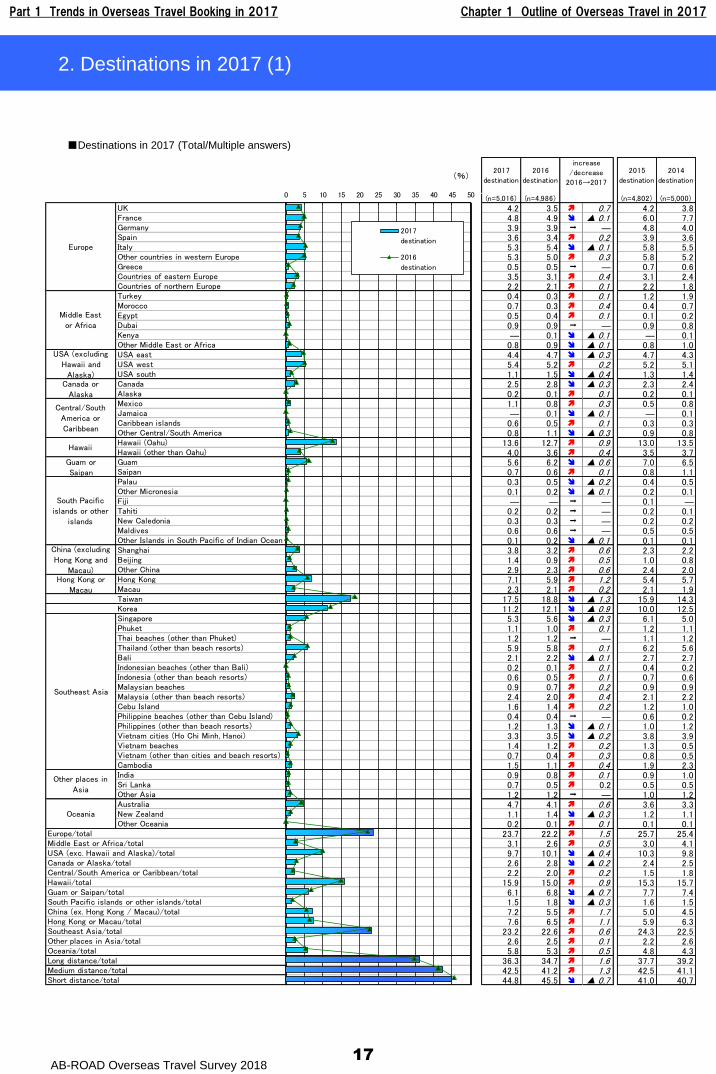
2. Destinations in 2017 (1)
(%)2017
destination
2016
destination
2015
destination
2014
destination
(n=5,016) (n=4,986) (n=4,802) (n=5,000)
UK 4.2 3.5 0.7 4.2 3.8France 4.8 4.9 ▲ 0.1 6.0 7.7Germany 3.9 3.9 ― 4.8 4.0Spain 3.6 3.4 0.2 3.9 3.6Italy 5.3 5.4 ▲ 0.1 5.8 5.5Other countries in western Europe 5.3 5.0 0.3 5.8 5.2Greece 0.5 0.5 ― 0.7 0.6Countries of eastern Europe 3.5 3.1 0.4 3.1 2.4Countries of northern Europe 2.2 2.1 0.1 2.2 1.8Turkey 0.4 0.3 0.1 1.2 1.9Morocco 0.7 0.3 0.4 0.4 0.7Egypt 0.5 0.4 0.1 0.1 0.2Dubai 0.9 0.9 ― 0.9 0.8Kenya ― 0.1 ▲ 0.1 ― 0.1Other Middle East or Africa 0.8 0.9 ▲ 0.1 0.8 1.0USA east 4.4 4.7 ▲ 0.3 4.7 4.3USA west 5.4 5.2 0.2 5.2 5.1USA south 1.1 1.5 ▲ 0.4 1.3 1.4Canada 2.5 2.8 ▲ 0.3 2.3 2.4Alaska 0.2 0.1 0.1 0.2 0.1Mexico 1.1 0.8 0.3 0.5 0.8Jamaica ― 0.1 ▲ 0.1 ― 0.1Caribbean islands 0.6 0.5 0.1 0.3 0.3Other Central/South America 0.8 1.1 ▲ 0.3 0.9 0.8Hawaii (Oahu) 13.6 12.7 0.9 13.0 13.5Hawaii (other than Oahu) 4.0 3.6 0.4 3.5 3.7Guam 5.6 6.2 ▲ 0.6 7.0 6.5Saipan 0.7 0.6 0.1 0.8 1.1Palau 0.3 0.5 ▲ 0.2 0.4 0.5Other Micronesia 0.1 0.2 ▲ 0.1 0.2 0.1Fiji ― ― ― 0.1 ―Tahiti 0.2 0.2 ― 0.2 0.1New Caledonia 0.3 0.3 ― 0.2 0.2Maldives 0.6 0.6 ― 0.5 0.5Other Islands in South Pacific of Indian Ocean 0.1 0.2 ▲ 0.1 0.1 0.1Shanghai 3.8 3.2 0.6 2.3 2.2Beijing 1.4 0.9 0.5 1.0 0.8Other China 2.9 2.3 0.6 2.4 2.0Hong Kong 7.1 5.9 1.2 5.4 5.7Macau 2.3 2.1 0.2 2.1 1.9Taiwan 17.5 18.8 ▲ 1.3 15.9 14.3Korea 11.2 12.1 ▲ 0.9 10.0 12.5Singapore 5.3 5.6 ▲ 0.3 6.1 5.0Phuket 1.1 1.0 0.1 1.2 1.1Thai beaches (other than Phuket) 1.2 1.2 ― 1.1 1.2Thailand (other than beach resorts) 5.9 5.8 0.1 6.2 5.6Bali 2.1 2.2 ▲ 0.1 2.7 2.7Indonesian beaches (other than Bali) 0.2 0.1 0.1 0.4 0.2Indonesia (other than beach resorts) 0.6 0.5 0.1 0.7 0.6Malaysian beaches 0.9 0.7 0.2 0.9 0.9Malaysia (other than beach resorts) 2.4 2.0 0.4 2.1 2.2Cebu Island 1.6 1.4 0.2 1.2 1.0Philippine beaches (other than Cebu Island) 0.4 0.4 ― 0.6 0.2Philippines (other than beach resorts) 1.2 1.3 ▲ 0.1 1.0 1.2Vietnam cities (Ho Chi Minh, Hanoi) 3.3 3.5 ▲ 0.2 3.8 3.9Vietnam beaches 1.4 1.2 0.2 1.3 0.5Vietnam (other than cities and beach resorts) 0.7 0.4 0.3 0.8 0.5Cambodia 1.5 1.1 0.4 1.9 2.3India 0.9 0.8 0.1 0.9 1.0Sri Lanka 0.7 0.5 0.2 0.5 0.5Other Asia 1.2 1.2 ― 1.0 1.2Australia 4.7 4.1 0.6 3.6 3.3New Zealand 1.1 1.4 ▲ 0.3 1.2 1.1Other Oceania 0.2 0.1 0.1 0.1 0.1
Europe/total 23.7 22.2 1.5 25.7 25.4Middle East or Africa/total 3.1 2.6 0.5 3.0 4.1USA (exc. Hawaii and Alaska)/total 9.7 10.1 ▲ 0.4 10.3 9.8Canada or Alaska/total 2.6 2.8 ▲ 0.2 2.4 2.5Central/South America or Caribbean/total 2.2 2.0 0.2 1.5 1.8Hawaii/total 15.9 15.0 0.9 15.3 15.7Guam or Saipan/total 6.1 6.8 ▲ 0.7 7.7 7.4South Pacific islands or other islands/total 1.5 1.8 ▲ 0.3 1.6 1.5China (ex. Hong Kong / Macau)/total 7.2 5.5 1.7 5.0 4.5Hong Kong or Macau/total 7.6 6.5 1.1 5.9 6.3Southeast Asia/total 23.2 22.6 0.6 24.3 22.5Other places in Asia/total 2.6 2.5 0.1 2.2 2.6Oceania/total 5.8 5.3 0.5 4.8 4.3Long distance/total 36.3 34.7 1.6 37.7 39.2Medium distance/total 42.5 41.2 1.3 42.5 41.1Short distance/total 44.8 45.5 ▲ 0.7 41.0 40.7
Other places inAsia
Southeast Asia
China (excludingHong Kong and
Macau)Hong Kong or
Macau
Oceania
increase
/decrease
2016→2017
Hawaii
USA (excluding
Hawaii andAlaska)
Canada or
Alaska
Europe
Middle Eastor Africa
Central/SouthAmerica or
Caribbean
Guam orSaipan
South Pacific
islands or otherislands
0 5 10 15 20 25 30 35 40 45 50
2017
destination
2016
destination
■Destinations in 2017 (Total/Multiple answers)
Part 1 Trends in Overseas Travel Booking in 2017 Chapter 1 Outline of Overseas Travel in 2017
AB-ROAD Overseas Travel Survey 201818
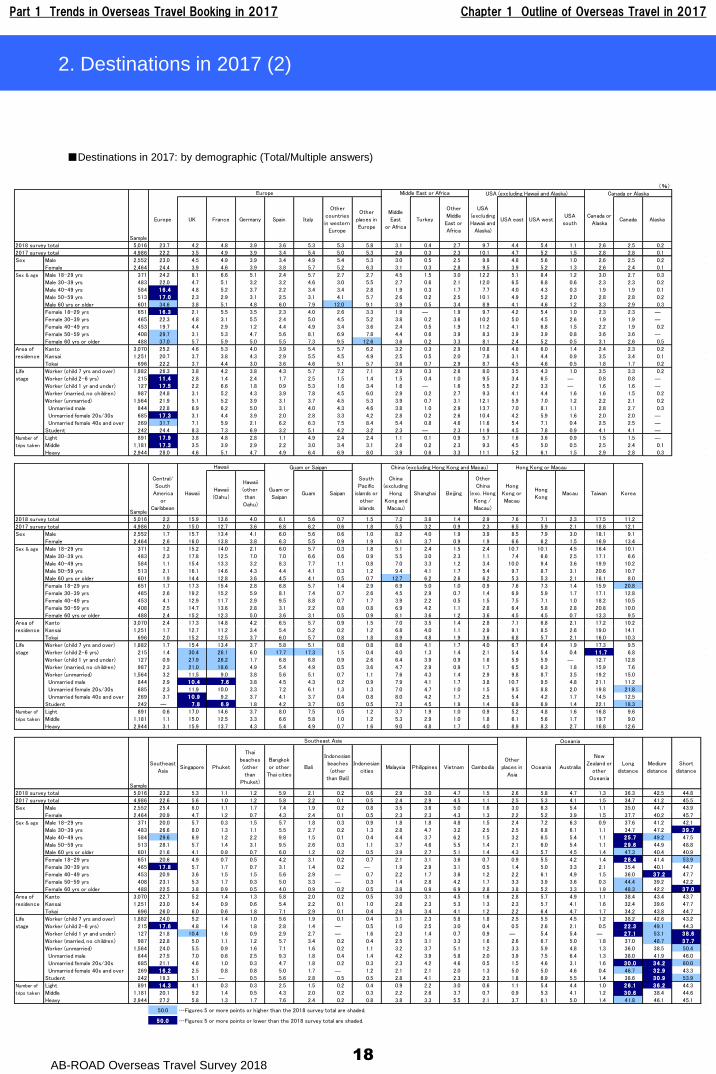
2. Destinations in 2017 (2)
■Destinations in 2017: by demographic (Total/Multiple answers)
(%)
TOTAL
Sample
Europe UK France Germany Spain Italy
Other
countries
in western
Europe
Other
places in
Europe
Middle
East
or Africa
Turkey
Other
Middle
East or
Africa
USA
(excluding
Hawaii and
Alaska)
USA east USA westUSA
south
Canada or
AlaskaCanada Alaska
TOTAL2018 survey total 5,016 23.7 4.2 4.8 3.9 3.6 5.3 5.3 5.8 3.1 0.4 2.7 9.7 4.4 5.4 1.1 2.6 2.5 0.2
2017 survey total 4,986 22.2 3.5 4.9 3.9 3.4 5.4 5.0 5.3 2.6 0.3 2.3 10.1 4.7 5.2 1.5 2.8 2.8 0.1
男性 Male 2,552 23.0 4.5 4.9 3.9 3.4 4.9 5.4 5.3 3.0 0.5 2.5 9.9 4.8 5.6 1.0 2.6 2.5 0.2
女性 Female 2,464 24.4 3.9 4.6 3.9 3.8 5.7 5.2 6.3 3.1 0.3 2.8 9.5 3.9 5.2 1.3 2.6 2.4 0.1
男性 18-29歳Male 18-29 yrs 371 24.2 8.1 6.6 5.1 2.4 5.7 2.7 2.7 4.5 1.5 3.0 12.2 5.1 8.4 1.2 3.0 2.7 0.3
男性 30-39歳Male 30-39 yrs 483 22.0 4.7 5.1 3.2 3.2 4.6 3.0 5.5 2.7 0.6 2.1 12.0 6.5 6.8 0.6 2.3 2.3 0.2
男性 40-49歳Male 40-49 yrs 584 16 .4 4.8 5.2 3.7 2.2 3.4 3.4 2.8 1.9 0.3 1.7 7.7 4.0 4.3 0.3 1.9 1.9 0.1
男性 50-59歳Male 50-59 yrs 513 17 .0 2.3 2.9 3.1 2.5 3.1 4.1 5.7 2.6 0.2 2.5 10.1 4.9 5.2 2.0 2.8 2.8 0.2
男性 60歳以上Male 60 yrs or older 601 34.6 3.8 5.1 4.8 6.0 7.9 12.0 9.1 3.9 0.5 3.4 8.9 4.1 4.6 1.2 3.3 2.9 0.3
女性 18-29歳Female 18-29 yrs 651 16 .3 2.1 5.5 3.5 2.3 4.0 2.6 3.3 1.9 ― 1.9 9.7 4.2 5.4 1.0 2.3 2.3 ―
女性 30-39歳Female 30-39 yrs 465 22.3 4.8 3.1 5.5 2.4 5.0 4.5 5.2 3.8 0.2 3.6 10.2 5.0 4.5 2.6 1.9 1.9 ―
女性 40-49歳Female 40-49 yrs 453 19.7 4.4 2.9 1.2 4.4 4.9 3.4 3.6 2.4 0.5 1.9 11.2 4.1 6.8 1.5 2.2 1.9 0.2
女性 50-59歳Female 50-59 yrs 408 29.7 3.1 5.3 4.7 5.6 8.1 6.9 7.8 4.4 0.6 3.9 8.3 3.9 3.9 0.8 3.6 3.6 ―
女性 60歳以上Female 60 yrs or older 488 37.0 5.7 5.9 5.0 5.5 7.3 9.5 12.6 3.6 0.2 3.3 8.1 2.4 5.2 0.5 3.1 2.6 0.5
関東 Kanto 3,070 25.2 4.6 5.3 4.0 3.9 5.4 5.7 6.2 3.2 0.3 2.9 10.8 4.8 6.0 1.4 2.4 2.3 0.2
関西 Kansai 1,251 20.7 3.7 3.8 4.3 2.9 5.5 4.5 4.9 2.5 0.5 2.0 7.8 3.1 4.4 0.9 3.5 3.4 0.1
東海 Tokai 696 22.2 3.7 4.4 3.0 3.6 4.6 5.1 5.7 3.6 0.7 2.9 8.7 4.5 4.6 0.5 1.8 1.7 0.2
社会人(子供7歳以上)Worker (child 7 yrs and over) 1,882 26.3 3.8 4.2 3.8 4.3 5.7 7.2 7.1 2.9 0.3 2.6 8.0 3.5 4.3 1.0 3.5 3.3 0.2
社会人(子供2~6歳)Worker (child 2-6 yrs) 215 11 .4 2.8 1.4 2.4 1.7 2.5 1.5 1.4 1.5 0.4 1.0 9.5 3.4 6.5 ― 0.8 0.8 ―
社会人(子供1歳以下)Worker (child 1 yr and under) 127 17 .5 2.2 6.6 1.8 0.9 5.3 1.6 3.4 1.6 ― 1.6 5.5 2.2 3.3 ― 1.6 1.6 ―
社会人(既婚・子供無)Worker (married, no children) 987 24.8 3.1 5.2 4.3 3.9 7.8 4.5 6.0 2.9 0.2 2.7 9.3 4.1 4.4 1.6 1.6 1.5 0.2
社会人(独身)Worker (unmarried) 1,564 21.9 5.1 5.2 3.9 3.1 3.7 4.5 5.3 3.9 0.7 3.1 12.1 5.9 7.0 1.2 2.2 2.1 0.2
独身男性 Unmarried male 844 22.8 6.9 6.2 5.0 3.1 4.0 4.3 4.6 3.8 1.0 2.9 13.7 7.0 8.1 1.1 2.8 2.7 0.3
独身女性20・30代 Unmarried female 20s/30s 685 17 .3 3.1 4.4 3.9 2.0 2.8 3.3 4.2 2.8 0.2 2.6 10.4 4.2 5.9 1.6 2.0 2.0 ―
独身女性40代以上 Unmarried female 40s and over 269 31.7 7.1 5.9 2.1 6.2 6.3 7.5 8.4 5.4 0.8 4.6 11.6 5.4 7.1 0.4 2.5 2.5 ―
学生 Student 242 24.4 8.3 7.3 6.9 3.2 5.1 4.2 3.2 2.3 ― 2.3 11.9 4.5 7.8 0.9 4.1 4.1 ―
ライト Light 891 17 .9 3.8 4.8 2.8 1.1 4.9 2.4 2.4 1.1 0.1 0.9 5.7 1.6 3.6 0.9 1.5 1.5 ―
ミドル Middle 1,181 17 .3 3.5 3.9 2.9 2.2 3.0 3.4 3.1 2.6 0.2 2.3 9.3 4.5 5.0 0.5 2.5 2.4 0.1
ヘビー Heavy 2,944 28.0 4.6 5.1 4.7 4.9 6.4 6.9 8.0 3.9 0.6 3.3 11.1 5.2 6.1 1.5 2.9 2.8 0.3
Sample
Central/
South
America
or
Caribbean
HawaiiHawaii
(Oahu)
Hawaii
(other
than
Oahu)
Guam or
SaipanGuam Saipan
South
Pacific
islands or
other
islands
China
(excluding
Hong
Kong and
Macau)
Shanghai Beijing
Other
China
(exc. Hong
Kong /
Macau)
Hong
Kong or
Macau
Hong
KongMacau Taiwan Korea
TOTAL2018 survey total 5,016 2.2 15.9 13.6 4.0 6.1 5.6 0.7 1.5 7.2 3.8 1.4 2.9 7.6 7.1 2.3 17.5 11.2
2017 survey total 4,986 2.0 15.0 12.7 3.6 6.8 6.2 0.6 1.8 5.5 3.2 0.9 2.3 6.5 5.9 2.1 18.8 12.1
男性 Male 2,552 1.7 15.7 13.4 4.1 6.0 5.6 0.6 1.0 8.2 4.0 1.9 3.9 8.5 7.9 3.0 18.1 9.1
女性 Female 2,464 2.6 16.0 13.8 3.8 6.3 5.5 0.9 1.9 6.1 3.7 0.9 1.9 6.6 6.2 1.5 16.9 13.4
男性 18-29歳Male 18-29 yrs 371 1.2 15.2 14.0 2.1 6.0 5.7 0.3 1.8 5.1 2.4 1.5 2.4 10.7 10.1 4.5 16.4 10.1
男性 30-39歳Male 30-39 yrs 483 2.3 17.8 12.5 7.0 7.0 6.6 0.6 0.9 5.5 3.0 2.3 1.1 7.4 6.6 2.5 17.1 6.6
男性 40-49歳Male 40-49 yrs 584 1.1 15.4 13.3 3.2 8.3 7.7 1.1 0.8 7.0 3.3 1.2 3.4 10.0 9.4 3.6 19.9 10.2
男性 50-59歳Male 50-59 yrs 513 2.1 16.1 14.6 4.3 4.4 4.1 0.3 1.2 9.4 4.1 1.7 5.4 9.7 8.7 3.1 20.6 10.7
男性 60歳以上Male 60 yrs or older 601 1.9 14.4 12.8 3.6 4.5 4.1 0.5 0.7 12.7 6.2 2.6 6.2 5.3 5.3 2.1 16.1 8.0
女性 18-29歳Female 18-29 yrs 651 1.7 17.3 15.4 2.8 6.8 5.7 1.4 2.9 6.9 5.0 1.0 0.9 7.6 7.3 1.4 15.9 20.8
女性 30-39歳Female 30-39 yrs 465 2.6 19.2 15.2 5.9 8.1 7.4 0.7 2.6 4.5 2.9 0.7 1.4 6.9 5.9 1.7 17.1 12.8
女性 40-49歳Female 40-49 yrs 453 4.1 12.9 11.7 2.9 9.5 8.8 0.7 1.7 3.9 2.2 0.5 1.5 7.5 7.1 1.0 18.2 10.5
女性 50-59歳Female 50-59 yrs 408 2.5 14.7 13.6 2.8 3.1 2.2 0.8 0.8 6.9 4.2 1.1 2.8 6.4 5.8 2.8 20.8 10.0
女性 60歳以上Female 60 yrs or older 488 2.4 15.2 12.3 5.0 3.6 3.1 0.5 0.9 8.1 3.6 1.2 3.6 4.5 4.5 0.7 13.3 9.5
関東 Kanto 3,070 2.4 17.3 14.8 4.2 6.5 5.7 0.9 1.5 7.0 3.5 1.4 2.8 7.1 6.8 2.1 17.2 10.2
関西 Kansai 1,251 1.7 12.7 11.2 3.4 5.4 5.2 0.2 1.2 6.8 4.0 1.1 2.9 9.1 8.5 2.6 19.0 14.1
東海 Tokai 696 2.0 15.2 12.5 3.7 6.0 5.7 0.8 1.8 8.9 4.8 1.9 3.6 6.8 5.7 2.1 16.0 10.3
社会人(子供7歳以上)Worker (child 7 yrs and over) 1,882 1.7 15.4 13.4 3.7 5.8 5.1 0.8 0.8 8.6 4.1 1.7 4.0 6.7 6.4 1.9 17.3 9.5
社会人(子供2~6歳)Worker (child 2-6 yrs) 215 1.4 30.4 26.1 6.0 17.7 17.3 1.5 0.4 4.0 1.3 1.4 2.1 5.4 5.4 0.4 11 .7 6.8
社会人(子供1歳以下)Worker (child 1 yr and under) 127 0.9 27.9 26.2 1.7 6.8 6.8 0.9 2.6 6.4 3.9 0.9 1.6 5.9 5.9 ― 12.7 12.8
社会人(既婚・子供無)Worker (married, no children) 987 2.3 21.0 18.6 4.9 5.4 4.9 0.5 3.6 4.7 2.9 0.9 1.7 6.5 6.3 1.8 15.9 7.6
社会人(独身)Worker (unmarried) 1,564 3.2 11.5 9.0 3.8 5.6 5.1 0.7 1.1 7.6 4.3 1.4 2.9 9.8 8.7 3.5 19.2 15.0
独身男性 Unmarried male 844 2.9 10 .4 7 .6 3.8 4.5 4.3 0.2 0.9 7.9 4.1 1.7 3.8 10.7 9.5 4.8 21.1 11.2
独身女性20・30代 Unmarried female 20s/30s 685 2.3 11.9 10.0 3.3 7.2 6.1 1.3 1.3 7.0 4.7 1.0 1.5 9.5 8.8 2.0 19.8 21.8
独身女性40代以上 Unmarried female 40s and over 269 3.7 10 .9 9.2 3.7 4.1 3.7 0.4 0.8 8.0 4.2 1.7 2.5 5.4 4.2 1.7 14.5 12.5
学生 Student 242 ― 7 .8 6 .9 1.8 4.2 3.7 0.5 0.5 7.3 4.5 1.9 1.4 6.9 6.9 1.4 22.1 18.3
ライト Light 891 0.6 17.0 14.6 3.7 8.0 7.5 0.5 1.2 3.7 1.9 1.0 0.9 5.2 4.8 1.6 16.8 9.6
ミドル Middle 1,181 1.1 15.0 12.5 3.3 6.6 5.8 1.0 1.2 5.3 2.9 1.0 1.8 6.1 5.6 1.7 19.7 9.0
ヘビー Heavy 2,944 3.1 15.9 13.7 4.3 5.4 4.9 0.7 1.6 9.0 4.8 1.7 4.0 8.9 8.3 2.7 16.8 12.6
Sample
Southeast
AsiaSingapore Phuket
Thai
beaches
(other
than
Phuket)
Bangkok
or other
Thai cities
Bali
Indonesian
beaches
(other
than Bali)
Indonesian
citiesMalaysia Philippines Vietnam Cambodia
Other
places in
Asia
Oceania Australia
New
Zealand or
other
Oceania
Long
distance
Medium
distance
Short
distance
TOTAL2018 survey total 5,016 23.2 5.3 1.1 1.2 5.9 2.1 0.2 0.6 2.9 3.0 4.7 1.5 2.6 5.8 4.7 1.3 36.3 42.5 44.8
2017 survey total 4,986 22.6 5.6 1.0 1.2 5.8 2.2 0.1 0.5 2.4 2.9 4.5 1.1 2.5 5.3 4.1 1.5 34.7 41.2 45.5
男性 Male 2,552 25.4 6.0 1.1 1.7 7.4 1.9 0.2 0.8 3.5 3.6 5.0 1.6 3.0 6.3 5.4 1.1 35.0 44.7 43.9
女性 Female 2,464 20.9 4.7 1.2 0.7 4.3 2.4 0.1 0.5 2.3 2.3 4.3 1.3 2.2 5.2 3.9 1.5 37.7 40.2 45.7
男性 18-29歳Male 18-29 yrs 371 20.0 5.7 0.3 1.5 5.7 1.8 0.3 0.9 1.8 1.8 4.8 1.5 2.4 7.2 6.3 0.9 37.6 41.2 42.1
男性 30-39歳Male 30-39 yrs 483 26.6 8.0 1.3 1.1 5.5 2.7 0.2 1.3 2.8 4.7 3.2 2.5 2.5 6.8 6.1 1.1 34.7 47.2 39 .7
男性 40-49歳Male 40-49 yrs 584 29.6 6.9 1.2 2.2 9.8 1.5 0.1 0.4 4.4 3.7 6.2 1.5 3.2 6.5 5.4 1.1 25 .7 49.2 47.5
男性 50-59歳Male 50-59 yrs 513 28.1 5.7 1.4 3.1 9.5 2.6 0.3 1.1 3.7 4.6 5.5 1.4 2.1 6.0 5.4 1.1 29 .6 44.9 48.8
男性 60歳以上Male 60 yrs or older 601 21.6 4.1 0.9 0.7 6.0 1.2 0.2 0.5 3.9 2.7 5.1 1.4 4.3 5.7 4.5 1.4 47.3 40.4 40.9
女性 18-29歳Female 18-29 yrs 651 20.6 4.9 0.7 0.5 4.2 3.1 0.2 0.7 2.1 3.1 3.6 0.7 0.9 5.5 4.2 1.4 28 .4 41.4 53.9
女性 30-39歳Female 30-39 yrs 465 17 .8 5.7 1.7 0.7 3.1 1.4 0.2 ― 1.9 2.9 3.1 0.5 1.4 5.0 3.3 2.1 35.4 40.1 44.7
女性 40-49歳Female 40-49 yrs 453 20.9 3.6 1.5 1.5 5.6 2.9 ― 0.7 2.2 1.7 3.6 1.2 2.2 6.1 4.9 1.5 36.0 37 .2 47.7
女性 50-59歳Female 50-59 yrs 408 23.1 5.3 1.7 0.3 5.0 3.3 ― 0.3 1.4 2.8 4.2 1.7 3.3 3.9 3.6 0.3 44.4 39.2 42.2
女性 60歳以上Female 60 yrs or older 488 22.5 3.8 0.9 0.5 4.0 0.9 0.2 0.5 3.8 0.9 6.9 2.8 3.8 5.2 3.3 1.9 48.3 42.2 37 .0
関東 Kanto 3,070 22.7 5.2 1.4 1.3 5.8 2.0 0.2 0.5 3.0 3.1 4.5 1.6 2.8 5.7 4.9 1.1 38.4 43.4 43.7
関西 Kansai 1,251 23.0 5.4 0.9 0.6 5.4 2.2 0.1 1.0 2.8 2.3 5.3 1.3 2.3 5.7 4.1 1.6 32.4 39.6 47.7
東海 Tokai 696 26.0 6.0 0.6 1.8 7.1 2.9 0.1 0.4 2.6 3.4 4.1 1.2 2.2 6.4 4.7 1.7 34.2 43.8 44.7
社会人(子供7歳以上)Worker (child 7 yrs and over) 1,882 24.0 5.2 1.4 1.0 5.6 1.9 0.1 0.4 3.1 2.3 5.8 1.8 2.5 5.5 4.5 1.2 38.2 42.6 43.2
社会人(子供2~6歳)Worker (child 2-6 yrs) 215 17 .6 4.8 1.4 1.8 2.8 1.4 ― 0.5 1.0 2.5 3.0 0.4 0.5 2.6 2.1 0.5 22 .3 49.1 44.3
社会人(子供1歳以下)Worker (child 1 yr and under) 127 21.8 10.4 1.6 0.9 2.9 2.7 ― 1.6 2.3 1.4 0.7 0.9 ― 5.4 5.4 ― 27 .1 53.1 38 .6
社会人(既婚・子供無)Worker (married, no children) 987 22.8 5.0 1.1 1.2 5.7 3.4 0.2 0.4 2.5 3.1 3.3 1.6 2.6 6.7 5.0 1.8 37.0 48.7 37 .7
社会人(独身)Worker (unmarried) 1,564 24.0 5.5 0.9 1.6 7.1 1.6 0.2 1.1 3.2 3.7 5.1 1.2 3.3 5.9 4.8 1.3 36.0 38.5 50.4
独身男性 Unmarried male 844 27.5 7.0 0.6 2.5 9.3 1.8 0.4 1.4 4.2 3.9 5.8 2.0 3.9 7.5 6.4 1.3 38.0 41.9 46.0
独身女性20・30代 Unmarried female 20s/30s 685 21.1 4.6 1.0 0.3 4.7 1.8 0.2 0.3 2.3 4.2 4.6 0.5 1.5 4.6 3.1 1.6 30 .0 34 .2 60.0
独身女性40代以上 Unmarried female 40s and over 269 16 .2 2.5 0.8 0.8 5.0 1.7 ― 1.2 2.1 2.1 2.0 1.3 5.0 5.0 4.6 0.4 46.7 32 .9 43.3
学生 Student 242 19.3 5.1 ― 0.5 5.6 2.8 0.5 0.5 2.8 4.1 2.3 2.3 1.8 6.9 5.5 1.4 38.6 30 .9 53.9
ライト Light 891 14 .3 4.1 0.3 0.3 2.5 1.5 0.2 0.4 0.9 2.2 3.0 0.6 1.1 5.4 4.4 1.0 26 .1 36 .2 44.3
ミドル Middle 1,181 20.1 5.2 1.4 0.5 4.3 2.0 0.2 0.3 2.2 2.6 3.7 0.7 0.9 5.3 4.1 1.2 30 .6 38.4 44.6
ヘビー Heavy 2,944 27.2 5.8 1.3 1.7 7.6 2.4 0.2 0.8 3.8 3.3 5.5 2.1 3.7 6.1 5.0 1.4 41.8 46.1 45.1
50.0 …Figures 5 or more points or higher than the 2018 survey total are shaded.
50 .0 …Figures 5 or more points or lower than the 2018 survey total are shaded.
Sex
Life
stage
Life
stage
Area of
residence
Area of
residence
Sex & age
Number of
trips taken
Sex & age
Sex
Canada or Alaska
Guam or Saipan
Europe USA (excluding Hawaii and Alaska)
Hong Kong or Macau
Middle East or Africa
Hawaii China (excluding Hong Kong and Macau)
Oceania
Area of
residence
Number of
trips taken
Sex & age
Sex
Southeast Asia
Life
stage
Number of
trips taken
Part 1 Trends in Overseas Travel Booking in 2017 Chapter 1 Outline of Overseas Travel in 2017
AB-ROAD Overseas Travel Survey 201819
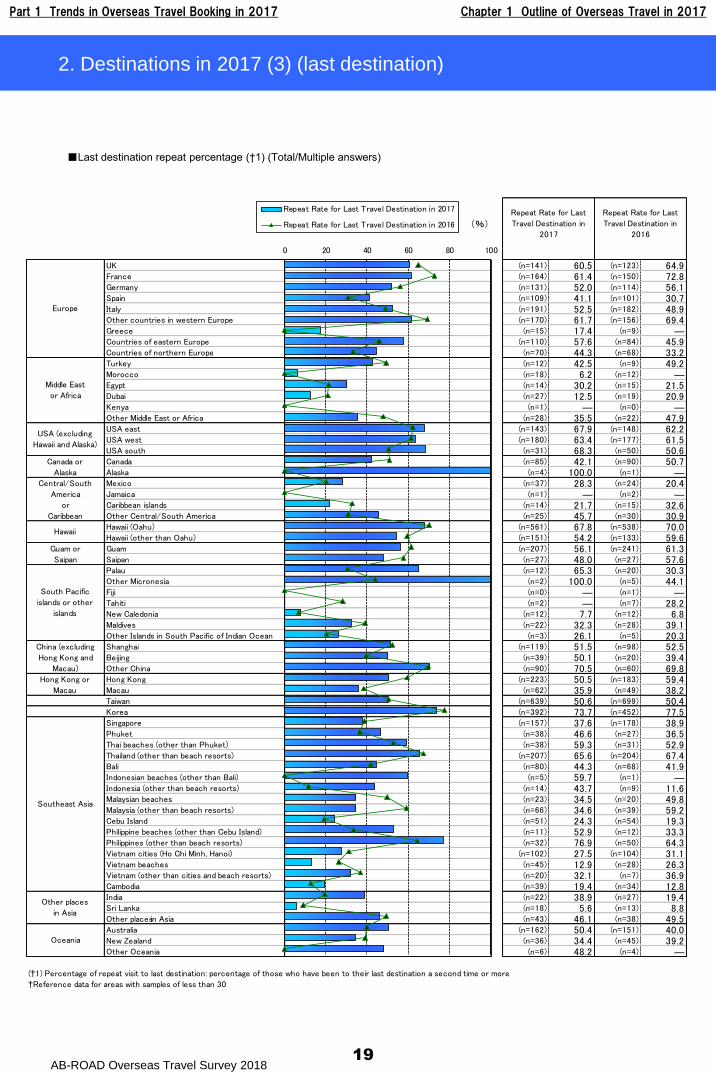
2. Destinations in 2017 (3) (last destination)
(%)
UK (n=141) 60.5 (n=123) 64.9France (n=164) 61.4 (n=150) 72.8Germany (n=131) 52.0 (n=114) 56.1Spain (n=109) 41.1 (n=101) 30.7Italy (n=191) 52.5 (n=182) 48.9Other countries in western Europe (n=170) 61.7 (n=156) 69.4Greece (n=15) 17.4 (n=9) ―Countries of eastern Europe (n=110) 57.6 (n=84) 45.9Countries of northern Europe (n=70) 44.3 (n=68) 33.2Turkey (n=12) 42.5 (n=9) 49.2Morocco (n=18) 6.2 (n=12) ―Egypt (n=14) 30.2 (n=15) 21.5Dubai (n=27) 12.5 (n=19) 20.9Kenya (n=1) ― (n=0) ―Other Middle East or Africa (n=28) 35.5 (n=22) 47.9USA east (n=143) 67.9 (n=148) 62.2USA west (n=180) 63.4 (n=177) 61.5USA south (n=31) 68.3 (n=50) 50.6Canada (n=85) 42.1 (n=90) 50.7Alaska (n=4) 100.0 (n=1) ―Mexico (n=37) 28.3 (n=24) 20.4Jamaica (n=1) ― (n=2) ―Caribbean islands (n=14) 21.7 (n=15) 32.6Other Central/South America (n=25) 45.7 (n=30) 30.9Hawaii (Oahu) (n=561) 67.8 (n=538) 70.0Hawaii (other than Oahu) (n=151) 54.2 (n=133) 59.6Guam (n=207) 56.1 (n=241) 61.3Saipan (n=27) 48.0 (n=27) 57.6Palau (n=12) 65.3 (n=20) 30.3Other Micronesia (n=2) 100.0 (n=5) 44.1Fiji (n=0) ― (n=1) ―Tahiti (n=2) ― (n=7) 28.2New Caledonia (n=12) 7.7 (n=12) 6.8Maldives (n=22) 32.3 (n=28) 39.1Other Islands in South Pacific of Indian Ocean (n=3) 26.1 (n=5) 20.3Shanghai (n=119) 51.5 (n=98) 52.5Beijing (n=39) 50.1 (n=20) 39.4Other China (n=90) 70.5 (n=60) 69.8Hong Kong (n=223) 50.5 (n=183) 59.4Macau (n=62) 35.9 (n=49) 38.2Taiwan (n=639) 50.6 (n=699) 50.4Korea (n=392) 73.7 (n=452) 77.5Singapore (n=157) 37.6 (n=178) 38.9Phuket (n=38) 46.6 (n=27) 36.5Thai beaches (other than Phuket) (n=38) 59.3 (n=31) 52.9Thailand (other than beach resorts) (n=207) 65.6 (n=204) 67.4Bali (n=80) 44.3 (n=68) 41.9Indonesian beaches (other than Bali) (n=5) 59.7 (n=1) ―Indonesia (other than beach resorts) (n=14) 43.7 (n=9) 11.6Malaysian beaches (n=23) 34.5 (n=20) 49.8Malaysia (other than beach resorts) (n=66) 34.6 (n=39) 59.2Cebu Island (n=51) 24.3 (n=54) 19.3Philippine beaches (other than Cebu Island) (n=11) 52.9 (n=12) 33.3Philippines (other than beach resorts) (n=32) 76.9 (n=50) 64.3Vietnam cities (Ho Chi Minh, Hanoi) (n=102) 27.5 (n=104) 31.1Vietnam beaches (n=45) 12.9 (n=28) 26.3Vietnam (other than cities and beach resorts) (n=20) 32.1 (n=7) 36.9Cambodia (n=39) 19.4 (n=34) 12.8India (n=22) 38.9 (n=27) 19.4Sri Lanka (n=18) 5.6 (n=13) 8.8Other placesin Asia (n=43) 46.1 (n=38) 49.5Australia (n=162) 50.4 (n=151) 40.0New Zealand (n=36) 34.4 (n=45) 39.2Other Oceania (n=6) 48.2 (n=4) ―
†Reference data for areas with samples of less than 30
China (excluding
Hong Kong and
Macau)
Hong Kong or
Macau
(†1) Percentage of repeat visit to last destination: percentage of those who have been to their last destination a second time or more
Canada or
Alaska
Repeat Rate for Last
Travel Destination in
2017
Repeat Rate for Last
Travel Destination in
2016
Europe
Middle East
or Africa
USA (excluding
Hawaii and Alaska)
Southeast Asia
Other places
in Asia
Oceania
Central/South
America
or
Caribbean
Hawaii
Guam or
Saipan
South Pacific
islands or other
islands
0 20 40 60 80 100
Repeat Rate for Last Travel Destination in 2017
Repeat Rate for Last Travel Destination in 2016
■Last destination repeat percentage (†1) (Total/Multiple answers)
Part 1 Trends in Overseas Travel Booking in 2017 Chapter 1 Outline of Overseas Travel in 2017
AB-ROAD Overseas Travel Survey 2018
(%)
TOTAL
Sample
Europe UK France Germany Spain Italy
Other
countries
in western
Europe
Other
places in
Europe
Middle East
or AfricaTurkey
Other
Middle East
or Africa
USA
(excluding
Hawaii and
Alaska)
USA east USA west USA southCanada or
AlaskaCanada Alaska
2018 survey total 5,016 62.7 33.1 42.9 31.8 26.1 39.3 30.0 26.5 23.1 13.8 17.8 51.5 31.7 40.8 14.7 25.8 25.2 3.6
2017 survey total 4,986 61.2 31.8 41.6 31.6 25.1 39.2 29.5 26.7 21.4 13.5 16.5 51.5 31.3 41.0 14.0 24.3 23.6 2.9
UK 141 100.0 100.0 65.6 51.2 26.8 41.3 42.6 35.1 28.1 17.3 17.7 50.6 36.3 37.9 13.7 27.5 26.0 3.6
France 164 100.0 54.4 100.0 54.3 45.4 59.2 47.4 33.3 26.9 11.4 24.3 52.7 36.8 37.4 15.9 24.6 24.6 4.7
Germany 131 100.0 50.3 66.4 100.0 39.5 55.9 58.6 40.4 33.5 19.8 27.6 54.7 34.6 36.5 20.6 33.0 32.4 4.8
Spain 109 100.0 48.1 64.3 51.1 100.0 76.7 49.8 38.8 36.6 28.0 23.7 61.3 40.6 47.2 19.2 30.7 30.7 3.0
Italy 191 100.0 48.1 67.1 46.9 47.9 100.0 47.9 43.4 31.3 19.3 27.3 44 .9 30.3 33 .8 11.0 26.0 24.0 4.7
Other countries in western Europe 170 100.0 54.9 75.1 71.2 53.1 69.4 100.0 58.7 43.2 34.3 32.4 59.9 41.5 47.2 19.5 41.3 40.1 6.6
Other places in Europe 194 100.0 52.7 68.6 62.3 52.6 65.7 70.9 100.0 43.5 31.8 33.1 58.6 38.3 43.5 17.3 37.0 36.4 2.8
Turkey 12 76.9 50.6 58.9 50.9 33.0 59.8 59.1 41.1 100.0 100.0 23.0 39.6 23.1 31.3 ― 33.1 33.1 ―
Other Middle East or Africa 87 82.3 45.3 58.6 48.2 41.6 51.5 52.7 46.7 100.0 21.6 100.0 64.0 45.6 46.2 14.9 32.5 32.5 4.8
USA east 143 70.3 46.9 50.5 40.4 29.6 44.8 38.7 29.6 26.8 17.3 18.9 100.0 100.0 62.6 33.5 38.6 38.6 2.9
USA west 180 62.7 34.2 40.3 33.6 22.3 39.8 26.4 22.8 22.9 14.2 20.1 100.0 49.2 100.0 24.0 36.3 35.7 6.0
USA south 31 56 .3 32.5 47.8 37.5 27.8 41.0 25 .0 26.9 25.4 22.1 12.9 100.0 57.6 62.5 100.0 49.1 49.1 21.7
Canada 85 69.9 35.1 48.9 44.1 31.5 41.8 35.3 33.4 26.9 16.5 19.4 60.9 39.7 55.1 25.0 100.0 100.0 4.4
Central/South America or Caribbean 71 82.0 44.4 51.7 39.3 41.6 53.2 48.9 57.3 55.1 39.4 46.1 74.3 48.5 67.9 25.9 48.9 47.4 9.8
Hawaii (Oahu) 561 48 .7 24 .0 35 .0 23 .5 19 .8 31 .6 19 .3 14 .7 14 .9 7 .1 11 .5 46.9 28.6 37.5 17.7 20 .5 20 .1 4.0
Hawaii (other than Oahu) 151 59.8 30.8 42.1 23 .3 17 .1 39.6 23 .5 16 .7 14 .9 6 .1 12.9 53.0 32.6 43.8 20.2 19 .8 18 .5 3.4
Guam 207 40 .0 21 .8 24 .6 9 .8 10 .4 24 .5 10 .6 10 .6 9 .8 4 .6 8 .3 45 .5 23 .7 40.0 11.0 18 .9 18 .2 1.8
Saipan 27 41.4 18.8 34.1 11.1 14.1 19.0 12.2 8.1 8.1 4.1 4.0 35.0 13.8 32.1 8.0 19.2 19.2 4.0
South Pacific islands or other islands 53 52 .7 17 .6 34 .8 19 .9 13 .6 36.5 15 .8 14 .0 19.0 10.0 14.9 42 .6 21 .4 34 .2 4 .2 19 .3 19 .3 2.2
Shanghai 119 55 .0 34.4 42.4 32.4 27.0 34.4 26.0 23.3 20.1 9.7 17.3 51.6 25 .9 41.7 16.1 21.2 21.2 3.6
Beijing 39 56 .1 33.0 39.9 42.9 35.7 32 .6 26.6 27.9 29.7 21.2 24.6 42 .0 29.0 26 .4 11.6 25.1 25.1 5.7
Other China (exc. Hong Kong / Macau) 90 54 .9 28.6 34 .5 34.9 27.9 33 .0 29.3 33.8 33.3 20.1 27.9 49.3 30.0 38.6 8 .8 22.4 22.4 4.4
Hong Kong 223 58.4 30.0 35 .8 24 .7 18 .2 33 .1 26.5 22.6 15 .3 8 .7 11 .4 49.6 28.4 36.4 15.3 20 .4 20.4 1.3
Macau 62 57.9 29.6 37 .1 25 .8 13 .3 32 .2 28.1 24.3 11 .0 6 .5 6 .2 44 .7 29.2 32 .8 13.4 22.3 20.6 1.8
Taiwan 639 51 .5 24 .8 33 .8 23 .2 18 .5 29 .3 21 .7 18 .2 15 .2 9.0 11 .0 41 .1 25 .5 33 .3 11.1 20 .4 19 .9 2.4
Korea 392 39 .6 18 .3 27 .3 15 .6 12 .4 22 .1 16 .1 13 .7 13 .0 8 .3 9 .4 36 .8 19 .2 27 .2 7 .7 15 .3 14 .8 1.6
Singapore 157 55 .5 25 .7 35 .9 27.3 20 .4 34.7 19 .3 17 .7 18.6 9.7 11 .8 46.9 26 .2 37.3 10.2 24.4 22.6 3.7
Phuket 38 41 .4 23 .1 24 .9 14 .3 18 .7 18 .7 17 .3 17 .9 18.2 7 .7 10 .4 32 .8 11 .8 22 .6 7 .4 14 .2 14 .2 5.6
Thai beaches (other than Phuket) 38 36 .1 23 .1 31 .6 14 .8 10 .8 15 .5 15 .5 13 .2 7 .9 2 .1 7 .9 53.7 26 .0 41.7 14.9 15 .6 15 .6 5.6
Bangkok or other Thai cities 207 55 .7 28.7 37 .0 29.2 26.0 33 .4 29.1 22.6 19.6 14.1 15.1 51.7 30.5 41.8 15.9 20 .4 19 .5 2.9
Bali 80 63.0 31.4 42.5 24 .9 19 .0 36.2 27.9 18 .3 28.9 12.6 20.0 51.3 26.8 32 .7 16.8 23.9 23.9 2.8
Indonesian cities 14 33.5 28.0 33.5 25.6 12.9 33.5 33.5 18.4 13.5 5.6 13.5 34.9 34.9 34.9 13.5 19.1 19.1 ―
Malaysia 84 73.1 41.0 54.1 35.8 28.4 49.6 32.2 24.7 28.7 18.2 22.9 50.5 34.5 41.4 17.8 31.0 28.2 4.1
Philippines 92 44 .3 19 .6 30 .5 18 .2 13 .9 28 .7 19 .7 16 .3 21.0 11.0 16.8 36 .8 18 .0 28 .9 7 .2 17 .3 16 .4 2.0
Vietnam 149 62.2 26 .3 41.1 26.9 26.7 34.6 26.8 29.5 26.6 17.1 19.0 44 .4 28.3 36.3 9 .2 21.3 20.5 1.5
Cambodia 39 70.2 33.5 54.7 40.3 37.0 50.8 50.1 33.6 40.8 33.1 25.7 48.0 33.1 31 .1 6 .9 26.1 23.4 2.6
Other places in Asia 84 77.9 34.2 51.8 40.6 37.7 49.8 36.7 44.5 49.4 32.7 38.0 53.9 38.8 41.8 9 .1 30.8 30.8 6.0
Australia 162 58.4 31.5 40.9 29.4 24.1 35.6 24 .2 19 .5 17 .3 12.3 14.2 59.3 34.4 49.7 15.1 26.3 25.1 6.0
New Zealand or other Oceania 42 60.4 37.2 38.7 35.5 34.6 39.7 28.2 19 .4 19.6 6 .9 17.4 59.0 34.8 47.3 21.9 44.1 41.5 9.0
Sample
Central/
South
America
or
Caribbean
HawaiiHawaii
(Oahu)
Hawaii
(other
than Oahu)
Guam or
SaipanGuam Saipan
South
Pacific
islands or
other
islands
China
(excluding
Hong Kong
and Macau)
Shanghai Beijing
Other
China (exc.
Hong Kong
/ Macau)
Hong Kong
or MacauHong Kong Macau Taiwan Korea
2018 survey total 5,016 14.6 54.8 49.8 26.9 44.9 41.0 19.2 12.8 36.1 26.3 20.2 19.6 43.1 42.2 22.7 52.8 51.3
2017 survey total 4,986 14.5 56.4 50.7 28.3 44.8 40.9 19.3 12.9 36.3 25.8 19.5 19.3 41.9 41.2 22.2 51.9 51.2
UK 141 14.1 30 .9 28 .1 20 .2 29 .8 24 .5 12 .5 12.2 30 .5 19 .6 21.0 19.5 36 .7 36 .7 19.1 38 .5 29 .6
France 164 13.7 41 .4 40 .0 18 .6 30 .0 26 .3 16.3 10.1 27 .4 15 .8 17.9 18.5 33 .7 33 .7 17 .5 38 .4 38 .6
Germany 131 15.5 34 .0 30 .6 18 .1 35 .8 30 .0 15.4 7 .8 28 .8 15 .9 18.4 15.5 38 .1 37 .2 17 .4 43 .3 44 .8
Spain 109 26.1 55.9 53.8 30.9 47.2 41.6 21.7 14.8 37.7 29.3 22.4 23.5 49.7 47.8 32.5 54.6 53.8
Italy 191 15.4 51.3 45.6 25.3 40.6 36.7 14 .1 12.5 34.3 26.9 18.4 19.8 40.3 40.3 23.5 45 .5 42 .6
Other countries in western Europe 170 20.8 48 .3 45.6 29.6 34 .0 30 .9 15.5 11.0 40.3 33.1 23.4 24.3 50.0 50.0 27.4 43 .4 47.7
Other places in Europe 194 16.8 50.9 47.7 24.6 35 .9 31 .2 13 .9 12.0 48.6 32.6 32.2 30.4 52.6 51.7 32.3 51.1 51.9
Turkey 12 8.3 35.2 35.2 26.4 36.0 36.0 ― ― 41.7 41.7 24.5 15.6 42.0 42.0 24.5 49.3 67.1
Other Middle East or Africa 87 26.4 40 .9 37 .4 20 .3 40.3 35 .2 22.7 19.4 48.9 31.4 29.9 30.6 58.3 58.3 34.4 57.0 54.4
USA east 143 17.6 47 .5 44 .5 23.2 41.5 37.2 19.4 15.5 39.1 27.5 20.6 16.1 41.6 41.0 22.8 40 .7 42 .2
USA west 180 24.7 53.4 44 .4 33.2 41.8 36.9 19.9 12.7 30 .1 20 .6 16.7 15.1 35 .3 34 .7 16 .6 42 .5 44 .7
USA south 31 29.4 63.0 63.0 28.7 42.8 36.8 21.5 15.7 37.1 31.1 21.6 18.3 48.9 48.9 20.8 38 .4 44 .4
Canada 85 26.2 55.5 47.1 29.5 39 .5 38.6 11 .5 11.5 32.0 21.7 17.8 13 .6 51.2 49.9 24.1 49.2 43 .6
Central/South America or Caribbean 71 100.0 54.8 45.2 31.5 40.1 34 .2 23.4 21.1 61.1 40.5 37.2 44.1 59.5 56.5 31.3 53.1 63.8
Hawaii (Oahu) 561 9 .1 100.0 100.0 42.9 50.2 48.2 21.5 12.8 24 .7 17 .1 12 .8 12 .1 34 .2 33 .4 14 .5 33 .0 41 .6
Hawaii (other than Oahu) 151 8 .6 100.0 61.1 100.0 49.3 47.3 21.6 14.2 28 .1 20 .4 16.1 9 .5 31 .8 31 .8 16 .9 34 .8 39 .4
Guam 207 11.0 58.0 53.1 25.3 100.0 100.0 26.1 14.3 24 .0 16 .8 12 .2 8 .4 35 .9 34 .5 15 .4 35 .0 44 .4
Saipan 27 4.0 44.2 44.2 26.1 100.0 63.1 100.0 17.6 11.2 7.1 4.0 ― 18.9 18.9 ― 33.1 45.4
South Pacific islands or other islands 53 10.3 45 .1 35 .5 19 .6 56.6 50.6 30.1 100.0 21 .1 12 .0 16.9 ― 24 .5 24 .5 12 .5 31 .9 37 .8
Shanghai 119 10.4 48 .3 45.7 28.0 46.4 43.5 25.3 11.1 100.0 100.0 35.9 34.3 48.7 47.8 25.0 53.1 51.1
Beijing 39 13.4 30 .1 30 .1 16 .1 26 .0 26 .0 7 .4 5 .1 100.0 47.8 100.0 35.8 38.8 38.8 23.0 52.4 38 .8
Other China (exc. Hong Kong / Macau) 90 13.5 43 .0 32 .9 20 .3 39 .3 32 .9 19.1 9.0 100.0 68.2 65.3 100.0 64.0 64.0 46.0 66.9 53.8
Hong Kong 223 11.3 51.6 48.1 22.8 46.8 43.5 19.8 10.6 42.1 29.0 20.6 24.3 100.0 100.0 48.2 60.2 58.6
Macau 62 8 .9 44 .2 42 .4 17 .4 38 .7 36.2 13 .6 6 .9 38.1 20 .0 13 .8 25.9 100.0 91.6 100.0 52.7 44 .8
Taiwan 639 10.8 44 .7 40 .7 19 .7 42.4 38.1 18.0 10.9 31.3 23.0 16.3 16.1 38.8 38.1 18.8 100.0 49.8
Korea 392 7 .5 43 .7 37 .3 20 .9 38 .1 35 .2 17.6 5 .9 26 .8 18 .1 13 .8 14 .2 36 .7 36 .0 18.4 41 .6 100.0
Singapore 157 12.2 51.2 47.3 20 .1 40.2 37.5 15.5 12.9 30 .3 22.8 15.6 15.6 39.8 39.0 23.4 45 .1 46 .1
Phuket 38 5 .7 56.6 46.3 29.1 66.3 60.5 37.3 19.9 17 .8 12 .9 5 .6 4 .8 40.0 40.0 17 .1 28 .3 46.5
Thai beaches (other than Phuket) 38 17.1 50.3 47.6 17 .4 43.4 34 .1 23.5 2 .1 32.0 14 .1 20.8 21.1 47.1 42.1 27.2 53.0 54.2
Bangkok or other Thai cities 207 18.7 49.9 47.0 21 .5 47.6 44.7 21.8 15.4 45.7 35.6 25.2 26.2 45.9 44.8 27.2 61.3 57.7
Bali 80 13.7 54.3 51.8 23.4 55.8 51.8 17.2 22.9 26 .0 23.2 13 .7 16.5 39.3 35 .9 25.1 53.9 57.0
Indonesian cities 14 5.6 41.6 41.6 21.6 12.1 12.1 6.4 ― 12.9 12.9 12.9 12.9 43.7 35.7 20.8 47.7 20.8
Malaysia 84 11.4 49 .4 47.0 24.6 38 .6 33 .7 15.9 8.1 49.1 35.1 27.9 26.9 51.1 50.2 31.7 61.0 64.0
Philippines 92 8 .7 43 .9 39 .7 13 .3 37 .0 33 .1 19.7 14.6 26 .1 20 .2 13 .3 16.2 36 .7 36 .7 20.1 45 .1 46.5
Vietnam 149 15.8 55.3 49.2 30.0 47.9 42.2 17.3 10.9 40.0 28.0 23.7 21.0 42.6 41.5 18.8 62.1 52.3
Cambodia 39 19.9 36 .5 34 .2 26.9 36 .4 25 .5 18.7 9.8 56.3 42.3 33.1 45.7 48.9 46.0 36.7 78.8 51.1
Other places in Asia 84 32.6 40 .7 36 .9 18 .2 42.0 36.1 17.4 13.9 58.8 45.7 39.5 34.5 49.8 49.8 31.7 61.5 57.0
Australia 162 9 .0 55.6 48.4 25.6 40.0 38.4 19.0 13.7 25 .9 20 .8 15.8 12 .6 33 .9 32 .7 18.4 40 .3 39 .4
New Zealand or other Oceania 42 18.3 50.5 39 .6 34.5 39 .7 39.7 16.6 23.2 32.4 17 .1 25.0 14.7 22 .2 22 .2 6 .8 42 .5 48.3
Sample
Southeast
AsiaSingapore Phuket
Thai
beaches
(other
than
Phuket)
Bangkok or
other Thai
cities
Bali
Indonesian
beaches
(other
than Bali)
Indonesian
citiesMalaysia Philippines Vietnam Cambodia
Other
places in
Asia
Oceania Australia
New
Zealand or
other
Oceania
2018 survey total 5,016 64.5 39.0 12.7 9.1 29.5 21.1 4.0 9.3 23.1 14.7 22.9 13.0 13.5 39.1 35.2 13.4
2017 survey total 4,986 63.9 38.0 12.0 9.4 29.6 20.8 4.3 8.7 21.6 14.3 21.6 12.4 11.9 37.9 34.2 13.1
UK 141 43 .3 25 .5 10.4 6.5 22 .2 15 .7 2.4 10.0 18.5 8 .8 20.4 10.5 10.4 34.7 31.2 13.5
France 164 51 .8 35.4 8.8 6.0 19 .5 18.9 3.6 4.5 14 .5 8 .7 14 .8 5 .6 7 .5 34.7 32.4 10.4
Germany 131 59 .3 37.1 10.3 8.1 33.2 17.3 3.3 11.6 19.8 9 .2 22.7 14.0 14.5 37.6 36.1 16.4
Spain 109 71.2 44.4 14.1 8.2 32.5 19.2 2.0 9.7 22.4 12.2 26.6 19.8 16.0 49.5 43.7 15.6
Italy 191 59 .2 35.0 6 .4 5.5 25.2 18.9 2.6 6.9 19.3 8 .4 19.7 13.7 12.1 36.7 31.1 14.9
Other countries in western Europe 170 63.5 47.4 12.9 5.7 27.6 17.7 3.1 13.5 25.7 10.4 25.1 19.4 19.4 43.5 40.9 16.5
Other places in Europe 194 66.2 49.4 13.3 6.6 30.8 26.0 5.6 15.4 30.7 15.6 33.8 23.9 24.3 41.9 36.7 18.8
Turkey 12 58.2 50.8 9.1 15.4 32.1 9.1 ― 6.5 32.8 15.4 32.8 14.8 23.9 33.0 23.9 9.1
Other Middle East or Africa 87 81.1 48.6 14.2 8.3 34.6 28.1 5.3 12.4 37.6 20.4 37.0 27.1 31.0 53.3 44.5 18.5
USA east 143 59.7 37.4 13.3 6.3 26.9 15 .3 4.5 5.5 22.2 14.9 17 .1 8.4 8 .2 39.1 39.1 16.2
USA west 180 56 .6 33 .5 10.5 5.9 24.8 20.0 3.9 7.6 19.4 12.6 18.5 9.8 11.2 44.0 39.8 14.7
USA south 31 54 .5 44.8 15.7 3 .6 21 .4 26.1 ― 6.9 24.9 14.4 12 .9 13.2 2 .5 45.4 39.3 16.4
Canada 85 62.1 45.9 10.7 7.6 30.0 24.3 3.6 4.9 23.5 15.7 22.0 12.0 15.3 50.9 45.3 25.6
Central/South America or Caribbean 71 81.7 50.3 19.5 13.2 37.2 39.7 10.5 21.2 33.6 15.8 40.4 44.0 33.6 55.7 50.2 23.5
Hawaii (Oahu) 561 50 .0 30 .6 12.7 8.0 16 .9 16.6 3.5 4.5 15 .8 10.0 9 .4 3 .8 6 .6 36.8 33.9 9.3
Hawaii (other than Oahu) 151 50 .6 25 .5 14.2 7.2 13 .9 21.7 5.5 5.5 15 .1 13.2 12 .3 6 .2 6 .3 37.9 35.3 9.0
Guam 207 50 .5 33 .9 10.1 5.3 18 .9 19.5 2.0 9.2 15 .4 15.0 6 .6 2 .0 4 .4 28 .3 27 .2 8.7
Saipan 27 65.9 31.1 12.0 4.0 10.8 24.8 8.0 ― 20.2 24.6 4.1 ― ― 18.2 18.2 4.0
South Pacific islands or other islands 53 68.8 33 .9 18.4 8.6 17 .4 37.8 9.1 5.1 21.6 27.1 11 .9 9.3 3 .4 33 .4 31.9 7 .4
Shanghai 119 57 .6 33 .2 12.9 5.4 25.7 15 .3 4.3 3 .7 22.3 12.2 24.5 11.6 8 .3 28 .9 26 .0 8 .3
Beijing 39 51 .4 34.2 10.0 9.5 28.4 12 .7 2.1 15.1 28.7 17.3 31.9 13.2 18.6 32 .8 29 .9 11.2
Other China (exc. Hong Kong / Macau) 90 71.5 41.7 12.7 10.8 32.1 15 .5 3.3 14.2 32.7 11.7 32.5 17.0 18.3 38.3 33.7 15.9
Hong Kong 223 66.3 42.1 13.1 6.5 28.7 20.7 3.2 9.1 25.6 16.4 23.6 10.5 11.9 37.9 34.1 10.9
Macau 62 61.2 36.3 14.2 8.3 23 .6 20.5 ― 7.1 31.0 12.6 19.2 11.3 6 .5 28 .4 25 .4 8 .3
Taiwan 639 55 .9 33 .7 8.1 6.2 27.4 15 .5 3.4 8.3 19.3 8 .7 19.5 9.8 10.1 33 .4 29 .4 9.8
Korea 392 51 .2 29 .8 7.9 6.1 23 .6 14 .7 1.8 5.1 15 .4 11.5 17 .6 7 .0 7 .8 29 .5 26 .5 6 .7
Singapore 157 100.0 100.0 14.8 10.7 27.9 16.4 3.1 7.4 29.5 11.4 16 .1 8.9 9.7 34.7 30.3 11.8
Phuket 38 100.0 32 .7 100.0 19.1 49.1 40.1 4.5 18.0 28.8 15.7 25.5 11.9 9.2 34.7 27 .5 17.9
Thai beaches (other than Phuket) 38 100.0 57.6 23.1 100.0 54.1 27.1 2.1 16.1 27.4 28.5 26.8 20.1 18.0 35.3 29 .5 7 .9
Bangkok or other Thai cities 207 100.0 44.9 28.3 24.8 100.0 27.2 5.3 15.9 36.0 25.3 33.1 24.2 26.3 42.2 38.9 17.3
Bali 80 100.0 41.0 18.4 9.4 32.2 100.0 7.6 15.6 22.1 16.3 28.4 12.0 11.3 37.0 37.0 9.5
Indonesian cities 14 100.0 55.6 5.6 5.6 50.1 35.8 6.4 100.0 47.7 5.6 18.4 15.0 28.7 28.7 21.5 12.9
Malaysia 84 100.0 65.4 23.8 15.9 53.7 37.2 4.6 14.6 100.0 24.4 37.0 21.1 16.8 40.3 31.8 18.8
Philippines 92 100.0 28 .1 15.5 16.2 30.6 17.7 3.0 8.5 16 .3 100.0 16 .2 13.9 20.2 27 .6 24 .5 8.7
Vietnam 149 100.0 46.9 13.4 8.2 38.6 24.0 3.0 13.8 31.2 15.6 100.0 22.8 18.5 35.9 32.6 16.0
Cambodia 39 100.0 43.2 16.4 14.7 60.4 31.0 16.5 16.0 40.4 22.6 75.6 100.0 28.8 48.2 45.3 22.1
Other places in Asia 84 85.0 52.1 16.2 17.0 58.8 28.3 8.8 25.4 47.9 28.2 47.3 43.9 100.0 37.2 35.9 11.9
Australia 162 56 .6 41.3 16.2 9.8 22 .5 25.4 7.7 7.9 22.5 11.3 18.3 13.9 11.9 100.0 100.0 24.5
New Zealand or other Oceania 42 42 .2 32 .7 2 .2 7.5 16 .7 20.1 4.1 9.5 14 .4 7 .3 17 .5 5 .0 10.0 100.0 48.6 100.0
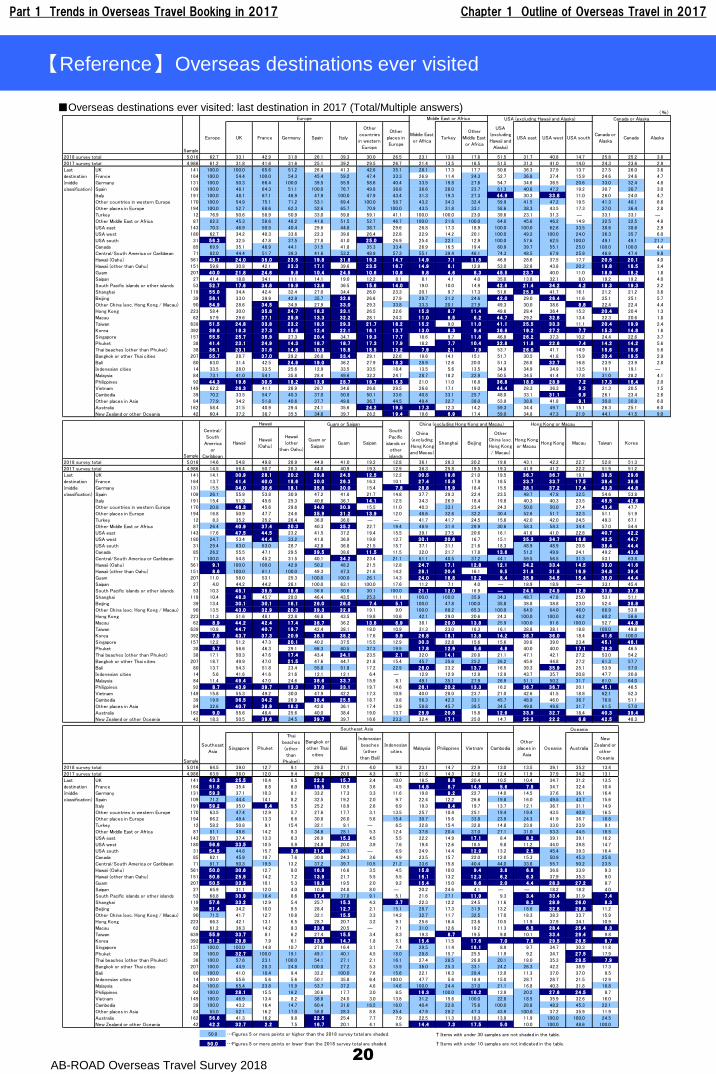
50.0 …Figures 5 or more points or higher than the 2018 survey total are shaded. † Items with under 30 samples are not shaded in the table.
50 .0 …Figures 5 or more points or lower than the 2018 survey total are shaded. † Items with under 10 samples are not indicated in the table.
Last
destination
(middle
classification)
Last
destination
(middle
classification)
Last
destination
(middle
classification)
Oceania
Europe Middle East or Africa USA (excluding Hawaii and Alaska)
China (excluding Hong Kong and Macau) Hong Kong or Macau
Canada or Alaska
Hawaii Guam or Saipan
Southeast Asia
20
【Reference】 Overseas destinations ever visited
■Overseas destinations ever visited: last destination in 2017 (Total/Multiple answers)
Part 1 Trends in Overseas Travel Booking in 2017 Chapter 1 Outline of Overseas Travel in 2017
AB-ROAD Overseas Travel Survey 201821
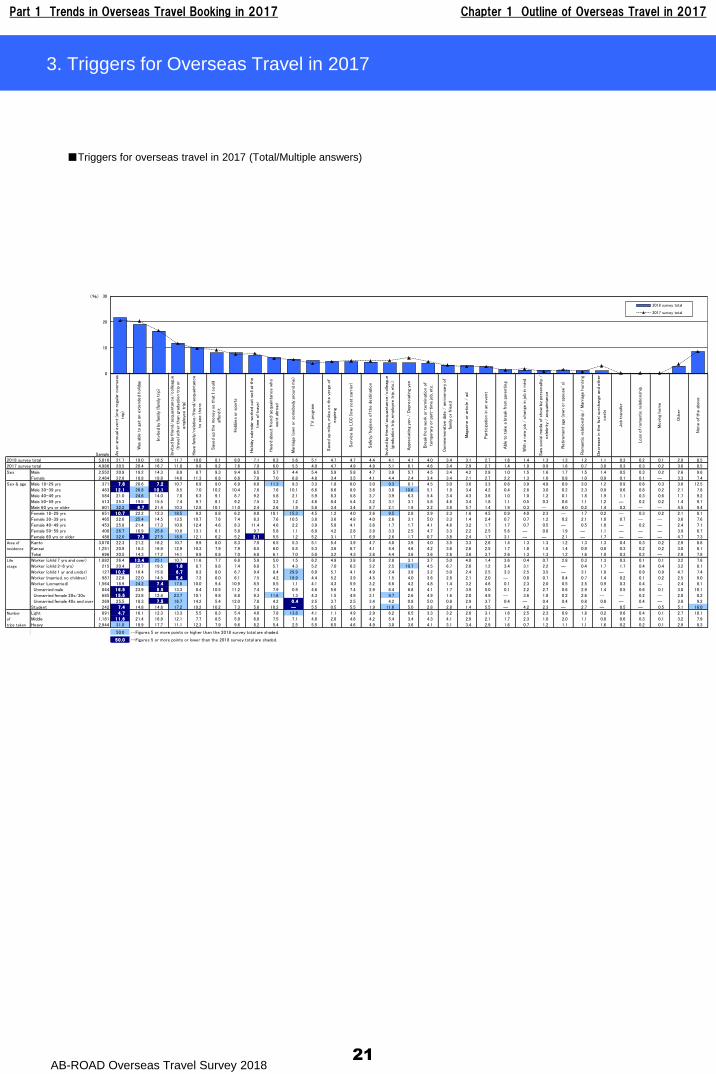
3. Triggers for Overseas Travel in 2017
Sample As
an a
nnual
eve
nt
(one r
egu
lar
ove
rseas
trip
)
Was
abl
e t
o g
et
an e
xtende
d holid
ay
Invi
ted
by fam
ily (fa
mily
trip)
Invi
ted
by friend/
acqu
ainta
nce/colle
ague
(tra
vel o
ther
than
gra
duat
ion t
rip
or
em
ploye
e t
rip)
Hav
e fam
ily/re
lative
/fr
iend/
acqu
ainta
nce
to s
ee t
here
Sav
ed
up
the m
oney
so t
hat
I c
ould
affo
rd it
Hobb
ies
or
sport
s
Holid
ay c
alenda
r w
ork
ed
out
well
at t
he
tim
e o
f tr
avel
Hear
d ab
out
frie
nd/
acqu
ainta
nce w
ho
went
abro
ad
Mar
riag
e (ow
n o
r so
mebo
dy a
round
me)
TV
pro
gram
Sav
ed
up
mile
s, m
iles
on t
he v
erg
e o
f
exp
irin
g
Serv
ice b
y LC
C (lo
w c
ost
car
rier)
Saf
ety
/hyg
iene o
f th
e d
est
inat
ion
Invi
ted
by friend/
acqu
ainta
nce/colle
ague
(gra
duat
ion t
rip,
em
ploye
e t
rip,
etc
.)
App
recia
ting
yen /
Depr
ecia
ting
yen
Bre
ak fro
m w
ork
or
term
inat
ion o
f
tem
pora
ry o
r pa
rt-tim
e jo
b, e
tc.
Com
mem
ora
tive
dat
e /
anniv
ers
ary
of
fam
ily o
r fr
iend
Mag
azin
e o
r ar
ticle
/ a
d
Par
ticip
atio
n in
an e
vent
Abl
e t
o t
ake a
bre
ak fro
m p
arenting
With a
new
job
/ c
han
ge in
job
in m
ind
Saw
socia
l medi
a of sh
ow
biz
pers
onal
ity
/
cele
brity
/ a
cqu
ainta
nce
Retire
ment
age (ow
n o
r sp
ouse
’s)
Rom
antic r
ela
tionsh
ip /
Mar
riag
e h
unting
Decre
ase in
the fuel s
urc
har
ge a
nd
oth
er
cost
s
Job
tran
sfer
Loss
of ro
man
tic r
ela
tionsh
ip
Movi
ng
hom
e
Oth
er
None o
f th
e a
bove
2018 survey total 5,016 21.7 19.0 16.5 11.7 10.0 8.1 8.0 7.1 6.3 5.6 5.1 4.7 4.7 4.4 4.1 4.1 4.0 3.4 3.1 2.7 1.6 1.4 1.3 1.3 1.2 1.1 0.3 0.2 0.1 2.9 8.5
2017 survey total 4,986 20.5 20.4 16.7 11.8 9.8 9.2 7.6 7.9 6.0 5.5 4.0 4.7 4.9 4.9 5.1 6.1 4.6 3.4 2.9 2.7 1.4 1.9 0.9 1.6 0.7 3.0 0.3 0.3 0.2 3.6 8.5
Male 2,552 20.9 19.2 14.3 8.9 8.7 9.3 9.4 6.5 5.7 4.4 5.4 5.9 5.8 4.7 3.9 5.7 4.5 3.4 4.2 2.8 1.0 1.5 1.6 1.7 1.5 1.4 0.5 0.3 0.2 2.6 9.6
Female 2,464 22.6 18.8 18.8 14.6 11.3 6.8 6.6 7.8 7.0 6.8 4.8 3.4 3.5 4.1 4.4 2.4 3.4 3.4 2.1 2.7 2.2 1.3 1.0 0.8 1.0 0.9 0.1 0.1 ― 3.3 7.4
Male 18-29 yrs 371 7 .8 20.6 7 .2 10.7 6.9 9.0 6.9 6.0 11.3 9.3 3.3 1.8 6.0 3.0 9.3 8.1 4.5 3.0 3.6 3.3 0.6 3.9 4.8 0.9 3.0 1.2 0.9 0.6 0.3 3.6 12.5
Male 30-39 yrs 483 12 .1 26.8 10 .1 8.5 7.0 10.2 10.4 7.6 7.6 10.1 6.6 6.6 8.9 3.6 3.0 10.6 5.1 1.9 3.4 4.2 0.4 2.8 3.0 0.2 2.3 0.9 0.6 0.8 0.2 2.1 7.8
Male 40-49 yrs 584 21.0 24.6 14.0 7.8 6.3 9.1 8.7 9.2 5.8 2.1 5.9 8.3 5.8 3.7 3.9 6.3 5.4 3.4 4.3 3.6 1.0 1.0 1.2 0.1 1.8 1.9 1.1 0.3 0.6 1.7 9.2
Male 50-59 yrs 513 25.3 19.5 15.5 7.4 9.7 8.1 9.2 7.5 3.2 1.2 4.6 8.4 5.4 3.2 3.1 3.1 5.8 4.6 3.4 1.8 1.1 0.5 0.3 0.6 1.1 1.2 ― 0.2 0.2 1.4 9.7
Male 60 yrs or older 601 32.2 6 .7 21.4 10.3 12.8 10.1 11.0 2.4 2.6 1.9 5.8 3.4 3.4 8.7 2.1 1.9 2.2 3.8 5.7 1.4 1.9 0.3 ― 6.0 0.2 1.4 0.2 ― ― 4.5 9.4
Female 18-29 yrs 651 10 .7 22.2 12.3 18.5 9.2 8.8 6.2 8.0 10.1 15.3 4.5 1.2 4.0 2.6 9.5 2.8 2.9 2.3 1.6 4.5 0.9 4.0 2.3 ― 1.7 0.2 ― 0.3 0.2 2.1 8.1
Female 30-39 yrs 465 22.6 25.4 14.5 13.5 10.7 7.6 7.4 8.3 7.6 10.5 3.8 3.6 4.8 4.0 2.6 3.1 5.0 3.3 1.4 2.4 0.7 0.7 1.2 0.2 2.1 1.0 0.7 ― ― 3.6 7.6
Female 40-49 yrs 453 25.8 21.4 17.3 10.0 12.4 4.6 8.3 11.4 4.6 2.2 3.9 5.8 4.1 3.6 1.7 1.7 4.1 4.6 3.2 1.7 1.7 0.7 0.5 ― 0.5 1.0 ― 0.2 ― 2.4 7.1
Female 50-59 yrs 408 26.7 16.9 25.6 10.8 13.1 6.1 5.8 9.7 5.8 1.1 6.9 4.2 2.8 3.9 3.3 2.5 4.7 3.3 2.2 2.5 5.6 ― 0.8 1.9 ― 1.1 ― ― ― 3.9 6.7
Female 60 yrs or older 488 32.0 7 .3 27.5 18.0 12.1 6.2 5.2 2 .1 5.5 1.2 5.2 3.1 1.7 6.9 2.6 1.7 0.7 3.8 2.4 1.7 3.1 ― ― 2.1 ― 1.7 ― ― ― 4.7 7.3
Kanto 3,070 22.3 21.2 16.2 10.7 9.9 8.0 8.3 7.5 6.5 5.3 5.1 5.4 3.9 4.7 4.0 3.9 4.0 3.5 3.3 2.6 1.4 1.3 1.3 1.2 1.3 1.3 0.4 0.3 0.2 2.9 8.8
Kansai 1,251 20.9 16.3 16.9 12.9 10.3 7.9 7.9 6.5 6.0 5.5 5.3 3.6 6.7 4.1 4.4 4.6 4.2 3.6 2.6 2.5 1.7 1.8 1.5 1.4 0.9 0.8 0.3 0.2 0.2 3.0 8.1
Tokai 696 20.5 14.3 17.2 14.1 9.9 8.8 7.0 6.8 6.1 7.0 5.0 3.2 4.3 3.8 4.4 3.6 3.6 2.6 3.6 3.7 2.6 1.3 1.3 1.2 1.6 1.0 0.3 0.2 ― 2.9 7.8
Worker (child 7 yrs and over) 1,882 26.4 13 .4 25.1 10.7 11.6 7.7 6.8 5.9 5.0 1.5 6.2 4.9 3.8 5.8 2.8 3.1 3.7 5.0 4.0 1.4 3.6 0.4 0.7 2.8 0.3 1.3 0.3 0.1 0.1 3.2 7.8
Worker (child 2-6 yrs) 215 20.4 22.7 19.5 1 .8 8.7 9.8 7.4 6.8 5.7 4.3 5.2 7.0 6.3 3.2 2.5 10.7 4.5 6.7 2.0 1.2 3.4 3.1 2.2 ― 0.4 1.7 1.7 0.4 0.4 3.2 8.1
Worker (child 1 yr and under) 127 10 .2 16.4 15.6 6 .7 9.3 8.0 6.7 9.4 8.4 29.9 6.0 5.7 4.1 4.9 2.4 3.9 3.2 5.0 2.4 2.5 3.3 2.5 3.5 ― 3.1 1.8 ― 0.9 0.9 4.7 7.4
Worker (married, no children) 987 22.6 22.0 14.5 5 .4 7.3 6.0 6.1 7.5 4.2 18.9 4.4 5.2 3.9 4.5 1.5 4.0 3.6 2.8 2.1 2.0 ― 0.8 0.7 0.4 0.7 1.4 0.2 0.1 0.2 2.5 9.0
Worker (unmarried) 1,564 18.9 24.2 7 .4 17.8 10.0 9.4 10.9 8.5 8.5 1.1 4.1 4.3 5.9 3.2 6.6 4.2 4.8 1.4 3.2 4.6 0.1 2.3 2.0 0.5 2.5 0.9 0.3 0.4 ― 2.4 8.1
Unmarried male 844 16 .5 23.9 5 .5 13.3 8.4 10.5 11.2 7.4 7.9 0.9 4.6 5.6 7.4 2.9 6.4 6.8 4.1 1.7 3.9 5.0 0.1 2.2 2.7 0.6 2.9 1.4 0.5 0.6 0.1 3.0 10.1
Unmarried female 20s/30s 685 15 .5 23.8 12.4 23.7 10.1 9.8 8.8 9.3 11.6 1.3 4.3 1.5 4.9 3.1 9.7 2.6 4.9 1.6 2.0 4.9 ― 3.6 1.8 0.2 2.6 ― ― 0.2 ― 2.0 8.2
Unmarried female 40s and over 269 25.5 18.3 7 .5 16.7 14.2 5.4 12.0 7.8 4.2 0 .4 2.5 3.7 2.5 3.4 4.2 0.8 5.0 0.8 2.9 3.7 0.4 ― 0.4 0.4 0.8 0.8 ― 0.4 ― 3.8 9.2
Student 242 7 .4 14.8 14.8 17.2 10.2 10.2 7.3 5.6 10.2 ― 5.5 0.5 5.5 1.9 11.6 5.0 2.8 2.8 1.4 5.5 ― 4.2 2.3 ― 2.7 ― 0.5 ― 0.5 5.1 16.0
Light 891 4 .7 16.1 12.3 13.3 5.5 8.3 5.4 4.0 7.8 13.8 4.1 1.1 4.9 2.9 6.2 6.5 3.3 3.2 2.6 3.1 1.6 2.5 2.3 0.9 1.8 0.2 0.6 0.4 0.1 2.7 10.1
Middle 1,181 11 .6 21.4 16.9 12.1 7.7 8.5 5.9 6.8 7.5 7.1 4.8 2.8 4.6 4.2 5.4 3.4 4.3 4.1 2.9 2.1 1.7 2.3 1.0 2.0 1.1 0.8 0.6 0.3 0.1 3.2 7.9
Heavy 2,944 31.0 18.9 17.7 11.1 12.3 7.9 9.6 8.2 5.4 2.5 5.5 6.5 4.6 4.9 3.0 3.6 4.1 3.1 3.4 2.9 1.6 0.7 1.2 1.1 1.1 1.6 0.2 0.2 0.1 2.9 8.3
50.0 …Figures 5 or more points or higher than the 2018 survey total are shaded.
50 .0 …Figures 5 or more points or lower than the 2018 survey total are shaded.
Sex
Sex & age
Area of
residence
Life
stage
Number
of
trips taken
0
10
20
30
2018 survey total
2017 survey total
(%)
■Triggers for overseas travel in 2017 (Total/Multiple answers)
Part 1 Trends in Overseas Travel Booking in 2017 Chapter 1 Outline of Overseas Travel in 2017
AB-ROAD Overseas Travel Survey 201822
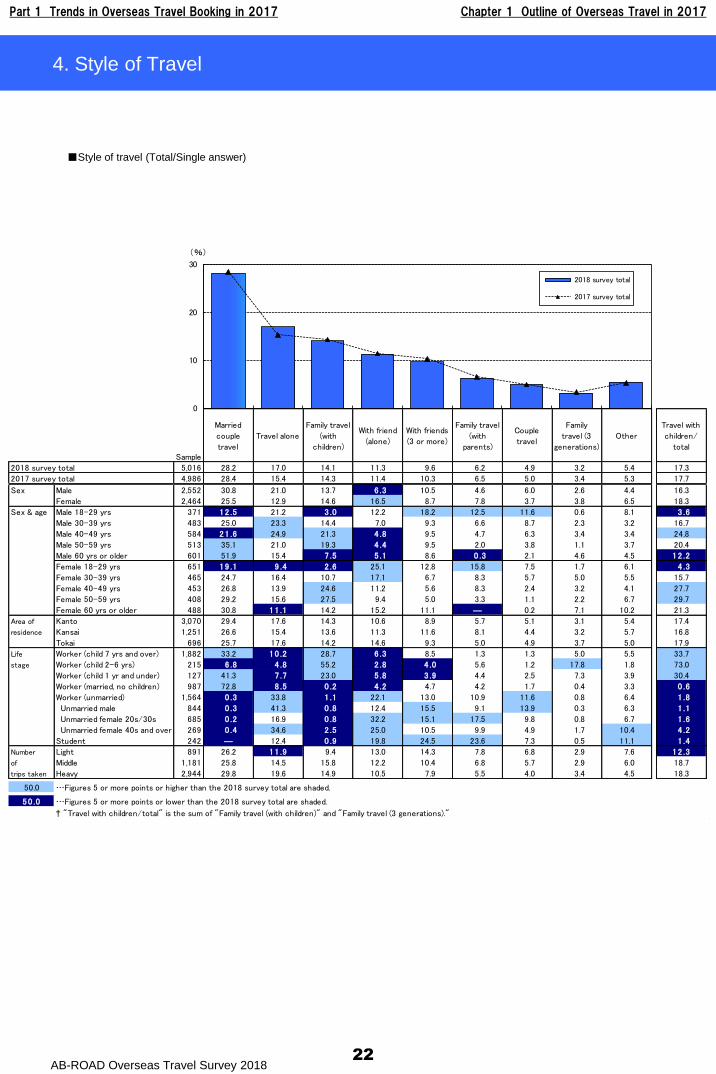
4. Style of Travel
Sample
Married
couple
travel
Travel alone
Family travel
(with
children)
With friend
(alone)
With friends
(3 or more)
Family travel
(with
parents)
Couple
travel
Family
travel (3
generations)
Other
Travel with
children/
total
2018 survey total 5,016 28.2 17.0 14.1 11.3 9.6 6.2 4.9 3.2 5.4 17.3
2017 survey total 4,986 28.4 15.4 14.3 11.4 10.3 6.5 5.0 3.4 5.3 17.7
Male 2,552 30.8 21.0 13.7 6 .3 10.5 4.6 6.0 2.6 4.4 16.3
Female 2,464 25.5 12.9 14.6 16.5 8.7 7.8 3.7 3.8 6.5 18.3
Male 18-29 yrs 371 12 .5 21.2 3 .0 12.2 18.2 12.5 11.6 0.6 8.1 3 .6
Male 30-39 yrs 483 25.0 23.3 14.4 7.0 9.3 6.6 8.7 2.3 3.2 16.7
Male 40-49 yrs 584 21 .6 24.9 21.3 4 .8 9.5 4.7 6.3 3.4 3.4 24.8
Male 50-59 yrs 513 35.1 21.0 19.3 4 .4 9.5 2.0 3.8 1.1 3.7 20.4
Male 60 yrs or older 601 51.9 15.4 7 .5 5 .1 8.6 0 .3 2.1 4.6 4.5 12 .2
Female 18-29 yrs 651 19 .1 9 .4 2 .6 25.1 12.8 15.8 7.5 1.7 6.1 4 .3
Female 30-39 yrs 465 24.7 16.4 10.7 17.1 6.7 8.3 5.7 5.0 5.5 15.7
Female 40-49 yrs 453 26.8 13.9 24.6 11.2 5.6 8.3 2.4 3.2 4.1 27.7
Female 50-59 yrs 408 29.2 15.6 27.5 9.4 5.0 3.3 1.1 2.2 6.7 29.7
Female 60 yrs or older 488 30.8 11 .1 14.2 15.2 11.1 ― 0.2 7.1 10.2 21.3
Kanto 3,070 29.4 17.6 14.3 10.6 8.9 5.7 5.1 3.1 5.4 17.4
Kansai 1,251 26.6 15.4 13.6 11.3 11.6 8.1 4.4 3.2 5.7 16.8
Tokai 696 25.7 17.6 14.2 14.6 9.3 5.0 4.9 3.7 5.0 17.9
Worker (child 7 yrs and over) 1,882 33.2 10 .2 28.7 6 .3 8.5 1.3 1.3 5.0 5.5 33.7
Worker (child 2-6 yrs) 215 6 .8 4 .8 55.2 2 .8 4 .0 5.6 1.2 17.8 1.8 73.0
Worker (child 1 yr and under) 127 41.3 7 .7 23.0 5 .8 3 .9 4.4 2.5 7.3 3.9 30.4
Worker (married, no children) 987 72.8 8 .5 0 .2 4 .2 4.7 4.2 1.7 0.4 3.3 0 .6
Worker (unmarried) 1,564 0 .3 33.8 1 .1 22.1 13.0 10.9 11.6 0.8 6.4 1 .8
Unmarried male 844 0 .3 41.3 0 .8 12.4 15.5 9.1 13.9 0.3 6.3 1 .1
Unmarried female 20s/30s 685 0 .2 16.9 0 .8 32.2 15.1 17.5 9.8 0.8 6.7 1 .6
Unmarried female 40s and over 269 0 .4 34.6 2 .5 25.0 10.5 9.9 4.9 1.7 10.4 4 .2
Student 242 ― 12.4 0 .9 19.8 24.5 23.6 7.3 0.5 11.1 1 .4
Light 891 26.2 11 .9 9.4 13.0 14.3 7.8 6.8 2.9 7.6 12 .3
Middle 1,181 25.8 14.5 15.8 12.2 10.4 6.8 5.7 2.9 6.0 18.7
Heavy 2,944 29.8 19.6 14.9 10.5 7.9 5.5 4.0 3.4 4.5 18.3
50.0 …Figures 5 or more points or higher than the 2018 survey total are shaded.
50 .0 …Figures 5 or more points or lower than the 2018 survey total are shaded.
† "Travel with children/total" is the sum of "Family travel (with children)" and "Family travel (3 generations)."
Sex
Life
stage
Sex & age
Number
of
trips taken
Area of
residence
0
10
20
30
2018 survey total
2017 survey total
(%)
■Style of travel (Total/Single answer)
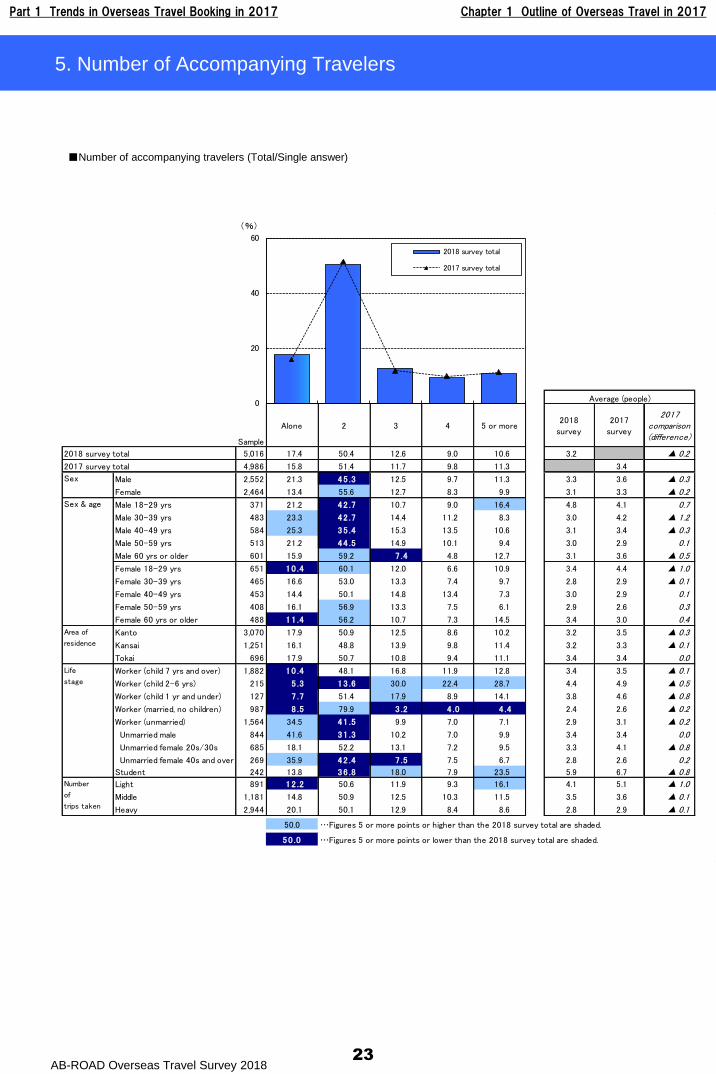
Part 1 Trends in Overseas Travel Booking in 2017 Chapter 1 Outline of Overseas Travel in 2017
AB-ROAD Overseas Travel Survey 201823
5. Number of Accompanying Travelers
Sample
Alone 2 3 4 5 or more2018
survey
2017
survey
2017comparison(difference)
2018 survey total 5,016 17.4 50.4 12.6 9.0 10.6 3.2 ▲ 0.2
2017 survey total 4,986 15.8 51.4 11.7 9.8 11.3 3.4
Male 2,552 21.3 45 .3 12.5 9.7 11.3 3.3 3.6 ▲ 0.3
Female 2,464 13.4 55.6 12.7 8.3 9.9 3.1 3.3 ▲ 0.2
Male 18-29 yrs 371 21.2 42 .7 10.7 9.0 16.4 4.8 4.1 0.7
Male 30-39 yrs 483 23.3 42 .7 14.4 11.2 8.3 3.0 4.2 ▲ 1.2
Male 40-49 yrs 584 25.3 35 .4 15.3 13.5 10.6 3.1 3.4 ▲ 0.3
Male 50-59 yrs 513 21.2 44 .5 14.9 10.1 9.4 3.0 2.9 0.1
Male 60 yrs or older 601 15.9 59.2 7 .4 4.8 12.7 3.1 3.6 ▲ 0.5
Female 18-29 yrs 651 10 .4 60.1 12.0 6.6 10.9 3.4 4.4 ▲ 1.0
Female 30-39 yrs 465 16.6 53.0 13.3 7.4 9.7 2.8 2.9 ▲ 0.1
Female 40-49 yrs 453 14.4 50.1 14.8 13.4 7.3 3.0 2.9 0.1
Female 50-59 yrs 408 16.1 56.9 13.3 7.5 6.1 2.9 2.6 0.3
Female 60 yrs or older 488 11 .4 56.2 10.7 7.3 14.5 3.4 3.0 0.4
Kanto 3,070 17.9 50.9 12.5 8.6 10.2 3.2 3.5 ▲ 0.3
Kansai 1,251 16.1 48.8 13.9 9.8 11.4 3.2 3.3 ▲ 0.1
Tokai 696 17.9 50.7 10.8 9.4 11.1 3.4 3.4 0.0
Worker (child 7 yrs and over) 1,882 10 .4 48.1 16.8 11.9 12.8 3.4 3.5 ▲ 0.1
Worker (child 2-6 yrs) 215 5 .3 13 .6 30.0 22.4 28.7 4.4 4.9 ▲ 0.5
Worker (child 1 yr and under) 127 7 .7 51.4 17.9 8.9 14.1 3.8 4.6 ▲ 0.8
Worker (married, no children) 987 8 .5 79.9 3 .2 4 .0 4 .4 2.4 2.6 ▲ 0.2
Worker (unmarried) 1,564 34.5 41 .5 9.9 7.0 7.1 2.9 3.1 ▲ 0.2
Unmarried male 844 41.6 31 .3 10.2 7.0 9.9 3.4 3.4 0.0
Unmarried female 20s/30s 685 18.1 52.2 13.1 7.2 9.5 3.3 4.1 ▲ 0.8
Unmarried female 40s and over 269 35.9 42 .4 7 .5 7.5 6.7 2.8 2.6 0.2
Student 242 13.8 36 .8 18.0 7.9 23.5 5.9 6.7 ▲ 0.8
Light 891 12 .2 50.6 11.9 9.3 16.1 4.1 5.1 ▲ 1.0
Middle 1,181 14.8 50.9 12.5 10.3 11.5 3.5 3.6 ▲ 0.1
Heavy 2,944 20.1 50.1 12.9 8.4 8.6 2.8 2.9 ▲ 0.1
50.0 …Figures 5 or more points or higher than the 2018 survey total are shaded.
50 .0 …Figures 5 or more points or lower than the 2018 survey total are shaded.
Number
of
trips taken
Average (people)
Sex
Sex & age
Area of
residence
Life
stage
0
20
40
60
2018 survey total
2017 survey total
(%)
■Number of accompanying travelers (Total/Single answer)
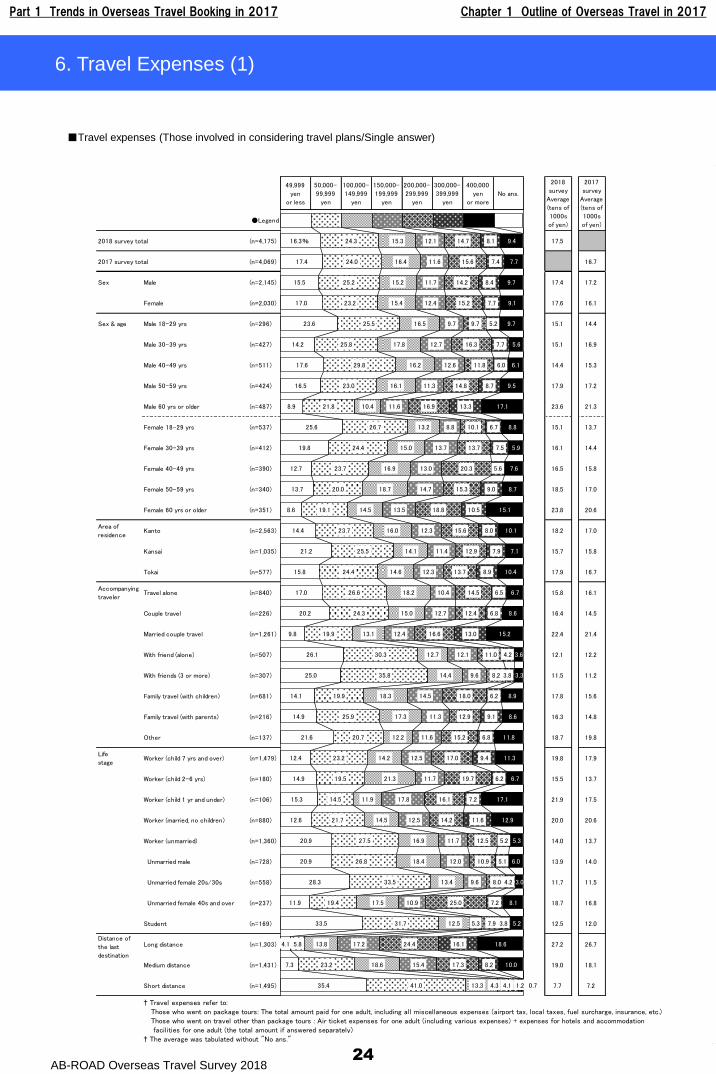
Part 1 Trends in Overseas Travel Booking in 2017 Chapter 1 Outline of Overseas Travel in 2017
AB-ROAD Overseas Travel Survey 2018
49,999
yen
or less
50,000-
99,999
yen
100,000-
149,999
yen
150,000-
199,999
yen
200,000-
299,999
yen
300,000-
399,999
yen
400,000
yen
or more
No ans.
●Legend
2018 survey total (n=4,175) 17.5
2017 survey total (n=4,069) 16.7
Sex Male (n=2,145) 17.4 17.2
Female (n=2,030) 17.6 16.1
Sex & age Male 18-29 yrs (n=296) 15.1 14.4
Male 30-39 yrs (n=427) 15.1 16.9
Male 40-49 yrs (n=511) 14.4 15.3
Male 50-59 yrs (n=424) 17.9 17.2
Male 60 yrs or older (n=487) 23.6 21.3
Female 18-29 yrs (n=537) 15.1 13.7
Female 30-39 yrs (n=412) 16.1 14.4
Female 40-49 yrs (n=390) 16.5 15.8
Female 50-59 yrs (n=340) 18.5 17.0
Female 60 yrs or older (n=351) 23.8 20.6
Area of
residenceKanto (n=2,563) 18.2 17.0
Kansai (n=1,035) 15.7 15.8
Tokai (n=577) 17.9 16.7
Accompanying
travelerTravel alone (n=840) 15.8 16.1
Couple travel (n=226) 16.4 14.5
Married couple travel (n=1,261) 22.4 21.4
With friend (alone) (n=507) 12.1 12.2
With friends (3 or more) (n=307) 11.5 11.2
Family travel (with children) (n=681) 17.8 15.6
Family travel (with parents) (n=216) 16.3 14.8
Other (n=137) 18.7 19.8
Life
stageWorker (child 7 yrs and over) (n=1,479) 19.8 17.9
Worker (child 2-6 yrs) (n=180) 15.5 13.7
Worker (child 1 yr and under) (n=106) 21.9 17.5
Worker (married, no children) (n=880) 20.0 20.6
Worker (unmarried) (n=1,360) 14.0 13.7
Unmarried male (n=728) 13.9 14.0
Unmarried female 20s/30s (n=558) 11.7 11.5
Unmarried female 40s and over (n=237) 18.7 16.8
Student (n=169) 12.5 12.0
Long distance (n=1,303) 27.2 26.7
Medium distance (n=1,431) 19.0 18.1
Short distance (n=1,495) 7.7 7.2
† Travel expenses refer to:
† The average was tabulated without "No ans."
Those who went on package tours: The total amount paid for one adult, including all miscellaneous expenses (airport tax, local taxes, fuel surcharge, insurance, etc.)
Those who went on travel other than package tours : Air ticket expenses for one adult (including various expenses) + expenses for hotels and accommodation
facilities for one adult (the total amount if answered separately)
Distance of
the last
destination
2018
survey
Average
(tens of
1000s
of yen)
2017
survey
Average
(tens of
1000s
of yen)
16.3%
17.4
15.5
17.0
23.6
14.2
17.6
16.5
8.9
25.6
19.8
12.7
13.7
8.6
14.4
21.2
15.8
17.0
20.2
9.8
26.1
25.0
14.1
14.9
21.6
12.4
14.9
15.3
12.6
20.9
20.9
28.3
11.9
33.5
4.1
7.3
35.4
24.3
24.0
25.2
23.2
25.5
25.8
29.8
23.0
21.8
26.7
24.4
23.7
20.0
19.1
23.7
25.5
24.4
26.6
24.3
19.9
30.3
35.8
19.9
25.9
20.7
23.2
19.5
14.5
21.7
27.5
26.8
33.5
19.4
31.7
5.8
23.2
41.0
15.3
16.4
15.2
15.4
16.5
17.8
16.2
16.1
10.4
13.2
15.0
16.9
18.7
14.5
16.0
14.1
14.6
18.2
15.0
13.1
12.7
14.4
18.3
17.3
12.2
14.2
21.3
11.9
14.5
16.9
18.4
13.4
17.5
12.5
13.8
18.6
13.3
12.1
11.6
11.7
12.4
9.7
12.7
12.6
11.3
11.6
8.8
13.7
13.0
14.7
13.5
12.3
11.4
12.3
10.4
12.7
12.4
12.1
9.6
14.5
11.3
11.6
12.5
11.7
17.8
12.5
11.7
12.0
9.6
10.9
5.3
17.2
15.4
4.3
14.7
15.6
14.2
15.2
9.7
16.3
11.8
14.8
16.9
10.1
13.7
20.3
15.3
18.8
15.6
12.9
13.7
14.5
12.4
16.6
11.0
8.2
18.0
12.9
15.2
17.0
19.7
16.1
14.2
12.5
10.9
8.0
25.0
7.9
24.4
17.3
4.1
8.1
7.4
8.4
7.7
5.2
7.7
6.0
8.7
13.3
6.7
7.5
5.6
9.0
10.5
8.0
7.9
8.9
6.5
6.8
13.0
4.2
3.8
6.2
9.1
6.8
9.4
6.2
7.2
11.6
5.2
5.1
4.2
7.2
3.8
16.1
8.2
1.2
9.4
7.7
9.7
9.1
9.7
5.6
6.1
9.5
17.1
8.8
5.9
7.6
8.7
15.1
10.1
7.1
10.4
6.7
8.6
15.2
3.6
3.3
8.9
8.6
11.8
11.3
6.7
17.1
12.9
5.3
6.0
3.0
8.1
5.2
18.6
10.0
0.7
24
6. Travel Expenses (1)
■Travel expenses (Those involved in considering travel plans/Single answer)
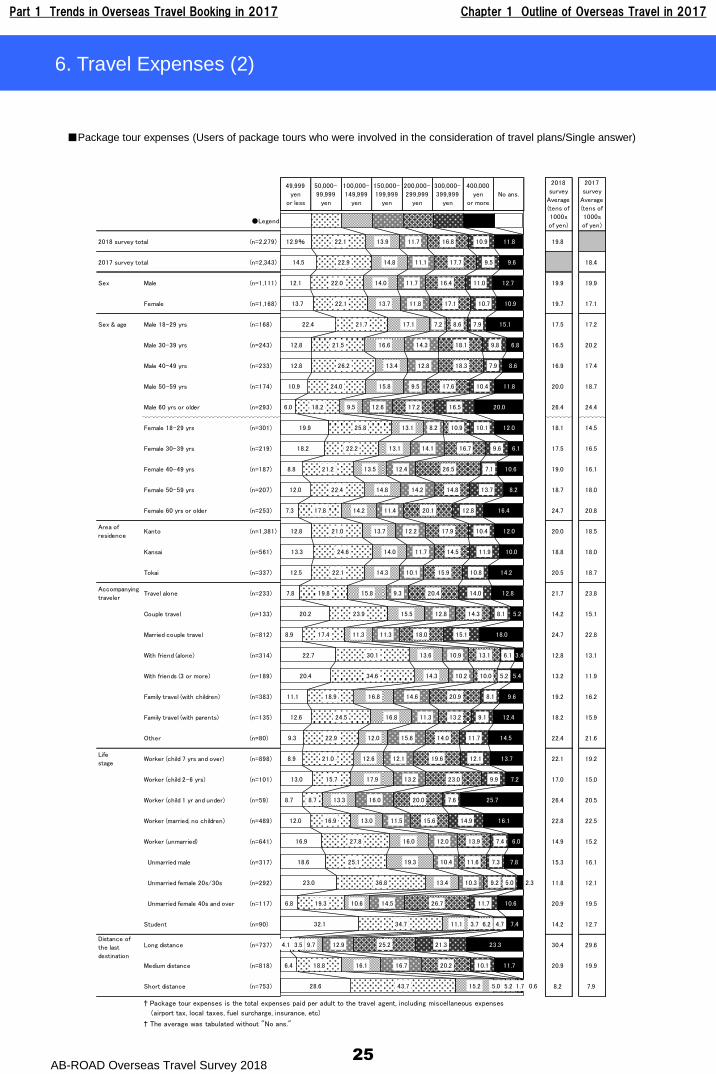
Part 1 Trends in Overseas Travel Booking in 2017 Chapter 1 Outline of Overseas Travel in 2017
AB-ROAD Overseas Travel Survey 201825
6. Travel Expenses (2)
49,999
yen
or less
50,000-
99,999
yen
100,000-
149,999
yen
150,000-
199,999
yen
200,000-
299,999
yen
300,000-
399,999
yen
400,000
yen
or more
No ans.
●Legend
2018 survey total (n=2,279) 19.8
2017 survey total (n=2,343) 18.4
Sex Male (n=1,111) 19.9 19.9
Female (n=1,168) 19.7 17.1
Sex & age Male 18-29 yrs (n=168) 17.5 17.2
Male 30-39 yrs (n=243) 16.5 20.2
Male 40-49 yrs (n=233) 16.9 17.4
Male 50-59 yrs (n=174) 20.0 18.7
Male 60 yrs or older (n=293) 26.4 24.4
Female 18-29 yrs (n=301) 18.1 14.5
Female 30-39 yrs (n=219) 17.5 16.5
Female 40-49 yrs (n=187) 19.0 16.1
Female 50-59 yrs (n=207) 18.7 18.0
Female 60 yrs or older (n=253) 24.7 20.8
Area of
residenceKanto (n=1,381) 20.0 18.5
Kansai (n=561) 18.8 18.0
Tokai (n=337) 20.5 18.7
Accompanying
travelerTravel alone (n=233) 21.7 23.8
Couple travel (n=133) 14.2 15.1
Married couple travel (n=812) 24.7 22.8
With friend (alone) (n=314) 12.8 13.1
With friends (3 or more) (n=189) 13.2 11.9
Family travel (with children) (n=383) 19.2 16.2
Family travel (with parents) (n=135) 18.2 15.9
Other (n=80) 22.4 21.6
Life
stageWorker (child 7 yrs and over) (n=898) 22.1 19.2
Worker (child 2-6 yrs) (n=101) 17.0 15.0
Worker (child 1 yr and under) (n=59) 26.4 20.5
Worker (married, no children) (n=489) 22.8 22.5
Worker (unmarried) (n=641) 14.9 15.2
Unmarried male (n=317) 15.3 16.1
Unmarried female 20s/30s (n=292) 11.8 12.1
Unmarried female 40s and over (n=117) 20.9 19.5
Student (n=90) 14.2 12.7
Long distance (n=737) 30.4 29.6
Medium distance (n=818) 20.9 19.9
Short distance (n=753) 8.2 7.9
† Package tour expenses is the total expenses paid per adult to the travel agent, including miscellaneous expenses
(airport tax, local taxes, fuel surcharge, insurance, etc)
† The average was tabulated without "No ans."
Distance of
the last
destination
2018
survey
Average
(tens of
1000s
of yen)
2017
survey
Average
(tens of
1000s
of yen)
12.9%
14.5
12.1
13.7
22.4
12.8
12.8
10.9
6.0
19.9
18.2
8.8
12.0
7.3
12.8
13.3
12.5
7.8
20.2
8.9
22.7
20.4
11.1
12.6
9.3
8.9
13.0
8.7
12.0
16.9
18.6
23.0
6.8
32.1
4.1
6.4
28.6
22.1
22.9
22.0
22.1
21.7
21.5
26.2
24.0
18.2
25.8
22.2
21.2
22.4
17.8
21.0
24.6
22.1
19.8
23.9
17.4
30.1
34.6
18.9
24.5
22.9
21.0
15.7
8.7
16.9
27.8
25.1
36.8
19.3
34.7
3.5
18.8
43.7
13.9
14.8
14.0
13.7
17.1
16.6
13.4
15.8
9.5
13.1
13.1
13.5
14.8
14.2
13.7
14.0
14.3
15.8
15.5
11.3
13.6
14.3
16.8
16.8
12.0
12.6
17.9
13.3
13.0
16.0
19.3
13.4
10.6
11.1
9.7
16.1
15.2
11.7
11.1
11.7
11.8
7.2
14.3
12.8
9.5
12.6
8.2
14.1
12.4
14.2
11.4
12.2
11.7
10.1
9.3
12.8
11.3
10.9
10.2
14.6
11.3
15.6
12.1
13.2
16.0
11.5
12.0
10.4
10.3
14.5
3.7
12.9
16.7
5.0
16.8
17.7
16.4
17.1
8.6
18.1
18.3
17.6
17.2
10.9
16.7
26.5
14.8
20.1
17.9
14.5
15.9
20.4
14.3
18.0
13.1
10.0
20.9
13.2
14.0
19.6
23.0
20.0
15.6
13.9
11.6
9.2
26.7
6.2
25.2
20.2
5.2
10.9
9.5
11.0
10.7
7.9
9.8
7.9
10.4
16.5
10.1
9.6
7.1
13.7
12.8
10.4
11.9
10.8
14.0
8.1
15.1
6.1
5.2
8.1
9.1
11.7
12.1
9.9
7.6
14.9
7.4
7.3
5.0
11.7
4.7
21.3
10.1
1.7
11.8
9.6
12.7
10.9
15.1
6.8
8.6
11.8
20.0
12.0
6.1
10.6
8.2
16.4
12.0
10.0
14.2
12.8
5.2
18.0
3.4
5.4
9.6
12.4
14.5
13.7
7.2
25.7
16.1
6.0
7.8
2.3
10.6
7.4
23.3
11.7
0.6
■Package tour expenses (Users of package tours who were involved in the consideration of travel plans/Single answer)
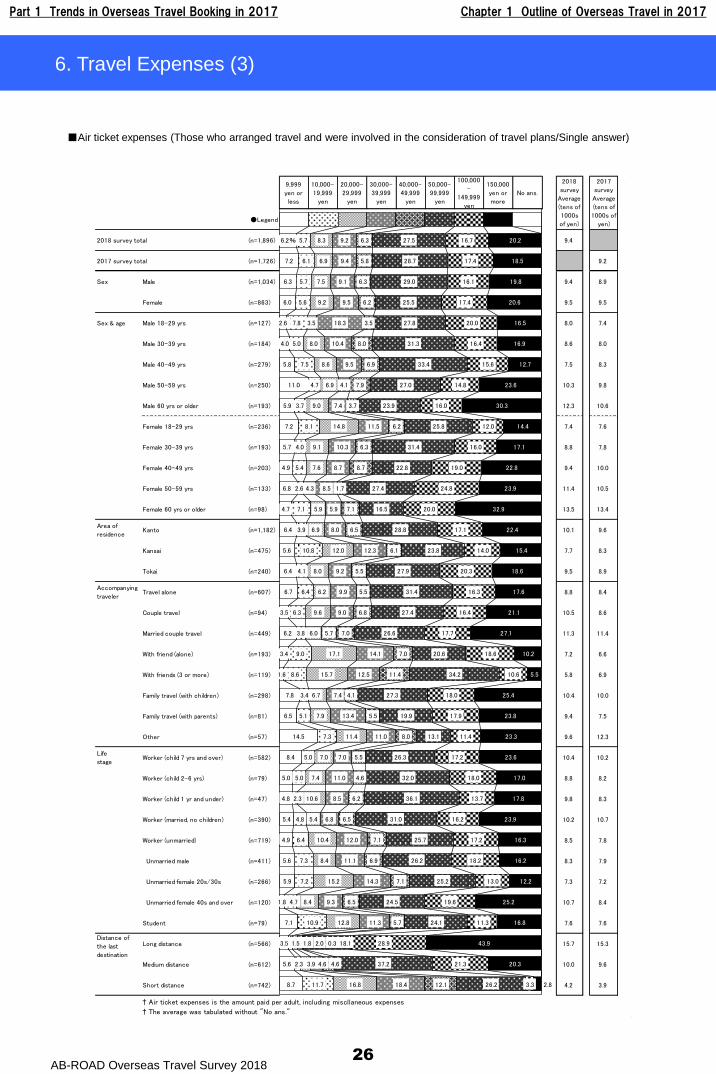
Part 1 Trends in Overseas Travel Booking in 2017 Chapter 1 Outline of Overseas Travel in 2017
AB-ROAD Overseas Travel Survey 201826
6. Travel Expenses (3)
9,999
yen or
less
10,000-
19,999
yen
20,000-
29,999
yen
30,000-
39,999
yen
40,000-
49,999
yen
50,000-
99,999
yen
100,000
-
149,999
yen
150,000
yen or
more
No ans.
●Legend
2018 survey total (n=1,896) 9.4
2017 survey total (n=1,726) 9.2
Sex Male (n=1,034) 9.4 8.9
Female (n=863) 9.5 9.5
Sex & age Male 18-29 yrs (n=127) 8.0 7.4
Male 30-39 yrs (n=184) 8.6 8.0
Male 40-49 yrs (n=279) 7.5 8.3
Male 50-59 yrs (n=250) 10.3 9.8
Male 60 yrs or older (n=193) 12.3 10.6
Female 18-29 yrs (n=236) 7.4 7.6
Female 30-39 yrs (n=193) 8.8 7.8
Female 40-49 yrs (n=203) 9.4 10.0
Female 50-59 yrs (n=133) 11.4 10.5
Female 60 yrs or older (n=98) 13.5 13.4
Area of
residenceKanto (n=1,182) 10.1 9.6
Kansai (n=475) 7.7 8.3
Tokai (n=240) 9.5 8.9
Accompanying
travelerTravel alone (n=607) 8.8 8.4
Couple travel (n=94) 10.5 8.6
Married couple travel (n=449) 11.3 11.4
With friend (alone) (n=193) 7.2 6.6
With friends (3 or more) (n=119) 5.8 6.9
Family travel (with children) (n=298) 10.4 10.0
Family travel (with parents) (n=81) 9.4 7.5
Other (n=57) 9.6 12.3
Life
stageWorker (child 7 yrs and over) (n=582) 10.4 10.2
Worker (child 2-6 yrs) (n=79) 8.8 8.2
Worker (child 1 yr and under) (n=47) 9.8 8.3
Worker (married, no children) (n=390) 10.2 10.7
Worker (unmarried) (n=719) 8.5 7.8
Unmarried male (n=411) 8.3 7.9
Unmarried female 20s/30s (n=266) 7.3 7.2
Unmarried female 40s and over (n=120) 10.7 8.4
Student (n=79) 7.6 7.6
Long distance (n=566) 15.7 15.3
Medium distance (n=612) 10.0 9.6
Short distance (n=742) 4.2 3.9
† Air ticket expenses is the amount paid per adult, including miscllaneous expenses
† The average was tabulated without "No ans."
Distance of
the last
destination
2018
survey
Average
(tens of
1000s
of yen)
2017
survey
Average
(tens of
1000s of
yen)
6.2%
7.2
6.3
6.0
2.6
4.0
5.8
11.0
5.9
7.2
5.7
4.9
6.8
4.7
6.4
5.6
6.4
6.7
3.5
6.2
3.4
1.6
7.8
6.5
14.5
8.4
5.0
4.8
5.4
4.9
5.6
5.9
1.8
7.1
3.5
5.6
8.7
5.7
6.1
5.7
5.6
7.8
5.0
7.5
4.7
3.7
8.1
4.0
5.4
2.6
7.1
3.9
10.8
4.1
6.4
6.3
3.8
9.0
8.6
3.4
5.1
7.3
5.0
5.0
2.3
4.8
6.4
7.3
7.2
4.7
10.9
1.5
2.3
11.7
8.3
6.9
7.5
9.2
3.5
8.0
8.6
6.9
9.0
14.8
9.1
7.6
4.3
5.9
6.9
12.0
8.0
6.2
9.6
6.0
17.1
15.7
6.7
7.9
11.4
7.0
7.4
10.6
5.4
10.4
8.4
15.2
8.4
12.8
1.8
3.9
16.8
9.2
9.4
9.1
9.5
18.3
10.4
9.5
4.1
7.4
11.5
10.3
8.7
8.5
5.9
8.0
12.3
9.2
9.9
9.0
5.7
14.1
12.5
7.4
13.4
11.0
7.0
11.0
8.5
6.8
12.0
11.1
14.3
9.3
11.3
2.0
4.6
18.4
6.3
5.8
6.3
6.2
3.5
8.0
6.9
7.9
3.7
6.2
6.3
8.7
1.7
7.1
6.5
6.1
5.5
5.5
6.8
7.0
7.0
11.4
4.1
5.5
8.0
5.5
4.6
6.2
6.5
7.1
6.9
7.1
6.5
5.7
0.3
4.6
12.1
27.5
28.7
29.0
25.5
27.8
31.3
33.4
27.0
23.9
25.8
31.4
22.8
27.4
16.5
28.8
23.8
27.9
31.4
27.4
26.6
20.6
34.2
27.3
19.9
13.1
26.3
32.0
36.1
31.0
25.7
26.2
25.2
24.5
24.1
18.1
37.2
26.2
16.7
17.4
16.1
17.4
20.0
16.4
15.6
14.8
16.0
12.0
16.0
19.0
24.8
20.0
17.1
14.0
20.3
16.3
16.4
17.7
18.6
10.6
18.0
17.9
11.4
17.2
18.0
13.7
16.2
17.2
18.2
13.0
19.6
11.3
28.9
21.3
3.3
20.2
18.5
19.8
20.6
16.5
16.9
12.7
23.6
30.3
14.4
17.1
22.8
23.9
32.9
22.4
15.4
18.6
17.6
21.1
27.1
10.2
5.5
25.4
23.8
23.3
23.6
17.0
17.8
23.9
16.3
16.2
12.2
25.2
16.8
43.9
20.3
2.8
■Air ticket expenses (Those who arranged travel and were involved in the consideration of travel plans/Single answer)
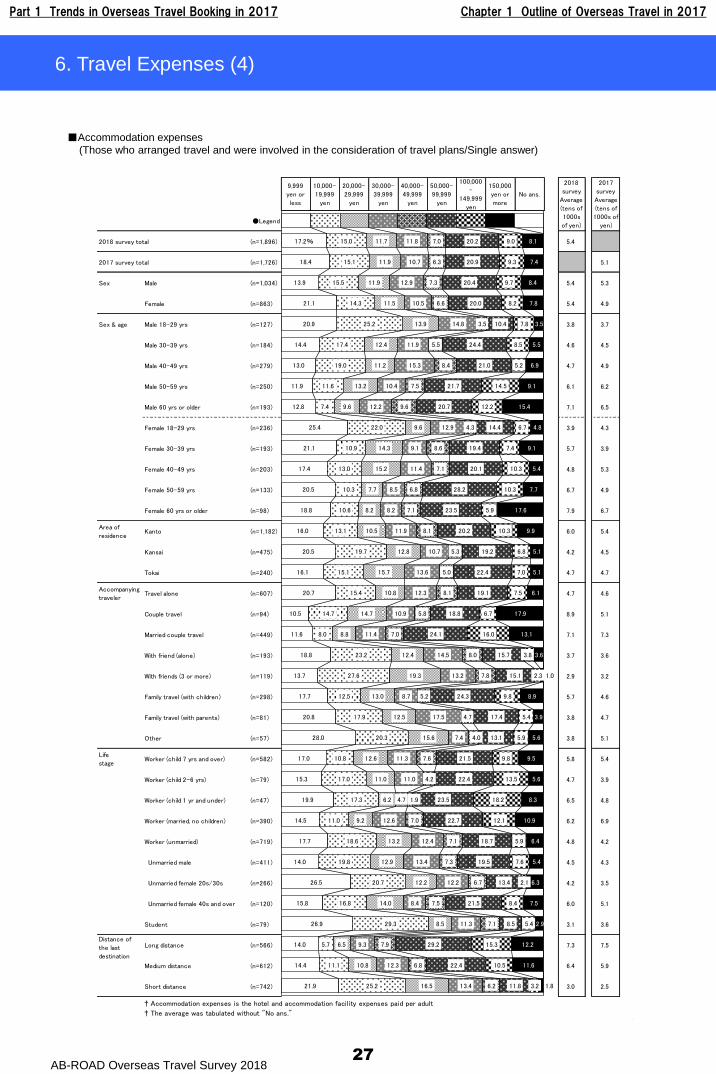
Part 1 Trends in Overseas Travel Booking in 2017 Chapter 1 Outline of Overseas Travel in 2017
AB-ROAD Overseas Travel Survey 201827
6. Travel Expenses (4)
9,999
yen or
less
10,000-
19,999
yen
20,000-
29,999
yen
30,000-
39,999
yen
40,000-
49,999
yen
50,000-
99,999
yen
100,000
-
149,999
yen
150,000
yen or
more
No ans.
●Legend
2018 survey total (n=1,896) 5.4
2017 survey total (n=1,726) 5.1
Sex Male (n=1,034) 5.4 5.3
Female (n=863) 5.4 4.9
Sex & age Male 18-29 yrs (n=127) 3.8 3.7
Male 30-39 yrs (n=184) 4.6 4.5
Male 40-49 yrs (n=279) 4.7 4.9
Male 50-59 yrs (n=250) 6.1 6.2
Male 60 yrs or older (n=193) 7.1 6.5
Female 18-29 yrs (n=236) 3.9 4.3
Female 30-39 yrs (n=193) 5.7 3.9
Female 40-49 yrs (n=203) 4.8 5.3
Female 50-59 yrs (n=133) 6.7 4.9
Female 60 yrs or older (n=98) 7.9 6.7
Area of
residenceKanto (n=1,182) 6.0 5.4
Kansai (n=475) 4.2 4.5
Tokai (n=240) 4.7 4.7
Accompanying
travelerTravel alone (n=607) 4.7 4.6
Couple travel (n=94) 8.9 5.1
Married couple travel (n=449) 7.1 7.3
With friend (alone) (n=193) 3.7 3.6
With friends (3 or more) (n=119) 2.9 3.2
Family travel (with children) (n=298) 5.7 4.6
Family travel (with parents) (n=81) 3.8 4.7
Other (n=57) 3.8 5.1
Life
stageWorker (child 7 yrs and over) (n=582) 5.8 5.4
Worker (child 2-6 yrs) (n=79) 4.7 3.9
Worker (child 1 yr and under) (n=47) 6.5 4.8
Worker (married, no children) (n=390) 6.2 6.9
Worker (unmarried) (n=719) 4.8 4.2
Unmarried male (n=411) 4.5 4.3
Unmarried female 20s/30s (n=266) 4.2 3.5
Unmarried female 40s and over (n=120) 6.0 5.1
Student (n=79) 3.1 3.6
Long distance (n=566) 7.3 7.5
Medium distance (n=612) 6.4 5.9
Short distance (n=742) 3.0 2.5
† Accommodation expenses is the hotel and accommodation facility expenses paid per adult
† The average was tabulated without "No ans."
Distance of
the last
destination
2018
survey
Average
(tens of
1000s
of yen)
2017
survey
Average
(tens of
1000s of
yen)
17.2%
18.4
13.9
21.1
20.9
14.4
13.0
11.9
12.8
25.4
21.1
17.4
20.5
18.8
16.0
20.5
16.1
20.7
10.5
11.6
18.8
13.7
17.7
20.8
28.0
17.0
15.3
19.9
14.5
17.7
14.0
26.5
15.8
26.9
14.0
14.4
21.9
15.0
15.1
15.5
14.3
25.2
17.4
19.0
11.6
7.4
22.0
10.9
13.0
10.3
10.6
13.1
19.7
15.1
15.4
14.7
8.0
23.2
27.6
12.5
17.9
20.3
10.8
17.0
17.3
11.0
18.6
19.8
20.7
16.8
29.3
5.7
11.1
25.2
11.7
11.9
11.9
11.5
13.9
12.4
11.2
13.2
9.6
9.6
14.3
15.2
7.7
8.2
10.5
12.8
15.7
10.8
14.7
8.8
12.4
19.3
13.0
12.5
15.6
12.6
11.0
6.2
9.2
13.2
12.9
12.2
14.0
8.5
6.5
10.8
16.5
11.8
10.7
12.9
10.5
14.8
11.9
15.3
10.4
12.2
12.9
9.1
11.4
8.5
8.2
11.9
10.7
13.6
12.3
10.9
11.4
14.5
13.2
8.7
17.5
7.4
11.3
11.0
4.7
12.6
12.4
13.4
12.2
8.4
11.3
9.3
12.3
13.4
7.0
6.3
7.3
6.6
3.5
5.5
8.4
7.5
9.6
4.3
8.6
7.1
6.8
7.1
8.1
5.3
5.0
8.1
5.8
7.0
8.0
7.8
5.2
4.7
4.0
7.6
4.2
1.9
7.0
7.1
7.3
6.7
7.5
7.1
7.9
6.8
6.2
20.2
20.9
20.4
20.0
10.4
24.4
21.0
21.7
20.7
14.4
19.4
20.1
28.2
23.5
20.2
19.2
22.4
19.1
18.8
24.1
15.7
15.1
24.3
17.4
13.1
21.5
22.4
23.5
22.7
18.7
19.5
13.4
21.5
8.5
29.2
22.4
11.8
9.0
9.3
9.7
8.2
7.8
8.5
5.2
14.5
12.2
6.7
7.4
10.3
10.3
5.9
10.3
6.8
7.0
7.5
6.7
16.0
3.8
2.3
9.8
5.4
5.9
9.8
13.5
18.2
12.1
5.9
7.6
2.1
8.4
5.4
15.3
10.5
3.2
8.1
7.4
8.4
7.8
3.5
5.5
6.9
9.1
15.4
4.8
9.1
5.4
7.7
17.6
9.9
5.1
5.1
6.1
17.9
13.1
3.6
1.0
8.9
3.9
5.6
9.5
5.6
8.3
10.9
6.4
5.4
6.3
7.5
2.9
12.2
11.6
1.8
■Accommodation expenses
(Those who arranged travel and were involved in the consideration of travel plans/Single answer)
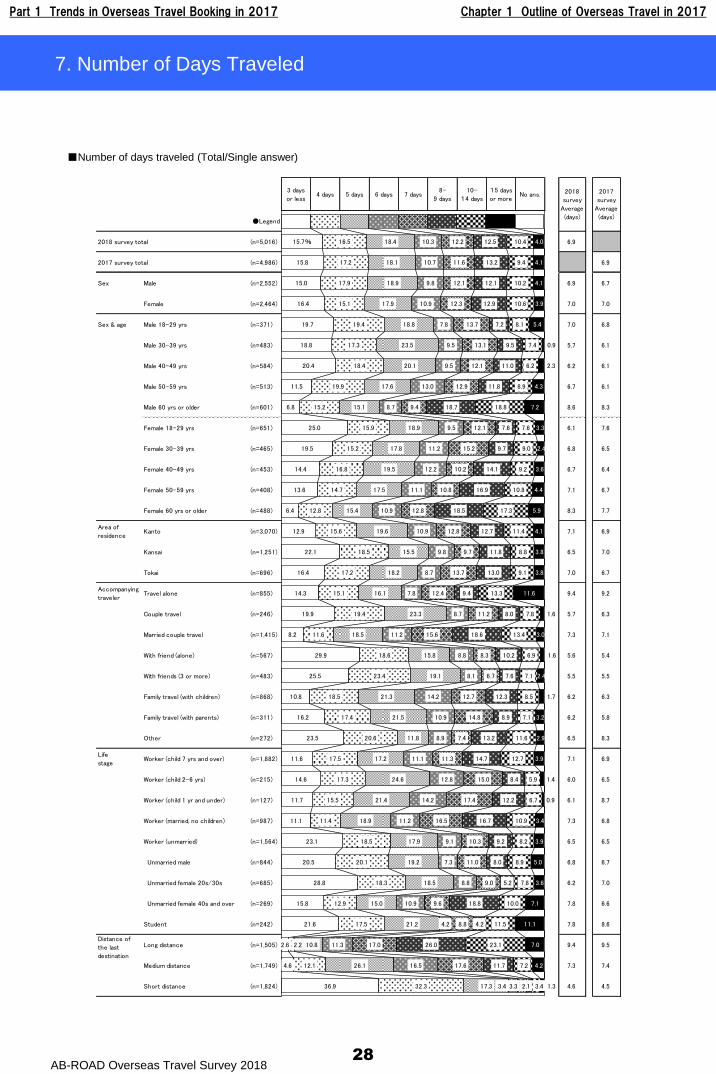
Part 1 Trends in Overseas Travel Booking in 2017 Chapter 1 Outline of Overseas Travel in 2017
AB-ROAD Overseas Travel Survey 201828
7. Number of Days Traveled
3 days
or less4 days 5 days 6 days 7 days
8-
9 days
10-
14 days
15 days
or moreNo ans.
●Legend
2018 survey total (n=5,016) 6.9
2017 survey total (n=4,986) 6.9
Sex Male (n=2,552) 6.9 6.7
Female (n=2,464) 7.0 7.0
Sex & age Male 18-29 yrs (n=371) 7.0 6.8
Male 30-39 yrs (n=483) 5.7 6.1
Male 40-49 yrs (n=584) 6.2 6.1
Male 50-59 yrs (n=513) 6.7 6.1
Male 60 yrs or older (n=601) 8.6 8.3
Female 18-29 yrs (n=651) 6.1 7.6
Female 30-39 yrs (n=465) 6.8 6.5
Female 40-49 yrs (n=453) 6.7 6.4
Female 50-59 yrs (n=408) 7.1 6.7
Female 60 yrs or older (n=488) 8.3 7.7
Area of
residenceKanto (n=3,070) 7.1 6.9
Kansai (n=1,251) 6.5 7.0
Tokai (n=696) 7.0 6.7
Accompanying
travelerTravel alone (n=855) 9.4 9.2
Couple travel (n=246) 5.7 6.3
Married couple travel (n=1,415) 7.3 7.1
With friend (alone) (n=567) 5.6 5.4
With friends (3 or more) (n=483) 5.5 5.5
Family travel (with children) (n=868) 6.2 6.3
Family travel (with parents) (n=311) 6.2 5.8
Other (n=272) 6.5 8.3
Life
stageWorker (child 7 yrs and over) (n=1,882) 7.1 6.9
Worker (child 2-6 yrs) (n=215) 6.0 6.5
Worker (child 1 yr and under) (n=127) 6.1 8.7
Worker (married, no children) (n=987) 7.3 6.8
Worker (unmarried) (n=1,564) 6.5 6.5
Unmarried male (n=844) 6.8 6.7
Unmarried female 20s/30s (n=685) 6.2 7.0
Unmarried female 40s and over (n=269) 7.8 6.6
Student (n=242) 7.8 8.6
Long distance (n=1,505) 9.4 9.5
Medium distance (n=1,749) 7.3 7.4
Short distance (n=1,824) 4.6 4.5
Distance of
the last
destination
2018
survey
Average
(days)
2017
survey
Average
(days)
15.7%
15.8
15.0
16.4
19.7
18.8
20.4
11.5
6.8
25.0
19.5
14.4
13.6
6.4
12.9
22.1
16.4
14.3
19.9
8.2
29.9
25.5
10.8
16.2
23.5
11.6
14.6
11.7
11.1
23.1
20.5
28.8
15.8
21.6
2.6
4.6
36.9
16.5
17.2
17.9
15.1
19.4
17.3
18.4
19.9
15.2
15.9
15.2
16.8
14.7
12.8
15.6
18.5
17.2
15.1
19.4
11.6
18.6
23.4
18.5
17.4
20.6
17.5
17.3
15.5
11.4
18.5
20.1
18.3
12.9
17.5
2.2
12.1
32.3
18.4
18.1
18.9
17.9
18.8
23.5
20.1
17.6
15.1
18.9
17.8
19.5
17.5
15.4
19.6
15.5
18.2
16.1
23.3
18.5
15.8
19.1
21.3
21.5
11.8
17.2
24.6
21.4
18.9
17.9
19.2
18.5
15.0
21.2
10.8
26.1
17.3
10.3
10.7
9.8
10.9
7.8
9.5
9.5
13.0
8.7
9.5
11.2
12.2
11.1
10.9
10.9
9.8
8.7
7.8
8.7
11.2
8.8
8.1
14.2
10.9
8.9
11.1
12.8
14.2
11.2
9.1
7.3
8.8
10.9
4.2
11.3
16.5
3.4
12.2
11.6
12.1
12.3
13.7
13.1
12.1
12.9
9.4
12.1
15.2
10.2
10.8
12.8
12.8
9.7
13.7
12.4
11.2
15.6
8.3
6.7
12.7
14.8
7.4
11.3
15.0
17.4
16.5
10.3
11.0
9.0
9.6
8.8
17.0
17.6
3.3
12.5
13.2
12.1
12.9
7.2
9.5
11.0
11.8
18.7
7.6
9.7
14.1
16.9
18.5
12.7
11.8
13.0
9.4
8.0
18.6
10.2
7.6
12.3
8.9
13.2
14.7
8.4
12.2
16.7
9.2
8.0
5.2
18.8
4.2
26.0
11.7
2.1
10.4
9.4
10.2
10.6
8.1
7.4
6.2
8.9
18.8
7.6
9.0
9.2
10.8
17.3
11.4
8.8
9.1
13.3
7.8
13.4
6.9
7.1
8.5
7.1
11.6
12.7
5.9
6.7
10.9
8.2
8.9
7.8
10.0
11.5
23.1
7.2
3.4
4.0
4.1
4.1
3.9
5.4
0.9
2.3
4.3
7.2
3.3
2.4
3.6
4.4
5.9
4.1
3.8
3.8
11.6
1.6
3.0
1.6
2.4
1.7
3.2
2.9
3.9
1.4
0.9
3.4
3.9
5.0
3.6
7.1
11.1
7.0
4.2
1.3
■Number of days traveled (Total/Single answer)
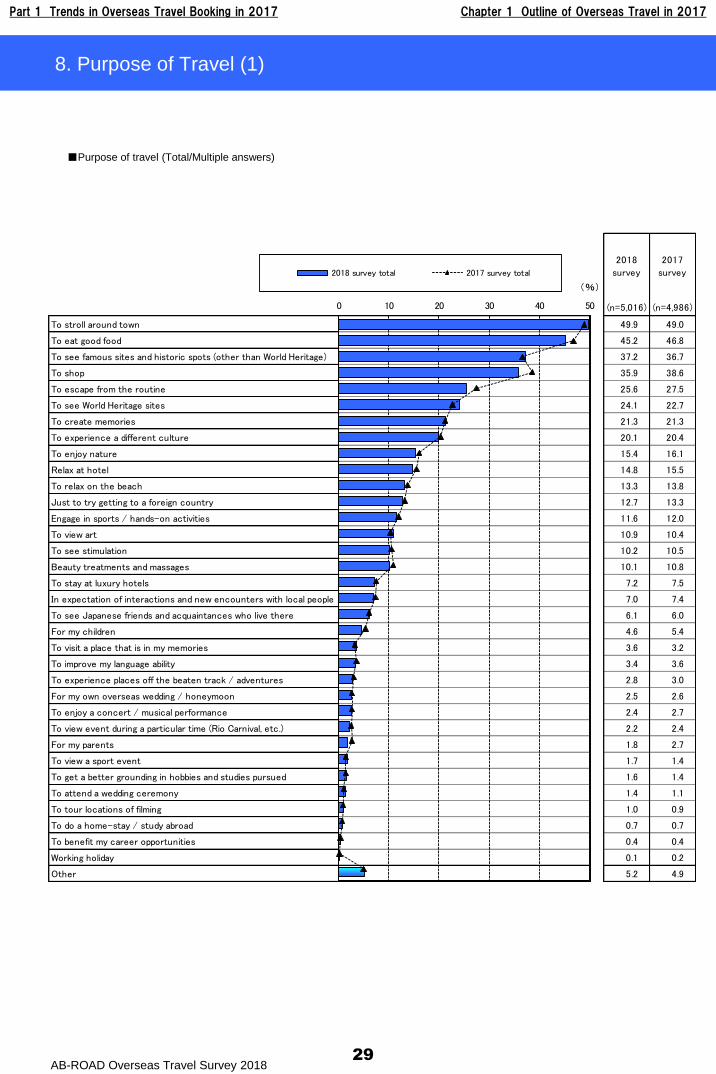
Part 1 Trends in Overseas Travel Booking in 2017 Chapter 1 Outline of Overseas Travel in 2017
AB-ROAD Overseas Travel Survey 201829
8. Purpose of Travel (1)
2018
survey
2017
survey
(n=5,016) (n=4,986)
To stroll around town 49.9 49.0
To eat good food 45.2 46.8
To see famous sites and historic spots (other than World Heritage) 37.2 36.7
To shop 35.9 38.6
To escape from the routine 25.6 27.5
To see World Heritage sites 24.1 22.7
To create memories 21.3 21.3
To experience a different culture 20.1 20.4
To enjoy nature 15.4 16.1
Relax at hotel 14.8 15.5
To relax on the beach 13.3 13.8
Just to try getting to a foreign country 12.7 13.3
Engage in sports / hands-on activities 11.6 12.0
To view art 10.9 10.4
To see stimulation 10.2 10.5
Beauty treatments and massages 10.1 10.8
To stay at luxury hotels 7.2 7.5
In expectation of interactions and new encounters with local people 7.0 7.4
To see Japanese friends and acquaintances who live there 6.1 6.0
For my children 4.6 5.4
To visit a place that is in my memories 3.6 3.2
To improve my language ability 3.4 3.6
To experience places off the beaten track / adventures 2.8 3.0
For my own overseas wedding / honeymoon 2.5 2.6
To enjoy a concert / musical performance 2.4 2.7
To view event during a particular time (Rio Carnival, etc.) 2.2 2.4
For my parents 1.8 2.7
To view a sport event 1.7 1.4
To get a better grounding in hobbies and studies pursued 1.6 1.4
To attend a wedding ceremony 1.4 1.1
To tour locations of filming 1.0 0.9
To do a home-stay / study abroad 0.7 0.7
To benefit my career opportunities 0.4 0.4
Working holiday 0.1 0.2
Other 5.2 4.9
0 10 20 30 40 50
2018 survey total 2017 survey total
(%)
■Purpose of travel (Total/Multiple answers)
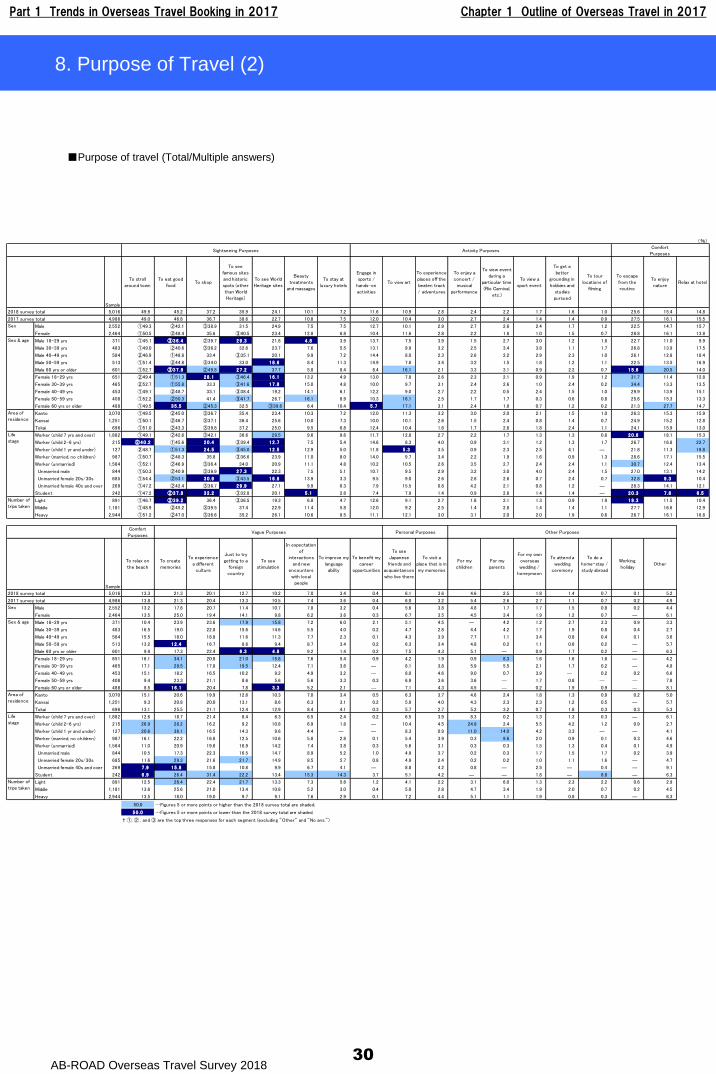
Part 1 Trends in Overseas Travel Booking in 2017 Chapter 1 Outline of Overseas Travel in 2017
AB-ROAD Overseas Travel Survey 201830
8. Purpose of Travel (2)
(%)
Sightseeing Purposes Activity PurposesComfort
Purposes
Sample
To stroll
around town
To eat good
foodTo shop
To see
famous sites
and historic
spots (other
than World
Heritage)
To see World
Heritage sites
Beauty
treatments
and massages
To stay at
luxury hotels
Engage in
sports /
hands-on
activities
To view art
To experience
places off the
beaten track
/ adventures
To enjoy a
concert /
musical
performance
To view event
during a
particular time
(Rio Carnival,
etc.)
To view a
sport event
To get a
better
grounding in
hobbies and
studies
pursued
To tour
locations of
filming
To escape
from the
routine
To enjoy
natureRelax at hotel
2018 survey total 5,016 49.9 45.2 37.2 35.9 24.1 10.1 7.2 11.6 10.9 2.8 2.4 2.2 1.7 1.6 1.0 25.6 15.4 14.8
2017 survey total 4,986 49.0 46.8 36.7 38.6 22.7 10.8 7.5 12.0 10.4 3.0 2.7 2.4 1.4 1.4 0.9 27.5 16.1 15.5
Sex Male 2,552 ①49.3 ②42.1 ③38.9 31.5 24.9 7.5 7.5 12.7 10.1 2.9 2.7 2.6 2.4 1.7 1.2 22.5 14.7 15.7
Female 2,464 ①50.5 ②48.4 35.6 ③40.5 23.4 12.8 6.8 10.4 11.6 2.8 2.2 1.8 1.0 1.5 0.7 28.8 16.1 13.8
Male 18-29 yrs 371 ①45.1 ③36 .4 ②39.7 29 .3 21.8 4 .8 3.9 13.7 7.5 3.9 1.5 2.7 3.0 1.2 1.8 22.7 11.0 9.9
Male 30-39 yrs 483 ①49.0 ②40.6 ③36.2 32.6 23.7 7.6 5.5 13.1 9.9 3.2 2.5 3.4 3.8 1.1 1.7 26.8 13.9 17.5
Male 40-49 yrs 584 ②46.9 ①48.8 33.4 ③35.1 20.1 9.9 7.2 14.4 8.0 2.3 2.6 2.2 2.9 2.3 1.0 26.1 12.8 18.4
Male 50-59 yrs 513 ①51.4 ②44.8 ③34.0 33.0 18 .6 8.4 11.3 14.9 7.8 3.4 3.2 1.5 1.8 1.2 1.1 22.5 13.5 16.9
Male 60 yrs or older 601 ①52.7 ③37 .8 ②49.8 27 .2 37.7 5.8 8.4 8.4 16.1 2.1 3.3 3.1 0.9 2.2 0.7 15 .6 20.5 14.0
Female 18-29 yrs 651 ②49.4 ①51.3 28 .1 ③46.4 16 .1 13.2 4.9 13.0 7.8 2.6 2.3 2.1 0.9 1.9 1.2 31.7 11.4 12.8
Female 30-39 yrs 465 ②52.7 ①55.8 33.3 ③41.6 17 .8 15.0 4.8 10.0 9.7 3.1 2.4 2.6 1.0 2.4 0.2 34.4 13.3 13.5
Female 40-49 yrs 453 ①49.1 ②48.7 33.1 ③38.4 19.2 14.1 6.1 12.2 9.0 2.7 2.2 0.5 2.4 1.5 1.0 29.9 13.9 15.1
Female 50-59 yrs 408 ①52.2 ②50.3 41.4 ③41.7 26.7 16.1 8.9 10.3 16.1 2.5 1.7 1.7 0.3 0.6 0.8 25.6 15.3 13.3
Female 60 yrs or older 488 ①49.5 35 .5 ②45.3 32.5 ③39.6 6.4 10.4 5 .7 17.1 3.1 2.4 1.9 0.7 1.2 0.2 21.3 27.7 14.7
Kanto 3,070 ①49.5 ②45.0 ③36.7 35.4 23.4 10.3 7.2 12.0 11.3 3.2 3.0 2.0 2.1 1.5 1.0 26.3 15.3 15.9
Kansai 1,251 ①50.1 ②46.7 ③37.1 36.4 25.6 10.0 7.3 10.0 10.1 2.6 1.5 2.4 0.8 1.4 0.7 24.9 15.2 12.8
Tokai 696 ①51.0 ②43.3 ③39.8 37.2 25.0 9.5 6.8 12.4 10.4 1.6 1.7 2.6 1.8 2.4 1.1 24.1 15.9 13.0
Worker (child 7 yrs and over) 1,882 ①49.1 ②42.6 ③42.1 36.6 29.5 9.6 9.6 11.7 12.8 2.7 2.2 1.7 1.3 1.3 0.8 20 .6 18.1 15.3
Worker (child 2-6 yrs) 215 ②40 .2 ①45.6 20 .4 ③39.4 12 .7 7.5 5.4 14.6 8.3 4.0 0.9 3.1 1.2 1.3 1.7 26.7 16.8 22.7
Worker (child 1 yr and under) 127 ②48.7 ①51.3 24 .5 ③45.0 12 .5 12.9 5.0 11.8 5 .3 3.5 0.9 2.3 2.5 4.1 ― 21.8 11.3 19.8
Worker (married, no children) 987 ①50.7 ②48.3 35.8 ③36.6 23.9 11.0 8.0 14.0 9.7 3.4 2.2 1.9 1.6 0.9 1.3 28.6 17.1 15.5
Worker (unmarried) 1,564 ①52.1 ②46.9 ③36.4 34.0 20.9 11.1 4.8 10.2 10.5 2.6 3.5 2.7 2.4 2.4 1.1 30.7 12.4 13.4
Unmarried male 844 ①50.3 ②40.9 ③39.9 27 .3 22.3 7.5 5.1 10.7 9.5 2.9 3.2 3.0 4.0 2.4 1.5 27.0 13.1 14.2
Unmarried female 20s/30s 685 ①54.4 ②53.1 30 .9 ③43.5 16 .8 13.9 3.3 9.5 9.0 2.6 2.8 2.6 0.7 2.4 0.7 32.8 9 .3 10.4
Unmarried female 40s and over 269 ①47.2 ②42.4 ③36.7 29 .9 27.1 9.9 6.3 7.9 15.5 0.8 4.2 2.1 0.8 1.2 ― 28.3 14.1 12.1
Student 242 ①47.2 ②37 .8 32 .2 ③32.8 20.1 5 .1 2.8 7.4 7.9 1.4 0.9 2.8 1.4 1.4 ― 20 .3 7 .8 6 .5
Light 891 ①46.7 ②39 .2 36.4 ③36.5 19.3 6.8 4.7 12.6 9.1 2.7 1.8 2.1 1.3 0.9 1.9 19 .3 11.5 10.4
Middle 1,181 ①48.9 ②45.2 ③39.5 37.4 22.9 11.4 5.8 12.0 9.2 2.5 1.4 2.8 1.4 1.4 1.1 27.7 16.6 12.9
Heavy 2,944 ①51.2 ②47.0 ③36.6 35.2 26.1 10.6 8.5 11.1 12.1 3.0 3.1 2.0 2.0 1.9 0.6 26.7 16.1 16.8
Comfort
PurposesVague Purposes Personal Purposes Other Purposes
Sample
To relax on
the beach
To create
memories
To experience
a different
culture
Just to try
getting to a
foreign
country
To see
stimulation
In expectation
of
interactions
and new
encounters
with local
people
To improve my
language
ability
To benefit my
career
opportunities
To see
Japanese
friends and
acquaintances
who live there
To visit a
place that is in
my memories
For my
children
For my
parents
For my own
overseas
wedding /
honeymoon
To attend a
wedding
ceremony
To do a
home-stay /
study abroad
Working
holidayOther
2018 survey total 5,016 13.3 21.3 20.1 12.7 10.2 7.0 3.4 0.4 6.1 3.6 4.6 2.5 1.8 1.4 0.7 0.1 5.2
2017 survey total 4,986 13.8 21.3 20.4 13.3 10.5 7.4 3.6 0.4 6.0 3.2 5.4 2.6 2.7 1.1 0.7 0.2 4.9
Sex Male 2,552 13.2 17.8 20.7 11.4 10.7 7.8 3.2 0.4 5.6 3.8 4.8 1.7 1.7 1.5 0.8 0.2 4.4
Female 2,464 13.5 25.0 19.4 14.1 9.8 6.2 3.6 0.3 6.7 3.5 4.5 3.4 1.9 1.2 0.7 ― 6.1
Male 18-29 yrs 371 10.4 23.9 23.6 17.9 15.8 7.2 6.0 2.1 5.1 4.5 ― 4.2 1.2 2.7 3.3 0.9 3.3
Male 30-39 yrs 483 16.5 19.0 22.8 15.6 14.6 5.5 4.0 0.2 4.7 2.8 4.4 4.2 1.7 1.9 0.8 0.4 2.7
Male 40-49 yrs 584 15.5 18.0 18.8 11.6 11.3 7.7 2.3 0.1 4.3 3.9 7.7 1.1 3.4 0.8 0.4 0.1 3.6
Male 50-59 yrs 513 13.2 12 .4 16.7 8.6 9.4 8.7 3.4 0.2 6.3 3.4 4.8 0.2 1.1 0.6 0.2 ― 5.7
Male 60 yrs or older 601 9.9 17.3 22.4 6 .3 4 .8 9.2 1.4 0.2 7.5 4.3 5.1 ― 0.9 1.7 0.2 ― 6.3
Female 18-29 yrs 651 16.1 34.1 20.8 21.0 15.8 7.6 5.4 0.9 4.2 1.9 0.9 8.3 1.6 1.6 1.6 ― 4.2
Female 30-39 yrs 465 17.1 29.5 17.8 19.5 12.4 7.1 3.6 ― 8.1 3.8 5.9 5.5 2.1 1.7 0.2 ― 4.8
Female 40-49 yrs 453 15.1 18.2 16.5 10.2 9.2 4.9 3.2 ― 8.0 4.6 9.0 0.7 3.9 ― 0.2 0.2 6.6
Female 50-59 yrs 408 9.4 23.3 21.1 8.6 5.6 5.6 3.3 0.3 6.9 3.6 3.6 ― 1.7 0.8 ― ― 7.8
Female 60 yrs or older 488 8.5 16 .1 20.4 7.8 3 .3 5.2 2.1 ― 7.1 4.3 4.5 ― 0.2 1.9 0.9 ― 8.1
Kanto 3,070 15.1 20.6 19.9 12.6 10.3 7.0 3.4 0.5 6.3 3.7 4.6 2.4 1.8 1.3 0.9 0.2 5.0
Kansai 1,251 9.3 20.8 20.0 13.1 8.6 6.3 3.1 0.2 5.9 4.0 4.3 2.3 2.3 1.2 0.5 ― 5.7
Tokai 696 13.1 25.5 21.1 12.4 12.9 8.4 4.1 0.3 5.7 2.7 5.2 3.2 0.7 1.8 0.3 0.3 5.3
Worker (child 7 yrs and over) 1,882 12.6 18.7 21.4 8.4 6.3 6.5 2.4 0.2 6.5 3.9 8.3 0.2 1.3 1.3 0.3 ― 6.1
Worker (child 2-6 yrs) 215 26.9 28.2 16.2 9.2 10.8 6.9 1.8 ― 10.4 4.5 24.9 2.4 5.5 4.2 1.2 0.9 2.7
Worker (child 1 yr and under) 127 20.6 36.1 16.5 14.3 9.6 4.4 ― ― 8.3 0.9 11.0 14.0 4.2 3.3 ― ― 4.1
Worker (married, no children) 987 16.1 22.2 16.8 12.5 10.6 5.8 2.8 0.1 5.4 3.9 0.3 9.6 2.0 0.9 0.1 0.3 4.6
Worker (unmarried) 1,564 11.0 20.9 19.6 16.9 14.2 7.4 3.8 0.3 5.6 3.1 0.3 0.3 1.5 1.3 0.4 0.1 4.9
Unmarried male 844 10.5 17.3 22.3 16.5 14.7 8.9 5.2 1.0 4.9 3.7 0.2 0.3 1.7 1.5 1.7 0.2 3.9
Unmarried female 20s/30s 685 11.6 29.3 21.6 21.7 14.9 8.5 5.7 0.8 4.9 2.4 0.2 0.2 1.0 1.1 1.6 ― 4.7
Unmarried female 40s and over 269 7 .9 15 .8 15.8 10.8 9.9 6.7 4.1 ― 8.8 4.2 0.8 ― 2.5 ― 0.4 ― 9.1
Student 242 6 .9 26.4 31.4 22.2 13.4 15.3 14.3 3.7 5.1 4.2 ― ― 1.8 ― 8.8 ― 6.3
Light 891 12.5 26.4 22.4 21.7 13.3 7.3 5.6 1.2 4.1 2.2 3.1 6.0 1.3 2.3 2.2 0.6 2.9
Middle 1,181 13.6 25.6 21.0 13.4 10.8 5.2 3.0 0.4 5.0 2.8 4.7 3.4 1.9 2.0 0.7 0.2 4.5
Heavy 2,944 13.5 18.0 19.0 9.7 9.1 7.6 2.9 0.1 7.2 4.4 5.1 1.1 1.9 0.8 0.3 ― 6.3
50.0 …Figures 5 or more points or higher than the 2018 survey total are shaded.
50 .0 …Figures 5 or more points or lower than the 2018 survey total are shaded.
† ①, ② , and ③ are the top three responses for each segment (excluding "Other" and "No ans.")
Number of
trips taken
Life
stage
Sex & age
Area of
residence
Life
stage
Sex & age
Area of
residence
Number of
trips taken
■Purpose of travel (Total/Multiple answers)
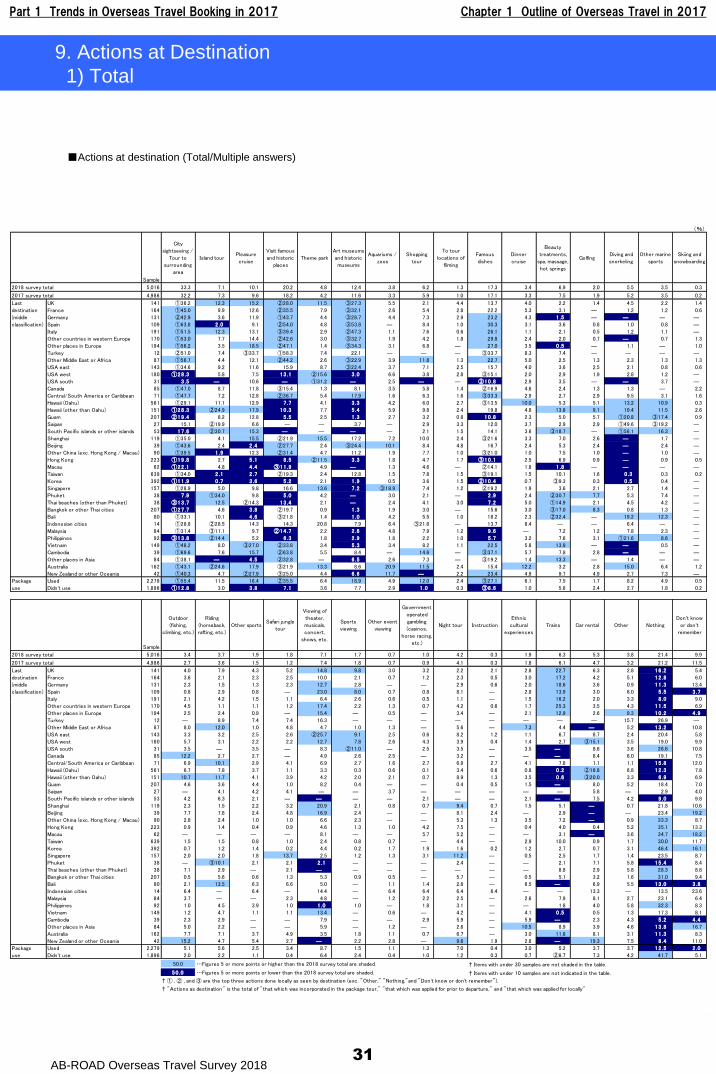
Part 1 Trends in Overseas Travel Booking in 2017 Chapter 1 Outline of Overseas Travel in 2017
AB-ROAD Overseas Travel Survey 2018
(%)
Sample
City
sightseeing /
Tour to
surrounding
area
Island tourPleasure
cruise
Visit famous
and historic
places
Theme park
Art museums
and historic
museums
Aquariums /
zoos
Shopping
tour
To tour
locations of
filming
Famous
dishes
Dinner
cruise
Beauty
treatments,
spa, massage,
hot springs
GolfingDiving and
snorkeling
Other marine
sports
Skiing and
snowboarding
2018 survey total 5,016 33.3 7.1 10.1 20.2 4.8 12.4 3.8 6.2 1.3 17.3 3.4 6.9 2.0 5.5 3.5 0.3
2017 survey total 4,986 32.2 7.3 9.6 18.2 4.2 11.6 3.3 5.9 1.0 17.1 3.3 7.5 1.9 5.2 3.5 0.2
UK 141 ①36.2 12.3 15.2 ②28.0 11.5 ③27.3 5.5 2.1 4.4 13.7 4.0 2.2 1.4 4.5 2.2 1.4
France 164 ①45.0 9.9 12.6 ②35.5 7.9 ③32.1 2.6 5.4 2.8 22.2 5.3 3.1 ― 1.2 1.2 0.6
Germany 131 ②42.9 3.6 11.9 ①43.7 4.4 ③28.7 4.4 7.3 2.9 23.2 4.3 1 .5 ― ― ― ―
Spain 109 ①63.8 2 .0 9.1 ②54.0 4.8 ③53.8 ― 8.4 1.0 30.3 3.1 3.6 0.8 1.0 0.8 ―
Italy 191 ①51.5 12.3 13.1 ③39.4 2.9 ②47.3 1.1 7.6 0.6 26.1 1.1 2.1 0.5 1.2 1.1 ―
Other countries in western Europe 170 ①53.0 7.7 14.4 ②42.6 3.0 ③32.7 1.9 4.2 1.8 29.8 2.4 2.0 0.7 ― 0.7 1.3
Other places in Europe 194 ①56.2 3.5 18.5 ②47.1 1.4 ③34.3 3.1 6.8 ― 27.0 3.5 0 .5 ― 1.1 ― 1.0
Turkey 12 ②51.0 7.4 ③33.7 ①58.3 7.4 22.1 ― ― ― ③33.7 8.3 7.4 ― ― ― ―
Other Middle East or Africa 87 ①56.7 4.4 12.1 ②44.2 2.6 ③22.9 3.9 11.8 1.3 22.7 5.0 2.5 1.3 2.3 1.3 1.3
USA east 143 ①34.6 9.2 11.6 15.9 8.7 ③22.4 3.7 7.1 2.5 15.7 4.0 3.6 2.5 2.1 0.8 0.6
USA west 180 ①28 .3 5.8 7.5 13 .1 ②15.6 3 .0 6.6 3.8 2.8 ③15.1 2.0 2.9 1.9 2.8 1.2 ―
USA south 31 3 .5 ― 10.6 ― ①31.2 ― 2.5 ― ― ③10 .8 2.9 3.5 ― ― 3.7 ―
Canada 85 ①47.0 8.7 11.8 ③15.4 1.3 8.1 3.5 5.8 1.4 ②16.9 4.6 2.4 1.3 1.3 ― 2.2
Central/South America or Caribbean 71 ①47.7 7.2 12.8 ②36.7 5.4 17.9 1.6 6.3 1.6 ③33.3 2.9 2.7 2.9 9.5 3.1 1.6
Hawaii (Oahu) 561 ①29.1 11.1 12.9 7 .7 4.1 3 .3 4.2 6.0 2.7 ③13.5 10.0 5.3 5.1 13.2 10.9 0.3
Hawaii (other than Oahu) 151 ①28 .3 ②24.9 17.9 10 .3 7.7 5 .4 5.9 9.8 2.4 19.8 4.8 13.8 9.1 19.4 11.5 2.6
Guam 207 ②19 .4 8.2 12.8 5 .5 2.5 1 .3 2.7 3.2 0.8 10 .8 2.3 5.0 5.7 ①20.8 ③17.4 0.9
Saipan 27 15.1 ②19.9 6.6 ― ― 3.7 ― 2.9 3.3 12.0 3.7 2.9 2.9 ①49.6 ③19.2 ―
South Pacific islands or other islands 53 17 .6 ②30.7 15.3 ― ― ― ― 2.1 1.5 14.1 3.6 ③18.7 ― ①56.1 16.3 ―
Shanghai 119 ①35.0 4.1 15.5 ②21.9 15.5 17.2 7.2 10.0 2.4 ③21.6 3.3 7.0 2.6 ― 1.7 ―
Beijing 39 ①43.6 2.4 2 .4 ②27.7 2.4 ③24.4 10.1 8.4 4.8 16.7 2.4 5.3 2.4 ― 2.4 ―
Other China (exc. Hong Kong / Macau) 90 ①39.5 1 .9 12.3 ②31.4 4.7 11.2 1.9 7.7 1.0 ③21.0 1.0 7.5 1.0 ― 1.0 ―
Hong Kong 223 ①19 .8 2.7 5 .1 8 .5 ②11.5 3 .3 1.8 4.7 1.7 ③10 .1 2.5 6.9 0.9 ― 0.9 0.5
Macau 62 ①22 .1 4.8 4 .4 ③11 .9 4.9 ― 1.3 4.6 ― ②14.1 1.8 1 .8 ― ― ― ―
Taiwan 639 ①34.0 2 .1 2 .7 ②19.3 2.4 12.8 1.5 7.8 1.5 ③19.1 1.5 10.1 1.6 0 .3 0.3 0.2
Korea 392 ①11 .9 0 .7 3 .6 5 .2 2.1 1 .9 0.5 3.6 1.5 ②10 .4 0.7 ③9.3 0.3 0 .5 0.4 ―
Singapore 157 ①28.9 5.0 9.8 16.6 13.6 7 .2 ③18.9 7.4 1.2 ②19.2 1.9 3.6 2.1 2.7 1.4 ―
Phuket 38 7 .9 ①34.0 9.8 5 .0 4.2 ― 3.0 2.1 ― 2 .9 2.4 ②30.7 7.7 5.3 7.4 ―
Thai beaches (other than Phuket) 38 ③13 .7 12.5 ②14.3 13 .4 2.1 ― 2.4 4.1 3.0 7 .2 5.0 ①14.9 2.1 4.5 4.2 ―
Bangkok or other Thai cities 207 ①27 .7 4.6 3 .8 ②19.7 0.9 1 .3 1.9 3.0 ― 15.6 3.0 ③17.0 8.3 0.8 1.3 ―
Bali 80 ①33.1 10.1 4 .6 ③21.8 1.4 1 .0 4.2 5.5 1.0 18.2 2.3 ②32.4 ― 19.2 12.3 ―
Indonesian cities 14 ①28.8 ②28.5 14.3 14.3 20.8 7.9 6.4 ③21.6 ― 13.7 6.4 ― ― 6.4 ― ―
Malaysia 84 ①31.4 ③11.1 9.7 ②14 .7 2.2 2 .6 4.8 7.9 1.2 9 .6 ― 7.2 1.2 7.8 2.3 ―
Philippines 92 ③13 .8 ②14.4 5.2 6 .3 1.8 2 .9 1.8 2.2 1.0 5 .7 3.2 7.6 3.1 ①21.6 8.6 ―
Vietnam 149 ①48.2 8.0 ③27.0 ②33.8 3.4 5 .3 3.4 8.2 1.1 22.5 5.8 13.9 ― ― 0.5 ―
Cambodia 39 ①69.6 7.6 15.7 ②63.8 5.5 8.4 ― 14.6 ― ③37.1 5.7 7.8 2.8 ― ― ―
Other places in Asia 84 ①38.1 ― 4 .5 ②32.8 ― 6 .5 2.6 7.3 ― ③19.2 1.4 13.3 ― 1.4 ― ―
Australia 162 ①43.1 ②24.6 17.9 ③21.9 13.3 8.6 20.9 11.5 2.4 15.4 12.2 3.2 2.8 15.0 6.4 1.2
New Zealand or other Oceania 42 ①40.3 4.7 ②27.9 ③25.0 4.4 6 .6 11.7 ― 2.2 23.4 4.9 9.7 4.9 2.7 7.3 ―
Used 2,279 ①55.4 11.5 16.4 ②35.5 6.4 18.9 4.9 12.0 2.4 ③27.1 6.1 7.5 1.7 8.2 4.9 0.5
Didn't use 1,896 ①12 .8 3.0 3 .8 7 .1 3.6 7.7 2.9 1 .0 0.3 ③8.6 1.0 5.8 2.4 2.7 1.8 0.2
Sample
Outdoor
(fishing,
climbing, etc.)
Riding
(horseback,
rafting, etc.)
Other sportsSafari jungle
tour
Viewing of
theater,
musicals,
concert,
shows, etc.
Sports
viewing
Other event
viewing
Government
operated
gambling
(casinos,
horse racing,
etc.)
Night tour Instruction
Ethnic
cultural
experiences
Trains Car rental Other Nothing
Don't know
or don't
remember
2018 survey total 5,016 3.4 3.7 1.9 1.8 7.1 1.7 0.7 1.0 4.2 0.3 1.9 6.3 5.3 3.8 21.4 9.9
2017 survey total 4,986 2.7 3.6 1.5 1.2 7.4 1.8 0.7 0.9 4.1 0.3 1.8 6.1 4.7 3.2 21.2 11.5
UK 141 4.0 7.9 4.3 5.2 14.8 9.8 3.0 3.2 2.2 2.1 2.8 22.7 6.3 2.8 16 .2 5.4
France 164 3.6 2.1 2.3 2.5 10.0 2.1 0.7 1.2 2.3 0.5 3.0 17.2 4.2 5.1 12 .8 6.0
Germany 131 2.3 1.5 1.3 2.3 12.7 2.8 ― ― 2.9 0.6 2.0 18.6 3.6 0.9 11 .3 13.4
Spain 109 0.8 2.9 0.8 ― 23.0 8.0 0.7 0.8 8.1 ― 2.8 13.9 3.0 6.0 5 .5 3 .7
Italy 191 2.1 4.2 1.5 1.1 6.4 2.6 0.6 0.5 1.1 ― 1.5 16.2 2.0 3.3 8 .0 9.0
Other countries in western Europe 170 4.5 1.1 1.1 1.2 17.4 2.2 1.3 0.7 4.2 0.6 1.7 25.3 3.5 4.3 11 .5 6.9
Other places in Europe 194 2.5 2.4 0.9 ― 15.4 ― 0.5 ― 3.4 ― 2.1 12.9 2.6 9.3 10 .2 4 .9
Turkey 12 ― 8.9 7.4 7.4 16.3 ― ― ― ― ― ― ― ― 15.7 26.9 ―
Other Middle East or Africa 87 8.0 12.0 1.0 4.8 4.7 1.0 1.3 ― 5.6 ― 7.3 4.4 ― 5.2 13 .2 10.8
USA east 143 3.3 3.2 2.5 2.6 ②25.7 9.1 2.5 0.6 8.2 1.2 1.1 6.7 8.7 2.4 20.4 5.8
USA west 180 5.7 3.1 2.2 2.2 12.7 7.8 2.6 4.3 3.9 0.4 1.4 2.7 ③15.1 3.5 19.0 9.9
USA south 31 3.5 ― 3.5 ― 8.3 ②11.0 ― 2.5 3.5 ― 3.5 ― 8.6 3.6 26.6 10.8
Canada 85 12.2 2.7 2.7 ― 4.9 2.6 2.5 ― 3.2 ― ― ― 8.4 6.0 19.1 7.5
Central/South America or Caribbean 71 6.9 10.1 2.9 4.1 6.9 2.7 1.6 2.7 6.9 2.7 4.1 7.8 1.1 1.1 15 .8 12.0
Hawaii (Oahu) 561 6.7 7.8 3.7 1.1 3.3 0.3 0.6 0.1 3.4 0.6 0.8 0 .2 ②16.8 6.8 12 .3 7.8
Hawaii (other than Oahu) 151 10.7 11.7 4.1 3.9 4.2 2.0 2.1 0.7 8.9 1.3 3.5 0 .6 ③20.0 3.3 6 .9 6.9
Guam 207 4.6 3.6 4.4 1.0 8.2 0.4 ― ― 0.4 0.5 1.5 ― 8.0 5.2 18.4 7.0
Saipan 27 ― 4.1 4.2 4.1 ― ― 3.7 ― ― ― ― ― 5.8 ― 2.9 4.0
South Pacific islands or other islands 53 4.2 6.3 2.1 ― ― ― ― 2.1 ― ― 2.1 ― 7.5 4.2 9 .0 9.8
Shanghai 119 2.3 1.5 2.2 3.2 20.9 2.1 0.8 0.7 9.4 0.7 1.5 5.1 ― 0.7 21.8 10.6
Beijing 39 7.7 7.8 2.4 4.8 16.9 2.4 ― ― 8.1 2.4 ― 2.9 ― ― 23.4 19.2
Other China (exc. Hong Kong / Macau) 90 2.8 2.4 1.0 1.0 6.6 2.3 ― ― 5.3 1.3 3.5 7.2 ― 0.9 33.3 8.7
Hong Kong 223 0.9 1.4 0.4 0.9 4.6 1.3 1.0 4.2 7.5 ― 0.4 4.0 0.4 5.2 35.1 13.3
Macau 62 ― ― ― ― 8.1 ― ― 5.7 5.2 ― ― 3.1 ― 3.6 34.7 18.2
Taiwan 639 1.5 1.5 0.8 1.0 2.4 0.8 0.7 ― 4.4 ― 2.9 10.0 0.9 1.7 30.0 11.7
Korea 392 0.7 1.2 1.4 0.2 4.4 0.2 1.7 1.9 1.6 0.2 1.2 2.7 0.7 3.1 46.4 16.1
Singapore 157 2.0 2.0 1.8 13.7 2.5 1.2 1.3 3.1 11.2 ― 0.5 2.5 1.7 1.4 23.5 8.7
Phuket 38 ― ③10.1 2.1 2.1 2 .1 ― ― ― 2.4 ― ― 2.1 7.1 5.8 15 .4 8.4
Thai beaches (other than Phuket) 38 7.1 2.9 ― 2.1 ― ― ― ― ― ― ― 8.8 2.9 5.8 28.3 8.8
Bangkok or other Thai cities 207 0.5 5.6 0.6 1.3 5.3 0.9 0.5 ― 5.7 ― 0.5 5.1 3.2 1.6 31.0 9.4
Bali 80 2.1 13.5 6.3 6.6 5.0 ― 1.1 1.4 2.8 ― 6.5 ― 6.9 5.5 13 .0 3 .8
Indonesian cities 14 6.4 ― 6.4 ― 14.4 ― 6.4 6.4 6.4 6.4 ― ― 13.3 ― 13.5 23.6
Malaysia 84 3.7 ― ― 2.3 4.8 ― 1.2 2.2 2.5 ― 2.6 7.9 8.1 2.7 23.1 6.4
Philippines 92 1.0 4.5 3.9 1.0 1 .0 1.0 ― 1.8 3.1 ― ― 1.8 4.0 5.8 32.3 8.3
Vietnam 149 1.2 4.7 1.1 1.1 13.4 ― 0.6 ― 4.2 ― 4.1 0 .5 0.5 1.3 17.3 8.1
Cambodia 39 2.3 2.9 ― ― 7.9 ― ― 2.9 5.9 ― 5.9 ― 2.3 4.3 5 .2 4 .4
Other places in Asia 84 5.0 2.2 ― ― 5.9 ― 1.2 ― 2.6 ― 10.5 8.9 3.9 4.6 13 .8 16.7
Australia 162 7.7 7.1 3.7 4.9 3.5 1.8 1.1 0.7 6.7 ― 3.0 11.8 8.1 3.1 11 .3 8.3
New Zealand or other Oceania 42 15.2 4.7 5.4 2.7 ― 2.2 2.8 ― 9.6 1.9 2.8 ― 19.3 7.5 8 .4 11.0
Used 2,279 5.1 5.6 2.5 3.4 8.7 1.5 1.1 1.3 7.0 0.4 3.0 5.2 3.7 3.7 12 .5 2 .0
Didn't use 1,896 2.0 2.2 1.1 0.4 6.4 2.4 0.4 1.0 1.2 0.3 0.7 ②8.7 7.3 4.2 41.7 5.1
50.0 …Figures 5 or more points or higher than the 2018 survey total are shaded. † Items with under 30 samples are not shaded in the table.
50 .0 …Figures 5 or more points or lower than the 2018 survey total are shaded. † Items with under 10 samples are not indicated in the table.
† ① , ② , and ③ are the top three actions done locally as seen by destination (exc. "Other," "Nothing,"and "Don't know or don't remember").
† "Actions as destination" is the total of "that which was incorporated in the package tour," "that which was applied for prior to departure," and "that which was applied for locally"
Package
use
Last
destination
(middle
classification)
Last
destination
(middle
classification)
Package
use
31
9. Actions at Destination
1) Total
■Actions at destination (Total/Multiple answers)
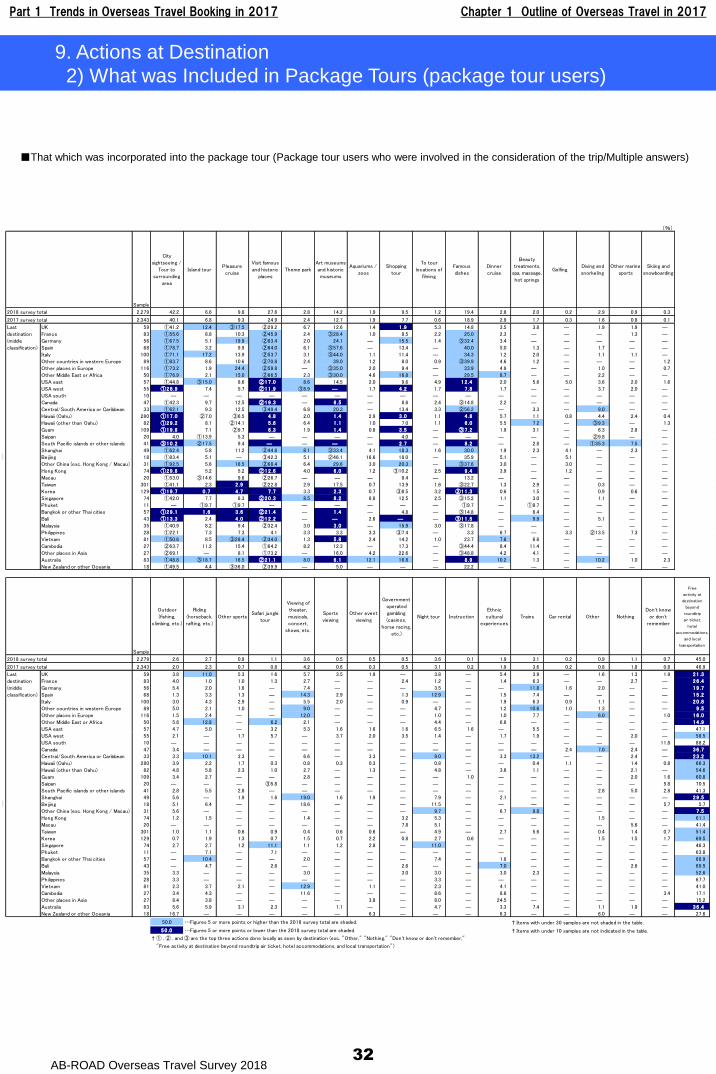
Part 1 Trends in Overseas Travel Booking in 2017 Chapter 1 Outline of Overseas Travel in 2017
AB-ROAD Overseas Travel Survey 201832
9. Actions at Destination
2) What was Included in Package Tours (package tour users)
(%)
Sample
City
sightseeing /
Tour to
surrounding
area
Island tourPleasure
cruise
Visit famous
and historic
places
Theme park
Art museums
and historic
museums
Aquariums /
zoos
Shopping
tour
To tour
locations of
filming
Famous
dishes
Dinner
cruise
Beauty
treatments,
spa, massage,
hot springs
GolfingDiving and
snorkeling
Other marine
sports
Skiing and
snowboarding
2018 survey total 2,279 42.2 6.6 9.8 27.6 2.8 14.2 1.9 9.5 1.2 19.4 2.8 2.0 0.2 2.9 0.9 0.3
2017 survey total 2,343 40.1 6.8 9.3 24.9 2.4 12.7 1.9 7.7 0.6 18.9 2.9 1.7 0.3 1.6 0.8 0.1
UK 59 ①41.2 12.4 ③17.5 ②29.2 6.7 12.6 1.4 1 .9 5.3 14.8 3.5 3.8 ― 1.9 1.9 ―
France 83 ①55.6 8.8 10.3 ②45.9 2.4 ③28.4 1.0 8.5 2.2 25.0 2.3 ― ― ― 1.3 ―
Germany 56 ①67.5 5.1 19.9 ②63.4 2.0 24.1 ― 15.5 1.4 ③32.4 3.4 ― ― ― ― ―
Spain 68 ①78.7 3.2 9.9 ②64.0 6.1 ③57.6 ― 13.4 ― 40.0 5.0 1.3 ― 1.7 ― ―
Italy 100 ①71.1 17.2 13.9 ②53.7 3.1 ③44.0 1.1 11.4 ― 34.3 1.2 2.0 ― 1.1 1.1 ―
Other countries in western Europe 89 ①83.7 8.6 10.6 ②70.8 2.4 39.0 1.2 8.0 0.9 ③39.9 4.6 1.2 ― ― ― 1.2
Other places in Europe 116 ①73.2 1.9 24.4 ②59.8 ― ③35.0 2.0 9.4 ― 33.9 4.9 ― ― 1.0 ― 0.7
Other Middle East or Africa 50 ①76.9 2.1 15.0 ②66.5 2.3 ③30.0 4.6 16.8 ― 29.5 8.7 ― ― 2.2 ― ―
USA east 57 ①44.8 ③15.0 8.6 ②17 .0 8.6 14.5 2.0 9.6 4.9 12 .4 2.0 5.6 5.0 3.6 2.0 1.6
USA west 55 ①28 .9 7.4 5.7 ②11 .9 ③8.9 ― 1.7 4 .2 1.7 7 .8 1.7 ― ― 3.7 2.0 ―
USA south 10 ― ― ― ― ― ― ― ― ― ― ― ― ― ― ― ―
Canada 47 ①42.3 9.7 12.5 ②19 .3 ― 6 .5 ― 8.6 2.4 ③14.8 2.2 ― ― ― ― ―
Central/South America or Caribbean 33 ①62.1 9.3 12.5 ③49.4 6.8 20.3 ― 13.4 3.3 ②56.2 ― 3.3 ― 9.0 ― ―
Hawaii (Oahu) 280 ①17 .0 ②7.0 ③6.5 4 .8 2.0 1 .4 2.9 3 .0 1.1 4 .8 5.7 1.1 0.8 4.4 2.4 0.4
Hawaii (other than Oahu) 82 ①29 .2 8.1 ②14.1 5 .6 6.4 1 .1 1.0 7.0 1.1 6 .0 5.5 7.2 ― ③9.3 ― 1.3
Guam 109 ①19 .6 7.1 ②9.7 6 .3 1.9 1 .4 0.8 3 .5 ― ③7 .2 1.9 3.1 ― 6.3 2.8 ―
Saipan 20 4.0 ①13.9 5.3 ― ― ― ― 4.0 ― ― ― ― ― ②9.8 ― ―
South Pacific islands or other islands 41 ③10 .2 ②17.5 9.4 ― ― ― ― 2 .7 ― 8 .2 ― 2.8 ― ①35.3 7.5 ―
Shanghai 49 ①62.4 5.8 11.2 ②44.8 8.1 ③33.4 4.1 18.3 1.6 30.0 1.9 2.3 4.1 ― 2.3 ―
Beijing 18 ①83.4 5.1 ― ③42.3 5.1 ②46.1 16.6 18.0 ― 35.9 5.1 ― 5.1 ― ― ―
Other China (exc. Hong Kong / Macau) 31 ①92.5 5.6 16.5 ②68.4 6.4 29.6 3.0 20.3 ― ③37.6 3.0 ― 3.0 ― ― ―
Hong Kong 74 ①29 .6 5.2 5.2 ②12 .6 4.0 6 .0 1.2 ③10.2 2.5 9 .4 3.9 ― 1.2 ― ― ―
Macau 20 ①53.0 ③14.6 9.6 ②26.7 ― ― ― 8.4 ― 13.2 ― ― ― ― ― ―
Taiwan 301 ①41.1 2.3 2 .9 ②22.8 2.9 17.5 0.7 13.9 1.6 ③22.7 1.3 2.9 ― 0.3 ― ―
Korea 129 ①19 .7 0 .7 4 .7 7 .7 3.3 2 .3 0.7 ③8.5 3.2 ②11 .3 0.6 1.5 ― 0.9 0.6 ―
Singapore 74 ①42.0 7.7 8.3 ②20 .3 8.5 8 .2 6.8 12.5 2.5 ③15.2 1.1 3.0 ― 1.1 ― ―
Phuket 11 ― ①9.7 ①9.7 ― ― ― ― ― ― ①9.7 ― ①9.7 ― ― ― ―
Bangkok or other Thai cities 57 ①29 .1 1 .6 3 .6 ②21 .4 ― 1 .4 ― 4.8 ― ③14.8 ― 6.4 ― ― ― ―
Bali 43 ①13 .3 2.4 4 .0 ②12 .2 ― ― 2.6 ― ― ③11 .5 ― 9.9 ― 5.1 ― ―
Malaysia 35 ①40.9 8.2 9.4 ②32.4 3.0 3 .0 ― 15.9 3.0 ③17.8 ― ― ― ― ― ―
Philippines 28 ①22.1 7.3 7.3 4.1 3.3 3.3 3.3 ③7.4 ― 3.3 6.7 ― 3.3 ②13.5 7.3 ―
Vietnam 81 ①50.6 8.5 ③28.4 ②34.0 1.3 5 .8 2.4 14.2 1.0 23.7 7.8 6.6 ― ― ― ―
Cambodia 27 ②63.7 11.2 15.4 ①64.2 8.2 12.3 ― 17.3 ― ③44.4 8.4 11.4 ― ― ― ―
Other places in Asia 27 ②69.1 ― 8.1 ①73.2 ― 16.0 4.2 22.6 ― ③48.8 4.2 4.1 ― ― ― ―
Australia 83 ①48.8 ③18.7 16.5 ②21 .1 8.0 6 .1 12.1 16.8 ― 8 .9 10.2 1.3 ― 10.2 1.0 2.3
New Zealand or other Oceania 18 ①49.5 4.4 ③36.0 ②39.9 ― 5.0 ― ― ― 22.2 ― ― ― ― ― ―
Sample
Outdoor
(fishing,
climbing, etc.)
Riding
(horseback,
rafting, etc.)
Other sportsSafari jungle
tour
Viewing of
theater,
musicals,
concert,
shows, etc.
Sports
viewing
Other event
viewing
Government
operated
gambling
(casinos,
horse racing,
etc.)
Night tour Instruction
Ethnic
cultural
experiences
Trains Car rental Other Nothing
Don't know
or don't
remember
Free
activity at
destination
beyond
roundtrip
air ticket,
hotel
accommodations,
and local
transportation
2018 survey total 2,279 2.6 2.7 0.9 1.1 3.6 0.5 0.5 0.5 3.6 0.1 1.9 3.1 0.2 0.9 1.1 0.7 45.0
2017 survey total 2,343 2.0 2.3 0.7 0.8 4.2 0.6 0.3 0.5 3.1 0.2 1.9 3.6 0.2 0.8 1.8 0.8 46.9
UK 59 3.8 11.0 5.3 1.6 5.7 3.5 1.9 ― 3.8 ― 5.4 3.9 ― 1.6 1.3 1.9 21 .3
France 83 4.0 1.0 1.0 1.3 2.7 ― ― 2.4 1.2 ― 1.4 6.3 ― ― 2.7 ― 26 .4
Germany 56 5.4 2.0 1.6 ― 7.4 ― ― ― 3.5 ― ― 11.8 1.6 2.0 ― ― 19 .7
Spain 68 1.3 3.3 1.3 ― 14.3 2.9 ― 1.3 12.9 ― 1.5 7.4 ― ― ― ― 15 .2
Italy 100 3.0 4.3 2.9 ― 5.5 2.0 ― 0.9 ― ― 1.9 6.3 0.9 1.1 ― ― 20 .8
Other countries in western Europe 89 5.0 2.1 1.0 ― 9.0 ― ― ― 4.7 ― 1.2 10.6 1.0 1.3 ― ― 9 .5
Other places in Europe 116 1.5 2.4 ― ― 12.0 ― ― ― 1.0 ― 1.0 7.7 ― 6.0 ― 1.0 16 .0
Other Middle East or Africa 50 5.8 12.8 ― 6.2 2.1 ― ― ― 4.4 ― 6.6 ― ― ― ― ― 14 .9
USA east 57 4.7 5.0 ― 3.2 5.3 1.6 1.6 1.6 6.5 1.6 ― 5.5 ― ― ― ― 47.1
USA west 55 2.1 ― 1.7 5.7 ― 3.7 2.0 3.5 1.4 ― 1.7 1.9 ― ― 2.0 ― 58.5
USA south 10 ― ― ― ― ― ― ― ― ― ― ― ― ― ― ― 11.8 88.2
Canada 47 3.4 ― ― ― ― ― ― ― ― ― ― ― 2.4 7.0 2.4 ― 36 .7
Central/South America or Caribbean 33 3.3 10.1 3.3 ― 6.6 ― 3.3 ― 9.0 ― 3.3 13.2 ― ― 2.4 ― 23 .2
Hawaii (Oahu) 280 3.9 2.2 1.7 0.3 0.8 0.3 0.3 ― 0.8 ― ― 0.4 1.1 ― 1.4 0.8 66.3
Hawaii (other than Oahu) 82 4.8 5.8 2.3 1.0 2.7 ― 1.3 ― 4.8 ― 3.6 1.1 ― ― 2.1 ― 54.6
Guam 109 3.4 2.7 ― ― 2.8 ― ― ― ― 1.0 ― ― ― ― 2.0 1.6 60.8
Saipan 20 ― ― ― ③5.8 ― ― ― ― ― ― ― ― ― ― ― 5.8 70.5
South Pacific islands or other islands 41 2.8 5.5 2.8 ― ― ― ― ― ― ― ― ― ― 2.8 5.0 2.8 41.3
Shanghai 49 5.6 ― 1.9 1.6 19.0 1.6 1.9 ― 7.9 ― 2.1 ― ― ― ― ― 29 .5
Beijing 18 5.1 6.4 ― ― 18.6 ― ― ― 11.5 ― ― ― ― ― ― 5.7 5.7
Other China (exc. Hong Kong / Macau) 31 5.6 ― ― ― ― ― ― ― 9.7 ― 6.7 9.8 ― ― ― ― 7 .5
Hong Kong 74 1.2 1.5 ― ― 1.4 ― ― 3.2 5.3 ― ― ― ― 1.5 ― ― 61.1
Macau 20 ― ― ― ― ― ― ― 7.8 5.1 ― ― ― ― ― 5.6 ― 41.4
Taiwan 301 1.0 1.1 0.6 0.9 0.4 0.6 0.6 ― 4.9 ― 2.7 5.6 ― 0.4 1.4 0.7 51.4
Korea 129 0.7 1.9 1.3 0.7 1.5 0.7 2.2 0.8 2.7 0.6 ― ― ― 1.5 1.5 1.7 69.5
Singapore 74 2.7 2.7 1.2 11.1 1.1 1.2 2.8 ― 11.0 ― ― ― ― ― ― ― 46.3
Phuket 11 ― 7.1 ― 7.1 ― ― ― ― ― ― ― ― ― ― ― ― 63.8
Bangkok or other Thai cities 57 ― 10.4 ― ― 2.0 ― ― ― 7.4 ― 1.8 ― ― ― ― ― 68.9
Bali 43 ― 4.7 ― 2.6 ― ― ― 2.6 ― ― 7.0 ― ― ― 2.6 ― 69.5
Malaysia 35 3.3 ― ― ― 3.0 ― ― 3.0 3.0 ― 3.0 2.3 ― ― ― ― 52.6
Philippines 28 3.3 ― ― ― ― ― ― ― 3.3 ― ― ― ― ― ― ― 67.7
Vietnam 81 2.3 3.7 2.1 ― 12.9 ― 1.1 ― 2.3 ― 4.1 ― ― ― ― ― 41.0
Cambodia 27 3.4 4.3 ― ― 11.6 ― ― ― 8.6 ― 8.6 ― ― ― ― 3.4 17.1
Other places in Asia 27 8.4 3.8 ― ― ― ― 3.8 ― 8.0 ― 24.5 ― ― ― ― ― 15.2
Australia 83 5.6 5.9 3.1 2.3 ― 1.1 ― ― 4.7 ― 3.3 7.4 ― 1.1 1.9 ― 36 .4
New Zealand or other Oceania 18 16.7 ― ― ― ― ― 6.3 ― ― ― 6.3 ― ― 6.0 ― ― 27.6
50.0 …Figures 5 or more points or higher than the 2018 survey total are shaded. † Items with under 30 samples are not shaded in the table.
50 .0 …Figures 5 or more points or lower than the 2018 survey total are shaded. † Items with under 10 samples are not indicated in the table.
† ① , ② , and ③ are the top three actions done locally as seen by destination (exc. "Other," "Nothing," "Don't know or don't remember,"
"Free activity at destination beyond roundtrip air ticket, hotel accommodations, and local transportation")
Last
destination
(middle
classification)
Last
destination
(middle
classification)
■That which was incorporated into the package tour (Package tour users who were involved in the consideration of the trip/Multiple answers)
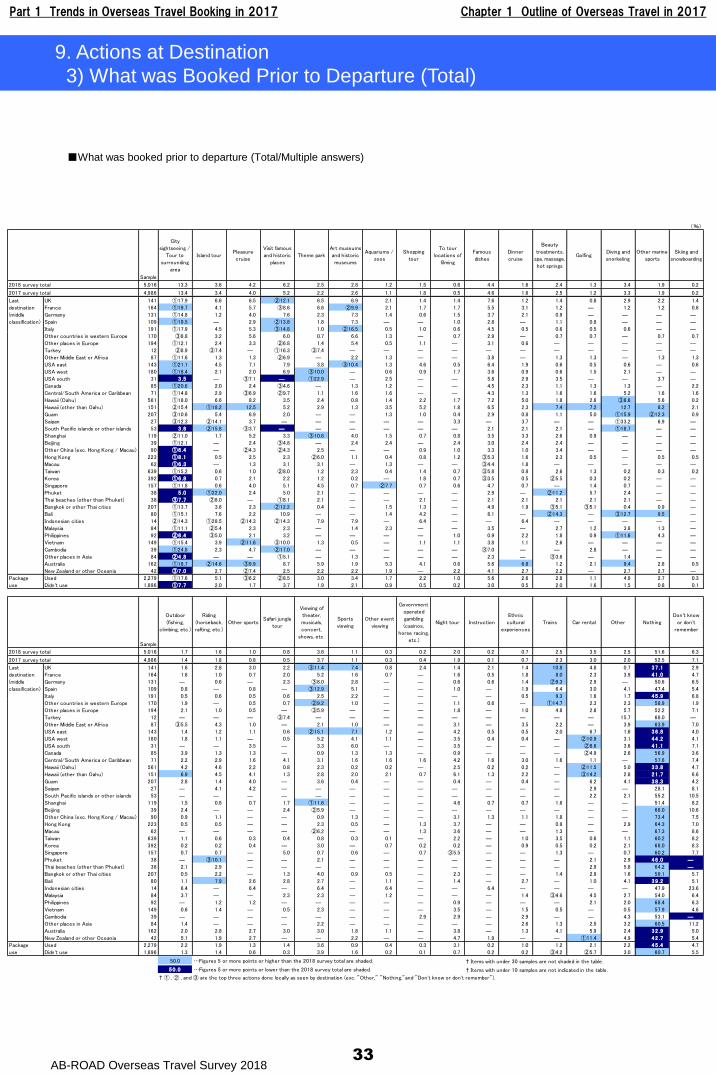
Part 1 Trends in Overseas Travel Booking in 2017 Chapter 1 Outline of Overseas Travel in 2017
AB-ROAD Overseas Travel Survey 2018
(%)
Sample
City
sightseeing /
Tour to
surrounding
area
Island tourPleasure
cruise
Visit famous
and historic
places
Theme park
Art museums
and historic
museums
Aquariums /
zoos
Shopping
tour
To tour
locations of
filming
Famous
dishes
Dinner
cruise
Beauty
treatments,
spa, massage,
hot springs
GolfingDiving and
snorkeling
Other marine
sports
Skiing and
snowboarding
2018 survey total 5,016 13.3 3.6 4.2 6.2 2.5 2.8 1.2 1.5 0.6 4.4 1.6 2.4 1.3 3.4 1.9 0.2
2017 survey total 4,986 13.4 3.4 4.0 5.2 2.2 2.6 1.1 1.8 0.5 4.6 1.6 2.5 1.2 3.3 1.9 0.2
UK 141 ①17.9 6.6 6.5 ②12.1 6.5 6.9 2.1 1.4 1.4 7.6 1.2 1.4 0.8 2.9 2.2 1.4
France 164 ①19.7 4.1 5.7 ③8.6 6.6 ②9.9 2.1 1.7 1.7 5.5 3.1 1.2 ― 1.2 1.2 0.6
Germany 131 ①14.8 1.2 4.0 7.6 2.3 7.3 1.4 0.6 1.5 3.7 2.1 0.9 ― ― ― ―
Spain 109 ①19.5 ― 2.9 ②13.8 1.8 7.3 ― ― 1.0 2.8 ― 1.1 0.8 ― ― ―
Italy 191 ①17.9 4.5 5.3 ③14.8 1.0 ②16.5 0.5 1.0 0.6 4.5 0.5 0.6 0.5 0.6 ― ―
Other countries in western Europe 170 ③8.8 3.2 5.6 6.0 0.7 6.6 1.3 ― 0.7 2.9 ― 0.7 0.7 ― 0.7 0.7
Other places in Europe 194 ①12.1 2.4 3.3 ②6.8 1.4 5.4 0.5 1.1 ― 3.1 0.6 ― ― ― ― ―
Turkey 12 ②8.9 ③7.4 ― ①16.3 ③7.4 ― ― ― ― ― ― ― ― ― ― ―
Other Middle East or Africa 87 ①11.6 1.3 1.3 ②6.9 ― 2.2 1.3 ― ― 3.8 ― 1.3 1.3 ― 1.3 1.3
USA east 143 ①21.1 4.5 7.1 7.9 3.8 ③10.4 1.3 4.6 0.5 6.4 1.9 0.6 0.5 0.6 ― 0.6
USA west 180 ①18.4 2.1 2.0 6.9 ③10.0 ― 0.6 0.9 1.7 3.6 0.9 0.6 1.5 2.1 ― ―
USA south 31 3 .5 ― ③7.1 ― ①22.9 ― 2.5 ― ― 5.8 2.9 3.5 ― ― 3.7 ―
Canada 85 ①20.6 2.0 2.4 ③4.6 ― 1.3 1.2 ― ― 4.5 2.3 1.1 1.3 1.3 ― 2.2
Central/South America or Caribbean 71 ①14.8 2.9 ③6.9 ②9.7 1.1 1.6 1.6 ― ― 4.3 1.3 1.6 1.6 5.2 1.6 1.6
Hawaii (Oahu) 561 ①18.0 6.6 8.2 3.5 2.4 0.8 1.4 2.2 1.7 7.2 5.0 1.8 2.6 ③8.6 5.6 0.2
Hawaii (other than Oahu) 151 ②15.4 ①18.2 12.5 5.2 2.9 1.3 3.5 5.2 1.8 6.5 2.3 7.4 7.2 12.7 8.2 2.1
Guam 207 ③10.6 5.4 6.9 2.0 ― ― 1.3 1.0 0.4 2.9 0.8 1.1 5.0 ①15.9 ②12.3 0.9
Saipan 27 ③12.3 ②14.1 3.7 ― ― ― ― ― 3.3 ― 3.7 ― ― ①33.2 6.9 ―
South Pacific islands or other islands 53 3 .6 ②15.8 ③3.7 ― ― ― ― ― ― 2.1 2.1 2.1 ― ①18.7 ― ―
Shanghai 119 ②11.0 1.7 5.2 3.3 ③10.6 4.0 1.5 0.7 0.8 3.5 3.3 2.6 0.9 ― ― ―
Beijing 39 ①12.1 ― 2.4 ③4.8 ― 2.4 2.4 ― 2.4 3.0 2.4 2.4 ― ― ― ―
Other China (exc. Hong Kong / Macau) 90 ①6.4 ― ②4.3 ②4.3 2.5 ― ― 0.9 1.0 3.3 1.0 3.4 ― ― ― ―
Hong Kong 223 ①8.1 0.5 2.5 2.3 ②6.0 1.1 0.4 0.8 1.2 ③5.3 1.6 2.3 0.5 ― 0.5 0.5
Macau 62 ①6.3 ― 1.3 3.1 3.1 ― 1.3 ― ― ③4.4 1.8 ― ― ― ― ―
Taiwan 639 ①15.2 0.6 1.0 ②8.0 1.2 2.3 0.4 1.4 0.7 ③5.8 0.8 2.6 1.3 0.2 0.3 0.2
Korea 392 ①6.8 0.7 2.1 2.2 1.2 0.2 ― 1.8 0.7 ③3.5 0.5 ②5.5 0.3 0.2 ― ―
Singapore 157 ①11.8 0.6 4.0 5.1 4.5 0.7 ②7.7 0.7 0.6 4.7 0.7 ― 1.4 0.7 ― ―
Phuket 38 5 .0 ①22.0 2.4 5.0 2.1 ― ― ― ― 2.9 ― ②11.2 5.7 2.4 ― ―
Thai beaches (other than Phuket) 38 ③7.7 ②8.0 ― ①8.1 2.1 ― ― 2.1 ― 2.1 2.1 2.1 2.1 2.1 ― ―
Bangkok or other Thai cities 207 ①13.7 3.6 2.3 ②12.2 0.4 ― 1.5 1.3 ― 4.9 1.9 ③5.1 ③5.1 0.4 0.9 ―
Bali 80 ①15.1 7.6 2.2 10.9 ― ― 1.4 4.2 ― 8.1 ― ②14.3 ― ③12.7 9.5 ―
Indonesian cities 14 ②14.3 ①28.5 ②14.3 ②14.3 7.9 7.9 ― 6.4 ― ― 6.4 ― ― ― ― ―
Malaysia 84 ①11.1 ②5.4 2.3 2.3 ― 1.4 2.3 ― ― 3.5 ― 2.7 1.2 3.8 1.3 ―
Philippines 92 ②6.4 ③5.0 2.1 3.2 ― ― ― ― 1.0 0.9 2.2 1.8 0.9 ①11.6 4.3 ―
Vietnam 149 ①15.4 3.9 ②11.6 ③10.0 1.3 0.5 ― 1.1 1.1 3.8 1.1 2.6 ― ― ― ―
Cambodia 39 ①24.8 2.3 4.7 ②17.0 ― ― ― ― ― ③7.0 ― ― 2.8 ― ― ―
Other places in Asia 84 ②4.8 ― ― ①5.1 ― 1.3 ― ― ― 2.3 ― ③3.6 ― 1.4 ― ―
Australia 162 ①18.7 ②14.6 ③9.9 8.7 5.9 1.9 5.3 4.1 0.6 5.6 6.8 1.2 2.1 9.4 2.8 0.5
New Zealand or other Oceania 42 ③7.0 2.7 ②7.4 2.5 2.2 2.2 1.9 ― 2.2 4.1 2.7 2.2 ― 2.7 2.7 ―
Used 2,279 ①17.6 5.1 ③6.2 ②8.5 3.0 3.4 1.7 2.2 1.0 5.6 2.6 2.8 1.1 4.9 2.7 0.3
Didn't use 1,896 ①7.7 2.0 1.7 3.7 1.9 2.1 0.9 0.5 0.2 3.0 0.5 2.0 1.6 1.5 0.8 0.1
Sample
Outdoor
(fishing,
climbing, etc.)
Riding
(horseback,
rafting, etc.)
Other sportsSafari jungle
tour
Viewing of
theater,
musicals,
concert,
shows, etc.
Sports
viewing
Other event
viewing
Government
operated
gambling
(casinos,
horse racing,
etc.)
Night tour Instruction
Ethnic
cultural
experiences
Trains Car rental Other Nothing
Don't know
or don't
remember
2018 survey total 5,016 1.7 1.6 1.0 0.8 3.6 1.1 0.3 0.2 2.0 0.2 0.7 2.5 3.5 2.5 51.6 6.3
2017 survey total 4,986 1.4 1.8 0.8 0.5 3.7 1.1 0.3 0.4 1.9 0.1 0.7 2.3 3.0 2.0 52.5 7.1
UK 141 1.6 2.8 3.0 2.2 ③11.4 7.4 0.8 2.4 1.4 2.1 1.4 10.8 4.8 0.7 37 .1 2.9
France 164 1.6 1.0 0.7 2.0 5.2 1.6 0.7 ― 1.6 0.5 1.8 8.0 2.3 3.9 41 .0 4.7
Germany 131 ― 0.6 ― 2.3 ③8.0 2.8 ― ― 0.6 0.6 1.4 ②9.3 2.9 ― 50.6 6.5
Spain 109 0.8 ― 0.8 ― ③12.9 5.1 ― ― 1.0 ― 1.9 6.4 3.0 4.1 47.4 5.4
Italy 191 0.5 0.6 0.5 0.6 2.5 2.2 ― ― ― ― 0.5 9.3 1.6 1.7 45 .9 6.8
Other countries in western Europe 170 1.9 ― 0.5 0.7 ②9.2 1.0 ― ― 1.1 0.6 ― ①14.7 2.3 2.3 58.9 1.9
Other places in Europe 194 2.1 1.0 0.5 ― ③5.9 ― ― ― 1.8 ― 1.0 4.8 2.6 5.7 52.2 7.1
Turkey 12 ― ― ― ③7.4 ― ― ― ― ― ― ― ― ― 15.7 68.0 ―
Other Middle East or Africa 87 ③5.5 4.3 1.0 ― 2.1 1.0 ― ― 3.1 ― 3.5 2.2 ― 3.9 63.9 7.0
USA east 143 1.4 1.2 1.1 0.6 ②15.1 7.1 1.2 ― 4.2 0.5 0.5 2.0 6.7 1.6 36 .8 4.0
USA west 180 1.8 1.1 ― 0.5 5.2 4.1 1.1 ― 3.5 0.4 0.4 ― ②10.9 3.1 44 .2 4.1
USA south 31 ― ― 3.5 ― 3.3 6.0 ― ― 3.5 ― ― ― ②8.6 3.6 41 .1 7.1
Canada 85 3.9 1.3 1.3 ― 0.9 1.3 1.3 ― 0.9 ― ― ― ②4.9 2.6 56.9 3.6
Central/South America or Caribbean 71 2.2 2.9 1.6 4.1 3.1 1.6 1.6 1.6 4.2 1.6 3.0 1.6 1.1 ― 57.6 7.4
Hawaii (Oahu) 561 4.2 4.6 2.2 0.8 2.3 0.2 0.2 ― 2.5 0.2 0.2 ― ②11.5 5.0 33 .8 4.7
Hawaii (other than Oahu) 151 6.9 4.5 4.1 1.3 2.8 2.0 2.1 0.7 6.1 1.3 2.2 ― ③14.2 2.8 21 .7 6.6
Guam 207 2.8 1.4 4.0 ― 3.6 0.4 ― ― 0.4 ― 0.4 ― 6.2 4.1 38 .3 4.2
Saipan 27 ― 4.1 4.2 ― ― ― ― ― ― ― ― ― 2.9 ― 28.1 8.1
South Pacific islands or other islands 53 ― ― ― ― ― ― ― ― ― ― ― ― 2.2 2.1 55.2 10.5
Shanghai 119 1.5 0.8 0.7 1.7 ①11.6 ― ― ― 4.6 0.7 0.7 1.6 ― ― 51.4 8.2
Beijing 39 2.4 ― ― 2.4 ②5.9 ― ― ― ― ― ― ― ― ― 66.0 10.6
Other China (exc. Hong Kong / Macau) 90 0.9 1.1 ― ― 0.9 1.3 ― ― 3.1 1.3 1.1 1.8 ― ― 73.4 7.5
Hong Kong 223 0.5 0.5 ― ― 2.3 0.5 ― 1.3 3.7 ― ― 0.9 ― 2.9 64.3 7.0
Macau 62 ― ― ― ― ②6.2 ― ― 1.3 3.6 ― ― 1.3 ― ― 67.3 8.6
Taiwan 639 1.1 0.6 0.3 0.4 0.8 0.3 0.1 ― 2.2 ― 1.0 3.5 0.6 1.1 60.2 8.2
Korea 392 0.2 0.2 0.4 ― 3.0 ― 0.7 0.2 0.2 ― 0.9 0.5 0.2 2.1 68.0 8.3
Singapore 157 0.7 0.7 ― 5.0 0.7 0.6 ― 0.7 ③5.5 ― ― 1.3 ― 0.7 60.2 7.7
Phuket 38 ― ③10.1 ― ― 2.1 ― ― ― ― ― ― ― 2.1 2.9 46 .0 ―
Thai beaches (other than Phuket) 38 2.1 2.9 ― ― ― ― ― ― ― ― ― ― 2.9 5.8 64.2 ―
Bangkok or other Thai cities 207 0.5 2.2 ― 1.3 4.0 0.9 0.5 ― 2.3 ― ― 1.4 2.9 1.6 59.1 5.7
Bali 80 1.1 7.9 2.6 2.8 2.7 ― 1.1 ― 1.4 ― 2.7 ― 1.0 4.1 39 .2 5.1
Indonesian cities 14 6.4 ― 6.4 ― 6.4 ― 6.4 ― ― 6.4 ― ― ― ― 47.9 23.6
Malaysia 84 3.7 ― ― 2.3 2.3 ― 1.2 ― ― ― 1.4 ③4.6 4.5 2.7 54.0 6.4
Philippines 92 ― 1.2 1.2 ― ― ― ― ― 0.9 ― ― ― 2.1 2.0 68.4 6.3
Vietnam 149 0.6 1.4 ― 0.5 2.3 ― ― ― 3.5 ― 1.5 0.5 ― 0.5 57.9 4.6
Cambodia 39 ― ― ― ― ― ― ― 2.9 2.9 ― 2.9 ― ― 4.3 53.1 ―
Other places in Asia 84 1.4 ― ― ― 2.2 ― ― ― ― ― 2.6 1.3 2.5 3.2 60.5 11.2
Australia 162 2.0 2.8 2.7 3.0 3.0 1.8 1.1 ― 3.8 ― 1.3 4.1 5.9 2.4 32 .9 5.0
New Zealand or other Oceania 42 5.1 1.9 2.7 ― ― 2.2 ― ― 4.7 1.9 ― ― ①11.4 4.9 42 .7 5.4
Used 2,279 2.2 1.9 1.3 1.4 3.6 0.9 0.4 0.3 3.1 0.2 1.0 1.2 2.1 2.2 45 .4 4.7
Didn't use 1,896 1.3 1.4 0.6 0.3 3.9 1.6 0.2 0.1 0.7 0.2 0.2 ③4.2 ②5.7 3.0 60.7 5.5
50.0 …Figures 5 or more points or higher than the 2018 survey total are shaded. † Items with under 30 samples are not shaded in the table.
50 .0 …Figures 5 or more points or lower than the 2018 survey total are shaded. † Items with under 10 samples are not indicated in the table.
† ① , ② , and ③ are the top three actions done locally as seen by destination (exc. "Other," "Nothing,"and "Don't know or don't remember").
Package
use
Last
destination
(middle
classification)
Last
destination
(middle
classification)
Package
use
33
9. Actions at Destination
3) What was Booked Prior to Departure (Total)
■What was booked prior to departure (Total/Multiple answers)
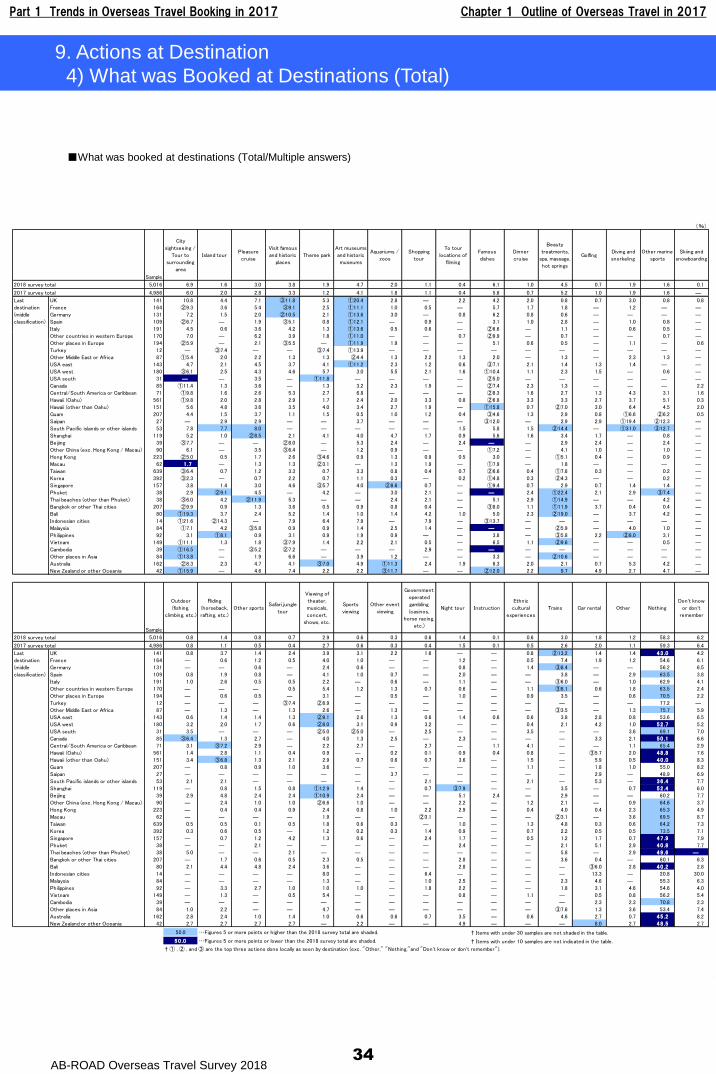
Part 1 Trends in Overseas Travel Booking in 2017 Chapter 1 Outline of Overseas Travel in 2017
AB-ROAD Overseas Travel Survey 201834
9. Actions at Destination
4) What was Booked at Destinations (Total)
(%)
Sample
City
sightseeing /
Tour to
surrounding
area
Island tourPleasure
cruise
Visit famous
and historic
places
Theme park
Art museums
and historic
museums
Aquariums /
zoos
Shopping
tour
To tour
locations of
filming
Famous
dishes
Dinner
cruise
Beauty
treatments,
spa, massage,
hot springs
GolfingDiving and
snorkeling
Other marine
sports
Skiing and
snowboarding
2018 survey total 5,016 6.9 1.6 3.0 3.8 1.9 4.7 2.0 1.1 0.4 6.1 1.0 4.5 0.7 1.9 1.6 0.1
2017 survey total 4,986 6.0 2.0 2.8 3.3 1.2 4.1 1.8 1.1 0.4 5.6 0.7 5.2 1.0 1.9 1.6 ―
UK 141 10.8 4.4 7.1 ③11.8 5.3 ①20.4 2.8 ― 2.2 4.2 2.0 0.8 0.7 3.0 0.8 0.8
France 164 ②9.3 3.6 5.4 ③9.1 2.5 ①11.1 1.0 0.5 ― 5.7 1.7 1.8 ― 1.2 ― ―
Germany 131 7.2 1.5 2.0 ②10.5 2.1 ①13.6 3.0 ― 0.8 6.2 0.8 0.6 ― ― ― ―
Spain 109 ②6.7 ― 1.9 ③5.1 0.8 ①12.1 ― 0.9 ― 3.1 1.0 2.8 ― 1.0 0.8 ―
Italy 191 4.5 0.6 3.6 4.2 1.3 ①13.6 0.5 0.6 ― ②6.6 ― 1.1 ― 0.6 0.5 ―
Other countries in western Europe 170 7.0 ― 6.2 3.9 1.8 ①11.0 ― ― 0.7 ②9.9 ― 0.7 ― ― 0.7 ―
Other places in Europe 194 ②5.9 ― 2.1 ③5.5 ― ①11.9 1.9 ― ― 5.1 0.6 0.5 ― 1.1 ― 0.6
Turkey 12 ― ③7.4 ― ― ③7.4 ①13.9 ― ― ― ― ― ― ― ― ― ―
Other Middle East or Africa 87 ①5.4 2.0 2.2 1.3 1.3 ②4.4 1.3 2.2 1.3 2.0 ― 1.3 ― 2.3 1.3 ―
USA east 143 4.7 2.1 4.5 3.7 4.1 ①11.2 2.3 1.2 0.6 ③7.1 2.1 1.4 1.3 1.4 ― ―
USA west 180 ③6.1 2.5 4.3 4.6 5.7 3.0 5.5 2.1 1.6 ①10.4 1.1 2.3 1.5 ― 0.6 ―
USA south 31 ― ― 3.5 ― ①11.8 ― ― ― ― ②5.0 ― ― ― ― ― ―
Canada 85 ①11.4 1.3 3.6 ― 1.3 3.2 2.3 1.9 ― ②7.4 2.3 1.3 ― ― ― 2.2
Central/South America or Caribbean 71 ①9.8 1.6 2.6 5.3 2.7 6.8 ― ― ― ②8.3 1.6 2.7 1.3 4.3 3.1 1.6
Hawaii (Oahu) 561 ①9.8 2.0 2.8 2.9 1.7 2.4 2.0 3.3 0.8 ②6.8 3.3 3.3 2.7 3.7 5.1 0.3
Hawaii (other than Oahu) 151 5.6 4.8 3.6 3.5 4.0 3.4 2.7 1.9 ― ①15.8 0.7 ②7.0 3.0 6.4 4.5 2.0
Guam 207 4.4 1.5 3.7 1.1 1.5 0.5 1.0 1.2 0.4 ③4.6 1.3 2.9 0.8 ①6.6 ②6.2 0.5
Saipan 27 ― 2.9 2.9 ― ― 3.7 ― ― ― ③12.0 ― 2.9 2.9 ①19.4 ②12.3 ―
South Pacific islands or other islands 53 7.8 7.7 8.0 ― ― ― ― ― 1.5 5.8 1.5 ②14.4 ― ①31.0 ③12.7 ―
Shanghai 119 5.2 1.0 ②8.5 2.1 4.1 4.0 4.7 1.7 0.9 5.6 1.6 3.4 1.7 ― 0.8 ―
Beijing 39 ③7.7 ― ― ②8.0 ― 5.3 2.4 ― 2.4 ― ― 2.9 2.4 ― 2.4 ―
Other China (exc. Hong Kong / Macau) 90 6.1 ― 3.5 ③6.4 ― 1.2 0.9 ― ― ①7.2 ― 4.1 1.0 ― 1.0 ―
Hong Kong 223 ②5.0 0.5 1.7 2.6 ③4.6 0.9 1.3 0.9 0.5 3.0 ― ①5.1 0.4 ― 0.9 ―
Macau 62 1 .7 ― 1.3 1.3 ②3.1 ― 1.3 1.9 ― ①7.9 ― 1.8 ― ― ― ―
Taiwan 639 ③6.4 0.7 1.2 3.3 0.7 3.3 0.8 0.4 0.7 ②6.6 0.4 ①7.6 0.3 ― 0.2 ―
Korea 392 ③2.3 ― 0.7 2.2 0.7 1.1 0.3 ― 0.2 ①4.8 0.3 ②4.3 ― ― 0.2 ―
Singapore 157 3.8 1.4 3.0 4.6 ③5.7 4.0 ②8.6 0.7 ― ①9.4 0.7 2.9 0.7 1.4 1.4 ―
Phuket 38 2.9 ②9.1 4.5 ― 4.2 ― 3.0 2.1 ― ― 2.4 ①22.4 2.1 2.9 ③7.4 ―
Thai beaches (other than Phuket) 38 ③6.0 4.2 ②11.9 5.3 ― ― 2.4 2.1 ― 5.1 2.9 ①14.9 ― ― 4.2 ―
Bangkok or other Thai cities 207 ②9.9 0.9 1.3 3.6 0.5 0.9 0.8 0.4 ― ③8.0 1.1 ①11.9 3.7 0.4 0.4 ―
Bali 80 ①19.3 3.7 2.4 5.2 1.4 1.0 1.4 4.2 1.0 5.0 2.3 ②19.0 ― 3.7 4.2 ―
Indonesian cities 14 ①21.6 ②14.3 ― 7.9 6.4 7.9 ― 7.9 ― ③13.7 ― ― ― ― ― ―
Malaysia 84 ①7.1 4.2 ③5.8 0.9 0.9 1.4 2.5 1.4 ― ― ― ②5.9 ― 4.0 1.0 ―
Philippines 92 3.1 ①8.1 0.9 3.1 0.9 1.9 0.9 ― ― 3.8 ― ③5.8 2.2 ②8.0 3.1 ―
Vietnam 149 ①11.1 1.3 1.8 ③7.9 1.4 2.2 2.1 0.5 ― 6.5 1.1 ②9.6 ― ― 0.5 ―
Cambodia 39 ①16.5 ― ③5.2 ②7.2 ― ― ― 2.9 ― ― ― ― ― ― ― ―
Other places in Asia 84 ①13.8 ― 1.9 6.6 ― 3.9 1.2 ― ― 3.3 ― ②10.6 ― ― ― ―
Australia 162 ②8.3 2.3 4.7 4.1 ③7.0 4.9 ①11.3 2.4 1.9 6.3 2.0 2.1 0.7 5.3 4.2 ―
New Zealand or other Oceania 42 ①15.9 ― 4.6 7.4 2.2 2.2 ③11.7 ― ― ②12.0 2.2 9.7 4.9 2.7 4.7 ―
Sample
Outdoor
(fishing,
climbing, etc.)
Riding
(horseback,
rafting, etc.)
Other sportsSafari jungle
tour
Viewing of
theater,
musicals,
concert,
shows, etc.
Sports
viewing
Other event
viewing
Government
operated
gambling
(casinos,
horse racing,
etc.)
Night tour Instruction
Ethnic
cultural
experiences
Trains Car rental Other Nothing
Don't know
or don't
remember
2018 survey total 5,016 0.8 1.4 0.8 0.7 2.9 0.6 0.3 0.6 1.4 0.1 0.6 3.0 1.8 1.2 58.3 6.2
2017 survey total 4,986 0.8 1.1 0.5 0.4 2.7 0.6 0.3 0.4 1.5 0.1 0.5 2.6 2.0 1.1 59.3 6.4
UK 141 0.8 3.7 1.4 2.4 3.9 3.1 2.2 1.6 ― ― 0.8 ②13.2 1.4 1.4 43 .0 4.2
France 164 ― 0.6 1.2 0.5 4.0 1.0 ― ― 1.2 ― 0.5 7.4 1.9 1.2 54.6 6.1
Germany 131 ― ― 0.6 ― 2.4 0.6 ― ― 0.8 ― 1.4 ③8.4 ― ― 56.2 6.5
Spain 109 0.8 1.9 0.8 ― 4.1 1.0 0.7 ― 2.0 ― ― 3.8 ― 2.9 63.5 3.8
Italy 191 1.0 2.6 0.5 0.5 2.2 ― 0.6 ― 1.1 ― ― ③6.0 ― 1.0 62.9 4.1
Other countries in western Europe 170 ― ― ― 0.5 5.4 1.2 1.3 0.7 0.6 ― 1.1 ③8.1 0.6 1.8 63.5 2.4
Other places in Europe 194 ― 0.6 0.5 ― 3.1 ― 0.5 ― 1.0 ― 0.9 3.5 ― 0.6 70.5 2.2
Turkey 12 ― ― ― ③7.4 ②8.9 ― ― ― ― ― ― ― ― ― 77.2 ―
Other Middle East or Africa 87 ― 1.3 ― 1.3 2.6 ― 1.3 ― ― ― ― ③3.5 ― 1.3 75.7 5.9
USA east 143 0.6 1.4 1.4 1.3 ②9.1 2.6 1.3 0.6 1.4 0.6 0.6 3.8 2.8 0.8 53.6 6.5
USA west 180 3.2 2.0 1.7 0.6 ②8.0 3.1 0.9 3.2 ― ― 0.4 2.1 4.2 1.0 52 .7 5.2
USA south 31 3.5 ― ― ― ②5.0 ②5.0 ― 2.5 ― ― 3.5 ― ― 3.6 69.1 7.0
Canada 85 ③6.4 1.3 2.7 ― 4.0 1.3 2.5 ― 2.3 ― ― ― 3.3 2.1 50 .1 6.6
Central/South America or Caribbean 71 3.1 ③7.2 2.9 ― 2.2 2.7 ― 2.7 ― 1.1 4.1 ― ― 1.1 65.4 2.9
Hawaii (Oahu) 561 1.4 2.8 1.1 0.4 0.9 ― 0.2 0.1 0.9 0.4 0.8 ― ③5.7 2.0 48 .8 7.6
Hawaii (other than Oahu) 151 3.4 ③6.8 1.3 2.1 2.9 0.7 0.6 0.7 3.6 ― 1.5 ― 5.9 0.5 40 .0 8.3
Guam 207 ― 0.8 0.9 1.0 3.6 ― ― ― ― ― 1.1 ― 1.8 1.0 55.0 8.2
Saipan 27 ― ― ― ― ― ― 3.7 ― ― ― ― ― 2.9 ― 48.9 6.9
South Pacific islands or other islands 53 2.1 2.1 ― ― ― ― ― 2.1 ― ― 2.1 ― 5.3 ― 36 .4 7.7
Shanghai 119 ― 0.8 1.5 0.8 ①12.9 1.4 ― 0.7 ③7.9 ― ― 3.5 ― 0.7 52 .4 6.0
Beijing 39 2.9 4.8 2.4 2.4 ①10.9 2.4 ― ― 5.1 2.4 ― 2.9 ― ― 60.2 7.7
Other China (exc. Hong Kong / Macau) 90 ― 2.4 1.0 1.0 ②6.6 1.0 ― ― 2.2 ― 1.2 2.1 ― 0.9 64.6 3.7
Hong Kong 223 ― 0.4 0.4 0.9 2.4 0.8 1.0 2.2 2.9 ― 0.4 4.0 0.4 2.3 65.3 4.9
Macau 62 ― ― ― ― 1.9 ― ― ②3.1 ― ― ― ②3.1 ― 3.6 69.5 8.7
Taiwan 639 0.5 0.5 0.1 0.5 1.8 0.6 0.3 ― 1.0 ― 1.3 4.8 0.3 0.6 64.2 7.3
Korea 392 0.3 0.6 0.5 ― 1.2 0.2 0.3 1.4 0.9 ― 0.7 2.2 0.5 0.5 73.5 7.1
Singapore 157 ― 0.7 1.2 4.2 1.3 0.6 ― 2.4 1.7 ― 0.5 1.2 1.7 0.7 47 .9 7.9
Phuket 38 ― ― 2.1 ― ― ― ― ― 2.4 ― ― 2.1 5.1 2.9 40 .8 7.7
Thai beaches (other than Phuket) 38 5.0 ― ― 2.1 ― ― ― ― ― ― ― 5.8 ― 2.9 49 .6 ―
Bangkok or other Thai cities 207 ― 1.7 0.6 0.5 2.3 0.5 ― ― 2.8 ― ― 3.6 0.4 ― 60.1 6.3
Bali 80 2.1 4.4 4.8 2.4 3.6 ― ― ― 2.8 ― ― ― ③6.0 2.8 40 .2 2.8
Indonesian cities 14 ― ― ― ― 8.0 ― ― 6.4 ― ― ― ― 13.3 ― 20.8 30.0
Malaysia 84 ― ― ― ― 1.3 ― ― 1.0 2.5 ― ― 2.3 4.6 ― 55.3 6.3
Philippines 92 ― 3.3 2.7 1.0 1.0 1.0 ― 1.8 2.2 ― ― 1.8 3.1 4.6 54.6 4.0
Vietnam 149 ― 1.3 ― 0.5 5.4 ― ― ― 0.8 ― 1.1 ― 0.5 0.8 56.2 5.4
Cambodia 39 ― ― ― ― ― ― ― ― ― ― ― ― 2.3 2.3 70.8 2.3
Other places in Asia 84 1.0 2.2 ― ― 4.7 ― ― ― ― ― ― ③7.6 1.3 3.6 53.4 7.4
Australia 162 2.8 2.4 1.0 1.4 1.0 0.6 0.6 0.7 3.5 ― 0.6 4.6 2.7 0.7 45 .2 8.2
New Zealand or other Oceania 42 2.7 2.7 2.7 2.7 ― 2.2 ― ― 4.9 ― ― ― 8.0 2.7 48 .5 2.7
50.0 …Figures 5 or more points or higher than the 2018 survey total are shaded. † Items with under 30 samples are not shaded in the table.
50 .0 …Figures 5 or more points or lower than the 2018 survey total are shaded. † Items with under 10 samples are not indicated in the table.
† ① , ② , and ③ are the top three actions done locally as seen by destination (exc. "Other," "Nothing,"and "Don't know or don't remember").
Last
destination
(middle
classification)
Last
destination
(middle
classification)
■What was booked at destinations (Total/Multiple answers)
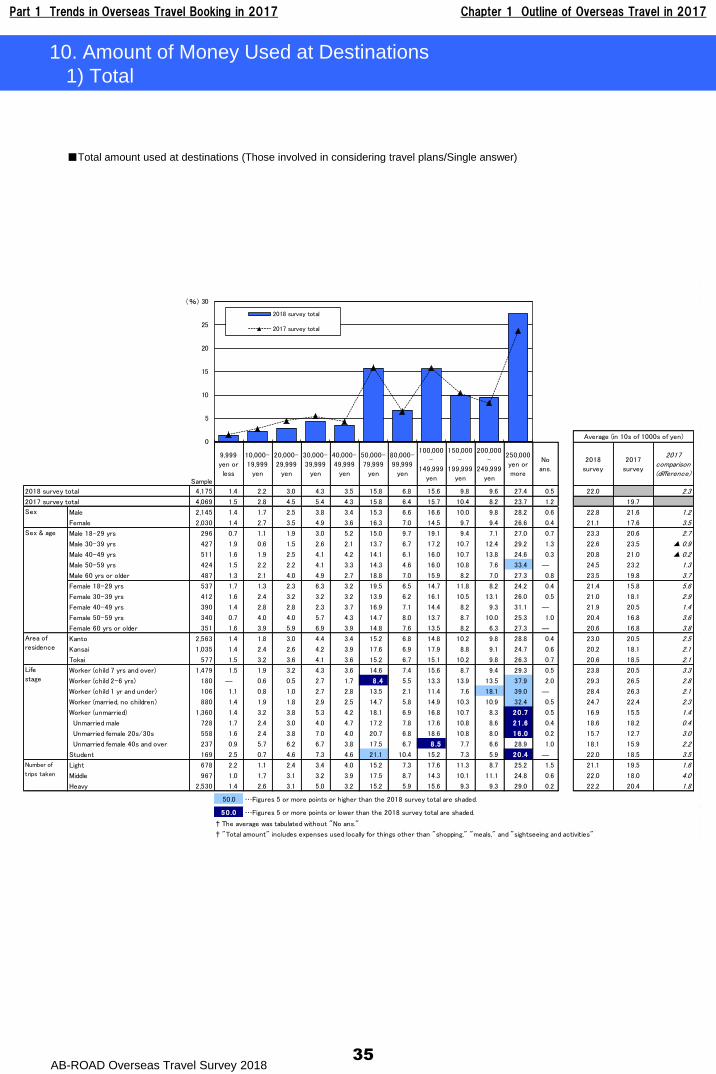
Part 1 Trends in Overseas Travel Booking in 2017 Chapter 1 Outline of Overseas Travel in 2017
AB-ROAD Overseas Travel Survey 2018
Sample
9,999
yen or
less
10,000-
19,999
yen
20,000-
29,999
yen
30,000-
39,999
yen
40,000-
49,999
yen
50,000-
79,999
yen
80,000-
99,999
yen
100,000
-
149,999
yen
150,000
-
199,999
yen
200,000
-
249,999
yen
250,000
yen or
more
No
ans.
2018
survey
2017
survey
2017comparison(difference)
2018 survey total 4,175 1.4 2.2 3.0 4.3 3.5 15.8 6.8 15.6 9.8 9.6 27.4 0.5 22.0 2.3
2017 survey total 4,069 1.5 2.8 4.5 5.4 4.3 15.8 6.4 15.7 10.4 8.2 23.7 1.2 19.7
Sex Male 2,145 1.4 1.7 2.5 3.8 3.4 15.3 6.6 16.6 10.0 9.8 28.2 0.6 22.8 21.6 1.2
Female 2,030 1.4 2.7 3.5 4.9 3.6 16.3 7.0 14.5 9.7 9.4 26.6 0.4 21.1 17.6 3.5
Male 18-29 yrs 296 0.7 1.1 1.9 3.0 5.2 15.0 9.7 19.1 9.4 7.1 27.0 0.7 23.3 20.6 2.7
Male 30-39 yrs 427 1.9 0.6 1.5 2.6 2.1 13.7 6.7 17.2 10.7 12.4 29.2 1.3 22.6 23.5 ▲ 0.9
Male 40-49 yrs 511 1.6 1.9 2.5 4.1 4.2 14.1 6.1 16.0 10.7 13.8 24.6 0.3 20.8 21.0 ▲ 0.2
Male 50-59 yrs 424 1.5 2.2 2.2 4.1 3.3 14.3 4.6 16.0 10.8 7.6 33.4 ― 24.5 23.2 1.3
Male 60 yrs or older 487 1.3 2.1 4.0 4.9 2.7 18.8 7.0 15.9 8.2 7.0 27.3 0.8 23.5 19.8 3.7
Female 18-29 yrs 537 1.7 1.3 2.3 6.3 3.2 19.5 6.5 14.7 11.8 8.2 24.2 0.4 21.4 15.8 5.6
Female 30-39 yrs 412 1.6 2.4 3.2 3.2 3.2 13.9 6.2 16.1 10.5 13.1 26.0 0.5 21.0 18.1 2.9
Female 40-49 yrs 390 1.4 2.8 2.8 2.3 3.7 16.9 7.1 14.4 8.2 9.3 31.1 ― 21.9 20.5 1.4
Female 50-59 yrs 340 0.7 4.0 4.0 5.7 4.3 14.7 8.0 13.7 8.7 10.0 25.3 1.0 20.4 16.8 3.6
Female 60 yrs or older 351 1.6 3.9 5.9 6.9 3.9 14.8 7.6 13.5 8.2 6.3 27.3 ― 20.6 16.8 3.8
Kanto 2,563 1.4 1.8 3.0 4.4 3.4 15.2 6.8 14.8 10.2 9.8 28.8 0.4 23.0 20.5 2.5
Kansai 1,035 1.4 2.4 2.6 4.2 3.9 17.6 6.9 17.9 8.8 9.1 24.7 0.6 20.2 18.1 2.1
Tokai 577 1.5 3.2 3.6 4.1 3.6 15.2 6.7 15.1 10.2 9.8 26.3 0.7 20.6 18.5 2.1
Worker (child 7 yrs and over) 1,479 1.5 1.9 3.2 4.3 3.6 14.6 7.4 15.6 8.7 9.4 29.3 0.5 23.8 20.5 3.3
Worker (child 2-6 yrs) 180 ― 0.6 0.5 2.7 1.7 8 .4 5.5 13.3 13.9 13.5 37.9 2.0 29.3 26.5 2.8
Worker (child 1 yr and under) 106 1.1 0.8 1.0 2.7 2.8 13.5 2.1 11.4 7.6 18.1 39.0 ― 28.4 26.3 2.1
Worker (married, no children) 880 1.4 1.9 1.8 2.9 2.5 14.7 5.8 14.9 10.3 10.9 32.4 0.5 24.7 22.4 2.3
Worker (unmarried) 1,360 1.4 3.2 3.8 5.3 4.2 18.1 6.9 16.8 10.7 8.3 20 .7 0.5 16.9 15.5 1.4
Unmarried male 728 1.7 2.4 3.0 4.0 4.7 17.2 7.8 17.6 10.8 8.6 21 .6 0.4 18.6 18.2 0.4
Unmarried female 20s/30s 558 1.6 2.4 3.8 7.0 4.0 20.7 6.8 18.6 10.8 8.0 16 .0 0.2 15.7 12.7 3.0
Unmarried female 40s and over 237 0.9 5.7 6.2 6.7 3.8 17.5 6.7 8 .5 7.7 6.6 28.9 1.0 18.1 15.9 2.2
Student 169 2.5 0.7 4.6 7.3 4.6 21.1 10.4 15.2 7.3 5.9 20 .4 ― 22.0 18.5 3.5
Light 678 2.2 1.1 2.4 3.4 4.0 15.2 7.3 17.6 11.3 8.7 25.2 1.5 21.1 19.5 1.6
Middle 967 1.0 1.7 3.1 3.2 3.9 17.5 8.7 14.3 10.1 11.1 24.8 0.6 22.0 18.0 4.0
Heavy 2,530 1.4 2.6 3.1 5.0 3.2 15.2 5.9 15.6 9.3 9.3 29.0 0.2 22.2 20.4 1.8
50.0 …Figures 5 or more points or higher than the 2018 survey total are shaded.
50 .0 …Figures 5 or more points or lower than the 2018 survey total are shaded.
† The average was tabulated without "No ans."
† "Total amount" includes expenses used locally for things other than "shopping," "meals," and "sightseeing and activities"
Number of
trips taken
Average (in 10s of 1000s of yen)
Sex & age
Area of
residence
Life
stage
0
5
10
15
20
25
30
2018 survey total
2017 survey total
(%)
35
10. Amount of Money Used at Destinations
1) Total
■Total amount used at destinations (Those involved in considering travel plans/Single answer)
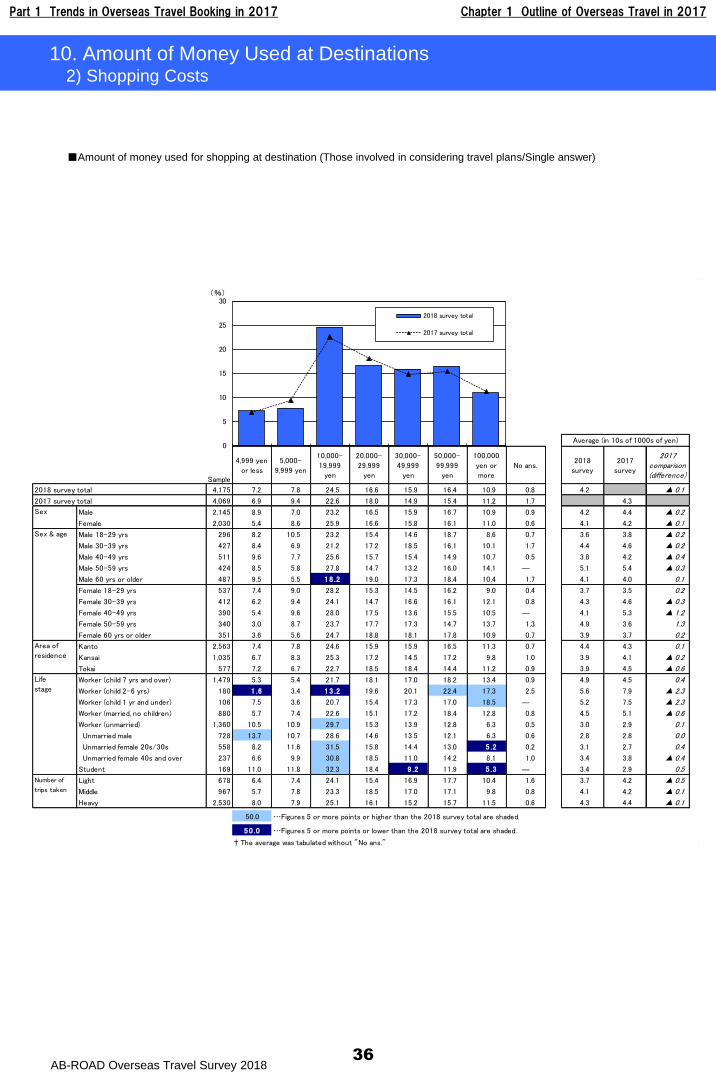
Part 1 Trends in Overseas Travel Booking in 2017 Chapter 1 Outline of Overseas Travel in 2017
AB-ROAD Overseas Travel Survey 201836
10. Amount of Money Used at Destinations2) Shopping Costs
Sample
4,999 yen
or less
5,000-
9,999 yen
10,000-
19,999
yen
20,000-
29,999
yen
30,000-
49,999
yen
50,000-
99,999
yen
100,000
yen or
more
No ans.2018
survey
2017
survey
2017comparison(difference)
2018 survey total 4,175 7.2 7.8 24.5 16.6 15.9 16.4 10.9 0.8 4.2 ▲ 0.1
2017 survey total 4,069 6.9 9.4 22.6 18.0 14.9 15.4 11.2 1.7 4.3
Sex Male 2,145 8.9 7.0 23.2 16.5 15.9 16.7 10.9 0.9 4.2 4.4 ▲ 0.2
Female 2,030 5.4 8.6 25.9 16.6 15.8 16.1 11.0 0.6 4.1 4.2 ▲ 0.1
Male 18-29 yrs 296 8.2 10.5 23.2 15.4 14.6 18.7 8.6 0.7 3.6 3.8 ▲ 0.2
Male 30-39 yrs 427 8.4 6.9 21.2 17.2 18.5 16.1 10.1 1.7 4.4 4.6 ▲ 0.2
Male 40-49 yrs 511 9.6 7.7 25.6 15.7 15.4 14.9 10.7 0.5 3.8 4.2 ▲ 0.4
Male 50-59 yrs 424 8.5 5.8 27.8 14.7 13.2 16.0 14.1 ― 5.1 5.4 ▲ 0.3
Male 60 yrs or older 487 9.5 5.5 18 .2 19.0 17.3 18.4 10.4 1.7 4.1 4.0 0.1
Female 18-29 yrs 537 7.4 9.0 28.2 15.3 14.5 16.2 9.0 0.4 3.7 3.5 0.2
Female 30-39 yrs 412 6.2 9.4 24.1 14.7 16.6 16.1 12.1 0.8 4.3 4.6 ▲ 0.3
Female 40-49 yrs 390 5.4 9.6 28.0 17.5 13.6 15.5 10.5 ― 4.1 5.3 ▲ 1.2
Female 50-59 yrs 340 3.0 8.7 23.7 17.7 17.3 14.7 13.7 1.3 4.9 3.6 1.3
Female 60 yrs or older 351 3.6 5.6 24.7 18.8 18.1 17.8 10.9 0.7 3.9 3.7 0.2
Kanto 2,563 7.4 7.8 24.6 15.9 15.9 16.5 11.3 0.7 4.4 4.3 0.1
Kansai 1,035 6.7 8.3 25.3 17.2 14.5 17.2 9.8 1.0 3.9 4.1 ▲ 0.2
Tokai 577 7.2 6.7 22.7 18.5 18.4 14.4 11.2 0.9 3.9 4.5 ▲ 0.6
Worker (child 7 yrs and over) 1,479 5.3 5.4 21.7 18.1 17.0 18.2 13.4 0.9 4.9 4.5 0.4
Worker (child 2-6 yrs) 180 1 .6 3.4 13 .2 19.6 20.1 22.4 17.3 2.5 5.6 7.9 ▲ 2.3
Worker (child 1 yr and under) 106 7.5 3.6 20.7 15.4 17.3 17.0 18.5 ― 5.2 7.5 ▲ 2.3
Worker (married, no children) 880 5.7 7.4 22.6 15.1 17.2 18.4 12.8 0.8 4.5 5.1 ▲ 0.6
Worker (unmarried) 1,360 10.5 10.9 29.7 15.3 13.9 12.8 6.3 0.5 3.0 2.9 0.1
Unmarried male 728 13.7 10.7 28.6 14.6 13.5 12.1 6.3 0.6 2.8 2.8 0.0
Unmarried female 20s/30s 558 8.2 11.6 31.5 15.8 14.4 13.0 5 .2 0.2 3.1 2.7 0.4
Unmarried female 40s and over 237 6.6 9.9 30.8 18.5 11.0 14.2 8.1 1.0 3.4 3.8 ▲ 0.4
Student 169 11.0 11.8 32.3 18.4 9 .2 11.9 5 .3 ― 3.4 2.9 0.5
Light 678 6.4 7.4 24.1 15.4 16.9 17.7 10.4 1.6 3.7 4.2 ▲ 0.5
Middle 967 5.7 7.8 23.3 18.5 17.0 17.1 9.8 0.8 4.1 4.2 ▲ 0.1
Heavy 2,530 8.0 7.9 25.1 16.1 15.2 15.7 11.5 0.6 4.3 4.4 ▲ 0.1
50.0 …Figures 5 or more points or higher than the 2018 survey total are shaded.
50 .0 …Figures 5 or more points or lower than the 2018 survey total are shaded.
† The average was tabulated without "No ans."
Number of
trips taken
Average (in 10s of 1000s of yen)
Sex & age
Area of
residence
Life
stage
0
5
10
15
20
25
30
2018 survey total
2017 survey total
(%)
■Amount of money used for shopping at destination (Those involved in considering travel plans/Single answer)
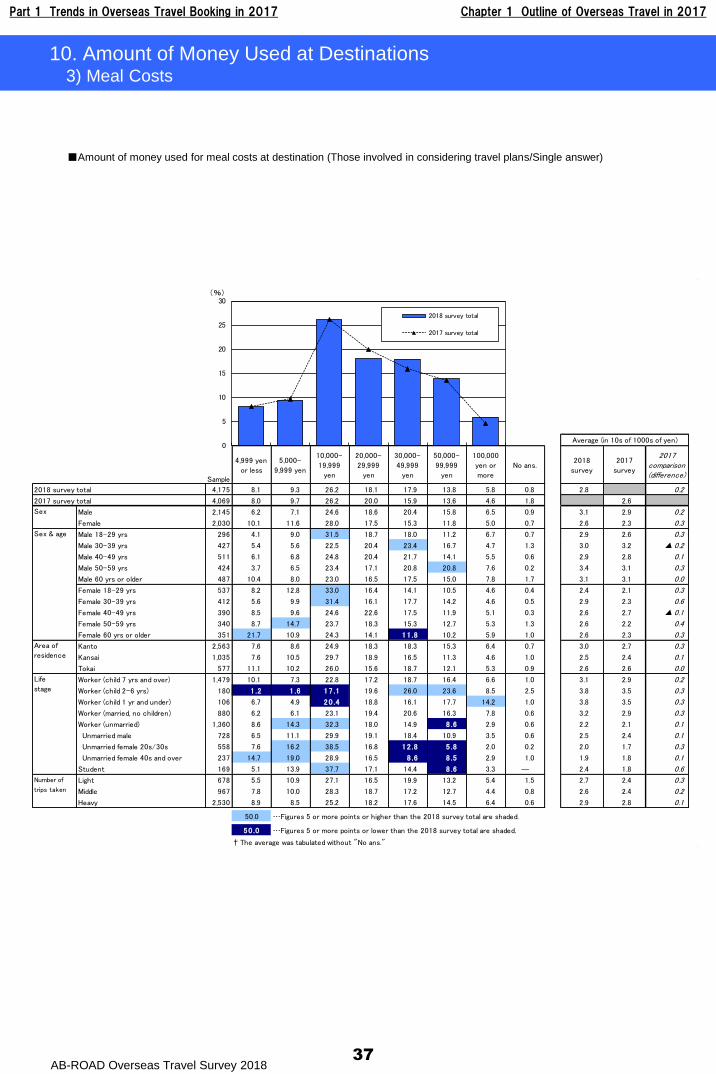
Part 1 Trends in Overseas Travel Booking in 2017 Chapter 1 Outline of Overseas Travel in 2017
AB-ROAD Overseas Travel Survey 201837
10. Amount of Money Used at Destinations3) Meal Costs
Sample
4,999 yen
or less
5,000-
9,999 yen
10,000-
19,999
yen
20,000-
29,999
yen
30,000-
49,999
yen
50,000-
99,999
yen
100,000
yen or
more
No ans.2018
survey
2017
survey
2017comparison(difference)
2018 survey total 4,175 8.1 9.3 26.2 18.1 17.9 13.8 5.8 0.8 2.8 0.2
2017 survey total 4,069 8.0 9.7 26.2 20.0 15.9 13.6 4.6 1.8 2.6
Sex Male 2,145 6.2 7.1 24.6 18.6 20.4 15.8 6.5 0.9 3.1 2.9 0.2
Female 2,030 10.1 11.6 28.0 17.5 15.3 11.8 5.0 0.7 2.6 2.3 0.3
Male 18-29 yrs 296 4.1 9.0 31.5 18.7 18.0 11.2 6.7 0.7 2.9 2.6 0.3
Male 30-39 yrs 427 5.4 5.6 22.5 20.4 23.4 16.7 4.7 1.3 3.0 3.2 ▲ 0.2
Male 40-49 yrs 511 6.1 6.8 24.8 20.4 21.7 14.1 5.5 0.6 2.9 2.8 0.1
Male 50-59 yrs 424 3.7 6.5 23.4 17.1 20.8 20.8 7.6 0.2 3.4 3.1 0.3
Male 60 yrs or older 487 10.4 8.0 23.0 16.5 17.5 15.0 7.8 1.7 3.1 3.1 0.0
Female 18-29 yrs 537 8.2 12.8 33.0 16.4 14.1 10.5 4.6 0.4 2.4 2.1 0.3
Female 30-39 yrs 412 5.6 9.9 31.4 16.1 17.7 14.2 4.6 0.5 2.9 2.3 0.6
Female 40-49 yrs 390 8.5 9.6 24.6 22.6 17.5 11.9 5.1 0.3 2.6 2.7 ▲ 0.1
Female 50-59 yrs 340 8.7 14.7 23.7 18.3 15.3 12.7 5.3 1.3 2.6 2.2 0.4
Female 60 yrs or older 351 21.7 10.9 24.3 14.1 11 .8 10.2 5.9 1.0 2.6 2.3 0.3
Kanto 2,563 7.6 8.6 24.9 18.3 18.3 15.3 6.4 0.7 3.0 2.7 0.3
Kansai 1,035 7.6 10.5 29.7 18.9 16.5 11.3 4.6 1.0 2.5 2.4 0.1
Tokai 577 11.1 10.2 26.0 15.6 18.7 12.1 5.3 0.9 2.6 2.6 0.0
Worker (child 7 yrs and over) 1,479 10.1 7.3 22.8 17.2 18.7 16.4 6.6 1.0 3.1 2.9 0.2
Worker (child 2-6 yrs) 180 1 .2 1 .6 17 .1 19.6 26.0 23.6 8.5 2.5 3.8 3.5 0.3
Worker (child 1 yr and under) 106 6.7 4.9 20 .4 18.8 16.1 17.7 14.2 1.0 3.8 3.5 0.3
Worker (married, no children) 880 6.2 6.1 23.1 19.4 20.6 16.3 7.8 0.6 3.2 2.9 0.3
Worker (unmarried) 1,360 8.6 14.3 32.3 18.0 14.9 8 .6 2.9 0.6 2.2 2.1 0.1
Unmarried male 728 6.5 11.1 29.9 19.1 18.4 10.9 3.5 0.6 2.5 2.4 0.1
Unmarried female 20s/30s 558 7.6 16.2 38.5 16.8 12 .8 5 .8 2.0 0.2 2.0 1.7 0.3
Unmarried female 40s and over 237 14.7 19.0 28.9 16.5 8 .6 8 .5 2.9 1.0 1.9 1.8 0.1
Student 169 5.1 13.9 37.7 17.1 14.4 8 .6 3.3 ― 2.4 1.8 0.6
Light 678 5.5 10.9 27.1 16.5 19.9 13.2 5.4 1.5 2.7 2.4 0.3
Middle 967 7.8 10.0 28.3 18.7 17.2 12.7 4.4 0.8 2.6 2.4 0.2
Heavy 2,530 8.9 8.5 25.2 18.2 17.6 14.5 6.4 0.6 2.9 2.8 0.1
50.0 …Figures 5 or more points or higher than the 2018 survey total are shaded.
50 .0 …Figures 5 or more points or lower than the 2018 survey total are shaded.
† The average was tabulated without "No ans."
Number of
trips taken
Average (in 10s of 1000s of yen)
Sex & age
Area of
residence
Life
stage
0
5
10
15
20
25
30
2018 survey total
2017 survey total
(%)
■Amount of money used for meal costs at destination (Those involved in considering travel plans/Single answer)
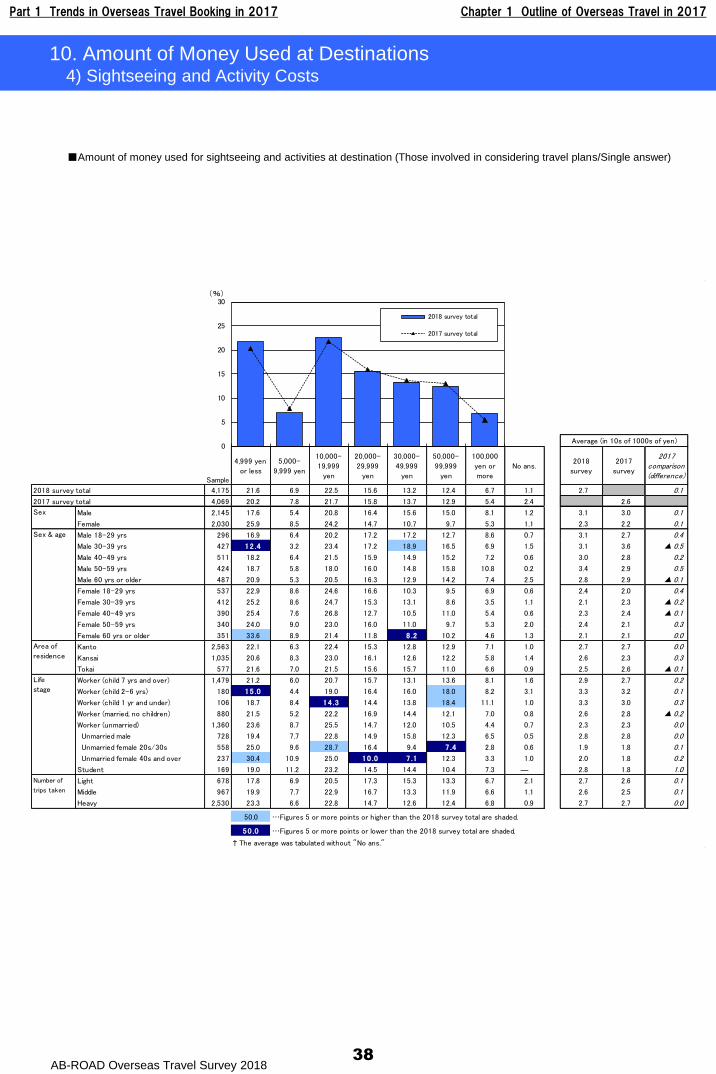
Part 1 Trends in Overseas Travel Booking in 2017 Chapter 1 Outline of Overseas Travel in 2017
AB-ROAD Overseas Travel Survey 201838
10. Amount of Money Used at Destinations4) Sightseeing and Activity Costs
Sample
4,999 yen
or less
5,000-
9,999 yen
10,000-
19,999
yen
20,000-
29,999
yen
30,000-
49,999
yen
50,000-
99,999
yen
100,000
yen or
more
No ans.2018
survey
2017
survey
2017comparison(difference)
2018 survey total 4,175 21.6 6.9 22.5 15.6 13.2 12.4 6.7 1.1 2.7 0.1
2017 survey total 4,069 20.2 7.8 21.7 15.8 13.7 12.9 5.4 2.4 2.6
Sex Male 2,145 17.6 5.4 20.8 16.4 15.6 15.0 8.1 1.2 3.1 3.0 0.1
Female 2,030 25.9 8.5 24.2 14.7 10.7 9.7 5.3 1.1 2.3 2.2 0.1
Male 18-29 yrs 296 16.9 6.4 20.2 17.2 17.2 12.7 8.6 0.7 3.1 2.7 0.4
Male 30-39 yrs 427 12 .4 3.2 23.4 17.2 18.9 16.5 6.9 1.5 3.1 3.6 ▲ 0.5
Male 40-49 yrs 511 18.2 6.4 21.5 15.9 14.9 15.2 7.2 0.6 3.0 2.8 0.2
Male 50-59 yrs 424 18.7 5.8 18.0 16.0 14.8 15.8 10.8 0.2 3.4 2.9 0.5
Male 60 yrs or older 487 20.9 5.3 20.5 16.3 12.9 14.2 7.4 2.5 2.8 2.9 ▲ 0.1
Female 18-29 yrs 537 22.9 8.6 24.6 16.6 10.3 9.5 6.9 0.6 2.4 2.0 0.4
Female 30-39 yrs 412 25.2 8.6 24.7 15.3 13.1 8.6 3.5 1.1 2.1 2.3 ▲ 0.2
Female 40-49 yrs 390 25.4 7.6 26.8 12.7 10.5 11.0 5.4 0.6 2.3 2.4 ▲ 0.1
Female 50-59 yrs 340 24.0 9.0 23.0 16.0 11.0 9.7 5.3 2.0 2.4 2.1 0.3
Female 60 yrs or older 351 33.6 8.9 21.4 11.8 8 .2 10.2 4.6 1.3 2.1 2.1 0.0
Kanto 2,563 22.1 6.3 22.4 15.3 12.8 12.9 7.1 1.0 2.7 2.7 0.0
Kansai 1,035 20.6 8.3 23.0 16.1 12.6 12.2 5.8 1.4 2.6 2.3 0.3
Tokai 577 21.6 7.0 21.5 15.6 15.7 11.0 6.6 0.9 2.5 2.6 ▲ 0.1
Worker (child 7 yrs and over) 1,479 21.2 6.0 20.7 15.7 13.1 13.6 8.1 1.6 2.9 2.7 0.2
Worker (child 2-6 yrs) 180 15 .0 4.4 19.0 16.4 16.0 18.0 8.2 3.1 3.3 3.2 0.1
Worker (child 1 yr and under) 106 18.7 8.4 14 .3 14.4 13.8 18.4 11.1 1.0 3.3 3.0 0.3
Worker (married, no children) 880 21.5 5.2 22.2 16.9 14.4 12.1 7.0 0.8 2.6 2.8 ▲ 0.2
Worker (unmarried) 1,360 23.6 8.7 25.5 14.7 12.0 10.5 4.4 0.7 2.3 2.3 0.0
Unmarried male 728 19.4 7.7 22.8 14.9 15.8 12.3 6.5 0.5 2.8 2.8 0.0
Unmarried female 20s/30s 558 25.0 9.6 28.7 16.4 9.4 7 .4 2.8 0.6 1.9 1.8 0.1
Unmarried female 40s and over 237 30.4 10.9 25.0 10 .0 7 .1 12.3 3.3 1.0 2.0 1.8 0.2
Student 169 19.0 11.2 23.2 14.5 14.4 10.4 7.3 ― 2.8 1.8 1.0
Light 678 17.8 6.9 20.5 17.3 15.3 13.3 6.7 2.1 2.7 2.6 0.1
Middle 967 19.9 7.7 22.9 16.7 13.3 11.9 6.6 1.1 2.6 2.5 0.1
Heavy 2,530 23.3 6.6 22.8 14.7 12.6 12.4 6.8 0.9 2.7 2.7 0.0
50.0 …Figures 5 or more points or higher than the 2018 survey total are shaded.
50 .0 …Figures 5 or more points or lower than the 2018 survey total are shaded.
† The average was tabulated without "No ans."
Number of
trips taken
Average (in 10s of 1000s of yen)
Sex & age
Area of
residence
Life
stage
0
5
10
15
20
25
30
2018 survey total
2017 survey total
(%)
■Amount of money used for sightseeing and activities at destination (Those involved in considering travel plans/Single answer)

Part 1 Trends in Overseas Travel Booking in 2017 Chapter 1 Outline of Overseas Travel in 2017
AB-ROAD Overseas Travel Survey 201839
11. Use of Airlines
2018 Survey
(n=4,175) (%) Ranking (n=2,563) Ranking (n=1,035) Ranking (n=577) Ranking (n=4,069)
1 ANA n=768 18.4 1 20.9 1 15.1 2 13.0 1 17.2 ↑
2 JAL n=722 17.3 2 18.5 2 12.7 1 20.1 2 16.8 ―
3 Delta Air Lines n=138 3.3 3 3.1 5 3.1 4 4.4 3 4.7 ↓
4 Cathay Pacific Airways n=136 3.3 7 2.7 4 3.6 3 4.9 8 2.5 ―
5 United Airlines n=133 3.2 4 3.1 8 2.7 4 4.5 6 3.1 ―
6 China Airlines n=122 2.9 5 2.9 8 2.7 8 3.5 5 3.2 ―
7 Hawaiian Airlines n=96 2.3 6 2.8 13 2.3 45 0.2 15 1.6 ―
8 Thai Airways n=91 2.2 12 1.6 7 2.8 7 3.6 11 1.8 ―
9 Asiana Airlines n=89 2.1 11 1.7 5 3.1 12 2.3 10 1.9 ―
10 Singapore Airlines n=88 2.1 12 1.7 19 2.1 6 4.1 7 2.6 ―
11 Peach Aviation n=83 2.0 23 1.0 3 5.1 20 1.0 16 1.5 ―
12 Vietnam Airlines n=80 1.9 15 1.5 10 2.6 10 2.5 12 1.7 ―
13 Lufthansa n=78 1.9 10 1.8 13 2.3 16 1.6 9 2.0 ―
14 Emirates n=77 1.8 14 1.5 11 2.5 14 1.9 13 1.6 ―
15 Korean Air n=73 1.7 18 1.3 11 2.6 10 2.4 4 3.6 ↓
16 AirAsia X n=66 1.6 17 1.4 13 2.3 23 1.0 23 1.0 ―
17 Alitalia n=62 1.5 9 1.9 32 0.6 18 1.2 22 1.1 ―
18 Finnair n=58 1.4 24 0.8 16 2.2 9 2.5 18 1.4 ―
19 Vanilla Air n=57 1.4 8 2.1 42 0.4 57 ― 17 1.4 ―
19 Eva Air n=57 1.4 16 1.5 21 1.6 31 0.4 14 1.6 ―
21 Air Canada n=54 1.3 24 0.8 16 2.2 15 1.7 20 1.2 ―
22 Jetstar n=51 1.2 24 0.8 16 2.3 18 1.3 19 1.3 ―
23 Air China n=45 1.1 22 1.2 23 1.0 23 0.8 29 0.8 ―
24 Air France n=43 1.0 21 1.2 25 0.8 28 0.6 23 1.0 ―
25 American Airlines n=38 0.9 19 1.3 45 0.3 31 0.4 20 1.2 ―
26 Qatar Airways n=36 0.9 19 1.3 45 0.3 45 0.2 26 0.9 ―
26 KLM Royal Dutch Airlines n=36 0.9 31 0.7 20 1.7 45 0.2 23 1.0 ―
28 Jeju Air n=33 0.8 40 0.4 23 1.0 13 2.0 34 0.6 ―
29 China Eastern Airlines n=32 0.8 33 0.6 25 0.7 17 1.4 27 0.9 ―
30 Tigerair Taiwan n=31 0.7 28 0.8 25 0.7 28 0.6 36 0.5 ―
31 Philippines Airlines n=28 0.7 31 0.7 37 0.5 23 0.9 30 0.7 ―
31 Garuda n=28 0.7 35 0.5 29 0.7 20 1.1 28 0.8 ―
33 Qantas n=27 0.6 30 0.7 32 0.6 31 0.4 34 0.6 ―
34 British Airways n=25 0.6 28 0.8 42 0.4 45 0.1 32 0.7 ―
35 Turkish Airlines n=23 0.6 24 0.8 48 0.2 45 0.1 33 0.6 ―
36 Etihad Airways n=22 0.5 34 0.6 51 0.1 20 1.1 50 0.3 ―
36 Jetstar Asia Airways n=22 0.5 55 0.1 21 1.5 31 0.4 30 0.7 ―
38 Malaysia Airlines n=20 0.5 37 0.5 37 0.5 31 0.4 45 0.3 ―
38 Hong Kong Airlines n=20 0.5 37 0.5 29 0.7 57 ― 42 0.3 ―
40 Scoot n=19 0.5 37 0.5 37 0.5 45 0.2 42 0.3 ―
41 Hong Kong Express Airways n=18 0.4 40 0.4 37 0.4 28 0.5 41 0.4 ―
41 China Southern Airlines n=18 0.4 46 0.3 32 0.6 26 0.7 59 0.2 ―
43 Air New Zealand n=17 0.4 50 0.3 32 0.6 26 0.7 36 0.6 ―
44 Air Busan n=16 0.4 46 0.3 25 0.8 57 ― 47 0.3 ―
45 Scandinavian Airlines n=15 0.4 35 0.6 59 ― 45 0.1 38 0.4 ―
46 Jin Air n=14 0.3 46 0.3 32 0.5 45 0.2 50 0.3 ―
46 Aero Mexico n=14 0.3 42 0.4 48 0.2 31 0.4 57 0.2 ―
48 Spring Airlines n=12 0.3 53 0.2 37 0.5 31 0.3 62 0.1 ―
49 Aeroflot n=11 0.3 44 0.4 59 ― 31 0.4 39 0.4 ―
49 LOT Polish Airlines n=11 0.3 44 0.4 59 ― 31 0.3 40 0.4 ―
49 T'Way Airlines n=11 0.3 53 0.2 29 0.6 57 ― 47 0.3 ―
49 SriLankan Airlines n=11 0.3 42 0.4 51 0.1 57 ― 45 0.3 ―
53 Spring Japan n=10 0.2 50 0.3 51 0.1 31 0.3 53 0.3 ―
53 Swiss International Airlines n=10 0.2 46 0.3 59 ― 31 0.3 57 0.2 ―
55 Cebu Pacific Air n=9 0.2 52 0.2 48 0.2 45 0.2 62 0.1 ―
55 Air Macau n=9 0.2 57 0.1 42 0.4 31 0.3 53 0.3 ―
57 Cathay Dragonair (formerly Hong Kong Dragonair) n=6 0.1 57 0.1 51 0.1 31 0.3 53 0.3 ―
58 Thai AirAsia X n=5 0.1 61 0.1 45 0.3 57 ― 59 0.2 ―
59 Air Caledonia International n=4 0.1 65 ― 51 0.1 31 0.4 53 0.2 ―
59 Hainan Airlines n=4 0.1 55 0.1 59 ― 57 ― 64 0.1 ―
61 S7 Airlines (Siberia Airlines) n=3 0.1 57 0.1 59 ― 57 ― 79 ― ―
61 Eastar Jet n=3 0.1 57 0.1 59 ― 57 ― 50 0.3 ―
63 Sichuan Air n=2 0.1 61 0.1 51 0.1 57 ― 73 ― ―
63 Bangkok Airways n=2 0.1 61 0.1 59 ― 57 ― 71 0.1 ―
63 Juneyao Airlines n=2 0.1 65 ― 51 0.1 57 ― 73 ― ―
63 Air Tahiti Nui n=2 0.1 61 0.1 59 ― 57 ― 64 0.1 ―
63 Air Niugini n=2 0.1 65 ― 51 0.1 57 ― 68 0.1 ―
63 Shanghai Airlines n=2 ― 65 ― 59 ― 45 0.1 73 ― ―
69 Air Indian n=1 ― 65 ― 59 ― 57 ― 59 0.2 ―
69 Ethiopian Airlines n=1 ― 65 ― 59 ― 57 ― 68 0.1 ―
69 Aurora (previously SAT Airlines and Vladivostok Avia) n=1 ― 75 ― 59 ― 45 0.2 71 0.1 ―
69 South African Airways n=1 ― 65 ― 59 ― 57 ― 68 0.1 ―
69 Asia Atlantic Airlines n=1 ― 65 ― 59 ― 57 ― 73 ― ―
69 Miat Mongolian Airlines n=1 ― 65 ― 59 ― 57 ― 73 ― ―
69 Egyptair n=1 ― 65 ― 59 ― 57 ― 64 0.1 ―
69 Uzbekistan Airways n=1 ― 75 ― 59 ― 45 0.1 79 ― ―
77 Shandong Airlines n=0 ― 75 ― 59 ― 57 ― 73 ― ―
77 Jet Airways n=0 ― 75 ― 59 ― 57 ― 79 ― ―
77 Shenzhen Airlines n=0 ― 75 ― 59 ― 57 ― 79 ― ―
77 Pakistan International Airlines n=0 ― 75 ― 59 ― 57 ― 79 ― ―
Other n=38 0.9 1.1 0.5 0.7 0.9 ―
Sea (traveled by ship) n=24 0.6 0.5 0.8 0.4 0.7 ―
Don't know or don't remember n=153 3.7 3.5 3.9 4.0 3.8 ―
† Rate of increase: The arrow indicates increases/decreases for airlines for which there were changes of plus or minus one point between the 2017 survey and 2018 survey.
Rate of
increase
2017 Survey
TotalTotal Kanto Kansai Tokai0 5 10 15 20
2018 Survey (%)
■Airline used this time [ranking table] (Those involved in considering travel plans/Single answer)

40
41
Chapter 2
Actions Taken for Prior Consideration of Travel
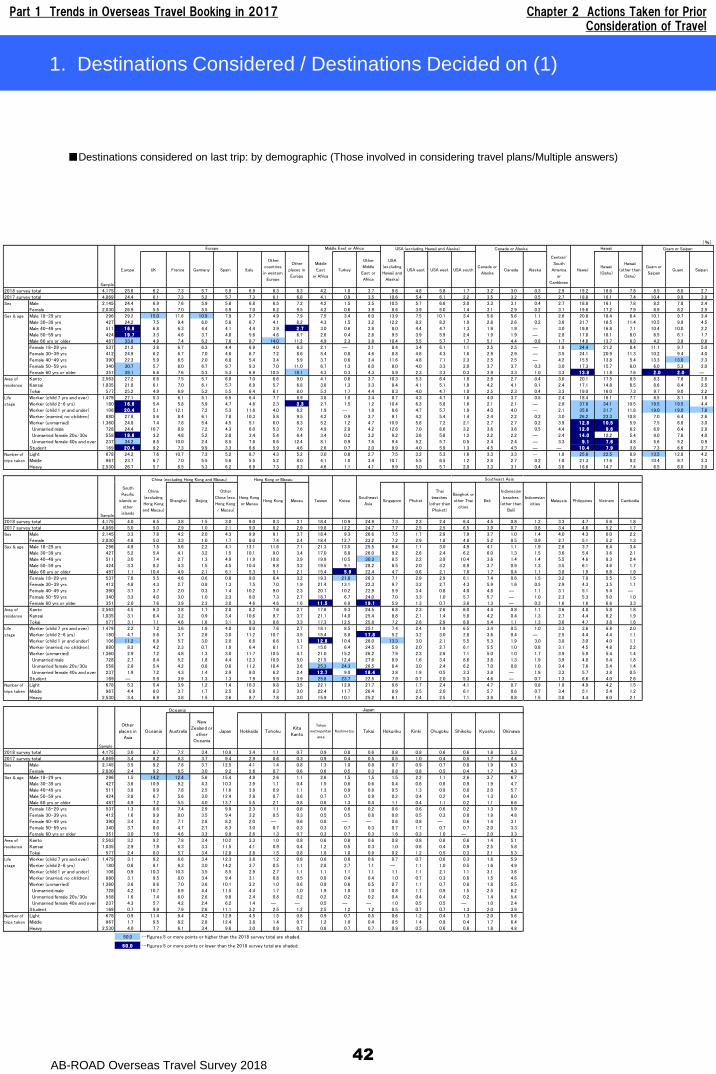
Part 1 Trends in Overseas Travel Booking in 2017 Chapter 2 Actions Taken for Prior Consideration of Travel
AB-ROAD Overseas Travel Survey 201842
1. Destinations Considered / Destinations Decided on (1)
(%)
Sample
Europe UK France Germany Spain Italy
Other
countries
in western
Europe
Other
places in
Europe
Middle
East
or Africa
Turkey
Other
Middle
East or
Africa
USA
(excluding
Hawaii and
Alaska)
USA east USA west USA southCanada or
AlaskaCanada Alaska
Central/
South
America
or
Caribbean
HawaiiHawaii
(Oahu)
Hawaii
(other than
Oahu)
Guam or
SaipanGuam Saipan
2018 survey total 4,175 25.6 6.2 7.3 5.7 5.9 6.9 6.3 8.3 4.2 1.0 3.7 9.6 4.8 5.8 1.7 3.2 3.0 0.3 2.9 19.2 16.6 7.8 8.5 8.0 2.7
2017 survey total 4,069 24.4 6.1 7.3 5.2 5.7 7.3 6.1 6.8 4.1 0.9 3.5 10.6 5.4 6.1 2.2 3.5 3.2 0.5 2.7 18.8 16.1 7.4 10.4 9.9 3.9
Male 2,145 24.4 6.9 7.6 5.9 5.8 6.8 6.5 7.2 4.2 1.5 3.5 10.5 5.7 6.6 2.0 3.3 3.1 0.4 2.7 18.8 16.1 7.8 8.2 7.8 2.4
Female 2,030 26.9 5.5 7.0 5.5 5.9 7.0 6.2 9.5 4.2 0.6 3.9 8.6 3.9 5.0 1.4 3.1 2.9 0.2 3.1 19.6 17.2 7.9 8.9 8.2 2.9
Male 18-29 yrs 296 29.2 15.0 11.6 10.9 7.9 9.7 4.9 7.9 7.5 3.4 6.0 13.9 7.5 10.1 3.4 5.6 5.6 1.1 2.6 20.6 18.4 6.4 10.1 9.7 3.4
Male 30-39 yrs 427 24.2 7.5 9.4 6.0 5.6 6.7 4.1 8.2 4.3 1.5 3.2 12.2 8.2 8.2 1.9 2.8 2.6 0.2 3.6 21.7 16.5 11.4 10.5 9.9 4.5
Male 40-49 yrs 511 16 .8 6.8 6.3 4.4 4.1 4.4 3.9 2 .7 3.0 0.6 2.8 8.0 4.4 4.7 1.3 1.9 1.9 ― 3.0 19.8 16.8 7.1 10.4 10.0 2.2
Male 50-59 yrs 424 19 .7 3.3 4.6 3.7 4.8 5.6 4.6 6.7 2.6 0.4 2.6 9.5 3.9 5.9 2.4 1.9 1.9 ― 2.8 17.8 16.1 8.0 6.5 6.1 1.7
Male 60 yrs or older 487 33.8 4.9 7.4 6.3 7.6 8.7 14.0 11.2 4.9 2.3 3.8 10.4 5.5 5.7 1.7 5.1 4.4 0.8 1.7 14.8 13.7 6.3 4.2 3.8 0.8
Female 18-29 yrs 537 21.2 3.8 6.7 6.3 4.4 6.9 4.0 6.3 2.1 ― 2.1 8.4 3.4 6.1 1.1 2.5 2.5 ― 1.9 24.4 21.2 8.4 11.1 9.7 5.0
Female 30-39 yrs 412 24.9 6.2 6.7 7.0 4.6 6.7 7.2 8.6 5.4 0.8 4.6 8.8 4.8 4.3 1.6 2.9 2.9 ― 3.5 24.1 20.9 11.3 10.2 9.4 4.0
Female 40-49 yrs 390 22.3 5.9 6.5 2.0 6.8 5.4 3.4 5.9 3.7 0.6 3.4 11.6 4.8 7.1 2.3 2.5 2.5 ― 4.2 15.5 13.8 5.4 13.3 13.0 2.3
Female 50-59 yrs 340 30.7 5.7 8.0 6.7 9.7 9.3 7.0 11.0 6.7 1.3 6.0 8.0 4.0 3.3 2.0 3.7 3.7 0.3 3.0 17.3 15.7 6.0 6.0 5.3 2.0
Female 60 yrs or older 351 39.1 6.6 7.6 5.3 5.3 6.9 10.5 18.1 4.3 0.3 4.3 5.9 2.3 3.3 0.3 3.9 3.3 1.0 3.3 13 .8 11.8 7.6 2 .0 2 .0 ―
Kanto 2,563 27.2 6.6 7.5 5.7 6.0 7.0 6.6 9.0 4.1 0.8 3.7 10.3 5.3 6.4 1.8 2.9 2.7 0.4 3.0 20.1 17.5 8.5 8.3 7.6 2.8
Kansai 1,035 21.8 6.1 7.0 6.1 5.7 6.9 5.7 6.8 3.8 1.3 3.3 8.4 4.1 5.1 1.9 4.2 4.1 0.1 2.4 17.1 14.8 6.5 8.6 8.4 2.5
Tokai 577 25.2 4.9 6.9 5.2 5.5 6.4 6.1 8.0 5.3 1.7 4.4 8.3 4.0 4.7 1.0 2.5 2.3 0.4 3.3 19.0 16.0 7.3 9.7 9.0 2.2
Worker (child 7 yrs and over) 1,479 27.1 5.3 6.1 5.1 6.5 6.4 7.7 8.9 3.8 1.0 3.4 8.7 4.3 4.7 1.6 4.0 3.7 0.5 2.4 18.4 16.1 7.7 8.5 8.1 1.8
Worker (child 2-6 yrs) 180 16 .6 5.4 5.8 5.9 4.7 4.6 2.3 3 .3 2.7 1.5 1.2 10.4 6.3 5.8 1.6 2.1 2.1 ― 2.8 37.9 34.1 10.5 19.5 19.5 4.4
Worker (child 1 yr and under) 106 20 .4 5.1 12.1 7.2 5.3 11.6 4.0 6.2 1.9 ― 1.9 6.6 4.7 5.7 1.9 4.0 4.0 ― 2.1 35.6 31.7 11.8 19.0 19.0 7.8
Worker (married, no children) 880 27.8 5.6 8.4 6.1 7.8 10.3 5.8 9.5 4.2 0.9 3.7 9.1 4.2 5.4 1.4 2.4 2.2 0.2 3.0 26.2 23.3 10.8 7.0 6.4 2.6
Worker (unmarried) 1,360 24.8 7.4 7.8 5.4 4.5 5.1 6.0 8.3 5.2 1.2 4.7 10.9 5.6 7.2 2.1 2.7 2.7 0.2 3.9 12 .8 10 .5 5.9 7.5 6.6 3.0
Unmarried male 728 24.4 10.7 8.9 7.2 4.3 6.0 5.3 7.6 4.9 2.0 4.2 12.6 7.0 8.6 3.2 3.6 3.6 0.5 4.4 12 .6 9 .6 6.2 6.9 6.4 2.9
Unmarried female 20s/30s 558 19 .6 3.2 4.8 5.2 2.8 3.4 5.4 6.4 3.4 0.2 3.2 9.2 3.6 5.8 1.2 2.2 2.2 ― 2.4 14 .0 12.2 5.4 9.0 7.6 4.0
Unmarried female 40s and over 237 34.2 8.5 10.0 2.4 8.5 7.6 8.6 12.4 8.1 0.9 7.6 9.4 5.2 5.7 0.5 2.4 2.4 ― 3.3 9 .1 7 .6 4.8 5.6 5.2 0.9
Student 169 20 .4 9.2 7.3 9.9 3.3 6.6 5.9 4.6 2.6 0.7 2.0 9.9 4.0 5.9 1.3 4.5 4.5 ― ― 10 .4 7 .9 3.8 7.3 6.6 2.7
Light 678 24.2 7.6 10.7 7.3 5.2 8.7 4.3 5.2 3.0 0.8 2.7 7.5 3.2 5.3 1.6 3.3 3.3 ― 1.8 25.6 22.5 8.9 13.5 12.8 4.2
Middle 967 23.7 6.7 7.0 5.5 5.6 5.5 5.2 8.0 4.1 1.0 3.4 10.1 5.5 6.5 1.2 2.8 2.7 0.2 1.8 21.3 17.6 8.2 10.4 9.7 3.3
Heavy 2,530 26.7 5.7 6.5 5.3 6.2 6.9 7.3 9.3 4.6 1.1 4.1 9.9 5.0 5.7 2.0 3.3 3.1 0.4 3.6 16.6 14.7 7.4 6.5 6.0 2.0
Sample
South
Pacific
islands or
other
islands
China
(excluding
Hong Kong
and Macau)
Shanghai Beijing
Other
China (exc.
Hong Kong
/ Macau)
Hong Kong
or MacauHong Kong Macau Taiwan Korea
Southeast
AsiaSingapore Phuket
Thai
beaches
(other than
Phuket)
Bangkok or
other Thai
cities
Bali
Indonesian
beaches
(other than
Bali)
Indonesian
citiesMalaysia Philippines Vietnam Cambodia
2018 survey total 4,175 4.0 6.5 3.8 1.5 3.0 9.0 8.3 3.1 18.4 10.9 24.9 7.3 2.3 2.4 6.4 4.5 0.8 1.2 3.3 4.7 5.6 1.8
2017 survey total 4,069 5.0 5.0 2.9 1.0 2.1 9.0 8.2 2.9 19.8 12.2 24.7 7.7 2.5 2.5 6.5 3.9 0.7 0.8 3.4 4.6 5.2 1.7
Male 2,145 3.3 7.8 4.2 2.0 4.3 9.9 9.1 3.7 18.4 9.3 26.6 7.5 1.7 2.9 7.9 3.7 1.0 1.4 4.0 4.3 6.0 2.2
Female 2,030 4.6 5.0 3.3 1.0 1.7 8.0 7.4 2.4 18.4 12.7 23.2 7.2 2.9 1.8 4.8 5.2 0.5 0.9 2.7 5.1 5.2 1.3
Male 18-29 yrs 296 4.9 7.5 5.6 2.2 4.1 13.1 11.6 7.1 21.3 13.5 25.5 9.4 1.1 3.0 4.9 4.1 1.1 1.9 2.6 3.7 6.4 3.4
Male 30-39 yrs 427 5.2 5.4 4.1 3.2 1.5 10.1 9.0 3.4 17.0 8.8 26.0 9.2 2.6 2.4 6.2 6.0 1.3 1.5 3.6 5.4 3.6 2.1
Male 40-49 yrs 511 3.0 7.4 2.7 1.3 4.9 11.9 10.8 3.9 19.9 10.5 30.3 8.5 2.2 3.9 10.4 3.6 1.4 1.4 5.5 4.6 8.3 2.4
Male 50-59 yrs 424 3.3 8.2 4.3 1.5 4.5 10.4 9.8 3.2 19.5 9.1 28.2 6.5 2.0 3.2 8.9 3.7 0.9 1.3 3.5 6.1 4.6 1.7
Male 60 yrs or older 487 1.1 10.4 4.9 2.1 6.1 5.3 5.1 2.1 15.4 5 .9 22.4 4.7 0.6 2.1 7.6 1.7 0.4 1.1 3.8 1.9 6.8 1.9
Female 18-29 yrs 537 7.8 5.5 4.6 0.6 0.8 9.0 8.4 3.2 19.3 21.8 26.3 7.1 2.9 2.9 6.1 7.4 0.6 1.5 3.2 7.8 5.5 1.5
Female 30-39 yrs 412 4.8 4.3 2.7 0.8 1.3 7.5 7.0 1.9 21.4 13.1 22.3 9.7 3.2 2.7 4.3 5.9 1.6 0.5 2.9 4.3 3.5 1.1
Female 40-49 yrs 390 3.7 3.7 2.0 0.3 1.4 10.2 9.0 2.3 20.1 10.2 22.9 5.9 3.4 0.8 4.0 4.8 ― 1.1 3.1 5.1 5.4 ―
Female 50-59 yrs 340 3.3 4.0 3.0 1.0 2.3 8.0 7.3 2.7 18.7 6.7 24.0 7.0 3.3 1.0 5.7 5.7 ― 1.0 2.3 5.3 5.0 1.0
Female 60 yrs or older 351 2.0 7.6 3.9 2.3 3.0 4.6 4.6 1.6 11 .5 6.9 19 .1 5.9 1.3 0.7 3.6 1.3 ― 0.3 1.6 1.6 6.6 3.3
Kanto 2,563 4.5 6.3 3.8 1.7 2.8 8.2 7.6 2.7 17.6 9.3 24.5 6.8 2.3 2.6 6.0 4.4 0.8 1.1 3.6 4.8 5.8 1.8
Kansai 1,035 3.1 6.4 3.2 0.9 3.4 10.6 9.7 3.7 21.1 14.0 25.4 8.8 2.1 1.4 5.8 4.2 0.4 1.3 2.7 4.4 6.2 1.9
Tokai 577 3.1 7.1 4.6 1.6 3.1 9.3 8.6 3.3 17.3 12.5 25.8 7.2 2.6 2.9 8.9 5.4 1.1 1.3 3.6 4.7 3.8 1.6
Worker (child 7 yrs and over) 1,479 2.2 7.2 3.6 1.9 4.0 8.0 7.6 2.7 18.1 8.5 25.1 7.4 2.4 1.9 6.5 3.4 0.5 1.0 3.3 3.6 6.8 2.0
Worker (child 2-6 yrs) 180 4.7 5.6 3.7 2.6 3.0 11.2 10.7 3.5 15.4 8.8 17 .8 5.2 3.2 3.0 2.8 3.6 0.4 ― 2.5 4.4 4.4 1.1
Worker (child 1 yr and under) 106 11.2 6.8 5.7 3.0 2.0 6.6 6.6 3.1 12 .6 10.4 26.0 13.3 3.0 2.1 5.5 5.3 1.9 3.0 3.8 3.0 4.0 1.1
Worker (married, no children) 880 8.3 4.2 2.3 0.7 1.9 6.4 6.1 1.7 15.0 6.4 24.5 5.9 2.0 2.7 6.1 5.5 1.0 0.8 3.1 4.5 4.8 2.2
Worker (unmarried) 1,360 2.9 7.2 4.8 1.3 3.0 11.7 10.5 4.1 21.0 15.2 26.2 7.9 2.3 2.6 7.1 5.0 1.0 1.7 3.9 5.9 5.4 1.4
Unmarried male 728 2.7 8.4 5.2 1.8 4.4 12.3 10.9 5.0 21.5 12.4 27.6 8.9 1.6 3.4 8.6 3.8 1.3 1.9 3.9 4.8 5.4 1.8
Unmarried female 20s/30s 558 2.8 5.4 4.2 0.6 0.8 11.2 10.4 3.6 25.3 24.3 26.5 8.4 3.0 2.4 6.2 7.0 0.8 1.0 3.4 7.6 5.4 1.4
Unmarried female 40s and over 237 1.9 7.2 4.3 1.4 2.9 8.0 6.2 2.4 12 .7 9.0 18 .4 3.8 1.9 0.5 3.3 3.8 ― 1.9 3.3 5.7 3.8 0.5
Student 169 ― 5.9 3.9 1.3 1.3 7.9 5.9 3.9 25.8 23.7 22.5 7.9 0.7 2.0 5.3 4.6 ― 0.7 1.3 6.6 4.0 2.6
Light 678 5.3 5.4 3.9 1.2 1.4 10.3 9.8 3.5 22.1 12.9 21.7 9.6 1.7 2.4 4.1 4.7 0.7 0.8 1.8 4.9 4.2 1.5
Middle 967 4.4 6.0 3.7 1.7 2.5 8.9 8.3 3.0 22.4 11.7 26.4 8.9 2.5 2.0 6.1 5.7 0.6 0.7 3.4 5.1 5.4 1.2
Heavy 2,530 3.4 6.9 3.8 1.5 3.6 8.7 7.8 3.0 15.9 10.1 25.2 6.1 2.4 2.5 7.1 3.9 0.8 1.5 3.8 4.4 6.0 2.1
Sample
Other
places in
Asia
Oceania Australia
New
Zealand or
other
Oceania
Japan Hokkaido TohokuKita
Kanto
Tokyo
metropolitan
area
Koshinetsu Tokai Hokuriku Kinki Chugoku Shikoku Kyushu Okinawa
2018 survey total 4,175 3.0 8.7 7.2 3.4 10.9 3.4 1.1 0.7 0.9 0.8 0.6 0.8 0.8 0.6 0.6 1.8 5.3
2017 survey total 4,069 3.4 8.2 6.3 3.7 9.4 2.9 0.6 0.3 0.9 0.4 0.5 0.5 1.0 0.4 0.5 1.7 4.4
Male 2,145 3.5 9.2 7.8 3.7 12.5 4.1 1.4 0.8 1.3 1.0 0.8 0.7 0.9 0.7 0.8 1.9 6.3
Female 2,030 2.4 8.2 6.5 3.0 9.2 2.6 0.7 0.6 0.6 0.5 0.3 0.8 0.8 0.5 0.4 1.7 4.3
Male 18-29 yrs 296 1.5 14.2 12.4 5.6 15.4 4.9 2.6 1.1 2.6 1.5 1.5 1.5 2.2 1.1 2.6 3.7 6.7
Male 30-39 yrs 427 3.6 10.9 9.2 4.3 10.3 3.9 1.1 0.4 1.5 0.6 0.6 0.4 0.6 0.6 0.9 1.9 4.7
Male 40-49 yrs 511 3.8 8.9 7.8 2.5 11.6 3.8 0.9 1.1 1.3 0.9 0.9 0.5 1.3 0.8 0.8 2.0 5.7
Male 50-59 yrs 424 2.8 6.7 5.6 3.0 12.4 2.8 0.7 0.6 0.7 0.7 0.9 0.2 0.4 0.2 0.4 1.3 8.0
Male 60 yrs or older 487 4.9 7.2 5.5 4.0 13.7 5.5 2.1 0.8 0.6 1.3 0.4 1.1 0.4 1.1 0.2 1.1 6.6
Female 18-29 yrs 537 1.3 8.6 7.4 2.9 9.9 2.3 1.1 0.8 0.6 0.6 0.2 0.6 0.6 0.6 0.2 1.3 5.9
Female 30-39 yrs 412 1.6 9.9 8.0 3.5 9.4 3.2 0.5 0.3 0.5 0.5 0.8 0.8 0.5 0.3 0.8 1.9 4.8
Female 40-49 yrs 390 3.4 8.2 7.1 2.8 8.2 2.0 ― 0.6 0.8 ― ― 0.6 0.8 ― 0.6 1.4 3.1
Female 50-59 yrs 340 3.7 6.0 4.7 2.7 8.3 3.0 0.7 0.3 0.3 0.7 0.3 0.7 1.7 0.7 0.7 2.0 3.3
Female 60 yrs or older 351 3.0 7.6 4.6 3.3 9.9 2.6 1.3 0.7 0.3 0.7 0.3 1.6 0.3 1.0 ― 2.0 3.3
Kanto 2,563 3.2 9.2 7.8 3.4 10.2 3.3 1.0 0.8 0.6 0.8 0.6 0.8 0.8 0.8 0.6 1.4 5.1
Kansai 1,035 2.9 7.9 6.3 3.3 11.5 4.1 0.9 0.4 1.2 0.5 0.3 1.0 0.8 0.4 0.9 2.5 5.8
Tokai 577 2.4 8.0 5.7 3.4 12.8 2.8 1.5 0.8 1.8 1.0 0.9 0.2 1.2 0.5 0.3 2.1 5.3
Worker (child 7 yrs and over) 1,479 3.1 8.2 6.6 3.4 12.3 3.8 1.2 0.8 0.6 0.8 0.6 0.7 0.7 0.6 0.3 1.8 5.9
Worker (child 2-6 yrs) 180 0.6 8.1 6.3 3.0 14.2 3.7 0.5 1.1 2.8 2.7 1.1 ― 1.1 1.0 0.5 1.6 4.9
Worker (child 1 yr and under) 106 0.9 10.3 10.3 3.5 8.5 2.9 2.7 1.1 1.1 1.1 1.1 1.1 1.1 2.1 1.1 3.1 3.6
Worker (married, no children) 880 3.1 9.5 8.0 3.4 9.4 3.1 0.8 0.5 0.8 0.4 0.4 1.0 0.7 0.3 0.8 1.5 4.6
Worker (unmarried) 1,360 3.6 8.6 7.0 3.6 10.1 3.2 1.0 0.6 0.9 0.6 0.5 0.7 1.1 0.7 0.8 1.8 5.5
Unmarried male 728 4.2 10.7 8.9 4.4 11.5 4.4 1.7 1.0 1.9 1.0 1.0 0.8 1.7 0.9 1.5 2.5 6.2
Unmarried female 20s/30s 558 1.6 7.4 6.0 2.6 9.8 2.4 0.8 0.2 0.2 0.2 0.2 0.4 0.4 0.4 0.2 1.4 5.4
Unmarried female 40s and over 237 4.3 5.7 4.2 2.4 6.2 1.4 ― ― 0.5 ― ― 1.0 0.5 0.5 ― 1.0 2.4
Student 169 0.7 9.9 7.9 2.6 11.1 3.2 2.5 1.2 2.5 1.2 1.2 0.5 0.7 0.7 1.3 2.0 3.9
Light 678 0.9 11.4 9.4 4.2 12.9 4.5 1.5 0.8 0.9 0.7 0.5 0.6 1.2 0.4 1.3 2.0 5.6
Middle 967 1.7 9.5 8.2 2.8 12.4 3.8 1.4 0.7 1.2 1.0 0.4 0.5 1.4 0.9 0.4 1.7 6.4
Heavy 2,530 4.0 7.7 6.1 3.4 9.8 3.0 0.9 0.7 0.8 0.7 0.7 0.9 0.5 0.6 0.6 1.8 4.8
50.0 …Figures 5 or more points or higher than the 2018 survey total are shaded.
50 .0 …Figures 5 or more points or lower than the 2018 survey total are shaded.
Guam or SaipanEurope Middle East or Africa USA (excluding Hawaii and Alaska) Canada or Alaska Hawaii
Oceania Japan
Sex
Sex & age
Area of
residence
Life
stage
China (excluding Hong Kong and Macau) Hong Kong or Macau
Number of
trips taken
Number of
trips taken
Southeast Asia
Sex
Sex & age
Area of
residence
Life
stage
Number of
trips taken
Sex
Sex & age
Area of
residence
Life
stage
■Destinations considered on last trip: by demographic (Those involved in considering travel plans/Multiple answers)
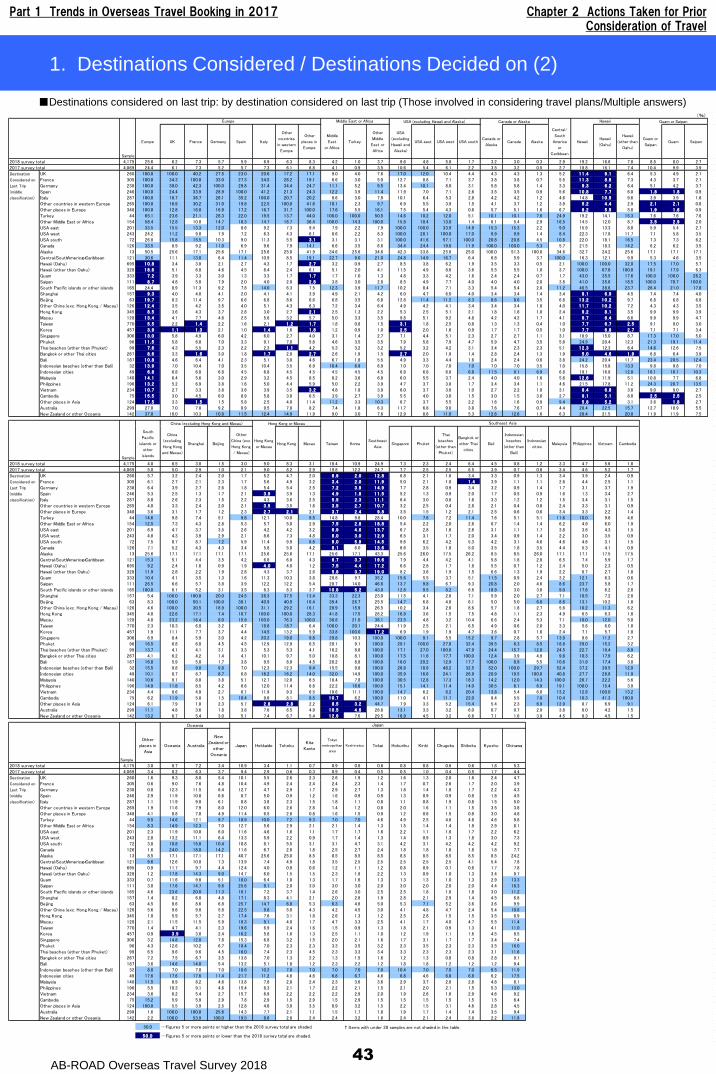
Part 1 Trends in Overseas Travel Booking in 2017 Chapter 2 Actions Taken for Prior Consideration of Travel
AB-ROAD Overseas Travel Survey 2018
(%)
Sample
Europe UK France Germany Spain Italy
Other
countries
in western
Europe
Other
places in
Europe
Middle
East
or Africa
Turkey
Other
Middle
East or
Africa
USA
(excluding
Hawaii and
Alaska)
USA east USA west USA southCanada or
AlaskaCanada Alaska
Central/
South
America
or
Caribbean
HawaiiHawaii
(Oahu)
Hawaii
(other than
Oahu)
Guam or
SaipanGuam Saipan
2018 survey total 4,175 25.6 6.2 7.3 5.7 5.9 6.9 6.3 8.3 4.2 1.0 3.7 9.6 4.8 5.8 1.7 3.2 3.0 0.3 2.9 19.2 16.6 7.8 8.5 8.0 2.7
2017 survey total 4,069 24.4 6.1 7.3 5.2 5.7 7.3 6.1 6.8 4.1 0.9 3.5 10.6 5.4 6.1 2.2 3.5 3.2 0.5 2.7 18.8 16.1 7.4 10.4 9.9 3.9
UK 260 100.0 100.0 40.2 27.5 23.0 20.6 17.2 17.1 9.0 4.0 7.6 17.0 12.0 10.4 4.4 4.3 4.3 1.3 5.2 11 .4 9 .1 6.4 5.3 4.9 2.1
France 305 100.0 34.3 100.0 33.0 27.3 34.5 26.2 19.1 6.6 3.0 5.0 12.7 8.8 7.1 3.7 3.8 3.8 0.7 5.5 11 .3 8 .6 7.3 4.3 3.7 2.1
Germany 238 100.0 30.0 42.3 100.0 29.8 31.4 34.4 24.7 11.1 5.2 9.5 13.4 10.1 8.0 3.1 5.8 5.8 1.4 3.3 9 .3 6 .2 6.4 5.1 4.2 3.7
Spain 246 100.0 24.4 33.9 28.9 100.0 41.2 21.3 24.3 12.2 3.9 11.4 11.9 7.0 7.1 2.6 3.5 3.5 0.9 5.6 10 .8 7 .7 6.0 1 .8 1 .8 0.9
Italy 287 100.0 18.7 36.7 26.1 35.2 100.0 20.7 20.2 8.6 3.0 7.9 10.1 6.4 5.3 2.8 4.2 4.2 1.2 4.6 14.8 10 .5 9.6 3.9 3.9 1.6
Other countries in western Europe 265 100.0 16.9 30.2 31.0 19.8 22.5 100.0 41.6 10.1 2.3 9.7 6.9 5.5 3.9 1.5 4.1 3.7 1.2 3.9 5 .2 4 .4 2.9 2 .1 2 .1 0.8
Other places in Europe 348 100.0 12.8 16.8 16.9 17.2 16.7 31.7 100.0 17.6 5.5 16.1 7.5 5.4 4.3 0.6 5.7 5.1 1.6 6.7 8 .2 5 .5 5.8 1 .9 1 .6 0.9
Turkey 44 65.1 23.6 21.1 28.3 22.0 19.5 13.7 44.0 100.0 100.0 50.5 14.6 10.2 12.0 5.1 10.1 10.1 7.6 24.9 19.2 14.1 15.3 7.6 7.6 7.6
Other Middle East or Africa 154 58.4 12.8 10.0 14.7 18.3 14.7 16.7 36.4 100.0 14.3 100.0 15.8 10.4 13.0 1.4 6.1 5.4 2.9 16.5 14.5 12.0 8.7 3 .5 2 .9 2.0
USA east 201 33.5 15.5 13.3 12.0 8.6 9.2 7.3 9.4 7.9 2.2 7.9 100.0 100.0 33.9 14.9 15.3 15.3 2.2 9.0 15.9 13.3 8.0 5.9 5.4 2.7
USA west 243 24.2 11.2 9.0 7.9 7.2 6.3 4.3 6.1 8.6 2.2 8.3 100.0 28.1 100.0 17.0 9.9 9.9 1.4 8.4 22.3 17.8 11.7 7.1 5.8 3.5
USA south 72 26.8 15.8 15.5 10.3 9.0 11.3 5.5 3 .1 3.1 3.1 3.1 100.0 41.6 57.1 100.0 20.8 20.8 4.5 10.8 22.0 18.1 16.5 7.3 7.3 6.2
Canada 126 33.5 8.9 9.2 11.0 6.9 9.6 7.9 14.1 6.6 3.5 6.6 34.4 24.4 19.0 11.9 100.0 100.0 5.3 5.7 21.5 18.3 14.2 6.2 6.2 3.5
Alaska 13 50.5 25.6 17.1 25.6 17.1 25.6 25.0 41.9 34.6 25.6 34.6 42.3 33.8 25.6 25.0 100.0 51.3 100.0 34.6 32.7 24.2 25.6 17.1 17.1 17.1
Central/SouthAmericaorCaribbean 121 30.6 11.1 13.8 6.4 11.4 10.9 8.5 19.1 22.7 9.0 21.0 24.8 14.9 16.7 6.4 6.8 5.9 3.7 100.0 16.3 12.1 9.9 5.3 4.6 3.5
Hawaii (Oahu) 695 10 .8 3.4 3.8 2.1 2.7 4.3 1.7 2 .7 3.2 0.9 2.7 8.5 3.8 6.2 1.9 3.5 3.3 0.5 2.1 100.0 100.0 32.0 17.5 17.0 5.7
Hawaii (other than Oahu) 328 18 .6 5.1 6.8 4.6 4.5 8.4 2.4 6.1 5.1 2.0 4.1 11.5 4.9 8.6 3.6 5.5 5.5 1.0 3.7 100.0 67.8 100.0 19.1 17.9 6.3
Guam 333 7 .2 3.9 3.3 3.0 1.3 3.3 1.7 1 .7 1.7 1.0 1.3 4.8 3.3 4.2 1.6 2.4 2.4 0.7 1.7 43.0 35.5 17.6 100.0 100.0 26.2
Saipan 111 8 .7 4.8 5.8 7.9 2.0 4.0 2.0 2 .8 3.8 3.0 2.8 8.5 4.9 7.7 4.0 4.0 4.0 2.0 3.8 41.0 35.6 18.5 100.0 78.7 100.0
South Pacific islands or other islands 165 24.4 8.9 11.3 9.2 7.8 14.0 6.3 7.5 12.3 3.9 11.7 10.2 8.4 7.1 3.3 5.4 5.4 2.0 11.2 46.5 38.6 23.7 26.4 21.0 17.8
Shanghai 157 9 .3 4.0 4.0 4.1 2.0 4.1 4.1 3.9 4.9 2.1 4.2 6.0 4.7 6.0 4.0 3.4 3.4 1.4 3.4 8 .1 6 .9 4.5 7.4 7.4 4.0
Beijing 63 19 .7 8.3 11.4 9.7 6.6 6.8 8.6 6.6 6.8 3.5 6.8 12.8 11.4 11.2 8.3 8.6 8.6 3.5 6.8 13 .2 10 .2 9.7 6.8 6.8 6.8
Other China (exc. Hong Kong / Macau) 126 12 .4 3.5 4.2 3.5 4.0 5.1 4.3 6.3 7.2 3.4 6.4 4.9 4.2 4.1 3.4 3.4 3.4 1.8 4.0 11 .7 10 .2 7.2 4.3 4.3 3.5
Hong Kong 345 8 .5 3.6 4.3 3.7 2.8 3.0 2.7 2 .1 2.5 1.3 2.2 5.3 2.5 5.1 2.1 1.8 1.8 1.0 2.4 9 .2 8 .1 3.5 9.9 9.9 3.9
Macau 128 13 .4 4.1 7.7 4.6 2.5 5.6 3.2 5.7 5.0 3.3 3.5 9.8 5.1 9.2 4.8 4.2 4.2 1.7 4.1 9 .7 6 .4 6.6 9.9 9.9 4.7
Taiwan 770 5 .5 2.2 1 .4 2.2 1.6 2.1 1 .2 1 .7 1.8 0.8 1.5 3 .1 1.8 2.5 0.8 1.3 1.3 0.4 1.0 7 .7 6 .7 2 .5 9.1 9.0 3.0
Korea 457 3 .9 1 .1 1 .3 2.1 1.0 1 .4 1.6 1 .8 1.2 0.9 1.0 2 .5 2.0 1.6 0.9 1.7 1.7 0.5 1.0 7 .7 6 .8 2 .7 7.1 7.1 3.4
Singapore 306 13 .0 5.8 4.9 6.0 4.2 6.0 2.7 4.0 3.1 1.4 2.7 7.1 4.4 5.1 2.3 2.7 2.7 1.1 3.1 18.9 15.0 8.7 17.3 17.0 5.0
Phuket 96 11 .5 5.8 6.8 7.0 3.3 9.1 7.0 5.6 4.6 3.5 3.5 7.9 5.8 7.9 4.7 5.9 4.7 3.5 5.6 24.9 20.4 12.3 21.3 19.1 11.4
Thai beaches (other than Phuket) 99 7 .6 4.3 5.5 2.3 2.2 2.3 1 .1 4.2 5.3 3.2 3.2 5.2 3.2 4.2 3.1 3.4 2.3 2.3 5.1 12 .3 12.3 6.4 14.6 12.6 7.5
Bangkok or other Thai cities 267 8 .6 3.3 1 .6 3.0 1.8 1 .7 2.8 2 .7 2.6 1.9 1.5 2 .7 2.0 1.9 1.4 2.8 2.4 1.3 1.9 5 .0 4 .6 1 .9 6.8 6.4 3.9
Bali 187 10 .8 4.6 6.4 4.1 2.3 5.1 3.0 4.6 6.7 1.8 5.5 4.9 3.3 4.4 1.6 2.4 2.4 0.6 3.8 24.2 20.4 11.7 23.4 20.5 12.4
Indonesian beaches (other than Bali) 32 13 .9 7.0 10.4 7.0 3.5 10.4 3.5 6.9 10.4 6.9 6.9 7.0 7.0 7.0 7.0 7.0 7.0 3.5 7.0 15.8 15.8 13.3 9.8 9.8 7.0
Indonesian cities 49 6 .8 6.8 6.8 6.8 4.5 6.8 4.5 4.5 4.5 4.5 4.5 6.8 6.8 6.8 6.8 11.5 9.1 6.9 6.8 19.1 16.8 12.8 16.1 16.1 10.3
Malaysia 140 14 .1 6.4 5.6 3.0 2.9 3.2 4.5 8.5 8.2 3.6 6.8 6.0 5.5 3.7 2.4 4.0 4.0 1.6 5.6 12 .6 11.9 5.1 10.8 7.7 6.8
Philippines 196 13 .2 5.2 6.9 3.8 1.6 5.0 4.4 5.9 5.0 2.2 3.9 4.7 3.7 3.8 1.7 3.4 3.4 1.1 4.6 21.5 17.8 11.2 24.3 20.7 13.5
Vietnam 234 10 .7 2.7 3.3 3.8 3.6 3.9 3.5 3 .2 4.8 1.8 3.9 6.0 3.7 3.6 1.0 2.7 2.2 1.0 3.1 8 .4 6 .8 3.8 9.0 9.0 2.7
Cambodia 75 15 .5 3.0 4.5 6.0 8.9 5.8 3.0 6.5 3.9 2.7 3.9 5.5 4.0 3.0 1.5 3.0 1.5 3.0 2.7 9 .1 5 .1 8.0 2 .5 2 .5 2.5
Other places in Asia 124 17 .5 3.3 1 .5 1.5 5.8 2.5 4.0 11.4 11.2 3.3 10.3 6.7 3.7 5.5 2.2 1.6 1.6 0.9 9.4 5 .8 5 .2 3.1 3.6 1 .8 2.7
Australia 299 27.0 7.0 7.8 9.2 8.9 9.5 7.0 8.2 7.4 1.8 6.3 11.7 6.8 9.0 3.8 7.6 7.6 0.7 4.4 28.4 22.5 15.7 12.7 10.9 5.5
New Zealand or other Oceania 142 37.0 10.0 10.3 10.8 11.5 12.4 14.9 11.9 9.0 3.0 7.6 12.9 8.6 11.0 5.3 12.6 12.6 1.6 6.3 28.4 21.5 20.8 11.9 11.9 7.5
Sample
South
Pacific
islands or
other
islands
China
(excluding
Hong Kong
and Macau)
Shanghai Beijing
Other
China (exc.
Hong Kong
/ Macau)
Hong Kong
or MacauHong Kong Macau Taiwan Korea
Southeast
AsiaSingapore Phuket
Thai
beaches
(other than
Phuket)
Bangkok or
other Thai
cities
Bali
Indonesian
beaches
(other than
Bali)
Indonesian
citiesMalaysia Philippines Vietnam Cambodia
2018 survey total 4,175 4.0 6.5 3.8 1.5 3.0 9.0 8.3 3.1 18.4 10.9 24.9 7.3 2.3 2.4 6.4 4.5 0.8 1.2 3.3 4.7 5.6 1.8
2017 survey total 4,069 5.0 5.0 2.9 1.0 2.1 9.0 8.2 2.9 19.8 12.2 24.7 7.7 2.5 2.5 6.5 3.9 0.7 0.8 3.4 4.6 5.2 1.7
UK 260 5.7 3.2 2.4 2.0 1.7 5.2 4.7 2.0 6 .6 2 .0 12 .8 6.8 2.1 1.6 3.4 3.3 0.9 1.3 3.4 3.9 2.4 0.9
France 305 6.1 2.7 2.1 2.3 1.7 5.6 4.9 3.2 3 .4 2 .0 11 .9 5.0 2.1 1.8 1 .4 3.9 1.1 1.1 2.6 4.4 2.5 1.1
Germany 238 6.4 3.9 2.7 2.6 1.8 5.4 5.4 2.5 7 .2 3 .9 14 .9 7.7 2.8 0.9 3.4 3.2 0.9 1.4 1.7 3.1 3.7 1.9
Spain 246 5.3 2.5 1.3 1.7 2.1 3 .9 3.9 1.3 4 .9 1 .8 11 .5 5.2 1.3 0.9 2.0 1.7 0.5 0.9 1.6 1.3 3.4 2.7
Italy 287 8.0 2.6 2.3 1.5 2.2 4.3 3.6 2.5 5 .5 2 .3 11 .1 6.4 3.0 0.8 1.6 3.3 1.2 1.2 1.5 3.4 3.1 1.5
Other countries in western Europe 265 4.0 3.3 2.4 2.0 2.1 3 .5 3.5 1.6 3 .5 2 .7 10 .7 3.2 2.5 0.4 2.8 2.1 0.4 0.8 2.4 3.3 3.1 0.9
Other places in Europe 348 3.6 3.1 1.7 1.2 2.3 2 .7 2 .1 2.1 3 .7 2 .4 9 .8 3.5 1.5 1.2 2.1 2.5 0.6 0.6 3.4 3.3 2.2 1.4
Turkey 44 14.6 9.8 7.4 5.1 9.8 12.1 10.0 9.5 14.8 9.8 28.4 10.0 7.6 7.2 11.4 7.6 5.1 5.1 11.6 10.0 9.6 4.6
Other Middle East or Africa 154 12.5 7.3 4.3 2.8 5.3 5.7 5.0 2.9 7 .5 2 .8 18 .8 5.4 2.2 2.0 2.6 6.7 1.4 1.4 6.2 4.9 6.0 1.9
USA east 201 6.9 4.7 3.7 3.5 2.6 4.2 4.2 3.2 6 .9 4 .6 13 .7 6.7 2.8 1.6 2.6 3.1 1.1 1.7 3.8 3.6 4.3 1.5
USA west 243 4.8 4.3 3.9 2.9 2.1 8.6 7.3 4.8 8 .0 3 .0 12 .9 6.5 3.1 1.7 2.0 3.4 0.9 1.4 2.2 3.0 3.5 0.9
USA south 72 7.5 8.7 8.7 7.2 5.9 11.4 9.9 8.6 9 .0 5 .9 14 .5 9.6 6.2 4.2 5.3 4.2 3.1 4.6 4.6 4.6 3.1 1.5
Canada 126 7.1 5.2 4.3 4.3 3.4 5.8 5.0 4.2 8 .1 6.0 13 .6 6.6 3.5 1.8 5.0 3.5 1.8 3.5 4.4 5.3 4.1 0.9
Alaska 13 25.6 17.1 17.1 17.1 17.1 25.6 25.6 17.1 25.6 17.1 43.3 25.6 26.0 17.5 26.2 8.5 8.5 26.0 17.1 17.1 17.5 17.5
Central/SouthAmericaorCaribbean 121 15.3 5.1 4.4 3.5 4.2 6.8 6.8 4.3 6 .7 3 .7 19 .6 7.9 4.4 4.2 4.1 5.8 1.8 2.8 6.5 7.4 5.9 1.7
Hawaii (Oahu) 695 9.2 2.4 1.6 0.9 1.9 4 .0 4.0 1.2 7 .5 4 .4 17 .2 6.6 2.8 1.7 1.8 5.5 0.7 1.2 2.4 5.0 2.3 0.5
Hawaii (other than Oahu) 328 11.9 2.8 2.2 1.9 2.8 4.3 3.7 2.6 5 .8 3 .7 19 .0 8.2 3.6 1.9 1.5 6.6 1.3 1.9 2.2 6.7 2.7 1.8
Guam 333 10.4 4.1 3.5 1.3 1.6 11.3 10.3 3.8 20.8 9.7 35.2 15.6 5.5 3.7 5.1 11.5 0.9 2.4 3.2 12.1 6.3 0.6
Saipan 111 26.5 6.6 5.7 3.8 3.9 12.2 12.2 5.4 20.7 14.0 46.6 13.7 9.8 6.7 9.3 20.8 2.0 4.6 8.6 23.7 5.8 1.7
South Pacific islands or other islands 165 100.0 6.1 5.2 3.1 3.5 8.3 8.3 3.7 10 .8 5 .2 43.0 12.8 9.5 8.2 6.6 18.9 3.0 3.0 9.0 17.6 6.2 2.8
Shanghai 157 5.4 100.0 100.0 20.0 24.5 38.3 37.5 13.4 33.3 22.3 23.0 11.5 4.1 2.6 7.1 5.9 2.0 2.7 7.1 10.5 7.2 2.8
Beijing 63 8.3 100.0 50.1 100.0 38.1 40.9 40.9 16.4 39.4 26.7 25.5 14.7 6.8 4.8 6.1 5.0 5.0 6.8 8.6 13.1 10.2 1.8
Other China (exc. Hong Kong / Macau) 126 4.6 100.0 30.5 18.9 100.0 31.1 29.2 16.1 28.9 15.9 26.5 10.2 3.4 2.6 8.6 5.7 1.8 2.7 5.6 10.2 11.3 6.2
Hong Kong 345 4.0 22.6 17.1 7.4 10.7 100.0 100.0 28.3 41.8 17.5 28.2 16.9 3.6 1.5 7.5 4.8 1.1 2.3 4.9 6.5 6.3 1.8
Macau 128 4.8 23.2 16.4 8.0 15.9 100.0 76.3 100.0 38.8 21.0 38.1 23.5 4.8 3.2 10.4 6.6 2.4 5.3 7.1 10.0 12.0 5.0
Taiwan 770 2.3 10.3 6.8 3.2 4.7 19.8 18.7 6.4 100.0 20.1 24.4 11.9 2.5 2.1 6.5 4.9 0.6 2.0 3.3 5.6 6.0 1.0
Korea 457 1.9 11.1 7.7 3.7 4.4 14.5 13.2 5.9 33.8 100.0 17 .2 6.9 1.9 1.9 4.7 3.6 0.7 1.6 2.4 7.1 5.7 1.0
Singapore 306 6.9 8.4 5.9 3.0 4.2 20.2 19.0 9.8 29.8 10.3 100.0 100.0 9.1 5.5 15.2 9.7 2.8 5.7 13.9 9.6 11.2 2.7
Phuket 96 16.5 6.8 6.8 4.5 4.5 12.9 12.9 6.5 20.1 9.1 100.0 29.1 100.0 27.8 32.4 39.5 6.3 8.5 18.8 29.0 15.2 3.2
Thai beaches (other than Phuket) 99 13.7 4.1 4.1 3.1 3.3 5.3 5.3 4.1 16.2 8.6 100.0 17.1 27.0 100.0 47.9 24.4 15.7 12.0 24.5 22.7 19.4 8.9
Bangkok or other Thai cities 267 4.1 6.2 4.2 1.4 4.1 10.1 9.7 5.0 18.8 8.1 100.0 17.5 11.6 17.7 100.0 12.4 3.9 4.9 9.6 10.3 17.9 6.2
Bali 187 16.8 5.9 5.0 1.7 3.8 9.5 8.9 4.5 20.2 8.8 100.0 16.0 20.2 12.9 17.7 100.0 8.9 5.5 10.6 31.9 17.4 3.8
Indonesian beaches (other than Bali) 32 15.5 9.8 9.8 9.8 7.0 12.3 12.3 9.4 15.5 9.8 100.0 26.8 18.9 48.2 32.5 52.0 100.0 29.7 52.4 37.2 39.5 12.9
Indonesian cities 49 10.1 8.7 8.7 8.7 6.8 16.2 16.2 14.0 32.0 14.9 100.0 35.9 16.6 24.1 26.9 20.9 19.5 100.0 40.8 27.7 28.8 11.9
Malaysia 140 10.6 9.1 8.0 3.8 5.1 12.7 12.0 6.5 18.4 7.8 100.0 30.5 12.8 17.3 18.3 14.2 12.0 14.3 100.0 26.7 22.2 5.6
Philippines 196 14.9 11.8 8.5 4.2 6.6 12.0 11.4 6.6 22.2 16.6 100.0 15.1 14.1 11.4 14.0 30.5 6.1 6.9 19.1 100.0 15.4 3.9
Vietnam 234 4.4 8.6 4.9 2.7 6.1 11.9 9.3 6.5 19.6 11.1 100.0 14.7 6.2 8.2 20.4 13.8 5.4 6.0 13.2 12.8 100.0 13.2
Cambodia 75 6.2 11.9 5.8 1.5 10.4 9.6 8.1 8.5 10 .7 6.2 100.0 11.0 4.1 11.7 22.0 9.4 5.5 7.8 10.4 10.3 41.3 100.0
Other places in Asia 124 6.1 7.9 1.8 2.3 5.7 2 .8 2 .8 2.2 8 .5 3 .2 44.7 7.9 3.3 5.2 15.4 5.4 2.3 6.9 12.9 8.7 6.9 9.1
Australia 299 11.1 4.8 3.6 1.8 3.8 7.6 6.5 4.9 10 .5 4 .6 28.8 13.1 3.3 3.2 6.0 8.7 0.7 2.9 3.8 6.0 4.2 1.5
New Zealand or other Oceania 142 13.2 6.7 5.4 3.0 5.1 7.4 6.7 5.4 12 .6 7.6 29.5 16.9 4.5 3.2 6.6 7.1 1.6 3.9 4.5 6.3 4.5 1.5
Sample
Other
places in
Asia
Oceania Australia
New
Zealand or
other
Oceania
Japan Hokkaido TohokuKita
Kanto
Tokyo
metropolitan
area
Koshinetsu Tokai Hokuriku Kinki Chugoku Shikoku Kyushu Okinawa
2018 survey total 4,175 3.0 8.7 7.2 3.4 10.9 3.4 1.1 0.7 0.9 0.8 0.6 0.8 0.8 0.6 0.6 1.8 5.3
2017 survey total 4,069 3.4 8.2 6.3 3.7 9.4 2.9 0.6 0.3 0.9 0.4 0.5 0.5 1.0 0.4 0.5 1.7 4.4
UK 260 1.6 9.3 8.0 5.4 10.1 5.5 2.6 2.3 2.6 1.9 1.2 1.6 1.3 2.0 1.6 2.4 4.7
France 305 0.6 9.0 7.6 4.8 10.4 4.9 2.4 2.4 2.4 2.3 1.4 1.7 0.7 2.6 1.7 2.0 3.9
Germany 238 0.8 12.3 11.5 6.4 12.7 4.7 2.9 1.7 2.9 2.7 1.3 1.8 1.4 1.8 1.7 2.2 4.3
Spain 246 2.9 11.9 10.8 6.6 8.7 5.0 0.9 1.2 1.6 0.9 0.9 1.3 0.9 0.9 0.8 1.8 4.5
Italy 287 1.1 11.9 9.8 6.1 8.8 3.8 2.3 1.5 1.8 1.1 0.8 1.1 0.8 1.9 0.8 1.5 5.0
Other countries in western Europe 265 1.9 11.6 7.9 8.0 12.0 6.0 2.6 2.8 1.4 1.2 0.8 2.0 1.6 1.1 1.5 3.5 3.8
Other places in Europe 348 4.1 8.8 7.0 4.9 11.4 6.5 2.6 0.8 1.6 1.5 0.9 1.2 0.6 1.5 0.8 3.0 4.8
Turkey 44 9.5 14.6 12.1 9.7 18.9 10.0 7.2 9.3 7.0 7.0 4.6 4.9 2.5 4.6 4.6 4.6 9.8
Other Middle East or Africa 154 8.3 14.9 12.3 7.0 12.7 5.6 2.9 2.1 2.1 1.4 1.3 1.5 1.4 1.4 1.9 2.9 8.1
USA east 201 2.3 11.9 10.0 6.0 11.6 4.6 1.6 1.1 1.7 1.7 1.6 2.2 1.1 1.6 1.7 2.2 6.2
USA west 243 2.8 13.2 11.1 6.4 13.3 5.9 2.2 0.9 1.7 1.4 1.3 1.4 0.9 1.3 1.8 3.0 7.3
USA south 72 3.8 18.8 15.8 10.4 10.8 8.1 5.5 3.1 3.1 4.7 3.1 4.2 3.1 4.2 4.2 4.2 9.2
Canada 126 1.6 24.0 18.0 14.2 11.6 6.7 2.6 1.8 2.5 2.7 2.4 1.8 1.8 1.8 1.8 1.8 7.7
Alaska 13 8.5 17.1 17.1 17.1 40.7 25.6 25.0 8.5 8.5 8.5 8.5 8.5 8.5 8.5 8.5 8.5 24.2
Central/SouthAmericaorCaribbean 121 9.6 12.6 10.8 7.3 13.9 7.4 4.9 1.8 3.5 2.5 2.5 2.5 2.5 2.5 4.1 5.4 7.8
Hawaii (Oahu) 695 0.9 11.7 9.7 4.4 12.4 4.0 0.9 0.6 1.2 1.1 1.2 0.8 0.9 0.7 0.6 1.7 7.8
Hawaii (other than Oahu) 328 1.2 17.8 14.3 9.0 14.7 6.0 1.5 1.5 2.3 1.8 2.2 1.3 0.9 1.0 1.3 3.4 9.7
Guam 333 0.7 11.6 9.8 5.1 18.0 6.4 1.0 1.3 1.7 1.6 1.3 1.3 1.3 1.0 1.3 2.9 13.3
Saipan 111 3.0 17.6 14.7 9.6 25.6 9.1 2.0 3.0 3.0 3.0 2.0 3.0 2.0 2.0 2.0 4.4 18.3
South Pacific islands or other islands 165 4.6 23.6 20.0 11.3 16.1 7.2 3.7 1.4 2.6 3.0 2.5 2.5 1.8 1.8 1.8 3.0 11.2
Shanghai 157 1.4 8.2 6.8 4.8 17.1 8.3 4.1 2.1 2.0 2.8 1.9 2.8 2.1 2.9 1.4 4.5 6.8
Beijing 63 4.5 8.6 8.6 6.8 25.7 14.7 6.8 5.3 6.3 4.8 5.0 5.3 7.1 5.2 3.6 3.6 9.9
Other China (exc. Hong Kong / Macau) 126 5.6 9.6 9.0 5.8 22.5 9.8 5.0 4.3 4.2 4.5 3.0 4.1 4.8 4.7 2.4 5.4 10.8
Hong Kong 345 1.0 5.9 5.7 2.7 17.4 7.6 3.1 1.8 2.6 1.3 1.2 2.5 2.8 1.5 1.5 3.5 8.9
Macau 128 2.1 11.5 11.5 5.9 18.3 9.1 4.0 1.7 4.7 3.3 2.5 4.1 1.7 4.0 4.7 5.5 11.4
Taiwan 770 1.4 4.7 4.1 2.3 19.6 6.9 2.4 1.6 1.5 0.9 1.3 1.8 2.1 0.9 1.3 4.1 11.0
Korea 457 0.9 3 .5 3.0 2.4 16.2 5.8 1.6 1.3 2.5 1.1 1.0 1.2 1.9 1.1 1.6 4.5 8.5
Singapore 306 3.2 14.8 12.8 7.8 15.3 6.8 3.2 1.5 2.0 2.1 1.6 1.7 3.1 1.7 1.7 3.4 7.4
Phuket 96 4.3 12.6 10.2 6.7 18.4 7.0 2.3 2.3 3.3 3.5 3.2 2.3 3.5 2.3 2.3 3.5 16.0
Thai beaches (other than Phuket) 99 6.5 9.6 9.6 4.5 16.0 7.4 2.3 4.5 2.3 3.3 3.4 3.3 2.3 2.3 2.3 3.1 11.6
Bangkok or other Thai cities 267 7.2 7.5 6.7 3.5 13.8 7.0 1.3 2.2 1.3 1.5 1.6 1.2 1.3 0.8 0.8 2.8 9.1
Bali 187 3.6 14.6 14.0 5.4 13.2 5.1 1.8 1.2 2.3 2.2 1.2 1.8 1.8 1.2 1.2 1.2 9.4
Indonesian beaches (other than Bali) 32 8.8 7.0 7.0 7.0 18.6 10.2 7.0 7.0 7.0 7.0 7.0 10.4 7.0 7.0 7.0 9.5 11.9
Indonesian cities 49 17.6 17.6 17.6 11.4 21.7 11.2 4.6 4.6 6.8 6.7 4.6 6.8 4.6 6.8 6.8 6.2 17.5
Malaysia 140 11.5 8.9 8.2 4.6 13.8 7.8 2.8 2.4 2.3 3.6 3.6 2.9 3.7 2.8 2.8 4.8 8.1
Philippines 196 5.5 10.3 9.1 4.6 15.4 8.3 2.1 1.7 2.2 2.1 1.5 2.1 2.0 2.1 1.5 5.3 13.0
Vietnam 234 3.6 6.2 5.4 2.7 15.7 6.9 2.2 2.2 2.2 2.9 2.0 1.9 2.6 1.6 2.9 4.6 9.2
Cambodia 75 15.2 5.9 5.9 2.9 7.8 2.9 1.5 2.9 1.5 2.9 1.5 1.5 1.5 1.5 1.5 1.5 6.4
Other places in Asia 124 100.0 5.5 3.9 2.5 12.8 4.6 3.9 3.5 0.9 3.2 1.5 2.2 1.5 3.1 4.6 2.8 4.5
Australia 299 1.6 100.0 100.0 25.6 14.3 7.7 2.1 1.1 1.5 1.7 1.8 1.9 1.7 1.4 1.4 3.5 9.4
New Zealand or other Oceania 142 2.2 100.0 53.9 100.0 19.5 8.6 2.8 2.4 2.4 3.2 1.6 2.4 2.1 2.4 3.8 2.2 11.8
50.0 …Figures 5 or more points or higher than the 2018 survey total are shaded. † Items with under 30 samples are not shaded in the table.
50 .0 …Figures 5 or more points or lower than the 2018 survey total are shaded.
Japan
Hawaii
Hong Kong or MacauChina (excluding Hong Kong and Macau)
Destination
Considered on
Last Trip
(middle
classification)
Guam or Saipan
Southeast Asia
Canada or AlaskaEurope USA (excluding Hawaii and Alaska)Middle East or Africa
Destination
Considered on
Last Trip
(middle
classification)
Destination
Considered on
Last Trip
(middle
classification)
Oceania
43
1. Destinations Considered / Destinations Decided on (2)
■Destinations considered on last trip: by destination considered on last trip (Those involved in considering travel plans/Multiple answers)
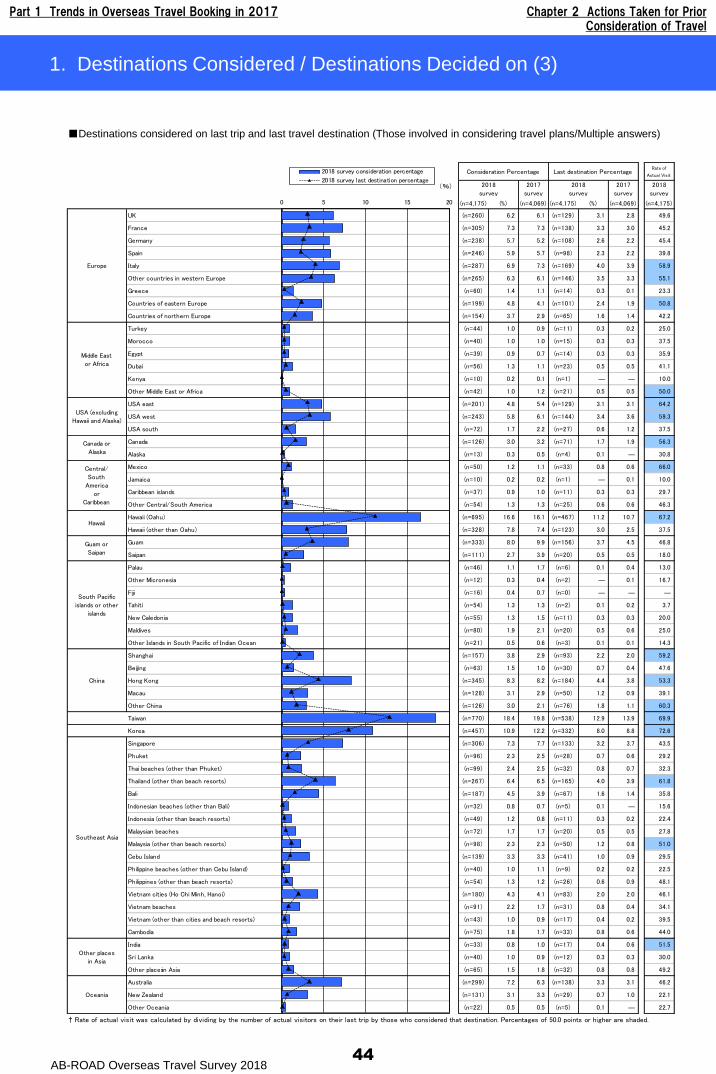
Part 1 Trends in Overseas Travel Booking in 2017 Chapter 2 Actions Taken for Prior Consideration of Travel
AB-ROAD Overseas Travel Survey 201844
1. Destinations Considered / Destinations Decided on (3)
2018 survey consideration percentage2018 survey last destination percentage
Consideration Percentage Last destination PercentageRate of
Actual Visit
2018
survey
2017
survey
2018
survey
2017
survey
2018
survey
(n=4,175) (%) (n=4,069) (n=4,175) (%) (n=4,069) (n=4,175)
イギリス UK (n=260) 6.2 6.1 (n=129) 3.1 2.8 49.6
フランス France (n=305) 7.3 7.3 (n=138) 3.3 3.0 45.2
Germany (n=238) 5.7 5.2 (n=108) 2.6 2.2 45.4
スペイン Spain (n=246) 5.9 5.7 (n=98) 2.3 2.2 39.8
イタリア Italy (n=287) 6.9 7.3 (n=169) 4.0 3.9 58.9
西ヨーロッパ諸国 Other countries in western Europe (n=265) 6.3 6.1 (n=146) 3.5 3.3 55.1
ギリシア Greece (n=60) 1.4 1.1 (n=14) 0.3 0.1 23.3
東ヨーロッパ諸国 Countries of eastern Europe (n=199) 4.8 4.1 (n=101) 2.4 1.9 50.8
北ヨーロッパ諸国 Countries of northern Europe (n=154) 3.7 2.9 (n=65) 1.6 1.4 42.2
Turkey (n=44) 1.0 0.9 (n=11) 0.3 0.2 25.0
モロッコ Morocco (n=40) 1.0 1.0 (n=15) 0.3 0.3 37.5
エジプト Egypt (n=39) 0.9 0.7 (n=14) 0.3 0.3 35.9
ドバイ(アラブ首長国連邦) Dubai (n=56) 1.3 1.1 (n=23) 0.5 0.5 41.1
Kenya (n=10) 0.2 0.1 (n=1) ― ― 10.0
中近東・アフリカ(トルコ、モロッコ、エジプト、ドバイ、ケニア以外)Other Middle East or Africa (n=42) 1.0 1.2 (n=21) 0.5 0.5 50.0
アメリカ東部(ニューヨーク、ナイアガラなど)USA east (n=201) 4.8 5.4 (n=129) 3.1 3.1 64.2
アメリカ西部(ロサンゼルス、ラスベガスなど)USA west (n=243) 5.8 6.1 (n=144) 3.4 3.6 59.3
アメリカ南部(マイアミ、オーランドなど)USA south (n=72) 1.7 2.2 (n=27) 0.6 1.2 37.5
Canada (n=126) 3.0 3.2 (n=71) 1.7 1.9 56.3
アラスカ Alaska (n=13) 0.3 0.5 (n=4) 0.1 ― 30.8
メキシコ(カンクン、ティファナなど)Mexico (n=50) 1.2 1.1 (n=33) 0.8 0.6 66.0
ジャマイカ Jamaica (n=10) 0.2 0.2 (n=1) ― 0.1 10.0
カリブ海諸島(キューバ、バハマ、ケイマンなど)Caribbean islands (n=37) 0.9 1.0 (n=11) 0.3 0.3 29.7
中南米(メキシコ、ジャマイカ、カリブ海諸島以外)Other Central/South America (n=54) 1.3 1.3 (n=25) 0.6 0.6 46.3
オアフ島 Hawaii (Oahu) (n=695) 16.6 16.1 (n=467) 11.2 10.7 67.2
ハワイ(オアフ島以外) Hawaii (other than Oahu) (n=328) 7.8 7.4 (n=123) 3.0 2.5 37.5
Guam (n=333) 8.0 9.9 (n=156) 3.7 4.5 46.8
サイパン Saipan (n=111) 2.7 3.9 (n=20) 0.5 0.5 18.0
Palau (n=46) 1.1 1.7 (n=6) 0.1 0.4 13.0
ミクロネシア(グアム、サイパン、パラオ以外)Other Micronesia (n=12) 0.3 0.4 (n=2) ― 0.1 16.7
フィジー Fiji (n=16) 0.4 0.7 (n=0) ― ― ―
Tahiti (n=54) 1.3 1.3 (n=2) 0.1 0.2 3.7
ニューカレドニア New Caledonia (n=55) 1.3 1.5 (n=11) 0.3 0.3 20.0
モルディブ Maldives (n=80) 1.9 2.1 (n=20) 0.5 0.6 25.0
南太平洋・インド洋の島々(フィジー、タヒチ、ニューカレドニア、モルディブ以外)Other Islands in South Pacific of Indian Ocean (n=21) 0.5 0.6 (n=3) 0.1 0.1 14.3
上海(中国) Shanghai (n=157) 3.8 2.9 (n=93) 2.2 2.0 59.2
北京(中国) Beijing (n=63) 1.5 1.0 (n=30) 0.7 0.4 47.6
香港(中国) Hong Kong (n=345) 8.3 8.2 (n=184) 4.4 3.8 53.3
マカオ(中国) Macau (n=128) 3.1 2.9 (n=50) 1.2 0.9 39.1
中国(上海、北京、香港、マカオ以外)Other China (n=126) 3.0 2.1 (n=76) 1.8 1.1 60.3
Taiwan (n=770) 18.4 19.8 (n=538) 12.9 13.9 69.9
Korea (n=457) 10.9 12.2 (n=332) 8.0 8.8 72.6
シンガポール Singapore (n=306) 7.3 7.7 (n=133) 3.2 3.7 43.5
プーケット島 Phuket (n=96) 2.3 2.5 (n=28) 0.7 0.6 29.2
タイビーチ(プーケット島以外) Thai beaches (other than Phuket) (n=99) 2.4 2.5 (n=32) 0.8 0.7 32.3
タイ(ビーチリゾート以外) Thailand (other than beach resorts) (n=267) 6.4 6.5 (n=165) 4.0 3.9 61.8
Bali (n=187) 4.5 3.9 (n=67) 1.6 1.4 35.8
インドネシアビーチ(バリ島以外)Indonesian beaches (other than Bali) (n=32) 0.8 0.7 (n=5) 0.1 ― 15.6
インドネシア(ビーチリゾート以外)Indonesia (other than beach resorts) (n=49) 1.2 0.8 (n=11) 0.3 0.2 22.4
マレーシアビーチ(ランカウイ島、ペナン島など)Malaysian beaches (n=72) 1.7 1.7 (n=20) 0.5 0.5 27.8
マレーシア(ビーチリゾート以外)Malaysia (other than beach resorts) (n=98) 2.3 2.3 (n=50) 1.2 0.8 51.0
Cebu Island (n=139) 3.3 3.3 (n=41) 1.0 0.9 29.5
フィリピンビーチ(セブ島以外) Philippine beaches (other than Cebu Island) (n=40) 1.0 1.1 (n=9) 0.2 0.2 22.5
フィリピン(ビーチリゾート以外)Philippines (other than beach resorts) (n=54) 1.3 1.2 (n=26) 0.6 0.9 48.1
ベトナムシティ(ホーチミン、ハノイ)Vietnam cities (Ho Chi Minh, Hanoi) (n=180) 4.3 4.1 (n=83) 2.0 2.0 46.1
ベトナムビーチ(ニャチャン、ダナンなど)Vietnam beaches (n=91) 2.2 1.7 (n=31) 0.8 0.4 34.1
ベトナム(ベトナムシティ、ベトナムビーチ以外)Vietnam (other than cities and beach resorts) (n=43) 1.0 0.9 (n=17) 0.4 0.2 39.5
カンボジア Cambodia (n=75) 1.8 1.7 (n=33) 0.8 0.6 44.0
India (n=33) 0.8 1.0 (n=17) 0.4 0.6 51.5
スリランカ Sri Lanka (n=40) 1.0 0.9 (n=12) 0.3 0.3 30.0
その他のアジア Other placesin Asia (n=65) 1.5 1.8 (n=32) 0.8 0.8 49.2
オーストラリア Australia (n=299) 7.2 6.3 (n=138) 3.3 3.1 46.2
ニュージーランド New Zealand (n=131) 3.1 3.3 (n=29) 0.7 1.0 22.1
オセアニア(オーストラリア、ニュージーランド以外)Other Oceania (n=22) 0.5 0.5 (n=5) 0.1 ― 22.7
† Rate of actual visit was calculated by dividing by the number of actual visitors on their last trip by those who considered that destination. Percentages of 50.0 points or higher are shaded.
Europe
Middle East
or Africa
Oceania
Hawaii
USA (excluding
Hawaii and Alaska)
Canada or
Alaska
Central/
South
America
or
Caribbean
Other places
in Asia
Southeast Asia
Guam or
Saipan
South Pacific
islands or other
islands
China
0 5 10 15 20
2018 survey consideration percentage
2018 survey last destination percentage(%)
■Destinations considered on last trip and last travel destination (Those involved in considering travel plans/Multiple answers)
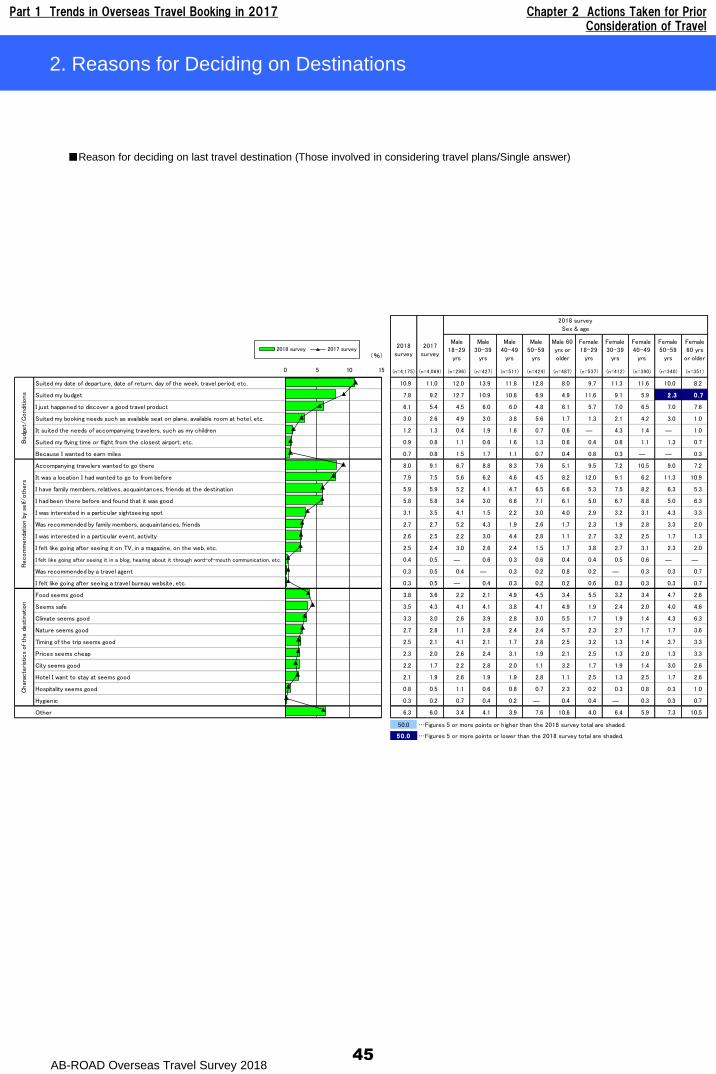
Part 1 Trends in Overseas Travel Booking in 2017 Chapter 2 Actions Taken for Prior Consideration of Travel
AB-ROAD Overseas Travel Survey 201845
2. Reasons for Deciding on Destinations
2018 survey2017 survey
2018
survey
2017
survey
Male
18-29
yrs
Male
30-39
yrs
Male
40-49
yrs
Male
50-59
yrs
Male 60
yrs or
older
Female
18-29
yrs
Female
30-39
yrs
Female
40-49
yrs
Female
50-59
yrs
Female
60 yrs
or older
(n=4,175) (n=4,069) (n=296) (n=427) (n=511) (n=424) (n=487) (n=537) (n=412) (n=390) (n=340) (n=351)
Suited my date of departure, date of return, day of the week, travel period, etc. 10.9 11.0 12.0 13.9 11.8 12.8 8.0 9.7 11.3 11.6 10.0 8.2
Suited my budget 7.8 9.2 12.7 10.9 10.8 6.9 4.9 11.6 9.1 5.9 2 .3 0 .7
I just happened to discover a good travel product 6.1 5.4 4.5 6.0 6.0 4.8 6.1 5.7 7.0 6.5 7.0 7.6
Suited my booking needs such as available seat on plane, available room at hotel, etc. 3.0 2.6 4.9 3.0 3.8 5.6 1.7 1.3 2.1 4.2 3.0 1.0
It suited the needs of accompanying travelers, such as my children 1.2 1.3 0.4 1.9 1.6 0.7 0.6 ― 4.3 1.4 ― 1.0
Suited my flying time or flight from the closest airport, etc. 0.9 0.8 1.1 0.6 1.6 1.3 0.6 0.4 0.8 1.1 1.3 0.7
Because I wanted to earn miles 0.7 0.8 1.5 1.7 1.1 0.7 0.4 0.8 0.3 ― ― 0.3
Accompanying travelers wanted to go there 8.0 9.1 6.7 8.8 8.3 7.6 5.1 9.5 7.2 10.5 9.0 7.2
It was a location I had wanted to go to from before 7.9 7.5 5.6 6.2 4.6 4.5 8.2 12.0 9.1 6.2 11.3 10.9
I have family members, relatives, acquaintances, friends at the destination 5.9 5.9 5.2 4.1 4.7 6.5 6.6 5.3 7.5 8.2 6.3 5.3
I had been there before and found that it was good 5.8 5.8 3.4 3.0 6.6 7.1 6.1 5.0 6.7 8.8 5.0 6.3
I was interested in a particular sightseeing spot 3.1 3.5 4.1 1.5 2.2 3.0 4.0 2.9 3.2 3.1 4.3 3.3
Was recommended by family members, acquaintances, friends 2.7 2.7 5.2 4.3 1.9 2.6 1.7 2.3 1.9 2.8 3.3 2.0
I was interested in a particular event, activity 2.6 2.5 2.2 3.0 4.4 2.8 1.1 2.7 3.2 2.5 1.7 1.3
I felt like going after seeing it on TV, in a magazine, on the web, etc. 2.5 2.4 3.0 2.6 2.4 1.5 1.7 3.8 2.7 3.1 2.3 2.0
I felt like going after seeing it in a blog, hearing about it through word-of-mouth communication, etc. 0.4 0.5 ― 0.6 0.3 0.6 0.4 0.4 0.5 0.6 ― ―
Was recommended by a travel agent 0.3 0.5 0.4 ― 0.3 0.2 0.8 0.2 ― 0.3 0.3 0.7
I felt like going after seeing a travel bureau website, etc. 0.3 0.5 ― 0.4 0.3 0.2 0.2 0.6 0.3 0.3 0.3 0.7
Food seems good 3.8 3.6 2.2 2.1 4.9 4.5 3.4 5.5 3.2 3.4 4.7 2.6
Seems safe 3.5 4.3 4.1 4.1 3.8 4.1 4.9 1.9 2.4 2.0 4.0 4.6
Climate seems good 3.3 3.0 2.6 3.9 2.8 3.0 5.5 1.7 1.9 1.4 4.3 6.3
Nature seems good 2.7 2.8 1.1 2.8 2.4 2.4 5.7 2.3 2.7 1.7 1.7 3.6
Timing of the trip seems good 2.5 2.1 4.1 2.1 1.7 2.8 2.5 3.2 1.3 1.4 3.7 3.3
Prices seems cheap 2.3 2.0 2.6 2.4 3.1 1.9 2.1 2.5 1.3 2.0 1.3 3.3
City seems good 2.2 1.7 2.2 2.8 2.0 1.1 3.2 1.7 1.9 1.4 3.0 2.6
Hotel I want to stay at seems good 2.1 1.9 2.6 1.9 1.9 2.8 1.1 2.5 1.3 2.5 1.7 2.6
Hospitality seems good 0.8 0.5 1.1 0.6 0.8 0.7 2.3 0.2 0.3 0.8 0.3 1.0
Hygienic 0.3 0.2 0.7 0.4 0.2 ― 0.4 0.4 ― 0.3 0.3 0.7
Other 6.3 6.0 3.4 4.1 3.9 7.6 10.6 4.0 6.4 5.9 7.3 10.5
50.0 …Figures 5 or more points or higher than the 2018 survey total are shaded.
50 .0 …Figures 5 or more points or lower than the 2018 survey total are shaded.
Char
acte
rist
ics
of th
e d
est
inat
ion
Budg
et/
Condi
tions
Recom
menda
tion b
y se
lf/oth
ers
2018 survey
Sex & age
0 5 10 15
2018 survey 2017 survey(%)
■Reason for deciding on last travel destination (Those involved in considering travel plans/Single answer)
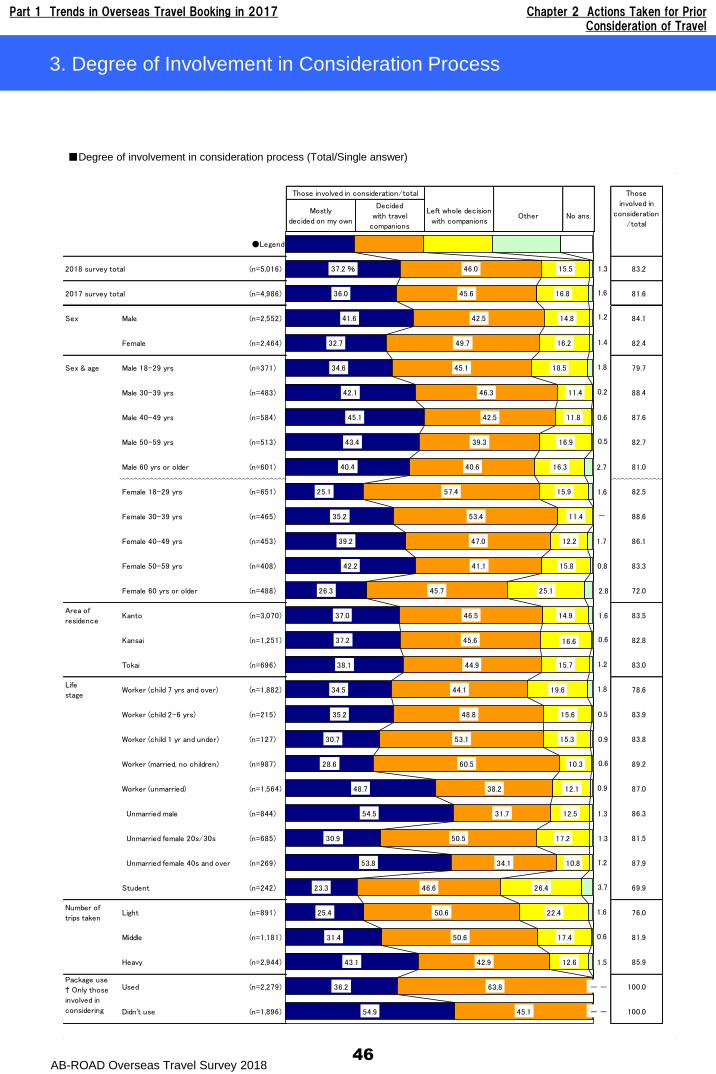
Part 1 Trends in Overseas Travel Booking in 2017 Chapter 2 Actions Taken for Prior Consideration of Travel
AB-ROAD Overseas Travel Survey 2018
Those involved in consideration/total
Mostly
decided on my own
Decided
with travel
companions
Left whole decision
with companionsOther No ans.
●Legend
2018 survey total (n=5,016) 83.2
2017 survey total (n=4,986) 81.6
Sex Male (n=2,552) 84.1
Female (n=2,464) 82.4
Sex & age Male 18-29 yrs (n=371) 79.7
Male 30-39 yrs (n=483) 88.4
Male 40-49 yrs (n=584) 87.6
Male 50-59 yrs (n=513) 82.7
Male 60 yrs or older (n=601) 81.0
Female 18-29 yrs (n=651) 82.5
Female 30-39 yrs (n=465) 88.6
Female 40-49 yrs (n=453) 86.1
Female 50-59 yrs (n=408) 83.3
Female 60 yrs or older (n=488) 72.0
Area of
residenceKanto (n=3,070) 83.5
Kansai (n=1,251) 82.8
Tokai (n=696) 83.0
Life
stageWorker (child 7 yrs and over) (n=1,882) 78.6
Worker (child 2-6 yrs) (n=215) 83.9
Worker (child 1 yr and under) (n=127) 83.8
Worker (married, no children) (n=987) 89.2
Worker (unmarried) (n=1,564) 87.0
Unmarried male (n=844) 86.3
Unmarried female 20s/30s (n=685) 81.5
Unmarried female 40s and over (n=269) 87.9
Student (n=242) 69.9
Number of
trips takenLight (n=891) 76.0
Middle (n=1,181) 81.9
Heavy (n=2,944) 85.9
Used (n=2,279) 100.0
Didn't use (n=1,896) 100.0
Package use
† Only those
involved in
considering
Those
involved in
consideration
/total
37.2 %
36.0
41.6
32.7
34.6
42.1
45.1
43.4
40.4
25.1
35.2
39.2
42.2
26.3
37.0
37.2
38.1
34.5
35.2
30.7
28.6
48.7
54.5
30.9
53.8
23.3
25.4
31.4
43.1
36.2
54.9
46.0
45.6
42.5
49.7
45.1
46.3
42.5
39.3
40.6
57.4
53.4
47.0
41.1
45.7
46.5
45.6
44.9
44.1
48.8
53.1
60.5
38.2
31.7
50.5
34.1
46.6
50.6
50.6
42.9
63.8
45.1
15.5
16.8
14.8
16.2
18.5
11.4
11.8
16.9
16.3
15.9
11.4
12.2
15.8
25.1
14.9
16.6
15.7
19.6
15.6
15.3
10.3
12.1
12.5
17.2
10.8
26.4
22.4
17.4
12.6
-
-
1.3
1.6
1.2
1.4
1.8
0.2
0.6
0.5
2.7
1.6
-
1.7
0.8
2.8
1.6
0.6
1.2
1.8
0.5
0.9
0.6
0.9
1.3
1.3
1.2
3.7
1.6
0.6
1.5
-
-
46
3. Degree of Involvement in Consideration Process
■Degree of involvement in consideration process (Total/Single answer)
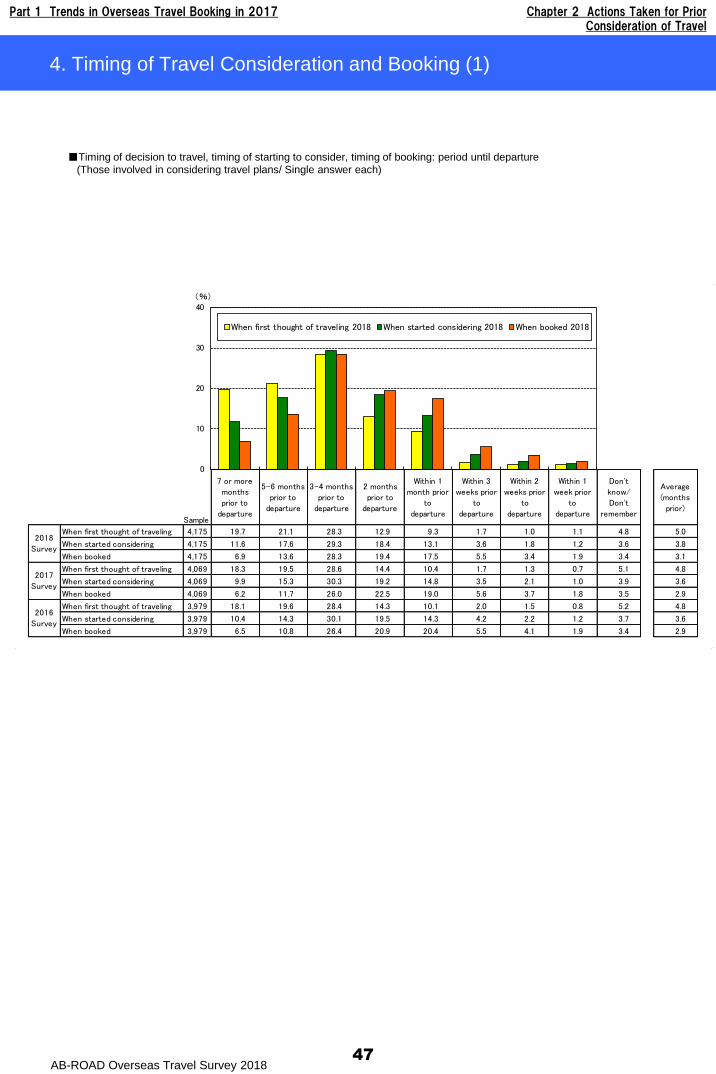
Part 1 Trends in Overseas Travel Booking in 2017 Chapter 2 Actions Taken for Prior Consideration of Travel
AB-ROAD Overseas Travel Survey 201847
4. Timing of Travel Consideration and Booking (1)
Sample
7 or more
months
prior to
departure
5-6 months
prior to
departure
3-4 months
prior to
departure
2 months
prior to
departure
Within 1
month prior
to
departure
Within 3
weeks prior
to
departure
Within 2
weeks prior
to
departure
Within 1
week prior
to
departure
Don't
know/
Don't
remember
Average
(months
prior)
When first thought of traveling 4,175 19.7 21.1 28.3 12.9 9.3 1.7 1.0 1.1 4.8 5.0
When started considering 4,175 11.6 17.6 29.3 18.4 13.1 3.6 1.8 1.2 3.6 3.8
When booked 4,175 6.9 13.6 28.3 19.4 17.5 5.5 3.4 1.9 3.4 3.1
When first thought of traveling 4,069 18.3 19.5 28.6 14.4 10.4 1.7 1.3 0.7 5.1 4.8
When started considering 4,069 9.9 15.3 30.3 19.2 14.8 3.5 2.1 1.0 3.9 3.6
When booked 4,069 6.2 11.7 26.0 22.5 19.0 5.6 3.7 1.8 3.5 2.9
When first thought of traveling 3,979 18.1 19.6 28.4 14.3 10.1 2.0 1.5 0.8 5.2 4.8
When started considering 3,979 10.4 14.3 30.1 19.5 14.3 4.2 2.2 1.2 3.7 3.6
When booked 3,979 6.5 10.8 26.4 20.9 20.4 5.5 4.1 1.9 3.4 2.9
2018
Survey
2017
Survey
2016
Survey
0
10
20
30
40
When first thought of traveling 2018 When started considering 2018 When booked 2018
(%)
■Timing of decision to travel, timing of starting to consider, timing of booking: period until departure
(Those involved in considering travel plans/ Single answer each)
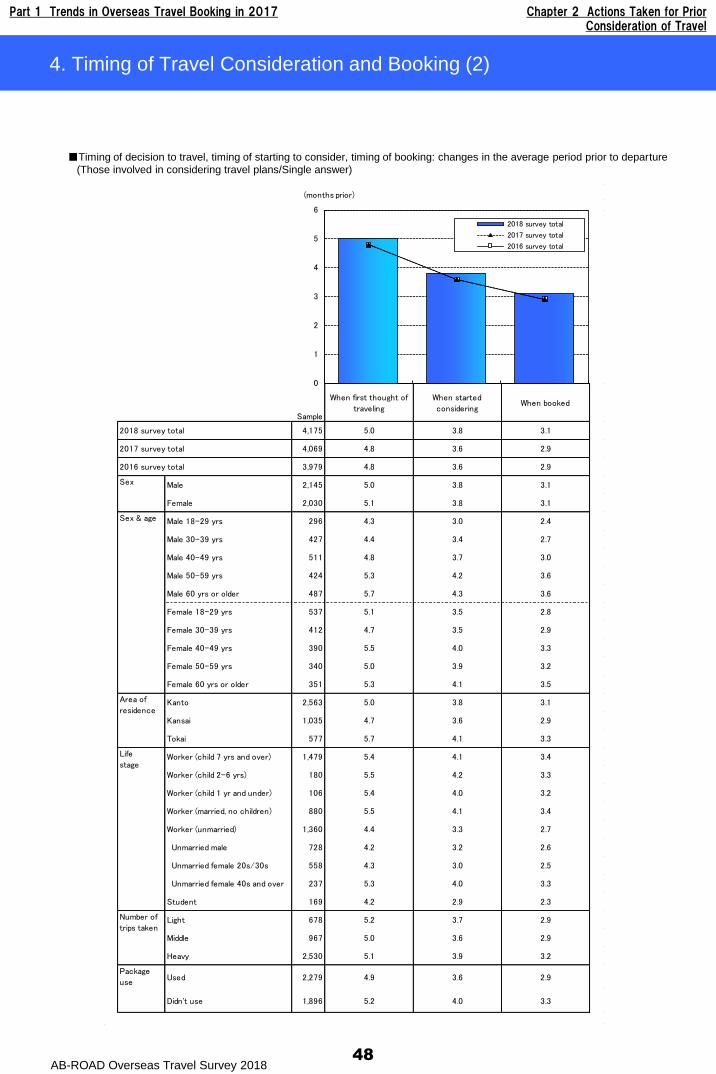
Part 1 Trends in Overseas Travel Booking in 2017 Chapter 2 Actions Taken for Prior Consideration of Travel
AB-ROAD Overseas Travel Survey 2018
Sample
When first thought of
traveling
When started
consideringWhen booked
4,175 5.0 3.8 3.1
4,069 4.8 3.6 2.9
2016 survey total 3,979 4.8 3.6 2.9
Male 2,145 5.0 3.8 3.1
Female 2,030 5.1 3.8 3.1
Male 18-29 yrs 296 4.3 3.0 2.4
Male 30-39 yrs 427 4.4 3.4 2.7
Male 40-49 yrs 511 4.8 3.7 3.0
Male 50-59 yrs 424 5.3 4.2 3.6
Male 60 yrs or older 487 5.7 4.3 3.6
Female 18-29 yrs 537 5.1 3.5 2.8
Female 30-39 yrs 412 4.7 3.5 2.9
Female 40-49 yrs 390 5.5 4.0 3.3
Female 50-59 yrs 340 5.0 3.9 3.2
Female 60 yrs or older 351 5.3 4.1 3.5
Kanto 2,563 5.0 3.8 3.1
Kansai 1,035 4.7 3.6 2.9
Tokai 577 5.7 4.1 3.3
Worker (child 7 yrs and over) 1,479 5.4 4.1 3.4
Worker (child 2-6 yrs) 180 5.5 4.2 3.3
Worker (child 1 yr and under) 106 5.4 4.0 3.2
Worker (married, no children) 880 5.5 4.1 3.4
Worker (unmarried) 1,360 4.4 3.3 2.7
Unmarried male 728 4.2 3.2 2.6
Unmarried female 20s/30s 558 4.3 3.0 2.5
Unmarried female 40s and over 237 5.3 4.0 3.3
Student 169 4.2 2.9 2.3
Light 678 5.2 3.7 2.9
Middle 967 5.0 3.6 2.9
Heavy 2,530 5.1 3.9 3.2
Used 2,279 4.9 3.6 2.9
Didn't use 1,896 5.2 4.0 3.3
2018 survey total
2017 survey total
Sex & age
Sex
Area of
residence
Life
stage
Number of
trips taken
Package
use
0
1
2
3
4
5
6
(months prior)
2018 survey total
2017 survey total
2016 survey total
48
4. Timing of Travel Consideration and Booking (2)
■Timing of decision to travel, timing of starting to consider, timing of booking: changes in the average period prior to departure
(Those involved in considering travel plans/Single answer)
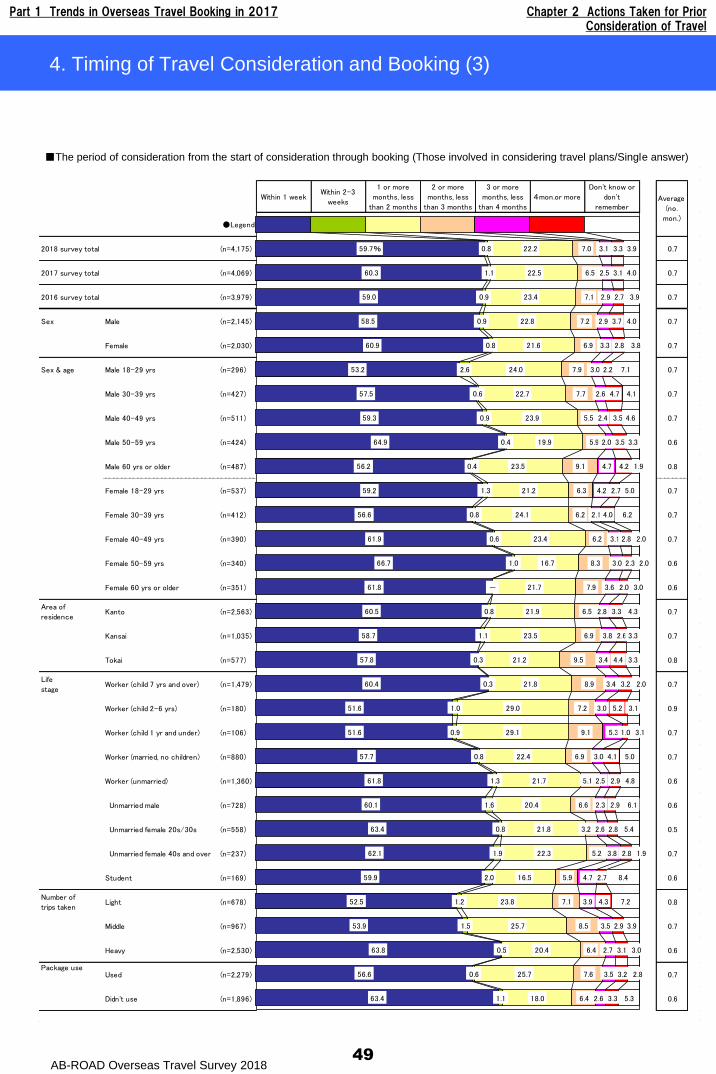
Part 1 Trends in Overseas Travel Booking in 2017 Chapter 2 Actions Taken for Prior Consideration of Travel
AB-ROAD Overseas Travel Survey 201849
4. Timing of Travel Consideration and Booking (3)
Within 1 weekWithin 2-3
weeks
1 or more
months, less
than 2 months
2 or more
months, less
than 3 months
3 or more
months, less
than 4 months
4mon.or more
Don't know or
don't
remember
●Legend
2018 survey total (n=4,175) 0.7
2017 survey total (n=4,069) 0.7
2016 survey total (n=3,979) 0.7
Sex Male (n=2,145) 0.7
Female (n=2,030) 0.7
Sex & age Male 18-29 yrs (n=296) 0.7
Male 30-39 yrs (n=427) 0.7
Male 40-49 yrs (n=511) 0.7
Male 50-59 yrs (n=424) 0.6
Male 60 yrs or older (n=487) 0.8
Female 18-29 yrs (n=537) 0.7
Female 30-39 yrs (n=412) 0.7
Female 40-49 yrs (n=390) 0.7
Female 50-59 yrs (n=340) 0.6
Female 60 yrs or older (n=351) 0.6
Area of
residenceKanto (n=2,563) 0.7
Kansai (n=1,035) 0.7
Tokai (n=577) 0.8
Life
stageWorker (child 7 yrs and over) (n=1,479) 0.7
Worker (child 2-6 yrs) (n=180) 0.9
Worker (child 1 yr and under) (n=106) 0.7
Worker (married, no children) (n=880) 0.7
Worker (unmarried) (n=1,360) 0.6
Unmarried male (n=728) 0.6
Unmarried female 20s/30s (n=558) 0.5
Unmarried female 40s and over (n=237) 0.7
Student (n=169) 0.6
Number of
trips takenLight (n=678) 0.8
Middle (n=967) 0.7
Heavy (n=2,530) 0.6
Used (n=2,279) 0.7
Didn't use (n=1,896) 0.6
Average
(no.
mon.)
Package use
59.7%
60.3
59.0
58.5
60.9
53.2
57.5
59.3
64.9
56.2
59.2
56.6
61.9
66.7
61.8
60.5
58.7
57.8
60.4
51.6
51.6
57.7
61.8
60.1
63.4
62.1
59.9
52.5
53.9
63.8
56.6
63.4
0.8
1.1
0.9
0.9
0.8
2.6
0.6
0.9
0.4
0.4
1.3
0.8
0.6
1.0
-
0.8
1.1
0.3
0.3
1.0
0.9
0.8
1.3
1.6
0.8
1.9
2.0
1.2
1.5
0.5
0.6
1.1
22.2
22.5
23.4
22.8
21.6
24.0
22.7
23.9
19.9
23.5
21.2
24.1
23.4
16.7
21.7
21.9
23.5
21.2
21.8
29.0
29.1
22.4
21.7
20.4
21.8
22.3
16.5
23.8
25.7
20.4
25.7
18.0
7.0
6.5
7.1
7.2
6.9
7.9
7.7
5.5
5.9
9.1
6.3
6.2
6.2
8.3
7.9
6.5
6.9
9.5
8.9
7.2
9.1
6.9
5.1
6.6
3.2
5.2
5.9
7.1
8.5
6.4
7.6
6.4
3.1
2.5
2.9
2.9
3.3
3.0
2.6
2.4
2.0
4.7
4.2
2.1
3.1
3.0
3.6
2.8
3.8
3.4
3.4
3.0
5.3
3.0
2.5
2.3
2.6
3.8
4.7
3.9
3.5
2.7
3.5
2.6
3.3
3.1
2.7
3.7
2.8
2.2
4.7
3.5
3.5
4.2
2.7
4.0
2.8
2.3
2.0
3.3
2.6
4.4
3.2
5.2
1.0
4.1
2.9
2.9
2.8
2.8
2.7
4.3
2.9
3.1
3.2
3.3
3.9
4.0
3.9
4.0
3.8
7.1
4.1
4.6
3.3
1.9
5.0
6.2
2.0
2.0
3.0
4.3
3.3
3.3
2.0
3.1
3.1
5.0
4.8
6.1
5.4
1.9
8.4
7.2
3.9
3.0
2.8
5.3
■The period of consideration from the start of consideration through booking (Those involved in considering travel plans/Single answer)
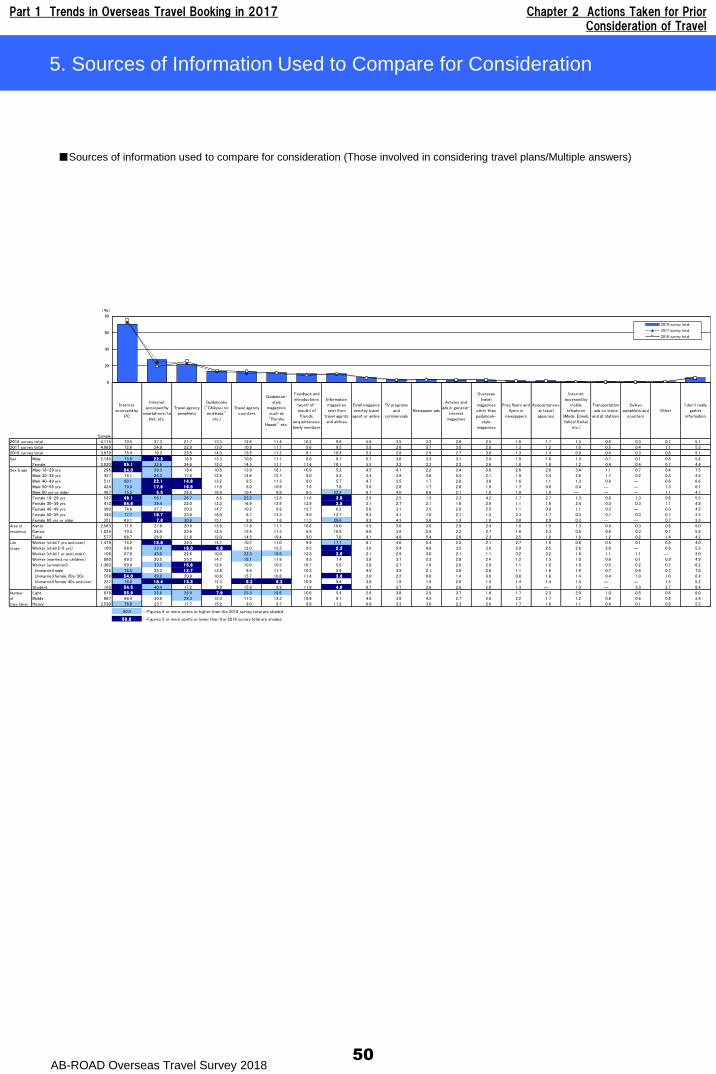
Part 1 Trends in Overseas Travel Booking in 2017 Chapter 2 Actions Taken for Prior Consideration of Travel
AB-ROAD Overseas Travel Survey 201850
5. Sources of Information Used to Compare for Consideration
Sample
Internet
accessed by
PC
Internet
accessed by
smartphone/ta
blet, etc.
Travel agency
pamphlets
Guidebooks
("Chikyuu no
arukikata,"
etc.)
Travel agency
counters
Guidebook-
style
magazines
such as
"Rurubu
Hawaii," etc.
Feedback and
introductions
(word-of-
mouth) of
friends,
acquaintances,
family members
Information
magazines
sent from
travel agents
and airlines
Email magazine
send by travel
agent or airline
TV programs
and
commercials
Newspaper ads
Articles and
ads in general-
interest
magazines
Overseas
travel
magazines
other than
guidebook-
style
magazines
Free flyers and
flyers in
newspapers
Acquaintances
at travel
agencies
Internet
accessed by
mobile
telephone
(iMode, Ezweb,
Yahoo! Keitai,
etc.)
Transportation
ads on trains
and at stations
Seikyo
pamphlets and
counters
Other
I don't really
gather
information
2018 survey total 4,175 70.5 27.3 21.7 13.3 12.6 11.4 10.2 9.9 5.6 3.5 3.3 2.6 2.5 1.8 1.7 1.3 0.6 0.3 0.7 5.1
2017 survey total 4,069 72.6 24.8 22.9 13.0 10.9 11.7 9.6 9.5 5.8 2.6 3.7 3.0 2.8 1.3 1.2 1.0 0.5 0.4 1.1 5.3
2016 survey total 3,979 75.4 19.3 25.5 14.3 13.5 11.2 8.1 10.4 5.3 2.8 2.9 2.7 3.0 1.3 1.4 0.9 0.4 0.3 0.8 5.1
Male 2,145 75.6 22 .3 18.9 13.3 10.8 11.1 8.9 9.7 5.7 3.6 3.3 3.1 2.4 1.9 1.6 1.4 0.7 0.1 0.8 5.8
Female 2,030 65 .1 32.6 24.6 13.3 14.5 11.7 11.6 10.1 5.5 3.3 3.3 2.2 2.6 1.8 1.8 1.2 0.4 0.4 0.7 4.4
Male 18-29 yrs 296 64 .0 39.3 18.4 10.5 13.9 16.1 10.9 5.2 4.5 4.1 2.2 3.4 3.0 2.6 2.6 3.4 1.1 0.7 0.4 7.5
Male 30-39 yrs 427 75.1 34.3 17.8 12.9 14.6 12.7 9.0 5.2 3.4 3.9 3.6 5.4 2.1 1.9 2.4 2.8 1.7 0.2 0.4 4.5
Male 40-49 yrs 511 80.1 22 .1 14 .8 13.2 8.5 11.3 8.0 5.7 4.7 3.5 1.7 2.8 3.0 1.6 1.1 1.3 0.9 ― 0.6 6.6
Male 50-59 yrs 424 79.0 17 .6 16 .5 11.9 8.0 10.9 7.6 7.8 5.6 2.8 1.7 2.0 1.9 1.7 0.6 0.4 ― ― 1.3 6.1
Male 60 yrs or older 487 75.5 5 .5 26.6 16.9 10.4 6.8 9.5 22.2 9.7 4.0 6.6 2.1 1.9 1.9 1.9 ― ― ― 1.1 4.7
Female 18-29 yrs 537 48 .1 56.1 26.7 8.8 23.3 12.8 11.6 3 .8 2.5 2.5 1.3 2.3 4.2 1.7 2.7 1.3 0.8 1.3 0.6 5.5
Female 30-39 yrs 412 64 .6 39.4 22.0 12.3 16.9 13.9 12.9 3 .5 2.1 2.7 2.1 1.6 2.9 1.1 1.6 2.4 0.3 0.3 1.1 4.8
Female 40-49 yrs 390 74.6 27.7 20.3 14.7 10.2 9.9 12.7 6.2 5.6 3.1 2.3 2.8 2.5 1.1 0.8 1.1 0.3 ― 0.3 4.5
Female 50-59 yrs 340 77.7 18 .7 23.0 18.0 8.7 13.3 9.0 12.7 9.3 4.7 7.0 2.7 1.3 2.3 1.7 0.3 0.7 0.3 0.7 3.3
Female 60 yrs or older 351 69.1 7 .6 30.6 15.1 8.9 7.6 11.5 29.6 9.9 4.3 5.6 1.3 1.0 3.0 2.0 0.3 ― ― 0.7 3.3
Kanto 2,563 71.5 27.9 20.9 13.9 11.8 11.7 10.6 10.0 5.5 3.0 3.0 2.9 2.4 1.8 1.5 1.3 0.4 0.3 0.6 5.0
Kansai 1,035 70.3 26.4 23.6 12.5 13.4 11.3 9.8 10.9 6.6 3.9 2.9 2.3 2.7 1.6 2.3 0.8 0.8 0.3 0.7 5.9
Tokai 577 66.7 26.0 21.8 12.0 14.5 10.4 9.0 7.8 4.1 4.8 5.4 2.0 2.3 2.5 1.8 1.9 1.2 0.2 1.4 4.2
Worker (child 7 yrs and over) 1,479 74.2 15 .8 26.3 14.7 10.7 11.0 9.9 17.1 8.1 4.0 5.4 2.2 2.1 2.7 1.9 0.8 0.5 0.1 0.5 4.0
Worker (child 2-6 yrs) 180 68.4 33.9 16 .0 6 .8 12.0 15.3 8.5 2 .3 3.6 5.4 4.8 3.5 3.9 2.9 2.5 2.6 2.0 ― 0.6 5.3
Worker (child 1 yr and under) 106 67.0 45.0 22.6 10.0 22.3 19.5 12.8 3 .6 2.1 2.9 3.0 2.1 1.1 3.2 3.2 1.8 1.1 1.1 ― 3.0
Worker (married, no children) 880 69.3 30.5 25.2 14.7 18.1 11.9 9.5 7.4 5.9 3.7 2.3 2.9 2.4 1.2 1.3 1.0 0.6 0.1 0.9 4.9
Worker (unmarried) 1,360 69.9 33.8 15 .6 12.4 10.0 10.5 10.7 5.8 3.8 2.7 1.6 2.8 2.9 1.1 1.9 1.8 0.5 0.2 0.7 6.2
Unmarried male 728 76.5 28.3 12 .7 13.4 8.6 11.7 10.3 5.9 4.5 3.3 2.1 3.9 2.6 1.1 1.6 1.9 0.7 0.4 0.7 7.0
Unmarried female 20s/30s 558 54 .0 49.8 20.9 10.6 15.7 10.8 11.4 3 .6 2.0 2.2 0.8 1.4 3.6 0.8 1.8 1.4 0.4 1.0 1.0 6.4
Unmarried female 40s and over 237 76.6 18 .4 13 .3 12.3 5 .2 6 .2 10.9 9.6 3.8 1.9 1.9 2.8 1.4 1.4 1.4 1.4 ― ― 1.4 5.2
Student 169 54 .5 40.4 17.2 9.9 15.9 9.9 11.9 4 .6 0.7 2.7 2.6 2.6 2.0 1.3 ― 1.3 ― 3.3 2.7 8.4
Light 678 55 .9 35.6 26.9 7 .9 23.3 16.6 10.6 5.4 2.9 3.8 2.9 3.7 1.9 1.7 2.3 2.0 1.0 0.5 0.6 6.0
Middle 967 66.4 30.8 28.3 12.3 17.3 12.3 10.9 9.7 4.9 3.8 4.3 2.7 2.6 2.2 1.7 1.2 0.8 0.6 0.6 3.4
Heavy 2,530 76.0 23.7 17.7 15.2 8.0 9.7 9.8 11.2 6.6 3.3 3.0 2.3 2.6 1.7 1.6 1.1 0.4 0.1 0.8 5.5
50.0 …Figures 5 or more points or higher than the 2018 survey total are shaded.
50 .0 …Figures 5 or more points or lower than the 2018 survey total are shaded.
Number
of
trips taken
Area of
residence
Sex & age
Sex
Life
stage
0
20
40
60
80
2018 survey total
2017 survey total
2016 survey total
(%)
■Sources of information used to compare for consideration (Those involved in considering travel plans/Multiple answers)
51
Chapter 3
Process of Package Tour Selection
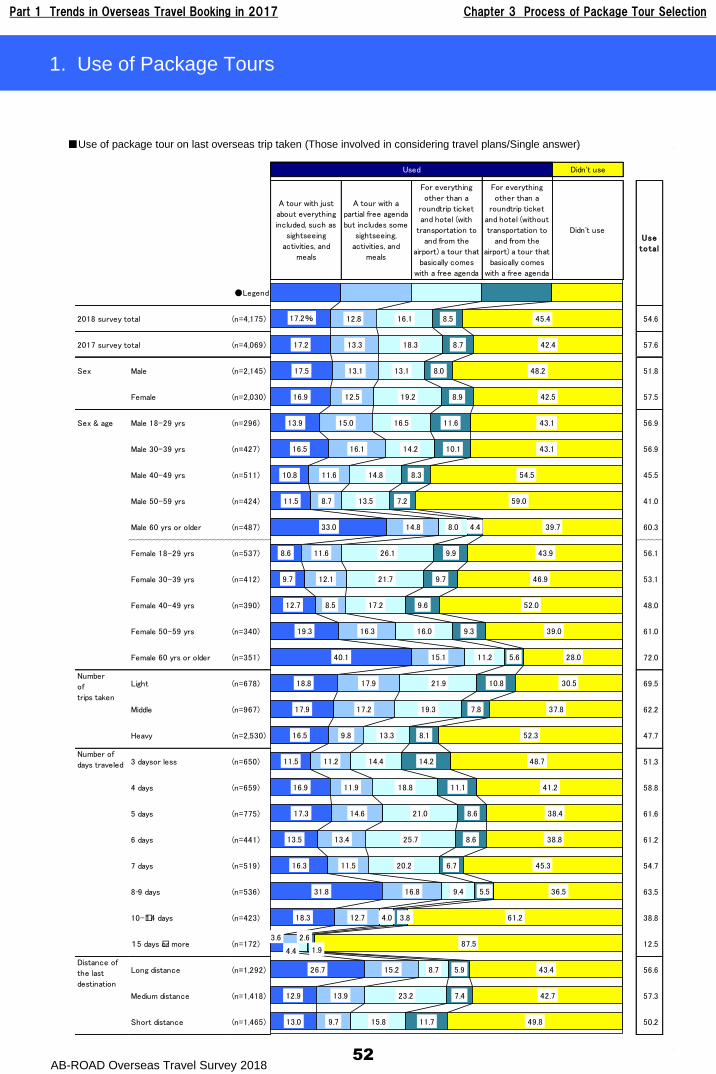
Part 1 Trends in Overseas Travel Booking in 2017 Chapter 3 Process of Package Tour Selection
AB-ROAD Overseas Travel Survey 2018
Didn't use
A tour with just
about everything
included, such as
sightseeing
activities, and
meals
A tour with a
partial free agenda
but includes some
sightseeing,
activities, and
meals
For everything
other than a
roundtrip ticket
and hotel (with
transportation to
and from the
airport) a tour that
basically comes
with a free agenda
For everything
other than a
roundtrip ticket
and hotel (without
transportation to
and from the
airport) a tour that
basically comes
with a free agenda
Didn't use
●Legend
2018 survey total (n=4,175) 54.6
2017 survey total (n=4,069) 57.6
Sex Male (n=2,145) 51.8
Female (n=2,030) 57.5
Sex & age Male 18-29 yrs (n=296) 56.9
Male 30-39 yrs (n=427) 56.9
Male 40-49 yrs (n=511) 45.5
Male 50-59 yrs (n=424) 41.0
Male 60 yrs or older (n=487) 60.3
Female 18-29 yrs (n=537) 56.1
Female 30-39 yrs (n=412) 53.1
Female 40-49 yrs (n=390) 48.0
Female 50-59 yrs (n=340) 61.0
Female 60 yrs or older (n=351) 72.0
Light (n=678) 69.5
Middle (n=967) 62.2
Heavy (n=2,530) 47.7
3 days or less (n=650) 51.3
4 days (n=659) 58.8
5 days (n=775) 61.6
6 days (n=441) 61.2
7 days (n=519) 54.7
8-9 days (n=536) 63.5
10-14 days (n=423) 38.8
15 days or more (n=172) 12.5
Long distance (n=1,292) 56.6
Medium distance (n=1,418) 57.3
Short distance (n=1,465) 50.2
Distance of
the last
destination
Used
Use
to tal
Number
of
trips taken
Number of
days traveled
17.2%
17.2
17.5
16.9
13.9
16.5
10.8
11.5
33.0
8.6
9.7
12.7
19.3
40.1
18.8
17.9
16.5
11.5
16.9
17.3
13.5
16.3
31.8
18.3
3.6
26.7
12.9
13.0
12.8
13.3
13.1
12.5
15.0
16.1
11.6
8.7
14.8
11.6
12.1
8.5
16.3
15.1
17.9
17.2
9.8
11.2
11.9
14.6
13.4
11.5
16.8
12.7
4.4
15.2
13.9
9.7
16.1
18.3
13.1
19.2
16.5
14.2
14.8
13.5
8.0
26.1
21.7
17.2
16.0
11.2
21.9
19.3
13.3
14.4
18.8
21.0
25.7
20.2
9.4
4.0
2.6
8.7
23.2
15.8
8.5
8.7
8.0
8.9
11.6
10.1
8.3
7.2
4.4
9.9
9.7
9.6
9.3
5.6
10.8
7.8
8.1
14.2
11.1
8.6
8.6
6.7
5.5
3.8
1.9
5.9
7.4
11.7
45.4
42.4
48.2
42.5
43.1
43.1
54.5
59.0
39.7
43.9
46.9
52.0
39.0
28.0
30.5
37.8
52.3
48.7
41.2
38.4
38.8
45.3
36.5
61.2
87.5
43.4
42.7
49.8
52
1. Use of Package Tours
■Use of package tour on last overseas trip taken (Those involved in considering travel plans/Single answer)
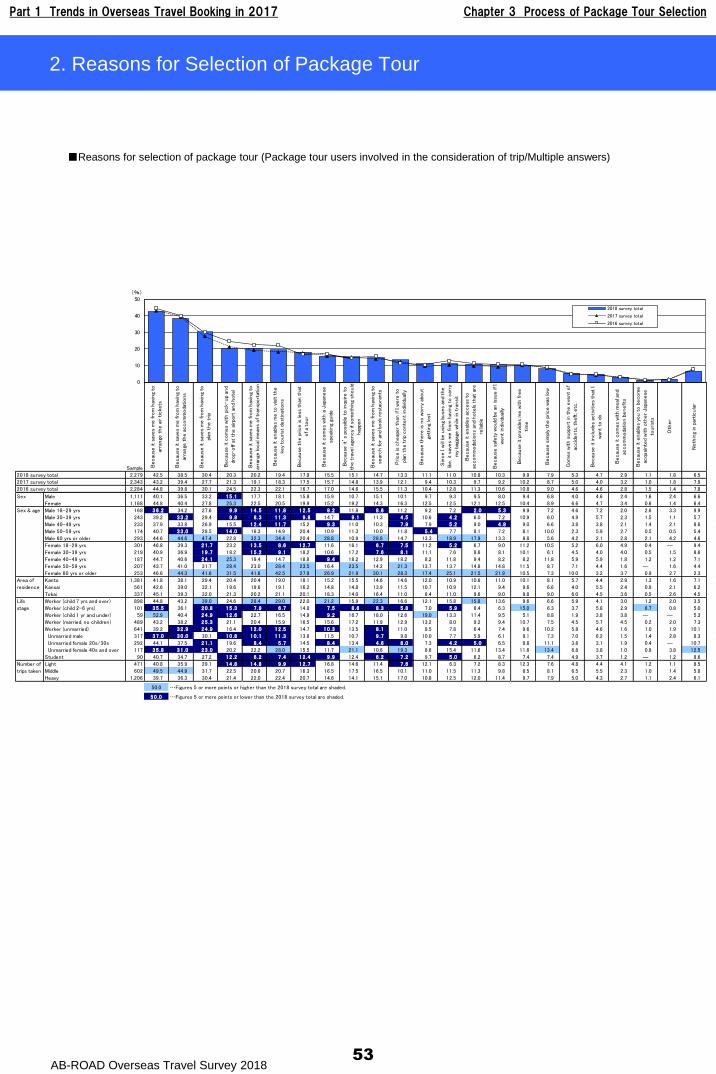
Part 1 Trends in Overseas Travel Booking in 2017 Chapter 3 Process of Package Tour Selection
AB-ROAD Overseas Travel Survey 201853
2. Reasons for Selection of Package Tour
Sample Becau
se it
sav
es
me fro
m h
avin
g to
arra
nge
the a
ir t
icke
ts
Becau
se it
sav
es
me fro
m h
avin
g to
arra
nge
the a
ccom
moda
tions
Becau
se it
sav
es
me fro
m h
avin
g to
plan
the t
rip
Becau
se it
com
es
with p
ick-
up
and
drop-
off a
t th
e a
irpo
rt a
nd
hote
l
Becau
se it
sav
es
me fro
m h
avin
g to
arra
nge
local
mean
s of tr
ansp
ort
atio
n
Becau
se it
enab
les
me t
o v
isit t
he
key
tourist
dest
inat
ions
Becau
se t
he p
rice is
less
than
that
of a
tour
Becau
se it
com
es
with a
Jap
anese
speak
ing
guid
e
Becau
se it
’s
poss
ible
to in
quire t
o
the t
rave
l age
ncy
if so
meth
ing
should
hap
pen
Becau
se it
sav
es
me fro
m h
avin
g to
sear
ch for
and
book
rest
aura
nts
Price is
cheap
er
than
if I w
ere
to
plan
the t
rip
conte
nt
indi
vidu
ally
Becau
se t
here
is n
o w
orr
y ab
out
gett
ing
lost
Sin
ce I w
ill b
e u
sing
buse
s an
d th
e
like, i
t sa
ves
me fro
m h
avin
g to
car
ry
my
bagg
age w
hile
in t
ransi
t
Becau
se it
enab
les
access
to
accom
moda
tions
and
hote
ls t
hat
are
relia
ble
Becau
se s
afety
would
be a
n is
sue if
I
went
indi
vidu
ally
Becau
se it
pro
vide
s m
e w
ith fre
e
tim
e
Becau
se s
impl
y th
e p
rice w
as lo
w
Com
es
with s
upp
ort
in t
he e
vent
of
accid
ents
, theft
, etc
.
Becau
se it
inclu
des
activi
ties
that
I
wan
t to
do
Becau
se it
com
es
with m
eal
and
accom
moda
tion b
enefit
s
Becau
se it
enab
les
you t
o b
ecom
e
acqu
ainte
d w
ith o
ther
Jap
anese
tourist
s
Oth
er
Noth
ing
in p
articula
r
2018 survey total 2,279 42.5 38.5 30.4 20.3 20.2 19.4 17.9 15.5 15.1 14.7 13.3 11.1 11.0 10.8 10.3 9.9 7.9 5.3 4.7 2.9 1.1 1.8 6.5
2017 survey total 2,343 43.2 39.4 27.7 21.3 19.1 18.3 17.5 15.7 14.8 13.9 12.1 9.4 10.3 9.7 9.2 10.2 8.7 5.0 4.0 3.2 1.0 1.8 7.9
2016 survey total 2,284 44.8 39.8 30.1 24.5 22.3 22.1 16.7 17.0 14.6 15.5 11.3 10.4 12.8 11.3 10.6 10.8 9.0 4.6 4.6 2.8 1.5 1.4 7.8
Male 1,111 40.1 36.5 33.2 15 .1 17.7 18.1 15.8 15.9 10.7 15.1 10.1 9.7 9.3 9.5 8.0 9.4 6.8 4.0 4.6 2.4 1.6 2.4 6.6
Female 1,168 44.8 40.4 27.8 25.3 22.5 20.5 19.9 15.2 19.2 14.3 16.3 12.5 12.5 12.1 12.5 10.4 8.9 6.6 4.7 3.4 0.6 1.4 6.4
Male 18-29 yrs 168 36 .2 34.2 27.6 9 .9 14 .5 11 .8 12 .5 9 .2 11.8 8 .6 11.2 9.2 7.2 2 .0 5 .3 9.9 7.2 4.6 7.2 2.0 2.6 3.3 9.9
Male 30-39 yrs 243 39.2 33 .2 29.4 9 .8 8 .3 11 .3 9 .8 14.7 9 .1 11.3 4 .5 10.6 4 .2 6.0 7.2 10.9 6.0 4.9 5.7 2.3 1.5 1.1 5.7
Male 40-49 yrs 233 37.9 33.8 26.9 15.5 12 .4 11 .7 15.2 9 .3 11.0 10.3 7 .9 7.9 5 .2 9.0 4 .8 9.0 6.6 3.8 3.8 2.1 1.4 2.1 8.6
Male 50-59 yrs 174 40.7 33 .0 28.5 14 .0 16.3 14.9 20.4 10.9 11.3 10.0 11.8 5 .4 7.7 8.1 7.2 8.1 10.0 2.3 5.9 2.7 0.5 0.5 5.4
Male 60 yrs or older 293 44.6 44.6 47.4 22.8 32.3 34.4 20.4 28.8 10.9 28.8 14.7 13.3 18.9 17.9 13.3 8.8 5.6 4.2 2.1 2.8 2.1 4.2 4.6
Female 18-29 yrs 301 46.8 39.3 21 .7 23.2 13 .5 8 .6 12 .7 11.6 16.1 6 .7 7 .5 11.2 5 .2 6.7 9.0 11.2 10.5 5.2 6.0 4.9 0.4 ― 9.4
Female 30-39 yrs 219 40.9 36.9 19 .7 18.2 15 .2 9 .1 18.2 10.6 17.2 7 .6 8 .1 11.1 7.6 8.6 8.1 10.1 6.1 4.5 4.0 4.0 0.5 1.5 8.6
Female 40-49 yrs 187 44.7 40.6 24 .1 25.3 19.4 14.7 18.8 9 .4 18.2 12.9 18.2 8.2 11.8 9.4 8.2 8.2 11.8 5.9 5.9 1.8 1.2 1.2 7.1
Female 50-59 yrs 207 43.7 41.0 31.7 28.4 23.0 28.4 23.5 16.4 23.5 14.2 21.3 13.7 13.7 14.8 14.8 11.5 8.7 7.1 4.4 1.6 ― 1.6 4.4
Female 60 yrs or older 253 46.6 44.3 41.6 31.5 41.6 42.5 27.9 26.9 21.9 30.1 28.3 17.4 25.1 21.5 21.9 10.5 7.3 10.0 3.2 3.7 0.9 2.7 2.3
Kanto 1,381 41.8 38.1 29.4 20.4 20.4 19.0 18.1 15.2 15.5 14.6 14.6 12.0 10.9 10.6 11.0 10.1 8.1 5.7 4.4 2.9 1.3 1.6 7.1
Kansai 561 42.6 39.0 32.1 19.6 19.6 19.1 16.2 14.8 14.8 13.9 11.5 10.7 10.9 12.1 9.4 9.6 6.6 4.0 5.5 2.4 0.9 2.1 6.2
Tokai 337 45.1 39.3 32.0 21.3 20.2 21.1 20.1 18.3 14.0 16.4 11.0 8.4 11.0 9.6 9.0 9.8 9.0 6.0 4.5 3.6 0.5 2.6 4.5
Worker (child 7 yrs and over) 898 44.8 43.2 39.0 24.6 28.4 29.0 22.0 21.2 15.9 22.3 16.6 12.1 15.8 15.8 13.6 9.6 6.6 5.9 4.1 3.0 1.2 2.0 3.5
Worker (child 2-6 yrs) 101 35 .5 36.1 20 .8 15 .3 7 .9 6 .7 14.8 7 .5 8 .6 8 .3 5 .8 7.0 5 .9 6.4 6.3 15.0 6.3 3.7 5.8 2.9 6.7 0.8 5.0
Worker (child 1 yr and under) 59 52.9 40.4 24 .9 12 .6 22.7 16.5 14.9 9 .2 16.7 18.0 12.6 19.0 13.3 11.4 9.5 5.1 8.8 1.9 3.8 3.8 ― ― 5.3
Worker (married, no children) 489 43.2 38.2 25 .3 21.1 20.4 15.9 16.5 15.6 17.2 11.9 12.9 13.2 8.0 9.2 9.4 10.7 7.5 4.5 5.7 4.5 0.2 2.0 7.3
Worker (unmarried) 641 39.2 32 .9 24 .9 16.4 12 .0 12 .5 14.7 10 .3 13.5 8 .1 11.0 8.5 7.8 6.4 7.4 9.6 10.2 5.8 4.6 1.6 1.0 1.9 10.1
Unmarried male 317 37 .0 30 .0 30.1 10 .8 10 .1 11 .3 13.8 11.5 10.7 9 .7 9.8 10.0 7.7 5.9 6.1 9.1 7.3 7.0 6.2 1.5 1.4 2.8 8.3
Unmarried female 20s/30s 292 44.1 37.5 21 .1 19.6 8 .4 5 .7 14.5 8 .4 13.4 4 .6 8 .0 7.3 4 .2 5 .0 6.5 8.8 11.1 3.8 3.1 1.9 0.4 ― 10.7
Unmarried female 40s and over 117 35 .8 31 .0 23 .0 20.2 22.2 28.0 15.5 11.7 21.1 10.6 19.3 8.6 15.4 11.6 13.4 11.6 13.4 6.8 3.8 1.0 0.9 3.8 12.5
Student 90 40.7 34.7 27.2 12 .2 6 .2 7 .4 12 .4 9 .9 12.4 6 .2 7 .2 9.7 5 .0 6.2 8.7 7.4 7.4 4.9 3.7 1.2 ― 1.2 8.6
Light 471 40.8 35.9 29.1 14 .8 14 .8 9 .9 12 .7 16.8 14.6 11.4 7 .6 12.1 6.3 7.2 8.3 12.3 7.6 4.8 4.4 4.1 1.2 1.1 8.5
Middle 602 49.5 44.9 31.7 22.5 20.6 20.7 16.3 16.5 17.5 16.5 10.1 11.0 11.5 11.3 9.8 8.5 8.1 6.5 5.5 2.3 1.0 1.4 5.8
Heavy 1,206 39.7 36.3 30.4 21.4 22.0 22.4 20.7 14.6 14.1 15.1 17.0 10.8 12.5 12.0 11.4 9.7 7.9 5.0 4.3 2.7 1.1 2.4 6.1
50.0 …Figures 5 or more points or higher than the 2018 survey total are shaded.
50 .0 …Figures 5 or more points or lower than the 2018 survey total are shaded.
Number of
trips taken
Area of
residence
Sex & age
Sex
Life
stage
0
10
20
30
40
50
2018 survey total
2017 survey total
2016 survey total
(%)
■Reasons for selection of package tour (Package tour users involved in the consideration of trip/Multiple answers)
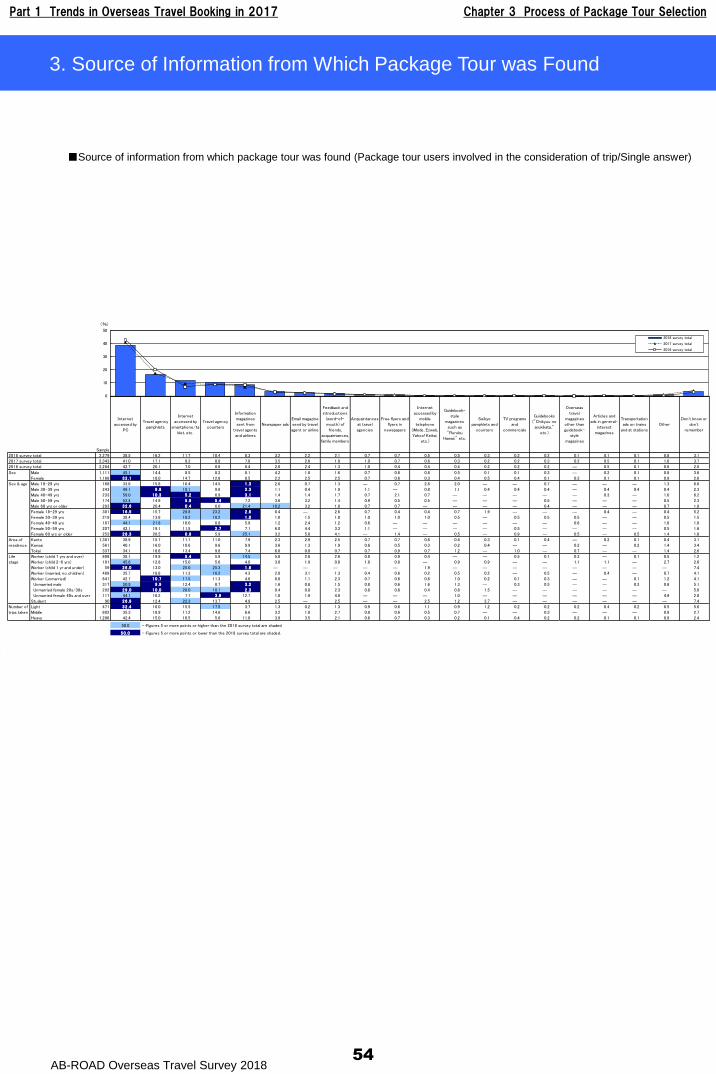
Part 1 Trends in Overseas Travel Booking in 2017 Chapter 3 Process of Package Tour Selection
AB-ROAD Overseas Travel Survey 2018
Sample
Internet
accessed by
PC
Travel agency
pamphlets
Internet
accessed by
smartphone/ta
blet, etc.
Travel agency
counters
Information
magazines
sent from
travel agents
and airlines
Newspaper ads
Email magazine
send by travel
agent or airline
Feedback and
introductions
(word-of-
mouth) of
friends,
acquaintances,
family members
Acquaintances
at travel
agencies
Free flyers and
flyers in
newspapers
Internet
accessed by
mobile
telephone
(iMode, Ezweb,
Yahoo! Keitai,
etc.)
Guidebook-
style
magazines
such as
"Rurubu
Hawaii," etc.
Seikyo
pamphlets and
counters
TV programs
and
commercials
Guidebooks
("Chikyuu no
arukikata,"
etc.)
Overseas
travel
magazines
other than
guidebook-
style
magazines
Articles and
ads in general-
interest
magazines
Transportation
ads on trains
and at stations
Other
Don't know or
don't
remember
2018 survey total 2,279 38.5 16.2 11.7 10.4 8.3 3.2 2.2 2.1 0.7 0.7 0.5 0.5 0.3 0.2 0.2 0.1 0.1 0.1 0.8 3.1
2017 survey total 2,343 41.0 17.1 9.3 8.8 7.0 3.5 2.6 1.9 1.0 0.7 0.6 0.3 0.2 0.2 0.3 0.2 0.5 0.1 1.0 3.7
2016 survey total 2,284 42.7 20.1 7.0 8.6 8.4 2.8 2.4 1.3 1.0 0.4 0.4 0.4 0.2 0.2 0.2 ― 0.5 0.1 0.6 2.8
Male 1,111 45.1 14.4 8.5 8.2 8.1 4.2 1.8 1.6 0.7 0.8 0.8 0.5 0.1 0.1 0.3 ― 0.2 0.1 0.8 3.6
Female 1,168 32 .1 18.0 14.7 12.6 8.5 2.2 2.5 2.5 0.7 0.6 0.3 0.4 0.5 0.4 0.1 0.3 0.1 0.1 0.9 2.6
Male 18-29 yrs 168 33.6 15.8 16.4 14.5 1 .3 2.6 0.7 1.3 ― 0.7 2.6 2.0 ― ― 0.7 ― ― ― 1.3 6.6
Male 30-39 yrs 243 49.1 9 .8 18.1 9.8 2 .3 1.1 0.4 1.9 1.1 ― 0.8 1.1 0.4 0.4 0.4 ― 0.4 0.4 0.4 2.3
Male 40-49 yrs 233 59.0 10 .3 5 .2 6.9 3 .1 1.4 1.4 1.7 0.7 2.1 0.7 ― ― ― ― ― 0.3 ― 1.0 6.2
Male 50-59 yrs 174 53.4 14.9 5 .9 5 .4 7.2 3.6 3.2 1.4 0.9 0.5 0.5 ― ― ― 0.5 ― ― ― 0.5 2.3
Male 60 yrs or older 293 32 .6 20.4 0 .4 6.0 21.4 10.2 3.2 1.8 0.7 0.7 ― ― ― ― 0.4 ― ― ― 0.7 1.8
Female 18-29 yrs 301 16 .5 15.7 28.8 23.2 2 .6 0.4 ― 2.6 0.7 0.4 0.4 0.7 1.9 ― ― ― 0.4 ― 0.4 5.2
Female 30-39 yrs 219 38.4 13.6 18.2 18.2 1 .0 1.0 1.5 1.0 1.0 1.0 1.0 0.5 ― 0.5 0.5 0.5 ― ― 0.5 1.5
Female 40-49 yrs 187 44.1 21.8 10.0 8.8 5.9 1.2 2.4 1.2 0.6 ― ― ― ― ― ― 0.6 ― ― 1.8 1.8
Female 50-59 yrs 207 42.1 19.1 11.5 2 .7 7.1 6.0 4.4 3.3 1.1 ― ― ― ― 0.5 ― ― ― ― 0.5 1.6
Female 60 yrs or older 253 28 .3 20.5 0 .9 5.9 25.1 3.2 5.0 4.1 ― 1.4 ― 0.5 ― 0.9 ― 0.5 ― 0.5 1.4 1.8
Kanto 1,381 38.9 15.7 11.7 11.0 7.9 2.3 2.9 2.5 0.7 0.7 0.6 0.4 0.3 0.1 0.4 ― 0.2 0.1 0.4 3.1
Kansai 561 40.1 16.0 10.6 9.6 9.9 3.6 1.3 1.9 0.6 0.5 0.3 0.2 0.4 ― ― 0.2 ― 0.2 1.4 3.4
Tokai 337 34.1 18.6 13.4 9.8 7.4 6.0 0.8 0.7 0.7 0.9 0.7 1.2 ― 1.0 ― 0.7 ― ― 1.4 2.6
Worker (child 7 yrs and over) 898 38.1 19.9 5 .4 5.9 14.5 5.8 2.8 2.6 0.8 0.9 0.4 ― ― 0.5 0.1 0.3 ― 0.1 0.5 1.2
Worker (child 2-6 yrs) 101 45.6 12.8 15.0 5.6 4.0 3.0 1.9 0.8 1.8 0.8 ― 0.9 0.9 ― ― 1.1 1.1 ― 2.7 2.0
Worker (child 1 yr and under) 59 26 .0 13.0 25.0 25.3 1 .6 ― ― ― ― ― 1.9 ― ― ― ― ― ― ― ― 7.4
Worker (married, no children) 489 35.7 18.6 11.3 16.2 4.3 2.0 3.1 1.3 0.4 0.6 0.2 0.5 0.2 ― 0.5 ― 0.4 ― 0.7 4.1
Worker (unmarried) 641 42.7 10 .7 17.5 11.3 4.6 0.8 1.1 2.3 0.7 0.6 0.6 1.0 0.2 0.1 0.3 ― ― 0.1 1.2 4.1
Unmarried male 317 50.9 9 .9 12.4 8.7 3 .2 1.6 0.8 1.5 0.8 0.6 1.6 1.3 ― 0.3 0.5 ― ― 0.3 0.6 5.1
Unmarried female 20s/30s 292 29 .0 10 .0 28.0 18.1 2 .3 0.4 0.8 2.3 0.8 0.8 0.4 0.8 1.5 ― ― ― ― ― ― 5.0
Unmarried female 40s and over 117 44.1 16.2 7.7 3 .9 12.7 1.0 1.9 4.8 ― ― ― 1.0 ― ― ― ― ― ― 4.9 2.0
Student 90 26 .9 12.4 22.3 13.7 4.9 2.5 ― 2.5 ― ― 2.5 1.2 3.7 ― ― ― ― ― ― 7.4
Light 471 32 .4 16.0 15.5 17.5 3.7 1.3 0.2 1.3 0.9 0.6 1.1 0.9 1.2 0.2 0.2 0.2 0.4 0.2 0.5 5.6
Middle 602 35.3 18.9 11.2 14.6 6.6 3.2 1.0 2.7 0.8 0.6 0.5 0.7 ― ― 0.3 ― ― ― 0.9 2.7
Heavy 1,206 42.4 15.0 10.5 5.6 11.0 3.9 3.5 2.1 0.6 0.7 0.3 0.2 0.1 0.4 0.2 0.2 0.1 0.1 0.9 2.4
50.0 …Figures 5 or more points or higher than the 2018 survey total are shaded.
50 .0 …Figures 5 or more points or lower than the 2018 survey total are shaded.
Number of
trips taken
Area of
residence
Sex & age
Sex
Life
stage
0
10
20
30
40
50
2018 survey total
2017 survey total
2016 survey total
(%)
54
3. Source of Information from Which Package Tour was Found
■Source of information from which package tour was found (Package tour users involved in the consideration of trip/Single answer)

Part 1 Trends in Overseas Travel Booking in 2017 Chapter 3 Process of Package Tour Selection
AB-ROAD Overseas Travel Survey 201855
4. Points Considered Important Factors When Selecting Package
Items considered important
2018 survey by number of trips
Light Middle Heavy
(n=2,279) (n=2,343) (n=471) (n=602) (n=1,206)
Price is cheap for the content 46.7 47.4 41.3 49.5 47.4
Cheap 22.9 24.6 28.5 26.6 18.8
Can pay by credit card 21.2 19.1 14.0 19.3 25.0
Includes spots I want to go to 17.4 16.5 11.7 14.8 20.9
Content/Breakdown of the price indicated is clear 15.7 15.5 10.9 14.4 18.2
There is a lot of free time 12.9 14.2 14.5 13.2 12.1
Can visit many tourist spots 9.7 8.8 6.8 10.7 10.3
There is city sightseeing 9.6 8.4 6.3 10.4 10.5
Discounts are available for early reservations 7.9 8.0 8.2 9.1 7.1
Time stayed at destination is long 6.9 6.5 4.4 7.4 7.6
There is no city sightseeing 1.9 3.0 1.3 1.3 2.4
Discounts are available for children 1.1 1.8 1.2 1.7 0.8
It is an assuring airline 28.5 27.4 26.9 28.1 29.2
There are direct flights 17.0 17.1 14.5 16.0 18.6
It is a well-known airline 10.3 9.2 8.3 11.5 10.5
It is a Japanese airline 8.4 9.4 4.9 7.9 10.1
Is a flight that meets my schedule and connecting flights 7.3 6.8 6.0 7.9 7.6
Departs from nearest airport 6.7 6.0 4.6 8.1 6.8
Premium economy or business class or better 4.5 3.6 1.9 2.3 6.7
Aircraft amenities (width of seats, etc.) are good 3.6 3.1 1.8 2.1 5.0
Aircraft equipment is good (new, clean) 3.5 2.9 1.6 2.3 4.9
I accrue miles / the additional terms are good for the airline I use or an affiliated airline 2.6 2.4 1.1 0.9 4.1
Is a Low-Cost Carrier 1.8 1.5 2.0 1.9 1.8
Is not a Low-Cost Carrier 1.3 0.9 1.8 1.4 1.1
Hotel grade is high / well known 16.5 15.2 12.2 17.7 17.5
Tourist spots are close to accommodations 11.9 11.4 11.4 12.4 11.8
Hotel is designated 11.0 12.7 7.8 9.7 13.0
Transportation is provided to and from hotel 8.6 8.2 10.1 10.1 7.3
There is Japanese staff or Japanese is spoken 8.5 8.2 11.5 10.3 6.4
Hotel room seems clean 6.3 6.9 6.2 7.3 5.9
Closest station, bus stop or metro is close to accommodations 6.2 5.8 4.7 6.6 6.5
Is a hotel with sense of luxury 6.1 6.2 3.7 6.6 6.9
Has Internet access 4.9 4.2 4.1 6.2 4.6
Scenery around the accommodations is nice 4.6 5.2 4.4 5.2 4.5
Has a quiet and subdued ambiance 4.4 3.9 3.8 4.1 4.9
Desired bath/toilet is provided 4.1 3.7 3.4 4.2 4.3
Hotel offers a wide array of facilities such as a spa, pool, gym, etc. 3.9 3.7 3.0 4.2 4.2
Room is spacious 3.7 3.8 2.9 3.8 3.9
Airport is close to accommodations 3.2 2.5 3.2 3.5 3.0
View from room 3.1 3.5 2.7 4.1 2.7
Hotel food is sumptuous 3.0 2.4 3.1 3.0 3.0
Desired bedding is provided 2.1 2.4 2.1 2.2 2.1
Hotel offers a wide array of amenities 1.9 2.2 1.7 2.1 1.9
I like the interior décor of the hotel room 1.8 1.5 1.6 1.6 2.0
Has local color/flavor 1.8 1.6 1.9 1.5 1.9
Early check-in / late check-out is available 0.9 0.8 0.2 1.5 0.9
Is barrier free 0.5 0.8 0.4 0.4 0.5
Travel agency is very reliable 32.6 29.0 27.7 33.3 34.1
Comes with guide 14.4 14.4 8.7 13.5 17.1
Travel agency response is thorough 12.3 10.7 12.9 13.1 11.6
Travel agency is well known 10.7 8.5 9.5 11.8 10.6
Travel agency is familiar 10.1 9.5 5.3 8.9 12.5
Travel agency has good ability to arrange and do good work 9.6 9.6 7.0 9.6 10.6
There are local staff who speak Japanese 9.1 9.1 11.0 11.7 7.1
The travel agent is highly specialized (has a wealth of travel information/knowledge) 5.6 5.6 2.5 4.8 7.1
There is a backup desk at destinations 4.1 4.5 4.7 5.7 3.1
Travel agency is in a location easy to visit 3.4 3.0 4.1 4.4 2.6
There are benefits for tour participants that are unique to the travel agency 2.3 2.4 2.1 3.1 1.9
Local transportation provided 14.8 16.0 12.6 17.2 14.4
All breakfasts provided 10.0 9.9 6.1 10.0 11.5
All meals provided 7.9 8.2 3.1 7.5 10.1
Comes with famous dishes 6.6 6.1 3.9 5.7 8.2
Possible to participate alone 4.0 3.7 1.0 3.7 5.3
Can make reservations right away 3.6 4.4 3.2 2.4 4.3
Local transportation not provided 1.1 1.2 0.9 0.5 1.5
Can increase or decrease the number of nights 0.8 1.3 0.9 0.3 1.1
Other 1.2 1.3 0.9 1.2 1.4
Nothing in particular 4.4 5.3 4.8 3.8 4.6
Budg
et
and
conte
nt
2018
survey
2017
survey
Oth
er
Accom
moda
tions
Airlin
e a
nd
airp
ort
Tra
vel a
gency
0 10 20 30 40 50
2018 survey
Items considered important
2017 survey
Items considered important
(%)
■Points considered important when selecting package (Package tour users involved in the consideration of trip/Multiple answers)
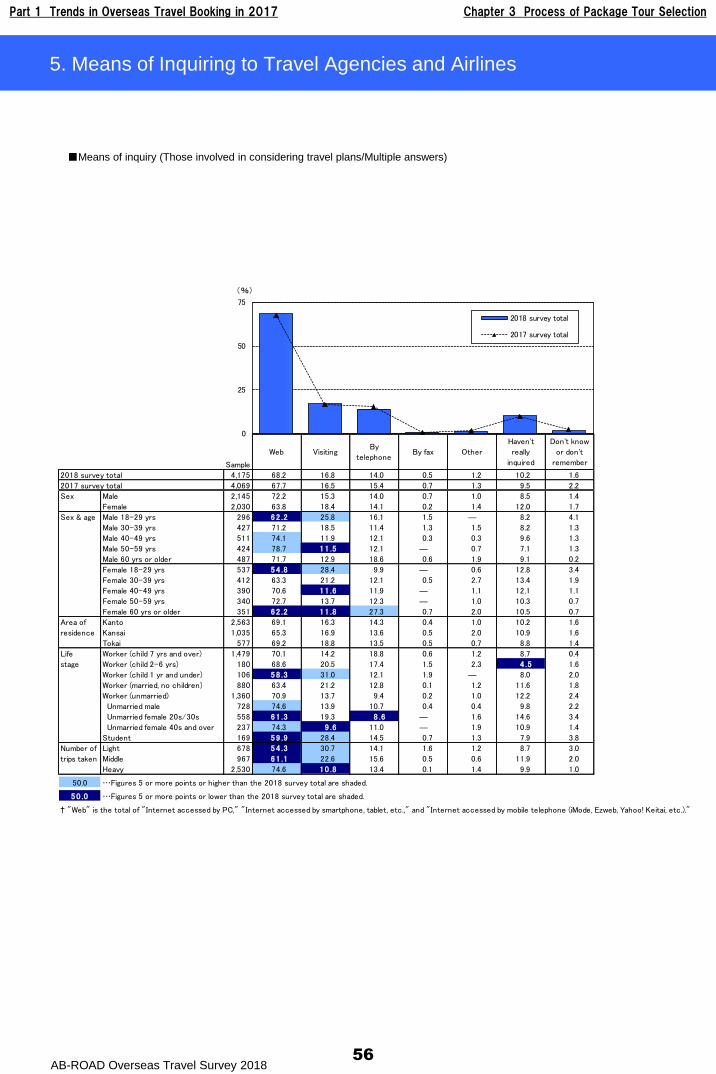
Part 1 Trends in Overseas Travel Booking in 2017 Chapter 3 Process of Package Tour Selection
AB-ROAD Overseas Travel Survey 201856
5. Means of Inquiring to Travel Agencies and Airlines
Sample
Web VisitingBy
telephoneBy fax Other
Haven't
really
inquired
Don't know
or don't
remember
2018 survey total 4,175 68.2 16.8 14.0 0.5 1.2 10.2 1.6
2017 survey total 4,069 67.7 16.5 15.4 0.7 1.3 9.5 2.2
Male 2,145 72.2 15.3 14.0 0.7 1.0 8.5 1.4
Female 2,030 63.8 18.4 14.1 0.2 1.4 12.0 1.7
Male 18-29 yrs 296 62 .2 25.8 16.1 1.5 ― 8.2 4.1
Male 30-39 yrs 427 71.2 18.5 11.4 1.3 1.5 8.2 1.3
Male 40-49 yrs 511 74.1 11.9 12.1 0.3 0.3 9.6 1.3
Male 50-59 yrs 424 78.7 11 .5 12.1 ― 0.7 7.1 1.3
Male 60 yrs or older 487 71.7 12.9 18.6 0.6 1.9 9.1 0.2
Female 18-29 yrs 537 54 .8 28.4 9.9 ― 0.6 12.8 3.4
Female 30-39 yrs 412 63.3 21.2 12.1 0.5 2.7 13.4 1.9
Female 40-49 yrs 390 70.6 11 .6 11.9 ― 1.1 12.1 1.1
Female 50-59 yrs 340 72.7 13.7 12.3 ― 1.0 10.3 0.7
Female 60 yrs or older 351 62 .2 11 .8 27.3 0.7 2.0 10.5 0.7
Kanto 2,563 69.1 16.3 14.3 0.4 1.0 10.2 1.6
Kansai 1,035 65.3 16.9 13.6 0.5 2.0 10.9 1.6
Tokai 577 69.2 18.8 13.5 0.5 0.7 8.8 1.4
Worker (child 7 yrs and over) 1,479 70.1 14.2 18.8 0.6 1.2 8.7 0.4
Worker (child 2-6 yrs) 180 68.6 20.5 17.4 1.5 2.3 4 .5 1.6
Worker (child 1 yr and under) 106 58 .3 31.0 12.1 1.9 ― 8.0 2.0
Worker (married, no children) 880 63.4 21.2 12.8 0.1 1.2 11.6 1.8
Worker (unmarried) 1,360 70.9 13.7 9.4 0.2 1.0 12.2 2.4
Unmarried male 728 74.6 13.9 10.7 0.4 0.4 9.8 2.2
Unmarried female 20s/30s 558 61 .3 19.3 8 .6 ― 1.6 14.6 3.4
Unmarried female 40s and over 237 74.3 9 .6 11.0 ― 1.9 10.9 1.4
Student 169 59 .9 28.4 14.5 0.7 1.3 7.9 3.8
Light 678 54 .3 30.7 14.1 1.6 1.2 8.7 3.0
Middle 967 61 .1 22.6 15.6 0.5 0.6 11.9 2.0
Heavy 2,530 74.6 10 .8 13.4 0.1 1.4 9.9 1.0
50.0 …Figures 5 or more points or higher than the 2018 survey total are shaded.
50 .0 …Figures 5 or more points or lower than the 2018 survey total are shaded.
† "Web" is the total of "Internet accessed by PC," "Internet accessed by smartphone, tablet, etc.," and "Internet accessed by mobile telephone (iMode, Ezweb, Yahoo! Keitai, etc.)."
Number of
trips taken
Sex
Sex & age
Area of
residence
Life
stage
0
25
50
75
2018 survey total
2017 survey total
(%)
■Means of inquiry (Those involved in considering travel plans/Multiple answers)
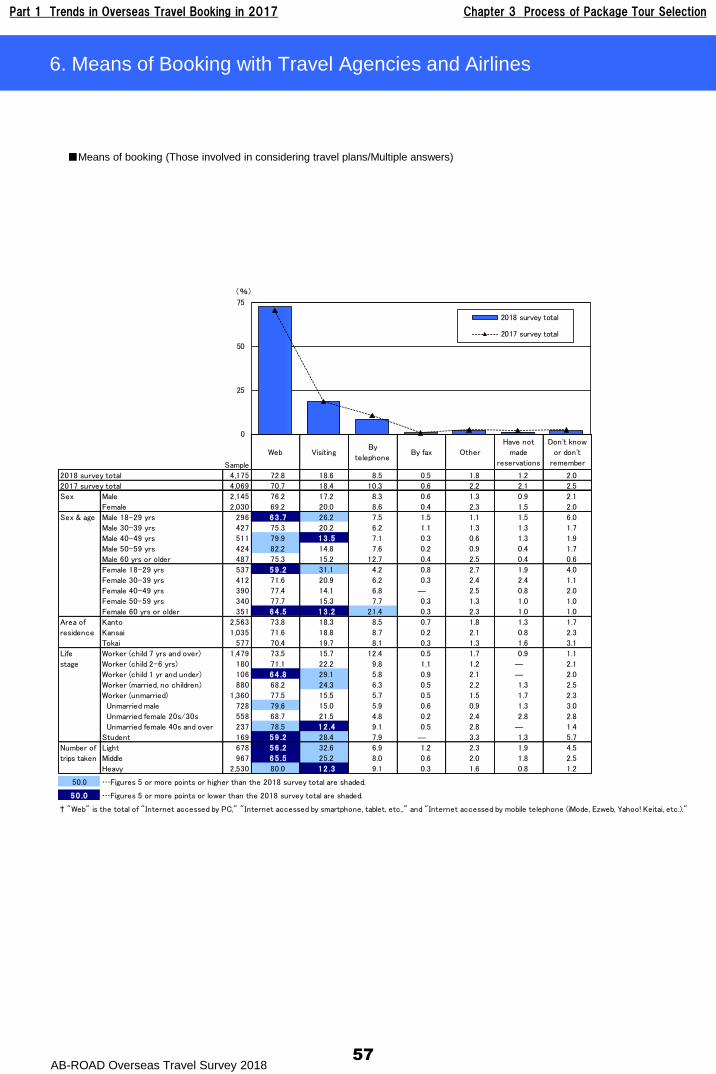
Part 1 Trends in Overseas Travel Booking in 2017 Chapter 3 Process of Package Tour Selection
AB-ROAD Overseas Travel Survey 201857
6. Means of Booking with Travel Agencies and Airlines
Sample
Web VisitingBy
telephoneBy fax Other
Have not
made
reservations
Don't know
or don't
remember
2018 survey total 4,175 72.8 18.6 8.5 0.5 1.8 1.2 2.0
2017 survey total 4,069 70.7 18.4 10.3 0.6 2.2 2.1 2.5
Male 2,145 76.2 17.2 8.3 0.6 1.3 0.9 2.1
Female 2,030 69.2 20.0 8.6 0.4 2.3 1.5 2.0
Male 18-29 yrs 296 63 .7 26.2 7.5 1.5 1.1 1.5 6.0
Male 30-39 yrs 427 75.3 20.2 6.2 1.1 1.3 1.3 1.7
Male 40-49 yrs 511 79.9 13 .5 7.1 0.3 0.6 1.3 1.9
Male 50-59 yrs 424 82.2 14.8 7.6 0.2 0.9 0.4 1.7
Male 60 yrs or older 487 75.3 15.2 12.7 0.4 2.5 0.4 0.6
Female 18-29 yrs 537 59 .2 31.1 4.2 0.8 2.7 1.9 4.0
Female 30-39 yrs 412 71.6 20.9 6.2 0.3 2.4 2.4 1.1
Female 40-49 yrs 390 77.4 14.1 6.8 ― 2.5 0.8 2.0
Female 50-59 yrs 340 77.7 15.3 7.7 0.3 1.3 1.0 1.0
Female 60 yrs or older 351 64 .5 13 .2 21.4 0.3 2.3 1.0 1.0
Kanto 2,563 73.8 18.3 8.5 0.7 1.8 1.3 1.7
Kansai 1,035 71.6 18.8 8.7 0.2 2.1 0.8 2.3
Tokai 577 70.4 19.7 8.1 0.3 1.3 1.6 3.1
Worker (child 7 yrs and over) 1,479 73.5 15.7 12.4 0.5 1.7 0.9 1.1
Worker (child 2-6 yrs) 180 71.1 22.2 9.8 1.1 1.2 ― 2.1
Worker (child 1 yr and under) 106 64 .8 29.1 5.8 0.9 2.1 ― 2.0
Worker (married, no children) 880 68.2 24.3 6.3 0.5 2.2 1.3 2.5
Worker (unmarried) 1,360 77.5 15.5 5.7 0.5 1.5 1.7 2.3
Unmarried male 728 79.6 15.0 5.9 0.6 0.9 1.3 3.0
Unmarried female 20s/30s 558 68.7 21.5 4.8 0.2 2.4 2.8 2.8
Unmarried female 40s and over 237 78.5 12 .4 9.1 0.5 2.8 ― 1.4
Student 169 59 .2 28.4 7.9 ― 3.3 1.3 5.7
Light 678 56 .2 32.6 6.9 1.2 2.3 1.9 4.5
Middle 967 65 .5 25.2 8.0 0.6 2.0 1.8 2.5
Heavy 2,530 80.0 12 .3 9.1 0.3 1.6 0.8 1.2
50.0 …Figures 5 or more points or higher than the 2018 survey total are shaded.
50 .0 …Figures 5 or more points or lower than the 2018 survey total are shaded.
† "Web" is the total of "Internet accessed by PC," "Internet accessed by smartphone, tablet, etc.," and "Internet accessed by mobile telephone (iMode, Ezweb, Yahoo! Keitai, etc.)."
Number of
trips taken
Area of
residence
Sex & age
Sex
Life
stage
0
25
50
75
2018 survey total
2017 survey total
(%)
■Means of booking (Those involved in considering travel plans/Multiple answers)

58
59
Chapter 4
Process of Arranged Travel Selection
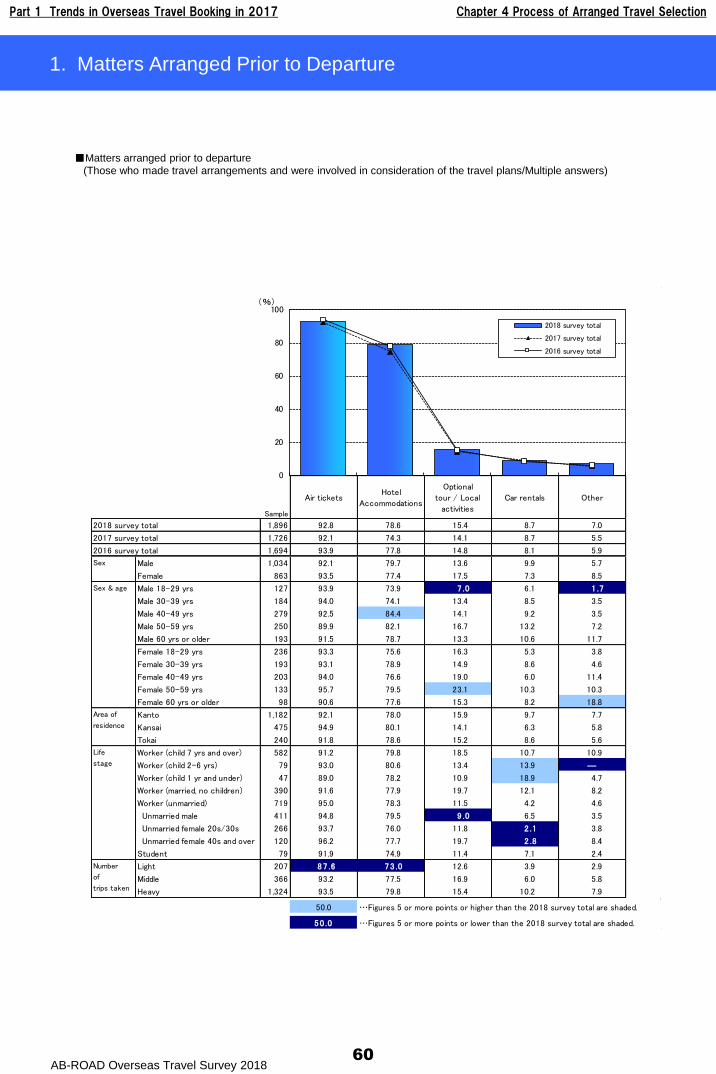
Part 1 Trends in Overseas Travel Booking in 2017 Chapter 4 Process of Arranged Travel Selection
AB-ROAD Overseas Travel Survey 201860
1. Matters Arranged Prior to Departure
Sample
Air ticketsHotel
Accommodations
Optional
tour / Local
activities
Car rentals Other
2018 survey total 1,896 92.8 78.6 15.4 8.7 7.0
2017 survey total 1,726 92.1 74.3 14.1 8.7 5.5
2016 survey total 1,694 93.9 77.8 14.8 8.1 5.9
Male 1,034 92.1 79.7 13.6 9.9 5.7
Female 863 93.5 77.4 17.5 7.3 8.5
Male 18-29 yrs 127 93.9 73.9 7 .0 6.1 1 .7
Male 30-39 yrs 184 94.0 74.1 13.4 8.5 3.5
Male 40-49 yrs 279 92.5 84.4 14.1 9.2 3.5
Male 50-59 yrs 250 89.9 82.1 16.7 13.2 7.2
Male 60 yrs or older 193 91.5 78.7 13.3 10.6 11.7
Female 18-29 yrs 236 93.3 75.6 16.3 5.3 3.8
Female 30-39 yrs 193 93.1 78.9 14.9 8.6 4.6
Female 40-49 yrs 203 94.0 76.6 19.0 6.0 11.4
Female 50-59 yrs 133 95.7 79.5 23.1 10.3 10.3
Female 60 yrs or older 98 90.6 77.6 15.3 8.2 18.8
Kanto 1,182 92.1 78.0 15.9 9.7 7.7
Kansai 475 94.9 80.1 14.1 6.3 5.8
Tokai 240 91.8 78.6 15.2 8.6 5.6
Worker (child 7 yrs and over) 582 91.2 79.8 18.5 10.7 10.9
Worker (child 2-6 yrs) 79 93.0 80.6 13.4 13.9 ―
Worker (child 1 yr and under) 47 89.0 78.2 10.9 18.9 4.7
Worker (married, no children) 390 91.6 77.9 19.7 12.1 8.2
Worker (unmarried) 719 95.0 78.3 11.5 4.2 4.6
Unmarried male 411 94.8 79.5 9 .0 6.5 3.5
Unmarried female 20s/30s 266 93.7 76.0 11.8 2 .1 3.8
Unmarried female 40s and over 120 96.2 77.7 19.7 2 .8 8.4
Student 79 91.9 74.9 11.4 7.1 2.4
Light 207 87 .6 73 .0 12.6 3.9 2.9
Middle 366 93.2 77.5 16.9 6.0 5.8
Heavy 1,324 93.5 79.8 15.4 10.2 7.9
50.0 …Figures 5 or more points or higher than the 2018 survey total are shaded.
50 .0 …Figures 5 or more points or lower than the 2018 survey total are shaded.
Sex
Sex & age
Number
of
trips taken
Area of
residence
Life
stage
0
20
40
60
80
100
2018 survey total
2017 survey total
2016 survey total
(%)
■Matters arranged prior to departure
(Those who made travel arrangements and were involved in consideration of the travel plans/Multiple answers)
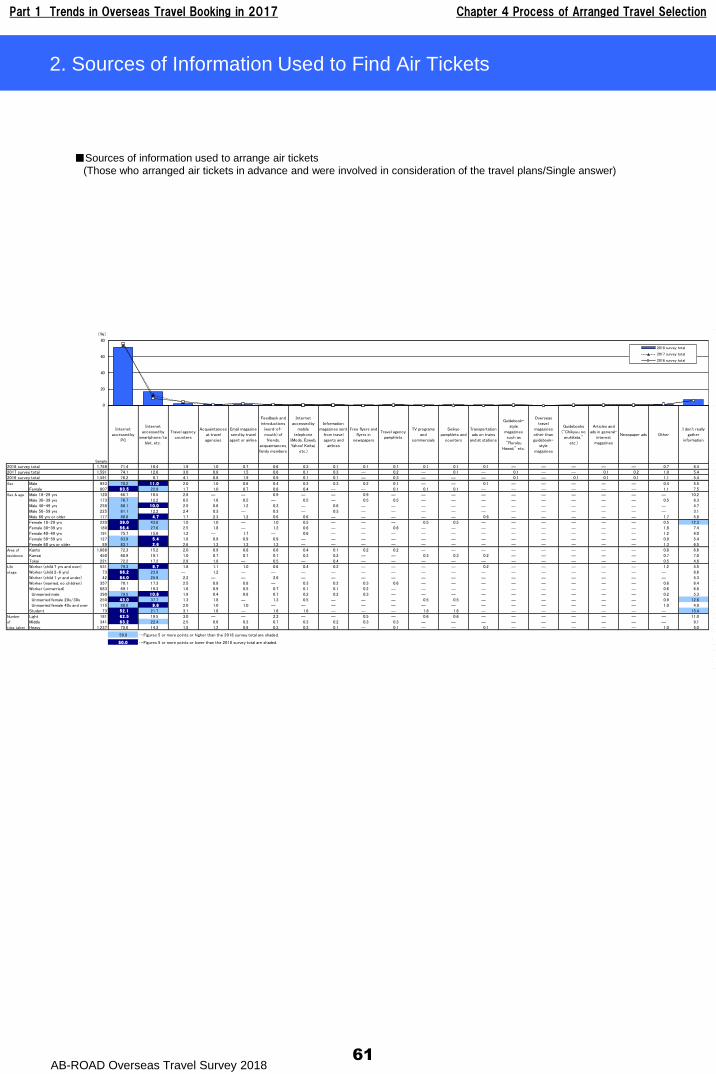
Part 1 Trends in Overseas Travel Booking in 2017 Chapter 4 Process of Arranged Travel Selection
AB-ROAD Overseas Travel Survey 2018
Sample
Internet
accessed by
PC
Internet
accessed by
smartphone/ta
blet, etc.
Travel agency
counters
Acquaintances
at travel
agencies
Email magazine
send by travel
agent or airline
Feedback and
introductions
(word-of-
mouth) of
friends,
acquaintances,
family members
Internet
accessed by
mobile
telephone
(iMode, Ezweb,
Yahoo! Keitai,
etc.)
Information
magazines sent
from travel
agents and
airlines
Free flyers and
flyers in
newspapers
Travel agency
pamphlets
TV programs
and
commercials
Seikyo
pamphlets and
counters
Transportation
ads on trains
and at stations
Guidebook-
style
magazines
such as
"Rurubu
Hawaii," etc.
Overseas
travel
magazines
other than
guidebook-
style
magazines
Guidebooks
("Chikyuu no
arukikata,"
etc.)
Articles and
ads in general-
interest
magazines
Newspaper ads Other
I don't really
gather
information
2018 survey total 1,759 71.4 16.4 1.9 1.0 0.7 0.6 0.3 0.1 0.1 0.1 0.1 0.1 0.1 ― ― ― ― ― 0.7 6.4
2017 survey total 1,591 74.1 12.6 3.0 0.8 1.5 0.6 0.1 0.3 ― 0.2 ― 0.1 ― 0.1 ― ― 0.1 0.2 1.0 5.4
2016 survey total 1,591 76.2 8.7 4.1 0.8 1.9 0.9 0.1 0.1 ― 0.3 ― ― ― 0.1 ― 0.1 0.1 0.1 1.1 5.4
Male 953 78.2 11 .0 2.0 1.0 0.6 0.4 0.2 0.3 0.2 0.1 ― ― 0.1 ― ― ― ― ― 0.4 5.5
Female 807 63 .5 22.9 1.7 1.0 0.7 0.8 0.4 ― ― 0.1 0.1 0.1 ― ― ― ― ― ― 1.1 7.5
Male 18-29 yrs 120 66.7 18.5 2.8 ― ― 0.9 ― ― 0.9 ― ― ― ― ― ― ― ― ― ― 10.2
Male 30-39 yrs 173 76.7 12.2 0.5 1.6 0.5 ― 0.5 ― 0.5 0.5 ― ― ― ― ― ― ― ― 0.5 6.3
Male 40-49 yrs 258 80.1 10 .0 2.5 0.6 1.2 0.3 ― 0.6 ― ― ― ― ― ― ― ― ― ― ― 4.7
Male 50-59 yrs 225 81.1 12.2 2.4 0.3 ― 0.3 ― 0.3 ― ― ― ― ― ― ― ― ― ― ― 3.1
Male 60 yrs or older 177 80.8 4 .7 1.7 2.3 1.2 0.6 0.6 ― ― ― ― ― 0.6 ― ― ― ― ― 1.7 5.8
Female 18-29 yrs 220 39 .0 43.6 1.0 1.0 ― 1.0 0.5 ― ― ― 0.5 0.5 ― ― ― ― ― ― 0.5 12.3
Female 30-39 yrs 180 56 .4 27.6 2.5 1.8 ― 1.2 0.6 ― ― 0.6 ― ― ― ― ― ― ― ― 1.8 7.4
Female 40-49 yrs 191 75.7 15.6 1.2 ― 1.7 ― 0.6 ― ― ― ― ― ― ― ― ― ― ― 1.2 4.0
Female 50-59 yrs 127 83.9 5 .4 1.8 0.9 0.9 0.9 ― ― ― ― ― ― ― ― ― ― ― ― 0.9 5.4
Female 60 yrs or older 89 83.1 2 .6 2.6 1.3 1.3 1.3 ― ― ― ― ― ― ― ― ― ― ― ― 1.3 6.5
Kanto 1,088 72.3 15.2 2.0 0.9 0.8 0.6 0.4 0.1 0.2 0.2 ― ― ― ― ― ― ― ― 0.8 6.6
Kansai 450 68.9 19.1 1.0 0.7 0.7 0.7 0.3 0.2 ― ― 0.3 0.3 0.2 ― ― ― ― ― 0.7 7.0
Tokai 221 72.2 17.2 2.9 1.8 ― 0.5 ― 0.4 ― ― ― ― ― ― ― ― ― ― 0.5 4.6
Worker (child 7 yrs and over) 531 79.3 9 .7 1.8 1.1 1.0 0.6 0.4 0.2 ― ― ― ― 0.2 ― ― ― ― ― 1.2 4.5
Worker (child 2-6 yrs) 73 66 .2 23.9 ― 1.2 ― ― ― ― ― ― ― ― ― ― ― ― ― ― ― 8.6
Worker (child 1 yr and under) 42 64 .0 25.9 2.2 ― ― 2.6 ― ― ― ― ― ― ― ― ― ― ― ― ― 5.3
Worker (married, no children) 357 70.1 17.3 2.5 0.9 0.8 ― 0.3 0.2 0.3 0.6 ― ― ― ― ― ― ― ― 0.6 6.4
Worker (unmarried) 683 69.1 19.3 1.6 0.9 0.5 0.7 0.1 0.1 0.2 ― ― ― ― ― ― ― ― ― 0.6 6.8
Unmarried male 390 79.5 10 .6 1.9 0.4 0.6 0.7 0.2 0.2 0.3 ― ― ― ― ― ― ― ― ― 0.2 5.3
Unmarried female 20s/30s 250 43 .0 37.7 1.3 1.8 ― 1.3 0.5 ― ― ― 0.5 0.5 ― ― ― ― ― ― 0.9 12.6
Unmarried female 40s and over 115 80.5 9 .6 2.0 1.0 1.0 ― ― ― ― ― ― ― ― ― ― ― ― ― 1.0 4.9
Student 73 52 .1 21.7 3.1 1.6 ― 1.6 1.6 ― ― ― 1.6 1.6 ― ― ― ― ― ― ― 15.4
Light 181 62 .5 19.5 3.0 ― ― 2.2 ― ― 0.5 ― 0.6 0.6 ― ― ― ― ― ― ― 11.0
Middle 341 63 .2 22.4 2.5 0.6 0.3 0.7 0.3 0.2 0.3 0.3 ― ― ― ― ― ― ― ― ― 9.1
Heavy 1,237 75.0 14.3 1.5 1.2 0.9 0.3 0.3 0.1 ― 0.1 ― ― 0.1 ― ― ― ― ― 1.0 5.0
50.0 …Figures 5 or more points or higher than the 2018 survey total are shaded.
50 .0 …Figures 5 or more points or lower than the 2018 survey total are shaded.
Number
of
trips taken
Area of
residence
Sex & age
Sex
Life
stage
0
20
40
60
80
2018 survey total
2017 survey total
2016 survey total
(%)
61
2. Sources of Information Used to Find Air Tickets
■Sources of information used to arrange air tickets
(Those who arranged air tickets in advance and were involved in consideration of the travel plans/Single answer)
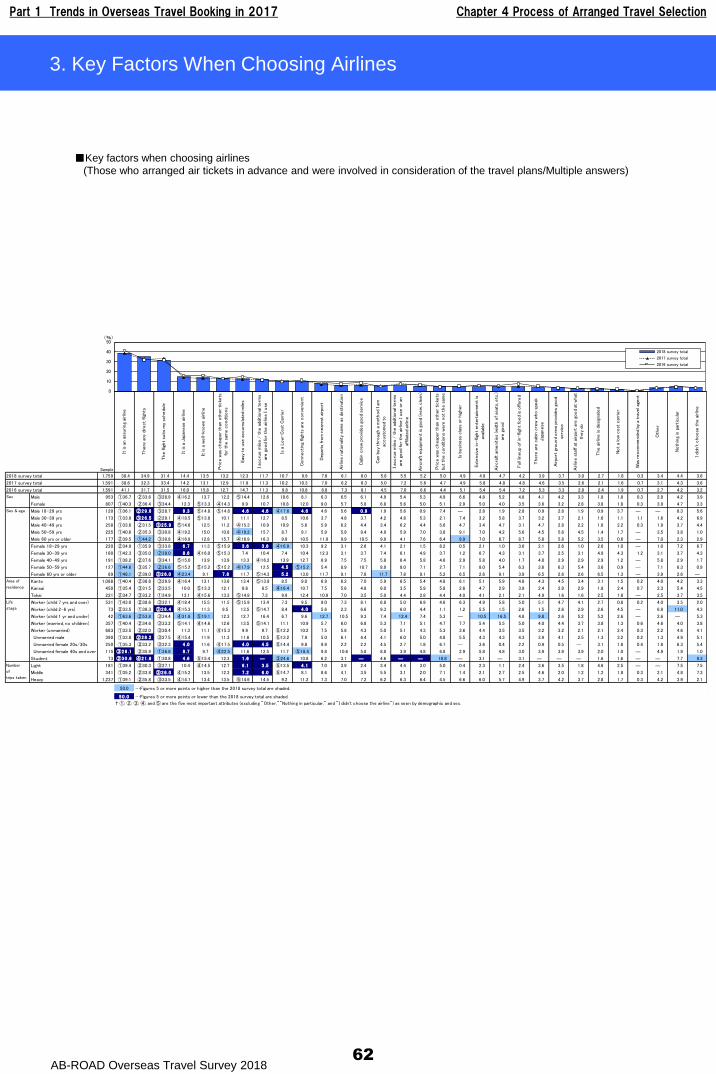
Part 1 Trends in Overseas Travel Booking in 2017 Chapter 4 Process of Arranged Travel Selection
AB-ROAD Overseas Travel Survey 2018
Sample
It is
an a
ssuring
airlin
e
There
are
direct
fligh
ts
The flig
ht
suits
my
schedu
le
It is
a J
apan
ese
airlin
e
It is
a w
ell-
know
n a
irlin
e
Price w
as c
heap
er
than
oth
er
ticke
ts
for
the s
ame c
ondi
tions
Eas
y to
use
accum
ula
ted
mile
s
I ac
cru
e m
iles
/ t
he a
dditio
nal
term
s
are g
ood
for
the a
irlin
e I u
se
Is a
Low
-C
ost
Car
rier
Connecting
fligh
ts a
re c
onve
nie
nt
Depa
rts
from
near
est
airpo
rt
Airlin
e n
atio
nal
ity
sam
e a
s de
stin
atio
n
Cab
in c
rew
pro
vide
s go
od
serv
ice
Can
buy
thro
ugh
a m
eth
od
I am
accust
om
ed
to
I ac
cru
e m
iles
/ t
he a
dditio
nal
term
s
are g
ood
for
the a
irlin
e I u
se o
r an
affil
iate
d ai
rlin
e
Aircra
ft e
quip
ment
is g
ood
(new
, cle
an)
Price w
as c
heap
er
than
oth
er
ticke
ts
but
the c
ondi
tions
were
not
the s
ame
Is b
usi
ness
cla
ss o
r hig
her
Ext
ensi
ve in
-fli
ght
ente
rtai
nm
ent
is
avai
labl
e
Aircra
ft a
menitie
s (w
idth
of se
ats,
etc
.)
are g
ood
Full
lineup
of in
-fli
ght
food
is o
ffere
d
There
are
cab
in c
rew
who s
peak
Jap
anese
Airpo
rt g
round
cre
w p
rovi
des
good
serv
ice
Airlin
e s
taff a
t ai
rport
are
good
at w
hat
they
do
The a
irlin
e is
desi
gnat
ed
Not
a lo
w c
ost
car
rier
Was
recom
mende
d by
a t
rave
l age
nt
Oth
er
Noth
ing
in p
articula
r
I di
dn't c
hoose
the a
irlin
e
2018 survey total 1,759 38.4 34.9 31.4 14.4 13.5 13.2 12.3 11.7 10.7 9.9 7.6 6.1 6.0 5.8 5.5 5.2 5.0 4.9 4.9 4.7 4.2 3.9 3.7 3.0 2.7 1.8 0.3 3.4 4.4 3.6
2017 survey total 1,591 38.6 32.3 33.4 14.2 13.1 12.9 11.9 11.3 10.2 10.3 7.0 6.2 6.3 5.0 7.2 5.6 4.7 4.9 5.8 4.8 4.8 4.6 3.5 2.6 2.1 1.6 0.7 3.1 4.3 3.6
2016 survey total 1,591 41.1 31.7 31.5 16.0 15.8 12.7 14.7 11.3 9.8 10.8 8.8 7.3 8.1 4.5 7.0 6.6 4.4 5.1 5.4 5.4 7.2 5.3 3.3 2.8 2.4 1.9 0.7 2.7 4.2 3.2
Male 953 ①36.7 ②33.6 ③28.9 ④16.2 13.7 12.2 ⑤14.4 12.6 10.6 8.1 6.3 6.5 6.1 4.9 5.4 5.3 4.9 6.6 4.8 5.2 4.8 4.1 4.2 3.3 1.8 1.8 0.3 2.9 4.2 3.9
Female 807 ①40.3 ②36.4 ③34.4 12.3 ⑤13.3 ④14.3 9.9 10.7 10.8 12.0 9.0 5.7 5.8 6.8 5.6 5.0 5.1 2.9 5.0 4.0 3.5 3.6 3.2 2.8 3.8 1.8 0.3 3.9 4.7 3.3
Male 18-29 yrs 120 ①36.1 ②29 .6 ③28.7 9 .3 ⑤14.8 ⑤14.8 4 .6 4 .6 ④17.6 4 .6 4.6 5.6 0 .9 1.9 5.6 0.9 7.4 ― 2.8 1.9 2.8 0.9 2.8 1.9 0.9 3.7 ― ― 8.3 5.6
Male 30-39 yrs 173 ①33.9 ③26 .5 ②29.1 ④18.5 ⑤13.8 10.1 11.1 12.7 8.5 10.6 3.7 4.8 3.7 4.2 4.8 5.3 2.1 7.4 3.2 5.8 3.7 3.2 3.7 2.1 1.6 1.1 1.1 1.6 4.2 6.9
Male 40-49 yrs 258 ①33.6 ②31.5 ③25 .9 ⑤14.6 12.5 11.2 ④15.3 10.9 10.9 5.6 5.9 6.2 4.4 3.4 6.2 4.4 5.6 4.7 3.4 4.7 3.1 4.7 2.8 2.2 1.6 2.2 0.3 1.9 3.7 4.4
Male 50-59 yrs 225 ①40.6 ②35.3 ③30.8 ④19.2 15.0 10.8 ④19.2 15.7 8.7 9.1 5.9 5.9 9.4 4.9 5.9 7.0 3.8 9.1 7.0 4.2 5.6 4.5 5.6 4.5 1.4 1.7 ― 3.5 3.8 1.0
Male 60 yrs or older 177 ②39.5 ①44.2 ③30.8 ④16.9 12.8 15.7 ④16.9 16.3 9.9 10.5 11.0 9.9 10.5 9.9 4.1 7.6 6.4 9.9 7.0 8.7 8.7 5.8 5.8 5.2 3.5 0.6 ― 7.0 2.3 2.9
Female 18-29 yrs 220 ②34.9 ①35.9 ③33.8 6 .7 11.3 ⑤15.9 3 .6 3 .6 ④16.9 10.3 9.2 3.1 2.6 4.1 2.1 1.5 8.2 0.5 2.1 1.0 3.6 2.1 2.6 1.0 2.6 1.0 ― 1.0 7.2 6.7
Female 30-39 yrs 180 ①42.3 ③35.0 ②38.0 8 .6 ④16.0 ⑤15.3 7.4 10.4 7.4 10.4 12.3 3.1 3.7 7.4 6.1 4.9 3.7 1.2 6.7 4.3 3.1 3.7 2.5 3.1 4.9 4.3 1.2 3.1 3.7 4.3
Female 40-49 yrs 191 ①38.2 ②37.6 ③34.1 ⑤15.0 13.9 13.9 13.3 ④16.2 13.9 12.7 6.9 7.5 7.5 5.8 6.4 5.8 4.6 2.9 5.8 4.0 1.7 4.0 2.9 2.9 2.9 1.2 ― 5.8 2.9 1.7
Female 50-59 yrs 127 ①44.6 ③35.7 ②36.6 ⑤15.2 ⑤15.2 ⑤15.2 ④17.9 12.5 4 .5 ⑤15.2 5.4 8.9 10.7 8.9 8.0 7.1 2.7 7.1 8.0 5.4 6.3 3.6 6.3 5.4 3.6 0.9 ― 7.1 6.3 0.9
Female 60 yrs or older 89 ①48.1 ②39.0 ③26 .0 ④23.4 9.1 7 .8 11.7 ⑤14.3 5 .2 13.0 11.7 9.1 7.8 11.7 7.8 9.1 5.2 6.5 2.6 9.1 3.9 6.5 2.6 2.6 6.5 1.3 ― 3.9 2.6 ―
Kanto 1,088 ①40.4 ②36.6 ③29.9 ④16.4 13.1 13.6 13.4 ⑤13.9 8.5 9.0 6.9 6.2 7.0 5.9 6.5 5.4 4.8 6.1 5.1 5.9 4.8 4.3 4.5 3.4 3.1 1.5 0.2 4.0 4.2 3.3
Kansai 450 ①35.4 ③31.5 ②33.5 10.0 ⑤13.3 12.1 8.6 8.5 ④16.4 10.7 7.5 5.6 4.8 6.0 3.5 5.9 5.8 2.6 4.7 2.9 3.9 2.4 2.9 2.9 1.8 2.4 0.7 2.3 5.4 4.5
Tokai 221 ②34.7 ③33.2 ①34.9 13.1 ④15.6 13.3 ⑤14.8 7.3 9.9 12.4 10.9 7.0 3.5 5.0 4.4 2.8 4.4 4.0 4.1 2.1 2.1 4.9 1.6 1.6 2.5 1.8 ― 2.5 3.7 3.5
Worker (child 7 yrs and over) 531 ①43.0 ②38.6 ③32.1 ④18.4 15.5 11.5 ⑤15.9 13.4 7.3 9.5 9.0 7.3 8.1 6.8 5.0 6.9 4.6 6.3 4.9 5.8 5.0 5.1 4.7 4.1 2.7 0.8 0.2 4.0 3.5 2.0
Worker (child 2-6 yrs) 73 ②33.5 ①38.3 ③26 .4 ④15.3 11.3 9.5 13.5 ⑤14.7 8.4 4 .0 5.6 2.3 6.6 9.3 6.0 4.4 1.1 1.2 5.5 1.5 2.6 1.5 2.6 2.9 2.6 4.5 ― 6.9 11.0 4.3
Worker (child 1 yr and under) 42 ①63.6 ②53.8 ③34.4 ④31.8 ⑤19.1 12.3 12.7 16.4 6.7 9.6 12.7 10.5 9.3 7.4 12.4 7.4 5.3 ― 10.5 16.5 4.8 9.8 2.6 5.2 5.2 2.6 ― 2.6 ― 5.3
Worker (married, no children) 357 ①40.4 ②34.6 ③33.2 ⑤14.1 ④14.6 12.6 13.5 ⑤14.1 11.1 10.9 5.7 6.0 6.8 5.3 7.1 5.1 4.7 7.7 5.4 5.5 5.0 4.0 4.4 3.7 3.8 1.3 0.6 4.6 4.0 3.8
Worker (unmarried) 683 ①33.5 ②32.0 ③30.4 11.3 11.1 ④15.3 9.9 9.7 ⑤12.2 10.2 7.5 5.8 4.3 5.0 5.1 4.3 5.3 3.6 4.4 3.5 3.5 3.2 3.2 2.1 2.1 2.4 0.3 2.2 4.6 4.1
Unmarried male 390 ①33.8 ②28 .2 ③27.5 ④15.4 11.9 11.3 11.6 10.5 ⑤13.2 7.9 5.0 6.1 4.4 4.1 6.0 5.0 4.8 5.5 4.3 4.3 4.3 3.9 4.1 2.5 1.3 3.2 0.2 1.3 4.9 5.1
Unmarried female 20s/30s 250 ①35.3 ②33.2 ③32.3 4 .0 11.6 ④17.5 4 .0 4 .5 ⑤14.4 9.8 9.9 2.2 2.2 4.5 2.7 1.8 6.7 ― 3.6 0.4 2.2 0.9 0.5 ― 3.1 1.8 0.4 1.8 6.3 5.4
Unmarried female 40s and over 115 ③26 .1 ②35.9 ①36.8 8 .7 9.7 ④22.5 11.6 12.5 11.7 ⑤18.4 9.8 10.6 5.8 8.8 3.9 4.8 6.8 2.9 5.8 4.8 3.0 3.9 3.9 3.9 2.0 1.0 ― 4.9 1.9 1.0
Student 73 ②30 .6 ④21 .6 ①30.8 4 .6 ⑤15.4 12.3 1 .6 ― ③24.6 10.8 6.2 3.1 ― 4.6 ― ― 10.8 ― 3.1 ― 3.1 ― ― ― 1.6 1.6 ― ― 7.7 9.3
Light 181 ①39.4 ②30.3 ③27.1 10.4 ④14.5 12.7 6 .1 3 .5 ⑤13.5 4 .1 7.0 3.9 2.4 3.4 4.4 3.0 5.0 0.4 2.3 1.1 2.4 3.6 3.5 1.8 4.6 2.5 ― ― 7.5 7.5
Middle 341 ①35.2 ②33.8 ③26 .0 ④15.2 13.5 12.3 7 .2 6 .0 ⑤14.7 8.1 8.6 4.1 3.5 5.5 3.1 2.0 7.1 1.4 2.1 2.7 2.5 4.6 2.0 1.2 1.2 1.8 0.3 2.1 4.8 7.3
Heavy 1,237 ①39.1 ②35.8 ③33.5 ④14.7 13.4 13.5 ⑤14.6 14.5 9.2 11.2 7.3 7.0 7.2 6.2 6.3 6.4 4.5 6.6 6.0 5.7 4.9 3.7 4.2 3.7 2.8 1.7 0.3 4.2 3.9 2.1
50.0 …Figures 5 or more points or higher than the 2018 survey total are shaded.
50 .0 …Figures 5 or more points or lower than the 2018 survey total are shaded.
† ①, ②, ③, ④, and ⑤ are the five most important attributes (excluding "Other,""Nothing in particular," and "I didn't choose the airline") as seen by demographic and sex.
Number
of
trips taken
Life
stage
Sex
Area of
residence
Sex & age
0
10
20
30
40
50
2018 survey total
2017 survey total
2016 survey total
(%)
62
3. Key Factors When Choosing Airlines
■Key factors when choosing airlines
(Those who arranged air tickets in advance and were involved in consideration of the travel plans/Multiple answers)
63
Part 2
Satisfaction with Travel Destinations
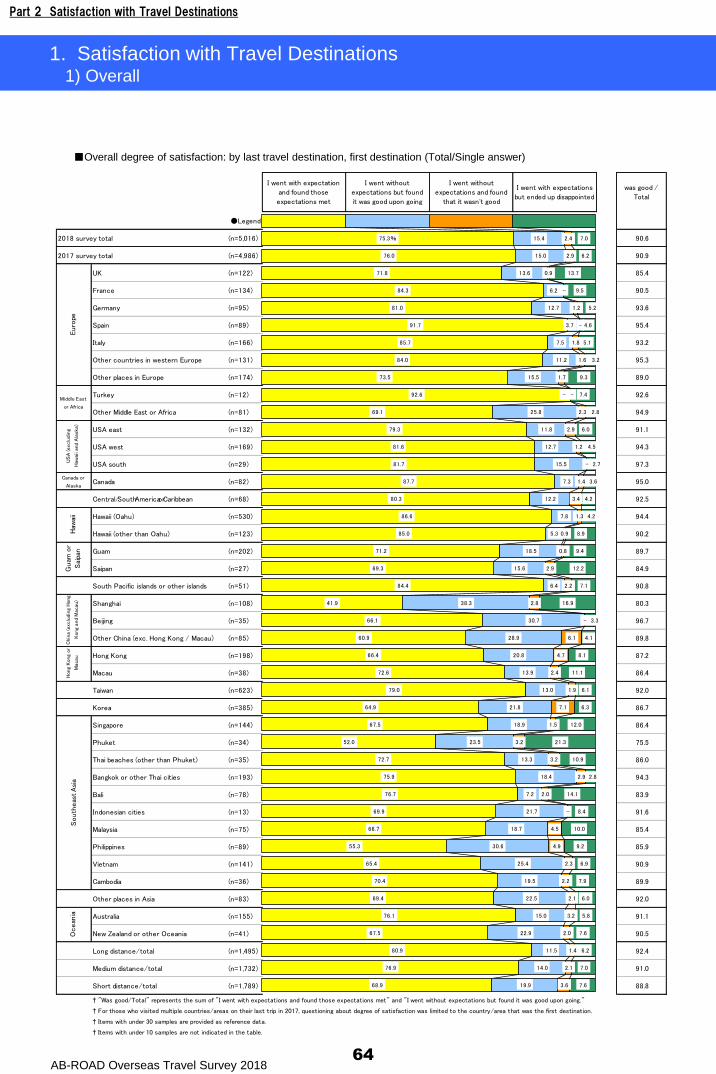
Part 2 Satisfaction with Travel Destinations
AB-ROAD Overseas Travel Survey 201864
1. Satisfaction with Travel Destinations1) Overall
I went with expectation
and found those
expectations met
I went without
expectations but found
it was good upon going
I went without
expectations and found
that it wasn't good
I went with expectations
but ended up disappointed
was good /
Total
●Legend
2018 survey total (n=5,016) 90.6
2017 survey total (n=4,986) 90.9
UK (n=122) 85.4
France (n=134) 90.5
Germany (n=95) 93.6
Spain (n=89) 95.4
Italy (n=166) 93.2
Other countries in western Europe (n=131) 95.3
Other places in Europe (n=174) 89.0
Turkey (n=12) 92.6
Other Middle East or Africa (n=81) 94.9
USA east (n=132) 91.1
USA west (n=169) 94.3
USA south (n=29) 97.3
Canada or
AlaskaCanada (n=82) 95.0
Central/SouthAmericaorCaribbean (n=68) 92.5
Hawaii (Oahu) (n=530) 94.4
Hawaii (other than Oahu) (n=123) 90.2
Guam (n=202) 89.7
Saipan (n=27) 84.9
South Pacific islands or other islands (n=51) 90.8
Shanghai (n=108) 80.3
Beijing (n=35) 96.7
Other China (exc. Hong Kong / Macau) (n=85) 89.8
Hong Kong (n=198) 87.2
Macau (n=38) 86.4
Taiwan (n=623) 92.0
Korea (n=385) 86.7
Singapore (n=144) 86.4
Phuket (n=34) 75.5
Thai beaches (other than Phuket) (n=35) 86.0
Bangkok or other Thai cities (n=193) 94.3
Bali (n=78) 83.9
Indonesian cities (n=13) 91.6
Malaysia (n=75) 85.4
Philippines (n=89) 85.9
Vietnam (n=141) 90.9
Cambodia (n=36) 89.9
Other places in Asia (n=83) 92.0
Australia (n=155) 91.1
New Zealand or other Oceania (n=41) 90.5
Long distance/total (n=1,495) 92.4
Medium distance/total (n=1,732) 91.0
Short distance/total (n=1,789) 88.8
† "Was good/Total" represents the sum of "I went with expectations and found those expectations met" and "I went without expectations but found it was good upon going."
† For those who visited multiple countries/areas on their last trip in 2017, questioning about degree of satisfaction was limited to the country/area that was the first destination.
† Items with under 30 samples are provided as reference data.
† Items with under 10 samples are not indicated in the table.
Euro
pe
Middle East
or Africa
US
A (exc
ludi
ng
Haw
aii a
nd
Ala
ska)
Hong
Kong
or
Mac
auO
cean
iaG
uam
or
Sai
pan
Haw
aii
Chin
a (e
xclu
ding
Hong
Kong
and
Mac
au)
75.3%
76.0
71.8
84.3
81.0
91.7
85.7
84.0
73.5
92.6
69.1
79.3
81.6
81.7
87.7
80.3
86.6
85.0
71.2
69.3
84.4
41.9
66.1
60.9
66.4
72.6
79.0
64.9
67.5
52.0
72.7
75.9
76.7
69.9
66.7
55.3
65.4
70.4
69.4
76.1
67.5
80.9
76.9
68.9
15.4
15.0
13.6
6.2
12.7
3.7
7.5
11.2
15.5
-
25.8
11.8
12.7
15.5
7.3
12.2
7.8
5.3
18.5
15.6
6.4
38.3
30.7
28.9
20.8
13.9
13.0
21.8
18.9
23.5
13.3
18.4
7.2
21.7
18.7
30.6
25.4
19.5
22.5
15.0
22.9
11.5
14.0
19.9
2.4
2.9
0.9
-
1.2
-
1.8
1.6
1.7
-
2.3
2.9
1.2
-
1.4
3.4
1.3
0.9
0.8
2.9
2.2
2.8
-
6.1
4.7
2.4
1.9
7.1
1.5
3.2
3.2
2.9
2.0
-
4.5
4.9
2.3
2.2
2.1
3.2
2.0
1.4
2.1
3.6
7.0
6.2
13.7
9.5
5.2
4.6
5.1
3.2
9.3
7.4
2.8
6.0
4.5
2.7
3.6
4.2
4.2
8.9
9.4
12.2
7.1
16.9
3.3
4.1
8.1
11.1
6.1
6.3
12.0
21.3
10.9
2.8
14.1
8.4
10.0
9.2
6.9
7.9
6.0
5.8
7.6
6.2
7.0
7.6
South
eas
t A
sia
■Overall degree of satisfaction: by last travel destination, first destination (Total/Single answer)
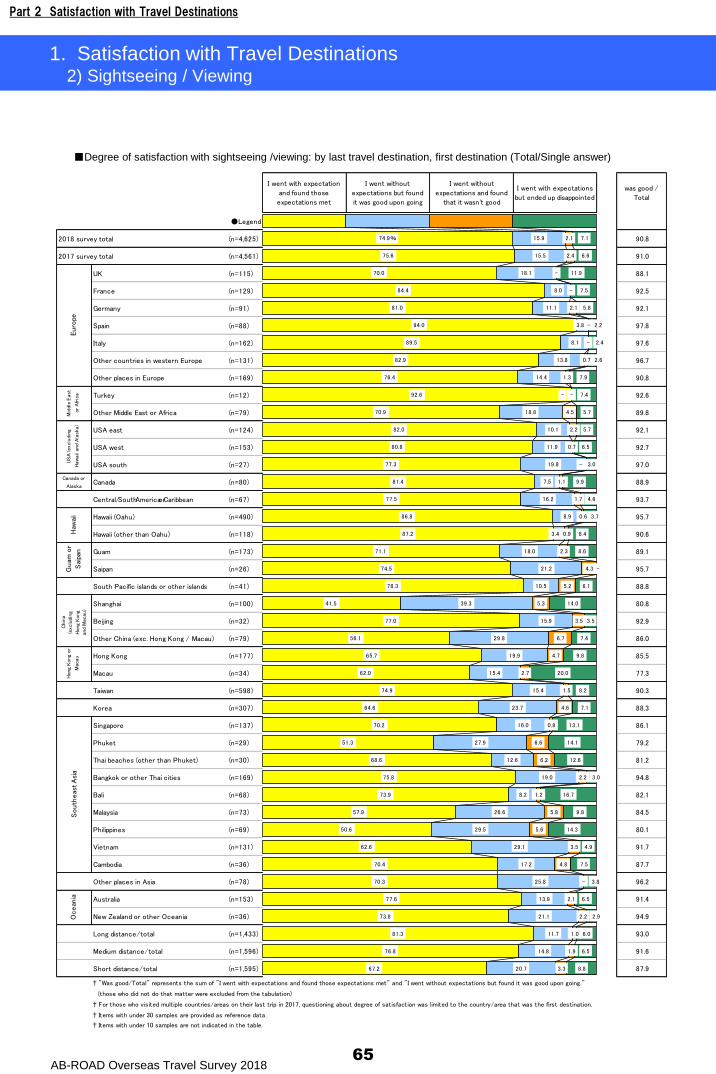
Part 2 Satisfaction with Travel Destinations
AB-ROAD Overseas Travel Survey 201865
1. Satisfaction with Travel Destinations2) Sightseeing / Viewing
■Degree of satisfaction with sightseeing /viewing: by last travel destination, first destination (Total/Single answer)
I went with expectation
and found those
expectations met
I went without
expectations but found
it was good upon going
I went without
expectations and found
that it wasn't good
I went with expectations
but ended up disappointed
was good /
Total
●Legend
2018 survey total (n=4,625) 90.8
2017 survey total (n=4,561) 91.0
UK (n=115) 88.1
France (n=129) 92.5
Germany (n=91) 92.1
Spain (n=88) 97.8
Italy (n=162) 97.6
Other countries in western Europe (n=131) 96.7
Other places in Europe (n=169) 90.8
Turkey (n=12) 92.6
Other Middle East or Africa (n=79) 89.8
USA east (n=124) 92.1
USA west (n=153) 92.7
USA south (n=27) 97.0
Canada or
AlaskaCanada (n=80) 88.9
Central/SouthAmericaorCaribbean (n=67) 93.7
Hawaii (Oahu) (n=490) 95.7
Hawaii (other than Oahu) (n=118) 90.6
Guam (n=173) 89.1
Saipan (n=26) 95.7
South Pacific islands or other islands (n=41) 88.8
Shanghai (n=100) 80.8
Beijing (n=32) 92.9
Other China (exc. Hong Kong / Macau) (n=79) 86.0
Hong Kong (n=177) 85.5
Macau (n=34) 77.3
Taiwan (n=598) 90.3
Korea (n=307) 88.3
Singapore (n=137) 86.1
Phuket (n=29) 79.2
Thai beaches (other than Phuket) (n=30) 81.2
Bangkok or other Thai cities (n=169) 94.8
Bali (n=68) 82.1
Malaysia (n=73) 84.5
Philippines (n=69) 80.1
Vietnam (n=131) 91.7
Cambodia (n=36) 87.7
Other places in Asia (n=78) 96.2
Australia (n=153) 91.4
New Zealand or other Oceania (n=36) 94.9
Long distance/total (n=1,433) 93.0
Medium distance/total (n=1,596) 91.6
Short distance/total (n=1,595) 87.9
† "Was good/Total" represents the sum of "I went with expectations and found those expectations met" and "I went without expectations but found it was good upon going."
(those who did not do that matter were excluded from the tabulation)
† For those who visited multiple countries/areas on their last trip in 2017, questioning about degree of satisfaction was limited to the country/area that was the first destination.
† Items with under 30 samples are provided as reference data.
† Items with under 10 samples are not indicated in the table.
Euro
peM
iddl
e E
ast
or
Afr
ica
US
A (exc
ludi
ng
Haw
aii a
nd
Ala
ska)
Hong
Kong
or
Mac
auO
cean
iaG
uam
or
Sai
pan
Haw
aii
74.9%
75.6
70.0
84.4
81.0
94.0
89.5
82.9
76.4
92.6
70.9
82.0
80.8
77.3
81.4
77.5
86.8
87.2
71.1
74.5
78.3
41.5
77.0
56.1
65.7
62.0
74.9
64.6
70.2
51.3
68.6
75.8
73.9
57.9
50.6
62.6
70.4
70.3
77.6
73.8
81.3
76.8
67.2
15.9
15.5
18.1
8.0
11.1
3.8
8.1
13.8
14.4
-
18.8
10.1
11.9
19.8
7.5
16.2
8.9
3.4
18.0
21.2
10.5
39.3
15.9
29.8
19.9
15.4
15.4
23.7
16.0
27.9
12.6
19.0
8.2
26.6
29.5
29.1
17.2
25.8
13.9
21.1
11.7
14.8
20.7
2.1
2.4
-
-
2.1
-
-
0.7
1.3
-
4.5
2.2
0.7
-
1.1
1.7
0.6
0.9
2.3
4.3
5.2
5.3
3.5
6.7
4.7
2.7
1.5
4.6
0.8
6.6
6.2
2.2
1.2
5.8
5.6
3.5
4.8
-
2.1
2.2
1.0
1.9
3.3
7.1
6.6
11.9
7.5
5.8
2.2
2.4
2.6
7.9
7.4
5.7
5.7
6.5
3.0
9.9
4.6
3.7
8.4
8.6
-
6.1
14.0
3.5
7.4
9.8
20.0
8.2
7.1
13.1
14.1
12.6
3.0
16.7
9.8
14.3
4.9
7.5
3.8
6.5
2.9
6.0
6.5
8.8
South
eas
t A
sia
Chin
a
(exc
ludi
ng
Hong
Kong
and
Mac
au)
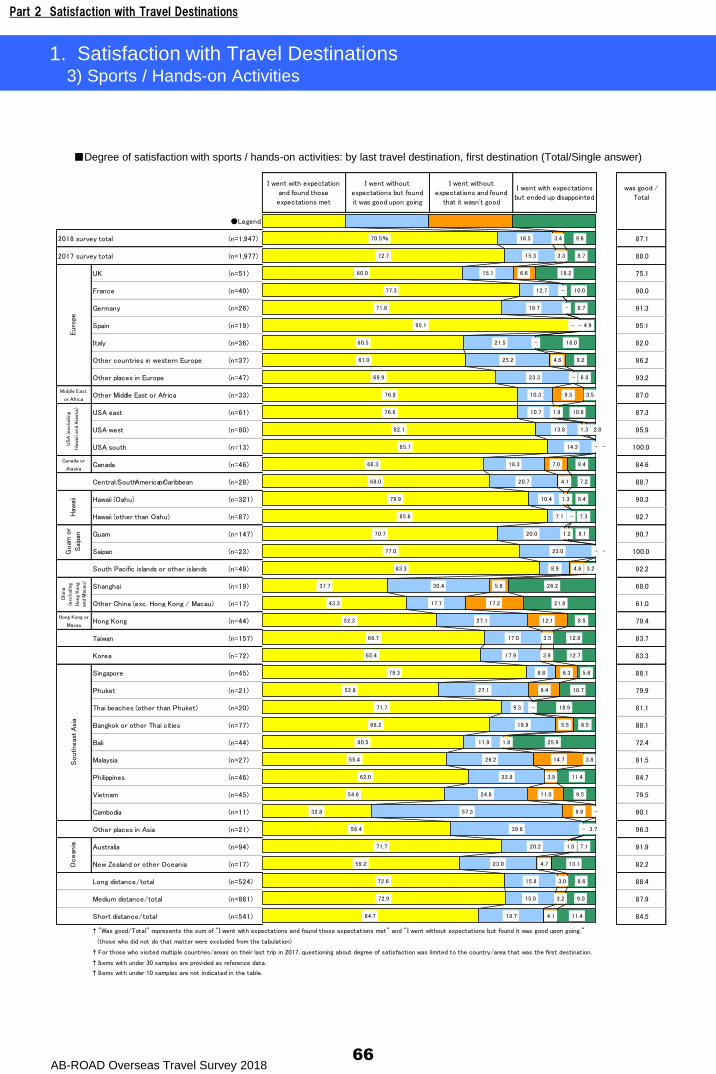
Part 2 Satisfaction with Travel Destinations
AB-ROAD Overseas Travel Survey 201866
1. Satisfaction with Travel Destinations3) Sports / Hands-on Activities
■Degree of satisfaction with sports / hands-on activities: by last travel destination, first destination (Total/Single answer)
I went with expectation
and found those
expectations met
I went without
expectations but found
it was good upon going
I went without
expectations and found
that it wasn't good
I went with expectations
but ended up disappointed
was good /
Total
●Legend
2018 survey total (n=1,947) 87.1
2017 survey total (n=1,977) 88.0
UK (n=51) 75.1
France (n=40) 90.0
Germany (n=26) 91.3
Spain (n=19) 95.1
Italy (n=36) 82.0
Other countries in western Europe (n=37) 86.2
Other places in Europe (n=47) 93.2
Middle East
or AfricaOther Middle East or Africa (n=33) 87.0
USA east (n=61) 87.3
USA west (n=80) 95.9
USA south (n=13) 100.0
Canada or
AlaskaCanada (n=46) 84.6
Central/SouthAmericaorCaribbean (n=28) 88.7
Hawaii (Oahu) (n=321) 90.3
Hawaii (other than Oahu) (n=87) 92.7
Guam (n=147) 90.7
Saipan (n=23) 100.0
South Pacific islands or other islands (n=49) 92.2
Shanghai (n=19) 68.0
Other China (exc. Hong Kong / Macau) (n=17) 61.0
Hong Kong or
MacauHong Kong (n=44) 79.4
Taiwan (n=157) 83.7
Korea (n=72) 83.3
Singapore (n=45) 88.1
Phuket (n=21) 79.9
Thai beaches (other than Phuket) (n=20) 81.1
Bangkok or other Thai cities (n=77) 88.1
Bali (n=44) 72.4
Malaysia (n=27) 81.5
Philippines (n=46) 84.7
Vietnam (n=45) 79.5
Cambodia (n=11) 90.1
Other places in Asia (n=21) 96.3
Australia (n=94) 91.9
New Zealand or other Oceania (n=17) 82.2
Long distance/total (n=524) 88.4
Medium distance/total (n=881) 87.9
Short distance/total (n=541) 84.5
† "Was good/Total" represents the sum of "I went with expectations and found those expectations met" and "I went without expectations but found it was good upon going."
(those who did not do that matter were excluded from the tabulation)
† For those who visited multiple countries/areas on their last trip in 2017, questioning about degree of satisfaction was limited to the country/area that was the first destination.
† Items with under 30 samples are provided as reference data.
† Items with under 10 samples are not indicated in the table.
Euro
peU
SA
(exc
ludi
ng
Haw
aii a
nd
Ala
ska)
Guam
or
Sai
pan
Haw
aii
Ocean
ia
70.5%
72.7
60.0
77.3
71.6
95.1
60.5
61.0
69.9
76.8
76.6
82.1
85.7
66.3
68.0
79.9
85.6
70.7
77.0
83.3
37.7
43.3
52.3
66.7
65.4
79.3
52.8
71.7
68.2
60.5
55.4
62.0
54.6
32.8
56.4
71.7
59.2
72.6
72.9
64.7
16.5
15.3
15.1
12.7
19.7
-
21.5
25.2
23.3
10.3
10.7
13.8
14.3
18.3
20.7
10.4
7.1
20.0
23.0
8.9
30.4
17.7
27.1
17.0
17.9
8.8
27.1
9.3
19.9
11.9
26.2
22.8
24.8
57.3
39.8
20.2
23.0
15.8
15.0
19.7
3.4
3.3
6.6
-
-
-
-
4.6
-
9.5
1.9
1.3
-
7.0
4.1
1.3
-
1.2
-
4.6
5.8
17.2
12.1
3.5
3.9
6.3
9.4
-
5.5
1.8
14.7
3.9
11.0
9.9
-
1.0
4.7
3.0
3.2
4.1
9.6
8.7
18.2
10.0
8.7
4.9
18.0
9.2
6.8
3.5
10.8
2.8
-
8.4
7.2
8.4
7.3
8.1
-
3.2
26.2
21.8
8.5
12.8
12.7
5.6
10.7
18.9
6.5
25.9
3.8
11.4
9.5
-
3.7
7.1
13.1
8.6
9.0
11.4
Chin
a
(exc
ludi
ng
Hon
g K
ong
and
Mac
au)
South
eas
t A
sia
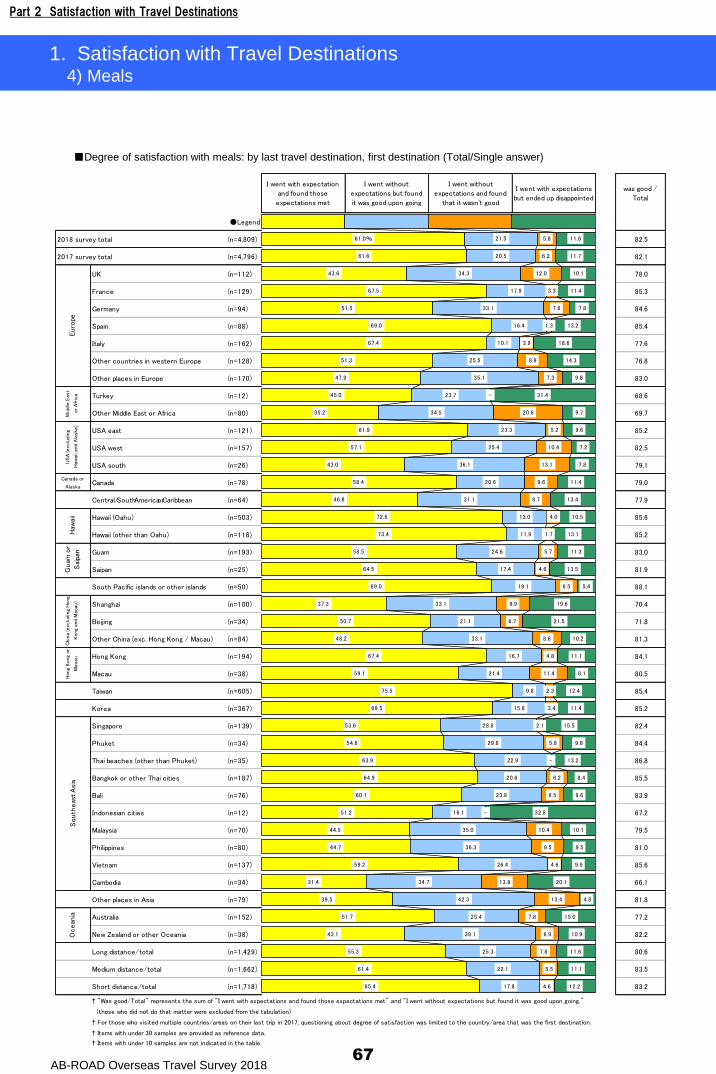
Part 2 Satisfaction with Travel Destinations
AB-ROAD Overseas Travel Survey 201867
1. Satisfaction with Travel Destinations4) Meals
■Degree of satisfaction with meals: by last travel destination, first destination (Total/Single answer)
I went with expectation
and found those
expectations met
I went without
expectations but found
it was good upon going
I went without
expectations and found
that it wasn't good
I went with expectations
but ended up disappointed
was good /
Total
●Legend
2018 survey total (n=4,809) 82.5
2017 survey total (n=4,796) 82.1
UK (n=112) 78.0
France (n=129) 85.3
Germany (n=94) 84.6
Spain (n=88) 85.4
Italy (n=162) 77.6
Other countries in western Europe (n=128) 76.8
Other places in Europe (n=170) 83.0
Turkey (n=12) 68.6
Other Middle East or Africa (n=80) 69.7
USA east (n=121) 85.2
USA west (n=157) 82.5
USA south (n=26) 79.1
Canada or
AlaskaCanada (n=78) 79.0
Central/SouthAmericaorCaribbean (n=64) 77.9
Hawaii (Oahu) (n=503) 85.6
Hawaii (other than Oahu) (n=118) 85.2
Guam (n=193) 83.0
Saipan (n=25) 81.9
South Pacific islands or other islands (n=50) 88.1
Shanghai (n=100) 70.4
Beijing (n=34) 71.8
Other China (exc. Hong Kong / Macau) (n=84) 81.3
Hong Kong (n=194) 84.1
Macau (n=38) 80.5
Taiwan (n=605) 85.4
Korea (n=367) 85.2
Singapore (n=139) 82.4
Phuket (n=34) 84.4
Thai beaches (other than Phuket) (n=35) 86.8
Bangkok or other Thai cities (n=187) 85.5
Bali (n=76) 83.9
Indonesian cities (n=12) 67.2
Malaysia (n=70) 79.5
Philippines (n=80) 81.0
Vietnam (n=137) 85.6
Cambodia (n=34) 66.1
Other places in Asia (n=79) 81.8
Australia (n=152) 77.2
New Zealand or other Oceania (n=38) 82.2
Long distance/total (n=1,429) 80.6
Medium distance/total (n=1,662) 83.5
Short distance/total (n=1,718) 83.2
† "Was good/Total" represents the sum of "I went with expectations and found those expectations met" and "I went without expectations but found it was good upon going."
(those who did not do that matter were excluded from the tabulation)
† For those who visited multiple countries/areas on their last trip in 2017, questioning about degree of satisfaction was limited to the country/area that was the first destination.
† Items with under 30 samples are provided as reference data.
† Items with under 10 samples are not indicated in the table.
Euro
peM
iddl
e E
ast
or
Afr
ica
US
A (exc
ludi
ng
Haw
aii a
nd
Ala
ska)
Hong
Kong
or
Mac
auO
cean
iaG
uam
or
Sai
pan
Haw
aii
Chin
a (e
xclu
ding
Hong
Kong
and
Mac
au)
61.0%
61.6
43.6
67.5
51.5
69.0
67.4
51.3
47.9
45.0
35.2
61.9
57.1
43.0
58.4
46.8
72.5
73.4
58.5
64.5
69.0
37.3
50.7
48.2
67.4
59.1
75.5
69.5
53.6
54.6
63.9
64.9
60.1
51.2
44.5
44.7
59.2
31.4
39.5
51.7
43.1
55.3
61.4
65.4
21.5
20.5
34.3
17.9
33.1
16.4
10.1
25.5
35.1
23.7
34.5
23.3
25.4
36.1
20.6
31.1
13.0
11.9
24.6
17.4
19.1
33.1
21.1
33.1
16.7
21.4
9.8
15.8
28.8
29.8
22.9
20.6
23.8
16.1
35.0
36.3
26.4
34.7
42.3
25.4
39.1
25.3
22.1
17.8
5.8
6.2
12.0
3.3
7.6
1.3
3.9
8.9
7.3
-
20.6
5.2
10.4
13.1
9.6
8.7
4.0
1.7
5.7
4.6
6.5
9.9
6.7
8.6
4.8
11.4
2.3
3.4
2.1
5.8
-
6.2
6.5
-
10.4
9.5
4.6
13.8
13.4
7.8
6.9
7.8
5.5
4.6
11.6
11.7
10.1
11.4
7.8
13.2
18.6
14.3
9.8
31.4
9.7
9.6
7.2
7.8
11.4
13.4
10.5
13.1
11.3
13.5
5.4
19.6
21.5
10.2
11.1
8.1
12.4
11.4
15.5
9.8
13.2
8.4
9.6
32.8
10.1
9.5
9.9
20.1
4.8
15.0
10.9
11.6
11.1
12.2
South
eas
t A
sia

Part 2 Satisfaction with Travel Destinations
AB-ROAD Overseas Travel Survey 201868
1. Satisfaction with Travel Destinations5) Shopping
■Degree of satisfaction with shopping: by last travel destination, first destination (Total/Single answer)
I went with expectation
and found those
expectations met
I went without
expectations but found
it was good upon going
I went without
expectations and found
that it wasn't good
I went with expectations
but ended up disappointed
was good /
Total
●Legend
2018 survey total (n=4,200) 80.9
2017 survey total (n=4,185) 80.7
UK (n=97) 82.8
France (n=119) 89.1
Germany (n=79) 84.4
Spain (n=70) 87.6
Italy (n=146) 86.9
Other countries in western Europe (n=107) 80.3
Other places in Europe (n=145) 83.8
Turkey (n=11) 80.9
Other Middle East or Africa (n=72) 67.6
USA east (n=116) 84.7
USA west (n=137) 89.3
USA south (n=22) 80.3
Canada or
AlaskaCanada (n=76) 73.9
Central/SouthAmericaorCaribbean (n=53) 74.3
Hawaii (Oahu) (n=487) 88.4
Hawaii (other than Oahu) (n=113) 85.0
Guam (n=183) 78.1
Saipan (n=24) 90.5
South Pacific islands or other islands (n=36) 65.5
Shanghai (n=77) 60.3
Beijing (n=23) 68.5
Other China (exc. Hong Kong / Macau) (n=57) 71.7
Hong Kong (n=151) 74.2
Macau (n=23) 70.8
Taiwan (n=514) 81.7
Korea (n=334) 81.3
Singapore (n=115) 75.6
Phuket (n=30) 78.7
Thai beaches (other than Phuket) (n=31) 76.6
Bangkok or other Thai cities (n=167) 88.0
Bali (n=68) 76.3
Indonesian cities (n=12) 83.0
Malaysia (n=63) 75.5
Philippines (n=68) 74.0
Vietnam (n=112) 82.9
Cambodia (n=29) 64.8
Other places in Asia (n=64) 65.9
Australia (n=136) 73.7
New Zealand or other Oceania (n=31) 74.9
Long distance/total (n=1,254) 83.2
Medium distance/total (n=1,492) 81.6
Short distance/total (n=1,454) 78.2
† "Was good/Total" represents the sum of "I went with expectations and found those expectations met" and "I went without expectations but found it was good upon going."
(those who did not do that matter were excluded from the tabulation)
† For those who visited multiple countries/areas on their last trip in 2017, questioning about degree of satisfaction was limited to the country/area that was the first destination.
† Items with under 30 samples are provided as reference data.
† Items with under 10 samples are not indicated in the table.
Euro
peM
iddl
e E
ast
or
Afr
ica
US
A (exc
ludi
ng
Haw
aii a
nd
Ala
ska)
Hong
Kong
or
Mac
auO
cean
iaG
uam
or
Sai
pan
Haw
aii
Chin
a (e
xclu
ding
Hong
Kong
and
Mac
au)
59.4%
60.7
52.7
72.5
55.0
66.4
69.1
48.5
43.2
29.6
38.7
64.6
68.7
56.5
53.0
43.9
76.8
75.5
58.5
67.6
47.1
34.1
45.9
34.8
57.0
56.5
65.4
64.4
52.8
46.7
51.6
64.4
56.3
57.6
37.3
39.5
50.6
27.1
29.3
57.8
46.1
57.4
61.6
59.0
21.5
19.9
30.1
16.7
29.4
21.2
17.8
31.9
40.6
51.3
28.9
20.1
20.6
23.9
20.9
30.4
11.6
9.5
19.5
22.9
18.4
26.2
22.6
36.9
17.2
14.3
16.3
16.9
22.7
32.0
25.0
23.5
20.0
25.4
38.2
34.6
32.2
37.8
36.6
16.0
28.8
25.8
19.9
19.3
6.4
6.9
5.4
1.5
8.7
6.0
0.8
4.8
4.1
9.1
21.6
2.4
3.6
-
10.1
15.7
2.9
2.4
8.4
4.7
23.1
18.6
9.9
16.3
6.7
3.4
4.4
4.8
5.1
10.3
10.9
6.4
5.7
-
8.4
14.2
4.4
17.1
23.8
9.7
8.3
5.7
6.5
7.0
12.7
12.5
11.8
9.3
6.9
6.4
12.3
14.8
12.1
10.0
10.9
12.9
7.0
19.7
16.0
10.0
8.7
12.6
13.6
4.8
11.4
21.2
21.5
12.0
19.2
25.8
13.9
13.9
19.4
11.0
12.5
5.6
18.0
17.0
16.0
11.7
12.7
18.1
10.3
16.6
16.8
11.1
11.9
14.8
South
eas
t A
sia
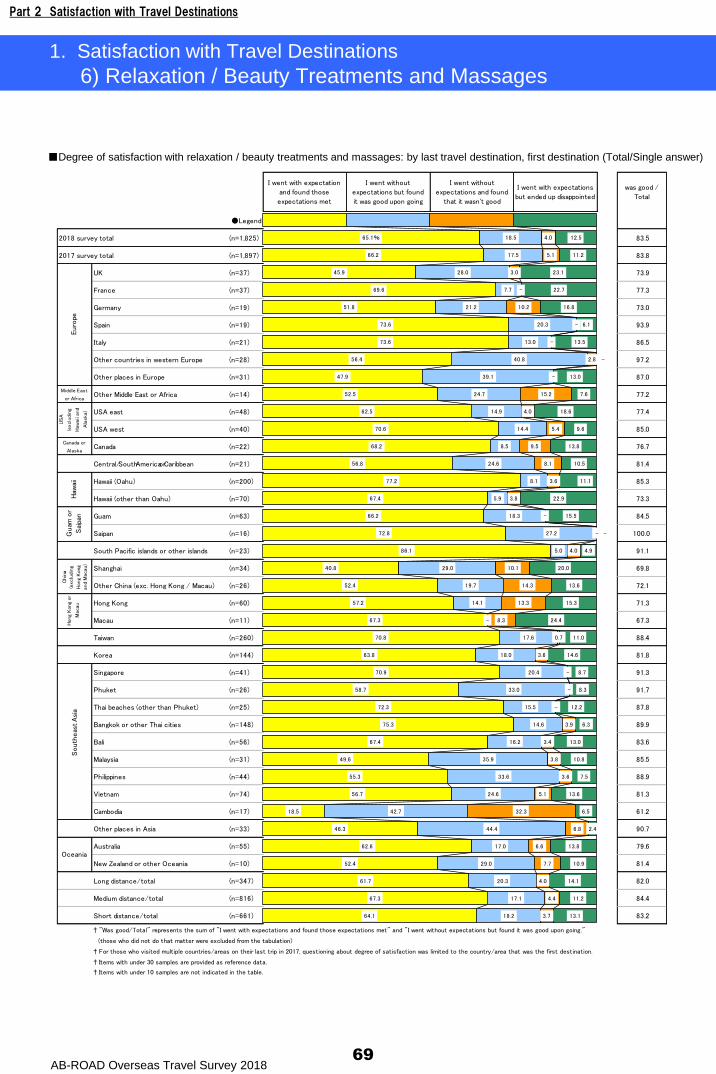
Part 2 Satisfaction with Travel Destinations
AB-ROAD Overseas Travel Survey 201869
1. Satisfaction with Travel Destinations
6) Relaxation / Beauty Treatments and Massages
■Degree of satisfaction with relaxation / beauty treatments and massages: by last travel destination, first destination (Total/Single answer)
I went with expectation
and found those
expectations met
I went without
expectations but found
it was good upon going
I went without
expectations and found
that it wasn't good
I went with expectations
but ended up disappointed
was good /
Total
●Legend
2018 survey total (n=1,825) 83.5
2017 survey total (n=1,897) 83.8
UK (n=37) 73.9
France (n=37) 77.3
Germany (n=19) 73.0
Spain (n=19) 93.9
Italy (n=21) 86.5
Other countries in western Europe (n=28) 97.2
Other places in Europe (n=31) 87.0
Middle East
or AfricaOther Middle East or Africa (n=14) 77.2
USA east (n=48) 77.4
USA west (n=40) 85.0
Canada or
AlaskaCanada (n=22) 76.7
Central/SouthAmericaorCaribbean (n=21) 81.4
Hawaii (Oahu) (n=200) 85.3
Hawaii (other than Oahu) (n=70) 73.3
Guam (n=63) 84.5
Saipan (n=16) 100.0
South Pacific islands or other islands (n=23) 91.1
Shanghai (n=34) 69.8
Other China (exc. Hong Kong / Macau) (n=26) 72.1
Hong Kong (n=60) 71.3
Macau (n=11) 67.3
Taiwan (n=260) 88.4
Korea (n=144) 81.8
Singapore (n=41) 91.3
Phuket (n=26) 91.7
Thai beaches (other than Phuket) (n=25) 87.8
Bangkok or other Thai cities (n=148) 89.9
Bali (n=56) 83.6
Malaysia (n=31) 85.5
Philippines (n=44) 88.9
Vietnam (n=74) 81.3
Cambodia (n=17) 61.2
Other places in Asia (n=33) 90.7
Australia (n=55) 79.6
New Zealand or other Oceania (n=10) 81.4
Long distance/total (n=347) 82.0
Medium distance/total (n=816) 84.4
Short distance/total (n=661) 83.2
† "Was good/Total" represents the sum of "I went with expectations and found those expectations met" and "I went without expectations but found it was good upon going."
(those who did not do that matter were excluded from the tabulation)
† For those who visited multiple countries/areas on their last trip in 2017, questioning about degree of satisfaction was limited to the country/area that was the first destination.
† Items with under 30 samples are provided as reference data.
† Items with under 10 samples are not indicated in the table.
Euro
pe
Oceania
Hong
Kong
or
Mac
auH
awai
iG
uam
or
Sai
pan
US
A
(exc
ludi
ng
Haw
aii a
nd
Ala
ska)
65.1%
66.2
45.9
69.6
51.8
73.6
73.6
56.4
47.9
52.5
62.5
70.6
68.2
56.8
77.2
67.4
66.2
72.8
86.1
40.8
52.4
57.2
67.3
70.8
63.8
70.9
58.7
72.3
75.3
67.4
49.6
55.3
56.7
18.5
46.3
62.6
52.4
61.7
67.3
64.1
18.5
17.5
28.0
7.7
21.2
20.3
13.0
40.8
39.1
24.7
14.9
14.4
8.5
24.6
8.1
5.9
18.3
27.2
5.0
29.0
19.7
14.1
-
17.6
18.0
20.4
33.0
15.5
14.6
16.2
35.9
33.6
24.6
42.7
44.4
17.0
29.0
20.3
17.1
19.2
4.0
5.1
3.0
-
10.2
-
-
2.8
-
15.2
4.0
5.4
9.5
8.1
3.6
3.8
-
-
4.0
10.1
14.3
13.3
8.3
0.7
3.6
-
-
-
3.9
3.4
3.8
3.6
5.1
32.3
6.8
6.6
7.7
4.0
4.4
3.7
12.5
11.2
23.1
22.7
16.8
6.1
13.5
-
13.0
7.6
18.6
9.6
13.8
10.5
11.1
22.9
15.5
-
4.9
20.0
13.6
15.3
24.4
11.0
14.6
8.7
8.3
12.2
6.3
13.0
10.8
7.5
13.6
6.5
2.4
13.8
10.9
14.1
11.2
13.1
South
eas
t A
sia
Chin
a
(exclu
din
g
Hong K
ong
and M
acau)
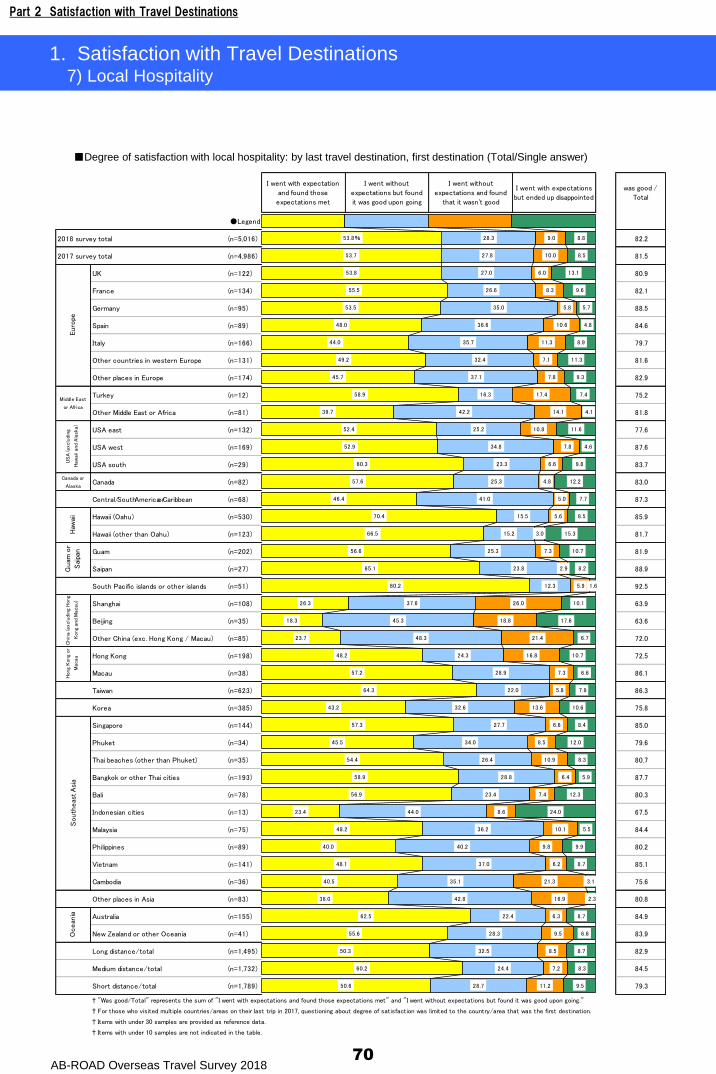
Part 2 Satisfaction with Travel Destinations
AB-ROAD Overseas Travel Survey 201870
1. Satisfaction with Travel Destinations7) Local Hospitality
I went with expectation
and found those
expectations met
I went without
expectations but found
it was good upon going
I went without
expectations and found
that it wasn't good
I went with expectations
but ended up disappointed
was good /
Total
●Legend
2018 survey total (n=5,016) 82.2
2017 survey total (n=4,986) 81.5
UK (n=122) 80.9
France (n=134) 82.1
Germany (n=95) 88.5
Spain (n=89) 84.6
Italy (n=166) 79.7
Other countries in western Europe (n=131) 81.6
Other places in Europe (n=174) 82.9
Turkey (n=12) 75.2
Other Middle East or Africa (n=81) 81.8
USA east (n=132) 77.6
USA west (n=169) 87.6
USA south (n=29) 83.7
Canada or
AlaskaCanada (n=82) 83.0
Central/SouthAmericaorCaribbean (n=68) 87.3
Hawaii (Oahu) (n=530) 85.9
Hawaii (other than Oahu) (n=123) 81.7
Guam (n=202) 81.9
Saipan (n=27) 88.9
South Pacific islands or other islands (n=51) 92.5
Shanghai (n=108) 63.9
Beijing (n=35) 63.6
Other China (exc. Hong Kong / Macau) (n=85) 72.0
Hong Kong (n=198) 72.5
Macau (n=38) 86.1
Taiwan (n=623) 86.3
Korea (n=385) 75.8
Singapore (n=144) 85.0
Phuket (n=34) 79.6
Thai beaches (other than Phuket) (n=35) 80.7
Bangkok or other Thai cities (n=193) 87.7
Bali (n=78) 80.3
Indonesian cities (n=13) 67.5
Malaysia (n=75) 84.4
Philippines (n=89) 80.2
Vietnam (n=141) 85.1
Cambodia (n=36) 75.6
Other places in Asia (n=83) 80.8
Australia (n=155) 84.9
New Zealand or other Oceania (n=41) 83.9
Long distance/total (n=1,495) 82.9
Medium distance/total (n=1,732) 84.5
Short distance/total (n=1,789) 79.3
† "Was good/Total" represents the sum of "I went with expectations and found those expectations met" and "I went without expectations but found it was good upon going."
† For those who visited multiple countries/areas on their last trip in 2017, questioning about degree of satisfaction was limited to the country/area that was the first destination.
† Items with under 30 samples are provided as reference data.
† Items with under 10 samples are not indicated in the table.
Euro
pe
Middle East
or Africa
US
A (exc
ludi
ng
Haw
aii a
nd
Ala
ska)
Hong
Kong
or
Mac
auO
cean
iaG
uam
or
Sai
pan
Haw
aii
Chin
a (e
xclu
ding
Hong
Kong
and
Mac
au)
53.8%
53.7
53.8
55.5
53.5
48.0
44.0
49.2
45.7
58.9
39.7
52.4
52.9
60.3
57.6
46.4
70.4
66.5
56.6
65.1
80.2
26.3
18.3
23.7
48.2
57.2
64.3
43.2
57.3
45.5
54.4
58.9
56.9
23.4
48.2
40.0
48.1
40.5
38.0
62.5
55.6
50.3
60.2
50.6
28.3
27.8
27.0
26.6
35.0
36.6
35.7
32.4
37.1
16.3
42.2
25.2
34.8
23.3
25.3
41.0
15.5
15.2
25.3
23.8
12.3
37.6
45.3
48.3
24.3
28.9
22.0
32.6
27.7
34.0
26.4
28.8
23.4
44.0
36.2
40.2
37.0
35.1
42.8
22.4
28.3
32.5
24.4
28.7
9.0
10.0
6.0
8.3
5.8
10.6
11.3
7.1
7.8
17.4
14.1
10.8
7.8
6.6
4.8
5.0
5.6
3.0
7.3
2.9
5.9
26.0
18.8
21.4
16.8
7.3
5.8
13.6
6.6
8.5
10.9
6.4
7.4
8.6
10.1
9.8
6.2
21.3
16.9
6.3
9.5
8.5
7.2
11.2
8.8
8.5
13.1
9.6
5.7
4.8
8.9
11.3
9.3
7.4
4.1
11.6
4.6
9.8
12.2
7.7
8.5
15.3
10.7
8.2
1.6
10.1
17.6
6.7
10.7
6.6
7.9
10.6
8.4
12.0
8.3
5.9
12.3
24.0
5.5
9.9
8.7
3.1
2.3
8.7
6.6
8.7
8.3
9.5
South
eas
t A
sia
■Degree of satisfaction with local hospitality: by last travel destination, first destination (Total/Single answer)
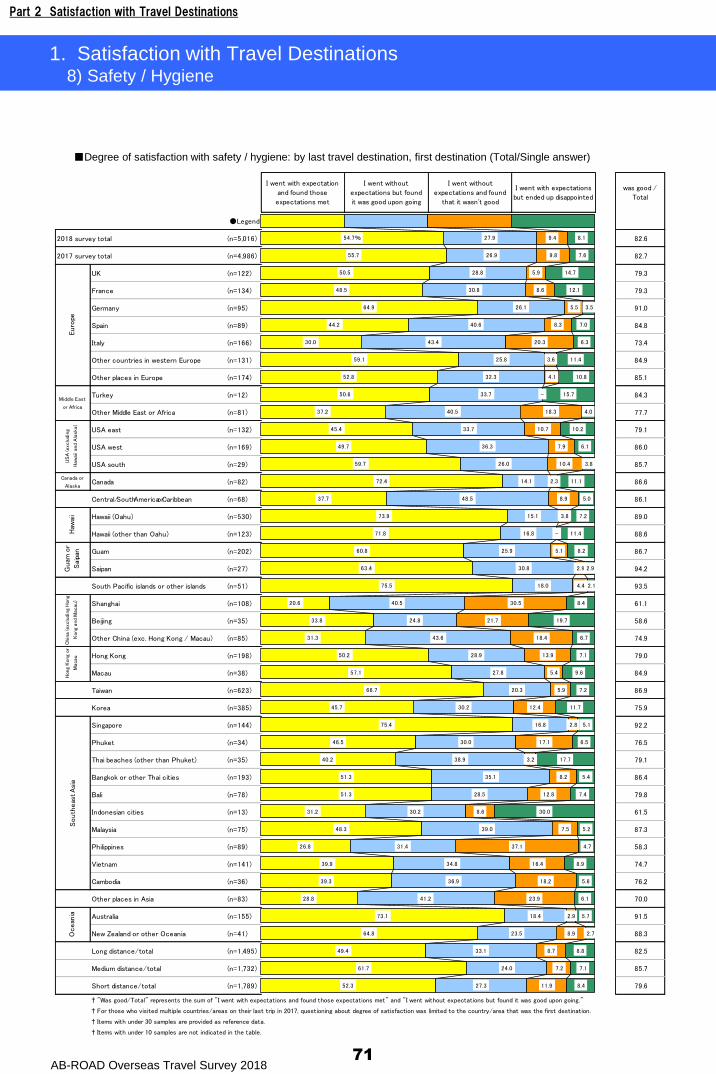
Part 2 Satisfaction with Travel Destinations
AB-ROAD Overseas Travel Survey 201871
1. Satisfaction with Travel Destinations8) Safety / Hygiene
I went with expectation
and found those
expectations met
I went without
expectations but found
it was good upon going
I went without
expectations and found
that it wasn't good
I went with expectations
but ended up disappointed
was good /
Total
●Legend
2018 survey total (n=5,016) 82.6
2017 survey total (n=4,986) 82.7
UK (n=122) 79.3
France (n=134) 79.3
Germany (n=95) 91.0
Spain (n=89) 84.8
Italy (n=166) 73.4
Other countries in western Europe (n=131) 84.9
Other places in Europe (n=174) 85.1
Turkey (n=12) 84.3
Other Middle East or Africa (n=81) 77.7
USA east (n=132) 79.1
USA west (n=169) 86.0
USA south (n=29) 85.7
Canada or
AlaskaCanada (n=82) 86.6
Central/SouthAmericaorCaribbean (n=68) 86.1
Hawaii (Oahu) (n=530) 89.0
Hawaii (other than Oahu) (n=123) 88.6
Guam (n=202) 86.7
Saipan (n=27) 94.2
South Pacific islands or other islands (n=51) 93.5
Shanghai (n=108) 61.1
Beijing (n=35) 58.6
Other China (exc. Hong Kong / Macau) (n=85) 74.9
Hong Kong (n=198) 79.0
Macau (n=38) 84.9
Taiwan (n=623) 86.9
Korea (n=385) 75.9
Singapore (n=144) 92.2
Phuket (n=34) 76.5
Thai beaches (other than Phuket) (n=35) 79.1
Bangkok or other Thai cities (n=193) 86.4
Bali (n=78) 79.8
Indonesian cities (n=13) 61.5
Malaysia (n=75) 87.3
Philippines (n=89) 58.3
Vietnam (n=141) 74.7
Cambodia (n=36) 76.2
Other places in Asia (n=83) 70.0
Australia (n=155) 91.5
New Zealand or other Oceania (n=41) 88.3
Long distance/total (n=1,495) 82.5
Medium distance/total (n=1,732) 85.7
Short distance/total (n=1,789) 79.6
† "Was good/Total" represents the sum of "I went with expectations and found those expectations met" and "I went without expectations but found it was good upon going."
† For those who visited multiple countries/areas on their last trip in 2017, questioning about degree of satisfaction was limited to the country/area that was the first destination.
† Items with under 30 samples are provided as reference data.
† Items with under 10 samples are not indicated in the table.
Euro
pe
Middle East
or Africa
US
A (exc
ludi
ng
Haw
aii a
nd
Ala
ska)
Hong
Kong
or
Mac
auO
cean
iaG
uam
or
Sai
pan
Haw
aii
Chin
a (e
xclu
ding
Hong
Kong
and
Mac
au)
54.7%
55.7
50.5
48.5
64.9
44.2
30.0
59.1
52.8
50.6
37.2
45.4
49.7
59.7
72.4
37.7
73.9
71.8
60.8
63.4
75.5
20.6
33.8
31.3
50.2
57.1
66.7
45.7
75.4
46.5
40.2
51.3
51.3
31.2
48.3
26.8
39.9
39.3
28.8
73.1
64.8
49.4
61.7
52.3
27.9
26.9
28.8
30.8
26.1
40.6
43.4
25.8
32.3
33.7
40.5
33.7
36.3
26.0
14.1
48.5
15.1
16.8
25.9
30.8
18.0
40.5
24.8
43.6
28.9
27.8
20.3
30.2
16.8
30.0
38.9
35.1
28.5
30.2
39.0
31.4
34.8
36.9
41.2
18.4
23.5
33.1
24.0
27.3
9.4
9.8
5.9
8.6
5.5
8.3
20.3
3.6
4.1
-
18.3
10.7
7.9
10.4
2.3
8.9
3.8
-
5.1
2.9
4.4
30.5
21.7
18.4
13.9
5.4
5.9
12.4
2.8
17.1
3.2
8.2
12.8
8.6
7.5
37.1
16.4
18.2
23.9
2.9
8.9
8.7
7.2
11.9
8.1
7.6
14.7
12.1
3.5
7.0
6.3
11.4
10.8
15.7
4.0
10.2
6.1
3.8
11.1
5.0
7.2
11.4
8.2
2.9
2.1
8.4
19.7
6.7
7.1
9.6
7.2
11.7
5.1
6.5
17.7
5.4
7.4
30.0
5.2
4.7
8.9
5.6
6.1
5.7
2.7
8.8
7.1
8.4
South
eas
t A
sia
■Degree of satisfaction with safety / hygiene: by last travel destination, first destination (Total/Single answer)
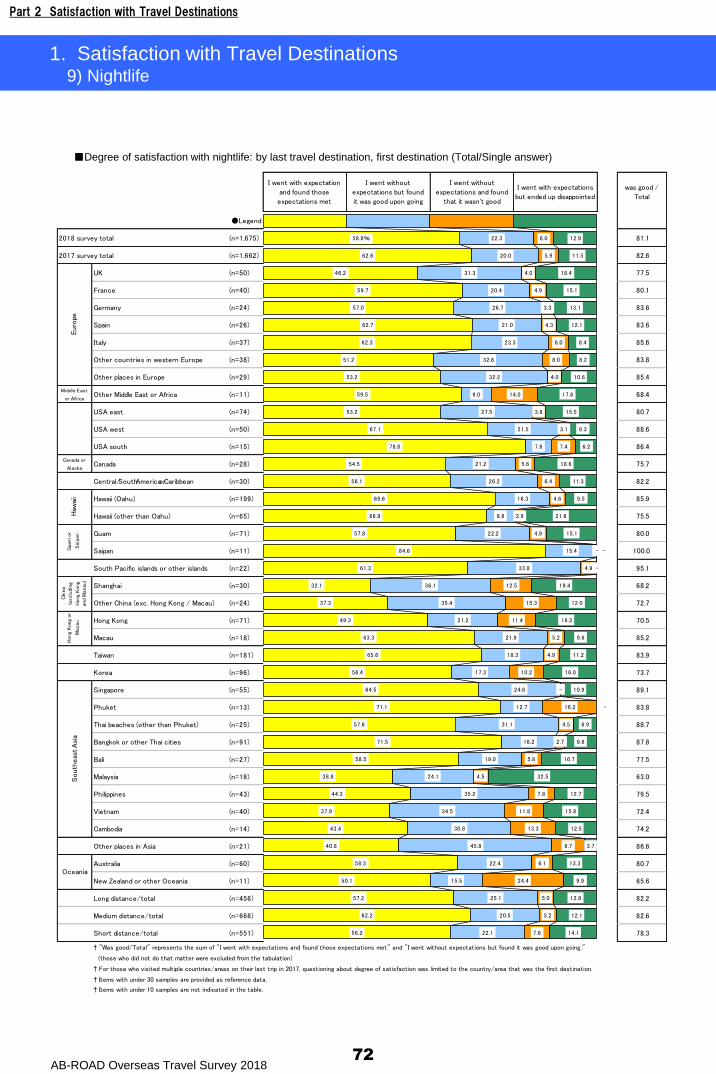
Part 2 Satisfaction with Travel Destinations
AB-ROAD Overseas Travel Survey 201872
1. Satisfaction with Travel Destinations9) Nightlife
■Degree of satisfaction with nightlife: by last travel destination, first destination (Total/Single answer)
I went with expectation
and found those
expectations met
I went without
expectations but found
it was good upon going
I went without
expectations and found
that it wasn't good
I went with expectations
but ended up disappointed
was good /
Total
●Legend
2018 survey total (n=1,675) 81.1
2017 survey total (n=1,662) 82.6
UK (n=50) 77.5
France (n=40) 80.1
Germany (n=24) 83.6
Spain (n=26) 83.6
Italy (n=37) 85.6
Other countries in western Europe (n=38) 83.8
Other places in Europe (n=29) 85.4
Middle East
or AfricaOther Middle East or Africa (n=11) 68.4
USA east (n=74) 80.7
USA west (n=50) 88.6
USA south (n=15) 86.4
Canada or
AlaskaCanada (n=28) 75.7
Central/SouthAmericaorCaribbean (n=30) 82.2
Hawaii (Oahu) (n=199) 85.9
Hawaii (other than Oahu) (n=65) 75.5
Guam (n=71) 80.0
Saipan (n=11) 100.0
South Pacific islands or other islands (n=22) 95.1
Shanghai (n=30) 68.2
Other China (exc. Hong Kong / Macau) (n=24) 72.7
Hong Kong (n=71) 70.5
Macau (n=18) 85.2
Taiwan (n=181) 83.9
Korea (n=96) 73.7
Singapore (n=55) 89.1
Phuket (n=13) 83.8
Thai beaches (other than Phuket) (n=25) 88.7
Bangkok or other Thai cities (n=91) 87.8
Bali (n=27) 77.5
Malaysia (n=18) 63.0
Philippines (n=43) 79.5
Vietnam (n=40) 72.4
Cambodia (n=14) 74.2
Other places in Asia (n=21) 86.6
Australia (n=60) 80.7
New Zealand or other Oceania (n=11) 65.6
Long distance/total (n=456) 82.2
Medium distance/total (n=668) 82.6
Short distance/total (n=551) 78.3
† "Was good/Total" represents the sum of "I went with expectations and found those expectations met" and "I went without expectations but found it was good upon going."
(those who did not do that matter were excluded from the tabulation)
† For those who visited multiple countries/areas on their last trip in 2017, questioning about degree of satisfaction was limited to the country/area that was the first destination.
† Items with under 30 samples are provided as reference data.
† Items with under 10 samples are not indicated in the table.
Euro
peH
ong
Kong
or
Mac
auH
awai
iG
uam
or
Sai
pan
Oceania
58.8%
62.6
46.2
59.7
57.0
62.7
62.3
51.2
53.2
59.5
53.2
67.1
78.8
54.5
56.1
69.6
66.9
57.8
84.6
61.3
32.1
37.3
49.3
63.3
65.6
56.4
64.5
71.1
57.6
71.5
58.5
38.8
44.3
37.9
43.4
40.8
58.3
50.1
57.2
62.2
56.2
22.3
20.0
31.3
20.4
26.7
21.0
23.3
32.6
32.2
9.0
27.5
21.5
7.6
21.2
26.2
16.3
8.6
22.2
15.4
33.8
36.1
35.4
21.2
21.9
18.3
17.3
24.6
12.7
31.1
16.2
19.0
24.1
35.2
34.5
30.8
45.8
22.4
15.5
25.1
20.5
22.1
6.0
5.9
4.0
4.9
3.3
4.3
6.0
8.0
4.0
14.0
3.8
3.1
7.4
5.6
6.4
4.6
2.9
4.9
-
4.9
12.5
15.3
11.4
5.2
4.9
10.2
-
16.2
4.5
2.7
5.8
4.5
7.8
11.8
13.3
9.7
6.1
24.4
5.0
5.2
7.6
12.9
11.5
18.4
15.1
13.1
12.1
8.4
8.2
10.6
17.6
15.5
8.3
6.2
18.6
11.3
9.5
21.6
15.1
-
-
19.4
12.0
18.2
9.6
11.2
16.0
10.9
-
6.9
9.6
16.7
32.5
12.7
15.8
12.5
3.7
13.3
9.9
12.8
12.1
14.1
Chin
a
(exclu
din
g
Hon
g K
ong
and
Mac
au)
South
eas
t A
sia

73
Part 3
Future Overseas Travel
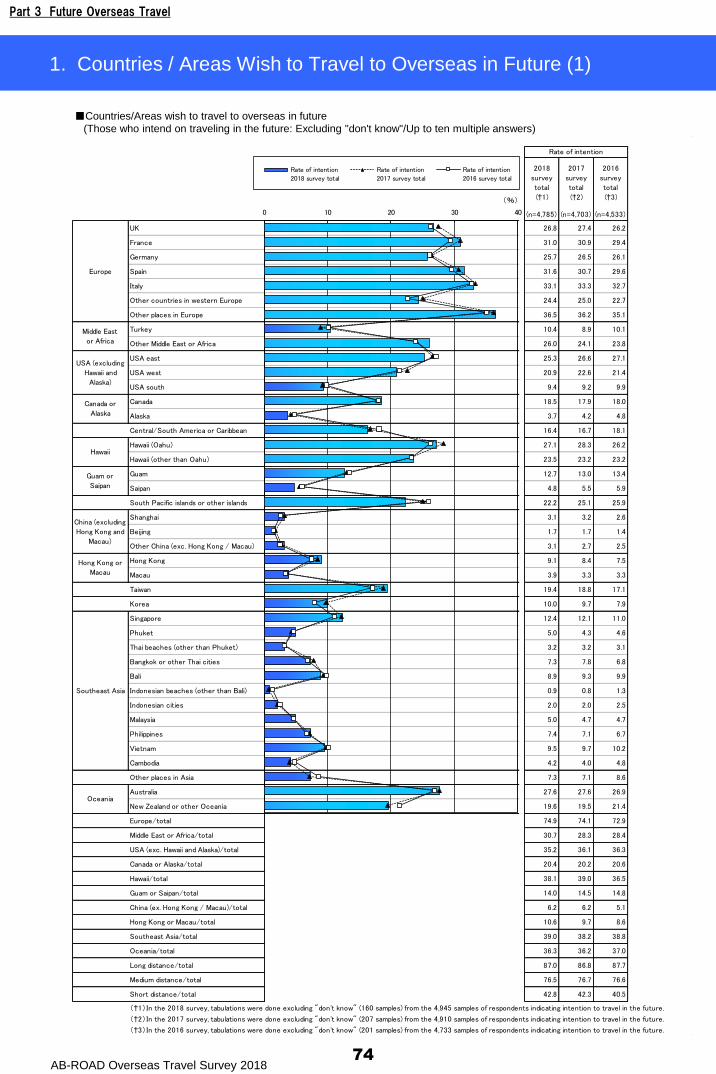
Part 3 Future Overseas Travel
AB-ROAD Overseas Travel Survey 201874
1. Countries / Areas Wish to Travel to Overseas in Future (1)
Rate of
intention
Rate of
intention
Rate of
intention
2018
survey
total
(†1)
2017
survey
total
(†2)
2016
survey
total
(†3)
(n=4,785) (n=4,703) (n=4,533)
UK 26.8 27.4 26.2
France 31.0 30.9 29.4
Germany 25.7 26.5 26.1
Spain 31.6 30.7 29.6
Italy 33.1 33.3 32.7
Other countries in western Europe 24.4 25.0 22.7
Other places in Europe 36.5 36.2 35.1
Turkey 10.4 8.9 10.1
Other Middle East or Africa 26.0 24.1 23.8
USA east 25.3 26.6 27.1
USA west 20.9 22.6 21.4
USA south 9.4 9.2 9.9
Canada 18.5 17.9 18.0
Alaska 3.7 4.2 4.8
Central/South America or Caribbean 16.4 16.7 18.1
Hawaii (Oahu) 27.1 28.3 26.2
Hawaii (other than Oahu) 23.5 23.2 23.2
Guam 12.7 13.0 13.4
Saipan 4.8 5.5 5.9
South Pacific islands or other islands 22.2 25.1 25.9
Shanghai 3.1 3.2 2.6
Beijing 1.7 1.7 1.4
Other China (exc. Hong Kong / Macau) 3.1 2.7 2.5
Hong Kong 9.1 8.4 7.5
Macau 3.9 3.3 3.3
Taiwan 19.4 18.8 17.1
Korea 10.0 9.7 7.9
Singapore 12.4 12.1 11.0
Phuket 5.0 4.3 4.6
Thai beaches (other than Phuket) 3.2 3.2 3.1
Bangkok or other Thai cities 7.3 7.8 6.8
Bali 8.9 9.3 9.9
Indonesian beaches (other than Bali) 0.9 0.8 1.3
Indonesian cities 2.0 2.0 2.5
Malaysia 5.0 4.7 4.7
Philippines 7.4 7.1 6.7
Vietnam 9.5 9.7 10.2
Cambodia 4.2 4.0 4.8
Other places in Asia 7.3 7.1 8.6
Australia 27.6 27.6 26.9
New Zealand or other Oceania 19.6 19.5 21.4
Europe/total 74.9 74.1 72.9
Middle East or Africa/total 30.7 28.3 28.4
USA (exc. Hawaii and Alaska)/total 35.2 36.1 36.3
Canada or Alaska/total 20.4 20.2 20.6
Hawaii/total 38.1 39.0 36.5
Guam or Saipan/total 14.0 14.5 14.8
China (ex. Hong Kong / Macau)/total 6.2 6.2 5.1
Hong Kong or Macau/total 10.6 9.7 8.6
Southeast Asia/total 39.0 38.2 38.8
Oceania/total 36.3 36.2 37.0
Long distance/total 87.0 86.8 87.7
Medium distance/total 76.5 76.7 76.6
Short distance/total 42.8 42.3 40.5
(†1)In the 2018 survey, tabulations were done excluding "don't know" (160 samples) from the 4,945 samples of respondents indicating intention to travel in the future.
(†2)In the 2017 survey, tabulations were done excluding "don't know" (207 samples) from the 4,910 samples of respondents indicating intention to travel in the future.
(†3)In the 2016 survey, tabulations were done excluding "don't know" (201 samples) from the 4,733 samples of respondents indicating intention to travel in the future.
Oceania
Guam or
Saipan
China (excluding
Hong Kong and
Macau)
Hong Kong or
Macau
Southeast Asia
Rate of intention
Europe
Hawaii
Middle East
or Africa
USA (excluding
Hawaii and
Alaska)
Canada or
Alaska
0 10 20 30 40
Rate of intention
2018 survey total
Rate of intention
2017 survey total
Rate of intention
2016 survey total
(%)
■Countries/Areas wish to travel to overseas in future
(Those who intend on traveling in the future: Excluding "don't know"/Up to ten multiple answers)
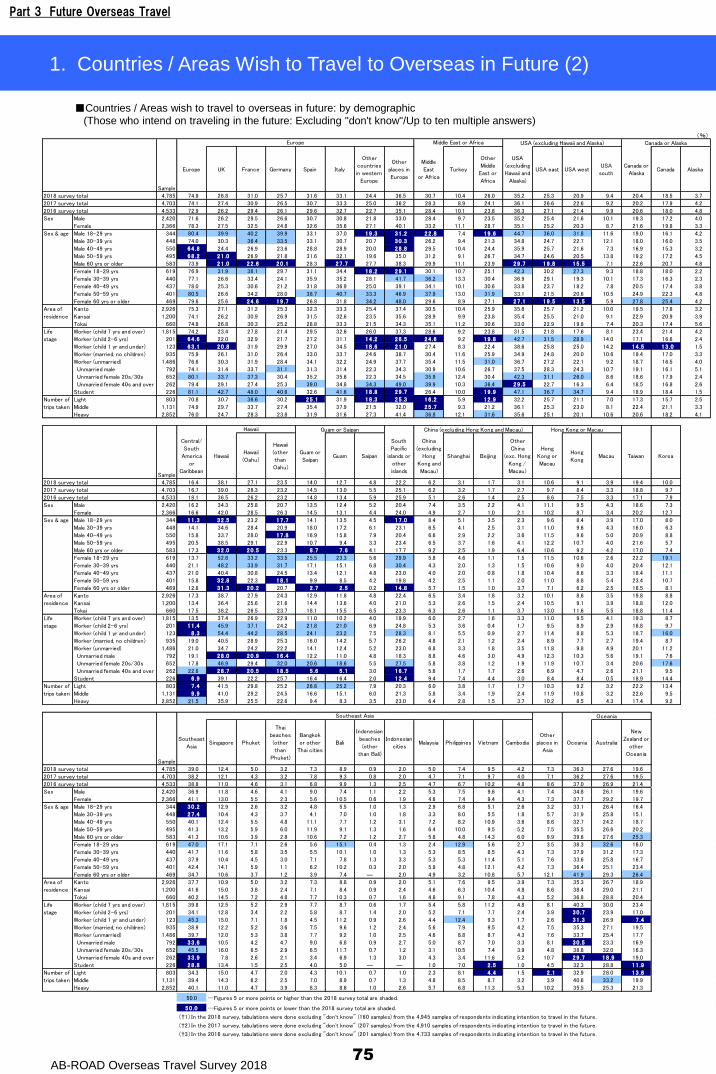
Part 3 Future Overseas Travel
AB-ROAD Overseas Travel Survey 201875
1. Countries / Areas Wish to Travel to Overseas in Future (2)
(%)
Sample
Europe UK France Germany Spain Italy
Other
countries
in western
Europe
Other
places in
Europe
Middle
East
or Africa
Turkey
Other
Middle
East or
Africa
USA
(excluding
Hawaii and
Alaska)
USA east USA westUSA
south
Canada or
AlaskaCanada Alaska
2018 survey total 4,785 74.9 26.8 31.0 25.7 31.6 33.1 24.4 36.5 30.7 10.4 26.0 35.2 25.3 20.9 9.4 20.4 18.5 3.7
2017 survey total 4,703 74.1 27.4 30.9 26.5 30.7 33.3 25.0 36.2 28.3 8.9 24.1 36.1 26.6 22.6 9.2 20.2 17.9 4.2
2016 survey total 4,533 72.9 26.2 29.4 26.1 29.6 32.7 22.7 35.1 28.4 10.1 23.8 36.3 27.1 21.4 9.9 20.6 18.0 4.8
Male 2,420 71.6 26.2 29.5 26.6 30.7 30.8 21.8 33.0 28.4 9.7 23.5 35.2 25.4 21.6 10.1 19.3 17.2 4.0
Female 2,366 78.3 27.5 32.5 24.8 32.6 35.6 27.1 40.1 33.2 11.1 28.7 35.1 25.2 20.3 8.7 21.6 19.8 3.3
Male 18-29 yrs 344 80.4 39.9 40.2 39.9 33.1 37.0 19 .3 31 .2 22 .8 7.4 19 .6 44.7 36.0 31.8 11.6 19.0 16.1 4.2
Male 30-39 yrs 448 74.0 30.3 36.4 33.5 33.1 30.7 20.7 30 .3 26.2 9.4 21.3 34.8 24.7 22.7 12.1 18.0 16.0 3.5
Male 40-49 yrs 550 64 .8 24.4 26.9 23.6 28.8 28.9 20.0 28 .8 29.5 10.4 24.4 35.9 25.7 21.6 7.3 16.9 15.3 3.2
Male 50-59 yrs 495 68 .2 21 .0 26.9 21.8 31.6 32.1 19.6 35.0 31.2 9.1 26.7 34.7 24.6 20.5 13.8 19.2 17.2 4.5
Male 60 yrs or older 583 73.9 21 .0 22 .6 20 .1 28.3 27 .7 27.7 38.3 29.9 11.1 23.9 29 .7 19 .8 15 .5 7.1 22.6 20.7 4.8
Female 18-29 yrs 619 76.9 31.9 38.1 29.7 31.1 34.4 18 .2 29 .1 30.1 10.7 25.1 42.3 30.2 27.3 9.3 18.8 18.0 2.2
Female 30-39 yrs 440 77.1 26.6 33.4 24.1 35.9 35.2 28.1 41.7 36.2 13.3 30.4 36.9 29.1 19.3 10.1 17.3 16.3 2.3
Female 40-49 yrs 437 78.0 25.3 30.6 21.2 31.8 36.9 25.0 39.1 34.1 10.1 30.6 33.8 23.7 18.2 7.8 20.5 17.4 3.8
Female 50-59 yrs 401 80.5 26.6 34.2 28.0 38.7 40.7 33.3 46.9 37.9 13.0 31.9 33.1 21.5 20.6 10.5 24.9 22.3 4.8
Female 60 yrs or older 469 79.6 25.6 24 .6 19 .7 26.8 31.8 34.2 48.0 29.6 8.9 27.1 27 .1 19 .5 13 .5 5.9 27.8 25.4 4.2
Kanto 2,926 75.3 27.1 31.2 25.3 32.3 33.3 25.4 37.4 30.5 10.4 25.9 35.6 25.7 21.2 10.0 19.5 17.8 3.2
Kansai 1,200 74.1 26.2 30.9 26.9 31.5 32.6 23.5 35.6 28.9 9.9 23.8 35.4 25.5 21.0 9.1 22.9 20.9 3.9
Tokai 660 74.8 26.8 30.3 25.2 28.8 33.3 21.5 34.3 35.1 11.2 30.6 33.0 22.9 19.8 7.4 20.3 17.4 5.6
社会人(子供7歳以上) Worker (child 7 yrs and over) 1,815 74.2 23.4 27.8 21.4 29.5 32.6 26.0 37.3 28.6 9.2 23.8 31.5 21.8 17.6 8.1 23.4 21.4 4.2
Worker (child 2-6 yrs) 201 64 .6 22.0 32.9 21.7 27.2 31.1 14 .2 26 .5 24 .6 9.2 19 .8 42.7 31.5 28.9 14.0 17.1 16.6 2.4
社会人(子供1歳以下) Worker (child 1 yr and under) 123 63 .1 20 .8 31.9 29.9 27.0 34.5 18 .6 21 .0 27.4 8.3 22.4 38.6 25.8 25.0 14.2 14 .5 13 .0 1.5
社会人(既婚・子供無) Worker (married, no children) 935 75.9 26.1 31.0 26.4 33.0 33.7 24.6 38.7 30.4 11.6 25.9 34.9 24.8 20.0 10.6 19.4 17.0 3.3
Worker (unmarried) 1,486 76.6 30.3 31.9 28.4 34.1 32.2 24.9 37.7 35.4 11.5 31.0 36.7 27.2 22.1 9.2 18.7 16.5 4.0
Unmarried male 792 74.1 31.4 33.7 31.1 31.3 31.4 22.3 34.3 30.9 10.6 26.7 37.5 28.3 24.3 10.7 19.1 16.1 5.1
Unmarried female 20s/30s 652 80.1 33.7 37.3 30.4 35.2 35.6 22.3 34.5 35.9 12.4 30.4 42.3 31.1 26.0 8.6 18.6 17.9 2.4
Unmarried female 40s and over 262 79.4 29.1 27.4 25.3 39.0 34.8 34.3 49.0 39.9 10.3 36.4 29 .5 22.7 16.3 6.4 18.5 16.8 2.6
Student 226 81.1 42.7 48.0 40.6 32.6 41.6 18 .8 29 .7 26.4 10.0 19 .9 47.1 36.7 34.7 9.4 18.9 18.4 1.5
Light 803 70.8 30.7 36.6 30.2 25 .1 31.9 18 .3 25 .3 16 .2 5.9 12 .9 32.2 25.7 21.1 7.0 17.3 15.7 2.5
Middle 1,131 74.9 29.7 33.7 27.4 35.4 37.9 21.5 32.0 25 .7 9.3 21.2 36.1 25.3 23.0 8.1 22.4 21.1 3.3
Heavy 2,852 76.0 24.7 28.3 23.8 31.9 31.6 27.3 41.4 36.8 12.1 31.6 35.6 25.1 20.1 10.6 20.6 18.2 4.1
Sample
Central/
South
America
or
Caribbean
HawaiiHawaii
(Oahu)
Hawaii
(other
than
Oahu)
Guam or
SaipanGuam Saipan
South
Pacific
islands or
other
islands
China
(excluding
Hong
Kong and
Macau)
Shanghai Beijing
Other
China
(exc. Hong
Kong /
Macau)
Hong
Kong or
Macau
Hong
KongMacau Taiwan Korea
2018 survey total 4,785 16.4 38.1 27.1 23.5 14.0 12.7 4.8 22.2 6.2 3.1 1.7 3.1 10.6 9.1 3.9 19.4 10.0
2017 survey total 4,703 16.7 39.0 28.3 23.2 14.5 13.0 5.5 25.1 6.2 3.2 1.7 2.7 9.7 8.4 3.3 18.8 9.7
2016 survey total 4,533 18.1 36.5 26.2 23.2 14.8 13.4 5.9 25.9 5.1 2.6 1.4 2.5 8.6 7.5 3.3 17.1 7.9
Male 2,420 16.2 34.3 25.8 20.7 13.5 12.4 5.2 20.4 7.4 3.5 2.2 4.1 11.1 9.5 4.3 18.6 7.3
Female 2,366 16.6 42.0 28.5 26.3 14.5 13.1 4.4 24.0 4.9 2.7 1.0 2.1 10.2 8.7 3.4 20.2 12.7
Male 18-29 yrs 344 11 .3 32 .5 23.2 17 .7 14.1 13.5 4.5 17 .0 8.4 5.1 3.5 2.3 9.6 8.4 3.9 17.0 8.0
Male 30-39 yrs 448 14.1 34.6 28.4 20.9 18.0 17.2 6.1 23.1 6.5 4.1 2.5 3.1 11.0 9.6 4.3 16.0 6.3
Male 40-49 yrs 550 15.8 33.7 28.0 17 .8 16.9 15.8 7.9 20.4 6.6 2.9 2.2 3.6 11.5 9.6 5.0 20.9 8.8
Male 50-59 yrs 495 20.5 38.5 29.1 22.9 10.7 9.4 3.3 23.4 6.5 3.7 1.6 4.1 12.2 10.7 4.0 21.6 5.7
Male 60 yrs or older 583 17.3 32 .0 20 .5 23.3 8 .7 7 .6 4.1 17.7 9.2 2.5 1.9 6.4 10.6 9.2 4.2 17.0 7.4
Female 18-29 yrs 619 13.7 52.6 33.2 33.5 25.5 23.3 5.6 29.9 5.8 4.6 1.1 1.5 11.5 10.6 2.6 22.2 19.1
Female 30-39 yrs 440 21.1 48.2 33.9 31.7 17.1 15.1 6.8 30.4 4.3 2.0 1.3 1.5 10.6 9.0 4.0 20.4 12.1
Female 40-49 yrs 437 21.0 40.4 30.8 24.5 13.4 12.1 4.8 23.0 4.0 2.0 0.8 1.8 10.4 8.6 3.3 18.4 11.1
Female 50-59 yrs 401 15.8 32 .8 22.3 18 .1 9.9 8.5 4.2 19.8 4.2 2.5 1.1 2.0 11.0 8.8 5.4 23.4 10.7
Female 60 yrs or older 469 12.8 31 .3 20 .2 20.7 2 .7 2 .5 0.2 14 .8 5.7 1.5 1.0 3.7 7.1 6.2 2.5 16.5 8.1
Kanto 2,926 17.3 38.7 27.9 24.3 12.9 11.8 4.8 22.4 6.5 3.4 1.8 3.2 10.1 8.6 3.5 19.8 8.8
Kansai 1,200 13.4 36.4 25.6 21.6 14.4 13.6 4.0 21.0 5.3 2.6 1.5 2.4 10.5 9.1 3.9 18.8 12.0
Tokai 660 17.5 38.2 26.5 23.7 18.1 15.5 6.5 23.3 6.3 2.6 1.1 3.7 13.0 11.6 5.5 18.8 11.4
社会人(子供7歳以上) Worker (child 7 yrs and over) 1,815 13.5 37.4 26.9 22.9 11.0 10.2 4.0 19.9 6.0 2.7 1.6 3.3 11.0 9.5 4.1 19.3 8.7
Worker (child 2-6 yrs) 201 11 .4 45.9 37.1 24.2 21.8 21.0 6.9 24.8 5.3 3.6 0.4 1.7 9.5 8.9 2.9 16.8 9.7
社会人(子供1歳以下) Worker (child 1 yr and under) 123 8 .3 54.4 44.2 28.5 24.1 23.2 7.5 28.3 8.1 5.5 0.9 2.7 11.4 8.8 5.3 18.7 16.0
社会人(既婚・子供無) Worker (married, no children) 935 19.0 40.5 28.9 25.3 16.0 14.2 5.7 26.2 4.8 2.1 1.2 2.4 8.9 7.7 2.7 19.4 8.7
Worker (unmarried) 1,486 21.0 34.7 24.2 22.2 14.1 12.4 5.2 23.0 6.8 3.3 1.8 3.5 11.8 9.8 4.9 20.1 11.2
Unmarried male 792 19.1 28 .0 20 .9 16 .4 12.2 11.0 4.8 18.3 8.8 4.6 3.0 4.9 12.3 10.3 5.6 19.1 7.6
Unmarried female 20s/30s 652 17.8 46.9 29.4 32.0 20.6 18.6 5.5 27.5 5.8 3.8 1.2 1.9 11.9 10.7 3.4 20.6 17.6
Unmarried female 40s and over 262 22.6 28 .7 20 .5 18 .5 5 .6 5 .1 3.0 16 .7 5.6 1.7 1.7 2.6 6.9 4.7 2.6 21.1 9.5
Student 226 6 .9 39.1 22.2 25.7 16.4 16.4 2.0 12 .4 9.4 7.4 4.4 3.0 8.4 8.4 0.5 18.9 14.4
Light 803 7 .4 41.5 29.8 25.2 26.8 25.2 7.9 20.3 6.0 3.8 1.7 1.7 10.3 9.2 3.2 22.2 13.4
Middle 1,131 9 .9 41.0 29.2 24.5 16.6 15.1 6.0 21.3 5.8 3.4 1.9 2.4 11.9 10.8 3.2 22.6 9.5
Heavy 2,852 21.5 35.9 25.5 22.6 9.4 8.3 3.5 23.0 6.4 2.8 1.5 3.7 10.2 8.5 4.3 17.4 9.2
Sample
Southeast
AsiaSingapore Phuket
Thai
beaches
(other
than
Phuket)
Bangkok
or other
Thai cities
Bali
Indonesian
beaches
(other
than Bali)
Indonesian
citiesMalaysia Philippines Vietnam Cambodia
Other
places in
Asia
Oceania Australia
New
Zealand or
other
Oceania
2018 survey total 4,785 39.0 12.4 5.0 3.2 7.3 8.9 0.9 2.0 5.0 7.4 9.5 4.2 7.3 36.3 27.6 19.6
2017 survey total 4,703 38.2 12.1 4.3 3.2 7.8 9.3 0.8 2.0 4.7 7.1 9.7 4.0 7.1 36.2 27.6 19.5
2016 survey total 4,533 38.8 11.0 4.6 3.1 6.8 9.9 1.3 2.5 4.7 6.7 10.2 4.8 8.6 37.0 26.9 21.4
Male 2,420 36.9 11.8 4.6 4.1 9.0 7.4 1.1 2.2 5.3 7.5 9.6 4.1 7.4 34.8 26.1 19.6
Female 2,366 41.1 13.0 5.5 2.3 5.6 10.5 0.6 1.9 4.6 7.4 9.4 4.3 7.3 37.7 29.2 19.7
Male 18-29 yrs 344 30 .2 12.9 2.6 3.2 4.8 5.5 1.0 1.3 2.9 6.8 5.1 2.6 3.2 33.1 26.4 16.4
Male 30-39 yrs 448 27 .4 10.4 4.3 3.7 4.1 7.0 1.0 1.8 3.3 8.0 5.5 1.8 5.7 31.9 25.8 15.1
Male 40-49 yrs 550 40.1 12.4 5.5 4.8 11.1 7.7 1.2 3.1 7.2 8.2 10.9 3.6 8.6 32.7 24.2 18.7
Male 50-59 yrs 495 41.3 13.2 5.9 6.0 11.9 9.1 1.3 1.6 6.4 10.0 9.5 5.2 7.5 35.5 26.6 20.2
Male 60 yrs or older 583 41.3 10.6 3.9 2.8 10.6 7.2 1.2 2.7 5.8 4.8 14.3 6.0 9.9 39.6 27.6 25.3
Female 18-29 yrs 619 47.0 17.1 7.1 2.6 5.6 15.1 0.4 1.3 2.4 12.9 5.6 2.7 3.5 38.3 32.6 16.0
Female 30-39 yrs 440 41.7 11.6 5.8 3.5 5.5 10.1 1.0 1.3 5.3 8.5 8.5 4.3 7.3 37.9 31.2 17.3
Female 40-49 yrs 437 37.9 10.4 4.5 3.0 7.1 7.8 1.3 3.3 5.3 5.3 11.4 5.1 7.6 33.6 25.8 16.7
Female 50-59 yrs 401 42.4 14.1 5.9 1.1 6.2 10.2 0.3 2.0 5.9 4.8 12.1 4.2 7.3 36.4 25.1 23.4
Female 60 yrs or older 469 34.7 10.6 3.7 1.2 3.9 7.4 ― 2.0 4.9 3.2 10.8 5.7 12.1 41.9 29.3 26.4
Kanto 2,926 37.7 10.9 5.0 3.2 7.3 8.8 0.9 2.0 5.1 7.6 9.5 3.9 7.3 35.3 26.7 18.9
Kansai 1,200 41.6 15.0 3.8 2.4 7.1 8.4 0.9 2.4 4.6 6.3 10.4 4.8 8.6 38.4 29.0 21.1
Tokai 660 40.2 14.5 7.2 4.8 7.7 10.3 0.7 1.6 4.8 9.1 7.8 4.3 5.2 36.8 28.8 20.4
社会人(子供7歳以上) Worker (child 7 yrs and over) 1,815 39.8 12.5 5.2 2.9 7.7 8.7 0.6 1.7 5.4 5.8 11.2 4.8 8.1 40.3 30.0 23.4
Worker (child 2-6 yrs) 201 34.1 12.8 3.4 2.2 5.8 8.7 1.4 2.0 5.2 7.1 7.7 2.4 3.9 30 .7 23.9 17.0
社会人(子供1歳以下) Worker (child 1 yr and under) 123 45.3 15.0 7.1 1.8 4.5 11.2 0.9 2.6 4.4 12.4 9.3 1.7 2.6 31 .3 26.9 7 .4
社会人(既婚・子供無) Worker (married, no children) 935 38.9 12.2 5.2 3.6 7.5 9.6 1.2 2.4 5.6 7.9 9.5 4.2 7.5 35.3 27.1 19.5
Worker (unmarried) 1,486 39.7 12.0 5.3 3.8 7.7 9.2 1.0 2.5 4.6 8.8 8.7 4.3 7.6 33.7 25.4 17.7
Unmarried male 792 33 .6 10.5 4.2 4.7 9.0 6.8 0.9 2.7 5.0 8.7 7.0 3.3 8.1 30 .5 23.3 16.9
Unmarried female 20s/30s 652 45.5 16.0 6.5 2.9 6.5 11.7 0.7 1.2 3.1 10.5 7.4 3.9 4.8 38.8 32.0 16.3
Unmarried female 40s and over 262 33 .9 7.8 2.6 2.1 3.4 6.9 1.3 3.0 4.3 3.4 11.6 5.2 10.7 29 .7 18 .9 19.0
Student 226 28 .8 13.4 1.5 2.5 4.0 5.0 ― ― 1.0 7.0 2 .5 1.0 4.5 32.3 28.8 11 .9
Light 803 34.3 15.0 4.7 2.0 4.3 10.1 0.7 1.0 2.3 8.1 4 .4 1.5 2 .1 32.9 28.0 13 .6
Middle 1,131 39.4 14.3 6.2 2.5 7.0 8.9 0.7 1.3 4.8 8.5 8.7 3.2 3.9 40.6 33.2 19.9
Heavy 2,852 40.1 11.0 4.7 3.9 8.3 8.6 1.0 2.6 5.7 6.8 11.3 5.3 10.2 35.5 25.3 21.3
50.0 …Figures 5 or more points or higher than the 2018 survey total are shaded.
50 .0 …Figures 5 or more points or lower than the 2018 survey total are shaded.
(†1)In the 2018 survey, tabulations were done excluding "don't know" (160 samples) from the 4,945 samples of respondents indicating intention to travel in the future.
(†2)In the 2017 survey, tabulations were done excluding "don't know" (207 samples) from the 4,910 samples of respondents indicating intention to travel in the future.
(†3)In the 2016 survey, tabulations were done excluding "don't know" (201 samples) from the 4,733 samples of respondents indicating intention to travel in the future.
USA (excluding Hawaii and Alaska)
Sex & age
Life
stage
Number of
trips taken
Area of
residence
Area of
residence
Number of
trips taken
Sex & age
Sex & age
Europe Middle East or Africa Canada or Alaska
Sex
Southeast Asia Oceania
Sex
Area of
residence
Hawaii Guam or Saipan China (excluding Hong Kong and Macau) Hong Kong or Macau
Sex
Life
stage
Number of
trips taken
Life
stage
■Countries / Areas wish to travel to overseas in future: by demographic
(Those who intend on traveling in the future: Excluding "don't know"/Up to ten multiple answers)
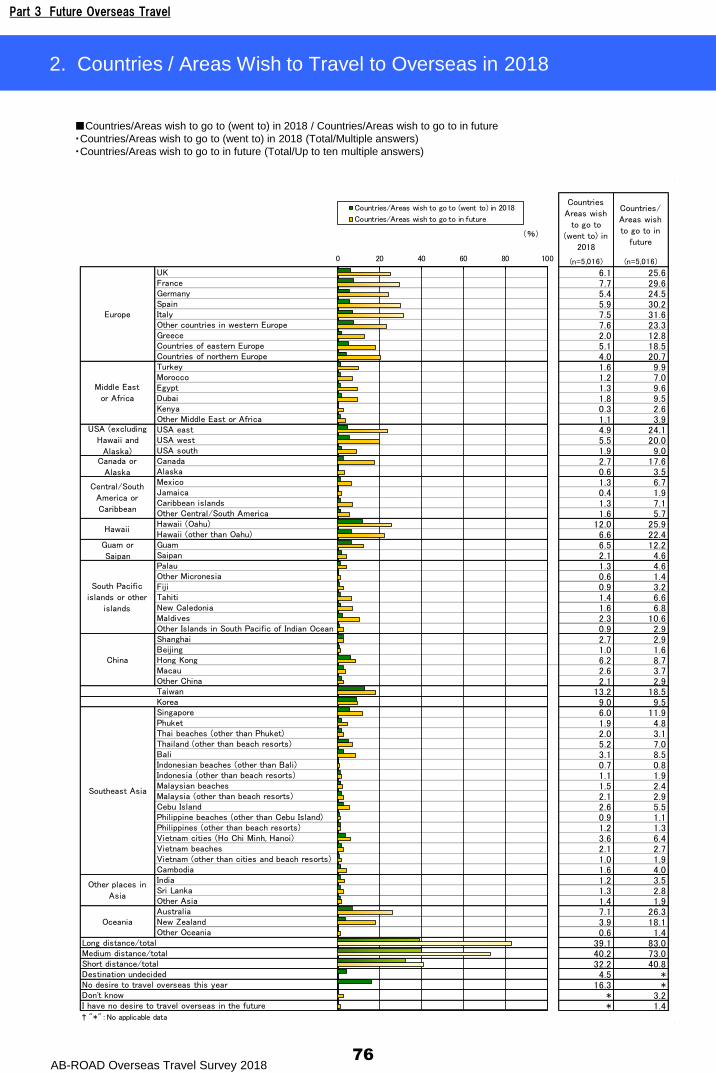
Part 3 Future Overseas Travel
AB-ROAD Overseas Travel Survey 2018
CountriesAreas wish
to go to(went to) in
2018
Countries/
Areas wishto go to in
future
(n=5,016) (n=5,016)
UK 6.1 25.6France 7.7 29.6Germany 5.4 24.5Spain 5.9 30.2Italy 7.5 31.6Other countries in western Europe 7.6 23.3Greece 2.0 12.8Countries of eastern Europe 5.1 18.5Countries of northern Europe 4.0 20.7Turkey 1.6 9.9Morocco 1.2 7.0Egypt 1.3 9.6Dubai 1.8 9.5Kenya 0.3 2.6Other Middle East or Africa 1.1 3.9USA east 4.9 24.1USA west 5.5 20.0USA south 1.9 9.0Canada 2.7 17.6Alaska 0.6 3.5Mexico 1.3 6.7Jamaica 0.4 1.9Caribbean islands 1.3 7.1Other Central/South America 1.6 5.7Hawaii (Oahu) 12.0 25.9Hawaii (other than Oahu) 6.6 22.4Guam 6.5 12.2Saipan 2.1 4.6Palau 1.3 4.6Other Micronesia 0.6 1.4Fiji 0.9 3.2Tahiti 1.4 6.6New Caledonia 1.6 6.8Maldives 2.3 10.6Other Islands in South Pacific of Indian Ocean 0.9 2.9Shanghai 2.7 2.9Beijing 1.0 1.6Hong Kong 6.2 8.7Macau 2.6 3.7Other China 2.1 2.9Taiwan 13.2 18.5Korea 9.0 9.5Singapore 6.0 11.9Phuket 1.9 4.8Thai beaches (other than Phuket) 2.0 3.1Thailand (other than beach resorts) 5.2 7.0Bali 3.1 8.5Indonesian beaches (other than Bali) 0.7 0.8Indonesia (other than beach resorts) 1.1 1.9Malaysian beaches 1.5 2.4Malaysia (other than beach resorts) 2.1 2.9Cebu Island 2.6 5.5Philippine beaches (other than Cebu Island) 0.9 1.1Philippines (other than beach resorts) 1.2 1.3Vietnam cities (Ho Chi Minh, Hanoi) 3.6 6.4Vietnam beaches 2.1 2.7Vietnam (other than cities and beach resorts) 1.0 1.9Cambodia 1.6 4.0India 1.2 3.5Sri Lanka 1.3 2.8Other Asia 1.4 1.9Australia 7.1 26.3New Zealand 3.9 18.1Other Oceania 0.6 1.4
Long distance/total 39.1 83.0Medium distance/total 40.2 73.0Short distance/total 32.2 40.8Destination undecided 4.5 *No desire to travel overseas this year 16.3 *Don't know * 3.2I have no desire to travel overseas in the future * 1.4† "*":No applicable data
Europe
Middle Eastor Africa
Central/South
America orCaribbean
Hawaii
USA (excludingHawaii and
Alaska)Canada or
Alaska
Oceania
Guam or
Saipan
South Pacificislands or other
islands
China
Other places in
Asia
Southeast Asia
0 20 40 60 80 100
Countries/Areas wish to go to (went to) in 2018
Countries/Areas wish to go to in future
(%)
76
2. Countries / Areas Wish to Travel to Overseas in 2018
■Countries/Areas wish to go to (went to) in 2018 / Countries/Areas wish to go to in future
・Countries/Areas wish to go to (went to) in 2018 (Total/Multiple answers)
・Countries/Areas wish to go to in future (Total/Up to ten multiple answers)
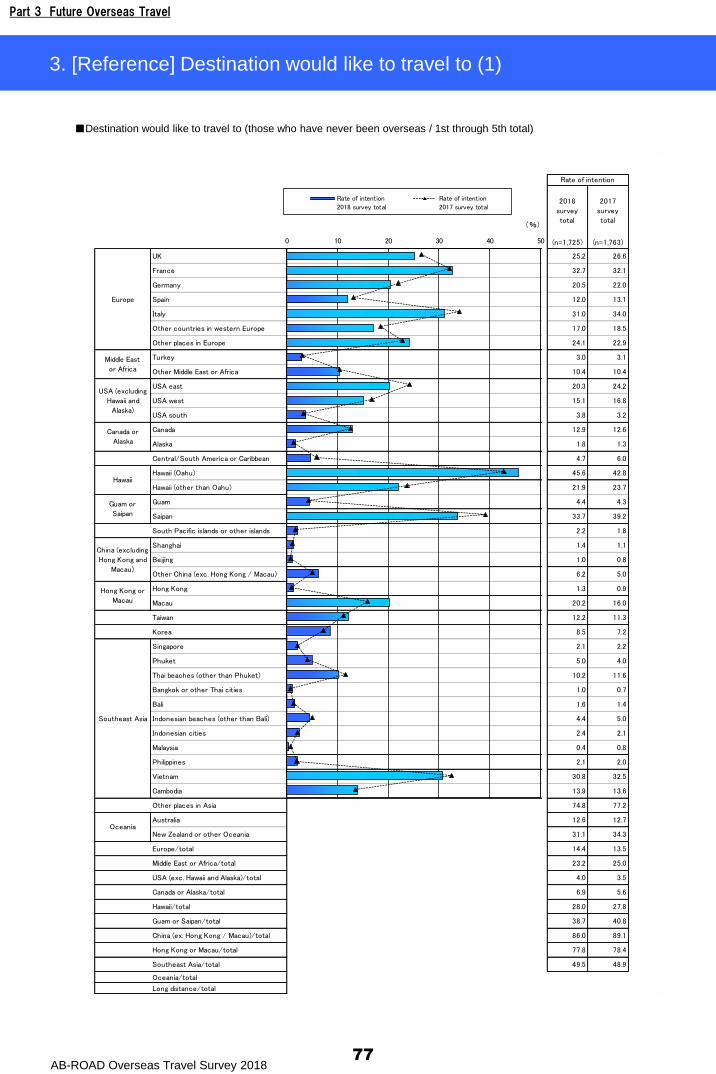
Part 3 Future Overseas Travel
AB-ROAD Overseas Travel Survey 201877
3. [Reference] Destination would like to travel to (1)
Rate of
intention
Rate of
intention
2018
survey
total
2017
survey
total
(n=1,725) (n=1,763)
UK 25.2 26.6
France 32.7 32.1
Germany 20.5 22.0
Spain 12.0 13.1
Italy 31.0 34.0
Other countries in western Europe 17.0 18.5
Other places in Europe 24.1 22.9
Turkey 3.0 3.1
Other Middle East or Africa 10.4 10.4
USA east 20.3 24.2
USA west 15.1 16.8
USA south 3.8 3.2
Canada 12.9 12.6
Alaska 1.8 1.3
Central/South America or Caribbean 4.7 6.0
Hawaii (Oahu) 45.6 42.8
Hawaii (other than Oahu) 21.9 23.7
Guam 4.4 4.3
Saipan 33.7 39.2
South Pacific islands or other islands 2.2 1.8
Shanghai 1.4 1.1
Beijing 1.0 0.8
Other China (exc. Hong Kong / Macau) 6.2 5.0
Hong Kong 1.3 0.9
Macau 20.2 16.0
Taiwan 12.2 11.3
Korea 8.5 7.2
Singapore 2.1 2.2
Phuket 5.0 4.0
Thai beaches (other than Phuket) 10.2 11.6
Bangkok or other Thai cities 1.0 0.7
Bali 1.6 1.4
Indonesian beaches (other than Bali) 4.4 5.0
Indonesian cities 2.4 2.1
Malaysia 0.4 0.8
Philippines 2.1 2.0
Vietnam 30.8 32.5
Cambodia 13.9 13.6
Other places in Asia 74.8 77.2
Australia 12.6 12.7
New Zealand or other Oceania 31.1 34.3
Europe/total 14.4 13.5
Middle East or Africa/total 23.2 25.0
USA (exc. Hawaii and Alaska)/total 4.0 3.5
Canada or Alaska/total 6.9 5.6
Hawaii/total 28.0 27.8
Guam or Saipan/total 38.7 40.8
China (ex. Hong Kong / Macau)/total 86.0 89.1
Hong Kong or Macau/total 77.8 78.4
Southeast Asia/total 49.5 48.9
Oceania/total
Long distance/total
Hawaii
Guam or
Saipan
China (excluding
Hong Kong and
Macau)
Hong Kong or
Macau
Southeast Asia
Oceania
Rate of intention
Europe
Middle East
or Africa
USA (excluding
Hawaii and
Alaska)
Canada or
Alaska
0 10 20 30 40 50
Rate of intention
2018 survey total
Rate of intention
2017 survey total
(%)
■Destination would like to travel to (those who have never been overseas / 1st through 5th total)
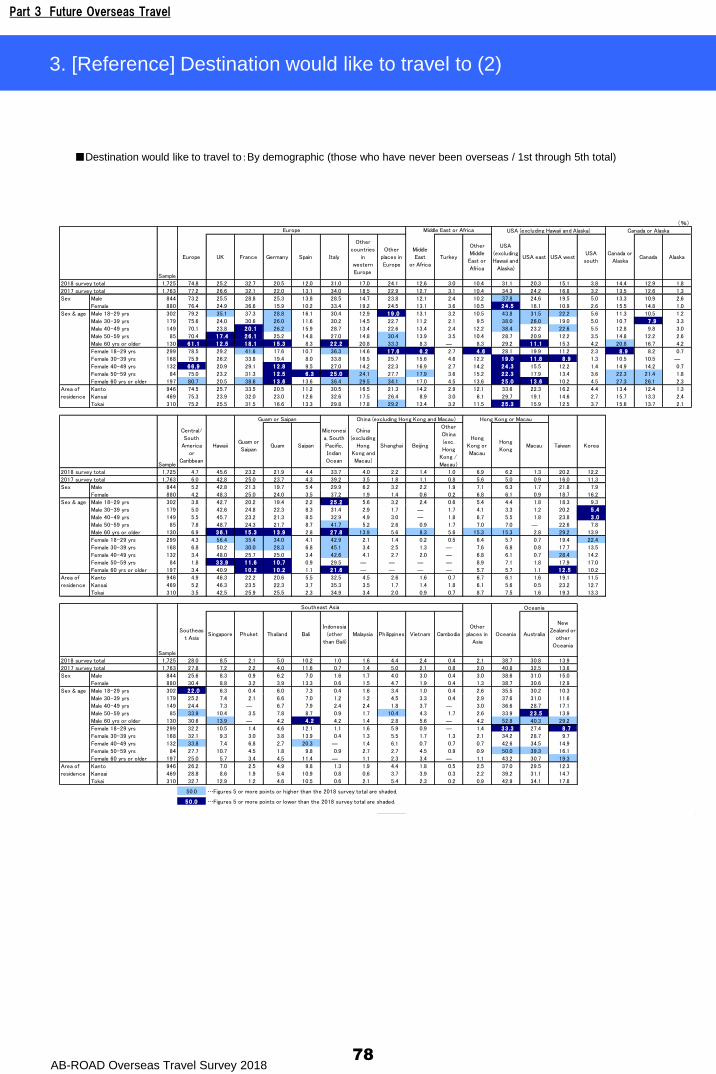
Part 3 Future Overseas Travel
AB-ROAD Overseas Travel Survey 201878
3. [Reference] Destination would like to travel to (2)
(%)
Sample
Europe UK France Germany Spain Italy
Other
countries
in
western
Europe
Other
places in
Europe
Middle
East
or Africa
Turkey
Other
Middle
East or
Africa
USA
(excluding
Hawaii and
Alaska)
USA east USA westUSA
south
Canada or
AlaskaCanada Alaska
2018 survey total 1,725 74.8 25.2 32.7 20.5 12.0 31.0 17.0 24.1 12.6 3.0 10.4 31.1 20.3 15.1 3.8 14.4 12.9 1.8
2017 survey total 1,763 77.2 26.6 32.1 22.0 13.1 34.0 18.5 22.9 12.7 3.1 10.4 34.3 24.2 16.8 3.2 13.5 12.6 1.3
Male 844 73.2 25.5 28.8 25.3 13.8 28.5 14.7 23.8 12.1 2.4 10.2 37.8 24.6 19.5 5.0 13.3 10.9 2.6
Female 880 76.4 24.9 36.6 15.9 10.2 33.4 19.2 24.5 13.1 3.6 10.5 24 .5 16.1 10.9 2.6 15.5 14.8 1.0
Male 18-29 yrs 302 79.2 35.1 37.3 28.8 16.1 30.4 12.9 19 .0 13.1 3.2 10.5 43.8 31.5 22.2 5.6 11.3 10.5 1.2
Male 30-39 yrs 179 75.6 24.0 30.6 26.0 11.6 30.2 14.5 22.7 11.2 2.1 9.5 38.0 26.0 19.0 5.0 10.7 7 .9 3.3
Male 40-49 yrs 149 70.1 23.8 20 .1 26.2 15.9 28.7 13.4 22.6 13.4 2.4 12.2 38.4 23.2 22.6 5.5 12.8 9.8 3.0
Male 50-59 yrs 85 70.4 17 .4 26 .1 25.2 14.8 27.0 14.8 30.4 13.9 3.5 10.4 28.7 20.9 12.2 3.5 14.8 12.2 2.6
Male 60 yrs or older 130 61 .1 12 .5 18 .1 15 .3 8.3 22 .2 20.8 33.3 8.3 ― 8.3 29.2 11 .1 15.3 4.2 20.8 16.7 4.2
Female 18-29 yrs 299 78.5 29.2 41.6 17.6 10.7 36.3 14.6 17 .6 6 .2 2.7 4 .6 28.1 19.9 11.2 2.3 8 .9 8.2 0.7
Female 30-39 yrs 168 75.9 26.2 33.8 19.4 8.0 33.8 16.5 25.7 15.6 4.6 12.2 19 .0 11 .8 8 .9 1.3 10.5 10.5 ―
Female 40-49 yrs 132 66 .9 20.9 29.1 12 .8 9.5 27.0 14.2 22.3 16.9 2.7 14.2 24 .3 15.5 12.2 1.4 14.9 14.2 0.7
Female 50-59 yrs 84 75.0 23.2 31.3 12 .5 6 .3 25 .0 24.1 27.7 17.9 3.6 15.2 22 .3 17.9 13.4 3.6 22.3 21.4 1.8
Female 60 yrs or older 197 80.7 20.5 38.6 13 .6 13.6 36.4 29.5 34.1 17.0 4.5 13.6 25 .0 13 .6 10.2 4.5 27.3 26.1 2.3
Kanto 946 74.5 25.7 33.5 20.5 11.2 30.5 16.5 21.3 14.2 2.9 12.1 33.6 22.3 16.2 4.4 13.4 12.4 1.3
Kansai 469 75.3 23.9 32.0 23.0 12.6 32.6 17.5 26.4 8.9 3.0 6.1 29.7 19.1 14.6 2.7 15.7 13.3 2.4
Tokai 310 75.2 25.5 31.5 16.6 13.3 29.8 17.8 29.2 13.4 3.2 11.5 25 .3 15.9 12.5 3.7 15.6 13.7 2.1
Sample
Central/
South
America
or
Caribbean
HawaiiGuam or
SaipanGuam Saipan
Micronesi
a, South
Pacific,
Indian
Ocean
China
(excluding
Hong
Kong and
Macau)
Shanghai Beijing
Other
China
(exc.
Hong
Kong /
Macau)
Hong
Kong or
Macau
Hong
KongMacau Taiwan Korea
2018 survey total 1,725 4.7 45.6 23.2 21.9 4.4 33.7 4.0 2.2 1.4 1.0 6.9 6.2 1.3 20.2 12.2
2017 survey total 1,763 6.0 42.8 25.0 23.7 4.3 39.2 3.5 1.8 1.1 0.8 5.6 5.0 0.9 16.0 11.3
Male 844 5.2 42.8 21.3 19.7 5.4 29.9 6.2 3.2 2.2 1.9 7.1 6.3 1.7 21.8 7.9
Female 880 4.2 48.3 25.0 24.0 3.5 37.2 1.9 1.4 0.6 0.2 6.8 6.1 0.9 18.7 16.2
Male 18-29 yrs 302 3.8 42.7 20.2 19.4 2.2 25 .2 5.6 3.2 2.4 0.6 5.4 4.4 1.8 18.3 9.3
Male 30-39 yrs 179 5.0 42.6 24.8 22.3 8.3 31.4 2.9 1.7 ― 1.7 4.1 3.3 1.2 20.2 5 .4
Male 40-49 yrs 149 5.5 45.7 23.2 21.3 8.5 32.9 4.9 3.0 ― 1.8 6.7 5.5 1.8 23.8 3 .0
Male 50-59 yrs 85 7.8 48.7 24.3 21.7 8.7 41.7 5.2 2.6 0.9 1.7 7.0 7.0 ― 22.6 7.8
Male 60 yrs or older 130 6.9 36 .1 15 .3 13 .9 2.8 27 .8 13.9 5.6 8.3 5.6 15.3 15.3 2.8 29.2 13.9
Female 18-29 yrs 299 4.3 56.4 35.4 34.0 4.1 42.9 2.1 1.4 0.2 0.5 6.4 5.7 0.7 19.4 22.4
Female 30-39 yrs 168 6.8 50.2 30.0 28.3 6.8 45.1 3.4 2.5 1.3 ― 7.6 6.8 0.8 17.7 13.5
Female 40-49 yrs 132 3.4 48.0 25.7 25.0 3.4 42.6 4.1 2.7 2.0 ― 6.8 6.1 0.7 28.4 14.2
Female 50-59 yrs 84 1.8 33 .9 11 .6 10 .7 0.9 29.5 ― ― ― ― 8.9 7.1 1.8 17.9 17.0
Female 60 yrs or older 197 3.4 40.9 10 .2 10 .2 1.1 21 .6 ― ― ― ― 5.7 5.7 1.1 12 .5 10.2
Kanto 946 4.9 46.3 22.2 20.6 5.5 32.5 4.5 2.6 1.6 0.7 6.7 6.1 1.6 19.1 11.5
Kansai 469 5.2 46.3 23.5 22.3 3.7 35.3 3.5 1.7 1.4 1.8 6.1 5.6 0.5 23.2 12.7
Tokai 310 3.5 42.5 25.9 25.5 2.3 34.9 3.4 2.0 0.9 0.7 8.7 7.5 1.6 19.3 13.3
Sample
Southeas
t AsiaSingapore Phuket Thailand Bali
Indonesia
(other
than Bali)
Malaysia Philippines Vietnam Cambodia
Other
places in
Asia
Oceania Australia
New
Zealand or
other
Oceania
2018 survey total 1,725 28.0 8.5 2.1 5.0 10.2 1.0 1.6 4.4 2.4 0.4 2.1 38.7 30.8 13.9
2017 survey total 1,763 27.8 7.2 2.2 4.0 11.6 0.7 1.4 5.0 2.1 0.8 2.0 40.8 32.5 13.6
Male 844 25.6 8.3 0.9 6.2 7.0 1.6 1.7 4.0 3.0 0.4 3.0 38.6 31.0 15.0
Female 880 30.4 8.8 3.2 3.9 13.3 0.6 1.5 4.7 1.9 0.4 1.3 38.7 30.6 12.9
Male 18-29 yrs 302 22 .0 6.3 0.4 6.0 7.3 0.4 1.6 3.4 1.0 0.4 2.6 35.5 30.2 10.3
Male 30-39 yrs 179 25.2 7.4 2.1 6.6 7.0 1.2 1.2 4.5 3.3 0.4 2.9 37.6 31.0 11.6
Male 40-49 yrs 149 24.4 7.3 ― 6.7 7.9 2.4 2.4 1.8 3.7 ― 3.0 36.6 28.7 17.1
Male 50-59 yrs 85 33.9 10.4 3.5 7.8 8.7 0.9 1.7 10.4 4.3 1.7 2.6 33.9 23 .5 13.9
Male 60 yrs or older 130 30.6 13.9 ― 4.2 4 .2 4.2 1.4 2.8 5.6 ― 4.2 52.8 40.3 29.2
Female 18-29 yrs 299 32.2 10.5 1.4 4.6 12.1 1.1 1.6 5.9 0.9 ― 1.4 33 .3 27.4 8 .7
Female 30-39 yrs 168 32.1 9.3 3.0 3.8 13.9 0.4 1.3 5.5 1.7 1.3 2.1 34.2 28.7 9.7
Female 40-49 yrs 132 33.8 7.4 6.8 2.7 20.3 ― 1.4 6.1 0.7 0.7 0.7 42.6 34.5 14.9
Female 50-59 yrs 84 27.7 10.7 4.5 1.8 9.8 0.9 2.7 2.7 4.5 0.9 0.9 50.0 39.3 16.1
Female 60 yrs or older 197 25.0 5.7 3.4 4.5 11.4 ― 1.1 2.3 3.4 ― 1.1 43.2 30.7 19.3
Kanto 946 26.2 7.0 2.5 4.9 9.8 1.3 1.9 4.4 1.8 0.5 2.5 37.0 29.5 12.3
Kansai 469 28.8 8.6 1.9 5.4 10.9 0.8 0.6 3.7 3.9 0.3 2.2 39.2 31.1 14.7
Tokai 310 32.7 12.9 1.2 4.6 10.5 0.6 2.1 5.4 2.3 0.2 0.9 42.9 34.1 17.8
50.0 …Figures 5 or more points or higher than the 2018 survey total are shaded.
50 .0 …Figures 5 or more points or lower than the 2018 survey total are shaded.
USA (excluding Hawaii and Alaska) Canada or Alaska
Sex
Area of
residence
Sex & age
Europe Middle East or Africa
Hong Kong or Macau
Sex
Sex & age
Area of
residence
Guam or Saipan China (excluding Hong Kong and Macau)
Oceania
Sex
Sex & age
Area of
residence
Southeast Asia
■Destination would like to travel to:By demographic (those who have never been overseas / 1st through 5th total)

79
Issue :JULY 2018
AB-ROAD Research Center, Travel Information Div. Recruit Lifestyle Co.,Ltd.GranTokyoSOUTHTOWER,1-9-2 MarunouchiChiyoda-ku Tokyo, JapanCopyright(C) Recruit Lifestyle Co.,Ltd.