2018 outlook - s3.amazonaws.com . 2018 priorities • outperform the end markets − execute one...
TRANSCRIPT

Webcast Presentation – December 13, 2017 2018 Outlook

2
Safe Harbor Statement All statements made herein that are not historical facts should be considered as “forward-looking statements” within the meaning of the Private Securities Litigation Act of 1995. Such statements involve known and unknown risks, uncertainties and other factors that may cause actual results to differ materially. Such risks, uncertainties and other factors include, but are not limited to: adverse economic conditions; disruptions in operations or information technology systems; supply chain disruptions, changes in supplier strategy or loss of key suppliers; product or other cost fluctuations; expansion of business activities; personnel turnover or labor cost increases; tax law changes or challenges to tax matters; increase in competition; risks related to acquisitions, including the integration of acquired businesses; exchange rate fluctuations; legal or regulatory matters; litigation, disputes, contingencies or claims; debt levels, terms, financial market conditions or interest rate fluctuations; goodwill or intangible asset impairment; stock market, economic or political instability; and other factors described in detail in the Form 10-K for WESCO International, Inc. for the year ended December 31, 2016 and any subsequent filings with the Securities & Exchange Commission. The following presentation includes a discussion of certain non-GAAP financial measures. Information required by Regulation G with respect to such non-GAAP financial measures can be found in the appendix and obtained via WESCO’s website, www.wesco.com.
3
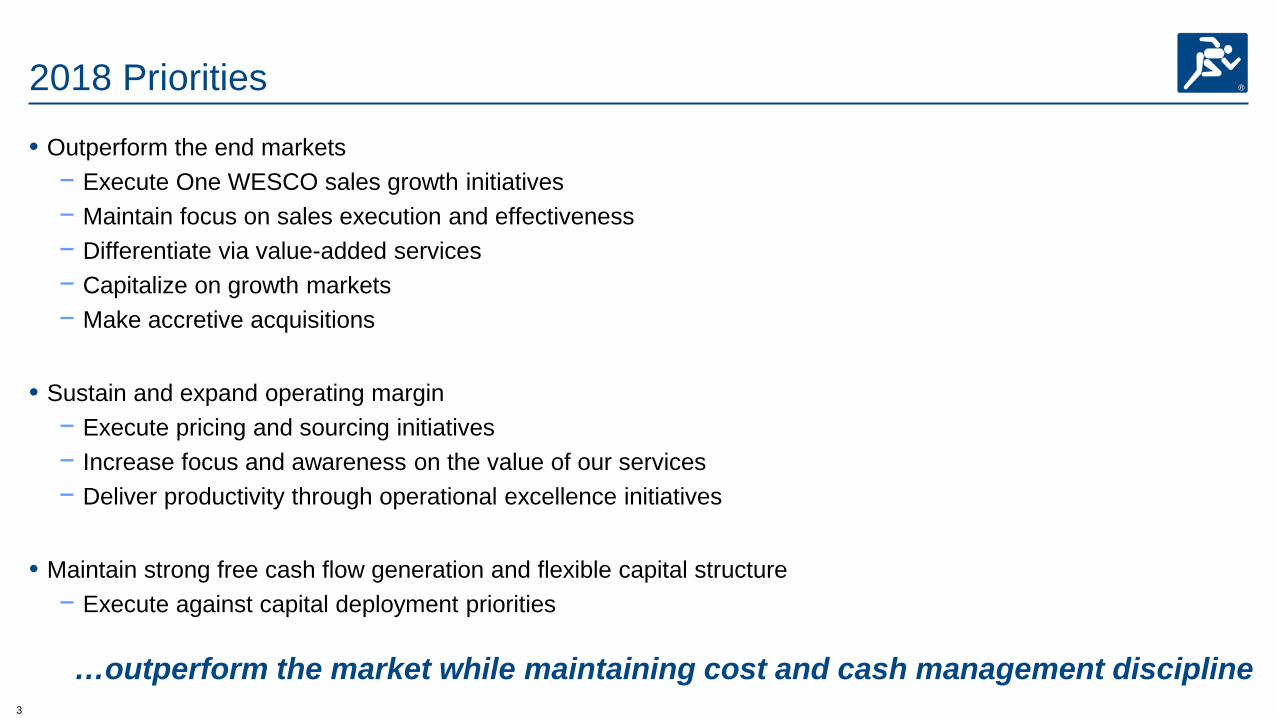
2018 Priorities
• Outperform the end markets − Execute One WESCO sales growth initiatives − Maintain focus on sales execution and effectiveness − Differentiate via value-added services − Capitalize on growth markets − Make accretive acquisitions
• Sustain and expand operating margin − Execute pricing and sourcing initiatives − Increase focus and awareness on the value of our services − Deliver productivity through operational excellence initiatives
• Maintain strong free cash flow generation and flexible capital structure − Execute against capital deployment priorities
…outperform the market while maintaining cost and cash management discipline
4
Improving Flat Declining
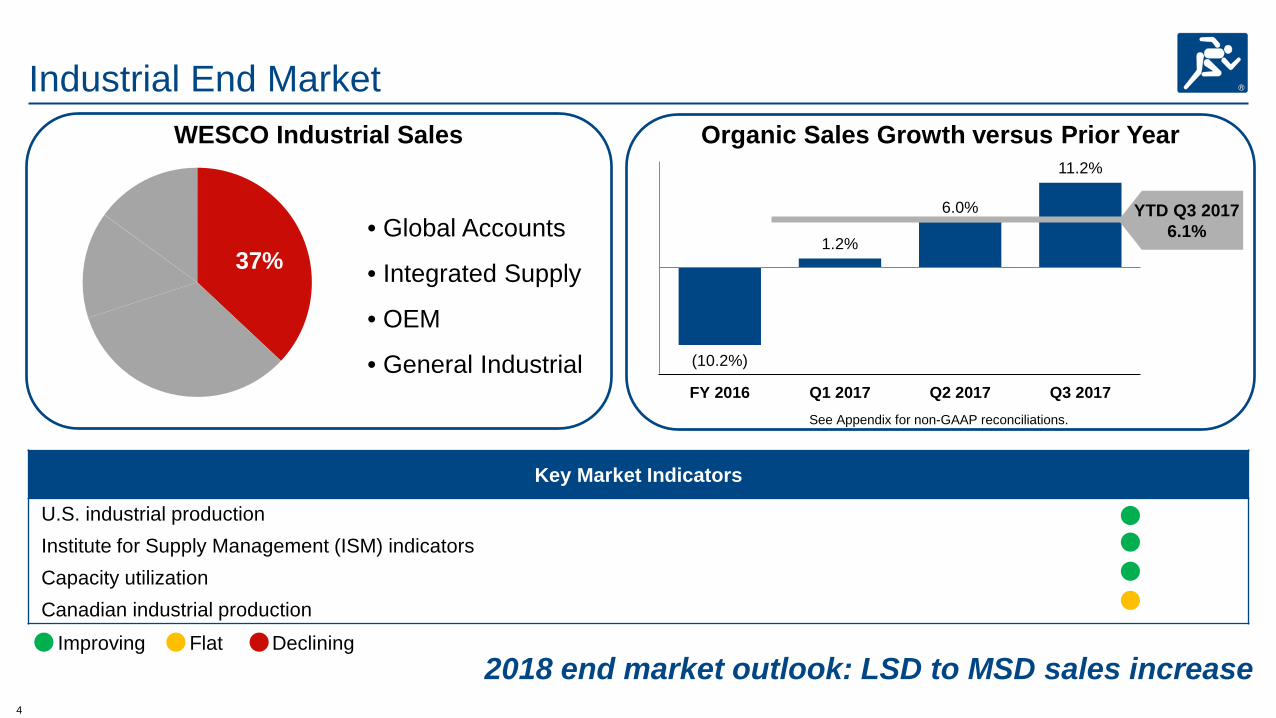
(10.2%)
1.2%
6.0%
11.2%
FY 2016 Q1 2017 Q2 2017 Q3 2017
Organic Sales Growth versus Prior Year 42%
Key Market Indicators
U.S. industrial production Institute for Supply Management (ISM) indicators Capacity utilization Canadian industrial production
• Global Accounts
• Integrated Supply
• OEM
• General Industrial
WESCO Industrial Sales
37%
YTD Q3 2017 6.1%
See Appendix for non-GAAP reconciliations.
Industrial End Market
2018 end market outlook: LSD to MSD sales increase
5
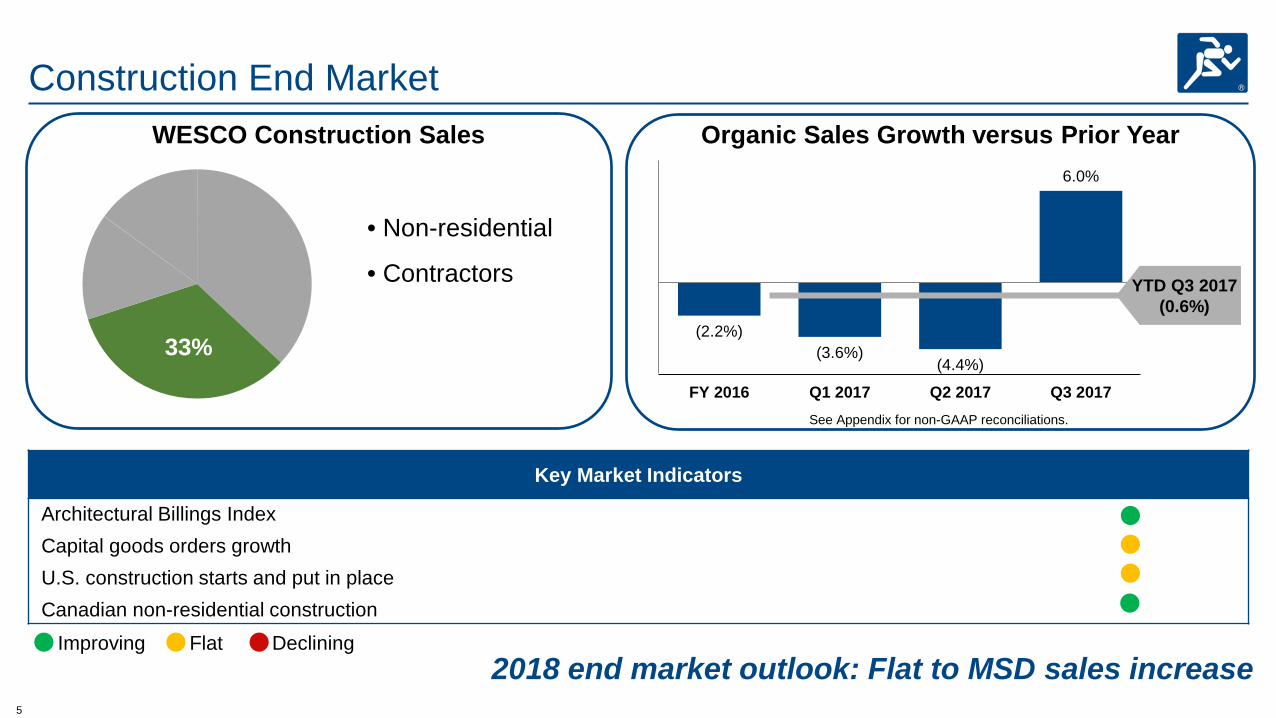
(2.2%) (3.6%)
(4.4%)
6.0%
FY 2016 Q1 2017 Q2 2017 Q3 2017
Key Market Indicators
Architectural Billings Index Capital goods orders growth U.S. construction starts and put in place Canadian non-residential construction
• Non-residential
• Contractors
33%
YTD Q3 2017 (0.6%)
Construction End Market
2018 end market outlook: Flat to MSD sales increase
Organic Sales Growth versus Prior Year WESCO Construction Sales
Improving Flat Declining
See Appendix for non-GAAP reconciliations.
6
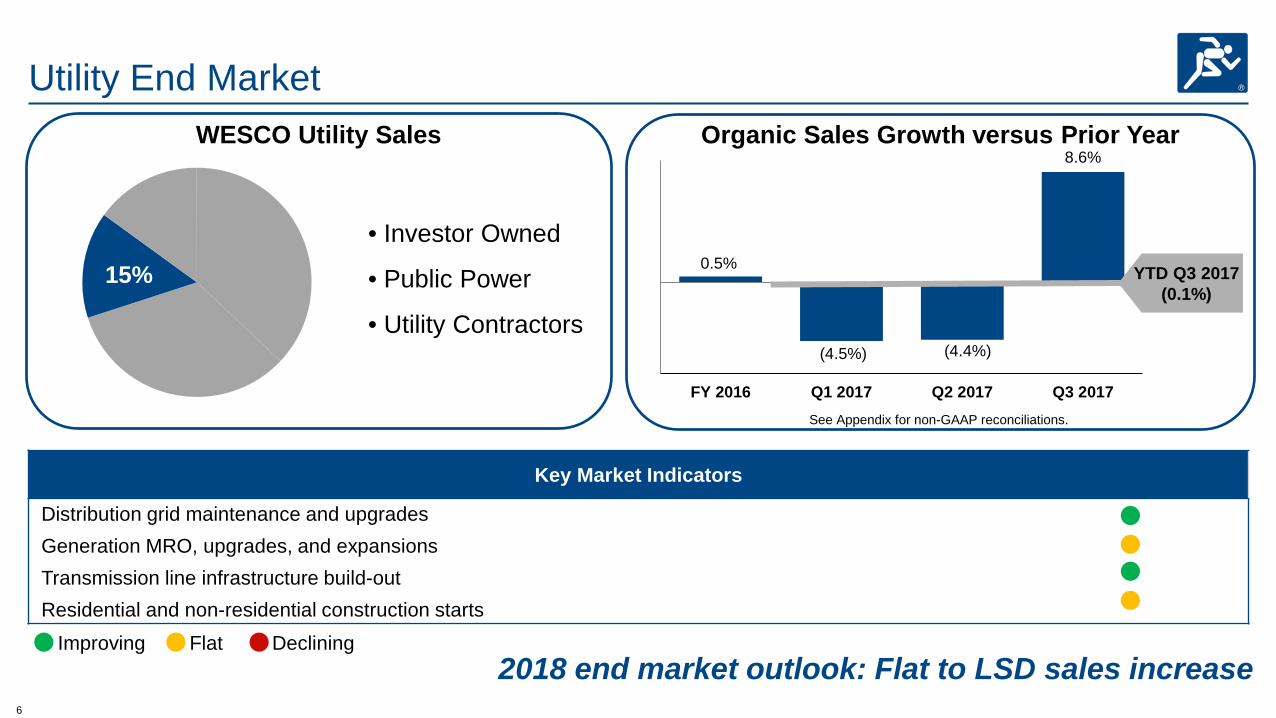
0.5%
(4.5%) (4.4%)
8.6%
FY 2016 Q1 2017 Q2 2017 Q3 2017
42%
Key Market Indicators
Distribution grid maintenance and upgrades Generation MRO, upgrades, and expansions Transmission line infrastructure build-out Residential and non-residential construction starts
• Investor Owned
• Public Power
• Utility Contractors
15% YTD Q3 2017 (0.1%)
Utility End Market
2018 end market outlook: Flat to LSD sales increase
Organic Sales Growth versus Prior Year WESCO Utility Sales
Improving Flat Declining
See Appendix for non-GAAP reconciliations.
7
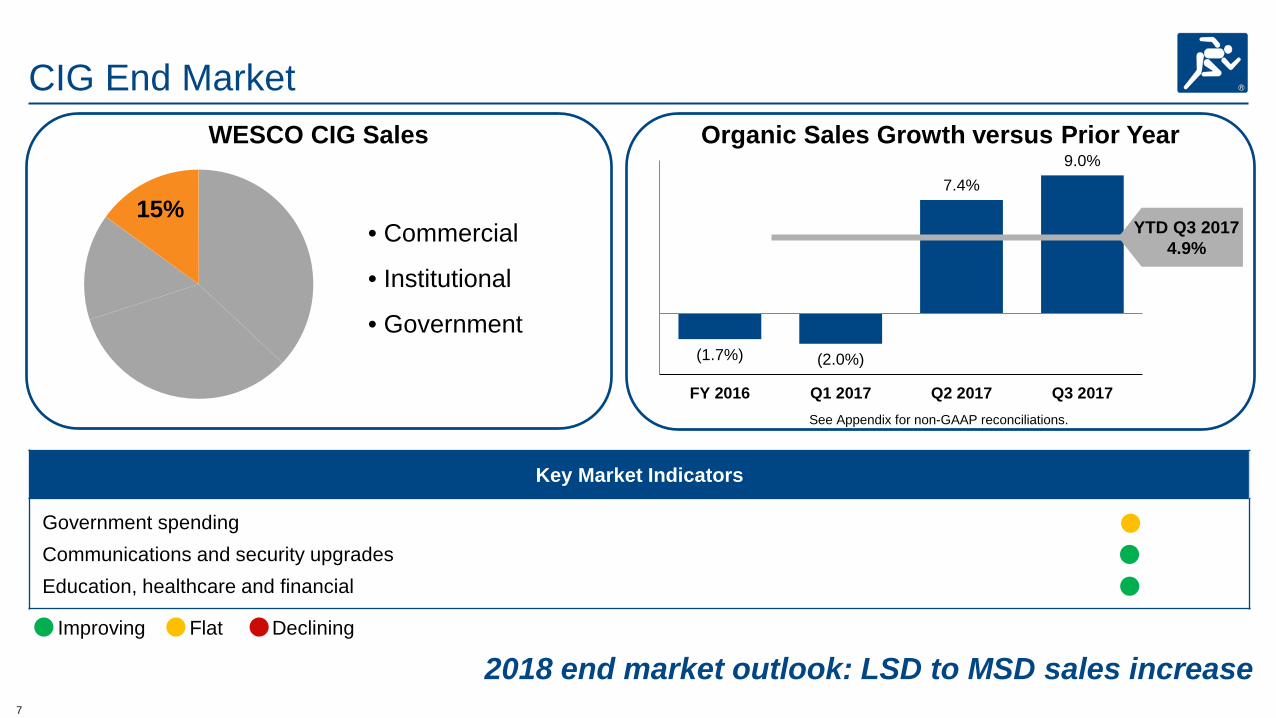
(1.7%) (2.0%)
7.4% 9.0%
FY 2016 Q1 2017 Q2 2017 Q3 2017
Key Market Indicators
Government spending Communications and security upgrades Education, healthcare and financial
• Commercial
• Institutional
• Government
15% YTD Q3 2017
4.9%
CIG End Market
2018 end market outlook: LSD to MSD sales increase
Organic Sales Growth versus Prior Year WESCO CIG Sales
Improving Flat Declining
See Appendix for non-GAAP reconciliations.

8
2018 Sales Outlook
Sales Outlook
End Market: Range
Industrial LSD to MSD
Construction Flat to MSD
Utility Flat to LSD
CIG LSD to MSD
End Market Sales Growth 1% to 5%
Market Outperformance ~1%
Foreign Exchange slightly favorable
Consolidated WESCO 3% to 6%
Excludes future acquisitions. May not add due to rounding.
…expecting higher growth vs prior year in the first half

9
2018 Sales Outlook by Geography
U.S.
Canada
International
LSD to MSD growth
LSD to MSD growth
Flat
…expecting solid U.S. and Canadian growth
Sales Outlook
Excludes future acquisitions.

10
Range 2017 Operating Margin Outlook 4.1% to 4.3% Expected margin improvement • Operating leverage • Favorable business mix • Improved pricing
+30 to 50 bps
Subtotal Fully restore variable compensation
4.4% to 4.8%
(20 bps)
2018 Operating Margin Outlook
4.2% to 4.6%
2018 Operating Margin Outlook
…outlook delivers >50% pull-through before restoring variable compensation
May not add due to rounding.
11
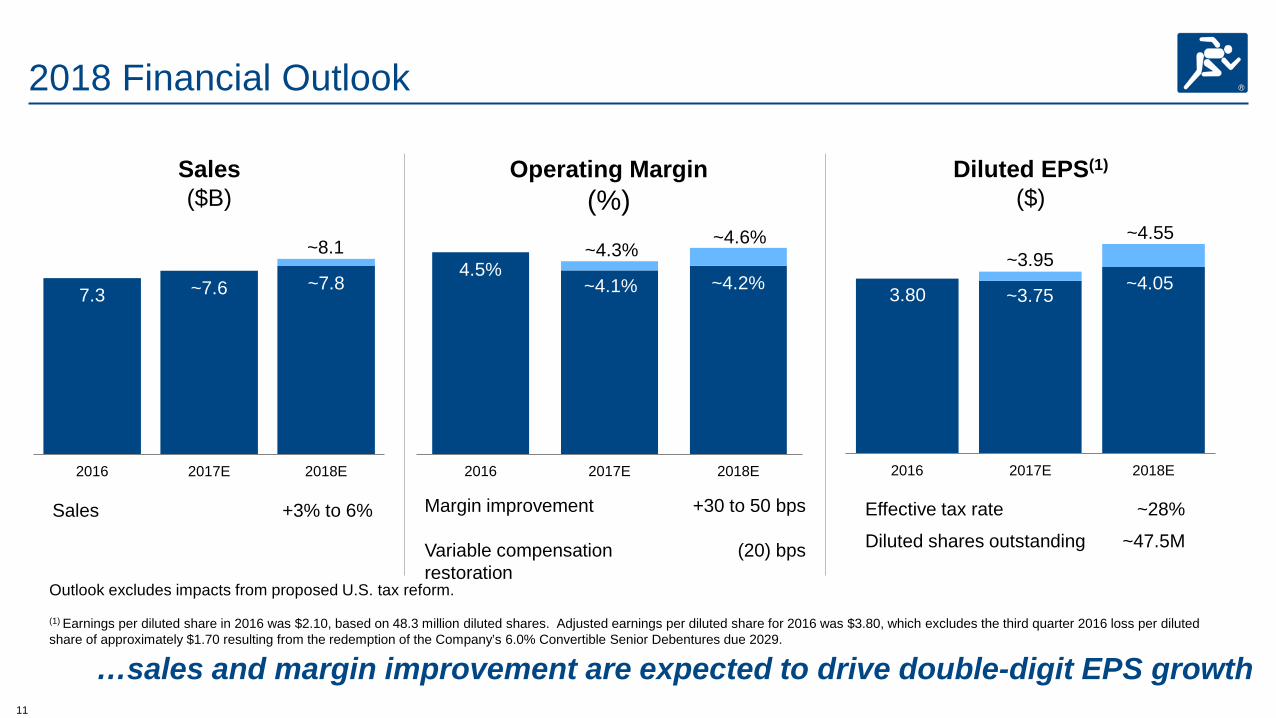
3.80 ~3.75 ~4.05
2016 2017E 2018E
2018 Financial Outlook
Sales ($B)
Diluted EPS(1)
($)
~4.55
4.5% ~4.1% ~4.2%
2016 2017E 2018E
Operating Margin (%)
Sales +3% to 6% Effective tax rate ~28%
Diluted shares outstanding ~47.5M
7.3 ~7.6 ~7.8
2016 2017E 2018E
~8.1 ~4.6% ~4.3% ~3.95
Margin improvement Variable compensation restoration
+30 to 50 bps
(20) bps
…sales and margin improvement are expected to drive double-digit EPS growth
(1) Earnings per diluted share in 2016 was $2.10, based on 48.3 million diluted shares. Adjusted earnings per diluted share for 2016 was $3.80, which excludes the third quarter 2016 loss per diluted share of approximately $1.70 resulting from the redemption of the Company’s 6.0% Convertible Senior Debentures due 2029.
Outlook excludes impacts from proposed U.S. tax reform.

12
1.5
2
2.5
3
3.5
4
Q1 Q2 Q3 Q4 Q1 Q2 Q3 Q4 Q1 Q2 Q3
Cash Generation and Leverage
(1) See Appendix for non-GAAP reconciliations. (2) Excludes the third quarter 2016 loss of $123.9M and related income tax benefit of $41.2M resulting from the redemption of the Company’s 6.0% Convertible Senior Debentures due 2029.
125%
154%
~90%
Free Cash Flow(1) as a Percentage of Adjusted Net Income(2)
Leverage (Total Debt to TTM EBITDA)(1) ~$1B of free
cash flow over last 4 years Target Leverage
2.0x – 3.5x 3.7X
2015 2016 2017
…expecting 2018 free cash flow of at least 90% of net income
2015 2016 2017E
13
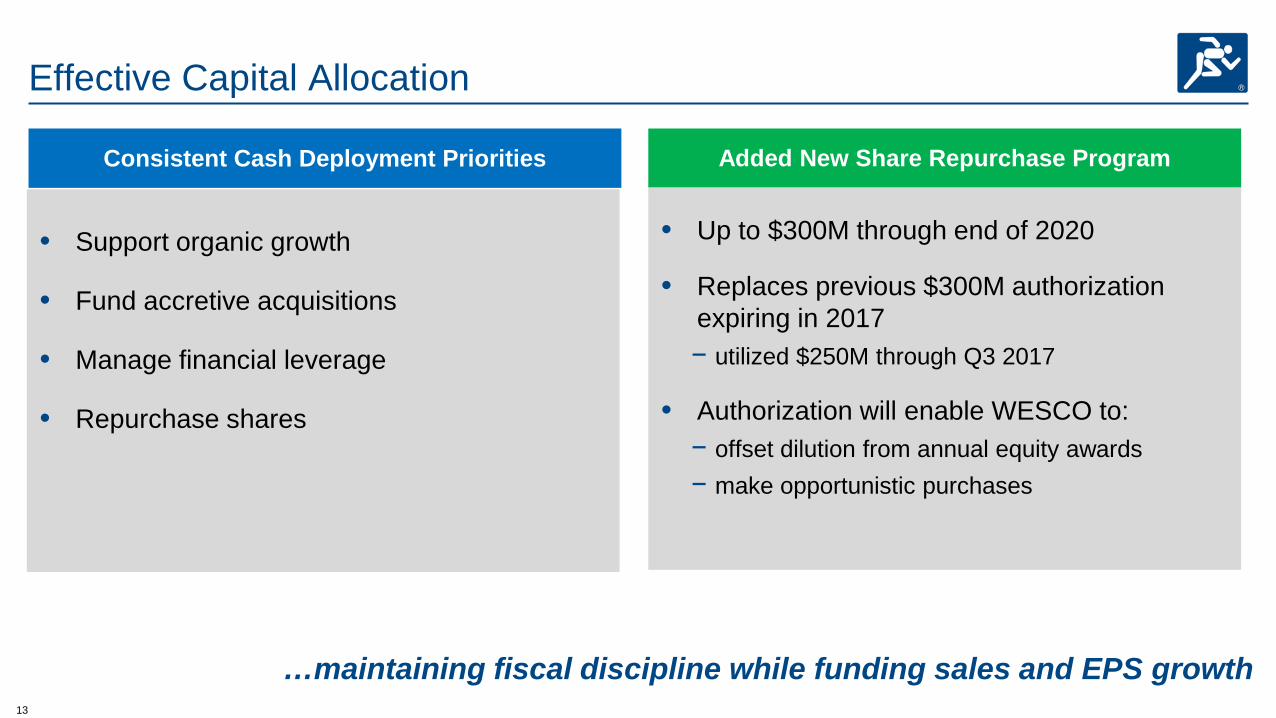
Effective Capital Allocation
Added New Share Repurchase Program
• Up to $300M through end of 2020
• Replaces previous $300M authorization expiring in 2017 − utilized $250M through Q3 2017
• Authorization will enable WESCO to: − offset dilution from annual equity awards − make opportunistic purchases
…maintaining fiscal discipline while funding sales and EPS growth
Consistent Cash Deployment Priorities
• Support organic growth
• Fund accretive acquisitions
• Manage financial leverage
• Repurchase shares
14
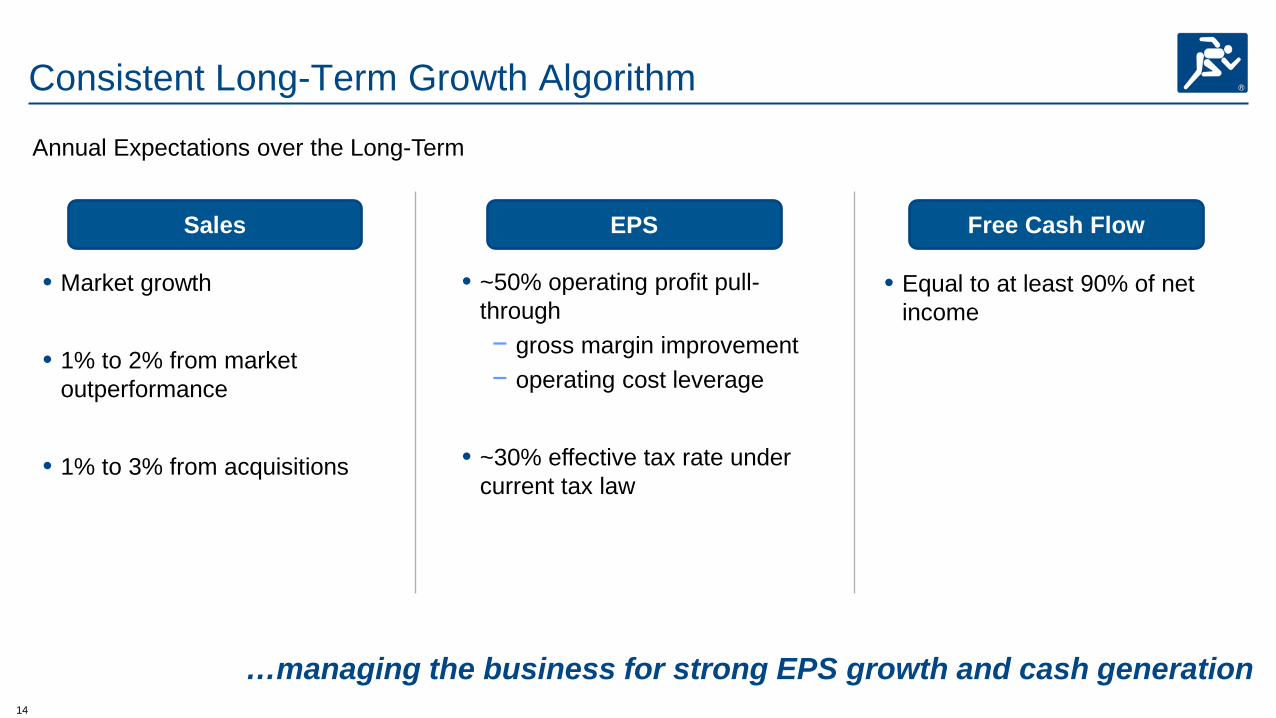
Consistent Long-Term Growth Algorithm
• Market growth
• 1% to 2% from market outperformance
• 1% to 3% from acquisitions
• ~50% operating profit pull-through − gross margin improvement − operating cost leverage
• ~30% effective tax rate under
current tax law
Annual Expectations over the Long-Term
• Equal to at least 90% of net income
Sales EPS Free Cash Flow
…managing the business for strong EPS growth and cash generation

15

16
Non-GAAP Financial Measures Appendix
This presentation includes certain non-GAAP financial measures. These financial measures include
organic sales growth, financial leverage, free cash flow, adjusted net income and adjusted earnings
per diluted share. WESCO believes that these non-GAAP measures are useful to investors as they
provide a better understanding of sales performance, and the use of debt and liquidity on a
comparable basis. Additionally, certain of the aforementioned non-GAAP measures either focus on or
exclude transactions impacting comparability of results, allowing investors to more easily compare the
Company's financial performance from period to period. Management does not use these non-GAAP
financial measures for any purpose other than the reasons stated above.

17
Definitions • Financial leverage ratio is calculated by dividing total debt, which excludes debt discount and debt issuance
costs, by the trailing twelve months earnings before interest, taxes, depreciation, and amortization (EBITDA).
• Free cash flow is calculated by deducting capital expenditures from cash flow provided by operating activities.
• Income from operations is defined as net sales less cost of goods sold (excluding depreciation and amortization), selling, general and administrative expenses, and depreciation and amortization.
• Operating margin is calculated by dividing income from operations by net sales.
• Organic sales growth is calculated by deducting the percentage impact from acquisitions in the first year of ownership, foreign exchange rates and number of workdays from the overall percentage change in consolidated net sales.
• Sales change abbreviations include: − HSD = High-single-digits − MSD = Mid-single-digits − LSD = Low-single-digits

18
WESCO Profile Q3 2017
37%
33%
15%
15%
40%
15% 15%
12%
10% 8%
Note: Markets & Customers and Products & Services percentages reported on a TTM consolidated basis.
Products & Services Markets & Customers
Utility
CIG
Industrial
Construction
Investor Owned | Public Power Utility Contractors
Commercial | Institutional | Government
Global Accounts | Integrated Supply OEM | General Industrial
Non-Residential | Contractors
Automation, Controls & Motors
Lighting & Sustainability
General Supplies Communications & Security
Wire, Cable & Conduit
Electrical Distribution & Controls
19
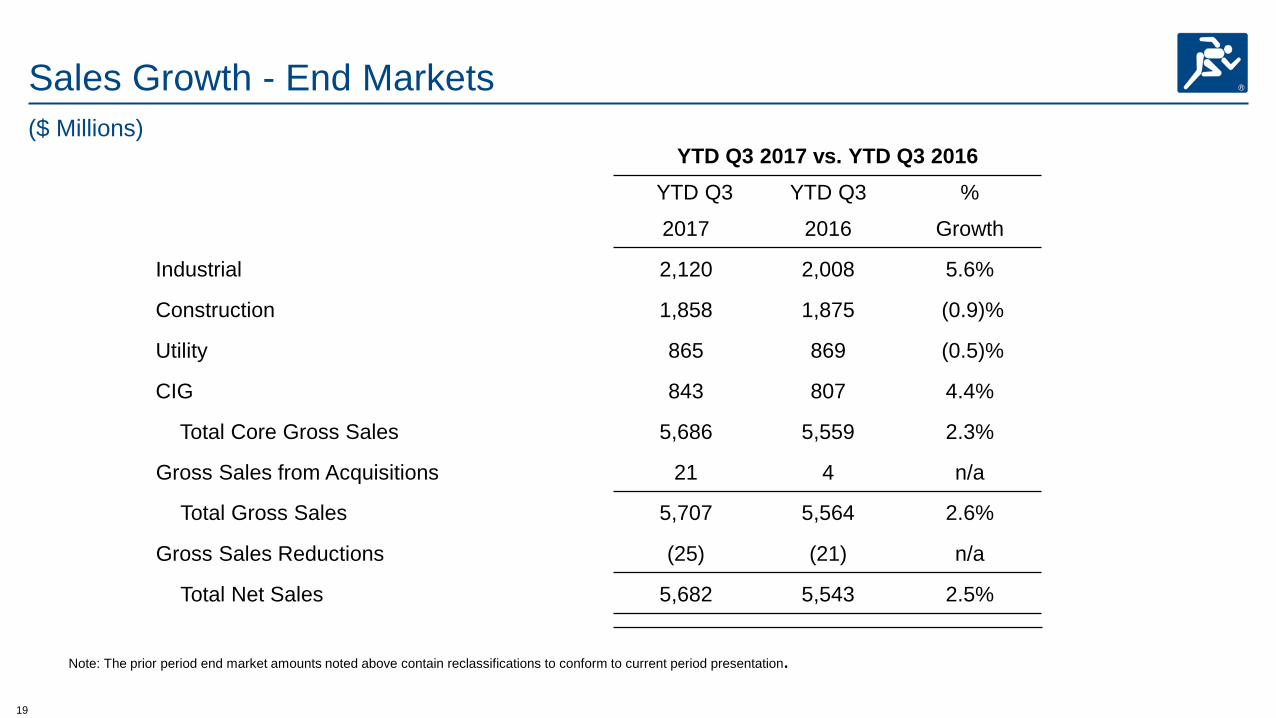
Note: The prior period end market amounts noted above contain reclassifications to conform to current period presentation.
($ Millions)
Sales Growth - End Markets
YTD Q3 2017 vs. YTD Q3 2016 YTD Q3 YTD Q3 %
2017 2016 Growth
Industrial 2,120 2,008 5.6%
Construction 1,858 1,875 (0.9)%
Utility 865 869 (0.5)%
CIG 843 807 4.4%
Total Core Gross Sales 5,686 5,559 2.3%
Gross Sales from Acquisitions 21 4 n/a
Total Gross Sales 5,707 5,564 2.6%
Gross Sales Reductions (25) (21) n/a
Total Net Sales 5,682 5,543 2.5%

20
YTD Q3 2017 Organic Sales by End Market
Industrial Construction Utility CIG WESCO
Core Sales Growth 5.6 (0.9) (0.5) 4.4 2.3
FX Impact 0.0 0.2 0.1 0.0 0.1
Workday Impact (0.5) (0.5) (0.5) (0.5) (0.5)
Organic Growth 6.1 (0.6) (0.1) 4.9 2.7
(%)
Note: For organic sales growth in 2017, see quarterly earnings webcasts as previously furnished to the Securities & Exchange Commission, which can be obtained from the ‘Investors” page of WESCO’s website at www.wesco.com.
21
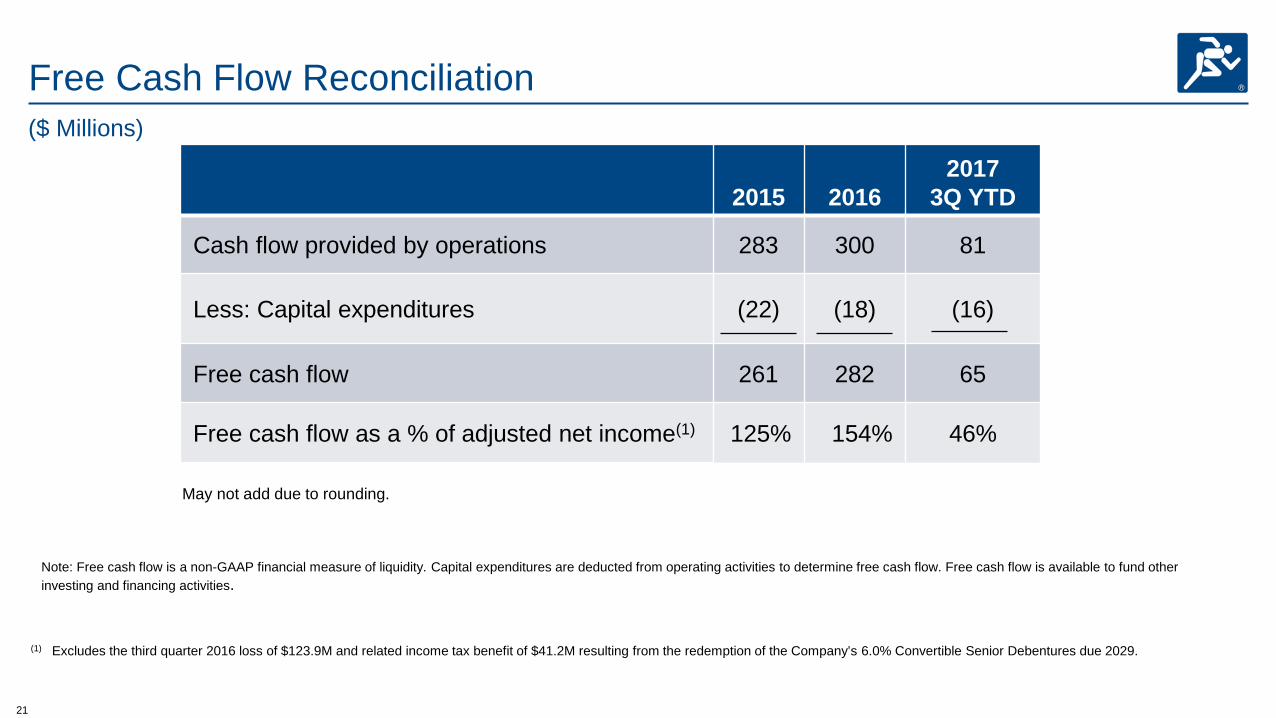
Free Cash Flow Reconciliation
2015 2016 2017
3Q YTD
Cash flow provided by operations 283 300 81
Less: Capital expenditures (22) (18) (16)
Free cash flow 261 282 65
Free cash flow as a % of adjusted net income(1) 125% 154% 46%
Note: Free cash flow is a non-GAAP financial measure of liquidity. Capital expenditures are deducted from operating activities to determine free cash flow. Free cash flow is available to fund other investing and financing activities.
(1) Excludes the third quarter 2016 loss of $123.9M and related income tax benefit of $41.2M resulting from the redemption of the Company’s 6.0% Convertible Senior Debentures due 2029.
($ Millions)
May not add due to rounding.

22
Financial Leverage Ratio Twelve Months Ended September 30, 2017
Financial leverage ratio: Income from operations $ 322 Depreciation and amortization 64 EBITDA $ 386
September 30, 2017 Short-term borrowings and current debt $ 41 Long-term debt 1,368 Debt discount and debt issuance costs(1) 14 Total debt $ 1,423 Less: cash and cash equivalents $ 94 Total debt, net of cash $ 1,329
Financial leverage ratio 3.7X Financial leverage ratio, net of cash 3.4X
($ Millions)
(1) Long-term debt is presented in the condensed consolidated balance sheet as of September 30, 2017, net of debt discount and debt issuance costs.
Note: For financial leverage ratio in 2017, see quarterly earnings webcasts as previously furnished to the Securities & Exchange Commission, which can be obtained from the ‘Investors” page of WESCO’s website at www.wesco.com.
23
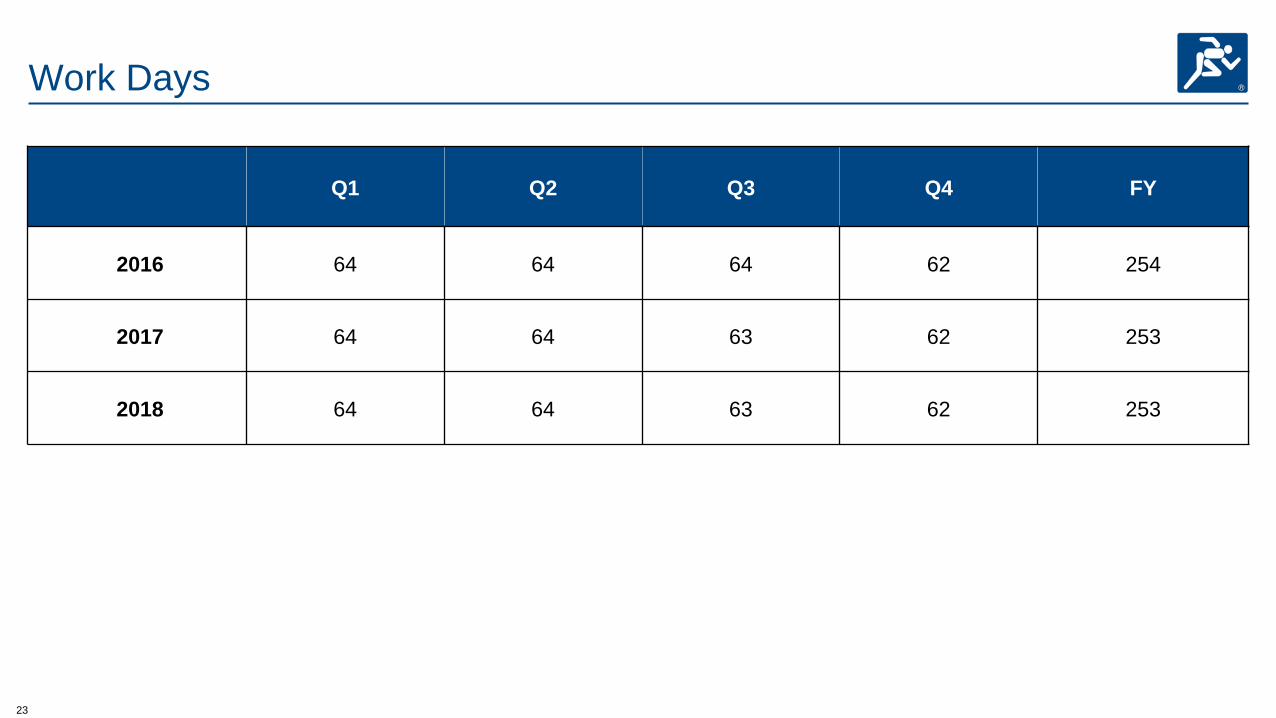
Work Days
Q1
Q2 Q3 Q4 FY
2016 64 64 64 62 254
2017 64 64 63 62 253
2018 64 64 63 62 253
24