2018 outcomes report · 2. a program plan of outcomes will be developed yearly. the plan will...
TRANSCRIPT

2018 Outcomes Report

Introduction to the Outcomes Report Performance Indicators Review of 2018
Our Mission
Our mission is to help people with disabilities and seniors attain independence and dignity by creating opportunities for participation in the community. People in pursuit of:
• a place to live affordable housing and specialized homes • a place to learn employment and training programs • a way to get there transportation services • a place to grow and play camping and recreation programs
Think of the 4 areas of service we provide that are connected to this mission: A place to live: Affordable housing and care provided in specialized
homes, apartments and duplex living. A place to learn: Autism Services, Community Living Supports
and vocational training programs A way to get there: Transportation services A place to grow and play: Camping and recreation programs and our
LARC clubs 2018 brought change, growth and development for our agency as we expanded services in Ottawa County through a new site for Group Community Living support services, the opening of a newly built residential group home, the wide development of Senior Services and the expansion of our Vocational Services Program EVALUATING OUR IMPACT: Our Values speak to the Impact we want to provide to the individuals who receive services from Pioneer Resources. Through these Values we define the essence of the agency and its mandate to define ourselves as an agency that is devoted to dignity, respect of the individuals who receive our services.
FY 2018 Outcomes Report 1

OUR VALUES Choice and Self Determination – people have a right to determine
where and with whom they will live. Control – people with disabilities should have control over their living
arrangements to the extent possible. Interdependence – not independence. The word independence is
over-used. Most of us do not choose to live in isolation, but we attempt to maintain supportive, meaningful relationships.
Flexible Supports – supports should vary for each individual and reflect a combination of services, adaptations, and assistance from paid staff, family, friends, neighbors and others.
As we engage in programs of such as Skill Building, Community Living Supports, Transportation, Vocational Training, ABA Therapy, Recreational Programs or operation of licensed residential settings, defining the value of this service is a key to success. How do we evaluate our services? This challenge is one that we define throughout the year, through the input of individuals served. Satisfaction and growth are key to defining if our services are having an impact on each person’s life. At Pioneer Resources, we believe it is possible to make a difference in the lives of persons who face barriers to the exercise of choice. We believe it is our duty to try and measure our effectiveness and report our results. We recognize this is not always easy and we are dedicated to continual improvement. Because we support the rights of persons with disabilities and senior citizens to make choices, because those choices are not always articulated in a manner that can be measureable and because growth is not always rapid in providing progress, the performance measurement system we have adopted relies heavily on what the persons receiving services report and express. In other words, we want to know if the people we serve and their representatives believe we are having an impact and are satisfied that we have marched in step with their desires to participate in community to the best of their abilities. Efficiency refers to our use of resources in the pursuit of breaking down barriers. We have also chosen to measure whether we are effective. Effectiveness refers to whether or not our actions and interventions help persons served make progress toward realization of goals or choices. Data and information is entered into our electronic record system. Using tablets and the Groveware application, staff can now easily track authorizations, record goals, and provide feedback in real time on participants’ progress toward goals. Many paper records were eliminated, service billing was improved, and perhaps most important, we have been able to add the observations of staff and individuals served in order to define progress and measurements towards goal completion. MEASUREMENTS: The performance measurement system we have adopted for skill building, community living supports, and residential services encompasses the variables below. By necessity, different programs require different variables.
FY 2018 Outcomes Report 2
For each service provided by Pioneer Resources or a subsidiary, we attempt to provide a measure of efficiency and effectiveness. The following are efficiency variables we have attempted to measure. These are examples used over time. Please refer to charts elsewhere in this report for selected measures.
• Number of persons served • Revenue and expenses – the bottom line compared to budget – or
financial performance compared to inflation • The number of persons served per dollar of expense • The number of denied claims for service • Occupancy rates
Below are examples of measures of effectiveness Pioneer Resources has adopted:
• Satisfaction rates of persons served and or family members • Satisfaction rates of persons or organizations making referrals to Pioneer
Resource • Satisfaction rates of other stakeholders • Number of persons served making progress toward goals as measured by
staff
Personnel responsibilities: The daily documentation is the responsibility of the direct support professional staff working with the participants. The responsibility for monitoring and accumulating the data is held with the Program Manager and reported yearly to the Performance Improvement Specialist. Please review this report for our rates of success from the past fiscal year for each program and service. We welcome feedback and constructive criticism.
Please review this report for our rates of success from the past fiscal year. We welcome feedback and constructive criticism.
FY 2018 Outcomes Report 3
MDHHS Licensing & LRE Audits
Internal Monitoring
People Served and Family Satisfaction Surveys
Annual Outcome Program Evaluation and Management Reports Based on Service
Outcomes
Agency-Wide Annual Goals and Work Plan
Three Year Strategic Plan
Agency-Wide Assessment By Outside Consultants
Individual Plans of Service Goals and Data Collection
Program outcome goals
Evaluate Progress on Strategic Plan and Quality Indicators
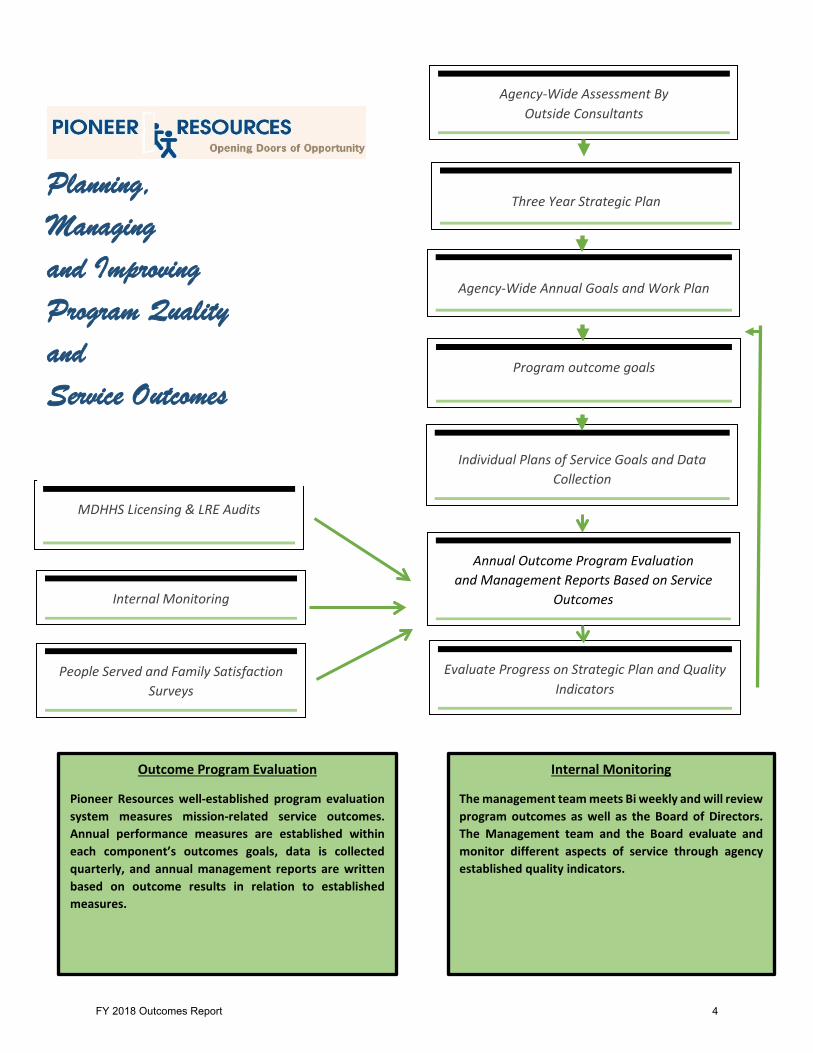
Planning, Managing and Improving Program Quality and Service Outcomes
Outcome Program Evaluation
Pioneer Resources well-established program evaluation system measures mission-related service outcomes. Annual performance measures are established within each component’s outcomes goals, data is collected quarterly, and annual management reports are written based on outcome results in relation to established measures.
Internal Monitoring
The management team meets Bi weekly and will review program outcomes as well as the Board of Directors. The Management team and the Board evaluate and monitor different aspects of service through agency established quality indicators.
FY 2018 Outcomes Report 4

PIONEER RESOURCES, INC. Standard Operating Policies And Procedures
Applies to: ☐ Pioneer Arbour ☒ Pioneer House ☐ Pioneer Non-Profit Housing ☒ Pioneer Resources ☒ Pioneer Transportation
Policy Area: ☐ Health /Safety ☒ Management / General ☐ Personnel ☐ Program Operations ☐ Transportation
Subject: Program Evaluation Policy Revision Date
Number: 524 Effective Date: 9/29/18 Issue Number: 1
Purpose To establish the guidelines for the agency to evaluate the outcomes and efficiencies of services provided to individuals
All programs within Pioneer Resources will conduct an outcome evaluation process which enables the organization to regularly review the results of services and the benefits to the individuals served. This information will be presented to the Board of Directors at least annually and integrated into decision-making processes at all levels within the organization. The following expectations will be used to develop and maintain a program evaluation system for each program: 1. The program evaluation system will measure the outcomes resulting from the services provided
for all individuals served, or a representative sample of those served, as well as progress towards those ends. Areas to be measured include efficiency, effectiveness and satisfaction.
2. A program plan of outcomes will be developed yearly. The Plan will include a description of the
characteristics of the individuals served, an assessment of their gifts and needs, and development of service outcome goals and objectives. The methods and time frames for collecting, processing, reporting and disseminating the program evaluation data.
3. An outcome report will be issued yearly. This report will reflect the measures of program
effectiveness and efficiency in delivery of services, measures the satisfaction of the individuals life because of the service and an interpretation of the results. This report will be due in February of each year and will be distributed to stakeholders, family members and persons served through access on our website.
4. Program evaluation information will be used to discontinue, maintain or improve the services;
impact programmatic and administrative functions; determine the appropriateness of the services, impact our strategic planning process and confirm that the organization portrays itself and its services in an accurate manner.
5. The Executive Director will periodically review the overall adequacy of the program evaluation
system. The review will focus on the meaningfulness of the information collected and the usefulness of the information in relation to the program mission, vision and the services provided.
6. The Agency Board of Directors will be presented with the agency outcomes report yearly.
FY 2018 Outcomes Report 5

PIONEER RESOURCES
FISCAL YEAR 2018 OUTCOMES REPORT
Table of Contents Section 1: Characteristics of People Served During the Year
Total Number of People Served Individuals Served through Applied Behavior Analysis (ABA) Individuals Served through Community Connections Individuals Served through Community Living Supports Individuals Served through the Leisure and Recreation Club (LARC) Individuals Served through Residential Services Individual Served through Vocational Services Characteristics Comparison Information Section 2: Quality Improvement Plans / Goals and Objectives
Applied Behavior Analysis (ABA) Program Community Connections Community Living Supports Leisure and Recreation Club (LARC) Residential Services Transportation Vocational Services All Community Living Services Programs Section 3: Narratives and Analysis of Outcomes
Applied Behavior Analysis (ABA) Program Community Connections Community Living Supports Leisure and Recreation Club (LARC) Residential Services Vocational Services
FY 2018 Outcomes Report 6

Characteristics of People Served During the Year
FY 2018 Outcomes Report 7

Pioneer Resources Community Living Services 2018 Participant Characteristics
Total Persons Served in all Programs = 390 Age 0-17 18-30 31-45 46-65 66 yrs. + 38 84 143 105 20 Gender Male Female 236 154
Ethnicity Caucasian African American Latino Asian American
Native American
Other (Biracial)
313 64 5 7 1
Ambulation Without Assistance With Assistance
Uses Wheelchair
314 25 51 Primary Disability
Developmental Disability Mental Illness
Autism Spectrum Dual Diagnosis Other
225 27 51 76 11
FY 2018 Outcomes Report 8

Pioneer Resources Community Living Services Participant Characteristics ABA Program-Muskegon
2018 Total Number of Persons Served = 30 Age 0-5 6-10 11-15 16-17 18-21 13 15 1 1 Gender Male Female 24 6
Ethnicity Caucasian African American Latino Asian Native American Other
15 14 1
Ambulation Without Assistance With Assistance Uses Wheelchair
30 Primary Disability
Developmental Disability Mental Illness Autism Spectrum Dual Diagnosis Other
30
FY 2018 Outcomes Report 9

Pioneer Resources Community Living Services Participant Characteristics
ABA Program-Ottawa 2018 Total Number of Persons Served = 9
Age 0-5 6-10 11-15 16-17 18-21 1 1 4 2 1 Gender Male Female 9
Ethnicity Caucasian African American Latino Asian Native American Other
8 1
Ambulation Without Assistance With Assistance
Uses Wheelchair
9 Primary Disability
Developmental Disability Mental Illness
Autism Spectrum Dual Diagnosis Other
9
FY 2018 Outcomes Report 10
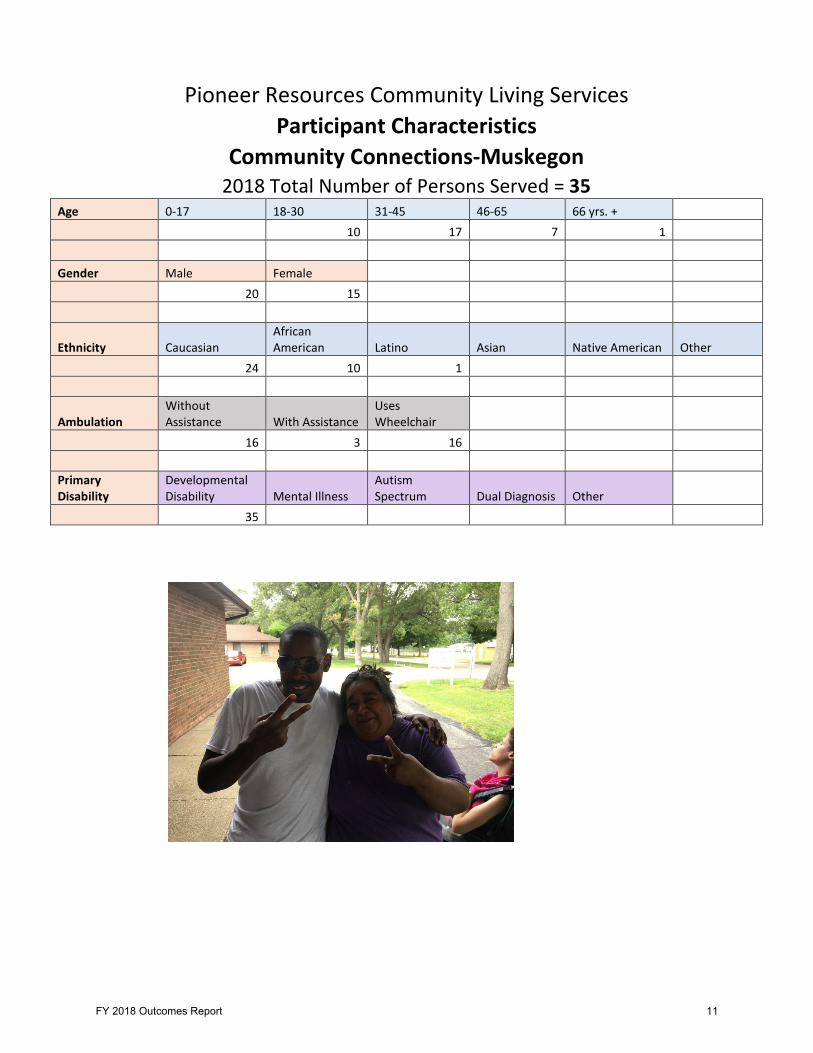
Pioneer Resources Community Living Services Participant Characteristics
Community Connections-Muskegon 2018 Total Number of Persons Served = 35
Age 0-17 18-30 31-45 46-65 66 yrs. + 10 17 7 1 Gender Male Female 20 15
Ethnicity Caucasian African American Latino Asian Native American Other
24 10 1
Ambulation Without Assistance With Assistance
Uses Wheelchair
16 3 16 Primary Disability
Developmental Disability Mental Illness
Autism Spectrum Dual Diagnosis Other
35
FY 2018 Outcomes Report 11
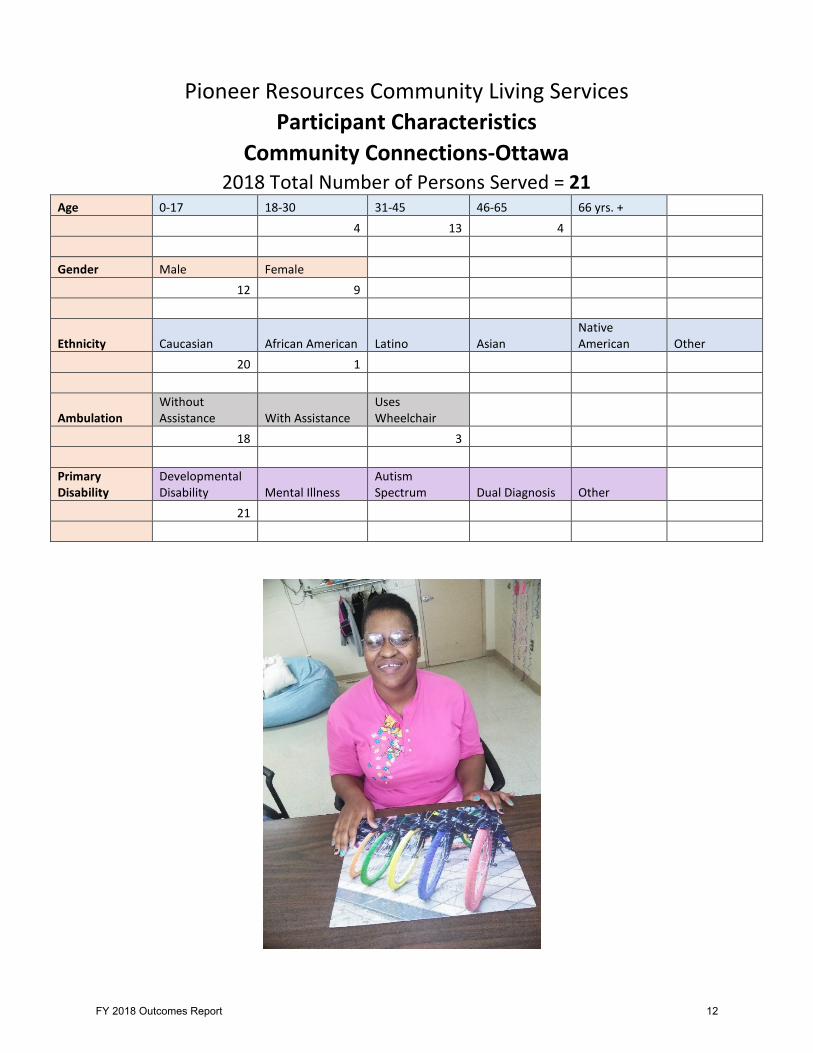
Pioneer Resources Community Living Services Participant Characteristics
Community Connections-Ottawa 2018 Total Number of Persons Served = 21
Age 0-17 18-30 31-45 46-65 66 yrs. + 4 13 4 Gender Male Female 12 9
Ethnicity Caucasian African American Latino Asian Native American Other
20 1
Ambulation Without Assistance With Assistance
Uses Wheelchair
18 3 Primary Disability
Developmental Disability Mental Illness
Autism Spectrum Dual Diagnosis Other
21
FY 2018 Outcomes Report 12

Pioneer Resources Community Living Supports Participant Characteristics
Community Living Supports (Individual)-Muskegon 2018 Total Number of Persons Served = 37
Age 0-17 18-30 31-45 46-65 66yrs. + 1 22 14 Gender Male Female 22 15
Ethnicity Caucasian African American Latino Asian American Native American Other
30 7
Ambulation Without Assistance With Assistance
Uses Wheelchair
35 2 Primary Disability
Developmental Disability Mental Illness
Autism Spectrum Dual Diagnosis Other
35 2
FY 2018 Outcomes Report 13

Pioneer Resources Community Living Services Participant Characteristics
Community Living Supports (Individual)-Ottawa 2018 Total Number of Persons Served = 2
Age 0-17 18-30 31-45 46-65 66 yrs. + 1 1 Gender Male Female 2
Ethnicity Caucasian African American Latino Asian Native American Other
2
Ambulation Without Assistance With Assistance
Uses Wheelchair
2 Primary Disability
Developmental Disability Mental Illness
Autism Spectrum Dual Diagnosis Other
2
FY 2018 Outcomes Report 14

Pioneer Resources Community Living Services Participant Characteristics
Leisure and Recreation Club (LARC)-Muskegon 2018 Total Number of Active Persons Served = 41
Age 0-17 18-30 31-45 46-65 66 yrs. + 6 18 15 2 Gender Male Female 23 18
Ethnicity Caucasian African American Latino Asian American Native American Other
34 5 2
Ambulation Without Assistance With Assistance Uses Wheelchair
34 3 4 Primary Disability
Developmental Disability Mental Illness Autism Spectrum Dual Diagnosis Other
6 3 32
FY 2018 Outcomes Report 15

Pioneer Resources Community Living Services Participant Characteristics
Leisure and Recreation Club (LARC)-Ottawa 2018 Total Number of Active Persons Served = 59
Age 0-17 18-30 31-45 46-65 66 yrs. + 10 25 19 5 Gender Male Female 35 24
Ethnicity Caucasian African American Latino Asian Native American Other
55 2 2
Ambulation Without Assistance With Assistance
Uses Wheelchair
52 5 2 Primary Disability
Developmental Disability Mental Illness
Autism Spectrum Dual Diagnosis Other
5 6 3 35 10
FY 2018 Outcomes Report 16

Pioneer Resources Community Living Services Participant Characteristics
Residential 2018 Total Number of Persons Served = 52
Age 0-17 18-30 31-45 46-65 66 yrs. + 3 10 29 10 Gender Male Female 19 33
Ethnicity Caucasian African American Latino Asian Native American Other
47 3 1 1
Ambulation Without Assistance With Assistance
Uses Wheelchair
23 11 18 Primary Disability
Developmental Disability Mental Illness
Autism Spectrum Dual Diagnosis Other
44 3 1 3 1
FY 2018 Outcomes Report 17

Pioneer Resources Community Living Services Participant Characteristics
Skill Building 2018 Total Number of Active Persons Served = 54
Age 0-17 18-30 31-45 46-65 66 yrs. + 20 20 13 1 Gender Male Female 40 14
Ethnicity Caucasian African American Latino Asian American Native American Other (Biracial
41 10 2 1
Ambulation Without Assistance With Assistance Uses Wheelchair
48 2 4 Primary Disability
Developmental Disability Mental Illness Autism Spectrum Dual Diagnosis Other
44 3 2 5
FY 2018 Outcomes Report 18
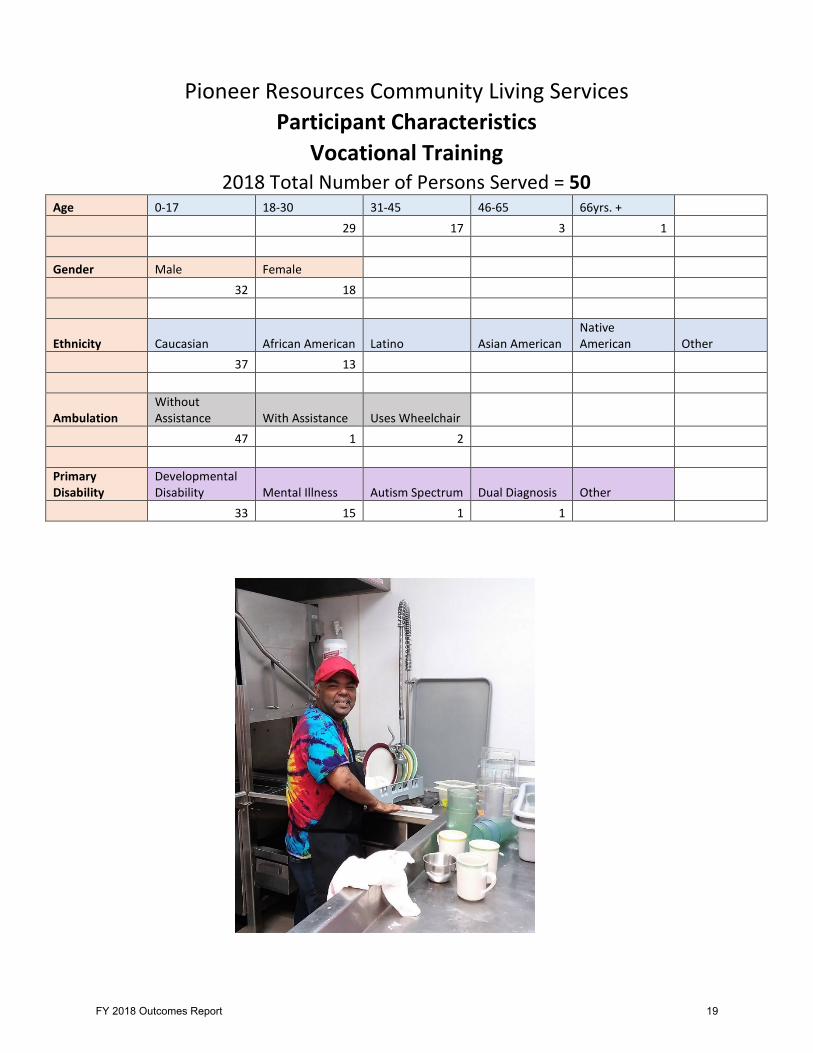
Pioneer Resources Community Living Services Participant Characteristics
Vocational Training 2018 Total Number of Persons Served = 50
Age 0-17 18-30 31-45 46-65 66yrs. + 29 17 3 1 Gender Male Female 32 18
Ethnicity Caucasian African American Latino Asian American Native American Other
37 13
Ambulation Without Assistance With Assistance Uses Wheelchair
47 1 2 Primary Disability
Developmental Disability Mental Illness Autism Spectrum Dual Diagnosis Other
33 15 1 1
FY 2018 Outcomes Report 19
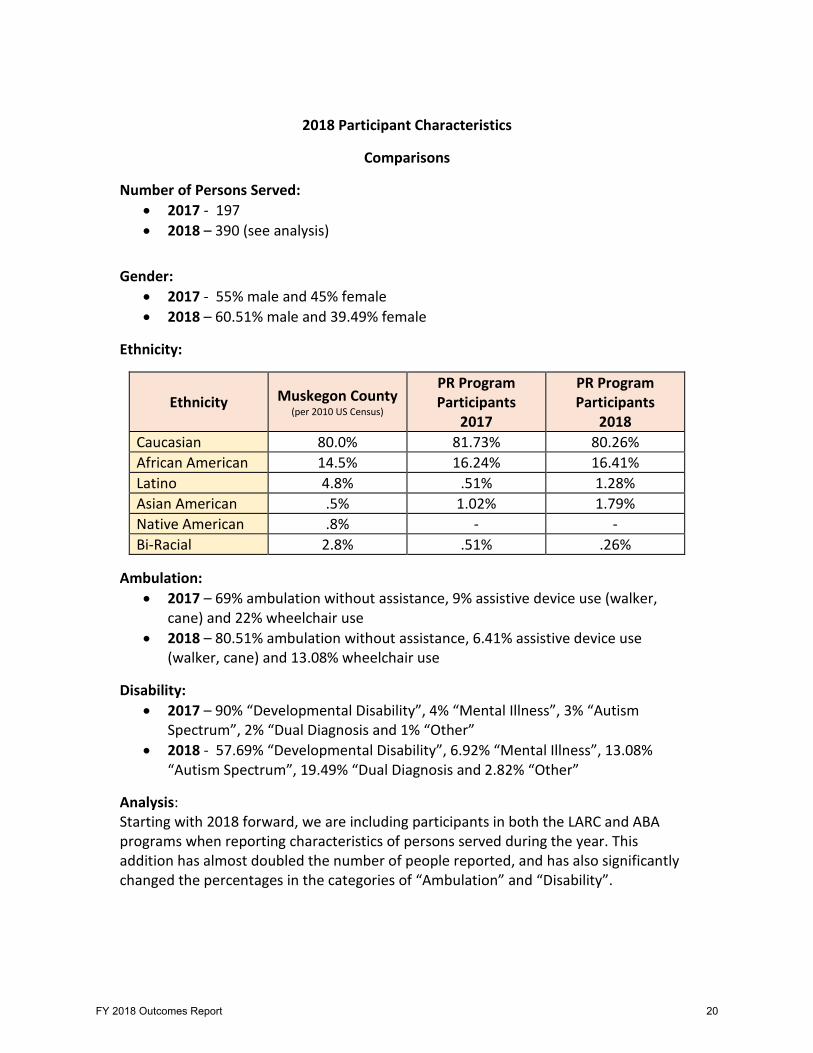
2018 Participant Characteristics
Comparisons
Number of Persons Served: • 2017 - 197 • 2018 – 390 (see analysis)
Gender: • 2017 - 55% male and 45% female • 2018 – 60.51% male and 39.49% female
Ethnicity:
Ethnicity Muskegon County (per 2010 US Census)
PR Program Participants
2017
PR Program Participants
2018 Caucasian 80.0% 81.73% 80.26% African American 14.5% 16.24% 16.41% Latino 4.8% .51% 1.28% Asian American .5% 1.02% 1.79% Native American .8% - - Bi-Racial 2.8% .51% .26%
Ambulation:
• 2017 – 69% ambulation without assistance, 9% assistive device use (walker, cane) and 22% wheelchair use
• 2018 – 80.51% ambulation without assistance, 6.41% assistive device use (walker, cane) and 13.08% wheelchair use
Disability: • 2017 – 90% “Developmental Disability”, 4% “Mental Illness”, 3% “Autism
Spectrum”, 2% “Dual Diagnosis and 1% “Other” • 2018 - 57.69% “Developmental Disability”, 6.92% “Mental Illness”, 13.08%
“Autism Spectrum”, 19.49% “Dual Diagnosis and 2.82% “Other”
Analysis: Starting with 2018 forward, we are including participants in both the LARC and ABA programs when reporting characteristics of persons served during the year. This addition has almost doubled the number of people reported, and has also significantly changed the percentages in the categories of “Ambulation” and “Disability”.
FY 2018 Outcomes Report 20
Quality Improvement Plans / Goals and Objectives
FY 2018 Outcomes Report 21
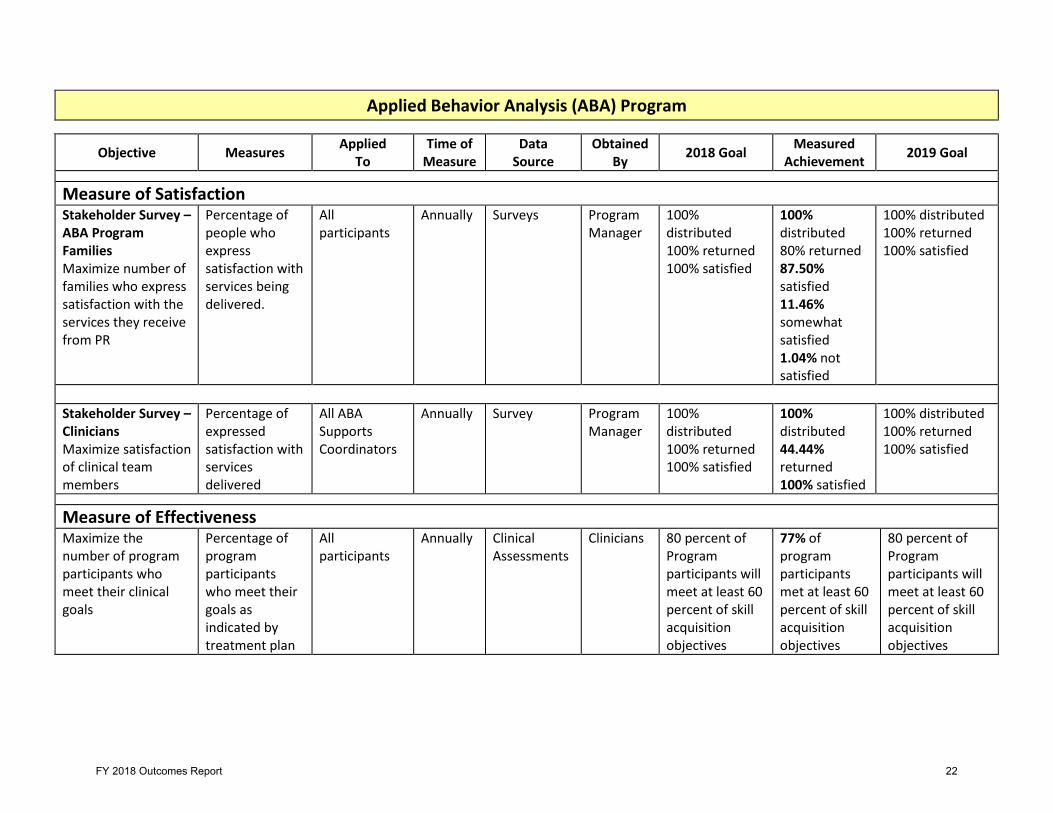
Applied Behavior Analysis (ABA) Program
Objective Measures Applied To
Time of Measure
Data Source
Obtained By 2018 Goal Measured
Achievement 2019 Goal
Measure of Satisfaction Stakeholder Survey – ABA Program Families Maximize number of families who express satisfaction with the services they receive from PR
Percentage of people who express satisfaction with services being delivered.
All participants
Annually Surveys Program Manager
100% distributed 100% returned 100% satisfied
100% distributed 80% returned 87.50% satisfied 11.46% somewhat satisfied 1.04% not satisfied
100% distributed 100% returned 100% satisfied
Stakeholder Survey – Clinicians Maximize satisfaction of clinical team members
Percentage of expressed satisfaction with services delivered
All ABA Supports Coordinators
Annually Survey Program Manager
100% distributed 100% returned 100% satisfied
100% distributed 44.44% returned 100% satisfied
100% distributed 100% returned 100% satisfied
Measure of Effectiveness Maximize the number of program participants who meet their clinical goals
Percentage of program participants who meet their goals as indicated by treatment plan
All participants
Annually Clinical Assessments
Clinicians 80 percent of Program participants will meet at least 60 percent of skill acquisition objectives
77% of program participants met at least 60 percent of skill acquisition objectives
80 percent of Program participants will meet at least 60 percent of skill acquisition objectives
FY 2018 Outcomes Report 22
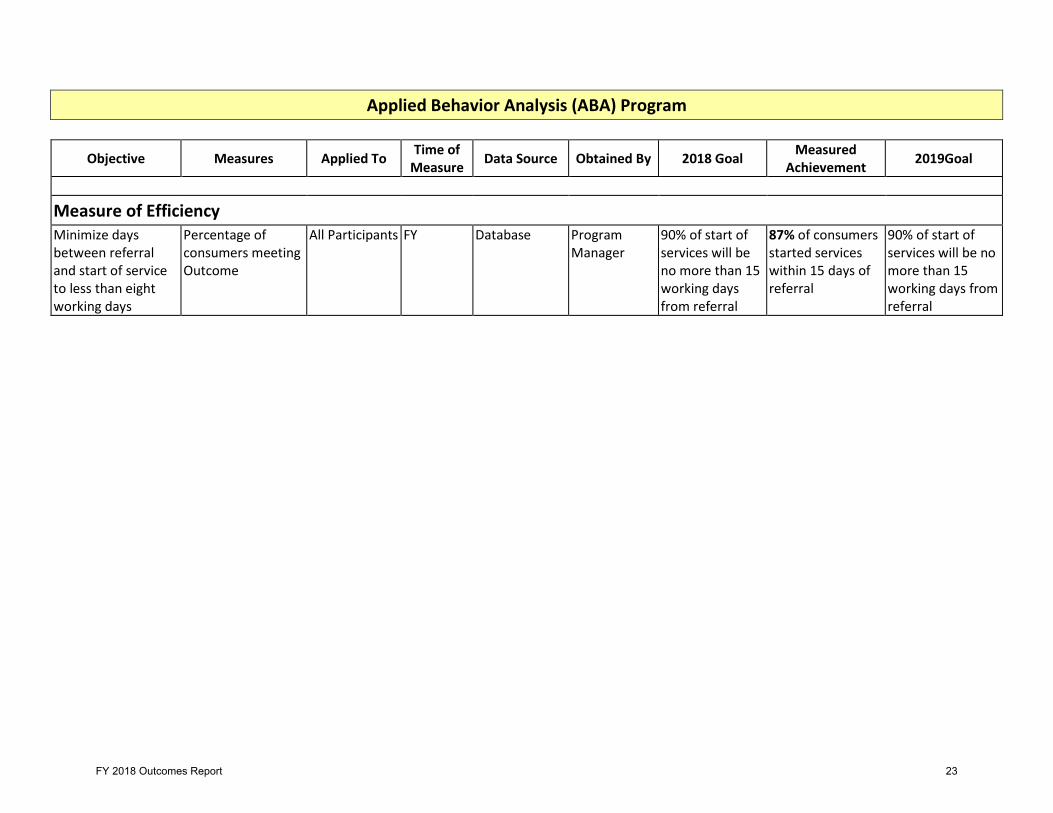
Applied Behavior Analysis (ABA) Program
Objective Measures Applied To Time of Measure Data Source Obtained By 2018 Goal Measured
Achievement 2019Goal
Measure of Efficiency Minimize days between referral and start of service to less than eight working days
Percentage of consumers meeting Outcome
All Participants FY Database Program Manager
90% of start of services will be no more than 15 working days from referral
87% of consumers started services within 15 days of referral
90% of start of services will be no more than 15 working days from referral
FY 2018 Outcomes Report 23
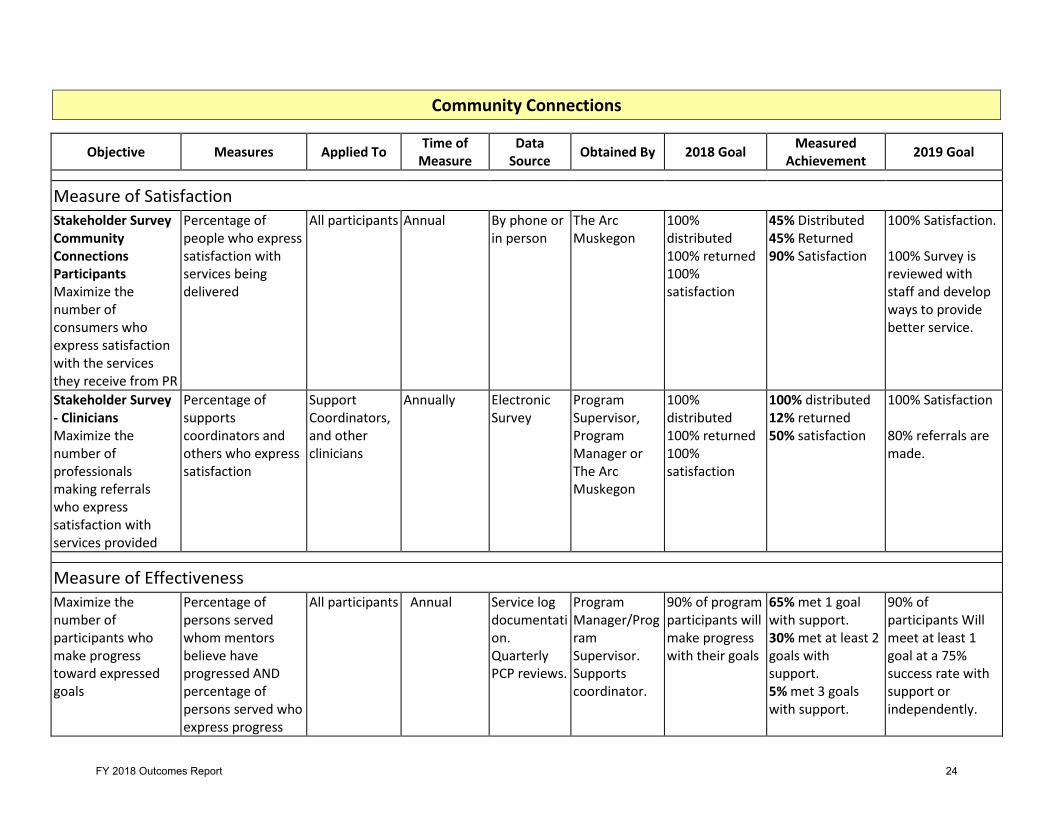
Community Connections
Objective Measures Applied To Time of Measure
Data Source Obtained By 2018 Goal Measured
Achievement 2019 Goal
Measure of Satisfaction Stakeholder Survey Community Connections Participants Maximize the number of consumers who express satisfaction with the services they receive from PR
Percentage of people who express satisfaction with services being delivered
All participants Annual By phone or in person
The Arc Muskegon
100% distributed 100% returned 100% satisfaction
45% Distributed 45% Returned 90% Satisfaction
100% Satisfaction. 100% Survey is reviewed with staff and develop ways to provide better service.
Stakeholder Survey - Clinicians Maximize the number of professionals making referrals who express satisfaction with services provided
Percentage of supports coordinators and others who express satisfaction
Support Coordinators, and other clinicians
Annually Electronic Survey
Program Supervisor, Program Manager or The Arc Muskegon
100% distributed 100% returned 100% satisfaction
100% distributed 12% returned 50% satisfaction
100% Satisfaction 80% referrals are made.
Measure of Effectiveness Maximize the number of participants who make progress toward expressed goals
Percentage of persons served whom mentors believe have progressed AND percentage of persons served who express progress
All participants Annual Service log documentation. Quarterly PCP reviews.
Program Manager/Program Supervisor. Supports coordinator.
90% of program participants will make progress with their goals
65% met 1 goal with support. 30% met at least 2 goals with support. 5% met 3 goals with support.
90% of participants Will meet at least 1 goal at a 75% success rate with support or independently.
FY 2018 Outcomes Report 24

Community Connections
Objective Measures Applied To Time of Measure Data Source Obtained By 2018 Goal Measured
Achievement 2019 Goal
Measure of Efficiency Denied Claims Minimize the number of claims denied by payers
Number of units disputed divided by all units billed
All CC claims Annually Ottawa, HW , Oceana Dispute forms and invoices
Program Manager/Supervisor and accounting staff
100% of claims paid
100% of claims were paid
100% of claims paid. 100% of documentation is accurate on service logs and authorization dates are current.
Service Access Minimize the amount of time from program acceptance to program start date
Number of days between the initial meeting and start date
All CC program participants
Annually Database, Participant files
Program Supervisor, Program Manager
100% of new participants will start within 7 days of their initial meeting
95% of new participants started within 7 days of their initial meeting
100% of new participants will start 3 to 5 days after all required paperwork is received.
FY 2018 Outcomes Report 25
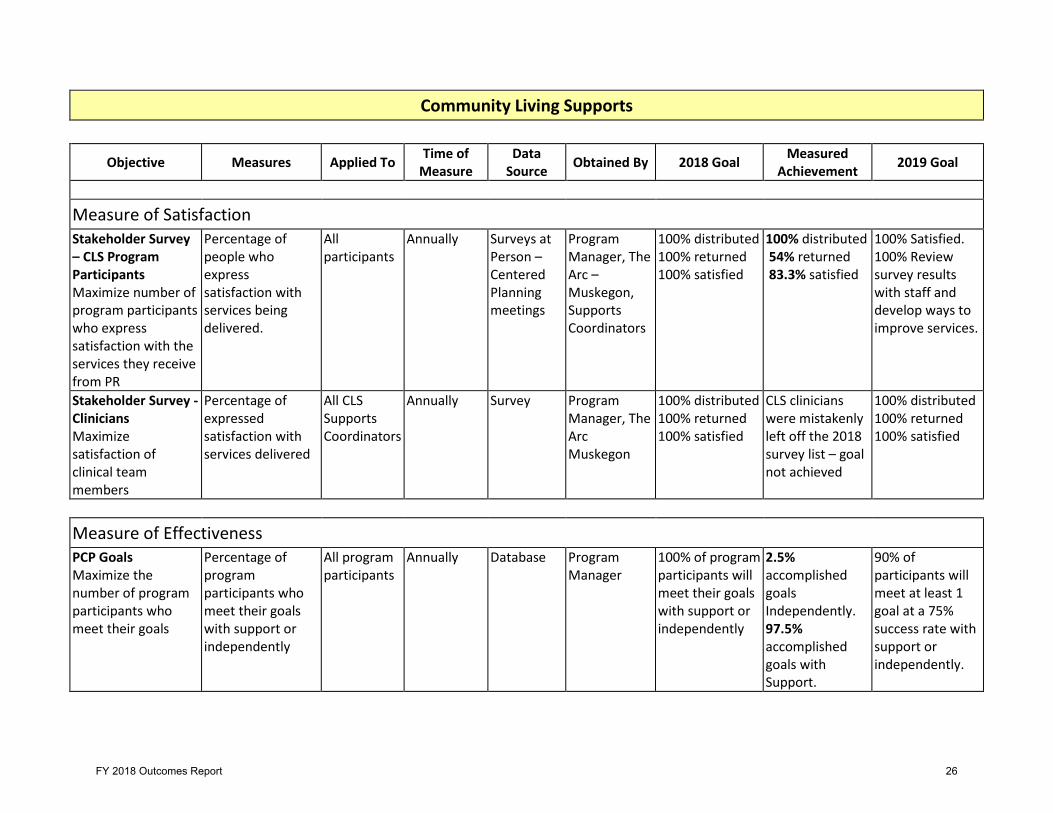
Community Living Supports
Objective Measures Applied To Time of Measure
Data Source Obtained By 2018 Goal Measured
Achievement 2019 Goal
Measure of Satisfaction Stakeholder Survey – CLS Program Participants Maximize number of program participants who express satisfaction with the services they receive from PR
Percentage of people who express satisfaction with services being delivered.
All participants
Annually Surveys at Person – Centered Planning meetings
Program Manager, The Arc – Muskegon, Supports Coordinators
100% distributed 100% returned 100% satisfied
100% distributed 54% returned 83.3% satisfied
100% Satisfied. 100% Review survey results with staff and develop ways to improve services.
Stakeholder Survey - Clinicians Maximize satisfaction of clinical team members
Percentage of expressed satisfaction with services delivered
All CLS Supports Coordinators
Annually Survey Program Manager, The Arc Muskegon
100% distributed 100% returned 100% satisfied
CLS clinicians were mistakenly left off the 2018 survey list – goal not achieved
100% distributed 100% returned 100% satisfied
Measure of Effectiveness PCP Goals Maximize the number of program participants who meet their goals
Percentage of program participants who meet their goals with support or independently
All program participants
Annually Database Program Manager
100% of program participants will meet their goals with support or independently
2.5% accomplished goals Independently. 97.5% accomplished goals with Support.
90% of participants will meet at least 1 goal at a 75% success rate with support or independently.
FY 2018 Outcomes Report 26
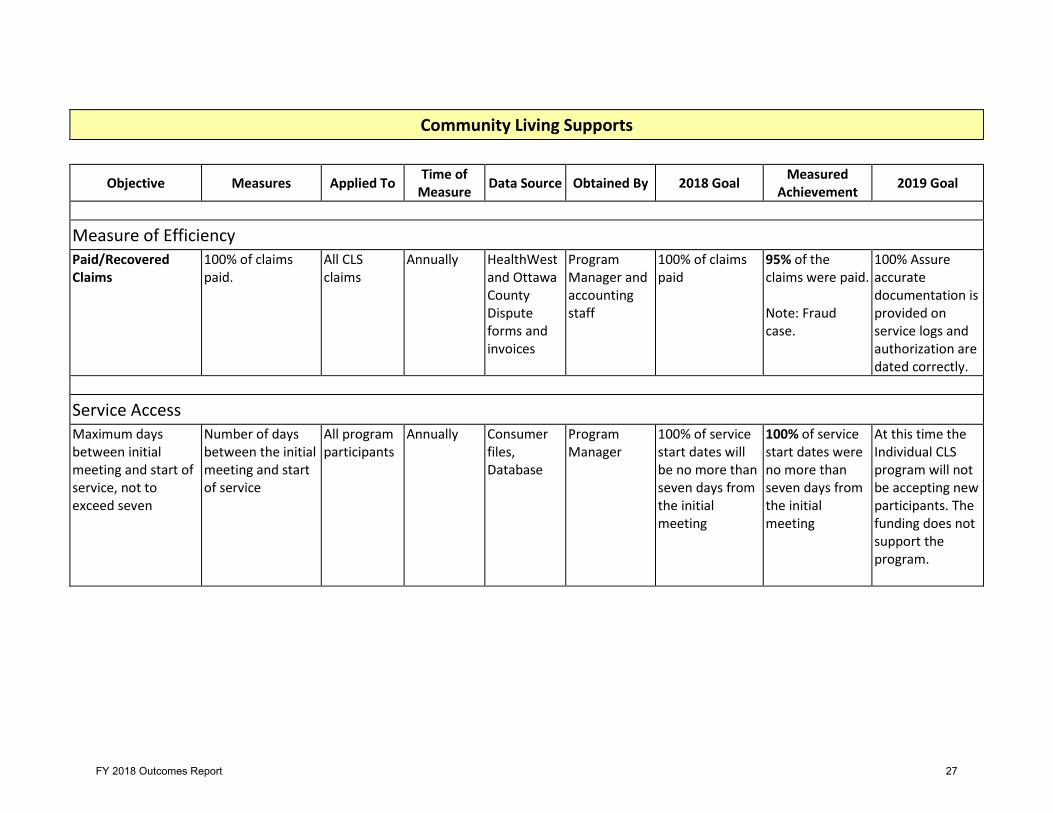
Community Living Supports
Objective Measures Applied To Time of Measure Data Source Obtained By 2018 Goal Measured
Achievement 2019 Goal
Measure of Efficiency Paid/Recovered Claims
100% of claims paid.
All CLS claims
Annually HealthWest and Ottawa County Dispute forms and invoices
Program Manager and accounting staff
100% of claims paid
95% of the claims were paid. Note: Fraud case.
100% Assure accurate documentation is provided on service logs and authorization are dated correctly.
Service Access Maximum days between initial meeting and start of service, not to exceed seven
Number of days between the initial meeting and start of service
All program participants
Annually Consumer files, Database
Program Manager
100% of service start dates will be no more than seven days from the initial meeting
100% of service start dates were no more than seven days from the initial meeting
At this time the Individual CLS program will not be accepting new participants. The funding does not support the program.
FY 2018 Outcomes Report 27
Residential
Objective Measures Applied To
Time of Measure
Data Source
Obtained By 2018 Goal Measured
Achievement 2019 Goal
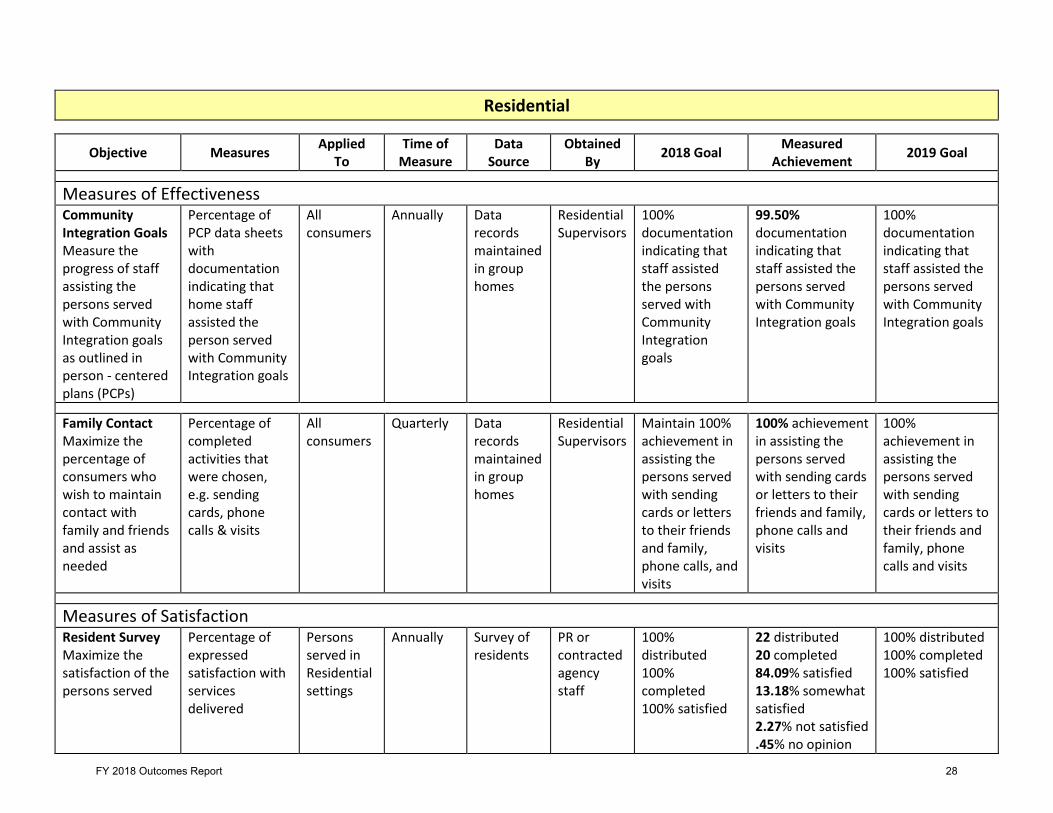
Measures of Effectiveness Community Integration Goals Measure the progress of staff assisting the persons served with Community Integration goals as outlined in person - centered plans (PCPs)
Percentage of PCP data sheets with documentation indicating that home staff assisted the person served with Community Integration goals
All consumers
Annually Data records maintained in group homes
Residential Supervisors
100% documentation indicating that staff assisted the persons served with Community Integration goals
99.50% documentation indicating that staff assisted the persons served with Community Integration goals
100% documentation indicating that staff assisted the persons served with Community Integration goals
Family Contact Maximize the percentage of consumers who wish to maintain contact with family and friends and assist as needed
Percentage of completed activities that were chosen, e.g. sending cards, phone calls & visits
All consumers
Quarterly Data records maintained in group homes
Residential Supervisors
Maintain 100% achievement in assisting the persons served with sending cards or letters to their friends and family, phone calls, and visits
100% achievement in assisting the persons served with sending cards or letters to their friends and family, phone calls and visits
100% achievement in assisting the persons served with sending cards or letters to their friends and family, phone calls and visits
Measures of Satisfaction Resident Survey Maximize the satisfaction of the persons served
Percentage of expressed satisfaction with services delivered
Persons served in Residential settings
Annually Survey of residents
PR or contracted agency staff
100% distributed 100% completed 100% satisfied
22 distributed 20 completed 84.09% satisfied 13.18% somewhat satisfied 2.27% not satisfied .45% no opinion
100% distributed 100% completed 100% satisfied
FY 2018 Outcomes Report 28
Residential
Objective Measures Applied To
Time of Measure
Data Source
Obtained By 2017 Goal Measured
Achievement 2018 Goal
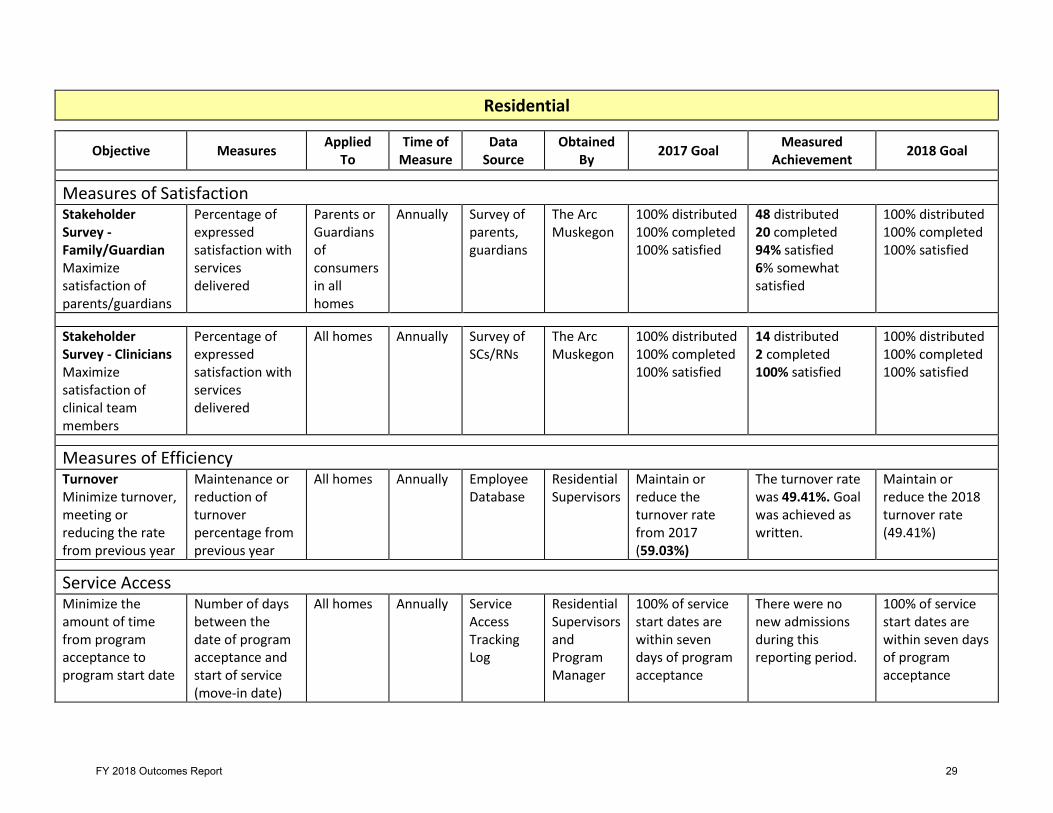
Measures of Satisfaction Stakeholder Survey - Family/Guardian Maximize satisfaction of parents/guardians
Percentage of expressed satisfaction with services delivered
Parents or Guardians of consumers in all homes
Annually Survey of parents, guardians
The Arc Muskegon
100% distributed 100% completed 100% satisfied
48 distributed 20 completed 94% satisfied 6% somewhat satisfied
100% distributed 100% completed 100% satisfied
Stakeholder Survey - Clinicians Maximize satisfaction of clinical team members
Percentage of expressed satisfaction with services delivered
All homes Annually Survey of SCs/RNs
The Arc Muskegon
100% distributed 100% completed 100% satisfied
14 distributed 2 completed 100% satisfied
100% distributed 100% completed 100% satisfied
Measures of Efficiency Turnover Minimize turnover, meeting or reducing the rate from previous year
Maintenance or reduction of turnover percentage from previous year
All homes Annually Employee Database
Residential Supervisors
Maintain or reduce the turnover rate from 2017 (59.03%)
The turnover rate was 49.41%. Goal was achieved as written.
Maintain or reduce the 2018 turnover rate (49.41%)
Service Access Minimize the amount of time from program acceptance to program start date
Number of days between the date of program acceptance and start of service (move-in date)
All homes Annually Service Access Tracking Log
Residential Supervisors and Program Manager
100% of service start dates are within seven days of program acceptance
There were no new admissions during this reporting period.
100% of service start dates are within seven days of program acceptance
FY 2018 Outcomes Report 29

Transportation
Objective Measures Applied To Time of Measure
Data Source Obtained By 2018 Goal Measured
Achievement 2019 Goal
Measure of Satisfaction Passenger Satisfaction Survey
Percentage of passengers who express satisfaction with services delivered
Persons served on Pioneer Resources buses
Annually Survey of Passengers
Transportation Director or Designee
N/A N/A 100% satisfaction with the services provided by Pioneer Resources staff
Measures of Efficiency Avoid Overtime for Full Time Staff
Maintenance or reduction of overtime percentage from previous year
Transportation Department
Annually Financial Statements
Transportation Director or Designee
Baseline – total amount of overtime used by full time staff in 2018
N/A Maintain or reduce the 2018 amount of overtime used by full time staff
Route Review All Routes Monthly Routematch Transportation Director or Designee
Baseline – 2018 Routes efficient for mileage & time
N/A Maintain efficient routes
Measures of Effectiveness Keep Vehicle Accidents at a Minimum
Reduction in the number of accidents from previous year
All Transportation vehicles
Annually Accident Reports
Transportation Director or Designee
Baseline – total number of accidents that occurred in 2018
N/A Reduce the 2018 number of accidents that occurred in vehicles
Staff Training Number of trainings completed versus number of required trainings
All Transportation Staff
Annually Staff training records
Transportation Director or Designee
Baseline – 2018 total number of completed trainings versus number of required training
N/A 100% staff completion of required training
FY 2018 Outcomes Report 30

Vocational Services Skill Building Program
Objective Measures Applied To Time of Measure
Data Source Obtained By 2018 Goal Measured
Achievement 2019 Goal
Measure of Satisfaction Stakeholder Survey – Skill Building Program Participants Maximize the number of consumers who express satisfaction with the services they receive from PR
Percentage of people who express satisfaction with services being delivered
All participants
Semi - Annual
Conduct written surveys and focus groups mid-year and end or year.
Program Manager + one other recorder
By end of year 97% of those surveyed will express that their experience is positive.
91% of those surveyed agreed while 9% somewhat agreed that they were satisfied with the services they receive from PR.
By end of year 97% of those surveyed will express that their experience is positive.
Stakeholder Survey – Clinicians Maximize the number of professionals making referrals who express satisfaction with progress on participant goals.
Percentage of supports coordinators and others who express satisfaction with progress on individual PCP goals
HW supports coordinators, Contract Managers and other Clinicians
Annually Electronic Survey
Program Manager
90% of professional staff express their satisfaction with the progress achieved against PCP goals
50% of those respondents expressed satisfaction on progress toward goals while 50% had no opinion
90% of professional staff expressed their satisfaction with the progress achieved against PCP goals.
Parent/Guardian Survey – Skill Building Program Participants Maximize the number of stakeholders who express satisfaction with communication they receive from PR
Percentage of people who express satisfaction with communication
All parents and guardian representative of participants
Semi - Annual
Conduct written surveys and focus groups mid-year and end of year
Program Manager + one other recorder
90% of those surveyed will express satisfaction in the volume and quality of communication received
A parent survey was not completed to measure satisfaction in this area.
90% of those surveyed will express satisfaction in the volume and quality of communication received.
FY 2018 Outcomes Report 31
Skill Building Program
Objective Measures Applied To Time of Measure Data Source Obtained
By 2018 Goal Measured Achievement 2019 Goal
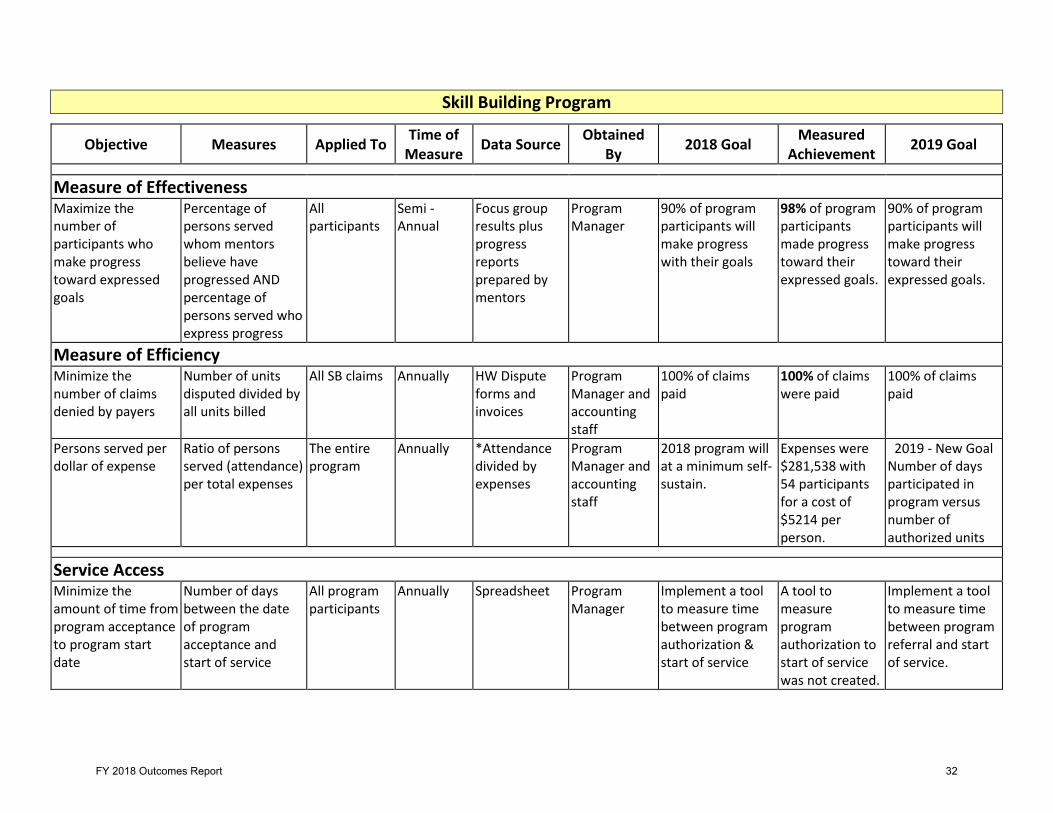
Measure of Effectiveness Maximize the number of participants who make progress toward expressed goals
Percentage of persons served whom mentors believe have progressed AND percentage of persons served who express progress
All participants
Semi - Annual
Focus group results plus progress reports prepared by mentors
Program Manager
90% of program participants will make progress with their goals
98% of program participants made progress toward their expressed goals.
90% of program participants will make progress toward their expressed goals.
Measure of Efficiency Minimize the number of claims denied by payers
Number of units disputed divided by all units billed
All SB claims Annually HW Dispute forms and invoices
Program Manager and accounting staff
100% of claims paid
100% of claims were paid
100% of claims paid
Persons served per dollar of expense
Ratio of persons served (attendance) per total expenses
The entire program
Annually *Attendance divided by expenses
Program Manager and accounting staff
2018 program will at a minimum self-sustain.
Expenses were $281,538 with 54 participants for a cost of $5214 per person.
2019 - New Goal Number of days participated in program versus number of authorized units
Service Access Minimize the amount of time from program acceptance to program start date
Number of days between the date of program acceptance and start of service
All program participants
Annually Spreadsheet Program Manager
Implement a tool to measure time between program authorization & start of service
A tool to measure program authorization to start of service was not created.
Implement a tool to measure time between program referral and start of service.
FY 2018 Outcomes Report 32

Vocational Training
Objective Measures Applied To Time of Measure
Data Source
Obtained By 2018 Goal Measured
Achievement 2019 Goal
Measure of Satisfaction Stakeholder Survey – Employment Services Program Participants Maximize the number of consumers who express satisfaction with the employment services they receive from PR
Percentage of people who express satisfaction with services being delivered
All participants Annual Conduct written surveys end of year.
Program Manager + one other recorder
80% of those surveyed will express that their experience is positive.
100% of respondents surveyed expressed satisfaction and choice with the services provided.
80% of those surveyed will express satisfaction in the services they are receiving.
Stakeholder Survey – Clinicians Maximize the number of professionals making referrals who express satisfaction with services provided
Percentage of supports coordinators and others who express satisfaction
MRS Counselors, Managers and other clinicians
Annually Electronic Survey
Program Manager
90% of professional staff express their satisfaction with the program and staff.
The clinician survey provided only included Skill Building and not Vocational Training.
90% of Counselors and Clinicians express their satisfaction with the program and staff.
FY 2018 Outcomes Report 33

Vocational Training
Objective Measures Applied To Time of Measure
Data Source
Obtained By 2018 Goal Measured
Achievement 2019 Goal
Measure of Effectiveness Maximize the number of participants who are enrolled in Employment Services
Physical count of individuals enrolled in services throughout 2018
All participants Annual Enrollment numbers
Program Manager
Obtain a ratio of 25% enrolled in Employment Services vs total in Skill Building Services
The ratio of those enrolled in Employment Services vs Skill Building was 92%.
Transition 25% of Skill Building participants to Vocational Training.
Program Diversity Expand the Variety of Programs Available to Participants
Number of new programs and participation in new programs
All participants Annual New programs enacted and number of individuals involved
Program Manager + 1 Recorder
Minimum 2 new programs will be enacted with at least 85% capacity of participation
2 news programs were enacted with 94% capacity of participation.
Minimum 2 new programs will be enacted with at least 85% capacity of participation.
FY 2018 Outcomes Report 34

Incident Reports and Complaints - All Programs
Objective Measures Applied To Time of Measure
Data Source
Obtained By 2018 Goal Measured
Achievement 2019 Goal
Measures of Effectiveness Complaints Received By Pioneer Resources
Review and analyze for trends
All programs
Annually Database- By category
Program Managers and Supervisors
Review incident reports based on category and site and look for trends
No complaints were received by PR
Review complaints based on category and site and look for trends
Incident Reports
Monitor an Incident Report database and analyze information for trends
All homes Annually Database- By category
Program Managers and Supervisors
Review incident reports based on category and site. Compare 2018 and 2017 data. Look for trends. Share analysis with Executive Director, Board of Directors and PR staff.
See Narrative Review incident reports based on category and site. Compare 2019 and 2018 data. Look for trends. Share analysis with Executive Director, Board of Directors and PR staff.
Recipient Rights Complaints
Monitor a Recipient Rights database and analyze information for trends
All homes Annually Database- with information broken into categories
Program Managers and Supervisors
Review complaints based on category and site. Compare 2018 and 2017 data. Look for trends and take action as warranted Share analysis with Executive Director, Board of Directors and PR staff
See Narrative Review complaints based on category and site. Compare 2019 and 2018 data. Look for trends and take action as warranted. Share analysis with Executive Director, Board of Directors and PR staff
FY 2018 Outcomes Report 35

Incident Report Review
FY 2018 Outcomes Report 36
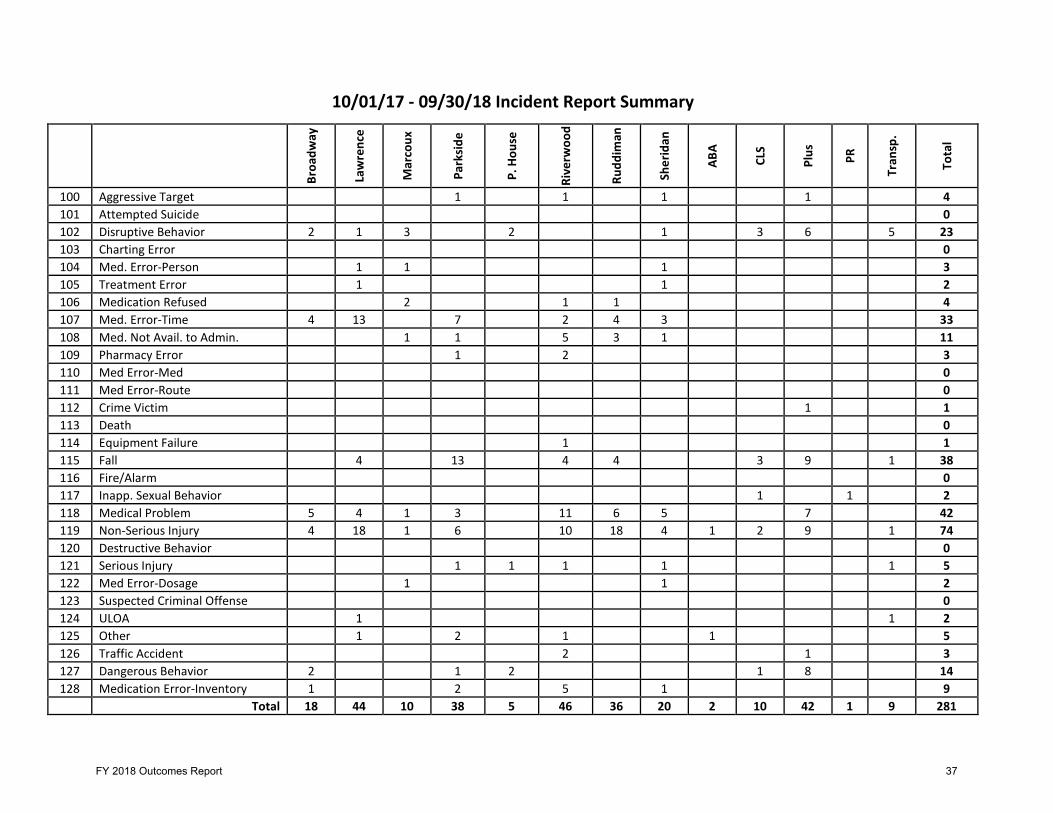
10/01/17 - 09/30/18 Incident Report Summary
Broa
dway
Law
renc
e
Mar
coux
Park
side
P. H
ouse
Rive
rwoo
d
Rudd
iman
Sher
idan
ABA
CLS
Plus
PR
Tran
sp.
Tota
l
100 Aggressive Target 1 1 1 1 4 101 Attempted Suicide 0 102 Disruptive Behavior 2 1 3 2 1 3 6 5 23 103 Charting Error 0 104 Med. Error-Person 1 1 1 3 105 Treatment Error 1 1 2 106 Medication Refused 2 1 1 4 107 Med. Error-Time 4 13 7 2 4 3 33 108 Med. Not Avail. to Admin. 1 1 5 3 1 11 109 Pharmacy Error 1 2 3 110 Med Error-Med 0 111 Med Error-Route 0 112 Crime Victim 1 1 113 Death 0 114 Equipment Failure 1 1 115 Fall 4 13 4 4 3 9 1 38 116 Fire/Alarm 0 117 Inapp. Sexual Behavior 1 1 2 118 Medical Problem 5 4 1 3 11 6 5 7 42 119 Non-Serious Injury 4 18 1 6 10 18 4 1 2 9 1 74 120 Destructive Behavior 0 121 Serious Injury 1 1 1 1 1 5 122 Med Error-Dosage 1 1 2 123 Suspected Criminal Offense 0 124 ULOA 1 1 2 125 Other 1 2 1 1 5 126 Traffic Accident 2 1 3 127 Dangerous Behavior 2 1 2 1 8 14 128 Medication Error-Inventory 1 2 5 1 9
Total 18 44 10 38 5 46 36 20 2 10 42 1 9 281
FY 2018 Outcomes Report 37
Recipient Rights
Complaint Review
FY 2018 Outcomes Report 38

10/01/17 – 09/30/18 Recipient Rights Complaints
Investigations Summary
Co
de
Cat
ego
ry
Gre
tch
ens
Pla
ce
Law
ren
ce
Par
ksid
e
Pio
nee
r P
lus
Co
mm
. Liv
. Su
pp
ort
s
Riv
erw
oo
d
Sher
idan
7400, 7520 Restraint, Failure to Report X
72271 Neglect Class III X
7420 Seclusion X
7223 Abuse Class III X
72271 Neglect Class III X
72271 Neglect Class III X
7080 Services Suited to Condition/Medication X
7481 Disclosure of Confidential Information X
72271 Neglect Class III X
Complaint Summaries
Department: Lawrence
Date: 08/30/18
Code: 7400 and 7520
Category: Restraint and Failure to Report
Summary
Allegation: Staff #1 put a sheet around Resident #1 and tied it around the back of her wheelchair. Staff #1 apparently did this to keep Resident #1 from putting her hands in her mouth.
Outcome: Substantiated Not Substantiated
Department: Parkside
Date: 01/07/18
Code: 72271
Category: Neglect Class III
Summary
Allegation: Resident #1 was left in bed all of 1st shift, and did not receive brief checks
and changes. Resident #2 was told he could not get up when he wanted to. Resident
#2 hit his head on the wall and neither Staff #1 nor Staff #2 followed the proper head
injury protocol. Staff #1 was sleeping while on duty and did not complete her duties.
Outcome: Substantiated Substantiated
FY 2018 Outcomes Report 39
10/01/17 – 09/30/18 Recipient Rights Complaints
Investigations Summary
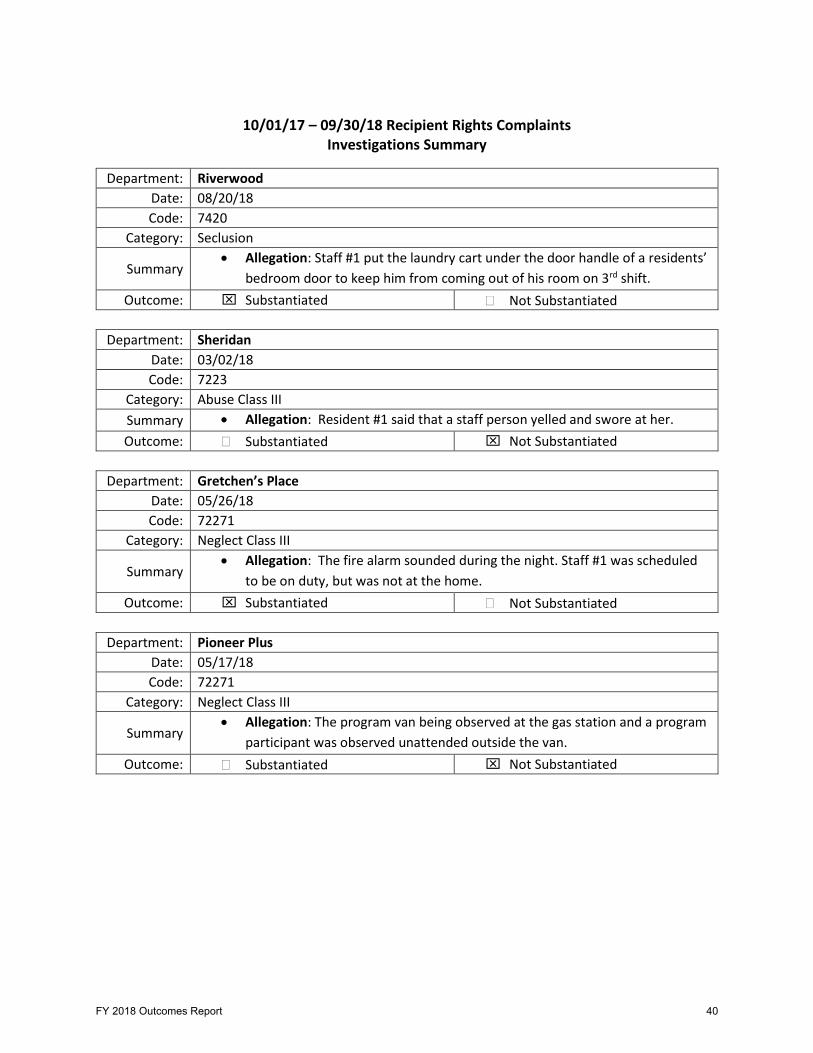
Department: Riverwood
Date: 08/20/18
Code: 7420
Category: Seclusion
Summary Allegation: Staff #1 put the laundry cart under the door handle of a residents’
bedroom door to keep him from coming out of his room on 3rd shift.
Outcome: Substantiated Not Substantiated
Department: Sheridan
Date: 03/02/18
Code: 7223
Category: Abuse Class III
Summary Allegation: Resident #1 said that a staff person yelled and swore at her.
Outcome: Substantiated Not Substantiated
Department: Gretchen’s Place
Date: 05/26/18
Code: 72271
Category: Neglect Class III
Summary Allegation: The fire alarm sounded during the night. Staff #1 was scheduled
to be on duty, but was not at the home.
Outcome: Substantiated Not Substantiated
Department: Pioneer Plus
Date: 05/17/18
Code: 72271
Category: Neglect Class III
Summary Allegation: The program van being observed at the gas station and a program
participant was observed unattended outside the van.
Outcome: Substantiated Not Substantiated
FY 2018 Outcomes Report 40

10/01/17 – 09/30/18 Recipient Rights Complaints
Investigations Summary
Department: Pioneer Plus
Date: 10/04/17
Code: 7080
Category: Services Suited to Condition/Medication
Summary Allegation: Staff #1 did not administer medications properly and then
falsified the medication administration sheets.
Outcome: Substantiated Not Substantiated
Department: Community Living Supports
Date: 07/10/18
Code: 7481
Category: Disclosure of Confidential Information
Summary
Allegation: A program participant said the CLS staff person would bring her
family or friends with her every time she was scheduled to provide CLS
services for him.
Outcome: Substantiated Not Substantiated
Department: Community Living Supports
Date: 05/22/18
Code: 72271
Category: Neglect Class III
Summary
Allegation: Staff #1 left a program participant unattended, and during that
time the person engaged in appropriate behavior that ended up with him
being arrested.
Outcome: Substantiated Not Substantiated
FY 2018 Outcomes Report 41

Complaint Category Comparisons
0112 Crime Victim • 2018 – zero• 2017 - zero• 2016 – zero• 2015 – one• 2014 – zero
7281 Possession and Use • 2018 – zero• 2017 - zero• 2016 – zero• 2015 – one• 2014 – zero
72221 Abuse Class II, Non-Accidental Act
• 2018 – zero• 2017 - zero• 2016 – one• 2015 – two• 2014 – one
1708 Dignity and Respect • 2018 - zero• 2017 – zero• 2016 – three• 2015 – zero• 2014 - zero
7400 Restraint • 2018 - one• 2017 – zero• 2016 – zero• 2015 – zero• 2014 - zero
72222 Abuse Class II, Unreasonable Force
• 2018 – zero• 2017 - zero• 2016 – one• 2015 – zero• 2014 – zero
7080 Services Suited to Condition
• 2018 - one• 2017 - two• 2016 – three• 2015 – one• 2014 – three
7420 Seclusion • 2018 - one• 2017 – zero• 2016 – zero• 2015 – zero• 2014 - zero
72261 Neglect II • 2018 – zero• 2017 - two• 2016 – one• 2015 – zero• 2014 – zero
7081 Safety • 2018 - zero• 2017 - zero• 2016 – one• 2015 – zero• 2014 – zero
7481 Disclosure of Confidential Information
• 2018 - one• 2017 – zero• 2016 – zero• 2015 – zero• 2014 - zero
72262 Neglect II, Failure to Report
• 2018 – zero• 2017 - one• 2016 – two• 2015 – zero• 2014 – zero
7082 Humane Environment • 2018 - zero• 2017 - one• 2016 – two• 2015 – one• 2014 – two
7520 Failure to Report • 2018 – one• 2017 – one• 2016 – two• 2015 – zero• 2014 – zero
72271 Neglect Class III • 2018 – four• 2017 - two• 2016 – two• 2015 - two• 2014 – three
7223 Abuse Class III • 2018 - one• 2017 - zero• 2016 – one• 2015 – zero• 2014 – zero
7545 Retaliation/Harassment • 2018 – zero• 2017 – one• 2016 – zero• 2015 – zero• 2014 – zero
____ Failure to Follow CMHS Medication Passing Procedures
• 2018 – zero• 2017 - zero• 2016 – zero• 2015 – zero• 2014 – one
Each complaint is reviewed by program supervisors/managers, and corrective action is taken with responsible staff for substantiated allegations. Ideas to help avoid future incidents are discussed, and may include retraining in areas such as staff responsibilities, recipient rights, gentle teaching practices, behavioral supports plans and professional behavior in the workplace.
FY 2018 Outcomes Report 42

Narratives and Analysis
FY 2018 Outcomes Report 43

Pioneer Resources Applied Behavior Analysis
ABA Program 2018 Narrative and Analysis of Outcomes
Measure of Satisfaction Participant Survey For our first year of outcomes, the ABA program set a goal of 100 percent returned and satisfied respondents to our satisfaction survey. A total of 20 satisfaction surveys were sent out to consumer families of the ABA program. 16 (80 percent) were returned and 100 percent of those agreed they were satisfied with services of the program. Additionally, all respondents agreed that families were able to communicate easily with clinicians. They also agreed their child was making progress and felt informed regarding treatment plans. One respondent disagreed regarding being kept informed regarding schedule changes. All respondents stated they would recommend the center to other families. With regard to scheduling communication, it is important to note many last minute changes occur regularly. Variables that can affect last minute scheduling changes include staff call-ins, necessary productivity rates, consumer cancels and weather. Presently, scheduling changes are communicated one week in advance to families utilizing their preferred method. Communication of schedule is either given by email, text or paper copies depending on the family’s choice. Last minute changes are also communicated by these methods as soon as the changes occur. Suggested Improvement Comments included: “Communication with parents” “Maybe a little more communication between the school, ABA Center and the family” Currently, clinicians meet face to face with parents each time an assessment is completed which is a minimum of every 6 months as well as when treatment plans are updated (as needed)and are present at a minimum of 10 percent of weekly therapy services. Minimally, a clinician is communicating weekly with parents. Each treatment plan and child’s progress dictates the necessary frequency of communication above these standard intervals. Clinicians, program supervisor and program manager communicate with families based on family preference as well as clinical necessity. Other comments included: “GREAT JOB FOLKS” “Love all the staff, because they really care and love my grandson” “Love the workers” “We seem to be on tract/wonderful services & clinicians, So glad I found ABA Therapy. My son has made huge improvements” “Love our techs”
FY 2018 Outcomes Report 44

Stakeholder Survey - Clinicians A total of nine surveys were distributed and four (44.44%) were returned. Of these returned surveys, 100% of respondents were satisfied with the ABA staff in regards to communication, knowledge, participant treatment, documentation and goals and meeting the needs of the participants. 33.3% of respondents had no opinion on staff being involved in the person centered planning process or assisting participants in this process. It should be noted that one of the four respondents does not have a participant being served in the ABA program. Other factors that may have contributed to the no opinion response is in regards to the ABA process. ABA clinicians complete an additional assessment after the person centered plan is completed which only identifies that ABA services will be pursued. The individual assessment completed by clinicians determines the specific goals and outcomes that ABA participants will work towards. We will look at modifying questions number 6 and 7 in the coming year to address the assessment process for the participants in this program. This will be a more accurate measure of determining ABA staff involvement in the development of treatment goals and objectives. Measure of Effectiveness During this past fiscal year, Pioneer Resources ABA Center provided services to 39 youth from ages 2 years to 19 years old. We provided services to youth in both Muskegon and Ottawa County with a total of 30 being served in Muskegon and 9 in Ottawa County. Our measure of effectiveness was determined based on progress of the youth served. For this first year, we chose to measure the percentage of participants meeting at least 60 percent of their skill acquisition objectives. Our goal was 80 percent and our data indicates that 77 percent of our participants were successful. In analyzing this data more closely, it should be noted that the older youth or the youth that are 11 years and older make up the majority of the youth that did not hit the 60 percent success rate with regard to skill acquisition. These kids still made progress but at a lower percentage. These youth more frequently exhibited significant behavior challenges that inhibit progress to a larger degree such as significant physical aggression, property destruction and self-regulation struggles. The younger youth that did not meet this goal showed a trend of either being placed on hold or leaving the program before significant progress could be made. Additionally, when analyzing this data, we did not account for the period of time called “pairing” with the technicians. This is a time period where no demands are placed on a youth as it is clinically necessary for each technician working with a particular youth to develop a positive relationship with which to start therapy. These pairing times vary between youth and are determined based on clinical observations during sessions. We recognize that this pairing time may have also played a role in the percentage outcomes.
FY 2018 Outcomes Report 45
With the above factors in mind, we have determined to continue with the same goal for the coming year. Measure of Efficiency To begin, the ABA Center set a goal that 90 percent of consumers would start services no more than 15 working days from the date of referral. Starting services is defined by this program as either the initial “meet and greet” or the first assessment completed by the clinician. It should be noted that contact with referred consumers happens within the first week and usually consists of an introduction and setting up the first appointment. 34 consumers (87 percent) achieved this standard while 5 consumers began services after this target. Variables that affect this time frame include family cancellations, family no-shows, staff call-ins and weather. Another variable that played a role in this percentage is related to the new status of the program. Consumers were being referred at a higher rate in the beginning of the year in order to bring the program up to capacity. During that time clinician, calendars were challenged with multiple assessment and treatment plan occurrences. As program continues to increase capacity at a controlled pace, it is probable this goal will be met in the coming year.
FY 2018 Outcomes Report 46

Pioneer Resources Community Living Supports
Community Connections 2018 Narrative and Analysis of Outcomes
Characteristics
The Individual CLS program served 39 consumers with 2 of them being served in Ottawa County. Unfortunately 4 staff left our agency and with the State wide staffing crisis making it difficult to hire qualified staff, resulted in a decline in the number of participants being served. Currently we have 17 participants receiving Individual CLS in Muskegon County and 1 participant receiving services in Ottawa County. CLS was provided through Aval, Inc. which was an entity of Pioneer Resources. As of 12/15/2018 Aval, Inc. was dissolved and Individual CLS is now provided through Pioneer Resources. There was no interruption in service and our CLS staff choose to stay on as a Pioneer Resources employee, making them eligible for PTO and other benefits when/if they meet the requirements to receive benefits.
The Community Connections (Group CLS) Program served 35 participants in Muskegon County, 21 participants in Ottawa County and a new contract with Oceana County was signed and we serve 1 participant from that county.
Participants have an annual Person Centered Planning meeting and they invite who they want to attend their PCP meeting. Most generally besides their support coordinator and CLS staff they will invite family, friends and employers. Participants identify goals they want to achieve in order to live independently. The support they receive from those invited also helps assure a good PCP is in place and the goals that are identified are achievable. Participants are made aware that they can make changes to their PCP anytime by contacting their supports coordinator.
Community Living Supports provides training and/or teaching to participants. A description of service can be found in the MDHHS Medicaid Provider Manual. Examples of service provided through CLS are, meal preparation, laundry, routine and seasonal and heavy household care and maintenance, activities of daily living such as bathing, eating, dressing, and personal hygiene, shopping for food and other necessities of daily living, money management, socialization and relationship building and attendance at medical appointments. Participants can receive services in their home and/or in the community. Pioneer Resources support staff are very keen to what other needs participants have and will recommend additional services to be authorized and added as an addendum to the participants PCP. Examples of what additional needs may arise are, finding affordable housing, support through a medical issue and assuring Medicaid benefits are in order.
The same is practiced for our Community Connections programs. Participants have an annual Person Centered Plan, but this is a community based program so their goals are focused on community inclusion. Participants arrive at our 1175 E. Wesley site and prepare for the day with staff assistance and then go out into the community. Participants are in the community an average of 70% of the day. We have memberships to Fredrick Meijer Gardens and The Grand Rapids Public Museum which can be used at other museums. Participants volunteer at the Kids Food Basket, Meals on Wheels, VFW and the Muskegon Eagles #668. They attend movies, community activities, go on picnics and bowl.
FY 2018 Outcomes Report 47
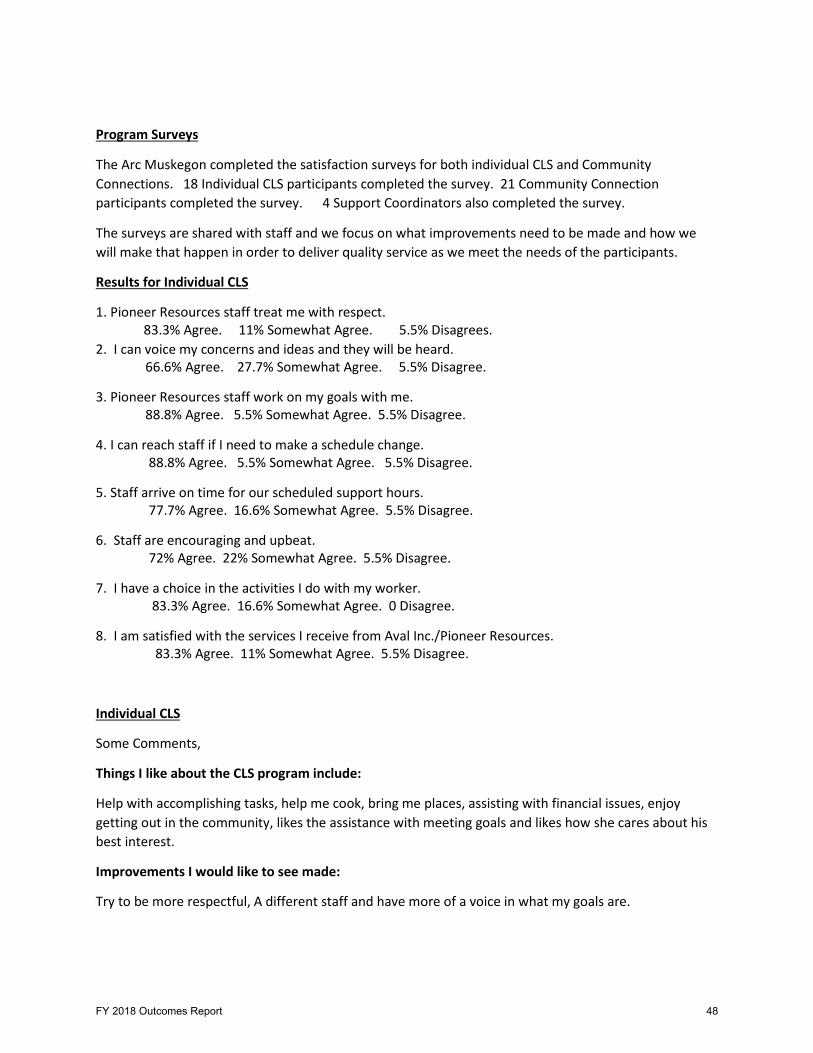
Program Surveys
The Arc Muskegon completed the satisfaction surveys for both individual CLS and Community Connections. 18 Individual CLS participants completed the survey. 21 Community Connection participants completed the survey. 4 Support Coordinators also completed the survey.
The surveys are shared with staff and we focus on what improvements need to be made and how we will make that happen in order to deliver quality service as we meet the needs of the participants.
Results for Individual CLS
1. Pioneer Resources staff treat me with respect. 83.3% Agree. 11% Somewhat Agree. 5.5% Disagrees.
2. I can voice my concerns and ideas and they will be heard. 66.6% Agree. 27.7% Somewhat Agree. 5.5% Disagree.
3. Pioneer Resources staff work on my goals with me. 88.8% Agree. 5.5% Somewhat Agree. 5.5% Disagree.
4. I can reach staff if I need to make a schedule change. 88.8% Agree. 5.5% Somewhat Agree. 5.5% Disagree.
5. Staff arrive on time for our scheduled support hours. 77.7% Agree. 16.6% Somewhat Agree. 5.5% Disagree.
6. Staff are encouraging and upbeat. 72% Agree. 22% Somewhat Agree. 5.5% Disagree.
7. I have a choice in the activities I do with my worker. 83.3% Agree. 16.6% Somewhat Agree. 0 Disagree.
8. I am satisfied with the services I receive from Aval Inc./Pioneer Resources. 83.3% Agree. 11% Somewhat Agree. 5.5% Disagree.
Individual CLS
Some Comments,
Things I like about the CLS program include:
Help with accomplishing tasks, help me cook, bring me places, assisting with financial issues, enjoy getting out in the community, likes the assistance with meeting goals and likes how she cares about his best interest.
Improvements I would like to see made:
Try to be more respectful, A different staff and have more of a voice in what my goals are.
FY 2018 Outcomes Report 48

Results for Community Connections
1. Pioneer Resources staff treats me with respect. 95% Agree. 5% Somewhat Agree. 0 Disagree.
2. I can voice my concerns and ideas and they will be heard. 81% Agree. 14% Somewhat Agree. 5% Disagree.
3. I know who I can voice my concerns to. 95% Agree. 0 Somewhat Agree. 0 Disagree. 5% had no opinion.
4. Pioneer Resources staff help me as needed. 85% Agree. 5% Somewhat Agree. 5% Disagree. 5% had no opinion.
5. I have a choice in the community activities in which I participate.
38% Agree. 38% Somewhat Agree. 10% Disagree. 14% had no opinion.
6. I am satisfied with the services I receive from Pioneer Resources. 90% Agree. 10% Somewhat Agree. 0 Disagree.
Some Comments, Things I like about the Community Connection Program: The outings into the community, I love the program, really enjoy being around other people, likes going to places and taco day. Improvements I would like to see made: More patience with the participant. Feel there was some dishonesty amongst staff members at the beginning, but it’s getting better. Hire people who are physically strong enough to handle the clients, less staff turnover, better qualified staff. Participant has been coming home in a soaked brief. One occurrence of participant coming home in no brief. Support Coordinator’s results for Community Connections:
1. Do you have a consumer receiving services through Pioneer Resources Community Connections program? 75% Yes. 25% No.
2. Pioneer Resources Community Connections staff are professional in interactions with Healthwest staff and clinicians. 50% Agree. 50% Disagree
FY 2018 Outcomes Report 49
3. Pioneer Resources Community Connections program staff, coordinators or manager are available to answer questions in a timely manner. 50% Agree. 50% had no opinion.
4. Pioneer Resources Community Connections program staff treats participants with dignity and respect and offers opportunities for choice. 50% Agree. 50% had no opinion.
5. Pioneer Resources Community Connections program documentation on goals and outcomes is effective. 50% Agree. 50% had no opinion.
6. Pioneer Resources Community Connections program staff are involved in the person centered planning process when requested. 100% Agree.
7. Pioneer Resources Community Connections program assist participants in working toward their person centered goals. 50% Agree. 50% had no opinion.
8. Pioneer Resources Community Connections program meets my participants program needs. 50% Agree. 50% had no opinion.
9. Pioneer Resources Community Connections program meets my participant’s personal care needs. 50% Agree. 50% had no opinion.
Measure of Effectiveness
Participant’s progress is tracked through the Groveware data base. Staff complete a service log report each time they provide service to a participant. Part of the information collected on the service log is a narrative of the goal that was worked on and how well the participant did working on their goals. The participant may have independently completed the goal or partially completed the goal with assistance. This past year a committee worked on ways to be more accurate in collecting data in Groveware, this is an ongoing process as we continue to meet the needs of our consumers and provide the documentation required by Medicaid. Measure of Efficiency
Participant’s service logs are compared to staff’s Paycom punches weekly. This assures that all service logs have been received and current authorizations are in place. The programs are billed monthly and we also track efficiency’s by paid billings. If a claim has been denied we are notified and we complete an investigation as to why it was denied and will complete a dispute form with our findings and return it requesting payment. Another measure of efficiency is that staff are asked to work out a schedule with their participants and keep it consistent while giving the participant choice to when they receive services.
FY 2018 Outcomes Report 50

New Goals for 2019 Individual CLS
• Work with HealthWest staff to create a training for CLS staff on providing accurate documentation based on the consumer’s goals identified in their Person-Centered Plan.
• Develop educational group CLS activities that will be authorized separately from their 1:1 goals identified in their Person-Centered Plan.
Community Connections – Muskegon
• Restructure how services are provided to participants by defining the goals and needs of participants served. Example: If a participant wants to go to a volunteer site with a group that they are not usually assigned to, then we will work with them to be able to spend the day with that group.
• Utilize the “home living room” to participants by assigning a staff member to that room. This way participants can have even more choice in activities and staff can better serve participants if each room has smaller group sizes. This will also encourage program growth as a whole.
Community Connections – Ottawa
• Increase the number of participants served by 50% by attending conferences an meetings offered by CMH and other agencies that advocate for people with developmental disabilities and attend provider fairs.
• Increase the number of volunteer sites to 5 (currently have 3) by building relationships with members of the community and increasing awareness of people with developmental disabilities.
Leisure and Recreation Club – Muskegon (LARC)
• Bring in new members by attending Accessibility Expos and reaching to other community resources.
• Increase pop-up events by 20%. • Create a new membership orientation. Orientation will be within one month of becoming a
member. Leisure and Recreation Club – Ottawa (LARC)
• Increase Fridays at Compassionate Heart Ministries to 3 times a month. • Bring in new members by attending Accessibility Expos and reaching to other community
resources. • Create a new membership orientation. Orientation will be within one month of becoming a
member.
FY 2018 Outcomes Report 51

Pioneer Resources Residential Services
2018 Narrative and Analysis of Outcomes
Residential Year in Review 2018 brought several major changes to the residential department, including:
Mill Iron – New Home Our long anticipated new group home on Mill Iron was completed in August 2018. The home became licensed by the state in late September, and the ladies who previously lived at the Broadway Home moved in on October 01, 2018. Everyone seems to enjoy their new living space, especially since each person has her own bedroom!
Broadway Home – New Program The Broadway Home has received a much needed “makeover”, with new windows, flooring, kitchen cabinets, roof, siding and an attached garage. We are now partnering with LifeCircles Pace to provide housing for seniors with symptoms of dementia. Our staff are hired and trained, and we’re ready for the first people to move in, hopefully by the end of February 2019. Cindy Morden, the Riverwood and Parkside residential supervisor has stepped down from Parkside and has taken on the new Broadway program. We are excited about this new adventure!
Parkside Home - New Supervisor With Cindy Morden transferring to the Broadway Home, we were then in need of a new supervisor for Parkside. We were lucky to have several good internal candidates, and ultimately the position was offered to, and accepted by Donna Mosley. Donna started working at the Riverwood Home as a residential support staff in 1996, and she took on the added responsibilities of Home Assistant for several years. Donna then worked as a Mentor in the Community Connections program, and she took on the residential supervisor position at Parkside in October 2018.
Marcoux – New Program On October 01, 2018 Marcoux changed from a licensed, specialized group home to a non-licensed transitional living environment. The ladies who currently live at Marcoux are now working on skills needed to succeed in a more independent environment. It is our hope that the program participants are ultimately able to move into their own house or apartment. Staff are scheduled to help each person work on their individualized goals, which may include learning to ride public transportation, budgeting, shopping, cooking, cleaning, and safety skills. There are no longer staff working during 3rd shift. If one of the ladies is in need of assistance during the night, they are able to contact our on call staff via an Echo Show and talk face to face. A stove alarm was installed that will send an alert to the on call cell phone if the stovetop or oven is left on too long. A microwave that can sit on the counter was purchased because one of the ladies is unable to reach the microwave above the stove. Also purchased to help teach skills is a Pizza Pizzazz, air fryer, and panni maker.
Gretchen’s Place – New Management As of October 2018, Gretchen’s Place is now under the umbrella of “Residential Services”. Chris Pickel has taken on supervising Gretchen’s Place as well as Marcoux. We are in the process of legally dissolving the “Aval” corporation, and staff who work CLS hours are now paid by Pioneer Resources, while staff providing personal care hours (DHS chore services) are now paid by “Elite” an outside company.
FY 2018 Outcomes Report 52
Participant Characteristics
In 2018 we served a total of 52 people in our licensed group homes. There was no turnover of persons served in residential during this reporting period. Starting 2019 we will include the people who live at Gretchen’s Place in our participant characteristics information. The majority of the people we serve are between the ages of “46-65”, female, Caucasian, need ambulation assistance, and have a primary diagnosis of “developmental disability”. These characteristics vary little from year to year and this is primarily because of long-term residency. Measures of Effectiveness
Community Integration Goal Each person served by Pioneer Resources in a residential setting has set goals for themselves. These goals may include community integration, learning a new skill, spending time with friends and family, taking a vacation and participating in preferred leisure activities. Pioneer Resources residential staff assists each person served in developing and implementing their person-centered plan. To help measure our effectiveness is assisting each person we monitor the data documented by home staff which indicates that each goal was worked on as required with the person served. The 2018 goal was 100% staff documentation for each person’s goals. A compliance percentage of 99.50% was achieved. The 2019 goal is 100% documentation indicating that staff assisted the persons served with Community Integration goals. Family and Friends Contact
Both the people we serve and their family & friends seem to value keeping in contact with one another, and we believe that consistent contact with family and friends is very important. Pioneer Resources residential staff help make sure contact occurs in various ways, including assistance with making or receiving telephone calls, helping the persons served send cards and letters, and assisting with transportation for visits. To help measure our effectiveness in assisting the people we serve with family contact we document each instance of calls, visits and written correspondence, and compare that data to each person’s goal. The 2018 goals was 100% compliance in assisting the persons served with phone calls, visits and/or sending cards or letters to family and friends. A compliance percentage of 100% was achieved. The 2019 goal is to maintain 100% compliance in assisting the persons served with phone calls, visits and sending cards or letters to family and friends.
FY 2018 Outcomes Report 53
Measures of Satisfaction
We strive to provide the highest level of care to the people we support, and are always looking for ways to improve our services. One of the ways we gather information is by asking our stakeholders for their opinion on what we do well, areas of need and ideas for improvement. Residential Survey
We enlisted the assistance of The Arc to complete satisfaction surveys with a sampling of the people we serve. Surveys were completed face to face in the homes and the result were:
• 22 distributed • 20 completed • 84.09% satisfied • 13.18% somewhat satisfied • 2.27% not satisfied • .45% no opinion
The persons served in residential had many positive things to say regarding what they like about where they live, including:
• Cooking in the kitchen, improvements to the home are appreciated, like the activities at my house, I mostly get along with the roommates, I like the way our house manager conducts business with us, having some independence, the food is really good, going out for activities, all the people/friends/staff, like the 1:1 time with the staff, I like my bedroom, I like having some privacy, I like the staff, I like doing exercises and practicing with my walker.
Improvements people would like to see made include:
• To be better informed would be appreciated because we are responsible for overall decisions and some monthly expenses, I can choose when I get up and go to bed - but it has to be in the timeframe of when staff is here, less chores, the carpet needs to go, would like to have access to a bicycle - wants more physical activity, would like to work harder on my goals, would like to see improvements with the staff’s attitudes, want to have snacks when I want snacks, I don’t like (a housemate).
The 2018 goal was for 100% satisfaction with the services provided by Pioneer Resources staff; we achieved an 84.09% satisfaction rating. The 2019 goal is to achieve 100% satisfaction with the services provided by Pioneer Resources staff. Family/Guardian Survey
• 48 distributed • 20 completed • 93.94% satisfied • 6.06% somewhat satisfied
FY 2018 Outcomes Report 54

Responses to the question “what are some of the strengths of this group home and the home staff” included:
• Consistent staffing, it feels like home for (T), friendly, encouraging, clean, they share ideas among each other, good care – one on one staff outings, concern for patient, they seem dedicated to my sister’s care, happiness and well-being, they care about (J), good mix of resident, caring staff, respectful, clean environment, serve balanced meals.
Suggestions for improvements included:
• Nothing I can think of, (J) needs a little prompting to brush her teeth every day - the dentist strongly encourages this, introducing new staff, I can’t say as I’m not there every day – I’m satisfied already, continued vigilance on the part of the care givers that rules are followed by all, it is often difficult to reach someone on the resident phone, please call guardian for non-emergencies at a more appropriate hour (i.e. 10am-8pm).
Additional comments made:
• Question #1 was as “Somewhat” because I am very picky about hair and clothing - I also know that my sister has strong opinions about those also so battles have to be chosen carefully, all my comments relate to the Broadway Home – my sister recently moved to the home on Mill Iron, keep up the good care – thank you!
We appreciate the positive feedback as well as comments suggesting improvements that could be made. The survey results are reviewed by the residential team, shared with home staff, and steps are taken to put suggested improvements into effect. The 2018 goal was for 100% satisfaction with the services provided; a 93.94% satisfaction rating was achieved, with 6.06% of the responses indicating “somewhat satisfied”. The 2019 goal is 100% satisfaction with the services provided. Clinician Survey
• 14 distributed • 2 completed • 100% satisfied
A total of two (2) surveys were completed and returned by supports coordinators. There were no comments. The 2018 goal was 100% satisfaction with the services provided, and this goal was achieved. The 2019 goal is 100% satisfaction with the services provided.
FY 2018 Outcomes Report 55
Measure of Efficiency
Staff Turnover
Staff turnover for 2018 was 49.41%. While this number is still far higher than we want, it is lower than the 2017 rate of 59.03%. , which is 9% higher than in 2016. The 2019 goal is to reduce the turnover rate from 2018 (under 49.42%). Service Access
The 2018 goal was 100% of service start dates are within seven days of program acceptance. There were no new admissions during this reporting period. The 2019 goal is 100% of service start dates are within seven days of program acceptance.
FY 2018 Outcomes Report 56

Pioneer Resources Vocational Services
2018 Narrative and Analysis of Outcomes
The Vocational Services department consists of Skill Building and Vocational Training. Both programs work together as one fluid unit providing different opportunities for skill enhancement or vocational proficiency within the community. In total we served 104 persons in Vocational Services.
Our Skill Building program served 54 individuals this year. Skill Building consists of activities identified in the individual plan of service that support an individual in enhancing their personal, social, and vocational competency to live successfully in the community. They include teaching concepts such as attendance, task completion, problem solving, and safety. This is accomplished through volunteer work, teaching job related skills, career exploration, mobility training and other vocational activities related to employment. The scope of these services and supports are based on the identified needs and desires of the person served. Skill Building participants have goals toward economic self-sufficiency, work, and/or volunteering. Some of the volunteer work they participate with includes Noah’s Project, Nuveen Community Center, Step-Up Boys Home, Meals on Wheels, and the Vikings club. Participants are learning customer service skills, maintenance, organization and sorting, kitchen prep, and most importantly, they are connecting with individuals and developing relationships in the community. During their volunteer work, they are learning concepts and soft skills related to employment. Some of these skills are attitude, teamwork, problem solving, professionalism, communication skills and conflict resolution. At the beginning of the fiscal year Skill Building had one volunteer site and by the end they were actively participating in 17 volunteer sites on a regular basis.
Of the 54 persons served in Skill Building, 12 of those participants were transitioned to Vocational Training to obtain open cases with MRS. Once individuals are open and authorized for Job Placement, Job Coaches can pursue employment with them. Of the 12 participants who transitioned from Skill Building, eight of those participants became employed. Our job seekers have been placed at various small businesses throughout our community. We have strong relationships with Ryke’s Bakery, Boar’s Belly, Northside Pub, Van’s Car Wash, Reliant Cleaning, and Gary’s Restaurant, just to name a few. One of our individuals placed, Anthony Rogers, is employed by Ryke’s Bakery. He originally received part time employment as a dishwasher. After several months of success, he was offered full time employment and no longer receives Social Security Benefits. That is a true success story.
Vocational Training served 50 people. Individuals have been served through Job Placement, Job Readiness Classes, Job Coaching, ServSafe Food Handler Training, Food for Thought, Custodial Work Crew and Social Skill Development.
Measure of Satisfaction
The Arc surveyed Skill Building and Vocational Training Participants on their level of program satisfaction. 11 participants’ information was provided for the Vocational Training survey. Of those, only nine participants were reached, and five participants provided responded. The survey indicated that 100% of those surveyed felt that Pioneer Resources staff treated them with respect, supported them as needed, and provided choice and support while they applied for jobs. Additionally, 100% agreed that their quality of life improved since beginning the program and that they were satisfied with the service
FY 2018 Outcomes Report 57
that they received from Pioneer Resources. 80% of the respondents agreed that they believed their concerns and ideas will be heard and 20% somewhat agreed. When asked if they were placed in a job that fit their skills and interests, 60% of the respondents agreed while 40% somewhat agreed. 40% of participants responding agreed and 60 % somewhat agreed that the staff supported them on the job until they learned their new responsibilities. Things respondents reported to like about the Vocational Training program include: “Love the program”; “Still looking for a job but like the 1:1 assistance”; “they explain things to me”; “waiting on orientation at Reliant but I like everything”; “It is a good process – very happy with staff”; and “it’s a good program”. When asked about areas where improvement was needed, none were noted.
In the survey provided to Skill Building participants, 23 individuals were surveyed. The results showed that 100% of those surveyed felt they were treated respect. 91% agreed that their concerns and ideas were heard, and that they were satisfied with their services, with 9% somewhat agreeing. 96% agreed that they received support from staff as needed, and that they were learning useful skills in the program. 4% somewhat agreed in these two areas. When asked if he or she agreed that they had a choice in the Skill Building activities in which he or she participates, 48% agreed, 39% somewhat agreed, and 13% disagreed. 87% of those surveyed agreed to the statement, “my quality of life improved since beginning this program”, while 9% agreed, and 1% disagreed. When asked about things they liked about the Skill Building program, statements included: “I like working with others”; “I like attending 2 days per week”; “I like having fun with activities and learning”; “I like coming to Skill Building”; “I like seeing people”; “the people are cool”; “the activities”; “it’s fun”; “getting out of the house and making new friends”; “cooking”; being with friends”; “I like helping in the community at the VFW and Meals on wheels”; and “bowling”. When asked about improvements that were needed, it was suggested that other participant’s attitudes and their “ways” could be improved.
An additional survey was provided to 32 Stakeholders. We received four responses, with only three of those responding having a participant in Skill Building. All four respondent’s input was included in the results of the survey. When asked for agreement on the statement, “Pioneer Resources Skill Builder staff are professional in interactions with HealthWest staff and clinicians”; “Pioneer Resources Skill Building program staff, coordinators or manager are available to answer questions in a timely manner”; “Pioneer Resources Skill Building program staff treat participants with dignity, respect, and offer opportunities for choice”; “Pioneer Resources Skill Building program documentation on goals and outcomes is effective”; and “Pioneer Resources Skill Building program assists participants in working toward their person centered goals”, 50% responded in agreement, and 50% with no opinion. 100% agreement was given when Stakeholders were asked to agree that Pioneer Resources Skill Building program staff are involved in the person centered planning process when requested, and if Pioneer Resources Skill Building program met their participant’s personal care needs.
Measure of Effectiveness
The effectiveness of Skill Building is measured by the number of successes a participant has with meeting his or her goals. Many of the current goals are established as measurable goals, including percentages or numbers to define the goal. We see it as improvement when we see the participants getting closer to these set goals. When we are able to see that the participant is consistent in meeting or exceeding the goal, we count that as a success. Participants work with their case managers to develop
FY 2018 Outcomes Report 58

goals both quarterly and yearly, depending on the need. The percentage of participants making progress toward their stated PCP goals was 98%.
Measure of Efficiency
Skill Building had no claim disputes and 100% of claims were paid. Additional measures were introduced this past fiscal year to ensure that all face-to-face service hours were properly documented. This new system allowed us to capture all billable services and safeguard that no contracted revenue was lost.
Service Access
There was not a specific tool that measured time between program authorization and start of service for this past fiscal year since participants are unable to start program without prior authorization. Our program did not experience any delays in starting services once authorizations were received.
Program Diversity
We had two new program offerings for Vocational Training this fiscal year. One new service provided was the Social Skill Development for student’s age 16 – 26 years of age. We had 14 Pre-ETS (Pre-Employment Transition Students) funded by MRS. This was a 14 week course was taught at the Wesley Transition Center.
The other new program offering was our Custodial Work Crew. It employs two persons supported by HealthWest authorized for Supported Employment, a Crew Leader, and another personal not supported by HealthWest. The Custodial Work Crew is a paid training opportunity for participants to develop skills for competitive, integrated employment in the community.
FY 2018 Outcomes Report 59