2018 oil & gas spending outlook - awma-gcc.org · 2,750 projects - $433bn under construction...
TRANSCRIPT

Presented By:
Industrial Info Resources
Air & Waste Management Association - Gulf Coast Chapter (A&WMA GCC) – Houston, Texas
April 24, 2018
2018 Oil & Gas Spending Outlook
CONFIDENTIAL - No portion of this presentation may be reproduced without prior written consent. © 2018 Industrial Info Resources, Inc.

-1.5
-1.0
-0.5
0.0
0.5
1.0
1.5
2.0
2.5
86
88
90
92
94
96
98
100
102
-1.5
-1.0
-0.5
0.0
0.5
1.0
1.5
2.0
2.5
2013 2014 2015 2016 2017 2018
86
88
90
92
94
96
98
100
102
Exce
ss D
em
and
Exce
ss S
up
ply
* Source: DOE EIA, IEA
Market Highlights
• Global demand growth 1.3 million BBL/d (or 1.3%) in 2018
• OPEC and non-OPEC participants agreed to extend supply cuts through 2018
• OPEC crude supply fell to 32.36 million BBL/d in November
• OECD commercial stocks fell to 2,940 million barrels in October
• Global oil supply rose 0.2 million BBL/d in November to 97.8 million BBL/d
• In 1Q18, runs are forecast to climb back up to 81.2 million BBL/d
• Higher U.S. oil output underpins around 75% of total non-OPEC supply growth in 2017 and 2018.
Difference between global crude production & global demand
-ve indicates demand greater than supply+ve indicates supply volumes exceed demand
Global Crude / Demand OutlookThe Imbalance is Shifting
© Industrial Info Resources 2018 – Data Generated via Industrial Info’s PECWeb Database - No portion of this presentation may be reproduced without prior written consent.
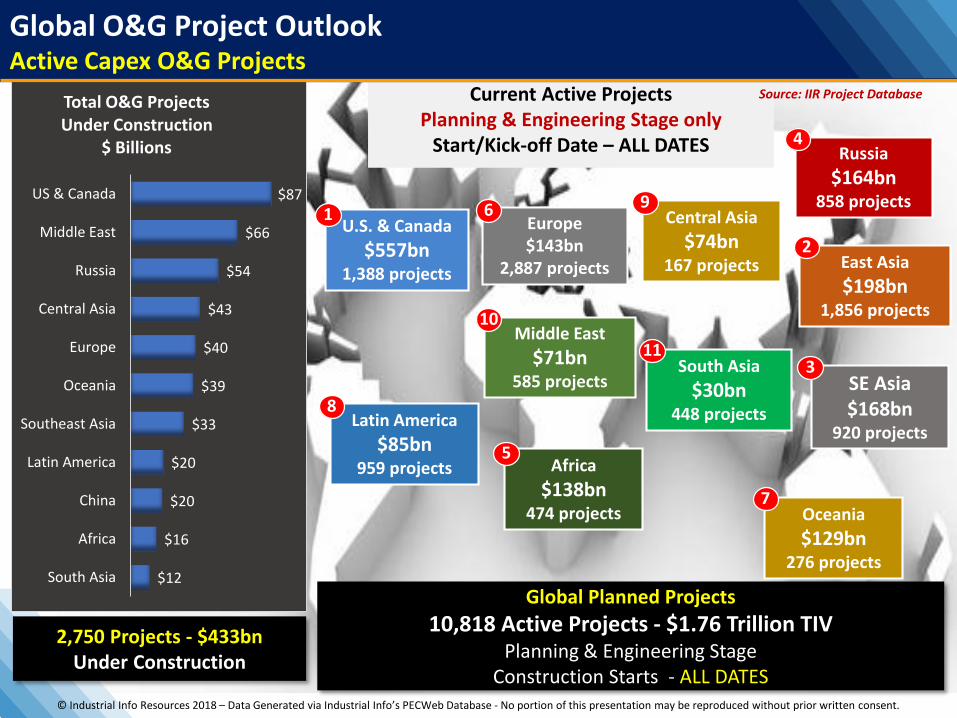
2,750 Projects - $433bnUnder Construction
Current Active ProjectsPlanning & Engineering Stage only
Start/Kick-off Date – ALL DATES
Source: IIR Project Database
U.S. & Canada
$557bn1,388 projects
Europe$143bn
2,887 projects
Oceania
$129bn276 projects
Africa
$138bn474 projects
Latin America
$85bn959 projects
Global Planned Projects
10,818 Active Projects - $1.76 Trillion TIVPlanning & Engineering Stage
Construction Starts - ALL DATES
South Asia
$30bn448 projects
Central Asia
$74bn167 projects
Middle East
$71bn585 projects
East Asia
$198bn1,856 projects
SE Asia$168bn
920 projects
Russia
$164bn858 projects
2
1 6 9
11
10
8
5
3
7
4
$12
$16
$20
$20
$33
$39
$40
$43
$54
$66
$87
South Asia
Africa
China
Latin America
Southeast Asia
Oceania
Europe
Central Asia
Russia
Middle East
US & Canada
Total O&G ProjectsUnder Construction
$ Billions
Global O&G Project OutlookActive Capex O&G Projects
© Industrial Info Resources 2018 – Data Generated via Industrial Info’s PECWeb Database - No portion of this presentation may be reproduced without prior written consent.

591Under Construction Projects
>$107bn TIV
Total Active ProjectsCapex & MRO
2017-20234,878 Projects
>$753bn TIV
U.S.
$241bn920 projects
Latin America Total
$67bn904 projects
24-Month Total ActiveCapex + MRO 4,276 Projects >$480bn TIV
Current Active Capex Project PipelineProjects at Planning & Engineering Stages
Construction Start in 2018 - 2020
Source: IIR O&GProject Database
Canada
$160bn333 projects
24-Month Total ActivePlanning/Engineering
2,157 Projects >$467bn TIV
Americas Oil & Gas Project OutlookWhat’s Still in Play?
Colombia
$2.8bn62 projects
Mexico
$13bn128 projects
Argentina
$9.7bn154 projects
Venezuela
$5.1bn27 projects
Brazil
$24bn355 projects
Peru
$1.9bn43 projects
Panama
$1.2bn4 projects
Chile
$0.6bn30 projects
Ecuador
$0.9bn17 projects
Bolivia
$1.6bn52 projects
Guatemala, Guyana, El Salvador, Dominican Republic, Costa Rica, Honduras, Uruguay, Paraguay, Nicaragua, Trinidad & Tobago
$4.6bn32 projects
$355bn
$.01
$.01
$.02
$.02
$.03
$.04
$.12
$.17
$.30
$.42
$.90
$2.49
$2.77
$12.94
$14.92
$72.50
Costa Rica
Ecuador
Honduras
Uruguay
Chile
Venezuela
Bolivia
Peru
Panama
Colombia
Trinidad…
Argentina
Mexico
Brazil
Canada
U.S.A.
Capital Projects Under Construction
Onshore & Offshore$ Billions
© Industrial Info Resources 2018 – Data Generated via Industrial Info’s PECWeb Database - No portion of this presentation may be reproduced without prior written consent.

$12
$25
$1
$38
$50
$6$12
$61
$3
Oil & Gas Pipelines Production (Oil & Gas) Terminals
U.S. O&G Project Outlook$bn
Capital & Maintenance
2017 2018 2019
U.S. Project Spending 24-Month OutlookU.S. Oil & Gas
$319bn989 projects
$393bn2,514 projects
Total Active U.S. Projects
Planning & Engineering Stage only – All KO Dates
2017-2019$208bn
3,070 projects
Market & Spending Drivers
Production 2018-2023:
• Natural Gas Production from 75–95+ Bcf/d. • NGL Production from 3 - 6 million BBL/d.• Crude Oil Production from 10 -13+ million BBL/d. • Rising LNG exports from 3-10 Bcf/d.• Industrial Petrochemical demand.• Power sector demand growth 4.5 Bcf/d.• Rising Pipeline exports to Mexico as delayed
pipelines are completed.• Supportive administration.
Associated gas production still to keep natural gas prices low.
Processing:
• Margins are returning along with increased utilization rates.
Terminals:
• Buildout to store additional crude oil production.
Pipelines:
• Buildout to move natural gas, NGLs and light oil to access export markets.
$138bn
Gas/NGL-Related1,135 Projects
$32bn
Oil-Related840 Projects
2018-2019Capital Projects
© Industrial Info Resources 2018 – Data Generated via Industrial Info’s PECWeb Database - No portion of this presentation may be reproduced without prior written consent.

1
2
3
4
5
6
7
8
9
10
U.S. Domestic Oil Production(Million Barrels/Day)
6,138
.5
1.0
1.5
2.0
2.5
3.0
3.5
2010 2011 2012 2013 2014 2015 2016 2017 2018
Total Oil Production for 7 Major Oil Basins(Million Barrels/Day)
U.S. Domestic Oil Production(Million Barrels/Day)
Total Oil Production for 7 Major Oil Basins(Million Barrels/Day)
Permian2.93 Mb/d
Eagle Ford1.27 Mb/d
Bakken1.37 Mb/d
Niobrara570 Kb/d
Total Crude Production
7 Major Oil Basins
9,949
* Source: DOE EIA
Onshore Production – USMajor Oil Basins still a major contributor
© Industrial Info Resources 2018 – Data Generated via Industrial Info’s PECWeb Database - No portion of this presentation may be reproduced without prior written consent.

Offshore Production – Gulf of MexicoGulf of Mexico Historical Daily Production
FID approved online 2019-2022
• Appomattox 100,000 BBL/d
• Mad Dog 2 120,000 BBL/d
• White Rose (Canada) 37,000 BBL/d
Total Project Spend $15.8 billion
Future Spending (Pre-FID)
• Shenendoah
• Phobos
• Vito
• Thunderhorse (future wells)
• Constellation
• Conger/Penn State
• Anchor/Tigris
• Buckskin
• Shallow Water Decommissioning
Total Project Spend $~27bn (est)
0
500
1,000
1,500
2,000
Jan
-10
May
-10
Sep
-10
Jan
-11
May
-11
Sep
-11
Jan
-12
May
-12
Sep
-12
Jan
-13
May
-13
Sep
-13
Jan
-14
May
-14
Sep
-14
Jan
-15
May
-15
Sep
-15
Jan
-16
May
-16
Sep
-16
Jan
-17
May
-17
Sep
-17
Jan
-18
Tho
usa
nd
s B
BL/
Day
U.S. GoM Crude Production
Jan 20181.6 million BBL/d
0
1,000
2,000
3,000
4,000
5,000
6,000
7,000
8,000
Jan
-10
May
-10
Sep
-10
Jan
-11
May
-11
Sep
-11
Jan
-12
May
-12
Sep
-12
Jan
-13
May
-13
Sep
-13
Jan
-14
May
-14
Sep
-14
Jan
-15
May
-15
Sep
-15
Jan
-16
May
-16
Sep
-16
Jan
-17
May
-17
Sep
-17
Jan
-18M
illio
n S
tan
dar
d C
ub
ic F
ee
t/D
ay
U.S. GoM Natural Gas Production
Jan 20182,501 MMSCFD
© Industrial Info Resources 2018 – Data Generated via Industrial Info’s PECWeb Database - No portion of this presentation may be reproduced without prior written consent.

Oil & Gas - MidstreamU.S. & Canada Oil & Gas Midstream Buildout
0
100
200
300
400
500
600
700
$0
$5
$10
$15
$20
$25
$30
$35
$40
$45
$50
2015 2016 2017 2018 2019
Pro
ject
Co
un
t
$ b
ns
Storage
SSLNG
Pump Station
Pipeline
LNGLiquefaction
IEP Power
Gas Processing
CompressorStation
Project Count
2018 - $136 Billion in active development - $37 Billion forecasted to Move Forward
© Industrial Info Resources 2018 – Data Generated via Industrial Info’s PECWeb Database - No portion of this presentation may be reproduced without prior written consent.

Permian
Gulf Coast Market
1,100 kbpd$15.7 Billion
760 kbpd$9 Billion
590 kbpd$6.8 Billion
2,655 kbpd$6.3 Billion
$41.89 BillionActive TIV
AlbertaOil Sands
Midcon
Midwest
350 kbpd$0.8 Billion
830 kbpd$7 Billion
Med/High Prob
$14,159,600,000
$1,092,400,000
$395,000,000
Construction KO Sum of TIV
2016 $4,58,000,000
2017 $7,85,000,000
2018 $18,020,000,000
2019 $17,480,000,000
2020 $395,000,000
Grand Total $48,325,000,000
Crude Oil PipelinesPipeline Activity to Move Product to Market (2017-2020)
© Industrial Info Resources 2018 – Data Generated via Industrial Info’s PECWeb Database - No portion of this presentation may be reproduced without prior written consent.

Permian
Gulf Coast Market
1,260 kbpd$12.7 Billion
590 kbpd$5.5 Billion
1,395 kbpd$3.1 Billion
Crude Oil PipelinesPipeline Activity to Move Product to Market (2017-2020)
AlbertaOil Sands
Midcon
Midwest
350 kbpd$0.8 Billion Company/Project Destination Cap (kbpd)
Magellan Midstream CC/HOU 350
P66 Gray Oak CC/HOU 385
Enterprise Conversion HOU 200
Buckeye S. TX Gateway CC 400
Permian Express III HOU 100
Epic CC 220
PAALP Cushing 350
Jupiter MLP Brownsville
Total 2,005
$41.89 BillionActive TIV
Med/High Prob
$14,159,600,000
$1,092,400,000
$395,000,000
Construction KO Sum of TIV
2016 $4,58,000,000
2017 $7,85,000,000
2018 $18,020,000,000
2019 $17,480,000,000
2020 $395,000,000
Grand Total $48,325,000,000
0 kbpd$0 Billion
1,100 kbpd$15.7 Billion
Permian
Eagle Ford
Cushing
CorpusChristi
Brownsville
Houston
Crude Oil PipelinesPipeline Activity to Move Product to Market (2017-2020)
© Industrial Info Resources 2018 – Data Generated via Industrial Info’s PECWeb Database - No portion of this presentation may be reproduced without prior written consent.

Source: DOE EIA, Baker Hughes
0
500
1,000
1,500
2,000
2011 2012 2013 2014 2015 2016 2017
Weekly Rig Count by Basin
Others
Williston
Utica
Permian
Mississippian
Marcellus
Haynesville
Granite Wash
Fayetteville
Eagle Ford
DJ-Niobrara
Cana Woodford
Barnett
Arkoma Woodford
Ardmore Woodford
132%
0
2
4
6
8
10
12
14
16
18
20
2011 2012 2013 2014 2015 2016 2017
Bcf
/d
Monthly Dry Shale Gas Production
Rest of US 'shale'AntrimBakkenFayettevilleWoodfordBarnettEagle FordHaynesvilleUticaPermianMarcellus
Marcellus18.6 Bcf/d
Permian5.6 Bcf/dUtica5.4 Bcf/d
Haynesville5.2 Bcf/d
Onshore Natural Gas Production – U.S.Remains strong despite Lower Rig Counts
© Industrial Info Resources 2018 – Data Generated via Industrial Info’s PECWeb Database - No portion of this presentation may be reproduced without prior written consent.

Kick Off Year
Active Projects TIV (Billions)
Miles
2016 $5.6 1,778
2017 $6.5 2,672
2018 $15.3 6,726
2019 $6.5 2,013
Total $33.9 13,189
Gulf Coast Market
Utica,Marcellus
Mexico
Permian
Midwest
Midcon
$5.2 Billion
5.4 BCF/D
Natural Gas DistributionNatural Gas Pipeline Activity to Meet Demand (2018-2022)
© Industrial Info Resources 2018 – Data Generated via Industrial Info’s PECWeb Database - No portion of this presentation may be reproduced without prior written consent.

Mexico
Gulf Coast
Midcon
Utica,Marcellus
Midwest
Permian
Feb ‘18 Apr ‘18 Jun ‘18 Aug ‘18 Oct ‘18 Dec ‘18
$2B
$1.5B
$1B
$.5B
Selection of projects likely to Move ForwardRegion MMSCFD Miles TIV (millions)SoutheastAtlantic Coast 1,500 560 $5,000 TGP (ACRP) 200 10.2 $280 NortheastPennEast 1,000 114 $385 WB Express 1,300 31 $103 Northeast Supply Enhancement 400 36 $190Northern Access 2016 300 101 $155 Mid-ContinentMIDSHIP 1,440 200 $600 Kingfisher 200 200 $380 Wildcat 400 140 $275 Case 140 205 $245 Great LakesNexus Gas Transmission (NGT) 1,500 257 $590 Texas Eastern Appalachian Lease Project 950 4.5 $37 LNGGulf Coast Southbound Expansion Project 460 N/A $65 TGP Lone Star 300 N/A $100 Pecos Trail Pipeline 1,850 468 $750MexicoSouth Texas Expansion Project (STEP) 200 N/A $130 Sierrita Gas Pipeline 200 N/A $45 Valley Crossing Pipeline 2,600 168 $1,500 Pomelo Connector 400 14 $140 SouthwestGulf Coast Express 1,900 447 $1,700
TIV (USD) by Year Month by Kickoff
Moving Forward
Likely to Move Forward
Not Likely to Move Forward
Natural Gas Distribution82 Pipeline Projects in 2018 worth more than $26.1 Billion
© Industrial Info Resources 2018 – Data Generated via Industrial Info’s PECWeb Database - No portion of this presentation may be reproduced without prior written consent.

1.8Bcf/d
Supplying Norte IIICC Power Plant
Supplying CFE PowerPlants in Chihuahua
Supplying CFE Power Plantsin Chihuahua & Durango
Supply to New &Existing Power Plants
Supplying CFE Power Plantsin Tamaulipas & Veracruz
Supplying CFE Power Plantsin Veracruz, Puebla & Hidalgo
Supply to New &Existing CFE Power Plants
Supply to HermosilloCC Power Plant
Supply to Empalme I & IIPower Plant
Supplying CFE Power Plantsin Baja California Sur
Supply to NoroesteTopolobampo II & III
Power Plants
Mexico Project Spending 24-Month OutlookNew Gas Pipelines tapping into U.S. Gas
3.2Bcf/d
Owner Project KO date Previous Startup Startup Length
$mns MMSCFD(Km)
Fermaca Pipeline El Encino Sde RL de CV El Encino-Delicias (Phase 1) 15-Jan 17-Mar 18-May 100 $128 1,500
Fermaca Pipeline El Encino Sde RL de CV Delicias-La Laguna (Phase 2) 16-May 17-Apr 18-May 314 $400 1,500
Fermaca Global La Laguna-Durango 17-Jun 18-Jan 18-Nov 220 $131 1,150
Fermaca Global Durango-Aguascalientes 17-Jun 18-Jan 18-Nov 330 $140 1,150
Infraestructura Marina del Golfo South Texas-Tuxpan 17-May 18-Oct 19-Apr 800 $2,000 2,600
Transportadora de Gas Natural de la Huasteca S de RL de CV Tuxpan-Tula 16-Oct 17-Dec 19-Apr 350 $500 886
Nueva Era Pipeline LLC Colombia-Escobedo 16-Oct 17-Nov 18-Sep 300 $350 600
Kinder Morgan Gas Natural de Mexico S de RL de CV Mier-Monterrey (Loop) 17-Jul 17-Sep 20-Jul 93 $120 200CFEnergia SA de CV Samalayuca-to-Sasabe 16-Nov 17-Nov 18-Nov 650 $471 472
Transportadora de Gas del Noroeste S de RL de C V El Encino-Topolobampo 14-May 16-Aug 18-Aug 670 $250 530
Fermaca Global Villa de Reyes - Aguascalientes 17-Sep 17-Dec 19-Mar 185 $140 1,000

Natural Gas DemandUS Natural Gas Demand Growth LNG Exports
0
0.4
0.8
1.2
1.6
2
2.4
2.8
3.2
Mill
ion
s
Sabine Pass LNG Liquefaction Plant - Gas Flows NGPL Creole Trail Lighthouse
Train 2
Train 3
Train 4
Train 1
Hurricane Harvey
Train1 Outage
© Industrial Info Resources 2018 – Data Generated via Industrial Info’s PECWeb Database - No portion of this presentation may be reproduced without prior written consent.

16
Executive Summary – All Gulf Coast LNG Export ProposalsCompany Name Project Name City State PEC Zone PEC Timing TIV
Sempra LNG CAMERON LNG GRASSROOT NATURAL GAS LIQUEFACTION PLANT Hackberry Louisiana LA*06 C1 $10,000,000,000Freeport LNG Development LP QUINTANA FREEPORT TRAIN II LNG LIQUEFACTION & EXPORT PLANT Quintana Texas TX*07 C1 $5,500,000,000Freeport LNG Development LP QUINTANA FREEPORT GRASSROOT TRAIN I LNG LIQUEFACTION & EXPORT PLANT Quintana Texas TX*07 C1 $5,500,000,000Cheniere Energy Incorporated CORPUS CHRISTI NATURAL GAS LIQUEFACTION (LNG) PLANT TRAIN #2 ADDITION Corpus Christi Texas TX*05 C1 $5,500,000,000Cheniere Energy Incorporated CORPUS CHRISTI GRASSROOT NATURAL GAS LIQUEFACTION (LNG) PLANT TRAIN #1 Corpus Christi Texas TX*05 C1 $5,500,000,000Freeport LNG Development LP QUINTANA FREEPORT TRAIN III LNG LIQUEFACTION & EXPORT PLANT Quintana Texas TX*07 C1 $4,500,000,000Cheniere Energy Incorporated SABINE PASS NATURAL GAS LIQUEFACTION (LNG) TRAIN #4 ADDITION Cameron Louisiana LA*06 C1 $2,500,000,000Cheniere Energy Incorporated SABINE PASS NATURAL GAS LIQUEFACTION (LNG) TRAIN #5 ADDITION Cameron Louisiana LA*06 C1 $2,500,000,000Cheniere Energy Incorporated CORPUS CHRISTI NATURAL GAS LIQUEFACTION (LNG) PLANT TRAIN #3 ADDITION Corpus Christi Texas TX*05 E2 $3,000,000,000NextDecade RIO GRANDE LNG GRASSROOT LIQUEFIED NATURAL GAS AND EXPORT TERMINAL Brownsville Texas TX*04 P2 $8,000,000,000NextDecade RIO GRANDE LNG LIQUEFACTION AND EXPORT TERMINAL PHASE III EXPANSION Brownsville Texas TX*04 P2 $8,000,000,000NextDecade RIO GRANDE LNG LIQUIFIED NATURAL GAS AND EXPORT TERMINAL PHASE II EXPANSION Brownsville Texas TX*04 P2 $8,000,000,000Venture Global LNG LLC PLAQUEMINE VENTURE GLOBAL LNG PRODUCTION & EXPORT TERMINAL PHASE II EXPANSION Davant Louisiana LA*03 P2 $5,000,000,000Venture Global LNG LLC PLAQUEMINE VENTURE GLOBAL LNG G-R NATURAL GAS LIQUEFACTION PRODUCTION TERMINAL Davant Louisiana LA*03 P2 $5,000,000,000Driftwood LNG LLC DRIFTWOOD LNG TRAIN #5 ADDITION Lake Charles Louisiana LA*06 P2 $5,000,000,000Driftwood LNG LLC DRIFTWOOD LNG TRAIN #4 ADDITION Lake Charles Louisiana LA*06 P2 $5,000,000,000Driftwood LNG LLC DRIFTWOOD LNG TRAIN #3 ADDITION Lake Charles Louisiana LA*06 P2 $5,000,000,000Driftwood LNG LLC DRIFTWOOD LNG TRAIN #2 ADDITION Lake Charles Louisiana LA*06 P2 $5,000,000,000Driftwood LNG LLC DRIFTWOOD GRASSROOT LNG LIQUEFACTON PRODUCTION AND EXPORT TERMINAL Lake Charles Louisiana LA*06 P2 $5,000,000,000Gulf LNG Energy LLC PASCAGOULA NAT GAS LIQUEFACTION (LNG) PRODUCTION/EXPORT TERMINAL PHASE II EXPAN Pascagoula Mississippi MS*01 P2 $4,000,000,000Gulf LNG Energy LLC PASCAGOULA G-R GULF LNG NATURAL GAS LIQUEFACTION EXPORT TERMINAL Pascagoula Mississippi MS*01 P2 $4,000,000,000Sempra LNG PORT ARTHUR GRASSROOT LIQUEFIED NATURAL GAS (LNG) PLANT TRAIN #1 Port Arthur Texas TX*10 P2 $3,500,000,000Sempra LNG PORT ARTHUR LIQUEFIED NATURAL GAS (LNG) PLANT TRAIN #2 ADDITION Port Arthur Texas TX*10 P2 $3,500,000,000Golden Pass Products LLC SABINE PASS GOLDEN PASS PHASE III LNG PRODUCTION TRAIN #3 ADDITION Sabine Pass Texas TX*10 P2 $3,300,000,000Golden Pass Products LLC SABINE PASS GOLDEN PASS PHASE II LNG PRODUCTION TRAIN #2 ADDITION Sabine Pass Texas TX*10 P2 $3,300,000,000Golden Pass Products LLC SABINE PASS GRASSROOT GOLDEN PASS PHASE I LNG PRODUCTION TRAIN #1 Sabine Pass Texas TX*10 P2 $3,300,000,000Lake Charles LNG Export LLC LAKE CHARLES LNG NATURAL GAS LIQUEFACTION & EXPORT PLANT TRAIN #3 ADDITION Lake Charles Louisiana LA*06 P2 $3,000,000,000Lake Charles LNG Export LLC LAKE CHARLES LNG NATURAL GAS LIQUEFACTION & EXPORT PLANT TRAIN #2 ADDITION Lake Charles Louisiana LA*06 P2 $3,000,000,000Lake Charles LNG Export LLC LAKE CHARLES LNG GRASSROOT NATURAL GAS LIQUEFACTION & EXPORT PLANT Lake Charles Louisiana LA*06 P2 $3,000,000,000Cheniere Energy Incorporated CORPUS CHRISTI NATURAL GAS LIQUEFACTION (LNG) PLANT TRAIN #4 ADDITION Corpus Christi Texas TX*05 P2 $3,000,000,000Cheniere Energy Incorporated CORPUS CHRISTI NATURAL GAS LIQUEFACTION (LNG) PLANT TRAIN #5 ADDITION Corpus Christi Texas TX*05 P2 $3,000,000,000Venture Global LNG LLC VENTURE GLOBAL CALCASIEU LNG PRODUCTION & MARINE EXPORT PHASE II PLANT EXPANSION Cameron Louisiana LA*06 P2 $2,500,000,000Venture Global LNG LLC VENTURE GLOBAL CALCASIEU LNG G-R NATURAL GAS LIQUEFACTION EXPORT TERMINAL Cameron Louisiana LA*06 P2 $2,500,000,000Cheniere Energy Incorporated SABINE PASS NATURAL GAS LIQUEFACTION (LNG) TRAIN #6 ADDITION Cameron Louisiana LA*06 P2 $2,500,000,000SCT&E LNG LLC MONKEY ISLAND LNG LIQUEFACTION PRODUCTION AND EXPORT FACILITY PHASE III EXP Cameron Louisiana LA*06 P2 $2,300,000,000SCT&E LNG LLC MONKEY ISLAND LNG LIQUEFACTION PRODUCTION AND EXPORT FACILITY PHASE II EXPANSION Cameron Louisiana LA*06 P2 $2,300,000,000SCT&E LNG LLC MONKEY ISLAND GRASSROOT LNG LIQUEFACTION PRODUCTION AND EXPORT FACILITY Cameron Louisiana LA*06 P2 $2,300,000,000Magnolia LNG LLC LAKE CHARLES MAGNOLIA LNG GRASSROOT LIQUEFACTION PRODUCTION PLANT Lake Charles Louisiana LA*06 P2 $2,200,000,000Magnolia LNG LLC LAKE CHARLES MAGNOLIA LNG PRODUCTION PLANT TRAINS #3 AND #4 ADDITIONS Lake Charles Louisiana LA*06 P2 $2,000,000,000Texas LNG Limited BROWNSVILLE TEXAS LNG NATURAL GAS LIQUEFACTION PLANT TRAIN #2 ADDITION Brownsville Texas TX*04 P2 $1,500,000,000Texas LNG Limited BROWNSVILLE GRASSROOT TEXAS LNG LIQUEFACTION PLANT Brownsville Texas TX*04 P2 $1,500,000,000Annova LNG LLC BROWNSVILLE STAGE C LIQUEFACTION (LNG) PRODUCTION PLANT EXPANSION Brownsville Texas TX*04 P2 $1,250,000,000Annova LNG LLC BROWNSVILLE STAGE B LIQUEFACTION (LNG) PRODUCTION PLANT EXPANSION Brownsville Texas TX*04 P2 $1,250,000,000Annova LNG LLC BROWNSVILLE GRASSROOT STAGE A LIQUEFACTON (LNG) PRODUCTION PLANT Brownsville Texas TX*04 P2 $1,250,000,000Cheniere Energy Incorporated CORPUS CHRISTI GRASSROOT MID-SCALE LNG PRODUCTION PLANT Corpus Christi Texas TX*05 P1 $10,000,000,000NextDecade RIO GRANDE LNG LIQUEFACTION AND EXPORT TERMINAL PHASE IV EXPANSION Brownsville Texas TX*04 P1 $8,000,000,000Freeport LNG Development LP QUINTANA FREEPORT LNG LIQUEFACTION & PRODUCTION PLANT TRAIN IV ADDITION Quintana Texas TX*07 P1 $4,500,000,000NextDecade SHOAL POINT PELICAN ISLAND LNG PRODUCTION AND EXPORT TERMINAL TRAIN #2 ADDITION Texas City Texas TX*07 P1 $3,000,000,000NextDecade SHOAL POINT PELICAN ISLAND LNG GRASSROOT LNG PRODUCTION AND EXPORT TERMINAL Texas City Texas TX*07 P1 $3,000,000,000Commonwealth Projects LLC COMMONWEALTH GRASSROOT LNG PRODUCTION PLANT & MARINE EXPORT TERMINAL Hackberry Louisiana LA*06 P1 $1,200,000,000Commonwealth Projects LLC COMMONWEALTH LNG PRODUCTION PLANT TRAINS 7 & 8 ADDITIONS Hackberry Louisiana LA*06 P1 $1,000,000,000Commonwealth Projects LLC COMMONWEALTH LNG PRODUCTION PLANT TRAINS 5 & 6 ADDITIONS Hackberry Louisiana LA*06 P1 $1,000,000,000Commonwealth Projects LLC COMMONWEALTH LNG PRODUCTION PLANT TRAINS 3 & 4 ADDITIONS Hackberry Louisiana LA*06 P1 $1,000,000,000Cambridge Energy Group Ltd BAPTISTE COLLETTE BAYOU CAMBRIDGE G-R LNG OFFSHORE LIQUEFACTION EXPORT TERMINAL Plaquemine Louisiana LA*02 P1 $600,000,000
Total $202,050,000,000
Ap
pro
ved
Late
r P
lan
nin
gEa
rly
Pla
nn
ing
© Industrial Info Resources 2018 – Data Generated via Industrial Info’s PECWeb Database - No portion of this presentation may be reproduced without prior written consent.

$48.5 Billion51.25 MTPA
8.7 bcf/d
$20.8 Billion35.7 MTPA7.6 bcf/d
$31.3 Billion44.5 MTPA6.1 bcf/d
$26 Billion14.1 MTPA1.9 bcf/d
166 Trains465 MTPA
$338 Billion
LNG Liquefaction Capacity Build OutIs the Spending Over?
Developer Project Train Location Kick-off Start-up MTPASempra Energy Cameron T1-3 Louisiana 2014 2019 15Dominion Cove Point 1 Maryland 2014 2018 5.25Cheniere Energy Corpus Christi T1-2 Texas 2015 2018-9 9Freeport LNG Freeport T1-3 Texas 2014-15 2018-19 15Cheniere Energy Sabine Pass T5 Louisiana 2015 2020 4.5
Kinder Morgan - Southern LNG Elba Island T1-10 Georgia 2017 2018-19 2.5USA - LNG Capacity FERC Approved awaiting FID or notice to proceed
Developer Project Train Location Kick-off Start-up MTPACheniere Energy Corpus Christi T3 Texas 2019 2023 4.5Cheniere Energy Sabine Pass T6 Louisiana 2019 2023 4.5
Energy Transfer-Trunkline/Shell Lake Charles T1 Louisiana 2019 2023 5.5LNG Limited Magnolia T1-2 Louisiana 2019 2023 4Sempra, ENGIE, Mitsui, Mitsubishi, Nippon Cameron T4-5 Louisiana 2019 2023 10
Qatar Petroleum/Exxon Mobil Golden Pass T1 Texas 2019 2023 5.2Delfin LNG Delfin LNG FLNG Gulf of Mexico 2019 2021 2
USA - Formal FERC Application FiledCompanies Project Train Location Kick-off Start-up MTPA
Kinder Morgan - Gulf LNG Gulf T1 Mississippi 2019 2023 6Venture Global Calcasieu Pass T1-5 Louisiana 2019 2023 5Texas LNG Texas T1 Texas 2019 2023 2NextDecade LLC Rio Grande T1-2 Texas 2019 2023 9Freeport LNG Freeport T4 Texas 2019 2023 5.1Exelon Annova T1-2 Texas 2019 2023 2Sempra Port Arthur T1 Texas 2019 2023 5Driftwood LNG Driftwood T1-4 Texas 2019 2023 5.2
Canada - Awaiting FID or Notice to ProceedCompanies Project Train Location Kick-off Start-up MTPA
Shell/PetroChina/Korea Gas LNG Canada T1-2 British Columbia 2019 2023 12Woodfibre LNG Woodfibre T1 British Columbia 2018 2021 2.1
Proposed without a Formal FERC Application Filed61 Projects 113 Trains $211B
© Industrial Info Resources 2018 – Data Generated via Industrial Info’s PECWeb Database - No portion of this presentation may be reproduced without prior written consent.

Commercial Start-Up Year
Start-Up Bcf/d Trains
2019* 5.8 34
2018* 9.2 58
2017 5.0 28
2016 3.5 26
2015 7.8 49
2014 7.5 50
2013 8.6 61
2012 4.1 36
2011 2.6 23
2010 1.7 17
2009 5.0 27
2008 3.1 28
2007 3.4 21
2006 1.5 19
Total 68.8 477Before 2006 47.0 437
Grand Total 116.0 914
Construction Kickoff by Production Region
State Shale Play 2017 2018 Total Bcf/d
Texas/New Mexico Permian 4.5 3.8 8.3
West Virginia/Ohio Marcellus/Utica 0.9 1.4 2.3
Oklahoma Woodford (STACK & SCOOP) 1.1 0.9 2.0
Colorado Niobrara DJ 0.3 0.7 1.0
Montana Bakken 0.1 0.2 0.3
Louisiana Haynesville/MS Lime 0.2 0.2 0.4
Texas Eagle Ford 0.1 0.1
Total Bcf/d 7.1 7.2 14.4
Natural Gas Processing – U.S. NGL Recovery Train Start-Ups (2006 – 2019)
© Industrial Info Resources 2018 – Data Generated via Industrial Info’s PECWeb Database - No portion of this presentation may be reproduced without prior written consent.

$0.00
$2.00
$4.00
$6.00
$8.00
$10.00
$12.00
.0
1.0
2.0
3.0
4.0
5.0
6.0
7.0
8.0
9.0
10.0
2013 2014 2015 2016 2017 2018
Bill
ion
BC
F
Gas Processing
KICKOFF STARTUP Billion
Natural Gas Processing – U.S.
© Industrial Info Resources 2018 – Data Generated via Industrial Info’s PECWeb Database - No portion of this presentation may be reproduced without prior written consent.

Gas DemandBelow $4MMBtu Gas projected 30+ Years Out.
Natural Gas Supply Growth 25% 2015-2020
Demand DriversLNG exports 10 Bcf/d Under ConstructionCoal displacement – Coal-to-Gas SwitchingGas power generation – New ConstructionGas-on-gas competition – Pushing out importsPipeline exports to MexicoNew industrial demand (Ammonia and Methanol)
$122 Billion Advanced Stage Industrial Projects scheduled for startup in between now and late 2018.
NGL DemandU.S. Supply Growth 40+% 2016-2020U.S. is now the Largest Exporter of Propane in the WorldU.S. Ethane Crackers to add 495,000 BBL/d demand by 2018U.S. Propane Dehydrogenation (PDH )198,000 BB/d by 2018
Lower 48 Onshore US Gas Production full-year average
2010 2016 2018 2020
BCF/d 61 70.1 80 89
0
2
4
6
8
10
12
14
16
18
2016 2017 2018 2019 2020
BC
F/d
Power Gen Methanol Ammonia
Ethylene Mexico Exports Canada Exports
LNG Exports Transportation
Natural Gas DemandU.S. Natural Gas Cumulative Demand Growth (2016-2020)
© Industrial Info Resources 2018 – Data Generated via Industrial Info’s PECWeb Database - No portion of this presentation may be reproduced without prior written consent.

LPG Demand• U.S. Supply Growth 40+% 2016-2020 (Largest Exporter of Propane in the World)
0
500,000
1,000,000
1,500,000
2,000,000
2,500,000
3Q-2013 3Q-2014 3Q-2015 3Q-2016 3Q-2017 3Q-2018
BB
L/d
LPG Demand Occidental, Ingleside
AltaGas, Ridley Island
Sunoco, Mariner East 2
Sunoco, Marcus Hook (Phase II)
Phillips 66, Freeport
Sunoco, Mariner East 1
Sunoco, Mariner South
Enterprise (Phase III)
Enterprise (Phase II)
Sunoco, Marcus Hook (Phase I)
DCP, Chesapeake
Targa, Galena Park (Phase II)
Enterprise (Phase I)
Targa, Galena Park (Phase I)
Enterprise
Targa, Galena Park
Sunoco, Marcus Hook
Existing
US Exports1Q-2019
LPG DemandU.S. LPG Demand Growth 2016-2020
© Industrial Info Resources 2018 – Data Generated via Industrial Info’s PECWeb Database - No portion of this presentation may be reproduced without prior written consent.

Ethane Demand• US Supply Growth 40+% 2016-2020 (Largest Exporter of Propane in the World)
0
200,000
400,000
600,000
800,000
1,000,000
1,200,000
1,400,000
4Q-2016 4Q-2017 4Q-2018 4Q-2019 4Q-2020
BB
L/d
US Ethane Demand 3Q16-1Q21Total/Borealis/Nova, Port Arthur (1)
Dow/Dupont, Freeport (1)
Formosa, Point Comfort (1)
Dow/Dupont, Orange (1)
Westlake/Lotte, Lake Charles (1)
Sasol, Lake Charles (1)
Shintech, Plaquemine (1)
ExxonMobil, Baytown (1)
CP Chem, Cedar Bayou (1)
Kinder Morgan, Utopia (3)
Indorama, Lake Charles (1)
Dow/Dupont, Freeport (1)
Westlake, Calvert City (1)
Dow/Dupont, Plaquemine (1)
OxyChem, Ingleside (1)
LyondellBasell, Corpus Christie (1)
Pembina, Vantage (3)
Sunoco, Mariner West (3)
INEOS, Marcus Hook (2)
Enterprise, Morgans Point (2)
(1) Ethylene Cracker(2) Export Terminal(3) Pipeline Exports
Ethane DemandUS Ethane Demand Growth 2016-2020
© Industrial Info Resources 2018 – Data Generated via Industrial Info’s PECWeb Database - No portion of this presentation may be reproduced without prior written consent.

Kick Off Year
Active Projects TIV (Billions)
Miles
2016 $0.09 724
2017 $1.7 244
2018 $9.0 4,514
2019 $2.8 1,830
2020 $0.3 31
Total $13.9 7,343
Gulf Coast Market
Utica,Marcellus
Permian
Rockies
Midcon
NGL DistributionNGL Pipeline Activity to Meet Demand (2018-2022)
© Industrial Info Resources 2018 – Data Generated via Industrial Info’s PECWeb Database - No portion of this presentation may be reproduced without prior written consent.

Global Office Information – Sugar Land, Texas:
Office Phone: (713) 783-5147 Toll Free: (800) 762-3361
Website: www.industrialinfo.com
Cordoba, Argentina Office:Office Phone: (+54) 351-5892452 Email: [email protected]: www.industrialinfo.com.ar
European Office - Galway, Ireland:Office Phone: (+353) 91-700500 Email: [email protected]: www.industrialinfo.eu
New Delhi, India Office:Office Phone: (+91)-124-4711200 Email: [email protected]: www.industrialinfo.com
Dubai, Middle East Office: Market Analytics Office Phone: (+971) 445-74382 Email: [email protected]: www.industrialinfo.com
Washington, D.C. Sales Office:Office Phone: (202) 507-5684 Email: [email protected]: www.industrialinfo.com
Melbourne, Australia Office:Office Phone: (+61) 3-8620-9052 Email: [email protected]: www.industrialinfo.com.au
Perth, Australia Office:Office Phone: (+61) 8-6382-6201 Email: [email protected]: www.industrialinfo.com.au
Beijing, China Office:Office Phone: (+81) 55 213 9014 Email: [email protected]: www.industrialinfo.cn
Manila, Philippines Office:Office Phone: (+63) 2-310 5261 Email: [email protected]: www.industrialinfo.com
Kofu-Shi, Japan Office:Office Phone: (+81) 55 213 9014 Email: [email protected]: www.industrialinfo.jp
Seoul, South Korea Office:Office Phone: (82) 2-557-1384 Email: [email protected]: www.industrialinfo.jp
Singapore, Singapore Office:Office Phone: (65) 6408-0510 Email: [email protected]: www.industrialinfo.com
Call one of our offices to discuss your market intelligence needs, access to one of our project or plant databases or a need for specific market
research and analysis tailored to your requirements.
Contact Industrial Info
Global
Presence
18Offices Around
The World
Over
35Years of
doingBusiness
speaking
59languages
Globally
CONFIDENTIAL - No portion of this presentation may be reproduced without prior written consent. © 2018 Industrial Info Resources, Inc. 1-713-783-5147

Thank you
CONFIDENTIAL - No portion of this presentation may be reproduced without prior written consent. © 2017 Industrial Info Resources, Inc.