2018 northern border customer meetingnorthernborder.com/docs/customermtgweb.pdf · for discussion...
TRANSCRIPT

2018 Northern Border Customer Meeting
April 12, 2018

Welcome
Bill Fonda
Account Director, Marketing & Business Development

For Discussion Purposes – Confidential Communication3
• Welcome – Bill Fonda
• Safety Moment
• Organizational Update – Brandon Anderson
• TransCanada’s Role in North America’s Energy Future – Brandon Anderson
• Commercial Update – Bill Fonda
• Operations Update – Paul Oliver
• Marketing Fundamentals – Colin Strom
• NGTL & Foothills Pipelines Update – Candice Engel
• Break
• Guest Speaker – Dennis Gartman
• Closing and Adjourn
Agenda

For Discussion Purposes – Confidential Communication4
Disclaimer: Forward Looking Information
This presentation includes certain forward looking information, including future oriented financial information or financial outlook, which is intended to help current and potential investors understand management’s assessment of our future plans and financial outlook, and our future prospects overall. Statements that are forward-looking are based on certain assumptions and on what we know and expect today and generally include words like anticipate, expect, believe, may, will, should, estimate or other similar words.
Forward-looking statements do not guarantee future performance. Actual events and results could be significantly different because of assumptions, risks or uncertainties related to our business or events that happen after the date of this presentation. Our forward-looking information in this presentation includes statements related to: future dividend growth, the future growth of our core businesses.
Our forward looking information is based on certain key assumptions and is subject to risks and uncertainties, including but not limited to: our ability to successfully implement our strategic initiatives and whether they will yield the expected benefits, the operating performance of our pipeline and energy assets, economic and competitive conditions in North America and globally, the availability, demand for and price of energy commodities and changes in market commodity prices, the amount of capacity sold and rates achieved in our pipeline businesses, the amount of capacity payments and revenues we receive from our energy business, regulatory decisions and outcomes, outcomes of legal proceedings, including arbitration and insurance claims, performance and credit risk of our counterparties, changes in the political environment, changes in environmental and other laws and regulations, construction and completion of capital projects, labour, equipment and material costs, access to capital markets, interest, inflation, tax and foreign exchange rates, including the impact of U.S. tax reform legislation, weather, cyber security, technological developments and economic conditions in North America as well as globally. You can read more about these risks and others in our Fourth Quarter 2017 Financial Highlights release and 2017 Annual Report filed with Canadian securities regulators and the SEC and available at www.transcanada.com.
As actual results could vary significantly from the forward-looking information, you should not put undue reliance on forward-looking information and should not use future-oriented information or financial outlooks for anything other than their intended purpose. We do not update our forward-looking statements due to new information or future events, unless we are required to by law.
This presentation contains reference to certain financial measures (non-GAAP measures) that do not have any standardized meaning as prescribed by U.S. generally accepted accounting principles (GAAP) and therefore may not be comparable to similar measures presented by other entities. These non-GAAP measures may include Comparable Earnings, Comparable Earnings per Share, Comparable Earnings Before Interest, Taxes, Depreciation and Amortization (Comparable EBITDA), Funds Generated from Operations, Comparable Funds Generated from Operations, Comparable Distributable Cash Flow (DCF) and Comparable DCF per share. Reconciliations to the mostclosely related GAAP measures are included in this presentation and in our Fourth Quarter 2017 Financial Highlights release filed with Canadian securities regulators and the SEC and available at www.transcanada.com.

Organizational Update &
TransCanada’s Role in North America’s Energy Future
Brandon Anderson
Senior Vice President, Commercial – U.S. Gas Pipelines

Organizational Update

For Discussion Purposes – Confidential Communication7
U.S. Natural Gas Pipelines
Stanley Chapman III
Executive Vice President & President
Brandon Anderson
Sr. VP, U.S. Commercial
Josh Gibbon
VP, Midstream
James Eckert
Sr. VP, Gas Operations
Richard Prior
VP, U.S. Gas Pipeline Projects

For Discussion Purposes – Confidential Communication8
U.S. Commercial
Brandon Anderson
Sr. VP, U.S. Commercial
Millie Moran
VP, U.S. Gas Operations
Jay White
VP, U.S. Rates, Regulatory & Strategy
Russ Mahan
VP, U.S. Business Development
Jas Bertovic
VP, U.S. Commercial Marketing

For Discussion Purposes – Confidential Communication9
Short Term Marketing Contacts
Jon Howe
Director, Short Term Marketing
(832) 320-5468
Lonnie Lozano
(832) 320-5679
Sean McDonald
(832) 320-5332
Commercial West Export Market Contacts
Long Term Marketing Contacts
Bill Fonda
(402) 492-7430
Colin Strom
(402) 492-7419
Dick Shepherd
(402) 492-7431
Jas Bertovic
VP, U.S. Commercial Marketing
(832) 320-5911

TransCanada’s Role in North America’s Energy Future

For Discussion Purposes – Confidential Communication11
TransCanada Today
One of North America’s Largest Natural Gas Pipeline Networks• ~57,100 miles of pipeline• ~653 Bcf of storage capacity• ~23 Bcf/d or 25% of continental
demand
Premier Liquids Pipeline System• 3,000 miles of pipeline• 555,000 b/d or 20% of Western
Canadian exports
Large Private Sector Power Generator• 11 power plants, 6,100 MW• Primarily long-term contracted assets
Enterprise Value ~$100 billion*
*$CAD (2018)

For Discussion Purposes – Confidential Communication12
TransCanada’s U.S. Pipeline Assets
Size and Scale
• ~31,000 miles of pipeline
• ~548 Bcf of storage capacity
• ~20% of all U.S. deliveries
• ~2,800 employees
• Assets across 37 states
Strategic Position• Pre-eminent position in lowest cost
supply basins
• Multiple access points to key trading
and storage hubs in the Midwest
• Traditional LDC markets across U.S.
• LNG, power generation, and key
interconnects
• Iroquois & PNGTS provide strategic
connectivity in northeast
• ~40% of TransCanada EBITA from U.S.
Gas by 2019

For Discussion Purposes – Confidential Communication13
15MMB/d
180 Bcf/d
Source: IEA – World Energy Outlook 2017, New Policies Scenario*Metric tonnes of coal equivalent
300Mtce*
125GW
2800GW
Global Demandneeds for all energy sources will increase through 2040!

For Discussion Purposes – Confidential Communication14
20 Bcf/d of U.S. LNG
exports
60% increase in gas
demand for power
8% increase in
petrochemical
demand
North America - Natural Gas Demand
Drivers to 2040
2040U.S. / Canada
Supply: 150 Bcf/d
Demand: 120 Bcf/d*
Exports: 30Bcf/d
Gas demand
increase 6 Bcf/d
Source: IHS Markit – Global Planning Scenarios, 2017*Does not include exports to Mexico and LNG export demand
4 Bcf/d of
Canadian
LNG exports
North Americaself sufficient and capable of being a global gas player

For Discussion Purposes – Confidential Communication15
North America has the oil supply to be self sufficient
U.S. exports increasing to ~1.5 MM b/d**
U.S. imports ~6 MM b/d**
0
5
10
15
20
25
30
2000 2016 2030 2040
North American Oil Production
USA Mexico Canada
<$100 MM project size
<$100 MM project size
Source: IHS Markit – Global Planning Scenarios, 2017 and EIA, 2018*Based on 2017 EIA year-end data figures**EIA, January 2018
Bcf/d
North American Oil Supplywe have the oil supply to be self sufficient
Canada exports ~3.8 MM b/d** to U.S.

For Discussion Purposes – Confidential Communication16
In
Processing &
Pipeline
Infrastructure
Renewable
GenerationTransmission
& Distribution
Fossil Fuel Production, 30,000, 52%
Renewables6,300 11%
T&D**** 8,500, 14%
Other Low Carbon*** 1,100, 2%
End Use**, 12,000, 21%
Cumulative Global Investment $US Billion to 2040
Production
Energy Efficiency
2016 North American Investment
$120B $40B
Fossil Fuel
Generation
$12B
$60B $50B$60B
Source: IEA – World Energy Investment 2017, New Policies Scenario*$USD 2016 (Real) **End use includes energy consumed directly by users***Low carbon includes geothermal, hydro, and tidal ****Transmission and Distribution
Global Energy Infrastructureinvestment is growing…reaching ~$60 Trillion by 2040*

For Discussion Purposes – Confidential Communication17
TransCanadainvestment in indispensable infrastructure

For Discussion Purposes – Confidential Communication18
Industry & Societal Trends
Rapid Technological Change• Shifting market dynamics and consumer preferences • May displace existing technology and upend markets • Impacts long-term investment decisions
Opposition• Rising concerns about safety and environmental impacts are adding
time, uncertainty and cost to project development• Implies the need to strive for zero incidents
Regulatory Change • Lengthening approval timelines and changing regulatory expectations • Jurisdictional disputes and litigation• Canada and U.S. bifurcation

For Discussion Purposes – Confidential Communication19
Conclusions and questions
Global demand for
energy and all fuels
will increase!
Investment in energy
infrastructure will
grow…
North America has the
opportunity to be the
global supplier of
energy!
Policy, innovation, opposition and access
to capital will determine if we can win.
Conclusions and Questions

Commercial Update
Bill Fonda
Account Director, Marketing & Business Development

For Discussion Purposes – Confidential Communication21
• Positioned to serve markets all
across the upper midwest
• Consists of 1,250 miles of
pipeline
• Capacity of ~2.425 Bcf on the
42” line through North Dakota
• Capacity of ~987 MMcf on the
east segment into Chicago
• Consists of a wide variety of
markets ranging from
interstate pipelines, LDC’s, and
power plants
• Volume throughput and
demand remain strong
Northern Border Overview
ND
SD
MN
IA
IL IN
Harper
Chicago
Manhattan
North
Hayden
Port of Morgan
Capacity: 2,200 MMcf
NGPL Point
Capacity
922 MMcf
NNG Point
Capacity
2,200 MMcf
MT
Ventura
AECO
0.3 %

For Discussion Purposes – Confidential Communication22
New Interconnects
ND
SD
MN
IA
IL IN
Harper
Chicago
Manhattan
North
Hayden
• Spring Creek
• Southeast Little Missouri
• McGowan
• Youngs Road
• Atalissa
MT
Ventura
AECO
0.3 %
Spring Creek Expansion (WBI)
• Receipt Point
• McKenzie County, North Dakota
• 730 MMcf
• Projected In-Service September 2018
Southeast Little Missouri (Targa)
• Receipt Point
• McKenzie County, North Dakota
• 205 MMcf
• Projected In-Service Q2 2018
Atalissa (MidAmerican)
• Delivery Point
• Muscatine County, Iowa
• 8 MMcf
• Projected In-Service June 2018
McGowan (Horizon Pipeline)
Receipt Point
Grundy County, Illinois
190 MMcf
Projected In-Service November 2018
Youngs Road (ANR)
• Receipt Point
• Will County, Illinois
• 70 MMcf
• Backhaul transportation to Ventura
• Projected In-Service May 2018

For Discussion Purposes – Confidential Communication23
• Positioned to serve markets all
across the upper midwest
• Assessing projected supply
growth in strategic basins
• Evaluating NBPL’s capabilities
to meet growth needs
• We appreciate your thoughts
and views on growth prospects
and look forward to continuing
discussions
Business Development Opportunities
ND
SD
MN
IA
IL IN
Harper
Chicago
Manhattan
North
Hayden
Port of Morgan
Capacity: 2,200 MMcf
NGPL Point
Capacity
922 MMcf
NNG Point
Capacity
2,200 MMcf
MT
Ventura
AECO
0.3 %

For Discussion Purposes – Confidential Communication24
• Settlement negotiations concluded on October 6, 2017
• Black box settlement
• Rate reductions
• Preservation of contract extension rights
• NBPL must file a new NGA Section 4 rate case by January 1, 2024
• Settlement filed December 4, 2017
• Order approving settlement issued February 23, 2018
• Compliance filing made on March 27, 2018
Rate Case SettlementRP18-234

For Discussion Purposes – Confidential Communication25
Rate Case SettlementRP18-234
January 1, 2018 – March 31, 2018
Demand (per 100 miles)
West - $.0272
East - $.0292
Demand (per path)
PofM to Ventura - $.2235
PofM to North Hayden - $.3485
Ventura to North Hayden - $.1250
April 1, 2018 – December 31, 2019
Demand (per 100 miles)
West - $.0256
East - $.0275
Demand (per path)
PofM to Ventura - $.2103
PofM to North Hayden - $.3280
Ventura to North Hayden - $.1177
January 1, 2020 – December 31, 2023
Demand (per 100 miles)
West - $.0250
East - $.0269
Demand (per path)
PofM to Ventura - $.2054
PofM to North Hayden - $.3205
Ventura to North Hayden - $.1151

Operations & Maintenance Update
Paul Oliver
Manager, West Gas Control

For Discussion Purposes – Confidential Communication27
• Winter 2017-2018 weather was 5% colder than normal in
Chicago compared to 9% warmer than normal for Winter
2016-2017.
• Northern Border’s peak transmission day occurred on
December 26, 2017 with system deliveries of 2.95 Bcf.
• Throughout 2017, the pipeline ran at a load factor of 99%
through Glen Ullin.
Operational Notes – Winter 2017-2018

For Discussion Purposes – Confidential Communication28
2,508,180 2,479,547 2,465,648 2,510,818 2,460,500
777,755663,443 618,769
507,894
844,648
737,866617,011 554,501
456,282
773,275
0
500,000
1,000,000
1,500,000
2,000,000
2,500,000
3,000,000
Nov-17 Dec-17 Jan-18 Feb-18 Mar-18
Dth
Flow Past Glen Ullin Flow Past Ventura Flow Past Harper
Average Winter Day System Flows

For Discussion Purposes – Confidential Communication29
• Like years prior, we continue to reserve April and May for major
planned outages and other capacity impacting events.
• All gas fired compression will take a required, annual maintenance
outage during April and May.
• Individual stations will be offline one at a time in order to minimize
capacity impacts.
Maintenance Schedule – Summer 2018

For Discussion Purposes – Confidential Communication30
Maintenance Schedule – April/May 2018
Scheduled Spring OutagesCompressor Station 18 from 4/3 – 4/4Compressor Station 16 from 4/10 – 4/11Compressor Station 04 on 4/11Compressor Station 03 from 4/16 – 4/17Compressor Station 17 from 4/17 – 4/18Compressor Station 09 from 4/18 – 4/19Compressor Station 07 from 4/24 – 4/25Des Plaines from 4/24 – 4/25Compressor Station 03 from 4/26 – 4/27Compressor Station 12 from 4/26 – 4/27Compressor Station 08 from 5/1 – 5/2Compressor Station 14 from 5/1 – 5/2Compressor Station 01 from 5/2 – 5/3Compressor Station 11 from 5/3 – 5/4Compressor Station 02 from 5/16 – 5/17Compressor Station 05 from 5/22 – 5/23Compressor Station 10 from 5/24 – 5/25
Control Upgrade & PT OverhaulsControl upgrades and PT overhauls will be conducted throughout April and May at the following Compressor Stations:
Compressor Station 13 from 4/3 – 4/16Compressor Station 06 from 5/8 – 5/21

Marketing & Fundamentals
Colin Strom
Account Director, U.S. Long Term Marketing & Optimization

For Discussion Purposes – Confidential Communication32
• Regional Supply & Demand Forecasts
• Domestic Supply Zone
• Value & Fundamentals Overview
Marketing Fundamentals for NBPL

Regional Supply and Demand Forecasts

For Discussion Purposes – Confidential Communication34
Western Canadian Production (Bcf)
Source: Point Logic Energy and Outside Consultants

For Discussion Purposes – Confidential Communication35
Bakken Production (Bcf)
Source: Point Logic Energy and Outside Consultants
For Discussion Purposes – Confidential Communication36
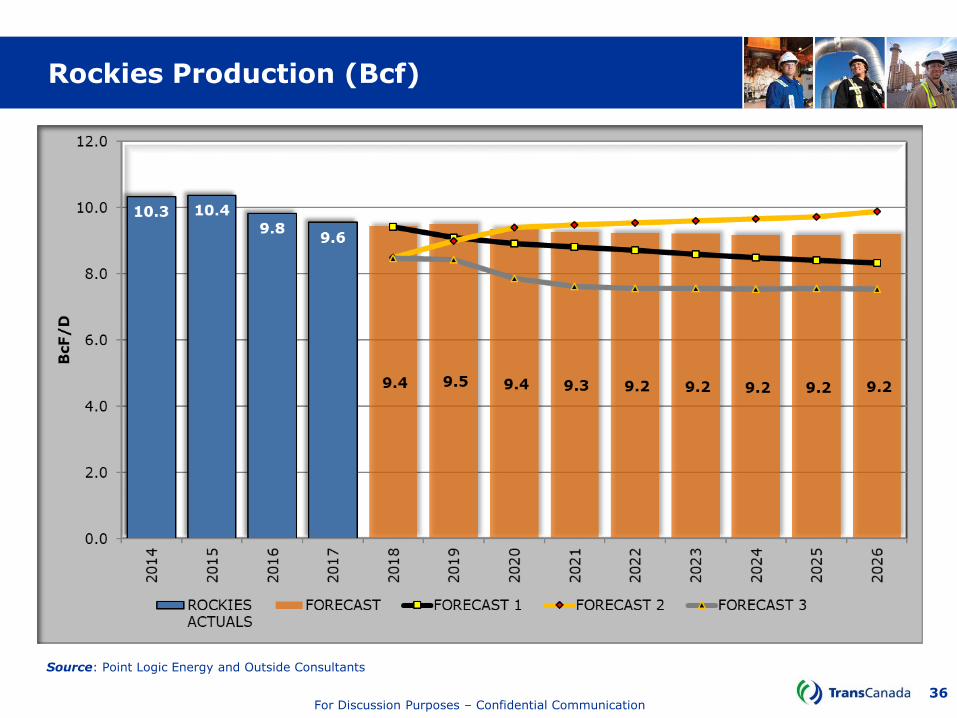
Rockies Production (Bcf)
Source: Point Logic Energy and Outside Consultants

For Discussion Purposes – Confidential Communication37
Permian Production (Bcf)
Source: Point Logic Energy and Outside Consultants
For Discussion Purposes – Confidential Communication38
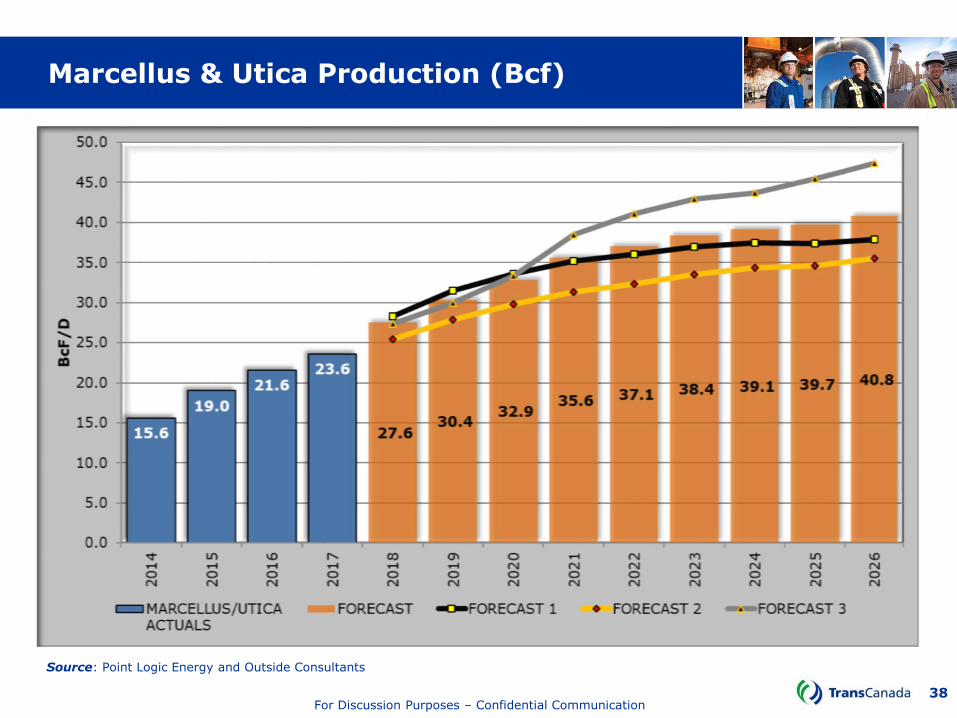
Marcellus & Utica Production (Bcf)
Source: Point Logic Energy and Outside Consultants

For Discussion Purposes – Confidential Communication39
Power Demand in the Central U.S. (Bcf)
0
2
4
6
8
10
12
2018 2019 2020 2021 2022 2023 2024 2025 2026 2027 2028 2029 2030
PJM
West
ERCOT
MISO
Source: Wood Mackenzie

For Discussion Purposes – Confidential Communication40
Southern Demand Pull (Bcf)
0
5
10
15
20
25
30
35
40
2010 2011 2012 2013 2014 2015 2016 2017 2018 2019 2020 2021 2022 2023 2024 2025
Exports
to Mexico
Corpus
Christi
LNG
Freeport
LNG
Cameron
LNG
Sabine
Pass LNG
TX/LA
Demand
Source: Wood Mackenzie

Domestic Supply Zone

For Discussion Purposes – Confidential Communication42
Supply Diversification
Source: Internal Analysis
Canadian84%
Bakken10%
Coal Gasification6%
Rockies0%
Northern Border Receipt Mix
2010
Canadian62%
Bakken25%
Coal Gasification5%
Rockies8%
Northern Border Receipt Mix
2014
Canadian57%
Bakken39%
Coal Gasification4%
Rockies0%
Northern Border Receipt Mix
2017

For Discussion Purposes – Confidential Communication43
Bakken Production ForecastWellhead Wet Gas
Source: JJ Kringstad – North Dakota Pipeline Authority

For Discussion Purposes – Confidential Communication44
Domestic Supply Zone – March, 2018
Bakken Interconnects Receipts Meter Capacity
Stateline 94 233
Squaw Creek 71 107
Charbonneau 108 176
Rawson 182 234
Hay Butte 6 50
Spring Creek 400 507
Watford City 41 68
Little Missouri 69 117
Alexander 18 90
Roosevelt 37 57
Killdeer 67 96
Glen Ullin 7 140
Total Bakken 1,100 1,875
Other Domestic Receipts Meter Capacity
Saskana (Omimex) 5 60
Manning (Grasslands) 6 198
Hebron (Dakota Gas) 121 169
Kurtz (Bison) 0 407
Grand Total 1,232 2,709
*Northern Border (MDth)
Source: *Internal Analysis**Point Logic Energy
Production (wet gas) 1943
Flared Gas (12%) 233
Tioga Lateral 83
Pecan Pipeline 153
Shrink 376
**Bakken Activity (MMcf)

For Discussion Purposes – Confidential Communication45
Bakken Flaring & Gas Capture Targets
November, 2013 December, 2014 February, 2018
Gas Capture Targets:
Jan 2015: 77%
Apr 2016: 80%
Nov 2016: 85%
Nov 2018: 88%
Jan 2020: 91%
Source: JJ Kringstad – North Dakota Pipeline Authority

Value & Fundamentals Overview

For Discussion Purposes – Confidential Communication47
Full Cost AECO Dispatch

For Discussion Purposes – Confidential Communication48
Forward Pricing to Ventura/DemarcAECO vs Field/Lower MidContinent

For Discussion Purposes – Confidential Communication49
Forward PricingAECO to Ventura/Chicago Values
to Chicago
to Ventura

For Discussion Purposes – Confidential Communication50
Peak Summer Weather ForecastJune to August
NOAA
Radiant Solutions
Source: NOAA and Radiant Solutions Weather Services

For Discussion Purposes – Confidential Communication51
2018 Maintenance Capacity
All of the current year’s maintenance capacity has been sold
2018 Design Capacity
July-August, 2018
~20 MMcf of Ventura to Chicago
Capacity Subject to ROFR
April, 2019
~50 MMcf of Ventura to Chicago
November, 2019
~15 MMcf of PofM to Brandt
~7 MMcf of PofM to Ventura
NBPL Available Capacity

For Discussion Purposes – Confidential Communication52
• Supply fundamentals
• NGTL performance at the eastern gate
• NGTL export enhancements for 2018 and beyond
• Marcellus/Utica flow direction
• Competition for supplies in the south
• TransCanada Mainline contracting
• Park & Loan services
Opportunities & Impacts to Pipeline Values

NGTL & Foothills Pipelines Update
Candice Engel
Manager, Commercial West Markets
Andrea Watters
Account Manager, Exports

For Discussion Purposes – Confidential Communication54
Canadian Natural Gas Pipelines
CANDIAN PIPELINE SYSTEMS
• NGTL System
• Canadian Mainline
• Foothills Pipeline
• Trans-Quebec and Maritimes Pipeline
LEADERSHIP
Tracy Robinson, Senior VP Canadian Gas
• Patrick Keys, VP Commercial West
• NGTL System
• Foothills Pipelines
• Stephanie Wilson, VP Commercial East
• Canadian Mainline
• Trans-Quebec and Maritimes Pipeline
• Jawad Masud, VP Commercial Services and Optimization and Design

For Discussion Purposes – Confidential Communication55
Commercial West – Organizational Chart
Patrick KeysVice President
Canadian Gas Pipelines, Commercial West
Ashley InnesDirector, Comm-West
Markets, Industry Collaboration & Rates
Candice EngelManager, Exports
Ashley StowkowyAccount Manager,
Exports
Andrea WattersAccount Manager,
Exports
Scott YuleManager, Intra-Alberta Markets
Tammy Manz Manager, Strategy &
Collaboration
Penelope Echenagusia
Manager, Rates
Keith NelsonDirector, Comm-West
Supply & Commercial Development
Blaine TroutManager, Supply
Todd HarperManager, Supply
Glenn SmetheramCAM
For Discussion Purposes – Confidential Communication56
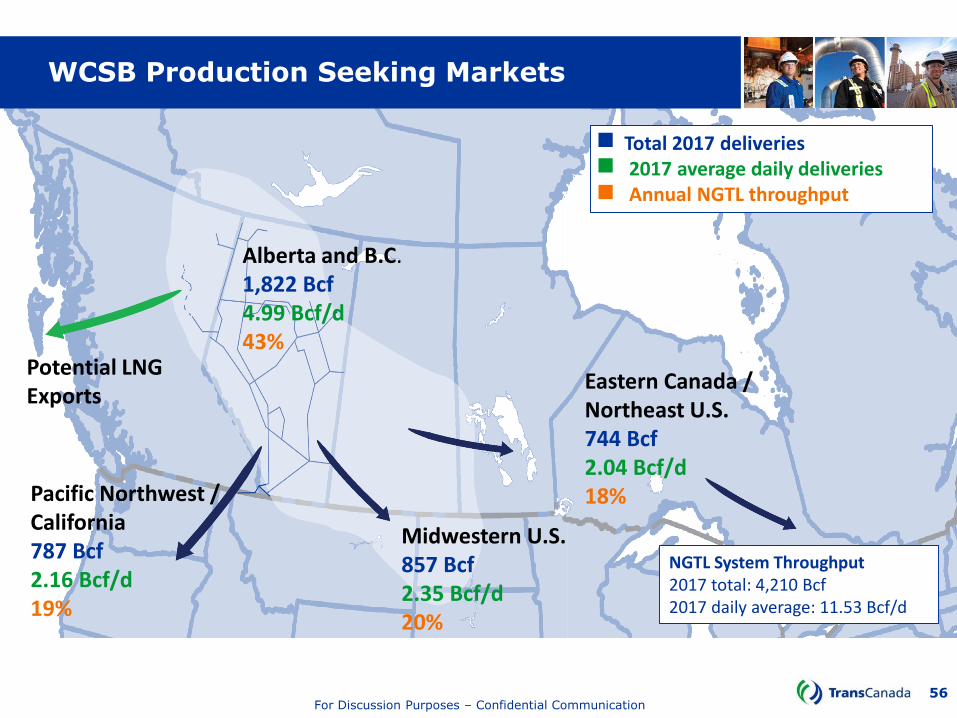
WCSB Production Seeking Markets
Midwestern U.S.857 Bcf2.35 Bcf/d20%
Eastern Canada /Northeast U.S.744 Bcf2.04 Bcf/d18%Pacific Northwest /
California787 Bcf2.16 Bcf/d19%
Potential LNGExports
Alberta and B.C.1,822 Bcf4.99 Bcf/d43%
NGTL System Throughput2017 total: 4,210 Bcf2017 daily average: 11.53 Bcf/d
Total 2017 deliveries2017 average daily deliveriesAnnual NGTL throughput

For Discussion Purposes – Confidential Communication57
0
5
10
15
20
25
2005 2010 2015 2020 2025 2030
Conventional Gas (Vertical)Deep Basin
Northern Shales
CBM
Montney
Duvernay
Solution Gas
Bcf/d History Forecast
WCSB Supply

For Discussion Purposes – Confidential Communication58
NGTL Empress Historic Flows
0
1,000
2,000
3,000
4,000
5,000
6,000
1-Jan 1-Feb 1-Mar 1-Apr 1-May 1-Jun 1-Jul 1-Aug 1-Sep 1-Oct 1-Nov 1-Dec
TJ/
d
2016 2017 2018
LTFP1.5 PJ/d
For Discussion Purposes – Confidential Communication59
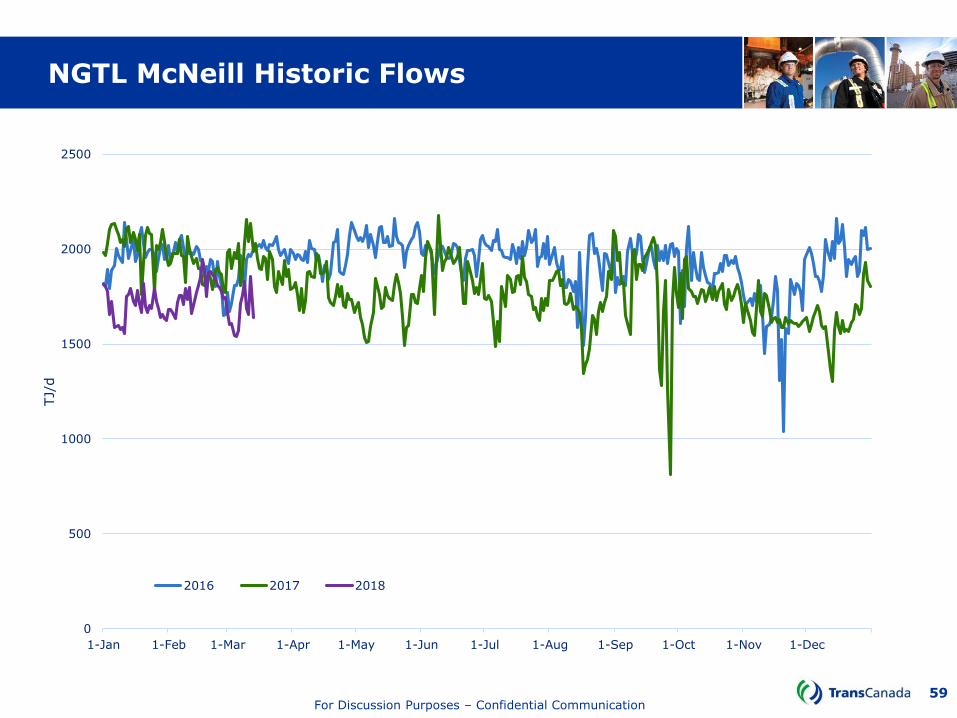
NGTL McNeill Historic Flows
0
500
1000
1500
2000
2500
1-Jan 1-Feb 1-Mar 1-Apr 1-May 1-Jun 1-Jul 1-Aug 1-Sep 1-Oct 1-Nov 1-Dec
TJ/
d
2016 2017 2018

For Discussion Purposes – Confidential Communication60
Empress and McNeill Border Open Seasons

For Discussion Purposes – Confidential Communication61
NGTL Mainline Expansions 2018-2021
• ~$7.0 billion of facilities in-service in
2018 through 2021
• 18 compressor units totaling 540 MW
• Approximately 120 km customer specific
pipeline ranging from NPS 16-24
• Approximately 800 km mainline pipeline
ranging from NPS 36-48
NMML Facilities
2019 Facilities
2020 Facilities
2021 Facilities
2018 Facilities

For Discussion Purposes – Confidential Communication62
2021 NGTL System Expansion Project
• Approximately 350km
NPS 48 Pipe
• Three 30MW Compressor
Units
• One Control Valve Facility

For Discussion Purposes – Confidential Communication63
Expanding WCSB Access to Markets
Gas TransmissionNorthwest
Northern Border
Great Lakes Gas Transmission
Canadian Mainline
PNGTS
Iroquois Gas Transmission
West CoastLNG
LTFP1.5 Bcf/d
West GateExpansions
650 MMcf/d
Basin Expansions550 MMcf/d
East Gate Expansions 1.3 Bcf/d
2.5 Bcf/d of Planned Market Capacity Expansions to 2021*
* 280 MMcf/d of EGAT expansion facilities being finalized.

For Discussion Purposes – Confidential Communication64
2017 and 2018 Pipe Integrity Program
2018
20-25 Launcher/Receiver Pairs30-35 Unconventional ILI55-65 Conventional ILI400-500 Post ILI Digs/Repairs
2017
20 Launcher/Receiver Pairs 30 Unconventional ILI77 Conventional ILI530 Post ILI Digs/Repairs
Launcher/Receiver/Mods
Local or no impact
Potential area/export impact
Probable area/export impact
Inline Inspections
Local or no impact
Potential area/export impact
Probable area/export impact

For Discussion Purposes – Confidential Communication65
NGTL Daily Operating Plan

For Discussion Purposes – Confidential Communication66
EGAT Operational Capability

For Discussion Purposes – Confidential Communication67
NGTL Revised 2018 Interim Rates
NGTL System - Transportation Rate Sheet
Revised Interim 2018 Rates (proposed to be effective May 1, 2018)
Receipt Service (3 yr term)
Revised Interim 2018 Rates
Interim 2018 Rates
(Effective May 1, 2017) (Effective January 1,
2018)
Receipt Service $/103m3 ¢//Mcf/d $/103m3 ¢//Mcf/d
FT-R Average Demand Rate (3 year term) 207.20/mo 19.3 203.40/mo 18.9
IT-R Interruptible Rate (based on FT-R Average above)
7.83/d 22.2 7.69/d 21.8
Delivery Service $/GJ/mo ¢/GJ/d $/GJ/mo ¢/GJ/d
FT-D Group 1 Demand Rate (1 year term):
Empress/McNeill 5.38 17.7 5.27 17.3
Alberta-B.C. Border 4.99 16.4 4.89 16.1
Gordondale/Boundary Lake Borders 4.99 16.4 4.89 16.1
Clairmont/Shell Creek/Edson 4.99 16.4 4.89 16.1
FT-D Group 2 Demand Rate (1 year term):
All Group 2 Delivery locations 4.99 16.4 4.89 16.1
FT-D Group 3 Demand Rate (1 year term):
All Group 3 Delivery locations 5.99 19.7 5.87 19.3
IT-D Group 1 Interruptible Rate:
Empress/McNeill - 19.45 - 19.07
Alberta-B.C. Border - 18.05 - 17.70
Gordondale/Boundary Lake Borders - 18.05 - 17.70
Clairmont/Shell Creek/Edson - 18.05 - 17.70
IT-D Group 2 Interruptible Rate:
All Group 2 Delivery locations - 18.05 - 17.70
• Receipt Point Specific FT-R Rates will vary between the price floor and price ceiling and will be a function of the contract term selected.
• Rates above do not include applicable Abandonment Surcharge.
• These rates do not include a provision for the federal Goods and Services Tax.
• All rates are quoted in Canadian dollars.

For Discussion Purposes – Confidential Communication68
TTFP Chair:
Tammy Manz
Manager, Commercial West Collaboration and Strategy
(403) 920-6330
Collaboration Initiatives:
• Rate Design Task Force
• Revenue Requirement
• Delivery Attributes (Transfers)
• System Reliability (Supply)
• Policy and Operational Communication
• Customer Operation Meetings
Collaboration Team

For Discussion Purposes – Confidential Communication69
NGTL Customer Connect
• NGTL Customer Connect EventMay 29, 2018The Westin CalgaryMore Details to Follow

For Discussion Purposes – Confidential Communication70
Ashley Innes
Director, Commercial West Markets, Industry Collaboration & Rates
(403) 920-2670
Candice Engel
Manager, Commercial West MarketsExport Markets
(403) 920-5623
Commercial West Export Market Contacts
Andrea Watters
Account Manager, Commercial West Export Markets
(403) 920-7956
Ashley Stowkowy
Account Manager, Commercial West Export Markets
(403) 920-5828