2018 investor conference - emerson electric · 8 emerson’s 2017 financial performance --compared...
TRANSCRIPT

1

2

3
8:30 – 9:45 Business Overview / Strategic Update David Farr
9:45 – 10:45 Automation Solutions Mike Train
10:45 – 11:00 Break
11:00 – 11:20 Final Control Update, V&C Integration Ed Monser
11:20 – 12:20 Commercial & Residential Solutions Bob Sharp
12:20 – 1:00 Questions & Answers
1:00 – 2:00 Lunch
Thursday, February 15, 2018
2018 Emerson Investor ConferenceNew York City, NY

4
Emerson Attendees
David Farr Chairman and Chief Executive Officer
Ed Monser President
Frank Dellaquila Senior Executive Vice President and Chief Financial Officer
Steve Pelch Chief Operating Officer and Executive Vice President - Organization
Planning and Development
Bob Sharp Executive President, Emerson Commercial & Residential Solutions
Mike Train Executive President, Emerson Automation Solutions
Sara Bosco Senior Vice President, Secretary and General Counsel
Mark Bulanda Senior Vice President, Planning and Development
Kathy Button Bell Senior Vice President and Chief Marketing Officer
Tim Reeves Director, Investor Relations
Judson Duncan Vice President, Planning

5
2018 Investor Conference
Business Update
David N. Farr
Chairman and Chief Executive Officer
February 15, 2018

6
Agenda
2017 Review
Market Outlook
The One Emerson Strategy Continues To Move Forward
Financial Outlook
Non-GAAP Measures
In this presentation we will discuss some non-GAAP measures (denoted with an *) in talking about our company’s performance, and the reconciliation of those measures to the most comparable GAAP measures is contained within this presentation or is available at our website www.emerson.com under the investors tab.
Safe Harbor Statement
Given the complexities associated with the Tax Cuts and Jobs Act (the “Tax Act”), the ultimate effects on repatriation cost and other tax items may differ materially from the provisional amounts presented herein due to additional regulatory guidance that may be issued and further evaluation of the Company’s actions, assumptions and interpretations.
Our commentary and responses to your questions may contain forward-looking statements, including our outlook for the remainder of the year, and Emerson
undertakes no obligation to update any such statement to reflect later developments. Factors that could cause actual results to vary materially from those
discussed today are provided in our most recent Annual Report on Form 10-K and subsequent reports as filed with the SEC, as well as the impact of the Tax Act
described above.
Trademark Ownership Statement
All non-Emerson marks and logos used in this presentation are the property of their respective owners, and Emerson is not endorsed by or affiliated with the owners.

77
2017 February Investor Conference --Versus 2017 Actual Performance
Perform as
“New Emerson”
1. Fully Integrate
Acquisitions
2. Continue
Rationalizing Base
3. Position and
Execute for Growth
We Successfully Built the Foundation for the New Emerson
Critical for
Pentair V&C
✓
✓
✓
Finish executing on restructuring plans to right-size cost structure given global macroeconomic trends and smaller two platform business footprint
Use cash proceeds and strong cash flow / balance sheet to aggressively acquire complementary businesses and enable organic growth
Position company to fully capitalize on pending global energy market recovery
Aggressively execute on initial cost and revenue synergy plans
Explore additional synergy opportunities as they emerge
Pentair V&C Integration is ahead of plan
✓✓
✓
Continue rationalization and restructuring of our 2 core platforms -- Perfect Execution
Boost profitability, creating a leaner organization positioned for premium growth and premium valuation -- Key to Controlling Our Own Destiny
✓
✓
Pursue both organic growth opportunities and acquisitions, especially in Process / Hybrid / Discrete Automation and Commercial & Residential areas
Execute deals worth ~$3B, adding ~$2B to total sales by 2021, in addition to the acquisition of Pentair V&C
Potential for additional $1-2B of strategic acquisitions for another ~$1B of sales
Regrow Emerson to $20+B in annual revenues by 2021, recover lost earnings and cash flow
✓
✓
Note: We have one last piece, optimizing touch points among Corporate and our two Platforms

88
Emerson’s 2017 Financial Performance --Compared to Guidance at Last Year’s Investor Conference
The Emerson Global Team Exceeded February 2017 Forecast in Sales, Profits and Cash Flow. Also, Successfully Closed the Pentair Valves & Controls Acquisition.
Performance in 2017 Led to Strong Orders Momentum Going Into 2018
2017 Guidance 2017 Actual* 2017 Actual
Sales $14.1 - $14.4B $14.7B $15.3B
Underlying Sales Growth* (2%) - 0% 1% 1%
Gross Margin ~43.4% 43.2% 42.0%
EBIT Margin* ~17.9% 17.9% 16.4%
Operating Cash Flow Continuing Ops ~$2.5B $2.7B
EPS Continuing Ops $2.47 - $2.62 $2.69 $2.54
Dividends per share $1.92 $1.92
Dividend to FCF Continuing Ops Ratio* 62% 56%
Cash Returned to Shareholders ~1.5B $1.6B
Feb. 2017 Investor Conference1
1 At the February 2017 Investor Conference, guidance did not account for results of the V&C acquisition which was completed April 29, 2017
Excl. V&C as Reported

99
2018 Investor Conference --Fiscal 2018 Key Focus Areas
Key 2018 Take Aways
• Achieve premium underlying sales* growth for all of Emerson: 5% - 7%• Drive strong earnings momentum within GAAP EPS by reaching $3.05 - $3.15 EPS in 2018 -- ~20%
GAAP EPS growth• Deliver another strong year of operating cash flow -- $2.9+B -- 17% of sales• Expected dividend per share increase of 2¢
1. Grow Underlying Sales* in Both Platforms: 5% - 7%
• Deliver positive underlying sales* growth within both platforms -- 5 - 7% EMR growth• Return Automation Solutions to above market underlying* growth: 6% - 8% in 2018• Continue strong, above market underlying* growth within Commercial & Residential
Solutions -- 3rd year. Targeting another premium underlying *sales growth year: 4% -6% in 2018
2. Continue Margin Expansion and Drive V&C Operating Margins* to 10%+ by 2nd half of 2018
• Strong profit margin performance within both platforms is important to return to Emerson consolidated margin improvement -- Especially within Automation Solutions --Must leverage profitability at ~ 35% as sales growth returns and absorbs V&C lower margins
• Successfully integrate V&C acquisition and expand margins to deliver Automation Solutions leverage goals – fiscal 2018 earnings / cash flow accretive
3. Grow Operating and Free Cash Flow to Fund Growth and Shareholder Returns
• Continued focus on cash flow management as Emerson returns to growth by generating $2.9+B in operating cash flow
• Invest $575M of capital, enhanced by new Tax Reform• Maintain FCF / Net Income Conversion* ~120%
2018 Will Be an Exciting Year -- It Is an Opportunity for Both Focused Platforms Within Our Organization to Grow While Maintaining a Strong Focus on Margins and Cash
Conversion -- A Strong Demonstration of Emerson’s New Focused 2 Platform Strategy

10
Emerson’s 2018 Forecast --Stronger Sales, Earnings, and Cash Flow Growth
% Change
2017 2018E Forecast 2017 - 18ESales (GAAP) $15.3B $17.0 – $17.3B 11% - 13%
Underlying Growth* 1% 5% - 7%
Gross Margin 42.0% ~43.1% ~110 bps
EBIT Margin* 16.4% ~16.7% ~30 bps
GAAP EPS Continuing Ops $2.54 $3.05 - $3.15 20% - 24%
Dividends Per Share $1.92 $1.94 +1%
Operating Cash Flow Continuing Ops $2.7B ~$2.9B +8%
Cash Returned to Shareholders $1.6B ~$2.0B
Other 2018 key assumptions:
• Currency Tailwinds ~$0.3B
• Tax Rate: 25%-27%
• 2018 Share Repurchase: ~$750M ($1B by end of calendar year)
• Closed acquisitions: ~$750M (includes Paradigm & Cooper Atkins)
• Capital Expenditures: ~$575M, ~3.4% of sales
• Oil prices: $50-$70
• First year pre-tax acquisition acctg. charges: 2017 ($93M), 2018E ~($45M)
• Intangibles amortization: 2017 ($117M), 2018E ~($180M)
Global GFI: FY 2018 2017-18E
Assumptions % Change
U.S. 3.5% - 4.5%
Canada 3.5% - 4.5%
Europe 3.5% - 4.5%
Middle East & Africa 3.5% - 4.5%
China 4.5% - 5.5%
Asia Pacific Excl. China 2.5% - 3.5%
Latin America 1.5% - 2.5%

1111
Mature Markets: Gross Fixed Investment (GFI) Trends 2018 and 2019 Look Pretty Good -- GFI Not GDP!
Mature Markets Expected to Grow ~3.5% in 2018 -- Better Than the 2.8% in 2017. Emerson Expects to Deliver 5+% Underlying Sales Growth* in Mature Markets in 2018
Canada• Nonresidential investment continues to trend higher
as business confidence remains high
• Energy investments accelerating in 2018
• NAFTA concerns, but should be resolved by 2019
2017: 0.6%
2018E: 4.0%
2018E - 2021F: 3.0%
Source: IHS Economics and Emerson Management Assessment; Europe ignores impact of Ireland ~$50B Intellectual Property investment
United States• Baseline GFI growth better than expected -- driven
by improved business spending
• Good GDP growth -- driven by business
spending/investments and the new tax plan
• Stronger growth results in a lower unemployment
rate, higher wages and improved consumer spending
2017: 2.3%
2018E: 4.0%
Reflective of tax reform 2018E - 2021F: 3.5%
Europe• Western Europe expected to continue to grow ~4%
• Eastern Europe should improve growth to 4+%
• Russian GFI growth should rebound as interest rates
come down, and Oil & Gas prices stay firm, and
investments start happening
2017: 3.9%
2018E: 4.0%
2018E - 2021F: 2.5%
World 2017: 2.8%
2018E: 3.8%
2018E - 2021F: 3.7%

1212
Emerging Markets: Gross Fixed Investment (GFI) Trends2018 and 2019 Will Accelerate Due to Strong Growth in USA and Europe
Emerging Markets Expected to Grow ~4.5% in 2018, Outgrowing Mature Markets,Emerson Expects to Deliver 6 - 7% Underlying Sales Growth* in Emerging Markets in 2018
Middle East & Africa• Saudi Arabia’s economy expected to emerge from
recession in 2018
• Capital expenditures expected to improve, especially
around energy and downstream investments
• New power investments are happening
2017: 1.2%
2018E: 3.7%
2018E - 2021F: 4.5%
Latin America• Mexico’s economy finally improving and now expects
solid fixed investment growth in 2018 and 2019
• Brazil’s economy is still weak and we don’t see much
improvement in our end markets in 2018
• NAFTA concerns, but should be resolved by 2019
2017: (2.0%)
2018E: 2.0%
2018E - 2021F: 3.0%
Asia Pacific (Excluding China)• India’s GFI growth will improve to ~5% with solid
industrial / environmental investments
• Southeast Asia’s GFI growth of ~4.5% will be driven
by all industrial sectors
2017: 3.5%
2018E: 2.9%
2018E - 2021F: 3.7%
China• Steady capital investments continue around export
expansion, environmental improvements and new
technology industries
• Exports will add to China’s economic growth and new
investments
2017: 2.9%
2018E: 5.0%
2018E - 2021F: 5.0%
Source: IHS Economics and Emerson Management Assessment

1313
3.0%
(1.5%)
2.5% 3+%
4.5%
1.0% 0.5%
6%
-5.0%
0.0%
5.0%
10.0%
15.0%
20.0%
2002 - 2007 2007 - 2012 2012 - 2017 2017 - 2021T
Mature Markets:GFI and Emerson Sales Growth Rates
Mature Market Growth Should Increase to ~3% -- With a Stronger North America and Western Europe, Emerson Should Drive Premium Growth With This Economic
Scenario -- Similar to 2002 - 2007
Source: GFI - IHS Economics; EMR Sales - Underlying sales excluding acquisitions, divestitures and currency impact*
GFIEMR
Sales
CAGR
Led by USA (tax reform)
and Western Europe,
Emerson sees solid
mature market growth over
the next several years
Emerson outperformed
during the last period of
strong mature market
growth
5+%
2002 - 2007 2017 - 2021T

1414
Emerging Markets:GFI and Emerson Sales Growth Rates
11.0%
7.5%
4.0%5%
15.0%
8.0%
1.0%
6%
-5.0%
0.0%
5.0%
10.0%
15.0%
20.0%
2002 - 2007 2007 - 2012 2012 - 2017 2017-2021T
Expected to Outpace Mature Market GFI Over the Next 3 Years, We Will Leverage Our Strong Position in Emerging Markets to See Solid 6% - 7% Underlying Sales Growth* --
Like We Did in 2002 - 2007 Time Period -- Lower Growth, but Larger Stronger Base
Emerson sees improved
emerging market growth
over the next several
years, especially in our
key end markets
Emerson really
outperformed in a strong
emerging market as we
invested heavily for
penetration / growth
6-7%
GFIEMR
Sales
CAGR
Source: GFI - IHS Economics; EMR Sales - Underlying sales excluding acquisitions, divestitures and currency impact*
2002 - 2007 2017 - 2021T

1515
50
100
150
200
250
300
350
U.S. Gross Fixed Capital Formation (GFCF), a Subset of GFI, Forecasts --- Post U.S. Tax Reform Enactment
Gross Fixed Capital Formation Is Showing Steady or Accelerating Capital Expenditure Forecasts Across Our Core End Markets
Oil & Gas
Chemicals
Power
Construction
Discrete
Life Sciences
Indexed Growth
Source: GFCF - IHS Economics, January 2018
The forecasted GFCF of the included industries is
~20% of GFI in each out year

1616
U.S. Tax Reform Positively Impacts Our Core Markets and Incremental Capital Investment
Additional Investments Brought on by Tax Reform Are Not ‘Shovel Ready’ Projects --Companies Are Evaluating Opportunities and We Anticipate Orders and Sales
Will Come Starting in Late 2018 and Going Into 2019 and 2020
“At ExxonMobil, we plan to invest more than $50
billion over the next five years to expand our
business in the United States. These investments
are underpinned by the unique strengths of our
company and enhanced by the historic tax
reform recently signed into law…. The recent
changes to the U.S. corporate tax rate coupled
with smarter regulation create an environment for
future capital investments.”
Darren Woods, ExxonMobil CEO
“Tax reform clearly provides incentives for us to
invest heavily in innovation and advanced
technologies here in the U.S., and that is exactly
what we will do… we expect to invest on the
order of $2.5 billion in capital expenditures in
the U.S. over the next 5 years.”
Robert Bradway, Amgen CEO
“We see the comprehensive tax
reform in the United States as a
catalyst for increased domestic
capital investment, which will take
advantage of enhanced
competitiveness and pro-business
investment incentives.”
Andrew Liveris,
DowDuPont
Executive Chairman
“The benefit that the franchises and the company will receive as
a result of U.S. tax reform, we are further accelerating our
investment in Experience of the Future in the U.S. … Between
the company and our franchises over the next 2 years, we will
invest approximately $6B to transform the U.S. business.”
Steve Easterbrook, McDonald’s CEO
“From a business
standpoint, tax reform is
quite transformational…
there will be a lot of
capital attracted to the
U.S. in my opinion, just
speaking from BP’s
perspective”
Bob Dudley,
BP CEO
Oil & Gas Oil & GasChemicals
Life Sciences Cold Chain

1717
(20%)
(15%)
(10%)
(5%)
0%
5%
10%
15%
20%
25%
Underlying Order Trends --Continue to Support Solid 2018 Underlying Sales Growth
Emerson’s Orders Are Expected to Rebound Into the 5 - 10% Range for the Next 10 Months. Comparisons Are Tough, but Underlying Demand Is Still Very Good. We Will
Bounce Between the 5 - 10% Range -- + or – Some Months
Commercial &
Residential Solutions
Automation
Solutions
Emerson
Expected
Trailing 3-Month Average vs. Prior Year
10%
5%Jan.
Prelim

1818
(10%)
(5%)
(8%)
(5%)
(3%)
0%
4%3%
7% ~7%~6% ~6%
(10%)
(5%)
0%
5%
10%
Q1 Q2 Q3 Q4 Q1 Q2 Q3 Q4 Q1 Q2E Q3E Q4E
Expected
Quarterly Underlying Sales Growth* --Maintaining Positive Momentum
Throughout 2017 We Saw Global Stabilization, Recovery, and Increased Investments. Now 2018 Is Seeing a Stronger and Improving Business Investment Environment
Driving Our 5% - 7% Underlying Growth* Year for Emerson
Emerson underlying sales growth* (year-over-year change by quarter)
2017: 1%2016: (7%)
Note: All data shows Emerson continuing operations
2018E: 5% - 7%
1919
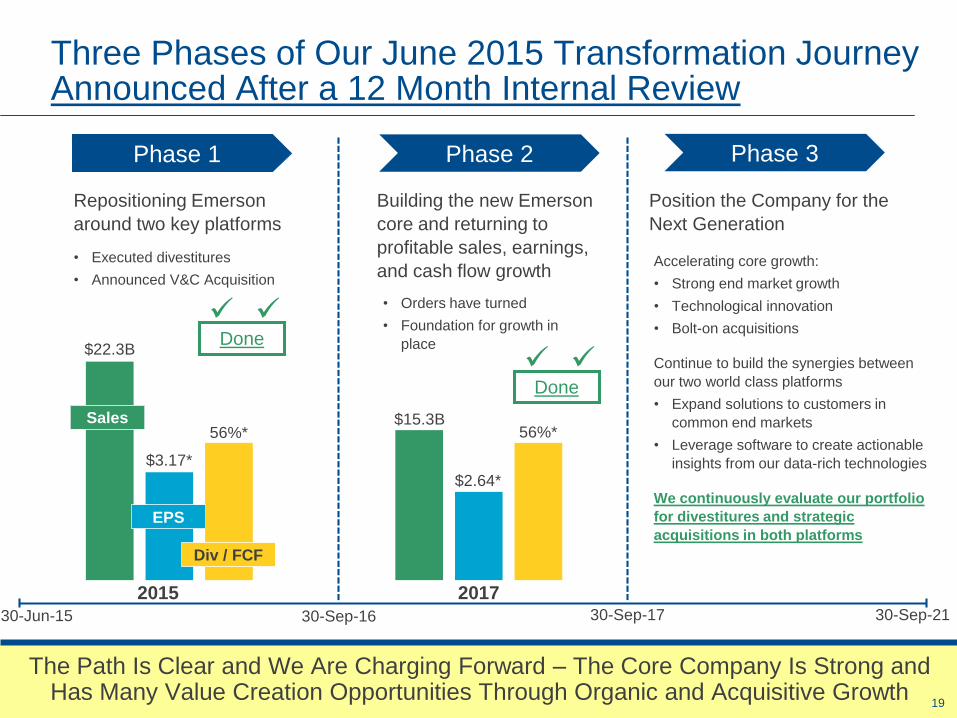
Accelerating core growth:
• Strong end market growth
• Technological innovation
• Bolt-on acquisitions
Continue to build the synergies between
our two world class platforms
• Expand solutions to customers in
common end markets
• Leverage software to create actionable
insights from our data-rich technologies
We continuously evaluate our portfolio
for divestitures and strategic
acquisitions in both platforms
30-Sep-17
Three Phases of Our June 2015 Transformation Journey Announced After a 12 Month Internal Review
The Path Is Clear and We Are Charging Forward – The Core Company Is Strong and Has Many Value Creation Opportunities Through Organic and Acquisitive Growth
• Executed divestitures
• Announced V&C Acquisition
2015 2017
$22.3B
$3.17*
56%*$15.3B
$2.64*
56%*
Repositioning Emerson
around two key platforms
Building the new Emerson
core and returning to
profitable sales, earnings,
and cash flow growth
30-Jun-15 30-Sep-16
Phase 1
• Orders have turned
• Foundation for growth in
place
Sales
Div / FCF
EPS
Phase 2 Phase 3
30-Sep-21
Done
Done
✓ ✓
✓ ✓
Position the Company for the
Next Generation

20
Emerson’s Two Core Business Platforms
• Making the greatest use of the world’s valuable resources
• Helping nations move their economies forward in a responsible way
• Enabling the performance and safety of industry when it matters most
• Advancing the industries that are the backbone of daily life
• Ensuring human comfort and health
• Protecting food quality and sustainability
• Advancing energy efficiency and environmental conservation
• Creating sustainable infrastructure
• Continuing momentum at our Helix Innovation Center
We concentrate on the most complex and important challenges facing the world in the process, industrial, commercial, and residential markets
$204B Market~$11.1B 2018E Sales~53,500¹ Employees
$39B Market~$6.0B 2018E Sales~26,500 Employees
AUTOMATION SOLUTIONS COMMERCIAL & RESIDENTIAL SOLUTIONS
¹Reflects number of employees at 9/30/17, including the impact of the Valves & Controls acquisition

2121
Emerson’s Two Platform Strategy: Continue to Move Up the Technology Pyramid Utilizing Our Strong Position in the Devices / Instruments / Sensors and Control Levels
Emerson Has Tremendous Credibility With Our Customers and We Are Uniquely Positioned to Provide Optimized Solutions for Our Customers
Up and Down the Technology Pyramid
Battleground
(DMZ)DataManagementConverts rich data to information and develops actionable insights
ControlPerforms action on rich data collected from the field
Devices / Instruments / SensorsGenerates rich data
Insights from
information are
fundamental to
delivering optimization
Our established credibility with customers
through world class devices/instruments/sensors
lays the foundation to optimize our customers’
broad needs
Customers rely on our control
systems, which ensure their
processes are optimized,
running safely, efficiently, and
productively

22
Emerson Offers Intelligent Devices, Instruments, Sensors, Controls, and Software Across the Two Platforms
Data
Management
Controls
Devices /
Instruments /
Sensors
Generates rich data
- Control signal
- Safety signal
- Status signal
- Product Quality signal
Performs action on rich data
- Change status
- Shutdown
- Monitoring
- Testing
Converts rich data to information
- Predictive Diagnostics
- Data Analytics & Traceability
Integrate with external information
- Production functions
- Enterprise functions
Increasing
Synergies
Across
Platforms
Commercial &
Residential Solutions
Syncade
Sensi Monitoring
ESI
Automation
Solutions
Low
High
GEOFIELDS
PARADIGM PROSYS
Cooper Atkins
MYNAH
SCADA
OpenEnterprise

23
This Slide Intentionally Omitted

24
This Slide Intentionally Omitted

2525
Automation Solutions: A Complete Portfolio of Solutions for Our Customers
Automation Solutions Has Built a Leading Portfolio Through Organic Technology Developments and Acquisitions Over the Last 20 Years --In Order to Develop Optimized Solutions for Customers
ControlPerforms action on rich data
Devices / Instruments / SensorsGenerates rich data
DataManagementConverts rich data to information and develops actionable insights Mynah
GeoFields
Paradigm
ESI
Syncade
Roxar AS
WestinghouseProcess Controls
RS3Provox
Ovation
DeltaV
Rosemount
Micro Motion
ASCO
Fisher
AG Crosby
Daniel
Vanessa
Permasense
Actuation Cascade
BristolOpenEnterprise
SCADA

2626
Acquisitions and Partnerships Will Play a Key Role in Becoming a Complete Automation Player
Multiple Paths to Expand Offerings -- Significant Progress Since Introducing This Framework in our February 2016 & 2017 Investor Conferences --
Much More To Be Done
Data
Management
Controls
Devices /
Instruments /
Sensors
Process: $101B Hybrid: $40B Discrete: $63B
Paradigm, Geofields, Mynah, Prosys,
AspenTech (alliance)
Pentair Valves & Controls
Investment
Emerson
Automation Solutions

2727
Automation Solutions Has Built Our Global Franchise on Strong Technology Development and Acquisitions, and the Successful Integration of These Acquisitions
Opportunity for Acquisitions Across All Technology Layers and End Markets --A Strong Focus on Discrete and Hybrid Niches for the Next Several Years for
Internal Investments and Acquisitions
High
No YesIntegral to Delivering
a Complete Solution
Channel
Synergy
Not StrategicLow
Highly StrategicTarget
Target
Target
Target
Target
Target
Target
GEOFIELDSPARADIGM
MYNAH
PENTAIRValves & Controls
Machine Control

2828
We Are Continuously Investing and Innovating Our Products and Solutions Across All Platforms
We Are Providing Our Customers a Solution That Will Improve Decision Making, Avoid Health and Safety Incidents, Extend the Life of Their Critical Assets, and
Enhance Operational Excellence
Acquire
Innovate
Provide a Broader /
Deeper Solution
Rosemount Acquired in 1976
Fisher Controls Acquired in 1992
Rosemount
3051 Platform
WirelessDigital Valve
Controller
CHARMs
Process
Refinery
Operations
Lifecycle
Services
FMC Blending & Transfer Systems
Acquired in 2016

2929
Automation Solutions Has Built Our Global Franchise on Strong Technology Development and Acquisitions, and the Successful Integration of These Acquisitions
Opportunity for Acquisitions Across All Technology Layers and End Markets --A Strong Focus on Discrete and Hybrid Niches for the Next Several Years for
Internal Investments and Acquisitions
High
No YesIntegral to Delivering
a Complete Solution
Channel
Synergy
Not StrategicLow
Highly StrategicTarget
Target
Target
Target
Target
Target
Target
GEOFIELDSPARADIGM
MYNAH
PENTAIRValves & Controls
Machine Control

3030
We Are Continuously Investing and Innovating Our Products and Solutions Across All Platforms
We Plan to Acquire, Invest, and Innovate in Order to Build Upon Our History as a Leader in Sensing and Control to Provide the Full Discrete / Hybrid Solution
ASCOAcquired 1985
Hybrid
Bottle Filling &
Packaging
TopWorxAcquired 2008
GO Switches G3 Fieldbus
Electronics
Innovate
Provide a Solution
Cascade Technologies
Acquired 2014
Aerosol Microleak
Detection System
Micro MotionAcquired 1984
F-Series Compact,
Drainable Coriolis Flow
and Density Meters
Acquire
Innovate
Provide a Broader /
Deeper Solution

31
This Slide Intentionally Omitted

32
Automation Solutions Continues to Invest Across Global Facilities in Order to Drive Innovation
Flow
Boulder, CO
Stavanger, Norway
Houston, TX
Nanjing, China
• Next generation Coriolis
• IIOT flow apps
• Pervasive multiphase
• Ultrasonic flow technology
• Flow Technology Center
Final Control
Marshalltown, IA
Singapore
Houston, TX
• Additive manufacturing
• Next generation DVC &
RFID
• Valve actuation
technologies
Discrete & Industrial
Rosemont, IL
Florham Park, NJ
Louisville, KY
Houston, TX
• Next generation LED lighting
• Fluid control
• Industrial Applications
Systems & Solutions
Austin, TX
Pittsburgh, PA
Manilla,
Philippines
Pune, India
• Modular Control (PK)
• Web based HMI
• Simulation
• Microgrid (OCC100)
• Reliability software platform
• Emerson Export Engineering
Center
Measurement & Analytical
Shakopee, MN• Pressure, temperature, & new
sensing technologies
• Wireless
• New analytical instruments
• IIOT apps
Singapore

33
This Slide Intentionally Omitted

34
This Slide Intentionally Omitted

3535
Commercial & Residential Solutions Are Moving Up the Technology Pyramid Utilizing Intelligent Devices, Controls, and Software Across the Platform
Commercial & Residential Solutions Is Utilizing New Product Programs, Early-Stage Investments, Helix Innovation, and Acquisitions to Fill Out Key Capabilities
ControlPerforms action on rich data
Devices / Instruments / SensorsGenerates rich data
DataManagementConverts rich data to information and develops actionable insights
Compressors
Ref Systems Gas Valves
Loggers Fans Pressing
Pipe Tools
Compressor
Controls
Thermostats
DrivesRef
Controls
AC
Controls
Multiple
Thermostats
Cargo & Remote Monitoring
Building
Mgmt
Temperature Monitoring
Cooper -
Atkins
Cooper -
AtkinsPaksense
Locus Traxx
Transformative Wave
7AC
Paksense
Locus Traxx

3636
Acquisitions, Partnerships, and New Software Development Will Play a Key Role
Commercial & Residential Solutions Continues to Expand its Solutions Portfolio Through Acquisitions and New Internal Software and Hardware Development
Data
Management
Controls
Devices /
Instruments /
Sensors
Residential: $22B Commercial: $9B Cold Chain: $8BInvestment
7AC Cooper-Atkins
Cooper-Atkins
Emerson
Commercial & Residential Solutions
Locus Traxx
PakSense
Locus Traxx
PakSenseTransformative Wave

3737
Robust Acquisition Activity in Commercial & Residential Solutions
Opportunity for Acquisitions Across All Technology Layers and End Markets, the Majority Are Smaller and New Technologies That Connect With Our Core Solution
Capabilities and Broaden / Deepen Our Capabilities
High
No YesIntegral to Delivering
a Complete Solution
Channel
Synergy
Not StrategicLow
Highly StrategicTarget
Target
Target
Target
Target
Target
Target
Target
COOPER -
ATKINS
CPCComputer
Process Controls
LOCUS TRAXXPAKSENSE
7AC
TECHNOLOGIES
VILTER
TRANSFORMATIVE WAVE

3838
We Are Continuously Investing and Innovating Our Products and Solutions Across All Platforms
We Continuously Invest and Innovate Across Our Business in Order to Provide a Solutions Offering to Our Customers
Cold Chain
Food Service
Computer Process Controls (CPC)
Acquired in 1996
ProAct Condensing Unit
DixellAcquired 2009
CopelandAcquired in 1986
Controllers for Small and Medium
Compressor Racks
Innovate
Provide a Solution
Acquire
Innovate
Provide a Broader /
Deeper Solution
Temperature Monitoring
Cooper - AtkinsAcquired 2018

39
This Slide Intentionally Omitted

40
Commercial & Residential Solutions Continues to Invest Across Global Facilities in Order to Drive Innovation
Heating & Air Conditioning
Dayton, OH (Helix) • Residential indoor air quality
controls
• Simple building management
systems
• Compressor modulation
• Low global warming
refrigerants
Sidney, OH
Suzhou, China
Aachen, Germany
Cold Chain
Dayton, OH (Helix) • Modular refrigeration
systems
• Commercial kitchen energy
management
• Integrated thermal storage
• Ammonia scroll technologies
Sidney, OH
Suzhou, China
Aachen, Germany
Sensors & Controls
St. Louis, MO • HVAC / IoT monitoring
• WirelessHART power meter
• High temperature smart
packaged sensorMansfield, OH
Tools & Home Products
Racine, WI • Food-load sensing in
waste disposers
• RIDGIDConnect data
management
• Hybrid AC/DC vacuum
technologies
Elyria, OH
St. Louis, MO
St. Truiden, BelgiumElectronics & Solutions
Atlanta, GA (Helix) • IoT cellular sensors
• Temperature sensor system
• Machine learning algorithmsBelluno, Italy

4141
Accelerating core growth:
• Strong end market growth
• Technological innovation
• Bolt-on acquisitions
Continue to build the synergies between
our two world class platforms
• Expand solutions to customers in
common end markets
• Leverage software to create actionable
insights from our data-rich technologies
30-Sep-17
Three Phases of Our June 2015 Transformation Journey Announced After a 12 Month Internal Review
The Path Is Clear and We Are Charging Forward – The Core Company Is Strong and Has Many Value Creation Opportunities Through Organic and Acquisitive Growth
• Executed divestitures
• Announced V&C Acquisition
2015 2017
$22.3B
$3.17*
56%*$15.3B
$2.64*
56%*
Repositioning Emerson
around two key platforms
Building the new Emerson
core and returning to
profitable sales, earnings,
and cash flow growth
30-Jun-15 30-Sep-16
Phase 1
• Orders have turned
• Foundation for growth in
place
Sales
Div / FCF
EPS
Phase 2 Phase 3
30-Sep-21
Done
Done
✓ ✓
✓ ✓
Position the Company for the
Next Generation
✓
✓
We continuously evaluate our
portfolio for divestitures and strategic
acquisitions in both platforms

4242
Corporate Structure and Platform Interface: Re-evaluating the Right Touch Points
We Must Optimize the Right New Touch Points Relative to Corporate and Platforms / Business Units to Ensure Governance, Compliance, and Oversight ---
While Reconfirming Accountability in the Most Efficient / Cost Effective Manner,The Right Balance Between Governance / Cost / Speed / Efficiency
Corporate
Business
Platforms
Business
Units
20182015
Platform 1
Platform 2
Platform 3
Platform 4
Platform 5
Corporate
Task ForceSubset of OCE led by CEO
BU BU
BU
BU
BU
BU
BU
BU
BU
BU
BUBU
BU
BU
BU
BUBU
BU
2016 - 20171st Wave of
Evaluation Began
in Phase 2
This second phase started in the
late summer of 2017 and will be
completed by 09/30/18

4343
Organization Update --Changes Will Continue to Unfold Through 2021
The New Organizational Structure Will Help Drive Our Transformation to a More Focused and Growth-Oriented Company… Then There Will Be an Orderly Transition
to the Next Chairman and CEO
Measurement & Analytical
Lal Karsanbhai
Systems & Solutions
Jim Nyquist
Final Control
Ram Krishnan
Flow
Dave Tredinnick
Discrete & Industrial
Larry Flatt
Board of DirectorsDavid Farr
Chairman and Chief Executive Officer
Executive President, Automation Solutions
Mike Train
President
Ed Monser
Senior Exec VP and Chief Financial Officer
Frank Dellaquila
Exec VP and
Chief Operating Officer
Steve Pelch
Office of the
Chief Executive:
Group
Presidents:
President of Process
Systems & Solutions
Jamie Froedge
Retiring through 2021

4444
Organization Update --Changes Will Continue to Unfold Through 2021
The New Organizational Structure Will Help Drive Our Transformation to a More Focused and Growth-Oriented Company… Then There Will Be an Orderly Transition
to the Next Chairman and CEO
Electronics & Solutions
Mark Dunson
Air Conditioning
Brent Schroeder
Refrigeration
John Rhodes
Sensors & Controls
Jack Huether
Board of DirectorsDavid Farr
Chairman and Chief Executive Officer
Senior VP, Secretary and General Counsel
Sara Yang Bosco
Senior VP, Planning and Development
Mark Bulanda
Senior VP and Chief Marketing Officer
Katherine Button Bell
Executive President –Commercial &
Residential Solutions
Bob Sharp
Exec VP
Chief Operating Officer
Jim Lindemann
Tools & Home Products
Tim Ferry

45
Emerson’s Shareholder Value Creation Model 2016 - 2021 -- Should be a Solid Growth Period
ROTC20% – 30%
Drive EPS1
10% – 12%
CAGR
$5B
Underlying
Sales
Growth:
4% – 7%
Acquisitions~$550M / Year+ Pentair V&C
Share Repurchase~$550M per Year
EBIT Margin
16% – 19%
Operating Capital Efficiency• Working Capital – ~18% of Sales
• Capital Spending – 3% - 3.5% of Sales
Free Cash Flow Target
13% – 15% of Sales
1 Excludes Tax Reform impact – (with tax reform ~13%)

46
2018 Key Messages Highlighting Financial Plan Versus 2017 Investor Conference
• Improving underlying markets -- key / critical global economies aligned for growth– Automation Solutions is just starting the 2017 - 2020 growth cycle– Commercial & Residential Solutions is 7 quarters into their growth cycle
Economic
Conditions
Margins
Acquisitions
Operating
Cash Flow
Capital
Expenditures
Share
Repurchases
Dividends
• Platform margin targets unchanged for 2020 / 2021
– Automation Solutions: ~19% – Commercial & Residential Solutions: ~25%
• Plan unchanged, significant capacity for more if strategic assets become available -- Currently evaluating adding $4B of additional spend for acquisitions and share repurchase
• Impact to 2021:– ~$0.3B increase from operational improvements– ~$0.2B increase from tax reform
• Impact to 2021:
– ~$0.30 increase from operational improvements and share repurchase– ~$0.35 increase from tax reform
• Average of ~3.3% - 3.5% of sales through 2021 -- slightly increased
• ~$600M increase to plan through 2021 and front end loaded --- However, capital allocation plans / strategy will be re-evaluated in 2018 under new tax reform
Earnings
per Share
• Plan to increase dividend versus current pace in 2020, but sooner if we get back to 45% free cash flow coverage by 2019
2016 - 2021
4747
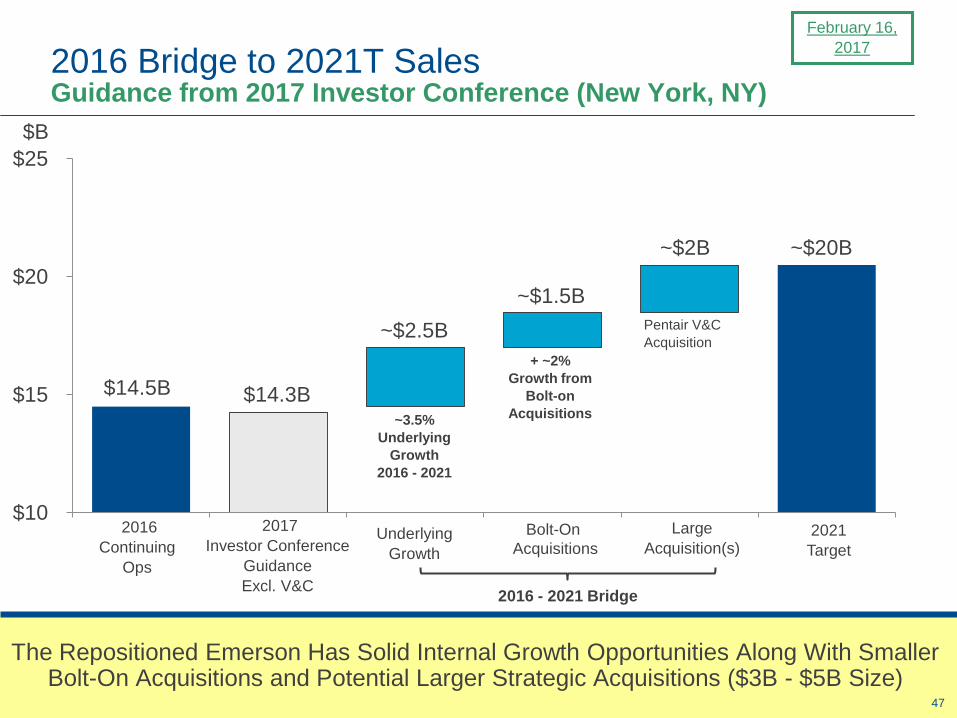
$10
$15
$20
$25
~$2.5B
2016 Bridge to 2021T Sales Guidance from 2017 Investor Conference (New York, NY)
The Repositioned Emerson Has Solid Internal Growth Opportunities Along With Smaller Bolt-On Acquisitions and Potential Larger Strategic Acquisitions ($3B - $5B Size)
$14.5B
~$2B
2016
Continuing
Ops
Large
Acquisition(s)2021
TargetUnderlying
Growth
~$20B
~3.5%
Underlying
Growth
2016 - 2021
Pentair V&C
Acquisition
2017
Investor Conference
Guidance
Excl. V&C
Bolt-On
Acquisitions
~$1.5B
$14.3B
+ ~2%
Growth from
Bolt-on
Acquisitions
2016 - 2021 Bridge
$B
February 16,
2017
4848
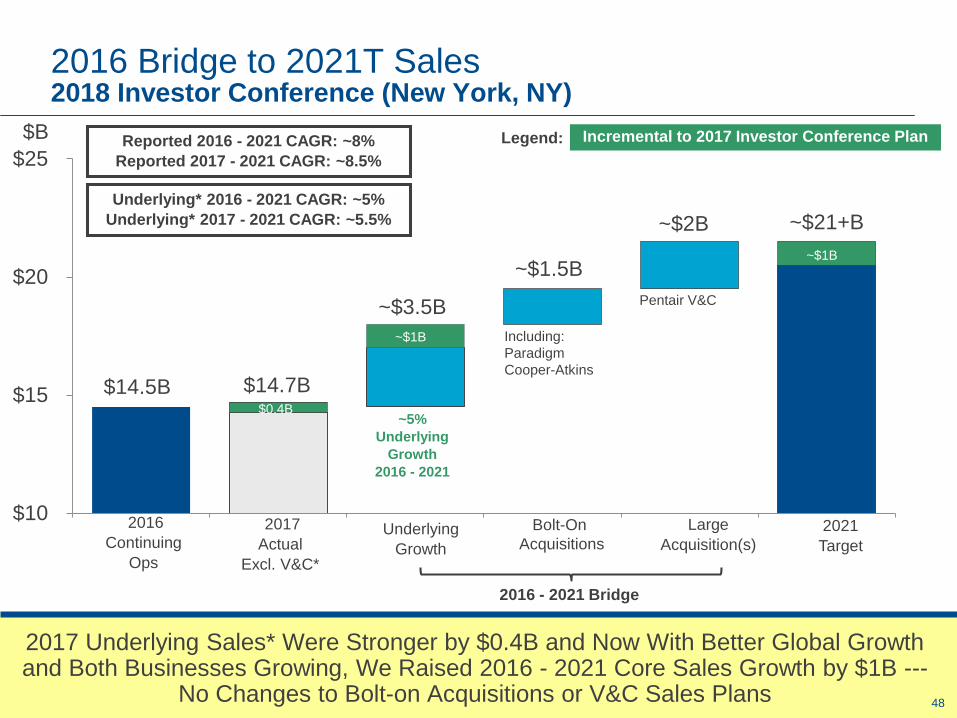
$10
$15
$20
$25
2016 Bridge to 2021T Sales 2018 Investor Conference (New York, NY)
2017 Underlying Sales* Were Stronger by $0.4B and Now With Better Global Growth and Both Businesses Growing, We Raised 2016 - 2021 Core Sales Growth by $1B ---
No Changes to Bolt-on Acquisitions or V&C Sales Plans
~$2B
$B
2021
Target
~$21+B
~5%
Underlying
Growth
2016 - 2021
Pentair V&C
2017
Actual
Excl. V&C*
~$1.5B
$14.7B
~$3.5B
Including:
Paradigm
Cooper-Atkins
Reported 2016 - 2021 CAGR: ~8%
Reported 2017 - 2021 CAGR: ~8.5%
Underlying* 2016 - 2021 CAGR: ~5%
Underlying* 2017 - 2021 CAGR: ~5.5%
2016 - 2021 Bridge
2016
Continuing
Ops
Large
Acquisition(s)Underlying
Growth
Bolt-On
Acquisitions
$14.5B
~$1B
$0.4B
~$1B
Incremental to 2017 Investor Conference PlanLegend:

4949
$2.00
$2.50
$3.00
$3.50
$4.00
$4.50
2016 Bridge to 2021T EPS Guidance from 2017 Investor Conference (New York, NY)
The Goal of the Repositioned / Refocused Emerson Is to Grow Faster, Expand EBIT Margins, and Increase Acquisitions to Drive a Faster EPS Growth Company
$2.45
~$0.45
~$0.10
2016
Cont. Ops
Underlying
Growth
Share Count
Reduction
2021
Target
2016 - 2021 CAGR: ~9.5%
Underlying Sales Growth: ~3.5%
Base EBIT Expansion: ~2.3 pts.
1 Includes interest reduction
$2,052FCF*($M) ~$2,700
Target Is 9+% EPS Growth from New Emerson Base
Margin
Expansion1
~$0.45
~$0.40
Acquisitions
Including V&C
~$3.85
$2.55
2017 Guidance
Excl. V&C
V&C’s EPS contribution will move to “underlying growth” bucket in subsequent bridges
2016 - 2021 Bridge
February 16,
2017

5050
$2.00
$2.50
$3.00
$3.50
$4.00
$4.50
2016 Bridge to 2021T EPS 2018 Investor Conference (New York, NY)
$2.69
~$0.90
~$0.15
2017
Actual
Excl. V&C*
Underlying
Growth
plus V&C
Share Count
Reduction
2021T
Target
Underlying Sales Growth: ~5%
Base EBIT Expansion: ~2.5 pts
Margin
Expansion
~$0.15
Acquisitions
~$4.15
~$0.35 ~$4.502016 - 2021 CAGR w/o Tax Reform*: ~11%
2017 - 2021 CAGR w/o Tax Reform*: ~11.5%
2021T
Target w/ Tax
Reform
Tax
Reform
Benefit
$2.45
2016
Cont. Ops
~$0.50
$2,052 $2,214 ~$2,900 ~$3,100
2016 - 2021 Bridge
Incremental to 2017 Investor Conference PlanLegend:
~$0.30
~$0.20
~$0.05
~$0.05
$0.14
The Faster Core Underlying Sales Growth, the Success of the Valves & Controls Integration, the Slightly Higher Share Repurchase, and the Tax Reform Benefit
Drives a $4.50 EPS by 2021 --- 13% EPS CAGR
FCF*($M)

5151
$3.0B $2.9B$2.3B $2.5B $2.2B ~$2.3B
Operating Capital Efficiency Drives Significantly Higher Cash Flow and Returns for Shareholders
A Strong Legacy of Cash Flow Generation Sets the Foundation for Future Operating Cashflow Growth and Continued Strong Pay Out to
Shareholders: 50% - 60% of Operating Cash Flow
$3.6B $3.7B$3.0B* $3.1B*
$2.7B ~$2.9B14.8% 16% - 18%
of Sales
13% - 15%
of Sales
Free Cash Flow*
Operating Cash Flow
116% 110% 105% 131% 135% ~120%FCF* /Net
Earnings
12.0% 11.9%10.2%
15.0%13.2%
1Excludes impact of repositioning items in 2015 and 2016, divestiture gains in 2015, and impairments in 2013 through 2014*2Continuing Ops
12.5%
17.6%
14.5%
15.1%
Common Stockholders
~16.8%
~13.5%
2018 - 2021
Targets
~110% - 120%
20131 20141 20151 20161 20172 2018E
5252
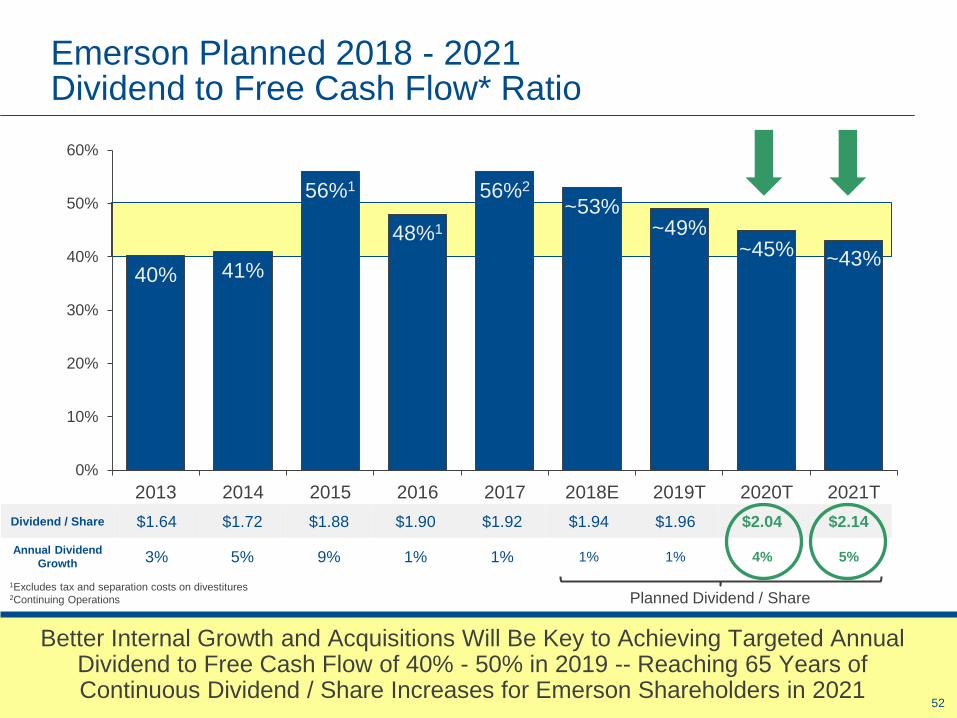
40% 41%
56%1
48%1
56%2
~53%~49%
~45% ~43%
0%
10%
20%
30%
40%
50%
60%
2013 2014 2015 2016 2017 2018E 2019T 2020T 2021T
Emerson Planned 2018 - 2021Dividend to Free Cash Flow* Ratio
Better Internal Growth and Acquisitions Will Be Key to Achieving Targeted Annual Dividend to Free Cash Flow of 40% - 50% in 2019 -- Reaching 65 Years of Continuous Dividend / Share Increases for Emerson Shareholders in 2021
1Excludes tax and separation costs on divestitures2Continuing Operations
Dividend / Share $1.64 $1.72 $1.88 $1.90 $1.92 $1.94 $1.96 $2.04 $2.14
Annual Dividend
Growth 3% 5% 9% 1% 1% 1% 1% 4% 5%
Planned Dividend / Share
5353
$0B
$5B
$10B
$15B
$20B
$25B
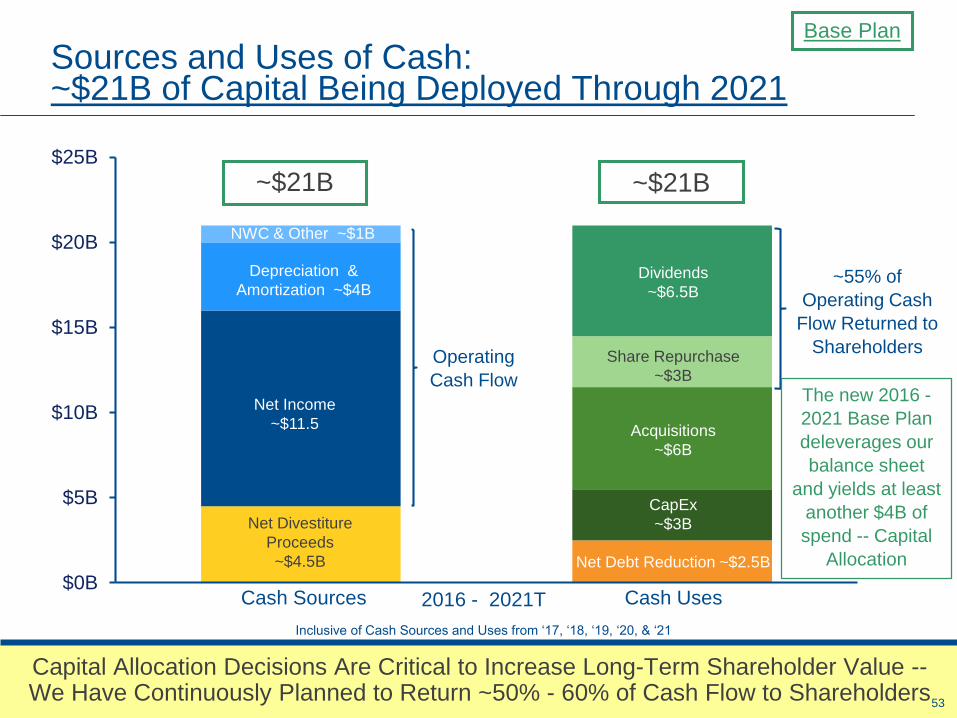
Sources and Uses of Cash: ~$21B of Capital Being Deployed Through 2021
Capital Allocation Decisions Are Critical to Increase Long-Term Shareholder Value --We Have Continuously Planned to Return ~50% - 60% of Cash Flow to Shareholders
Acquisitions
~$6B
CapEx
~$3B
Dividends
~$6.5B
2016 - 2021T
Depreciation &
Amortization ~$4B
Net Income
~$11.5
Share Repurchase
~$3BOperating
Cash Flow
~$21B ~$21B
~55% of
Operating Cash
Flow Returned to
Shareholders
NWC & Other ~$1B
Net Debt Reduction ~$2.5B
Net Divestiture
Proceeds
~$4.5B
Inclusive of Cash Sources and Uses from ‘17, ‘18, ‘19, ‘20, & ‘21
Cash UsesCash Sources
The new 2016 -
2021 Base Plan
deleverages our
balance sheet
and yields at least
another $4B of
spend -- Capital
Allocation
Base Plan

5454
Emerson Has the Capacity To Add $4.0B for Acquisitions and Share Repurchase
The Upside Case Leverages Our Strong Balance Sheet by Adding $4B of Incremental Debt To Be Spent on Acquisitions and Share Repurchases -- We Are Evaluating a New Capital
Allocation Plan That Could Begin in 2019
$0B
$5B
$10B
$15B
$20B
$25B
Sources Uses
Depreciation &
Amortization ~$4B
Net Income
~$11.5
NWC & Other ~$1B
Net Divestiture
Proceeds
~$4.5B
Net Debt Increase ~$1.5B
Acquisitions
~$6B
CapEx
~$3B
Dividends
~$6.5B
Share Repurchase
~$3B
Share Repurchase and / or Acquisitions
~$4.0B
2016 - 2021TInclusive of Cash Sources and Uses from ‘17, ‘18, ‘19, ‘20, & ‘21
Cash UsesCash Sources
~$22.5B ~$22.5B
Operating Cash Flow
Payout ~50% - 60% of
Operating Cash Flow to Shareholders
Upside Case

5555
Fiscal 2018 Key Focus Areas --2018 Investor Conference
Key 2018 Take Aways
• Achieve premium underlying sales* growth for all of Emerson: 5% - 7%• Drive strong earnings momentum within GAAP EPS by reaching $3.05 - $3.15 EPS in 2018 -- ~20%
GAAP EPS growth• Deliver another strong year of operating cash flow -- $2.9+B -- 17% of sales• Expected dividend per share increase of 2¢
1. Grow Underlying Sales* in Both Platforms: 5% - 7%
• Deliver positive underlying sales* growth within both platforms -- 5 - 7% EMR growth• Return Automation Solutions to above market underlying* growth: 6% - 8% in 2018• Continue strong, above market underlying* growth within Commercial & Residential
Solutions -- 3rd year. Targeting another premium underlying *sales growth year: 4% -6% in 2018
2. Continue Margin Expansion and Drive V&C Operating Margins* to 10%+ by 2nd half of 2018
• Strong profit margin performance within both platforms is important to return to Emerson consolidated margin improvement -- Especially within Automation Solutions --Must leverage profitability at ~ 35% as sales growth returns and absorbs V&C lower margins
• Successfully integrate V&C acquisition and expand margins to deliver Automation Solutions leverage goals – fiscal 2018 earnings / cash flow accretive
3. Grow Operating and Free Cash Flow to Fund Growth and Shareholder Returns
• Continued focus on cash flow management as Emerson returns to growth by generating $2.9+B in operating cash flow
• Invest $575M of capital, enhanced by new Tax Reform• Maintain FCF / Net Income Conversion* ~120%
2018 Will Be an Exciting Year -- It Is an Opportunity for Both Focused Platforms Within Our Organization to Grow While Maintaining a Strong Focus on Margins and Cash
Conversion -- A Strong Demonstration of Emerson’s New Focused 2 Platform Strategy

5656
GAAP2017 2018E 2021T
Sales $15.3 $17.0 - $17.3 ~$21+B ~$22+B
Gross Margin 42.0% ~43.1% ~44%
EBIT Margin* 16.4% ~16.7% ~19% ~18%
EPS Reported Continuing Ops $2.54 $3.05 - $3.15 ~$4.50 ~$4.70
Operating Cash Flow Continuing Ops $2.7B ~$2.9B ~$3.8B ~$3.9B
CapEx $476M ~$575M ~$675M
% of Sales 3.1% ~3.4% ~3.2%
2017 – 2021 -- Financial Forecast
By 2021, We Plan to Reach ~44% GP Margin, ~19% EBIT* Margin, and ~$3.8B Operating Cash Flow for Increased Internal / Acquisition Investment
to Drive Sales to ~$21+B and EPS to ~$4.50
Note: 2018 Includes 10 months Paradigm, 9 months Cooper Atkins
2021T Upside Casewith additional ~$4B spend at
50% Share Repurchase,50% Acquisitions
Balance Sheet Leverage Ratios
Operating Cash Flow / Total Debt 58% ~65% ~85% ~50%
Total Debt / EBITDA 1.5x ~1.2x ~0.9x ~1.5X
✓
✓
✓
✓

57

58

59
2018 Investor Conference Automation Solutions Business Overview
Mike Train
Executive President
February 15, 2018

60
2018 Investor Conference Automation Solutions Business Overview
Mike Train
Executive President
February 15, 2018

61
Automation Solutions Key Messages
• Automation Solutions performed very well in 2017 with strong margin growth in the base business and strategic portfolio expansion with Valves & Controls
• Our $204B automation market is growing with a rebound in Process and continued investment in Hybrid and Discrete industries
• Automation continues to grow in scope and relevance as customers look to improve performance and overcome strategic challenges
• Emerson is uniquely positioned to lead the growth of automation and IIoT leveraging our complete technology portfolio, industry expertise and customer engagement strategies
• We will continue to focus acquisitions on elevating our position in Process and Hybrid, while diversifying within specific Discrete industries

62
Automation Solutions2017 Summary
2016 20172016 – 2017
Change
2016 – 2017
ChangeUnderlying Excl. V&C*
Sales (GAAP) $9.0B $9.4B 5% (1%)
EBIT $1.5B $1.5B 5% 7%
% of Sales 16.2% 16.2% 0 bps 150 bps
ROTC 17% 14%
44%
23%
20%
5%8%
Asia
Europe
Latin America
North America
2017 Major Markets Served 2017 Sales by Geography
Middle East & Africa
19%
10%
14%
14%
10%
9%
12%
12%
Upstream
Oil & Gas
Refining
Power
Chemical
Other
Midstream
Oil & GasHybrid
Discrete

63
Emerson’s Strength Is Our Technology, People,and Ability to Create Value for Our Customers
MEASUREMENT ANALYTICALPNEUMATICS &
SOLENOIDS
VALVES &
CONTROLS
FINAL
CONTROL
ENGINEERING
& DESIGN
PRODUCTION
MANAGEMENTCONTROL SOFTWARE
ASSET RELIABILITY
& PERFORMANCE
CONTROL SYSTEMS
Plant Asset
Management
Asset Integrity
Management
Operations
& Alarm
Management
Training &
Simulation
Advanced
Process
Control
Real-time
Optimization
Planning &
Scheduling
Energy
Management
Control
Engineering
SAFETY SYSTEMS MACHINERY HEALTH
Reservoir
Modeling
Data
Man
ag
em
en
t C
on
tro
lF
ield
Devic
es
WELLHEAD CONTROL

6464
11,000+Salespeople
3,000+Engineering &
Development
Emerson’s Strength Is Our Technology, People,and Ability to Create Value for Our Customers
We Have Unique Capabilities to Bring Customers Predictable Success From Project Design Through the Entire Operational Lifecycle
World-class People and Expertise
53,500¹Automation Solutions Employees
3,700+Lifecycle Services
Professionals
5,000+Project Services
Personnel
100+Industry Consultants
Solutions Enabling Top Quartile Performance
Enable customers to eliminate cost,
reduce complexity, and accommodate late
changes on capital projects.
Project Certainty
Help customers optimize production,
improve reliability, minimize emissions,
and ensure safety.
Operational Certainty
200+Service Centers
¹Headcount at 9/30/17, inclusive of V&C acquisition

65
Have Consistently Outperformed Market and Delivered Transformative Solutions and Approaches
AUTOMATION SOLUTIONS GROWTH & MARKET SEPARATION
1992 2009 2009 2017*
$10.3B
$7.5B
$1.9B
3.7% 5.2% Participation
Market
Penetration
Acquisition
Market
Penetration
Acquisition
2009
*Includes full year of V&C sales
Project Certainty,
Operational Certainty
Industry Solutions,
Lifecycle Services,
Perfect Execution
Problem
Solving
Top Quartile
Performance
Main Automation Contractor
Global Reach
Integrated
Solutions
Smart
Devices
Technology
Leadership
FoundationLeading
Products

66
Emerson Is a Recognized Leader Across the Total Automation Spectrum
~$140B ~$40B ~$20B
Devices Control Data
Mgmt
Emerson Participation: 6%5%
2%
#1 in
Final Control
#1 in
Measurement
& Analytical
#1 in
Flow
Solutions
#2 in
Integrated
Control and
Safety
Systems
#1 Continuous #1 Chemicals#1 Power#1 Oil & Gas#1 Life Sciences
Software
#1 Advanced Process Control
#1 Asset Management Software
#1 Loop-Tuning
#1 Simulation
Participation
#1 in
Plant
Asset
Mgmt
#1 Batch #1 Chemicals#1 Refining#1 Life Sciences
#1 in 28 Field Device Categories
Pressure
Temperature
Level
Coriolis Flow
Ultrasonic Flow
Magnetic Flow
Vortex Flow
Control Valves
On/Off Valves
Valve Actuators
Liquid Analyzers
Gas Analyzers

67
Emerson Is the Innovation Leader in Control, and We Continue to Grow Our Presence
Process Control Systems Evolution
of new systems expand our global presence
1992-
2000
2001-
2009
2010-
2015
2016
Technology
Provox,
RS3,
WDPF
DeltaV,
Ovation
DeltaV CHARMs,
Ovation
DCS
Participation1 5% 9% 12% 15%
Control Systems for World’s Power
• 1,300 Gigawatts globally, ~20% of the world
• Over 68% of 600MW and 1,000 MW
Ultra-supercritical units in China
“Emerson... overturns 35 years of industry thinking of I/O”
Industrial Automation Insider - Oct 2009
1Served Market Participation for DeltaV and Ovation based on ARC, Frost & Sullivan, and Internal Estimates
45% Greenfield projects
25% Displacing competition
30% Modernizing Emerson systems
70%
Since 2000, we have replaced >3,200 competitive systems

68
2018 Will Include Emerson’s Biggest Control Platform Technology Launches Ever
New Data Management Capabilities Built-in
• Integrated Machinery Health Monitoring
• Synchronized predictive simulation
Extending Industry Leading Controls
• Ovation Compact Controller
• Integrated Generator Excitation Control
DeltaV v14
Saves Millions
on Cabling
First Native HTML5
interface in the World
From 140 min. to
25 min. per device
DeltaV Live
Powerful Standalone
Easily Integrated
PK Controller
ISASecure SSA
Level 1 Certification
Cybersecurity
Distributed
CHARMs
OPC UA
Communications
IIoT
Smart
Commissioning
Mobile
Simulation
DeltaV
Discovery
Know the health of
operations anywhere
Operations Confidence
Common platform
research to production
Ovation 3.7
Next Generation Flow Computer, Remote Terminal Unit, and SCADA for Oil & Gas Control and Optimization
Flow Computers

69
This Slide Intentionally Omitted

70
This Slide Intentionally Omitted

7171
Process Industries Rebounding in 2018 with Strong Growth Dynamics Going Forward
2018 Total Automation Market Up 5% to 7%Expecting Sustained Growth Period through 2021
Process Industries2018
Outlook
2018-21
OutlookKey Investment Trends:
Oil & Gas – UpstreamNA shale recovery continues; strong project
activity in MEA
Oil & Gas – MidstreamLNG and increasing globalization of natural
gas; pipeline buildout in emerging markets
RefiningGlobal increase in coking units led by China;
India to double refining capacity
Chemical & PetrochemicalU.S. investment to continue in 18; China to
double ethylene over next 5 years
PowerCoal & renewable investment in China and
India; gas conversions and new builds in NA
Process Total

72
Hybrid and Discrete Industries Continue To Be Attractive for Growth and Diversification
• 2018 Hybrid Market Up 3% to 5%Hybrid Industries2018
Outlook
2018-21
OutlookKey Investment Trends:
Life SciencesIncreased innovation spend in NA and EUR;
medicines in emerging markets
Food & BeverageGlobal increase in operational improvement
and food safety spend
Metals & MiningGold and copper recovery spurring project
spend in LA and AP
Pulp & PaperInvestment to upgrade assets in pulp;
strong packaging demand in AP
Hybrid Total
Discrete Industries2018
Outlook
2018-21
OutlookKey Investment Trends:
Industrial MachineryIndustry 4.0 increasing automation spend in
manufacturing
AutomotiveElectric vehicle manufacturing capacity
globally; Emerging Markets
PackagingInvestment in U.S.; automation of manual
process in emerging markets
Discrete Total

73
Accelerated Recovery Period Has Emerson Strongly Positioned to Capture Broad Growth Globally
Automation Solutions Market by Type of Business
Note: Chart is illustrative
Growth Downturn Growth
KOB3: Maintenance and Repair
KOB2: Brownfield Projects
KOB1: Greenfield Projects
2nd
3rd
1st
Large project funnel
visibility has more than
doubled since Feb. 2017
First priority spend is
driving smaller expansion
and optimization projects
with faster payback for
customers
Customers are looking for
new, and more lifecycle
services driving improved
foundational growth
Recovery
74
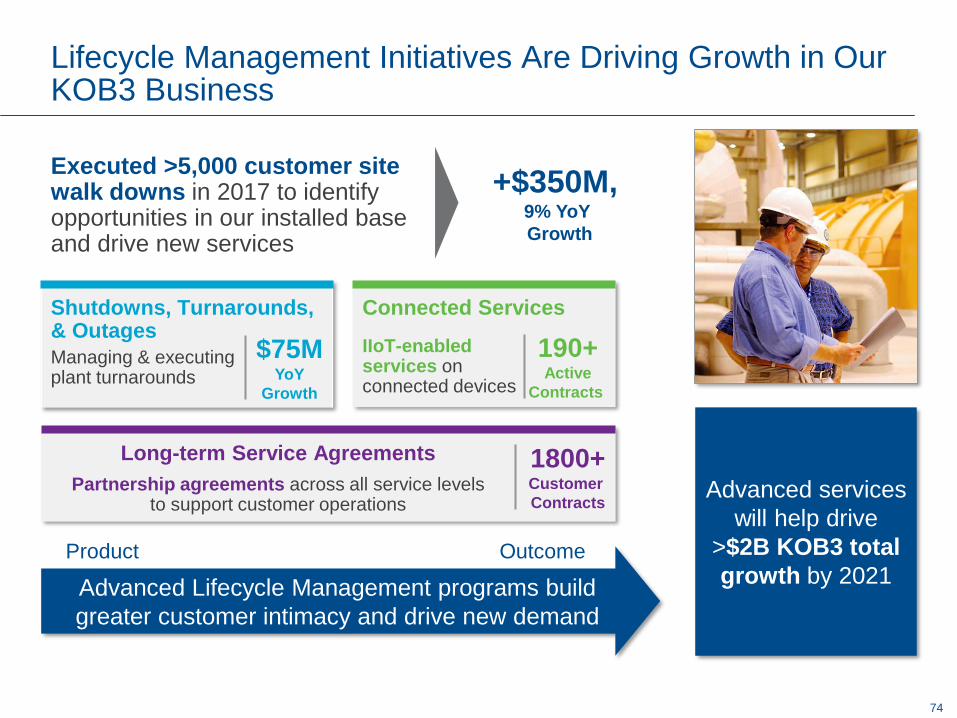
Lifecycle Management Initiatives Are Driving Growth in Our KOB3 Business
Executed >5,000 customer site walk downs in 2017 to identify opportunities in our installed base and drive new services
Shutdowns, Turnarounds, & Outages
Managing & executing plant turnarounds
Connected Services
IIoT-enabled services on connected devices
Long-term Service Agreements
Partnership agreements across all service levels to support customer operations
Advanced Lifecycle Management programs build
greater customer intimacy and drive new demand
Product Outcome
20-40% CAGR$75MYoY
Growth
190+Active
Contracts
1800+Customer
ContractsAdvanced services
will help drive
>$2B KOB3 total
growth by 2021
+$350M, 9% YoY
Growth

7575
2016 2017 2018
Launched Plantweb and Introduced Operational Certainty Consulting to Drive KOB2 Growth
Plantweb IIoT Solutions Grew 30+% in 2017, Forecasting $1B by 2021
• Top Quartile performance
• KPI’s by industry– Reliability– Performance– Safety– Energy/Emissions
Plantweb Digital Ecosystem
Operational Certainty Consulting
• Identified high impact applications
• Prioritized solution opportunities
• Plantweb and Top Quartile launch events
– 8000+ customers reached in 30+ countries
• Top Quartile workshops– Link digital strategy to business objectives– Incorporate deep domain expertise – Identify highest impact opportunities– Provide pragmatic business case for investment
– 100+ Consulting Leads– 5000+ Automation Experts
Identified Market Opportunity
Launched Solutions & Services
Mapped Pains to Solutions
Executing Market Engagement

7676
Data
Analytics
Connectivity
Services
Plantweb Digital Ecosystem: Recognized as Industry’s Most Complete and Integrated IIoT Solution
Plantweb Provides a Scalable Approach to Realize the Promise of IIoT,and Delivers Measurable Business Results
IIoT
SOLUTIONS
FOUNDATIONAL
SOLUTIONS

77
This Slide Intentionally Omitted

78
This Slide Intentionally Omitted

79
This Slide Intentionally Omitted

80
This Slide Intentionally Omitted

81
Automation Is Growing in Scope and Customer Relevance
Hard-wired, intrusive, highly accurate and reliable sensors generating
continuous data
Large systems running highly secure, industry-
based logic for control and safety
On-premise, standalone software packages for
operations experts
Wireless, non-intrusive
sensors fulfilling new data needs
Modular controllers expanding control and optimization of
data islands
Cloud-enabled integrated software
platforms for multiple personas
Device
Control
DataManagement
Services
Product maintenance, reactive repair and replacement
Consulting, connected,
outcome-based offerings

82
Emerson Is Leading the World in New Innovations That Help Customers Transform Their Projects and Operations
Virtual Project
& Consulting
Services
Expanding portfolio of
non-intrusive sensors
Simulation and
synchronization:
Digital Twins
32,000 Networks
146 countries
>10B operating hours
Modular
Controllers
SCADA, Flow Computers and RTUs with Edge Applications for Oil & Gas
Connected Services
for remote asset
monitoring
Growing
ecosystem of
Plantweb
applications

83
Emerson’s Capabilities Span the Full Oil & Gas Value Chain
Refining, Processing,
Blending & Distribution
Upstream Midstream Downstream
ExplorationDevelopment
& Production
Transportation
& Trade
International oil and
gas marketsBiofuels
Petrochemicals
Lubricants
Fuels
Aging infrastructure
and expertise
Leak Detection
Increased importance
of asset integrity
Corrosion Detection
Predictive Maintenance
Maximize asset utilization
due to low oil prices
Production Optimization
Structural Cost Reductions Digitization of Operations
M&A
Valves
SYSS
Industrial
Business Mix
Image Source: BP Strategic Report 2015
https://www.bp.com/content/dam/bp/pdf/investors/bp-strategic-report-2015.pdf
84
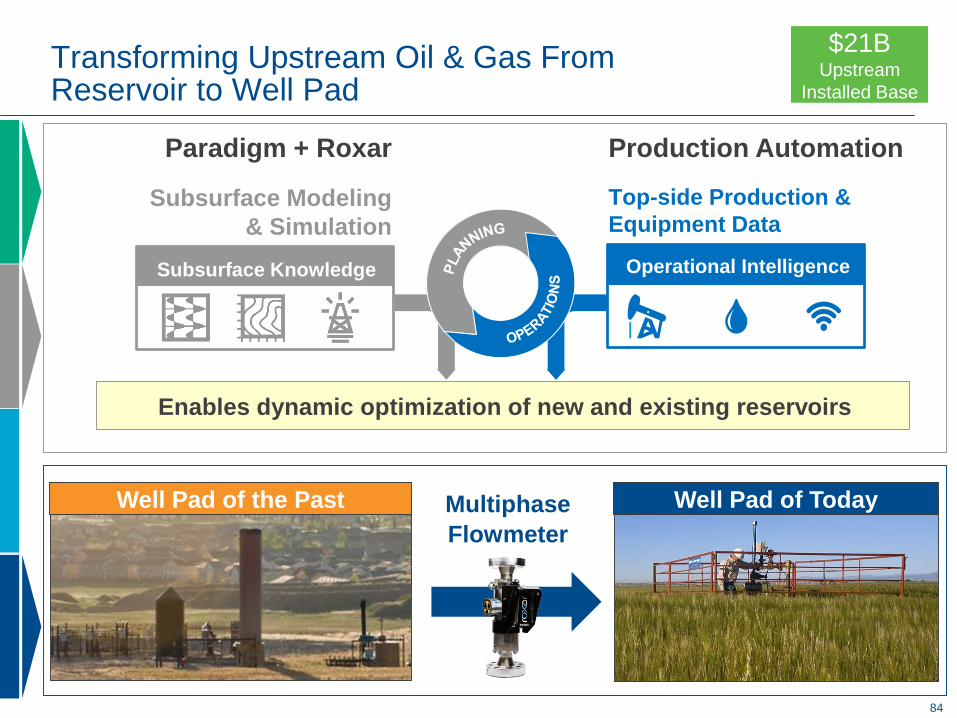
Transforming Upstream Oil & Gas From Reservoir to Well Pad
Subsurface Modeling
& Simulation
Top-side Production &
Equipment Data
Production AutomationParadigm + Roxar
$21B Upstream
Installed Base
Enables dynamic optimization of new and existing reservoirs
Subsurface Knowledge Operational Intelligence
Well Pad of the Past Well Pad of TodayMultiphase
Flowmeter

85
Digitizing Midstream Operations
SCADA, Flow Computers,
and RTUs, enable greater
fleet management and
optimization for operators
in the field -- deliver key
requirements for
digitizing operations
$9B Midstream
Installed Base
Security and Mobility Low Maintenance
Guided WorkflowsSimple Configuration
Verification
Pipeline
Asset Data
Pipeline Integrity,
risk analysis,
and visualization
Scheduling,
operations, and
commercial
management
Real-time
pipeline integrity
insight and
optimizationPipeline Automation ESI GeoFields

86
Expanding High Value Solutions Portfolio at Every Level for Downstream Facilities
Non-Intrusive Wireless Corrosion Monitoring
Corrosion is the industry’s #1 maintenance problem
• Easily deploy corrosion monitoring anywhere
• Automate manual, intrusive inspections with real-time data
Digitally-empowered turnaround services enable
shorter shutdowns, faster startup, and improved
confidence in operations
$25B Downstream
Installed Base
• Cybersecurity
• Mobility
• Integration by Design
• Modularity
• Virtualization
• Efficiency
DeltaV V14 extends control and IIoT leadership
Dynamic
Simulation
Alarm
Management
Advanced Control
& Optimization
1000111001100
000111000
Mynah & ProSys
acquisitions and AspenTech
alliance add new integrated
software solutions
87
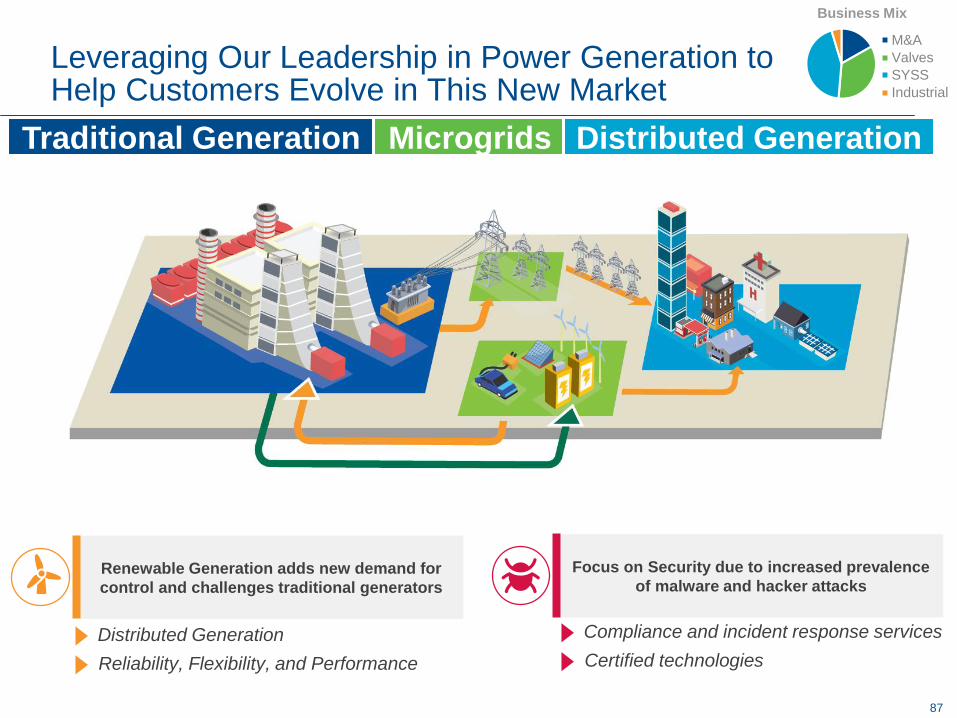
Leveraging Our Leadership in Power Generation to Help Customers Evolve in This New Market
Traditional Generation Microgrids Distributed Generation
Renewable Generation adds new demand for
control and challenges traditional generators
Distributed Generation
Reliability, Flexibility, and Performance
64%
27%
Focus on Security due to increased prevalence
of malware and hacker attacks
M&A
Valves
SYSS
Industrial
Business Mix
Compliance and incident response services
Certified technologies

88
Extending Reach of Control and Digital Services for the Power Industry
New Final Control
capabilities extend
connected services and
predictive maintenance
strategies to every valve
in a plant
$14B Power
Installed Base
Digital Walk
Down
Connected
Services
Mobile Service
Center
Inventory MachiningTesting
New Ovation Compact Controller extends
control to new applications in plant and beyond
Emerson offers complete Cybersecurity services supported by
Qualified Anti-Terrorism Technology (QATT) designated by
US Department of Homeland Security
High fidelity embedded
simulation for complete
plant optimization

89
Helping Life Sciences Customers Stay Aheadof New Market Trends
Secondary
Development Drug Substance Drug ProductProcess Development
& Clinical
Primary Packaging
64%
27%
Growing number and
complexity of regulations
Regulatory Approval & Traceability
Time to market pressure
in biosimilars and
generics
Technology Transfer
PROCESS
DEVELOPMENT
QUALITY
CONTROL
BIOREACTOR
BUFFER MEDIA
DISPENSING
PURIFICATION
ENCAPSULATION
SAMPLING
FILLING
QUALITY
CONTROL
TRANSFERS
PACKAGING
Demand for smaller
batches and modular
production
Single-Use Processing &Instrumentation
M&A
Valves
SYSS
Industrial
Business Mix

90
Delivering Innovative Sensors, Connected Controllers, and Consulting Services
Expanding hygienic instrument portfolio and launching new line of single-use sensors for next-gen biologics manufacturing
Growing World-Class Hygienic Portfolio
DeltaV Discovery
connects R&D to
production, speeding
up technology transfer
and manufacturing
scale up
PK Controller connects modular
operations for advanced control
$2B Life Sciences
Installed Base
Full Life Science operations consulting services to ensure
Operational Excellence and expedite FDA validation

91
Helping Packaging Customers Increase Speed and Systems Integration
Processing Packaging Logistics
Increased risk due to
speed of operations
Real-Time Insights
Faster restarts
Excess waste impacting
production costs
Precise filling
Effective sealing

92
Discrete Innovations Extend Our Portfolio of Intelligent Devices and Controls
$17B Discrete
Installed Base
G3 Gateway
ASCO G3 Fieldbus and 580 CHARMs
seamlessly integrate pneumatic control --
simplifying commissioning, improving
visual status and enhancing diagnostics
Quantum Cascade Laser quickly detects leaks and
rejects products with 100% accuracy at 600 packages
per minute, 3x faster than previous solutions

93
This Slide Intentionally Omitted

94
This Slide Intentionally Omitted

95
Automation Solutions2017 Summary & 2018 Guidance
2016 2017 2018E
Sales (GAAP) $9.0B $9.4B 18 – 20%
Underlying* 6 – 8%
EBIT $1.5B $1.5B
% of Sales 16.2% 16.2% 16-17%
ROTC 17% 14%
44%
23%
20%
5%8%
Asia
Europe
Latin AmericaNorth America
2017 Major Markets Served 2017 Sales by Geography
Middle East & Africa
19%
10%
14%
14%
10%
9%
12%
12%
Upstream
Oil & Gas
Refining
Power Chemical
Other
Midstream
Oil & Gas
Hybrid
Discrete

96
This Slide Intentionally Omitted

97
This Slide Intentionally Omitted

98
This Slide Intentionally Omitted

99

100

101
2018 Investor Conference
Final Control and V&C Integration Update
Ed Monser
President
February 15, 2018

102
2018 Investor Conference
Final Control and V&C Integration Update
Ed Monser
President
February 15, 2018

103
Final Control -- Key Messages
• Acquisition of Valves & Controls transforms Final Control into the biggest / broadest solutions provider and strengthens Automation Solutions
• Integration activities progressing to plan and building strong momentum
• Focused, early concentration on customer engagement resulting in accelerating order activity with many ‘combined portfolio’ wins
• Transitions to the Single Integrated Channel have been timely and seamless
• Manufacturing facility consolidation and restructuring programs underway, targeting 10 plant closures by the end of 2018
• $17+M of negotiated supply chain savings finalized in the first 180 days
• Product rationalization and positioning direction has been set; execution of the plan is underway -- excellent progress
• Operating Model Transformation (OMT) realignment completed in February 2018 -- 2nd quarter will be key

104
This Slide Intentionally Omitted

105
29%
22%
14%
13%
12%2%8%
22%
15%
12%
24%
15%4%8%
13%5%9%
40%
20%
6%7%
$1.4B
8%
64%
23%
5%
41%
30%
20%
9%
Portfolio and Market Diversification With Valves & Controls Strengthens our Global Presence
Business
Industry
Geography
Valves & Controls Final Control Combined
28%
31%
28%
10%
3%
51%
20%
12%12%
5%
41%
25%
19%
11%4%
North America
Asia Pacific
Europe
MEALatin America
North America
Asia Pacific
Europe
MEA
North America
Asia Pacific
Europe
MEALatin America
Upstream Oil & Gas
Other
Power
Chemical
Flow Controls
Isolation
Valves
Pressure Management
Actuation Technologies
Refining
Flow Controls
Isolation
Valves
Pressure Management
Actuation Technologies
2017 Sales $2.1B $3.5B
Midstream Oil & Gas
Upstream Oil & Gas
Other
Power
Chemical
Refining
Midstream Oil & Gas
Upstream Oil & Gas
Other
Power
Chemical
Refining
Midstream Oil & Gas
64%
6%
18%
12%
Flow Controls
Isolation
Valves
Pressure Management
Actuation Technologies
Latin America
Mining Mining Mining
Note: 2017 includes full year Valves & Controls impact.
106106
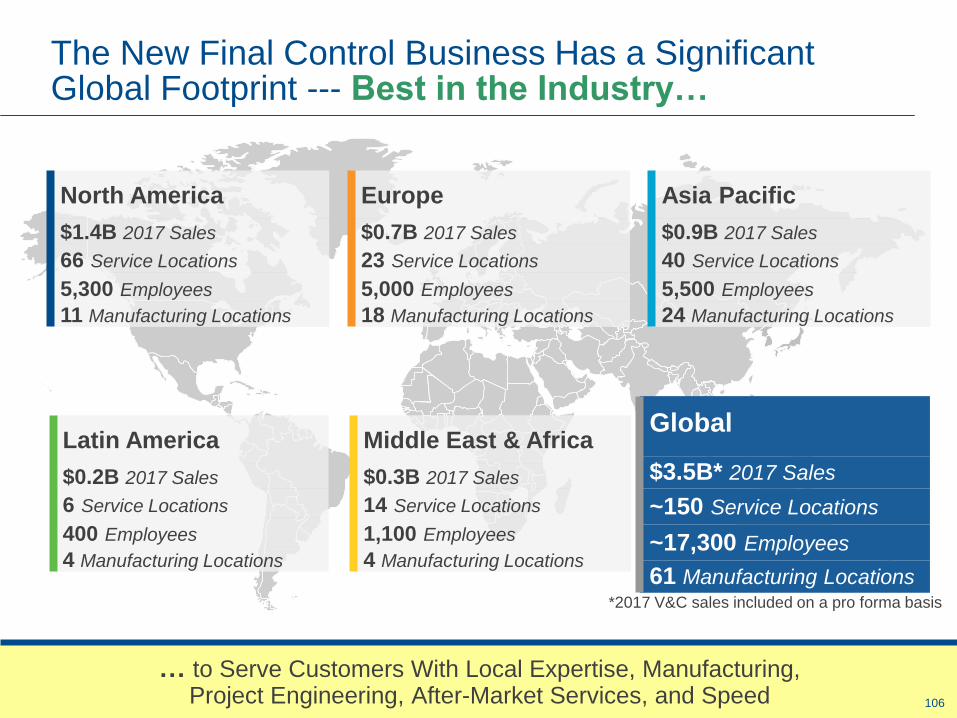
The New Final Control Business Has a Significant Global Footprint --- Best in the Industry…
… to Serve Customers With Local Expertise, Manufacturing, Project Engineering, After-Market Services, and Speed
Europe
$0.7B 2017 Sales
23 Service Locations
5,000 Employees
18 Manufacturing Locations
Asia Pacific
$0.9B 2017 Sales
40 Service Locations
5,500 Employees
24 Manufacturing Locations
Middle East & Africa
$0.3B 2017 Sales
14 Service Locations
1,100 Employees
4 Manufacturing Locations
Latin America
$0.2B 2017 Sales
6 Service Locations
400 Employees
4 Manufacturing Locations
North America
$1.4B 2017 Sales
66 Service Locations
5,300 Employees
11 Manufacturing Locations
Global
$3.5B* 2017 Sales
~150 Service Locations
~17,300 Employees
61 Manufacturing Locations*2017 V&C sales included on a pro forma basis

107
Flow Controls Pressure Management Isolation Valves Actuation Technologies
New Final Control Business Group Management Structure
Final ControlBusiness
Group
Business
Unit
Strategic
Product
Business
Unit
Impacted by V&C
2017 Sales - $1.5B 2017 Sales - $0.7B 2017 Sales - $1.0B 2017 Sales - $0.3B
Sliding Stem
Rotary
Engineered
Products
Instrumentation
Nuclear
Pressure
Relief
Industrial
Regulators
Natural Gas
Regulators
Safety
Relief
Ball
Triple
Offset
Butterfly
Gate /
Globe /
Check
Pneumatic
Electric
Gears
Hydraulic
Fisher Digital
Isolation
Automated
Isolation
Valves

108
This Slide Intentionally Omitted

109
Focused and Early Concentration on Customer Engagement Resulting in Accelerating Order Activity
(35%)
(30%)
(25%)
(20%)
(15%)
(10%)
(5%)
0%
5%
10%
15%
20%
25%
30%
11%
9%10%
Tra
iling 3
Mo
nth
Ord
ers
(%
Yo
Y)
@ F
ixe
d R
ate
Valves & Controls
Final Control Base
Final Control Proforma
Acquisition Announced
August 18, 2016
Acquisition Closed
April 28, 2017
*Note: Adjusted to exclude impact of sales channel returns
Trailing 3 Month Order Rates vs. Prior Year
Oct* Nov Dec
Final Control Base 18% 18% 11%
Valves & Controls Proforma 1% 1% 9%
Final Control Proforma 11% 11% 10%

110
Key Growth Programs Will Drive $200M in Incremental Growth by 2020; $70M+ Will Be Realized in 2018
Strategic Accounts
Fisher Digital Isolation™
Automated Isolation
Valves
Industry Focus Automated Valves Lifecycle Services
• Fully Engineered &
Integrated
• Factory Configured and
Tested
$40B Installed Base
North America
Asia
Europe
Middle East
& Africa
Latin America
$16B
$10B
$7B
$4B
$3B
Valves & Controls
Emerson

111
Challenge
• Customer needed strong
technical and engineering
support for large, complex
project
Solution
• Cross-functional teams utilized
to closely engage with customer
• Full Final Control engagement
to shorten decision process
Challenge
• Complex project with expedited
delivery schedule
Solution
• Engaged at Front-End
Engineering & Design as Main
Instrument Vendor
• Applied unrivalled application
expertise for critical valve
specification and design
PEMEX
Abkatun-A2 Offshore Platform
$9MEmerson Value
Early Project Engagement as Main Valve Partner Is Delivering Schedule & Cost Improvementsfor Customers
Hengli Group
Hengli Refinery and Ethylene Project
Petrochemical
$18MEmerson ValueChinaMexico
Final Control Portfolio Participation
Control Valves Isolation Valves
Pressure Relief Actuators
Final Control Portfolio Participation
Control Valves Isolation Valves
Pressure Relief Actuators
Upstream O&G Refining

112
Combined Cycle Power Plant
Asheville Project
Power
$6MEmerson Value
Challenge
• Extreme conditions and
specialized applications for a
plant expansion
Solution
• Offered unparalleled portfolio
• Applied unrivalled application
expertise for critical valve
specification and design
Final Control Expertise as an Operational Partner Is Delivering Lower Total Cost of Ownership &Improved Productivity
Petrochemical Customer
Jubail Chemical Plant
Chemical
$2MEmerson Value
Challenge
• Reduce costs and procurement
complexity, and simplify
maintenance for improved
operating performance
Solution
• Broad portfolio of service
offerings with embedded service
personnel and local presence
USA Saudi Arabia
Service Agreement
Connected Services
QuickShip
Final Control Portfolio Participation
Control Valves Isolation Valves
Turbine Bypass Actuators
Final Control Portfolio Participation

113
This Slide Intentionally Omitted

114
This Slide Intentionally Omitted

115
Supply Chain Programs Will Deliver $30M in Cost Savings by 2020
95+%
4,600+ (25%)$17+M
400+
$30M
Castings
Machined Parts
Indirect
$12M-$20M
Savings Realized
Supplier
Negotiations in
First 180 Days
Savings Potential Identified
60 Global Leaders Trained
Supply Chain
Regionalization by
2020
Expanding capacity in Toluca, Mexico to
support North America plants on
machined parts
Regional foundry development and 3D
printed sand molds for D-part castings
Implementing spend visibility tools to
accelerate cross-BU tensioning
in Net Material Inflation by 2020
Suppliers
Reduced
by 2020
Before Deal Closure…
420 Projects Identified

116
This Slide Intentionally Omitted

117
Regional
DecisionsProject Management/Manufacturing/
Support
OMT¹ Realignment Will Drive Service Level Improvements While Reducing Inventory
Centralized
Decisions
Principal Entity (HQ)
Sales
Project
ManagementManufacturing
Support
Functions
¹ Operating Model Transformation
² On-Time to Request Date Service Levels
Customer
Valves & Controls
OMT ModelEmerson
Model
OMT Performance Metrics
RDSL² ~65%
Inventory Turnover ~1.9
Past-Due Receivables ~38%
Emerson Target Metrics
RDSL² >95%
Inventory Turnover >5.0
Past-Due Receivables <15%
1) Elimination of barriers to communication
2) Increased customer visibility
3) Reduced transactional complexity
4) Regional decision making
Customer
Management (HQ)
Sales

118
This Slide Intentionally Omitted

119119
Final Control -- Summary
Final Control Will Drive Value Creation for Our Global Customers
• Acquisition of Valves & Controls transforms Final Control and broadens Automation Solutions
– One global manufacturer supplying and servicing all valves everywhere;
– Global #1 player, with 16%+ served market participation and $5B in sales by 2022
• Rapid organic growth driven by enhancing our relevance – Connecting To Customersto capture investment waves
– Strategic direction focused on Problem Solving enabling customers to achieve Top Quartile Performance in both operational and project environments
– Simplifying and elevating customer interactions through a Single Integrated Channel
• Technology Leadership position to separate from the competition
– Electric actuation remains a priority for accelerated investment
• Lifecycle Management of the $40B global installed base to build loyalty and drive sustained growth through traditional and outcome-based service models
• Perfect Execution focus to drive regionalization and supply chain speed resulting in superior operating margin and cash flow generation

120
We Are the Main Valve Partner Helping Customers Achieve Top Quartile Performance
Category Leading ProductsTechnology
Leadership
Top Quartile
Performance
Problem Solving
Trusted
Advisor
Main Valve Partner
New Final Control
• Project
Certainty
• Operational
Certainty
• Build in Optimized Solutions at
Front-End Engineering &
Design
• Project Execution Expertise
• Single Partner Accountability
Flow Controls
Isolation Valves
Pressure Management
Actuation
Technologies
Brand, Breadth, and Service
Condition MonitoringUptime &
Reliability

121

122

123
2018 Investor Conference Commercial & Residential Solutions Business Overview
Bob Sharp
Executive President
February 15, 2018

124
2018 Investor Conference Commercial & Residential Solutions Business Overview
Bob Sharp
Executive President
February 15, 2018

125
Commercial & Residential Solutions2017 Summary
2016 2017
2016 – 2017
Change
Sales $5.2B $5.6B 6%
EBIT $1.3B $1.3B 7%
% of Sales 24.0% 24.2% +20 bps
ROTC 48% 52%
2017 Sales by Market 2017 Sales by Geography
62%19%
10%
4%5%
US &
Canada
Asia
Europe
L. AmericaMiddle East & Africa
49%
30%
21%
CommercialResidential
Cold Chain
* All Figures are Excluding Closetmaid

126126
Commercial & Residential SolutionsKey Messages
• Commercial & Residential Solutions is uniquely positioned in an attractive market
that consistently delivers ~3% underlying through-the-cycle growth
• Our platform is built upon franchise businesses that serve as industry stewards,
essential attributes that have enabled a long-term proven record of value creation
• Our significant market positions get challenged, but we have managed these
challenges for decades. In addition, several major new programs provide the
foundation for incremental above-market growth and value creation.
• New areas of focus have expanded our addressable market by $8B, to $39B. And we
are working additional internal and acquisition opportunities in Electronics and
Professional Tools areas to further increase our served space.
• With our broad product portfolio, we have a differentiated position from which to
deliver solutions and act as a technology partner to our customers
• Traction over the past ~18 months has been very solid: We achieved 6.1%
underlying sales* growth in 2017, and expect 4-6% growth in 2018
We Are Committed to Delivering Sustained Above-Market Sales Growth While Maintaining Record Profit Margins and Asset Management for
Continued Value Creation

127127
Served Market Showing Steady Growth, With Attractive Market Drivers to Leverage
Expect 2018 Total Commercial & Residential Global Market up 3% to 5% --Commercial & Residential Solutions Underlying Sales* Expected To Be up 4% to 6%
Cold Chain
Residential
Commercial
2018 2018-2021Commercial
Refrigeration
DOE & EPA regulations drive redesigns &
food monitoring, Cold Chain expansion
Food Retail Energy reduction, food quality, new formats
Transport Asia rail, truck & trailer, container recovery
2018 2018-2021
Residential AC Solid fundamentals; summer weather key
Home
Improvements
Consumer confidence, equipment
investment, improvement & repair projects
Residential
ConstructionNew construction & private spending
2018 2018-2021
Commercial AC New efficiency standards
Global Heating China coal to heat pump conversion
Non-Residential
Construction
Non residential fixed investment & growth
in strategic building segments
Market Drivers

128
Several Key Programs to Address Our Core Opportunities
Protecting Food
Quality &
Sustainability
Keeping food fresh across
the cold chain while lowering
cost and improving customer
experience
✓ Temperature Management
✓ Facility/Asset Monitoring
✓ Integrated Solutions
Ensuring Human
Comfort & Health
Transforming homes with
comfort, efficiency and
connectivity solutions
✓ Heat Pumps Solutions
✓ Sensi Thermostats
✓ Sensi Monitoring
Advancing Energy
Efficiency
Enabling high-performance,
comfortable and controllable
workplace environments
✓Modulation & Control
✓ Dehumidification
✓ Building Management
Creating Sustainable
Infrastructure
Food waste management
solutions for home,
businesses and
communities
✓ Disposer Adoption
✓Grind2Energy
Key Programs

129
This Slide Intentionally Omitted

130
This Slide Intentionally Omitted

131
DataManagementConverts raw data to information and develops actionable insights
ControlPerforms action on raw data
Devices / Instruments / SensorsGenerates raw data
Compressors
Ref SystemsGas Valves
Loggers
Fans
Disposers Pressing
Pipe Tools
Compressor
Controls
Thermostats
Drives Ref
Controls
AC
Controls
Multiple
Thermostats
Grind2Energy Data Mgmt
Cargo & Remote Monitoring
Building Mgmt
ContractorResidential Commercial Cold Chain131
Moving Up the Technology Pyramid Utilizing Intelligent Devices, Controls and Software Across the Platform
Integrated &
Optimized
Solutions
Temp Monitoring

132
This Slide Intentionally Omitted

133
This Slide Intentionally Omitted

134134
Our Domain Knowledge, Product Strength and Solutions Capability Enable Us to Serve as an Industry Steward
We Are Leveraging Expertise, Relationships, and Capabilities for Solutions,Even in the Most Competitive Global Markets
PRODUCT
Core component and
application specific
solutions
OEM / CHANNEL
Traditional Relationship
Participating with industry
associations to make
recommendations on policy
and regulations
STANDARD BODIES
Providing technical
training for installation
and ongoing service
CONTRACTOR
Understanding needs
and supporting
ease of use
END USER
Increased Engagement

135135

136
Keeping Food Fresh Throughout the Cold Chain
Food Quality and Safety
Solutions Across the Cold Chain

137
End-to-End Cold Chain Solutions Offer a Significant Opportunity to Protect Food Quality & Safety
Harvest Processing Transportation Distribution End-Users
Compressors &
Refrigeration Systems
Industrial Refrigeration
Controls
Loggers & Trackers
Temperature
Management
ProAct Services
Project Management 137

138138
We Are Focused on Integrated Solutions at Each Node and Across the Cold Chain
Cold Chain Teams Organized Around Food Retail, Food Service, Industrial, Transportation and Distribution. 2x Larger Than Next Participant in an $8B Served
Portion of Global Market With Several Opportunities to Expand.
Harvest Processing Transportation Distribution End-Users
Pre-cool products
prior to shipment
Production of food
products
Reduce product
loss & monitor
food safety
Ensure food
quality & maintain
freshness
Deliver fresh
products & energy
savings
Refrigeration for
storage facilities &
warehouses
Fixed monitoring
on-site
Mobile monitoring
for cargo from field
forward
Refrigeration for
food process cooling
& cold storage
Fixed monitoring
with data analytics &
recording keeping
HVAC solutions
Refrigeration &
monitoring for
containers & trailers
Container fleet asset
management &
maintenance
Mobile monitoring
for cargo through the
supply chain
Refrigeration for cold
rooms &
warehouses
Fixed monitoring
with data analytics
HVAC solutions
Refrigeration for
point of sale
providers
Fixed & remote
monitoring with data
analytics & record
keeping, predictive
maintenance
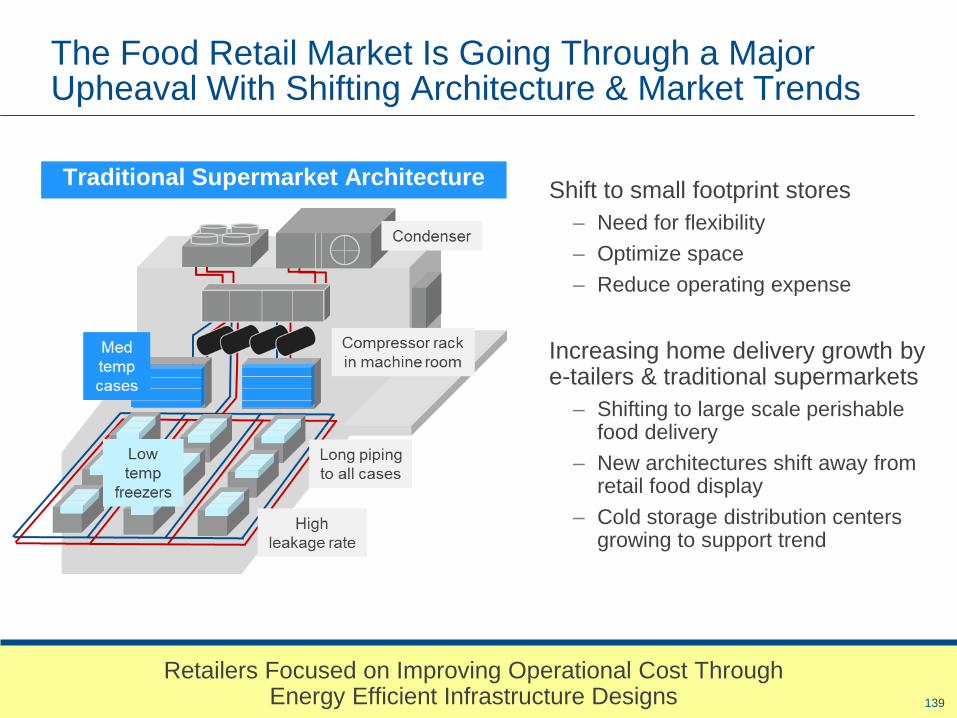
139139
The Food Retail Market Is Going Through a Major Upheaval With Shifting Architecture & Market Trends
Traditional Supermarket ArchitectureShift to small footprint stores
– Need for flexibility
– Optimize space
– Reduce operating expense
Increasing home delivery growth by e-tailers & traditional supermarkets
– Shifting to large scale perishable food delivery
– New architectures shift away from retail food display
– Cold storage distribution centers growing to support trend
Retailers Focused on Improving Operational Cost Through Energy Efficient Infrastructure Designs

140
We Have Solutions to Support New Food Retail Architectures and Business Models
Small-Format Architecture E-Commerce Models
Integrated Solutions for
Refrigeration Case Manufacturers
New Staging
Infrastructure for
Click & Collect
Supermarket
New Cold Chain
Space in Traditional
Distribution Centers

141
Convenience Stores & Restaurants Continue to Expand Fresh Food Offering, Requiring New Solutions
Food Quality,
Energy Efficiency
and Consistency
are Critical to
Success and
Brand Equity
Packaged Controls
Building Controls
ProAct SoftwareServices, SolutionsSensi
Transformative Wave
Temperature Monitoring Cargo Solutions
Secure Connection to
Corporate Offices
HVAC Food Service Building Management Systems Cargo
Monitoring

142
This Slide Intentionally Omitted

143
This Slide Intentionally Omitted

144
Cooper-Atkins Further Expands Our Connected Solutions for the Cold Chain
Cargo
Monitoring
Food
Monitoring

145145

146
Bringing Comfort And Convenience to Homes as Part of The Critical Infrastructure
Compressors,
Drives & Controls
Gas Valves &
Heating Controls
Smart Thermostats
Sensi
Monitoring
FansAir Quality
Sensors
Disposers & Hot
Water Dispensers

147
This Slide Intentionally Omitted

148
This Slide Intentionally Omitted

149
This Slide Intentionally Omitted

150150
Variable Speed Market Dynamics Vary by Region, and We Address With Local Presence
Competitive Variable Speed Offering in All Regions
Delivering integrated variable speed
solutions to strategic and small OEMs
Differentiation for specialty applications
Europe
Variable speed key for penetrating the heat
pump space due to efficiency requirements
Emerson heating & electronic solutions
differentiate
North America
Delivering variable speed solutions to
multiple OEMs
Continues to be a niche market due to
contractor reluctance & price level
Compressor
Drive
Asia

151
This Slide Intentionally Omitted

152
This Slide Intentionally Omitted

153153

154
Enabling High Performance Commercial Buildings as Part of the Critical Infrastructure
Dehumidification
Compressors &
Controls
Rooftop Unit
Drives
HVAC
Monitoring &
DiagnosticsMultiple
Thermostat
Manager

155
Integrated Solution
System Level Solution
Tech
no
log
y In
teg
rati
on
Building
Solution
Building
Management
& System
Supervisor
Integrated HVAC Solutions Deliver Additional Value & Efficiency to Commercial Buildings
End User Value
Compressor
Compressor + Drive

156
This Slide Intentionally Omitted

157
This Slide Intentionally Omitted
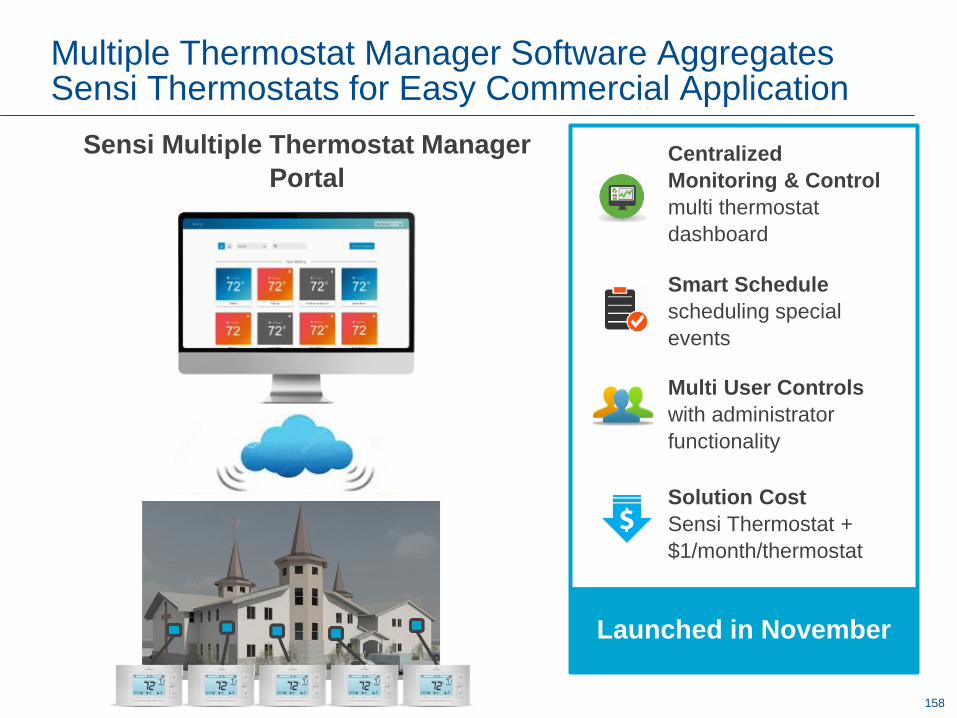
158
Multiple Thermostat Manager Software Aggregates Sensi Thermostats for Easy Commercial Application
Centralized
Monitoring & Control
multi thermostat
dashboard
Smart Schedule
scheduling special
events
Multi User Controls
with administrator
functionality
Solution Cost
Sensi Thermostat +
$1/month/thermostat
Sensi Multiple Thermostat Manager
Portal
Launched in November

159
This Slide Intentionally Omitted

160160
Rural
Coal Boiler
China Heat Pump Offering Now Includes Commercial Applications, a Significant Market Expansion
District, Industrial and Sanitary Heating Market Will Continue to Drive China Heating
Municipal
Heating
District
Heating
Gas Heating
Urban
Coal Boiler
Industrial
Heating
Sanitary
Heating
Residential
Heating
District
Heating
Residential & District Heating Additional Heating Applications
1M Heat Pumps Installed
Annually in China

161161
Our Connection With Contractors Extends Into Professional Tools
Professional Contractor Relationships Are a Key Driver of Brand Strength, Helping Balance Relationships With OEMs and Retail Channel Partners
PRODUCT
Core component and
application specific
solutions
OEM / CHANNEL
Participating with industry
associations to make
recommendations on policy
and regulations
STANDARD BODIES
Providing technical
training for installation
and ongoing service
CONTRACTOR
Understanding needs
and supporting
ease of use
END USER
Touch 1.7M Contractors
3.5K Distributor Relationships
50K Locations to Buy

162
This Slide Intentionally Omitted

163
This Slide Intentionally Omitted

164
Business Development Focus Areas Across Our End Markets
• Home HVAC
and Critical
Infrastructure
Monitoring
• Smart Fans
• Indoor Air Quality
• Modulating
Compressors
• Liquid Desiccant
Dehumidification
• Transformative
Wave
• Small & Medium
BMS
• New Compression
• Grind2Energy
• Industrial
Refrigeration
Solutions
• Expanded Cold
Chain Services
• Non-food Cold
Chain Solutions
• Test &
Measurement
Solutions
• RIDGID Connect
• Contractor Tools
and Enriched Data
• E-Commerce
From
2017
Plus• Asia & Europe
Heat Pumps
• Modulating and
Variable Speed
Compressors
• Portable
Temperature
Monitoring
• Refrigeration
Joining
Energy
Efficient
Commercial
Buildings
Residential
Home Comfort
Food Quality &
Safety Across
the Cold Chain
Efficient
Contractors
FROM 2017 INVESTOR MEETING
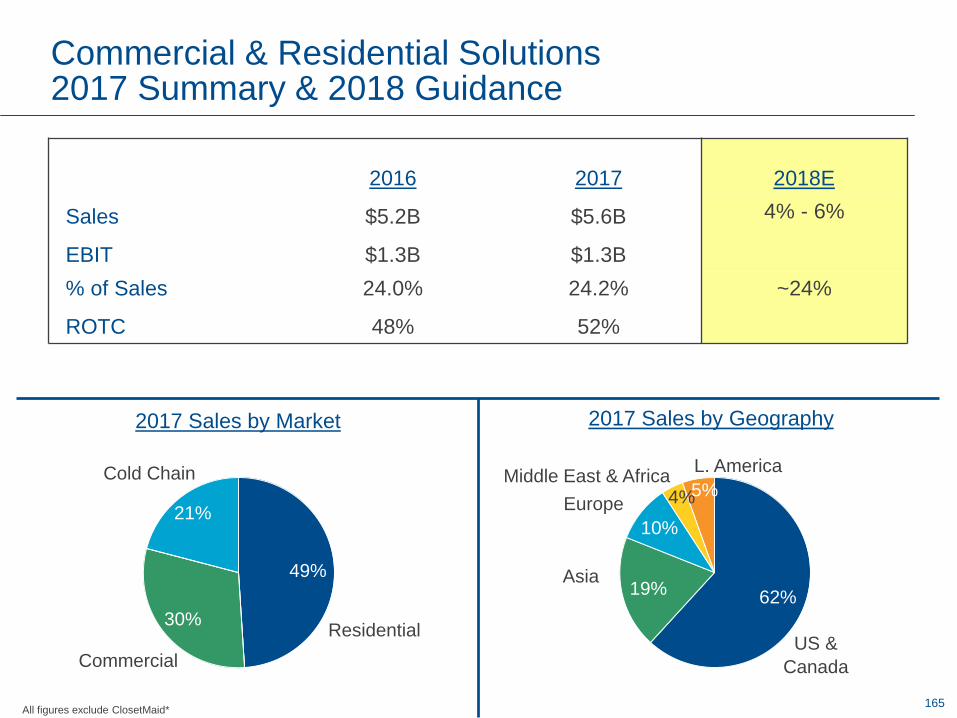
165
Commercial & Residential Solutions2017 Summary & 2018 Guidance
2016 2017 2018E
Sales $5.2B $5.6B 4% - 6%
EBIT $1.3B $1.3B
% of Sales 24.0% 24.2% ~24%
ROTC 48% 52%
2017 Sales by Geography
62%19%
10%
4%5%
US &
Canada
Asia
Europe
L. AmericaMiddle East & Africa
2017 Sales by Market
49%
30%
21%
Commercial
Residential
Cold Chain
All figures exclude ClosetMaid*

166
This Slide Intentionally Omitted

167

168

169
Reconciliation of Non-GAAP Measures
In this presentation non-GAAP measures (denoted with an *) are used when talking about the Company's performance,
and a reconciliation of those measures to the most comparable GAAP measures is contained below.
($ in billions, except per share amounts or where noted)

170
Reconciliation of Non-GAAP Measures
In this presentation non-GAAP measures (denoted with an *) are used when talking about the Company's performance,
and a reconciliation of those measures to the most comparable GAAP measures is contained below.
($ in billions, except per share amounts or where noted)
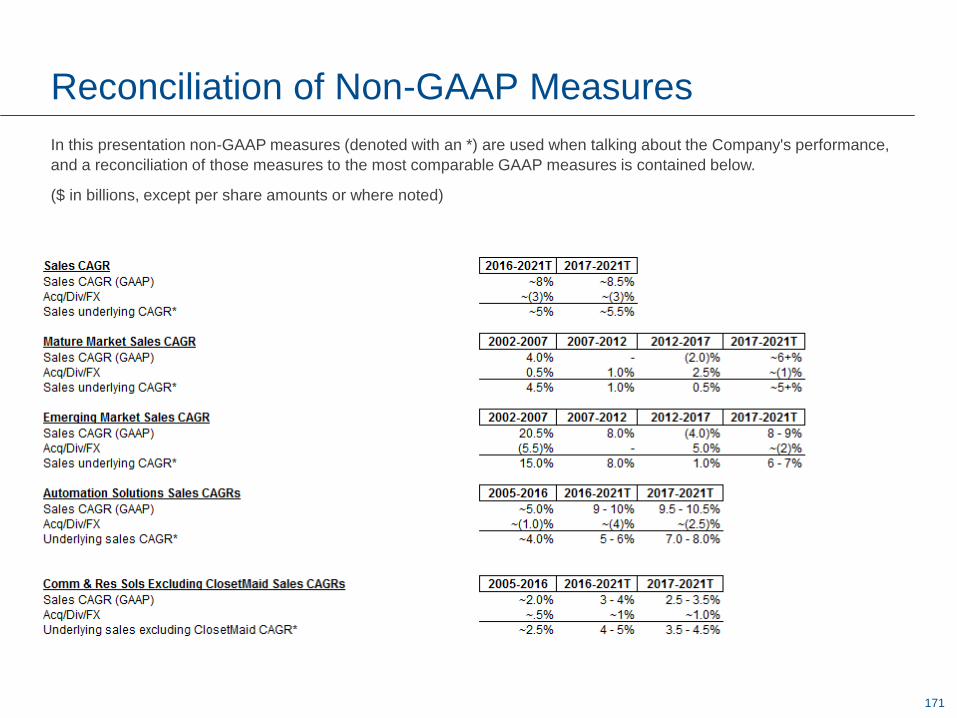
171
Reconciliation of Non-GAAP Measures
In this presentation non-GAAP measures (denoted with an *) are used when talking about the Company's performance,
and a reconciliation of those measures to the most comparable GAAP measures is contained below.
($ in billions, except per share amounts or where noted)

172
Reconciliation of Non-GAAP Measures
In this presentation non-GAAP measures (denoted with an *) are used when talking about the Company's performance,
and a reconciliation of those measures to the most comparable GAAP measures is contained below.
($ in billions, except per share amounts or where noted)

173
Reconciliation of Non-GAAP Measures
In this presentation non-GAAP measures (denoted with an *) are used when talking about the Company's performance,
and a reconciliation of those measures to the most comparable GAAP measures is contained below.
($ in billions, except per share amounts or where noted)

174
Reconciliation of Non-GAAP Measures
In this presentation non-GAAP measures (denoted with an *) are used when talking about the Company's performance,
and a reconciliation of those measures to the most comparable GAAP measures is contained below.
($ in billions, except per share amounts or where noted)

175
Reconciliation of Non-GAAP Measures
In this presentation non-GAAP measures (denoted with an *) are used when talking about the Company's performance,
and a reconciliation of those measures to the most comparable GAAP measures is contained below.
($ in billions, except per share amounts or where noted)

176
Reconciliation of Non-GAAP Measures
In this presentation non-GAAP measures (denoted with an *) are used when talking about the Company's performance,
and a reconciliation of those measures to the most comparable GAAP measures is contained below.
($ in billions, except per share amounts or where noted)

177
Reconciliation of Non-GAAP Measures
In this presentation non-GAAP measures (denoted with an *) are used when talking about the Company's performance,
and a reconciliation of those measures to the most comparable GAAP measures is contained below.
($ in billions, except per share amounts or where noted)

178
Trademark Ownership Statement
Amazon, Amazon Echo, Comcast, Apple, Samsung, Samsung SmartThings, Alarm.com, ADT, Vivint, Nest,
Honeywell, Ecobee, USA Today, Homekit, Wink, GoogleHome, Goodman, Johnson Controls, Siemens,
Schneider Electric, Viega, Shell, Chevron, Pemex, Saudi Aramco, BASF, Dow, bhpbilliton, Bayer, and their
related designs and logotypes used within this presentation are the trademarks, service marks and/or
trade names of their respective owners, and are not owned by or affiliated with Emerson.