2018 interim result - p-airnz.com · period gain and impact of fuel ... assumes average jet fuel...
TRANSCRIPT

2018 INTERIM RESULT
Forward looking statements
2
This presentation contains forward-looking statements. Forward-looking statements often include words such as “anticipate", "expect", "intend", "plan", "believe”, “continue” or similar words in connection with discussions of future operating or financial performance.
The forward-looking statements are based on management's and directors’ current expectations and assumptions regarding Air New Zealand’s businesses and performance, the economy and other future conditions, circumstances and results. As with any projection or forecast, forward-looking statements are inherently susceptible to uncertainty and changes in circumstances. Air New Zealand’s actual results may vary materially from those expressed or implied in its forward-looking statements.
The Company, its directors, employees and/or shareholders shall have no liability whatsoever to any person for any loss arising from this presentation or any information supplied in connection with it. The Company is under no obligation to update this presentation or the information contained in it after it has been released.
Nothing in this presentation constitutes financial, legal, tax or other advice.

2018 INTERIM RESULT
Christopher LuxonChief Executive Officer
2018 INTERIM RESULT
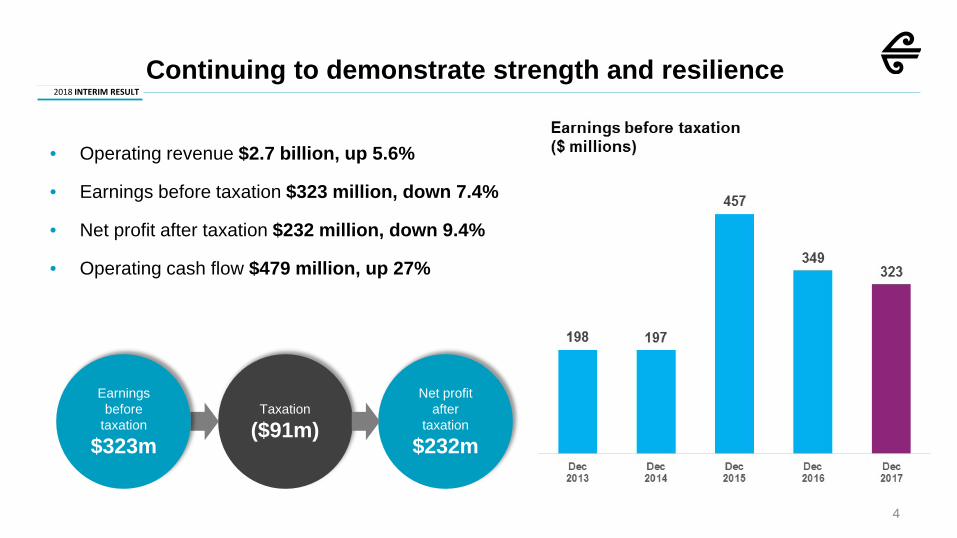
• Operating revenue $2.7 billion, up 5.6%
• Earnings before taxation $323 million, down 7.4%
• Net profit after taxation $232 million, down 9.4%
• Operating cash flow $479 million, up 27%
4
Taxation
($91m)
Net profitafter
taxation
$232m
Earnings before
taxation
$323m
Continuing to demonstrate strength and resilience
2018 INTERIM RESULT
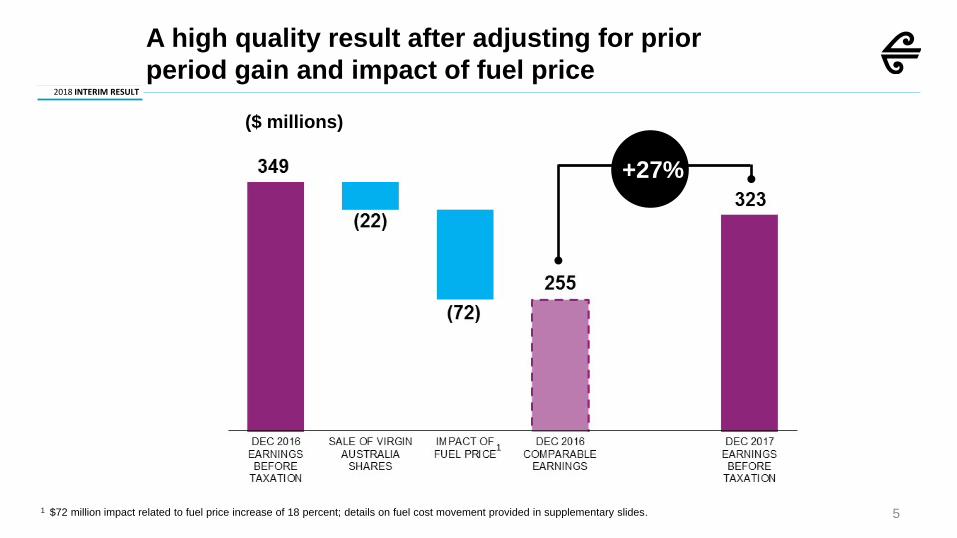
A high quality result after adjusting for prior period gain and impact of fuel price
+27%
1 $72 million impact related to fuel price increase of 18 percent; details on fuel cost movement provided in supplementary slides.
1
($ millions)
5
2018 INTERIM RESULT
6
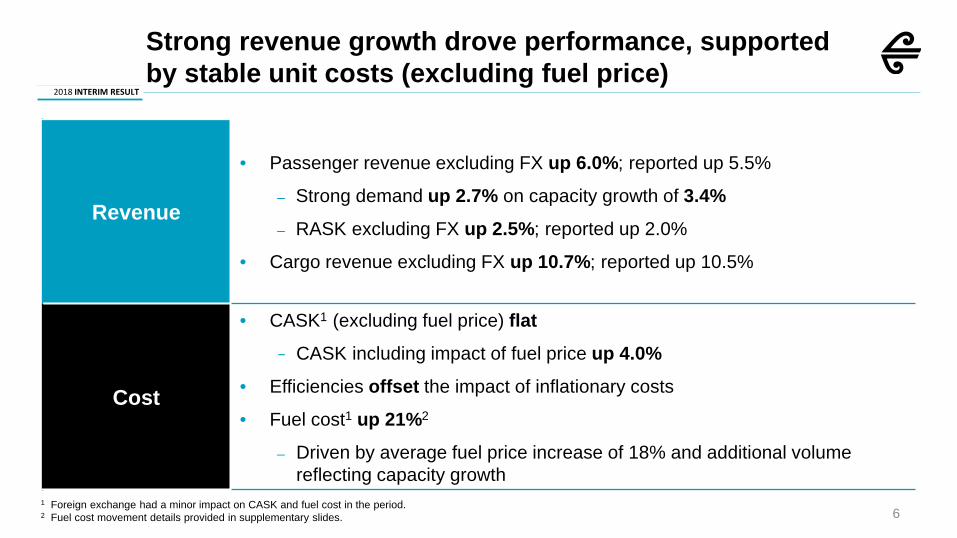
Revenue
• Passenger revenue excluding FX up 6.0%; reported up 5.5%
– Strong demand up 2.7% on capacity growth of 3.4%– RASK excluding FX up 2.5%; reported up 2.0%
• Cargo revenue excluding FX up 10.7%; reported up 10.5%
Cost
• CASK1 (excluding fuel price) flat− CASK including impact of fuel price up 4.0%
• Efficiencies offset the impact of inflationary costs
• Fuel cost1 up 21%2
– Driven by average fuel price increase of 18% and additional volume reflecting capacity growth
Strong revenue growth drove performance, supported by stable unit costs (excluding fuel price)
1 Foreign exchange had a minor impact on CASK and fuel cost in the period.2 Fuel cost movement details provided in supplementary slides.
2018 INTERIM RESULT
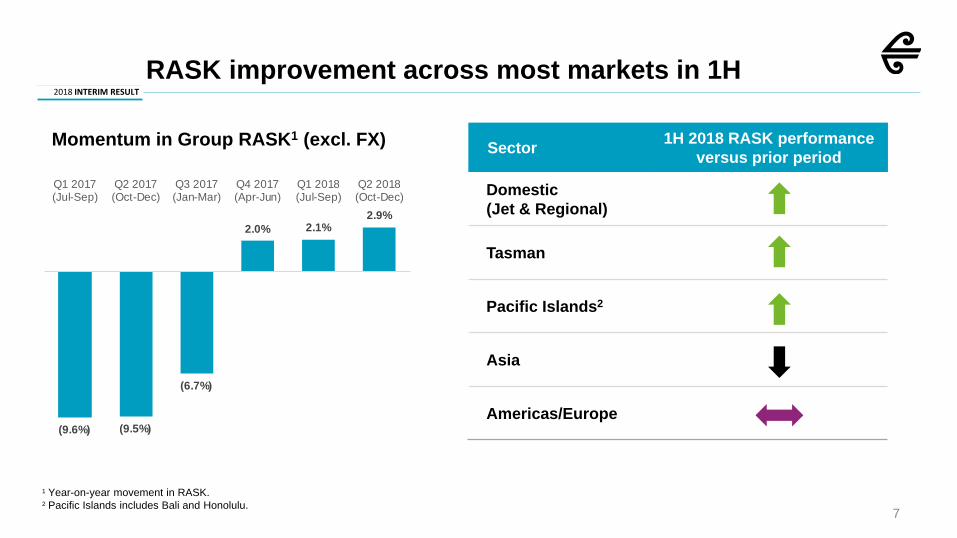
RASK improvement across most markets in 1H
Sector 1H 2018 RASK performance versus prior period
Domestic (Jet & Regional)
Tasman
Pacific Islands2
Asia
Americas/Europe
1 Year-on-year movement in RASK.2 Pacific Islands includes Bali and Honolulu.
7
Momentum in Group RASK1 (excl. FX)
(9.6%) (9.5%)
(6.7%)
2.0% 2.1%2.9%
Q1 2017(Jul-Sep)
Q2 2017(Oct-Dec)
Q3 2017(Jan-Mar)
Q4 2017(Apr-Jun)
Q1 2018(Jul-Sep)
Q2 2018(Oct-Dec)

2018 INTERIM RESULT
Rob McDonaldChief Financial Officer

2018 INTERIM RESULT
Changes in profitability
9
~$22 million related to increased capacity
1 Fuel cost movement details provided in supplementary slides.

2018 INTERIM RESULT
10
• CASK increased 4.0%, driven by fuel price increases of 18%− CASK (excluding fuel price) was flat
• $33 million of efficiencies from cost saving initiatives and economies of scale offset inflation• FX movement had no net impact on CASK
* Operating expenditure per ASK.
CASK* excluding fuel price remained flat, as efficiencies offset price increases
CASK (ex fuel price & FX)
flat 9.168.81 0.19
(0.18)
0.34
7
8
9
10
DEC 2016CASK
PRICE ECONOMIES OF SCALEAND EFFICIENCIES
FUEL PRICE DEC 2017CASK
CAS
K (c
ents
)

2018 INTERIM RESULT
11
• Strong volume growth in the period related to: – Improved loads on Tasman and Pacific Islands routes– Increased capacity on Haneda Airport (Tokyo)– Improved cargo capability out of Los Angeles
• Yield improvements driven by:– Higher value product mix
Cargo momentum also robust
Volumeup 9.0%
Yieldup 1.7%
Revenueup
10.7%*
* Reported Cargo revenue increased 10.5%, inclusive of foreign exchange impact.

2018 INTERIM RESULT
12
• Operating cash flow $479 million, up 27%, reflecting:
− Increase in cash operating earnings
− Strong working capital cash flow as the business grows
− Lower provisional taxes paid due to transitional impact of legislative tax changes for engine maintenance
• Cash on hand of $1.3 billion, down 2.1% from June 2017
Strong growth in operating cash flows
300
378
541
376
479
Dec2013
Dec2014
Dec2015
Dec2016
Dec2017
Operating cash flow ($ millions)

2018 INTERIM RESULT
13
• Target cash level re-examined− Previously managed liquidity within $1.0 to $1.5
billion target − Equated to a ratio of 20% to 30%; the reported
ratio included ~$150 million of restricted cash− Divestment in Virgin Australia shareholding
requires smaller cash requirement
Targeting liquidity of $700m to $1b going forward
• New liquidity range of $700 million to $1 billion− Transition to cash target will occur over time− Primary mechanism to achieve cash target will be
purchasing aircraft− No expected impact to gearing, as net debt level would
remain− Liquidity ratio going forward will exclude restricted
cash. The new liquidity ratio will equate to 14% to 20%
Prior range: 20% to 30%
29.9% 29.2% 29.7%
36.0%30.0%
0%
10%
20%
30%
40%
2013 2014 2015 2016 2017Financial year
Historical liquidity ratio
2018 INTERIM RESULT
14
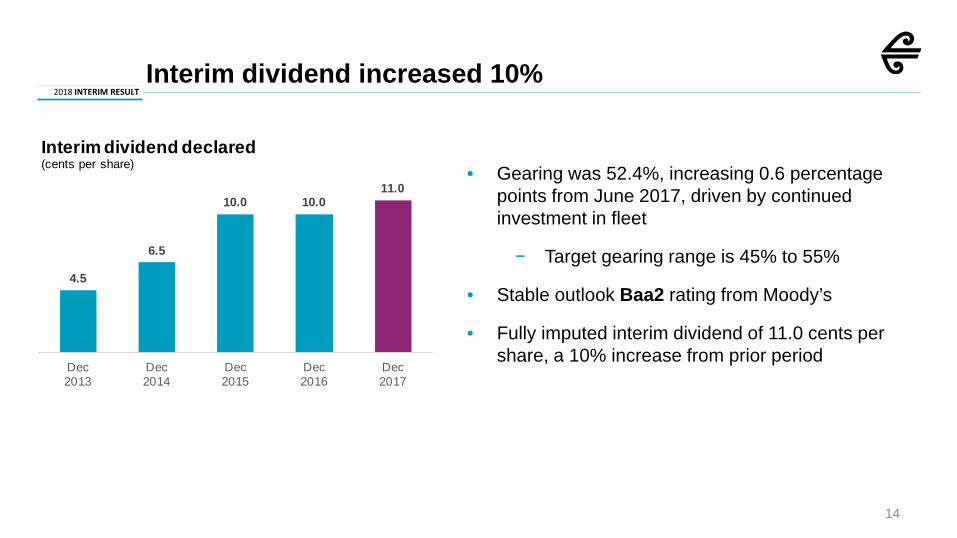
• Gearing was 52.4%, increasing 0.6 percentage points from June 2017, driven by continued investment in fleet
− Target gearing range is 45% to 55%
• Stable outlook Baa2 rating from Moody’s
• Fully imputed interim dividend of 11.0 cents per share, a 10% increase from prior period
Interim dividend increased 10%
4.5
6.5
10.0 10.011.0
Dec2013
Dec2014
Dec2015
Dec2016
Dec2017
Interim dividend declared(cents per share)
2018 INTERIM RESULT
15
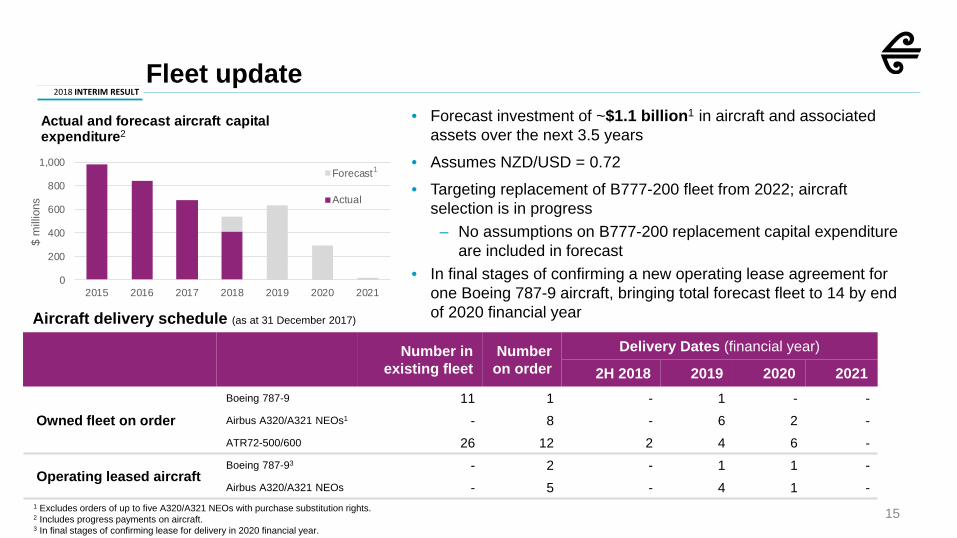
• Forecast investment of ~$1.1 billion1 in aircraft and associated assets over the next 3.5 years
• Assumes NZD/USD = 0.72• Targeting replacement of B777-200 fleet from 2022; aircraft
selection is in progress– No assumptions on B777-200 replacement capital expenditure
are included in forecast• In final stages of confirming a new operating lease agreement for
one Boeing 787-9 aircraft, bringing total forecast fleet to 14 by end of 2020 financial year
1 Excludes orders of up to five A320/A321 NEOs with purchase substitution rights.2 Includes progress payments on aircraft.3 In final stages of confirming lease for delivery in 2020 financial year.
Aircraft delivery schedule (as at 31 December 2017)
Number in existing fleet
Number on order
Delivery Dates (financial year)
2H 2018 2019 2020 2021
Owned fleet on orderBoeing 787-9 11 1 - 1 - -Airbus A320/A321 NEOs1 - 8 - 6 2 -ATR72-500/600 26 12 2 4 6 -
Operating leased aircraftBoeing 787-93 - 2 - 1 1 -Airbus A320/A321 NEOs - 5 - 4 1 -
Fleet update
0
200
400
600
800
1,000
2015 2016 2017 2018 2019 2020 2021
$ m
illio
ns
Actual and forecast aircraft capital expenditure2
Forecast
Actual
1
2018 INTERIM RESULT
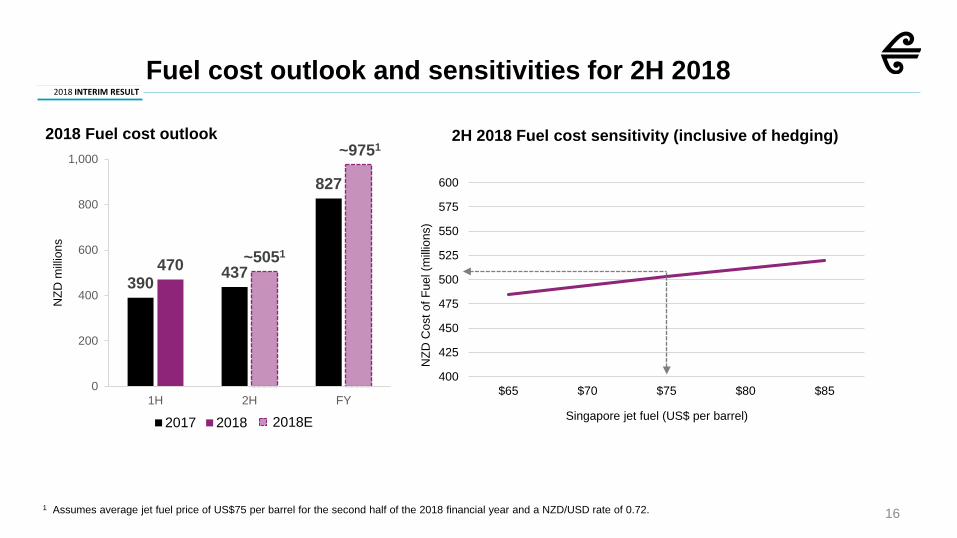
161 Assumes average jet fuel price of US$75 per barrel for the second half of the 2018 financial year and a NZD/USD rate of 0.72.
Fuel cost outlook and sensitivities for 2H 2018
390 437
827
470 ~5051
~9751
0
200
400
600
800
1,000
1H 2H FY
NZD
milli
ons
2018 Fuel cost outlook
2017 2018 2018E
2H 2018 Fuel cost sensitivity (inclusive of hedging)
400
425
450
475
500
525
550
575
600
$65 $70 $75 $80 $85
NZD
Cos
t of F
uel (
milli
ons)
Singapore jet fuel (US$ per barrel)

2018 INTERIM RESULT
Christopher LuxonChief Executive Officer

2018 INTERIM RESULT
Continued strength in short-haul markets drivingtargeted growth opportunities in 2H 2018
• Positive market dynamics following competitor exit from AKL-SYD
• Additional competitor capacity reductions in Melbourne and Brisbane in 2H expected to drive continued strength Targeted capacity growth in 2HWide-body flying on key routes driving increased premium seats
TRANS-TASMAN
• Strong outbound New Zealand leisure traffic expected to continue
• Competitor capacity changes create varying dynamics Ramp up of capacity in 2H driven by better utilisation of B787 Dreamliner aircraft during seasonal low periodIncreased wide-body flying on Samoa and Fiji
PACIFIC ISLANDS
• Underlying demand remains strong driven by tourism and positive economic climate
• Regional pullback from competitor over peak season Trunk growth in 2H driven by additional services into Queenstown, Dunedin and ChristchurchRegional routes growing slightly ahead of trunk, notably Napier and Nelson
DOMESTIC
• Denotes observation on market conditions.Denotes Air New Zealand actions. 18
2018 INTERIM RESULT
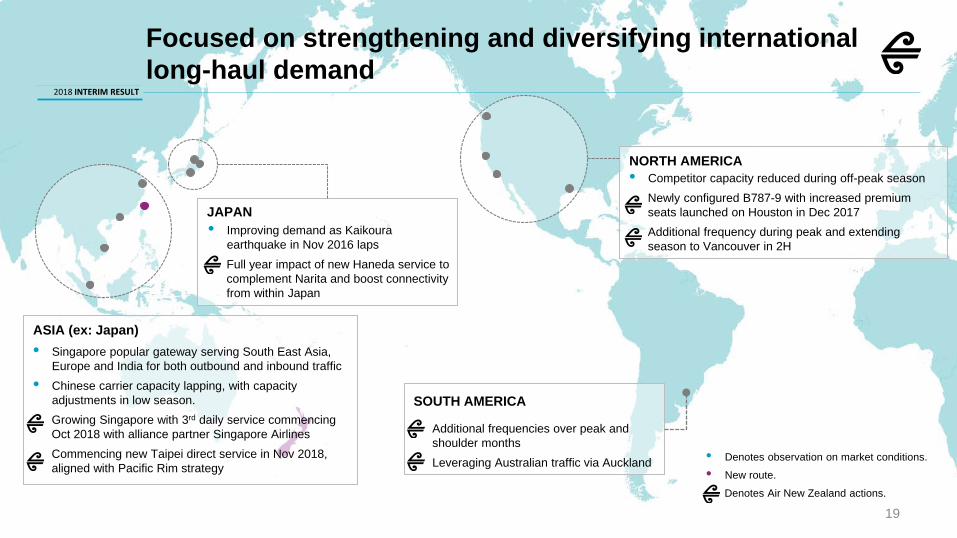
Focused on strengthening and diversifying international long-haul demand
• Singapore popular gateway serving South East Asia, Europe and India for both outbound and inbound traffic
• Chinese carrier capacity lapping, with capacity adjustments in low season. Growing Singapore with 3rd daily service commencing Oct 2018 with alliance partner Singapore AirlinesCommencing new Taipei direct service in Nov 2018, aligned with Pacific Rim strategy
ASIA (ex: Japan)
• Improving demand as Kaikoura earthquake in Nov 2016 lapsFull year impact of new Haneda service to complement Narita and boost connectivity from within Japan
JAPAN
• Competitor capacity reduced during off-peak seasonNewly configured B787-9 with increased premium seats launched on Houston in Dec 2017Additional frequency during peak and extending season to Vancouver in 2H
NORTH AMERICA
Additional frequencies over peak and shoulder months Leveraging Australian traffic via Auckland
SOUTH AMERICA
• Denotes observation on market conditions.• New route.
Denotes Air New Zealand actions.
19
2018 INTERIM RESULT
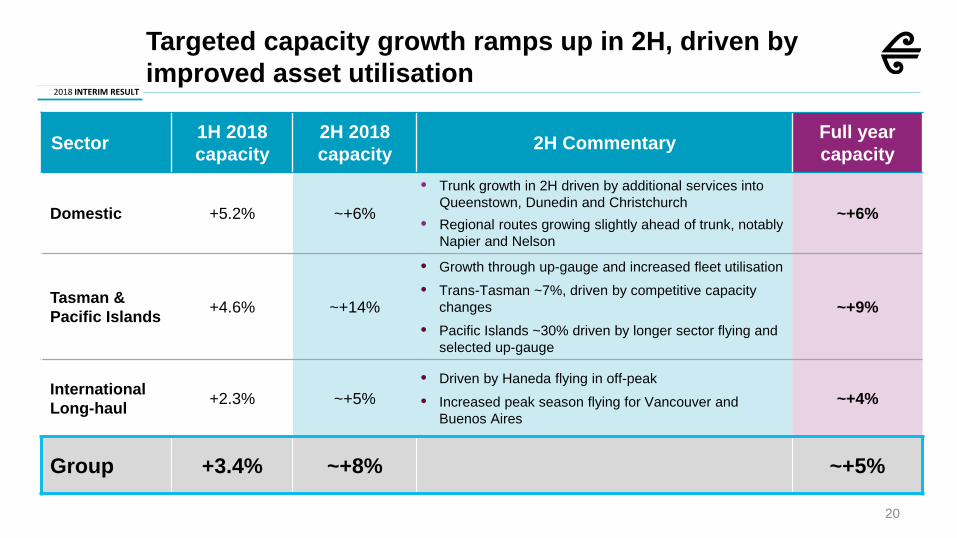
20
Sector 1H 2018capacity
2H 2018 capacity 2H Commentary Full year
capacity
Domestic +5.2% ~+6%
• Trunk growth in 2H driven by additional services into Queenstown, Dunedin and Christchurch
• Regional routes growing slightly ahead of trunk, notably Napier and Nelson
~+6%
Tasman & Pacific Islands +4.6% ~+14%
• Growth through up-gauge and increased fleet utilisation• Trans-Tasman ~7%, driven by competitive capacity
changes• Pacific Islands ~30% driven by longer sector flying and
selected up-gauge
~+9%
International Long-haul +2.3% ~+5%
• Driven by Haneda flying in off-peak• Increased peak season flying for Vancouver and
Buenos Aires ~+4%
Group +3.4% ~+8% ~+5%
Targeted capacity growth ramps up in 2H, driven by improved asset utilisation
2018 INTERIM RESULT
21
Reaffirming 2018 outlook despite jet fuel increase
Looking to the remainder of the year, we are optimistic about the overall market dynamics.
Based upon the current market conditions and despite the increased price of jet fuel, the Company is still
expecting 2018 earnings before taxation to exceed the prior year.

2018 INTERIM RESULT

2018 INTERIM RESULT
Supplementary slides
2018 INTERIM RESULT
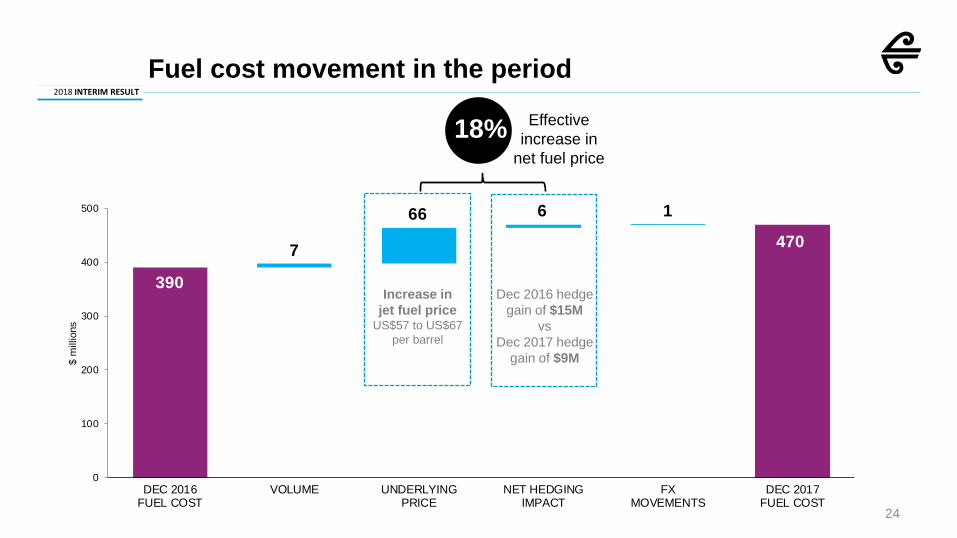
390
7
66 6 1
470
0
100
200
300
400
500
DEC 2016FUEL COST
VOLUME UNDERLYINGPRICE
NET HEDGINGIMPACT
FXMOVEMENTS
DEC 2017FUEL COST
$ m
illio
nsFuel cost movement in the period
24
Increase injet fuel price
US$57 to US$67 per barrel
Dec 2016 hedge gain of $15M
vsDec 2017 hedge
gain of $9M
Effective increase in
net fuel price 18%

2018 INTERIM RESULT
25
Fuel hedging
• 70% of estimated volumes hedged in 2H 2018
– Protection against adverse spikes in fuel
– Allows for pricing participation should oil prices fall
• 35% of 1H 2019 estimated volumes currently hedged
– Reflects backwardation of Brent forward curve
Foreign exchange hedging
• 2H 2018 hedges for US$447 million at a NZD/USD rate of 0.716
• 2019 hedges for US$372 million at a NZD/USD rate of 0.716
Hedging update
0%
10%
20%
30%
40%
50%
60%
70%
80%
$30
$35
$40
$45
$50
$55
$60
$65
$70
FY18 Q3Jan - Mar
FY18 Q4Apr - Jun
FY19 Q1Jul - Sep
FY19 Q2Oct - Dec
Hed
ged
% o
f est
imat
ed je
t fue
l con
sum
ptio
n
US$
per
bar
rel
Fuel hedge position(as at 14 February 2018)
Hedge percentage Brent Collar Ceiling Brent Collar Floor

2018 INTERIM RESULT
26* Comparative is for 30 June 2017.** Dividends are fully imputed.
Dec 2017$M
Dec 2016$M
Movement$M
Movement%
Operating revenue 2,729 2,584 145 5.6%
Earnings before taxation 323 349 (26) (7%)
Net profit after taxation 232 256 (24) (9%)
Operating cash flow 479 376 103 27%
Cash position* 1,340 1,369 (29) (2%)
Gearing* 52.4% 51.8% (0.6 pts)
Ordinary dividends declared** 11.0 cps 10.0 cps 10.0%
Financial overview

2018 INTERIM RESULT
27* Calculation based on numbers before rounding.
Dec 2017 Dec 2016 Movement*
Passengers carried (‘000s) 8,530 8,086 5.5%
Available seat kilometres (ASKs, millions) 22,138 21,409 3.4%
Revenue passenger kilometres (RPKs, millions) 18,274 17,790 2.7%
Load factor 82.5% 83.1% (0.6 pts)
Passenger revenue per ASKs as reported(RASK, cents) 10.6 10.3 2.0%
Passenger revenue per ASKs, excluding FX(RASK, cents) 10.6 10.3 2.5%
Group performance metrics
2018 INTERIM RESULT
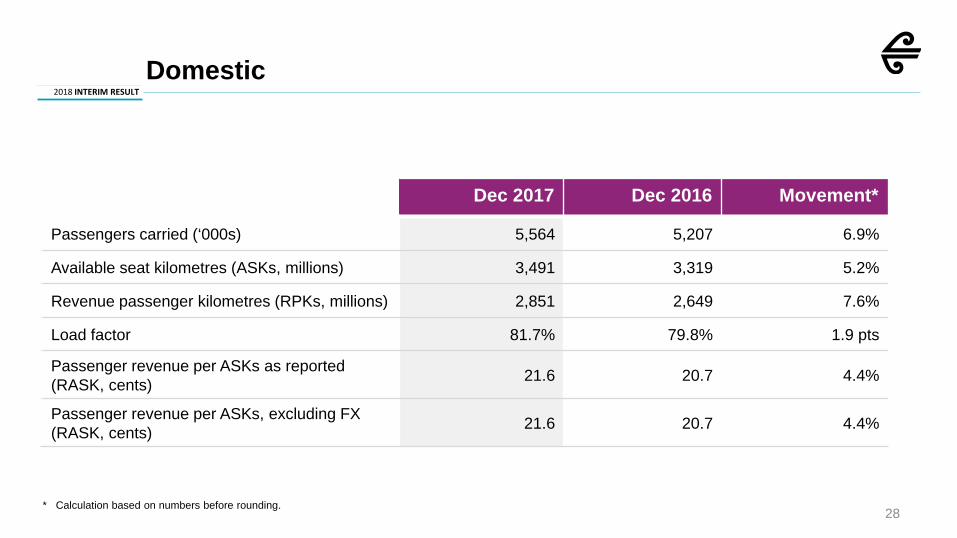
28
Domestic
Dec 2017 Dec 2016 Movement*
Passengers carried (‘000s) 5,564 5,207 6.9%
Available seat kilometres (ASKs, millions) 3,491 3,319 5.2%
Revenue passenger kilometres (RPKs, millions) 2,851 2,649 7.6%
Load factor 81.7% 79.8% 1.9 pts
Passenger revenue per ASKs as reported(RASK, cents) 21.6 20.7 4.4%
Passenger revenue per ASKs, excluding FX(RASK, cents) 21.6 20.7 4.4%
* Calculation based on numbers before rounding.
2018 INTERIM RESULT
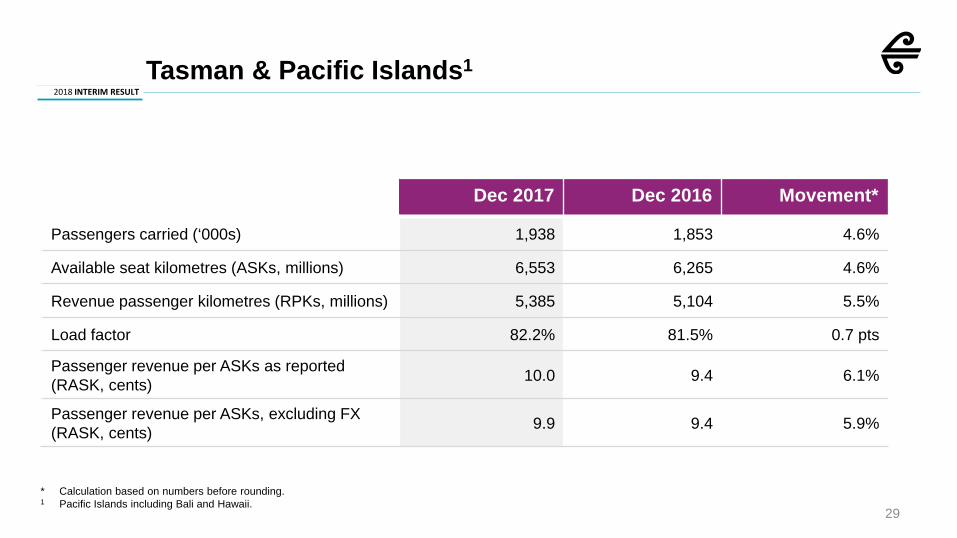
29
* Calculation based on numbers before rounding.1 Pacific Islands including Bali and Hawaii.
Tasman & Pacific Islands1
Dec 2017 Dec 2016 Movement*
Passengers carried (‘000s) 1,938 1,853 4.6%
Available seat kilometres (ASKs, millions) 6,553 6,265 4.6%
Revenue passenger kilometres (RPKs, millions) 5,385 5,104 5.5%
Load factor 82.2% 81.5% 0.7 pts
Passenger revenue per ASKs as reported(RASK, cents) 10.0 9.4 6.1%
Passenger revenue per ASKs, excluding FX(RASK, cents) 9.9 9.4 5.9%

2018 INTERIM RESULT
30* Calculation based on numbers before rounding.
International
Dec 2017 Dec 2016 Movement*
Passengers carried (‘000s) 1,028 1,026 0.2%
Available seat kilometres (ASKs, millions) 12,094 11,825 2.3%
Revenue passenger kilometres (RPKs, millions) 10,038 10,037 0.0%
Load factor 83.0% 84.9% (1.9 pts)
Passenger revenue per ASKs as reported(RASK, cents) 7.7 8.0 (3.3%)
Passenger revenue per ASKs, excluding FX(RASK, cents) 7.8 8.0 (2.0%)
2018 INTERIM RESULT
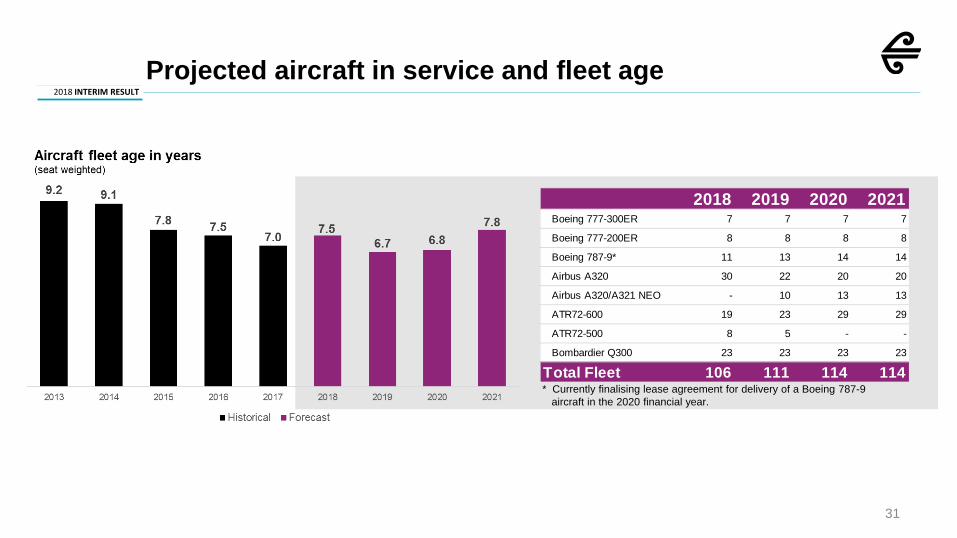
31
Projected aircraft in service and fleet age
2018 2019 2020 2021Boeing 777-300ER 7 7 7 7
Boeing 777-200ER 8 8 8 8
Boeing 787-9* 11 13 14 14
Airbus A320 30 22 20 20
Airbus A320/A321 NEO - 10 13 13
ATR72-600 19 23 29 29
ATR72-500 8 5 - -
Bombardier Q300 23 23 23 23
Total Fleet 106 111 114 114* Currently finalising lease agreement for delivery of a Boeing 787-9
aircraft in the 2020 financial year.
2018 INTERIM RESULT
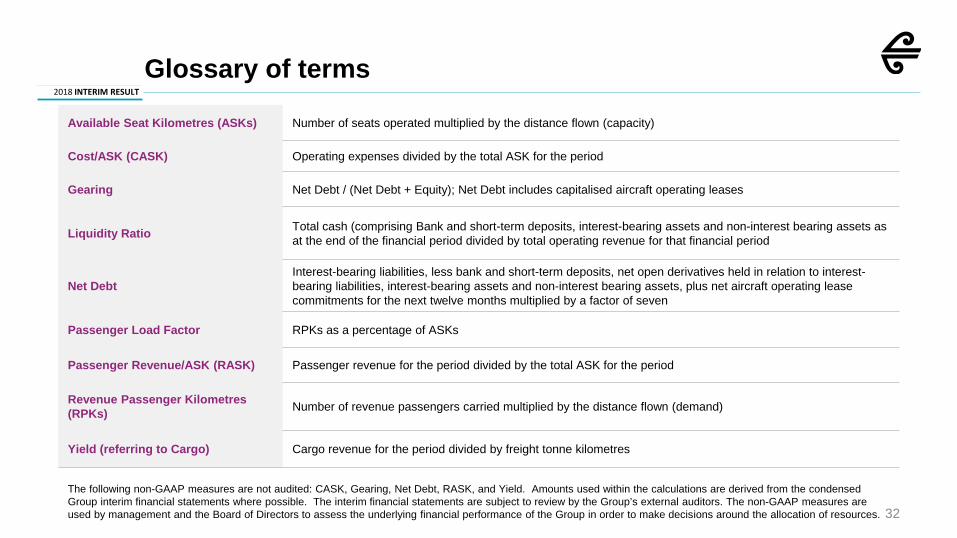
Glossary of terms
32
Available Seat Kilometres (ASKs) Number of seats operated multiplied by the distance flown (capacity)
Cost/ASK (CASK) Operating expenses divided by the total ASK for the period
Gearing Net Debt / (Net Debt + Equity); Net Debt includes capitalised aircraft operating leases
Liquidity Ratio Total cash (comprising Bank and short-term deposits, interest-bearing assets and non-interest bearing assets as at the end of the financial period divided by total operating revenue for that financial period
Net DebtInterest-bearing liabilities, less bank and short-term deposits, net open derivatives held in relation to interest-bearing liabilities, interest-bearing assets and non-interest bearing assets, plus net aircraft operating lease commitments for the next twelve months multiplied by a factor of seven
Passenger Load Factor RPKs as a percentage of ASKs
Passenger Revenue/ASK (RASK) Passenger revenue for the period divided by the total ASK for the period
Revenue Passenger Kilometres (RPKs) Number of revenue passengers carried multiplied by the distance flown (demand)
Yield (referring to Cargo) Cargo revenue for the period divided by freight tonne kilometres
The following non-GAAP measures are not audited: CASK, Gearing, Net Debt, RASK, and Yield. Amounts used within the calculations are derived from the condensed Group interim financial statements where possible. The interim financial statements are subject to review by the Group’s external auditors. The non-GAAP measures are used by management and the Board of Directors to assess the underlying financial performance of the Group in order to make decisions around the allocation of resources.
