2018 guam economic report
TRANSCRIPT

2018 GUAM Economic Report Regional Center for Public Policy School of Business and Public Administration Maria Claret M. Ruane, Ph.D. Alexander K.M. Aflague Rebecca G. Casimbon, MPA Luisa V. Tenorio
303 University Drive UOG Station, Mangilao, Guam 96913
www.uog.edu/sbpa
www
+1 (671) 735-2501

2018 Guam Economic Report 1 Regional Center for Public Policy – [email protected]
INTRODUCTION
Welcome to the first annual Guam Economic Report published by the University of Guam-Regional Center for Public Policy (RCPP) and funded by the University of Guam-Endowment Foundation. Being the first report, some attempts were made to provide a kind of “primer” on important economic concepts and measures presented in this report with the aim of a better understanding of what they mean and/or imply. EXECUTIVE SUMMARY
Guam’s economy has grown 1.08% on average per year between 2002 and 2017 but its growth momentum has slowed since 2010, where it averaged a mere 0.84% growth per year and with the latest estimated growth of only 0.2% in 2017. How did our $5.217 billion economy fare in 2018? Looking back, it was clear that 2018 was indeed a busy year that was filled with positive and negative developments:
• The Tax Cuts and Jobs Act (TCJA) of 2017 was a two-edged sword for Guam as it spelled $145 million less tax revenues for the Government of Guam (GovGuam) which anticipated a fiscal crisis, real or fake. On the other hand, the tax cuts meant larger paychecks for many residents and families.
• A very exciting election year, with many “firsts”: the election of the first female Governor of Guam (Maga’Håga), a female-dominated Guam legislature (with ten female senators) as well as the return of Democratic leadership to Adelup (the Guam Governor’s complex) after 16 years of Republican leadership in the Executive Branch
• A near-record low unemployment rate at the same time that the number of people not participating in the labor force is higher and increasing
• A relatively low inflation expected to go down further in near future, thanks to decreasing oil prices in the global market • Lower business spending in recent years to have continued in 2018 in response to uncertainties with government budget, election
outcomes, H-2B visa limits for civilian projects • A shift in tourism as Korea unseated Japan as #1 in market share and local businesses learn more about this group of visitors and
adjust their product offerings and marketing strategy to attract these visitors while not alienating those from Japan and, at the same time, reach out to local consumers
• A slightly higher amount of Federal Government contracts on Guam and an increase in National Defense Authorization Act (NDAA) approved military construction projects in Guam expected to increase even more in Fiscal Year (FY) 2019
As Guam welcomes the New Year 2019, what would this mean for the local economy and the island community that depends on it?

2018 Guam Economic Report 2 Regional Center for Public Policy – [email protected]
MACROECONOMIC ENVIRONMENT GROSS DOMESTIC PRODUCT (GDP) OR GROSS ISLAND PRODUCT (GIP) A standard measure of any economy is the Gross Domestic Product (GDP), which is the total market value of all final goods and services produced within the boundary of the economy during a particular period of time. For Guam, the “boundary” applies to production that takes place on-island, which explains the use of the term “Gross Island Product” (GIP) in place of or synonymous with “Gross Domestic Product” (GDP). Also for Guam, the phrase “particular period of time” translates to one year as GIP estimates are available on an annual basis only, unlike the U.S. and other countries where quarterly data are also available. Available Data Speaking of data, the most recent and consistent data source for Guam’s GIP estimates by the Bureau of Economic Analysis (BEA) within the U.S. Department of Commerce. It provides annual GDP data for Guam from 2002 to 2017, marking the latest available data that was released in November 2018 and presented in TABLE 1. Although the Guam data set does not come close to annual GDP estimates for the U.S., which run from 1929 to 2017, it was not until May 5, 2010 that Guam’s GDP estimates for 2002 to 2007 were released. This data was made available thanks to the efforts started in mid-2009 between the U.S. Department of the Interior-Office of Insular Affairs (OIA) and the BEA to update the GDP estimates for Guam, CNMI, American Samoa and the U.S. Virgin Islands. For years, Guam’s last estimated GIP was for the year 2002. This meant that up until May 2010, the “latest” GDP data for Guam was eight years old, that is, for 2002. This lack of available and updated data on which important decisions were based definitely created a negative image of our local businesses,
government agencies and residents “not having their act together” and making decisions not based on data and evidence. Such negative image would have reduced the funds that Guam could have received from the federal government and/or attracted from prospective businesses. Based on the latest GDP data released by BEA on November 13, 2018, the Guam economy in 2017 produced $5.859 billion worth of output valued in 2017 prices (known as Nominal GDP) or $5.217 billion measured in 2009 prices (known as Real GDP).

2018 Guam Economic Report 3 Regional Center for Public Policy – [email protected]
Which GDP Measure: Nominal vs Real? At the risk of sounding technical, the question of which is a better measure is important to ask. To clarify, it matters less if one is asking about the size or value of the Guam economy at a point in time (for example, the year 2017), although it is still a good idea to state which measure (Nominal GDP or Real GDP) is being cited. However, if one were interested in the performance of the Guam economy over time or to compare its performance over time or between two different years, then the Real GDP is the correct measure to use as this measure focuses on whether the economy is producing more output over time or between two years by removing the effect of price changes (usually increases) over time. Another way to state this is that Nominal GDP measures can increase from one year to the next year because the more that goods and services are produced that year compared to the previous year or because prices of many items in the economy increase or both. Therefore, even if the economy produced the same level of output (which would mean zero economic growth) but the prices of these products increased between these two years, the Nominal GDP would increase. To this effect, the BEA annual report presents the growth rate of Real GDP, which was 0.2% for Guam between 2016 and 2017, suggesting that our economy produced 0.2% more goods and services (output) in 2017 compared to what it produced in 2016. This growth performance, shown in CHART 1, is comparatively slower than the average annual growth rates from earlier periods, which was 1.08% during 2002-2017 or 1.68% during 2002-2010 or 0.84% during 2010-2017. Since Nominal GDP grew during 2002-2017 at an average rate of 3.28% and Real GDP grew at 1.08%, then the difference of 2.2% measures the average growth of prices per year. This is one of three commonly accepted ways to measure inflation, in this case, using the GDP or Implicit Price Deflator. Another measure of inflation, using the Consumer Price Index (CPI) will be presented in a later section.
The difference in the growth rates between Nominal GDP and Real GDP is shown in CHART 2 by the steeper line representing Nominal GDP and the flatter line representing Real GDP. Note that the two lines cross at the base year, the year whose prices are used to calculate Real GDP for every year during 2002-2017.
2018 Guam Economic Report 4 Regional Center for Public Policy – [email protected]
Surprisingly, some individuals or organizations have erroneously tracked Guam’s economic growth using the Nominal GDP instead of the Real GDP and hence provided incorrect and misleading information. Examples include the following:
• “Economic Census Shows Guam's Economy Grows 24 Percent Over Five Years” (U.S. Bureau of Census, 2014 April 29) based on Nominal Revenue;
• “we have grown our economy by $1 billion” (The Guam Daily Post, 2018 November 19);
• “Guam’s economy performed well over the past decade and is poised for additional growth… Guam’s GDP measured $5.8 billion in 2016… GDP has grown over 19% since 2009” (Guam Economic Development Authority, 2018).
When one looks at the Real GDP (in 2009 prices) during the periods referenced by these claims, Guam’s economy measured by Real GDP grew 6.42% between 2007 and 2012 compared to 18.83% growth in Nominal GDP during the same period; Guam’s Real GDP grew from $4.881 billion in 2010 to $5.217 billion in 2017 or by $336 million and not by $1 billion (which is based on Nominal GDP increasing from $4.895 billion in 2010 to $5.859 in 2017); Guam’s Real GDP grew 6.88% since 2009 while Nominal GDP increased by 19.69%. Clearly, these are significant differences in numbers depending on which measure was used in the calculation. Major Data Revision in 2014 Also important to note for those using annual GDP reports from BEA from 2010 to 2017 is that there was a major revision of the data in 2014 due to
• newly available and/or revised source data provided by the Guam government,
• results from BEA’s latest revisions to the national accounts, and
• information from the 2012 Economic Census of Island Areas, which provides the most thorough and detailed information on the structure of Guam’s economy (BEA, 2015 December 12)
Not knowing about this major revision would create errors if pre-2014 estimates were used alongside post-2014 estimates. For example, prior to the revision, Guam’s economy in 2013 was estimated at $4.882 billion in 2013 prices or $4.144 billion in 2005 prices. After the revision, these estimates became $5.357 billion and $5.070 billion, respectively, with the revision causing a major increase in both numbers, not because the economy experienced tremendous growth. Next GDP Estimate BEA plans to release Guam’s 2018 GDP estimate in the Summer of 2019 (BEA, 2018 November 13). As will be discussed in this report, there are a number of factors that create expectations of a negative growth in Guam’s Real GDP in 2018, meaning, Guam’s 2018 Real GDP is likely to be the same or slightly lower (up to -0.5%) than its 2017 Real GDP of $5.217 billion. Although this projection might not be as optimistic as others in the economy, it is also not as gloomy as that of Mr. Joseph Bradley, Chief Economist at the Bank of Guam, whose projection in November 2017 was for Guam’s economy in 2018 to be 5% lower than 2017 (KUAM, 2017 November 3). What GDP Tells Us? One use of the GDP reports is to find out what drives the overall economy, especially in terms of how much the different sources of spending or demand contribute to our overall economy. The standard approach is to think of the following groups that buy from our economy:

2018 Guam Economic Report 5 Regional Center for Public Policy – [email protected]
• local consumers/households whose spending is referred to by BEA as “Personal Consumption Expenditures”;
• local businesses whose spending is referred to as “Private Fixed Investment”;
• governments at all levels which, in Guam, is divided between the local (or as BEA calls it “territorial”) government, i.e., the Government of Guam or “GovGuam” and the Federal Government; a spending category that BEA refers to as “Government Consumption Expenditures and Gross Investment”; and
• non-residents, including visitors to Guam, whose spending is referred to as “Exports”
In short, think of our economy as having three types of customers/buyers: locals (including consumers, businesses and government (GovGuam), Federal Government including Military and family members, and non-residents/visitors/tourists. TABLE 2 shows the share of Guam’s Real GDP that resulted from spending by these different groups. The largest source of demand or spending in Guam comes from local consumers/households, which make up 57-59% of Guam’s output, followed by 52-56% combined spending by both GovGuam and the Federal Government, which contribute 20-22% and 32-36%, respectively. Local businesses spending account for 19-22% of Guam’s output, similar to spending by non-residents including visitors at 19-21% of Guam’s output. Total spending by all four groups add up to 152-156% of Guam’s output. Another way to think of these four groups is to categorize them into three types of customers/buyers that Guam’s economy sells to: locals (households, businesses and GovGuam) represented 91-103% of total spending, the Federal Government including military at 32-36%, and non-residents/visitors/tourists at 19-21%.
How can total spending (at $8 billion in real terms in 2017) add up to more than 100% of what Guam’s economy produces on-island (measured by Real GDP of $5.217 billion in 2017)? Easy, because the amount above 100% represents spending on products that were not produced in Guam but elsewhere and then imported into Guam, which was 54.2% of Real GDP in 2017 hence amounting to $2.829 billion of imports that year. Although this figure is often expected of a small island economy like Guam, it highlights our heavy dependence on imports and its effect of paying producers and suppliers outside our economy $2.829 billion, an amount that left our economy and therefore did not get spent locally, create local jobs nor generate local incomes and taxes. Putting in this context presents compelling reasons for the island community and its leadership to explore more products that we could produce locally instead of importing them.

2018 Guam Economic Report 6 Regional Center for Public Policy – [email protected]
Produce More Locally, Import Less Consider the benefits to Guam’s economy if 10% of what it currently imports were replaced by locally produced goods and services, or approximately $283 million using the 2017 total imports figure. This means that $283 million would have stayed in the local economy as economic transactions, which would generate additional incomes to local residents, a large part of which they would spend. This process of additional incomes leading to additional spending which creates additional income again leading to additional spending, etc. is known as the spending multiplier process. Using Guam’s local spending multiplier of 1.30 (Ruane, 2011 December), the $283 million worth of additional spending and income on local products (instead of imports) would multiply at 1.3 per $1. This action can increase Real GDP by $368 million, from $5.217 billion to $5.585 billion, create approximately 5,500 new jobs, generate additional gross receipts taxes (GRT) of $18 million and additional income taxes of $55 million.1 Increasing local production of import substitutes creates new or additional income opportunities for local producers and promotes our local economy, thus resulting in greater economic diversification and reducing our dependence on tourism and the FedGov/military, where outcomes are not largely within our control. The local economy gives us more control to shape, own and be responsible for our own future. Also, using more locally produced products in tourism and in general makes our island more sustainable. Other ways of increasing island sustainability is to encourage production for tourism and in general to take place outside of the Tumon area. This is the main message of the One-Village, One-Product approach that Tourism Professor, Dr. Fred Schumann, has applied to Guam. Along this line, a project by the University of Guam-Pacific
1 A bit technical but the local spending multiplier would actually increase to 1.35, which would increase real GDP by $382 million (from $5.217 billion to $5.6 billion),
Center for Economic Initiatives (PCEI) considered different products, including those in agriculture, that could be produced locally and in every village in Guam (Rojas et al., 2014 July; Schumann et al’, 2014 July). This way, tourism and economic activities do not have to be concentration in Tumon. As Mr. Joseph Bradley of Bank of Guam stated, "Less concentrated means a lower intensity of development… (t)he effects (on the environment) will be more spread out." He also suggested that Guam needs to look toward other industries for its economic revenue (Pacific Daily News, 2018 October 17).
JOBS AND NO JOBS Employment and Job Growth Guam’s employment data are derived from the Current Employment Survey (CES) conducted by the Guam Department of Labor-Bureau of Labor Statistics. These data are available quarterly from September 1993 to the latest available of March 2018, which shows a total employment for 64,790 individuals, with 49,200 (75.9%) of them employed in the private sector, 11,820 (18.2%) in the Government of Guam (GovGuam) and 3,770 (5.8%) in the Federal Government. CHART 3 presents data going back to March 2010, during which the average total employment was 62,361 individuals of whom 46,798 (75%) were with the private sector, 11,586 (18.6%) with GovGuam and 3,977 (6.4%) with the Federal Government.
create 5,700 new jobs and generate $19 million of additional GRT and $57 million of additional income taxes.

2018 Guam Economic Report 7 Regional Center for Public Policy – [email protected]
Looking at job growth, March 2018 data compared to one year earlier (March 2017) show a decrease of 0.32% in overall employment resulting from a decrease in employment in both private sector (-0.20%) and Federal government (-4.56%) but partially offset by an increase of +0.60% in GovGuam employment. CHART 4 shows that the negative growth in private sector employment and total job growth in March 2018 is the third worst outcome since 2010, with corresponding figures in 2012 being the worst and in 2011 the second worst.
2 “Unemployed persons comprise of all persons within the scope of the survey, who did not work during the survey week, who made specific efforts to find a job within the past 4 weeks, and who were available for work during the survey week (except for temporary illness). Also included as unemployed are those who did not work at
Unemployment Another commonly cited measure of the job situation in an economy is the unemployment rate. This is based on a survey periodically conducted by the Guam Department of Labor-Bureau of Labor Statistics (“Guam BLS”) using the definition of “Unemployed Persons”.2 The unemployment rate shows the percentage of Unemployed Persons to those persons in the Civilian Labor Force. The latest unemployment rate for Guam was 4.4% in March 2018, which has been low compared to all available estimates in the past 10 years beginning in March 2011. During this period, Guam’s unemployment rate reached the highest figure of 14% in June 2012
all, were available for work, and (a) were waiting to be called back to a job from which they were laid off; or (b) were waiting to report to a new wage or salary job within 30 days.”

2018 Guam Economic Report 8 Regional Center for Public Policy – [email protected]
and the lowest figure of 3.9% in June 2016. CHART 5 shows this decreasing trend.3
In general, a lower unemployment rate is preferred; however, one must note two very important points that this measure does not reflect well. The first one has to do with the definition of “Employed Persons”4 according to the Guam BLS, which means that a person who worked for pay for as little as one hour during the survey week is considered employed. Therefore, a low unemployment rate does not imply that all employed persons are working full-time as it includes those individuals who are working part-time, even if they would have preferred to work full-time.
3 A statistical analysis confirms a non-linear decreasing trend between March 2011 and March 2018. 4 “Employed persons comprise (a) all those within the scope of the survey who, during the survey week did any work at all as paid employees, in their own business, profession, or farm or who worked 15 hours or more as unpaid workers in
To Work or Not to Work: That is the Question The second problem with the unemployment rate measure is that it excludes those individuals who, for various reasons, choose not to participate in the civilian labor force. It is the visibility of this group in our community that makes many question the accuracy of the official unemployment rate estimate, which many would have guessed to be higher than measured. For this reason, it is good that the Guam BLS reports another measure known as the Labor Force Participation Rate (LFPR), which is the percentage of those individuals that do participate in the civilian labor force to those who COULD participate in the civilian labor force. The latter is defined by the Guam BLS to exclude the following: “Inmates of institutions, members of the Armed Forces, civilian living in military installations and housings, persons under 16 years of age, and nonimmigrant aliens”. In March 2018, Guam’s LFPR was 57.9%, compared to the U.S.’s figure of 62.9%. This means that of the 122,720 individuals who COULD work, 71,060 were employed and 3,100 were unemployed but, by definition, interested, willing and available to work. Guam’s LFPR also measures its opposite: Labor Force Non-Participation Rate (Non-LFPR), which would be 42.1% in March 2018, which translated to 51,660 individuals who choose not to participate in the labor force in Guam as shown on TABLE 3. Of this number, 2,530 indicated during the survey that they “want(ed) job during survey period but did not look for work” and provided one of the following reasons: “believe(d) no job was available”, “could not find work”, “school attendance”, “family responsibility, “could not arrange child care” and “others” (Guam BLS, 2018 July 26).
an enterprise operated by a member of the family, and (b) all those were not working but who had jobs or business from which they were absent because of illness, bad weather, vacation, labor-management dispute, or personal reasons, whether or not they were paid by their employers for the time off, and whether or not they were seeking other jobs.”

2018 Guam Economic Report 9 Regional Center for Public Policy – [email protected]
The remaining 49,130 individuals simply did not look for work with no reason provided. Guam Department of Labor Director Mabini was correct in stating that “(t)he largest groups … chose not to work because they are retired, full-time homemakers, caregivers, [have a] disability and/or students,” (Marianas Business Journal, 2017 January 23). Unfortunately, she did not provide a count of how many belonged in these groups. An attempt was made to use the 2010 Guam Census data to estimate some of these groups as follows:
• retirees, assumed to be aged 65 and over, and not in the labor force (21.82% of those not in the labor force);
• individuals aged 16-64 with disability, and not in the labor force (19.79%); and
• students aged 16-18, and not in the labor force (14.53%). These three groups comprise 45.52% of those not in the labor force, which would translate to 23,517 individuals in March 2018. The other categories cited by Mabini such as “full-time homemakers” and “caregivers” would have been included among the 460 individuals in TABLE 3 who cited “family responsibility” as the reason for wanting a job during the survey period but did not look for work.
5 That 44,986 individuals were receiving SNAP benefits compared to the estimated 28,129 individuals who choose not to participate in the labor force shows the difference of 16,857 individuals who were actually in the labor force. Many of them
Many wonder to what extent public assistance programs affect an individual’s decision to not work, estimated at 54.48% or 28,129 individuals in March 2018. Local media have loosely made the connection between this group and the high number of local households and individuals, 15,572 and 44,9865, respectively, in July 2018 (USDA-FNS, 2018 October 5) who receive Supplemental Nutrition Assistance Program (SNAP) benefits, along with other public assistance benefits. “With a possible $50,009 to be received in public assistance (by a family of four), the temptation to remain at or below the poverty income level or unemployed is obvious” (Marianas Business Journal, 2017 January 23), see TABLE 4.
worked but earned incomes that were low enough to qualify for SNAP benefits adjusted for the family size and the number of children.

2018 Guam Economic Report 10 Regional Center for Public Policy – [email protected]
Evidence points to some degree of truth to this claim, including the very clear pattern shown in CHART 6 supported by a correlation analysis, which shows a positive correlation (+0.866 vs highest possible value of +1) between Guam’s Non-LFPR (% of those who could participate in the civilian labor force who choose not to) and Guam’s SNAP participation rate by individuals (the number of individuals participating in SNAP as a percentage of those who COULD work).
Other evidence which are anecdotal in nature lend further support to how public assistance programs affect individuals’ related behavior or choice. One was shared by a female full-time student from the University of Guam who choose to work minimally so she could focus on completing her degree sooner. Thinking of temporary public assistance until she graduates, this student went to apply for SNAP participation and was denied the benefits but remembered being told that, if she were to get pregnant, that the government agency can help with her SNAP (or Women, Infants and Children, WIC) application. Another anecdotal evidence was shared by a local employer who has employees who ask NOT to be given a pay raise as their higher incomes would reduce or eliminate their family’s eligibility for public assistance (see earlier footnote). This relates to what is referred to in the U.S. as the “’welfare cliff’ where some … low-income families choose to keep their wages below a certain ceiling, so they won’t get disqualified from more economically beneficial welfare programs for food, subsidized housing and tax credits that convert into tax refunds, according to welfare reform advocates” (Pacific Daily News, 2015 November 14). What message do these anecdotes send to our community and to the taxpayers in Guam and in the U.S. who fund these programs? These comments are not intended to eliminate public assistance programs including SNAP as these programs assist those in our community in genuine need of assistance. On the contrary, it is precisely on behalf of this group that we cannot waste any of our limited budget resources and need to make sure that these resources (including those determined by eligibility to these programs) end up with those that need them the most. It is also a call to improving how programs are administered, reducing fraudulent participation, and making sure these programs do not create a dependent mindset and a disincentive to seek work.

2018 Guam Economic Report 11 Regional Center for Public Policy – [email protected]
It is important to note that this problem is not unique to Guam as studies6 have shown similar evidence in other economies. In general, countries where social safety programs (such as many public assistance programs in Guam) are more generously provided by the government to its constituents tend to have higher unemployment rates. This conclusion is hardly surprising as it shows that individuals respond to incentives or situations so as to behave or make choices in ways that benefit them the most. Doing so excessively and illegally creates room for government regulation and monitoring. In addition, countries that run generous social safety programs tend to not be in a position to be generous as shown by their high levels of national debt. In this case, this generosity toward the current generation imposes a burden on the future generation, who will shoulder the debt. PRICES AND INFLATION The latest Consumer Price Index (CPI) data was for the 3rd Quarter 2018, which shows consumer prices in Guam to have increased 2.8% compared to one year earlier during the 3rd Quarter 2017. Although this figure is higher compared to the average inflation rate since 2010, which was 2.3% per year and presented in CHART 7, it is within what most would consider to be an acceptable rate of inflation.7 Of course, the effect on individuals’ purchasing power depends on how well their incomes kept pace with rising prices. For those on fixed income, a 2.8% inflation would translate to their buying 2.8% less items this year than they did one year earlier. Looking at data from Guam BLS, average weekly earnings in the private sector for non-managerial/non-supervisorial position increased from $486.99 in March 2017 to $496.28, translating to a 1.9% increase over the year and barely able to keep up with consumer prices that rose in excess of 2% in the past
6 These include an unpublished research paper by Dela Cruz (2014, December 17) who used data from 53 countries and regression analysis to arrive at this conclusion.
year (Guam Department of Labor-Bureau of Labor Statistics, 2018 March 28).
Among the broad groups of the 168 products whose prices are tracked quarterly, the biggest increase occurred in the “Food” group where prices increased an average of 4.2% during the 3rd Quarter 2018 compared to one year earlier. In addition, “Motor Fuel” which is a component of the “Transportation” group and accounts for 5.2% of a typical household’s spending, reported a 17.9% in 3rd Quarter 2018 compared to 3rd Quarter 2017. This is not surprising as gas pump prices rose from $3.88 per gallon on January 1st to $4.43 per gallon on May 14th where it stayed until the end of the 3rd Quarter covered by the latest CPI report. Since then, gas prices went up one more time to $4.53 per gallon on October 9th before decreasing two times in November
7 Studies have shown that businesses and investors do not consider inflation rates below 5% as a risk whereas many central banks (including the Federal Reserve in the U.S. and the Bank of Japan) appear to consider a 2% inflation rate as an ideal figure.
Average annual inflation rate = 2.3% growth rate = 1.02%

2018 Guam Economic Report 12 Regional Center for Public Policy – [email protected]
(14th and 22nd) and another three times in December (2nd, 17th and 24th) down to $4.00 per gallon (see CHART 8). The downward trend in oil prices in the world market contributed to the decreases in gas prices in the last months (Pacific Island Times, 2018 October 12; Pacific Daily News, 2018 December 17).
CPI estimates in Guam are based on a market basket or spending pattern of a “typical” household living in Guam. Because of changes in buying pattern as well as the introduction of new products, this market basket must be updated, as it is done in the U.S. approximately every 10 years. Guam’s current market basket was developed in 2007 based on the latest Household Income and Expenditure Survey (HIES) at that time, which was conducted in 2005. Thanks to a $2.5 million funding from the U.S. Department of the Interior (DOI) in July 2018, $494,657 is funding toward the 2018 Household Income Expenditure Survey (HIES) to be overseen by the Bureau of Statistics and Plans and to be conducted by the University of Guam-Cooperative Extension, which also conducted the last HIES. As DOI noted in its press release, the 2018 HIES “serves as the one of the most reliable economic data tools for re-basing the Consumer Price Index, measuring inflation, developing the
Gross Domestic Product and other key economic indicators critical to business and government decision-makers.” (U.S. Department of the Interior, 2018 July 3; also in Saipan Tribune, 2018 July 5).
MAJOR ECONOMIC DRIVERS TOURISM Tourist Arrivals Guam’s visitor arrivals, shown in CHART 9, reached its highest in 2017 at 1,543,990 visitors that year, a record in Guam’s history and 0.6% higher than visitor arrivals in 2016, which was 1,535,518 (Guam Visitors Bureau (GVB), 2017 December). CHART 9 also shows that number of visitors to Guam has been increasing since 2012 and exceeded 1.4 million visitors by 2015, thus breaking the previous record of 1.38 million, which was set in 1997. Unfortunately, the 2018 figure is not likely to reach the 2017 record as available data between January and October 2018 show visitor arrivals to be 0.7% lower than it was during the same period in 2017. This lukewarm scenario exists in contrasts to the optimism expressed by the GVB Managing Director who pointed to the latest visitor arrivals report for November 2018, which shows another record-breaking statistics for Guam with an 8.6% increase compared to November 2017. 1,363 of the visitors in November 2018 arrivals were military, not civilian, visitors. The same report shows visitors from Korea actually decreased 6.8% in November 2018 compared to one year early and a 25.7% increase in visitors from Japan, which GVB interprets as a recovery of the Japan market. The increased availability of charter and commercial flights were cited as contributing factors to the stronger Japanese market in November 2018 as well as in October 2018, including four additional weekly flights on United Airlines between

2018 Guam Economic Report 13 Regional Center for Public Policy – [email protected]
Guam and Nagoya; a daily Nagoya-Guam flight by T-way Airlines starting December 29 and 471 charter flights from Japan by the end of 2018, with more than 600 charter flights anticipated in 2019 (Pacific Daily News, 2018 December 24).
Hotel Occupancy and Room Rates The hotel occupancy rate (CHART 10) took a significant dive in 2017 at 65%, in sharp contrast to a 5-year average of 77% (2012-2016), with a high of 81% in 2012. All the while, the average room rate continues to increase from $159 in 2015, $166 in 2016 and $168 in 2017. Average hotel room rates increased 25% over the 5-year period between 2013 and 2017 and 45% over the 10-year period of 2008-2017. Data from January to March 2018 show hotel occupancy rate at 77%, which is lower than the 81% figure during the same months in 2017. During the same period, the average hotel room rate was $188 in 2018 compared to $181 in 2017.
Hotel business privilege and occupancy taxes peaked at $47.8million in 2016 before declining 9.4% to $44.9 million in 2017. These taxes are not tracking well for 2018 as data for January to March 2018 estimate them at $7.54 million, 44.12% lower than they were during the same months in 2017. With GovGuam expecting a $140 million shortfall in its tax revenues for FY2019, the business privilege tax rate increased from 4% to 5% beginning April 1, 2018 (Pacific Daily News, March 30) but was supposed to revert back to 4% in FY2019 once the 2% sales tax came into effect. The sales tax never went into effect as it was later axed by the Guam Legislature in July 2018. The business privilege tax was kept at 5%. In addition, the Guam Legislature passed a bill in mid-August 2018 to raise the hotel occupancy tax rate from 11% to 13% but rolled it back the same week after receiving strong opposition to the bill and concerns about its negative effect on Guam’s tourism (Pacific Daily News, 2018 August 3). A Guam Visitors Bureau’s report cited that the “increase in the occupancy tax and the business privilege tax could result in a loss of approximately $201.1 million to $525.4 million in visitor spending over five years.” (Pacific Daily News, 2018 August 2).

2018 Guam Economic Report 14 Regional Center for Public Policy – [email protected]
2017: Guam’s Tourist Market Shifts from Japan to Korea The year 2017 saw tensions rise between the U.S. and North Korea due to North Korea’s nuclear weapons and missile testing. North Korea was testing its capability to send missiles past its immediate area and reach areas near Guam (estimated to take just over 17 minutes, The Washington Post, 2017 September 15) and the Western Pacific. In response to North Korea, U.S. President Trump, at one point, stated that the “U.S. would respond to more North Korean threats with ‘fire and fury’ unlike the world had ever seen” (The New York Times, 2017 August 8). This tumultuous time saw the cancellation of thousands of Japanese package tours to Guam (Guam Department of Labor, Economic Report 2019), thus exacerbating an already declining Japanese visitors market for Guam, which decreased by 16.8% in 2017 compared to 2016 as shown in TABLE 5. During the same year, the Korean market increased significantly, growing at 25.6% and resulting in a market share of 45% that surpassed the Japanese market share of 40.8%. Third in market share in 2017 was the U.S./Hawaii market at 5.1%, which was the same as in 2016, followed by the Taiwan market at 2.1%, down from 2.8% in 2016, and the China market at 1.4%, down from 1.8% in 2016. The importance of attracting visitors markets from Korea and other possible countries increased further in 2018 due to the decline in the Japan visitors market. TABLE 6 illustrates the comparison of the time period between January and October of 2017 and 2018. In terms of market share during the January to October 2018 period, the Korean market accounted for almost half of the market at 49.2%, increasing from 43.2% during the same period in 2017. The Japan market held 35% of the market between January and October 2018, decreasing from 41.1% during the same period in 2017. The increase in Korea’s market share resulted from a 13% growth in the number of Korean visitors to Guam during these periods (January-October of 2017-2018)

2018 Guam Economic Report 15 Regional Center for Public Policy – [email protected]
while visitors from Japan decreased by 15.5%. Growth in other markets were mixed, with the U.S./Hawaii market increasing at 22.3% but those from Taiwan and China both decreased significantly by 17.1% and 26%, respectively. Market Reactions and Adaptations A shift to a Korean-dominated market created a noticeable change on Guam’s tourism industry. The trends, taste and buying preferences of the Korean visitors are different from those of their Japanese counterparts, the previously dominant market. The challenge was to find a balance between appealing to the Korean visitors without adversely alienating the Japanese visitors. For some businesses, like the Duty-Free Shop (DFS), this transition has been going on for the past three years. The Korean traveler is known to be “more price-conscious, tech-savvy and fashion-forward.” In the luxury market, from goods to ambiance, a change has been necessary. Businesses are learning to use different strategies such as offering larger discounts in order to encourage visitor spending. The lower profit margins are offset by increased revenue. Diversification of product portfolios is also changing from Japanese-centric brands like Marc Jacobs and Chloe to brands that are more popular to Korean visitors like Balenciaga and Givenchy. (Marianas Business Journal, 2018 October) Similar changes are also noticeable when it comes to lodging. Korean visitors are found to be highly price-sensitive as well as tending to travel as family groups. Both of these factors favor accommodations offered through bed and breakfast options like Airbnb instead of hotels located across the island. This change has fueled a boom in the “… black market of underground, unregulated, unlicensed, tax avoiding bed-n-breakfast operations that are essentially stealing business from legitimate hotels and restaurants” (Guam Hotel and Restaurant Associated quoted in Pacific News Center, 2017 December 20). “Japanese and South Korean visitors spend differently… Japanese tourists like prepackaged tours while the South Korean visitor are more
into free, individual traveling” (Pacific Island Times, 2018, December 12). Additionally, there appears to be an increase in interest in the fusion between a luxury experience and a local style, and local businesses have been diversifying their spaces and offerings to respond to this change. One example is how Tumon Sands Plaza is replacing “some of its luxury boutiques with family restaurants, mid-priced retail stores and entertainment to attract a broader market in 2019”, which allows it to keep some of its traditional luxury boutiques while also attracting a broader segment of local businesses and visitors (Marianas Business Journal, 2018 March 19). Other factors that contributed to the market shifts previously noted include
• a reduction in the number of flights to Guam; • a push to increase the number of charter flights to Guam; • expanded social media marketing initiatives to attract more
independent travelers; • market shift from package tours to Foreign Independent Tours
(FITs); and • unlikely China visa waiver program and a refocus on the 2
million China visitors who already have U.S. Visas (Guam Department of Labor, Economic Report 2018 and 2019)
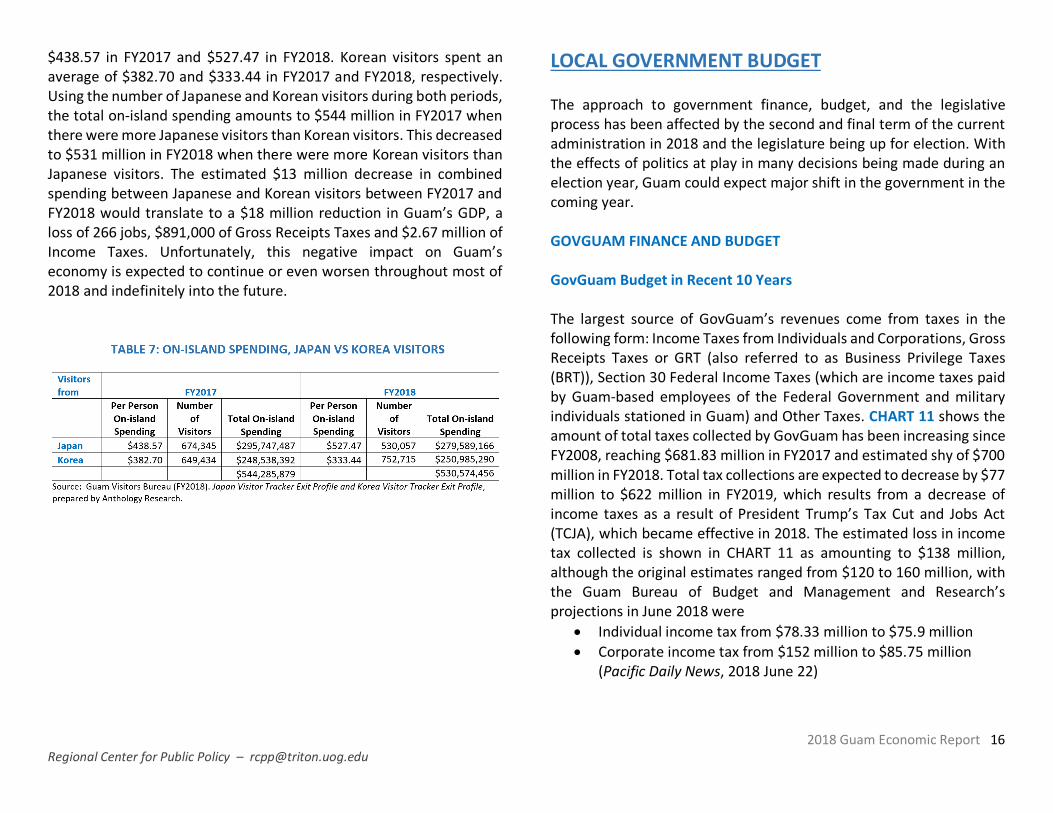
Change in Visitor Spending Despite the record high number of visitors who came to Guam in 2017, the shift from the Japan market to the Korea market resulted in lower total visitor spending in Guam. This decrease is illustrated by exit survey results, the latest of which was for FY2018, showing that Japanese visitors, on average, spend a larger amount of money on-island than Korean visitors. TABLE 7 summarizes on-island spending data for FY2017 and FY2018. Japanese visitors spent an average of
2018 Guam Economic Report 16 Regional Center for Public Policy – [email protected]
$438.57 in FY2017 and $527.47 in FY2018. Korean visitors spent an average of $382.70 and $333.44 in FY2017 and FY2018, respectively. Using the number of Japanese and Korean visitors during both periods, the total on-island spending amounts to $544 million in FY2017 when there were more Japanese visitors than Korean visitors. This decreased to $531 million in FY2018 when there were more Korean visitors than Japanese visitors. The estimated $13 million decrease in combined spending between Japanese and Korean visitors between FY2017 and FY2018 would translate to a $18 million reduction in Guam’s GDP, a loss of 266 jobs, $891,000 of Gross Receipts Taxes and $2.67 million of Income Taxes. Unfortunately, this negative impact on Guam’s economy is expected to continue or even worsen throughout most of 2018 and indefinitely into the future.
LOCAL GOVERNMENT BUDGET The approach to government finance, budget, and the legislative process has been affected by the second and final term of the current administration in 2018 and the legislature being up for election. With the effects of politics at play in many decisions being made during an election year, Guam could expect major shift in the government in the coming year. GOVGUAM FINANCE AND BUDGET GovGuam Budget in Recent 10 Years The largest source of GovGuam’s revenues come from taxes in the following form: Income Taxes from Individuals and Corporations, Gross Receipts Taxes or GRT (also referred to as Business Privilege Taxes (BRT)), Section 30 Federal Income Taxes (which are income taxes paid by Guam-based employees of the Federal Government and military individuals stationed in Guam) and Other Taxes. CHART 11 shows the amount of total taxes collected by GovGuam has been increasing since FY2008, reaching $681.83 million in FY2017 and estimated shy of $700 million in FY2018. Total tax collections are expected to decrease by $77 million to $622 million in FY2019, which results from a decrease of income taxes as a result of President Trump’s Tax Cut and Jobs Act (TCJA), which became effective in 2018. The estimated loss in income tax collected is shown in CHART 11 as amounting to $138 million, although the original estimates ranged from $120 to 160 million, with the Guam Bureau of Budget and Management and Research’s projections in June 2018 were
• Individual income tax from $78.33 million to $75.9 million • Corporate income tax from $152 million to $85.75 million
(Pacific Daily News, 2018 June 22)

2018 Guam Economic Report 17 Regional Center for Public Policy – [email protected]
Total tax revenues decreased less (at $77 million) as lost income tax revenues were offset by revenues from tax increases effective FY2019 such as increase in property taxes and increase in taxes on tobacco products (Public Law 34-116, 2018 August 24).
CHART 12 shows GovGuam expenditures in total and in different services between FY2008 and FY2017 using audited figures from the Guam Office of Public Accountability Citizen Centric Reports (CCR). These expenditure figures were those appropriated from the General Fund Revenue and Section 30 tax revenues. Also shown are the public services that received the largest appropriations, which are Public Education and Protection of Life and Property, which received $245.57 million and $190.47 million, respectively, in FY2017. The third largest category of expenditure was Debt Services, which was $85.6 million in FY2017. CHART 12 shows how debt service has increased over time as a result of GovGuam’s debt through bond financing has grown.
CURRENT FISCAL YEAR (FY2019) The budget bill for FY2019 was met with resistance by the Governor of Guam, Eddie Calvo. He cites the lack of proper clauses and the absence of correct wording in certain parts of the law that would later bring up difficulties regarding layoffs for several government positions. In the end, the bill authorizing the spending of $956 million lapsed into law on Thursday, August 23, 2018 (The Guam Daily Post, 2018, August 25) referred to as the General Appropriations Act of 2019, Public Law 34-116 or the Budget Law of FY2019. During the discussions for the FY2019 budget bill, the revenue shortfall was a heavy topic that influenced both the decisions of the lawmakers and the governor, who ultimately approves and signs bills that he

2018 Guam Economic Report 18 Regional Center for Public Policy – [email protected]
agrees with or sees fit into public laws. The legislature had to decide what to cut and what to increase to hopefully match the revenue gained in this present fiscal year (Marianas Business Journal, 2018 August 20). The following portion will discuss ways that the legislature approached this issue. Elimination of Deputy Positions A notable change for the 2019 Fiscal Year budget that attracted attention comes in the form of spending controls administrative provisions, found in Chapter XIII of the General Appropriations Act of 2019. As a part of this Chapter that has caught the public’s attention, Section Four of this chapter covers “Funding of Unclassified Deputy Director and Similar Positions Prohibited.” This section prohibits the use of government funds for unclassified positions under certain titles, such as Deputy Director, Deputy Administrator, Deputy General Manager, Assistant General Manager, Deputy Executive Manager, Vice President, and Deputy Executive Director. This Section directly involves the following departments and agencies: Executive Branch departments, Guam Commission for Education Certification, Department of Public Health and Social Services, Guam Behavioral Health and Wellness Center, Department of Integrated Services for Individuals with Disabilities, and Guam Visitors Bureau. The FY2019 Budget Law states that the elimination of Deputy positions will be effective January 7, 2019 (General Appropriations Act of 2019). Using the latest available staffing patterns, TABLE 8 shows the amount of GovGuam budget that is spent on the Deputy positions listed and how elimination of these positions per FY2019 Budget Law will save GovGuam and taxpayers $1.252 million (Government of Guam, 2018). Note that the FY2019 Budget Law does not eliminate all Deputy positions so there could be further savings in future years if it would be possible to eliminate more Deputy positions if they could be shown to be unnecessary, duplicative, held by unqualified political hires, or just not an effective use of limited GovGuam budget resources.
Federal Government Funds With previous complaints about the shortage of funding related to the Compact of Free Association, Guam received $2,164,545 in additional funding along with the $14.9 million that is mandated by law. These funds include the $176,989 unexpended funds from 2017 (Pacific Island Times, 2018 September 19). Businesses and government agencies, such as the Guam Behavior Health and Wellness Center, Guam Department of Agriculture, and Farm to Table Guam, have been awarded federal grants. The grants for Guam Department of Agriculture and Farm to Table Guam aim to help farmers market and transport their goods and to help develop business plans. With these grants aiming toward building the agricultural sector, they assist with the development of the industry and encourages sustainable practices that can lead the industry to better provide for the island. The grant for the Guam Behavior Health and Wellness Center aims to encourage gathering resources and trainings for preventing and reducing suicide and substance abuse across the island (Pacific Island Times, 2018 September 19).

2018 Guam Economic Report 19 Regional Center for Public Policy – [email protected]
Tax Situation in Guam With the estimated loss of $145 million in revenue for FY2019 due to the Tax Cuts and Jobs Act of 2017 (TCJA), the legislature turned to cutting funds for government departments and agencies and increasing certain tax rates to make up for that loss (Marianas Business Journal, 2018 August 20). These changes are reflected in the present in the General Appropriations Act of 2019. Originally increased in FY2018, the Business Privilege Tax was kept at 5% when it was originally written to roll back to its pre-April 1, 2018 rate of 4% after a 2% sales tax were to commence in October 1, 2018.
Real property tax: “The budget bill also increases the tax on improvements to all land properties of Guam with a value of at least $1 million from 7/18% to 7/9%. Revenue from the increase will be directed to the Territorial Educational Facilities Fund” (Marianas Business Journal, 2018 August 20). After FY2019 Bill lapsed into law (Public Law 34-116) on August 24, 2018, an error was discovered in the wording of the property tax increase section contained in the law, which stated
a) There is hereby levied on all land property in Guam a yearly tax at the rate of seven seventy-seconds percent (7/72%) of the value thereof and seven eighteenths percent (7/18%) of the value of the improvements thereon… shall be deposited in the Territorial Educational Facilities Fund.
b) In addition to the levy in Subsection (a), there is hereby levied on improvements on all land property in Guam with a value of One Million Dollars ($1,000,000) a yearly tax at the rate of seven eighteenths percent (7/18%) of the value thereon… (Public Law 34-116, Chapter 1, Section 3, amendment to 11 GCA § 24103, 2018 August 24).
The error is in (b) with the wording of “all land property … value of One Million Dollars ($1,000,000)” instead of stating … “value of One Million Dollars ($1,000,000) or more”. If implemented as originally worded, the error would have translated to approximately $8 million in lost property tax revenues for FY2019. After some debates, the erroneous wording was amended through the passage of Bill 374-34 (COR) on December 16, 2018. (Guam Legislature, 34th Guam Legislature – Bills) Uncollected Taxes: With Senator Michael San Nicolas making the argument of not placing a burden on its people and the discovery of uncollected taxes, lawmakers voted to repeal the 2 percent sales tax that was supposed to take effect on October 1, 2018, the start of Fiscal Year 2019 (Guam Daily Post, 2018 July 3). What has been brought to the legislature’s and public’s attention is that Guam has a substantial amount of taxes that have not been collected for the past few years. Reasons for the lack of collection falls to tax leakage (Pacific News Center, 2018 May 17), technical issues with software (Guam Daily Post, 2018 May 16), and possible tax evasion. It has been reported that there are at least 23,302 taxpayers that owe the government $194 million in taxes but not all can be collected (Pacific Daily News, 2018 August 9). 2018 Tax Amnesty Program: The purpose of the 2018 Tax Amnesty Program was “(t)o increase and accelerate the collection of delinquent taxes and to encourage voluntary compliance from all taxpayers, including individual and business taxpayers…” by requiring (“full payment of principal taxes and will allow for the abatement of penalty and interest.” (Guam Department of Revenue and Taxation, 2018 May 4). The program was announced on May 4 on the Guam Department of Revenue and Taxation official website and began accepting applications on May 7 until the original deadline of May 27, which was extended to June 19 and then again to June 26. Payments were originally due by August 6 but were extended to September 5 and extended again to September 28. Department of Revenue and Taxation director “confirmed that $30.1 million was collected out of

2018 Guam Economic Report 20 Regional Center for Public Policy – [email protected]
the $35.2 million pledged by nearly 900 delinquent taxpayers … (w)e’re very happy with the results” (The Guam Daily Post, 2018 October 9). Section 30 Funds: War reparations for World War II survivors from Guam has been a major topic on for the past few years considering the “Guam World War II Loyalty Recognition Act” was passed in December 2016. “The Guam World War II Recognition Act honors Guam’s greatest generation by providing Congressional recognition to the people of Guam who endured enemy occupation during World War II. The law authorizes the payment of certain claims to the living survivors and the heirs of those who died as a result of the occupation” (Office of Guam Congressional Delegate). Only certain claims will be considered for compensation by payment, such as the following: (Guam World War II Loyalty Recognition Act, 2016, December)
• Forced march, internment, or hiding to evade internment: $10,000
• Forced labor or a personal injury: $12,000 • Rape or severe personal injury: $15,000 • Death during the occupation: $25,000
By the deadline, June 20, 2018, for filing a claim, approximately 3,640 claims have been filed (Pacific Daily News, 2018, August 22). Before any World War II survivor or surviving family members will be compensated, the Foreign Claims Settlement Commission must review the claims and decide who will be compensated and how much they will be compensated (Office of Guam Congressional Delegate). The funds that will be used to compensate survivors or their families will be coming from Section 30 funds, as stated in the War Claims Act. According to a letter sent from Congresswoman Bordallo to Former Speaker Cruz (Guam Daily Post, 2018, August 31), the Government of Guam will be receiving $77,046,768 for FY2019, of which $6,442,665
will go toward paying war claims (War Claims Fund). As was stated in the War Claims Act and explained, “Section 30 funds in excess of $68 million will be earmarked to pay war claims, and the process will continue each year until all claims are paid” (Pacific Daily News, 2018 August 30). GUAM’S POLITICAL CLIMATE 2018 Election Season With the Calvo-Tenorio Administration approaching the end of its second term, Guam was getting ready to jump into an election season in 2018. In the 2018 election, the people of Guam voted for the following offices: Governor and Lieutenant Governor of Guam, Non-Voting Delegate to the U.S. House of Representatives, Guam’s Thirty-Fifth Legislature, Attorney General of Guam, Guam Education Board, Consolidated Commission on Utilities, and for Judicial retention. This year’s election season was ripe with changes in views, approaches, and tactics. Contested Election With an approximate 260-vote difference between the top two Democratic gubernatorial candidates before the primary election was certified, the Aguon-Limtiaco team had requested for a recount of the ballots. A recount done by machines found a six-vote difference from the initial count on the night of the debate. A request for a hand count of ballots from the Aguon-Limtiaco gubernatorial team was denied by the Guam Election Commission Board at their meeting on Wednesday, September 5, 2018, citing that is was not required by law (Guam Daily Post, 2018 September 6). Not content with the results and supported by Guam Citizens for Public Accountability, the Aguon-Limtiaco gubernatorial team decided to run a write-in campaign for the 2018 Guam General Election.

2018 Guam Economic Report 21 Regional Center for Public Policy – [email protected]
The One Guam Gubernatorial Debate – Toward Decolonization On May 08, 2018 the University of Guam Spring Graduating Candidates for the Master of Public Administration, in collaboration with the Regional Center for Public Policy and the Guam Commission on Decolonization, hosted the One Guam Gubernatorial Debate. Over 2000 people were in attendance with the event being broadcasted live, rebroadcasted by major media, and available on demand through the Internet. The debate brought together the five 2018 gubernatorial candidates on one stage for the largest debate on decolonization in Guam’s history. Testifying before the United Nations the Executive Director for the Commission on Decolonization, Amanda Blas, put into record listing the One Guam Gubernatorial Debate as an “historic debate” that highlighted the importance of leadership’s involvement in self-determinations efforts (United Nations, 2018).
The 2018 Great Gubernatorial Debate A week before the 2018 Guam General Election was set to take place, the Regional Center for Public Policy (RCPP) at the University of Guam-School of Business and Public Administration held the 2018 Great Gubernatorial Debate on Tuesday, October 30, 2018. The debate acted as a platform for the two campaigns to address community concerns and clarify their platforms and other issues. The Democratic team and Republican team have previous experience in politics and government, some of which was expressed through the candidates’ answers. The Leon Guerrero-Tenorio camp pointed to the negative aspects of the current administration that has held office for the past eight years. They contrasted their views on and approaches to addressing various problems across the island. The Tenorio-Ada camp focused on the successes and achievements of the current administration and how they would work to continue on that progress.
General Election Results The general election took place on Tuesday, November 6, 2018. TABLE 9 presents the general election results for the Guam Governor and Lieutenant Governor, Legislature and Delegate to the U.S. House of Representatives as certified by the Guam Election Commission on Friday, November 23, 2018 (Guam Election Commission, 2018, November 23). Guam had been under two different Republican administrations since 2003 while the legislature has held a Democrat majority since 2009. In this election year, Guam has witnessed a change in political party in their executive branch that should bring change and different approaches with this new administration taking office in January 2019. Along with a Democratic administration, Guam’s Thirty-Fifth Legislature will hold a Democratic majority. Leaving both branches in the hands of the Democratic party, the positive outlook suggests the possibility of party unity and more cooperation between the branches for the purposes of initiatives with the upcoming administration. The negative outlook suggests more party tension stemming from differing ideals and agendas, leading to gridlock on important issues. The role of the non-voting delegate will still be held by a Democratic official, although there maybe differing agendas and tactics. 2018 Natural Disasters on Guam In a year of a weak La Nina, Guam expected a higher chance of getting more stormy weather and possible typhoons, especially in the latter part of the year (FEMA, 2018, February 13). The island had been notified of storm watches throughout the year that has prompted residents to make preparations for possible storms and typhoons (Pacific Daily News, 2018 May 7).

2018 Guam Economic Report 22 Regional Center for Public Policy – [email protected]
A typhoon watch for Guam was issued in the month of September when Typhoon Mangkhut approached the Mariana Islands region. The island residents prepared for the typhoon by taking protective measures around their homes and purchasing necessary supplies. The island faced a power outage that lasted up to a week for some residents. Some residents also loss their homes to typhoon-related damage. Due to the extent of the damage across the island, private businesses and government agencies were prevented from opening and operating (Marianas Business Journal, 2018 September 11). A preliminary assessment of the damage from the typhoon that was executed by Guam Homeland Security and Office of Civil Defense has estimated $4.3 million in damages across the island (Pacific Daily News, 2018 September 27). Federal financial assistance for Guam was approved by President Donald Trump to help cover the costs of the damage done by the typhoon (Pacific Daily News, 2018 October 2), but the Federal Emergency Management Agency did not approve federal assistance for individuals who have been affected by the typhoon (Pacific Daily News, 2018 October 8). Although individuals will not be getting federal assistance to cover the cost of damage from the typhoon, the US Department of Agriculture Food and Nutrition Service (USDA Food and Nutrition Service) approved Guam Department of Health and Social Service (DPHSS) to issue replacement benefits for recipients of the Supplemental Nutrition Assistance Program (SNAP) that might have been negatively affected by food spoilage due to the loss of power across the island (Pacific Island Times, 2018 September 21).

2018 Guam Economic Report 23 Regional Center for Public Policy – [email protected]
FEDERAL GOVERNMENT AND MILITARY REALIGNMENT MILITARY BUILDUP (REALIGNMENT) AND FEDERAL GOVERNMENT SPENDING It has been years since the initial talk about the Defense Realignment in July 2005 with then-Governor of Guam Camacho to its more formal announcement as a “Military Build-Up” in October 2006 to its earlier version with detailed contained in the original Environmental Impact Statement (EIS) in 2009 to its reconfiguration as a Military Realignment in Guam (or a Military Rebalance in the Asia-Pacific region) since then. With the final Supplemental Environmental Impact Statement (SEIS) and Record of Decision (ROD) signed and implemented in 2015, the military realignment in Guam has been in full swing and is expected to grow in the coming years. The change in U.S. leadership since January 2017 did not have any noticeable effect on the intent, timing or funding of the military realignment in Guam. Much of the adjustments to the final SEIS resulted from the concerns raised by the local community, including the reduction of the number of military personnel to be transferred to Guam for the military realignment. The original EIS estimated this number to be 8,600 U.S. Marines service men and women and their 9,000 dependents, which was reduced to approximately 5,000 Marine service men and women and 1,3000 dependents as stated in the final EIS. Perhaps the best indicator of positive developments related to the military realignment in Guam is the annual National Defense Authorization Act (NDAA) and, more specifically, the amounts of funding and the types of military construction projects in Guam that are authorized by U.S. Congress and approved by the President. As a baseline, the military construction projects in Guam approved for FY2015, the first year since the signing of the ROD, was $162,451,000.
The amounts in subsequent fiscal years have been significantly higher than that for FY2015. TABLES 10-13 present the details of the military construction projects in Guam that are approved by the NDAA for FY2016, 2017, 2018 and 2019. The amount approved for FY2016 was nearly $400, 145% higher than during FY2015. The amount for FY2017 decreased to $254 million. Since then, it grew by 39.7% to %355 million for FY2018, which increased to nearly $450 million or 26.5% for FY2019.

2018 Guam Economic Report 24 Regional Center for Public Policy – [email protected]
It is anticipated that Guam will continue to see an increase in NDAA funding in the coming years and reach a peak of $1.4 billion of NDAA funding for FY2022 (defensecommunities.org, 2018 February 28). The yearly authorized NDAA budget shows spending on U.S. Department of Defense projects in Guam and does not include contracts, grants and other funding by the Federal Government for work performed in Guam, although data show defense spending to
make up 57.4%, on average, of all Federal Government funding in Guam between FY2009 and FY2018, which totaled almost $12 billion. CHART 13 shows the top 10 recipients of Federal funds received by Guam, with Social Security Administration and Health and Human Services as receiving 13.9% and 6.8, respectively, of the total Federal Government funding in Guam between FY2009 and FY2018.
CHART 14 breaks down the total amount of $12 billion of Federal Government funds for projects or services in Guam between FY2009 and FY2018 by fiscal year. It shows that there had been variations in the yearly amounts from less than $800 million for FY2009 to the highest amount of $1.507 billion for FY2018. However, it also shows that the yearly amounts exceeded $1 billion per year since FY2014 and exceeded $1.5 billion in the last two fiscal years, FY2017 and FY2018 and is expected to continue to increase until the completion of the

2018 Guam Economic Report 25 Regional Center for Public Policy – [email protected]
Marine Base and the relocation of the Marine service men and women and their dependents from Okinawa and to fund future projects such as cantonment and family housing. It is hoped that the Military Realignment in Guam and that the agreement between U.S. and Japan will stay on course and not be affected by the President asking for a 5% reduction on the defense budget (along with the those of other department’s for FY2020 (FoxNews, 2018 October 17). The continued funding for defense is particularly important in light of the possible reduction of military forces from the Middle East, which might lead to defense spending being shifted towards military bases within the U.S. and to include Guam, spending separate from the military realignment (Defense News, 2018 October 17).
The degree to which Federal Spending in Guam benefits the local community depends, to some extent, to what share of its overall value were awarded to local contractors. Data show positive development in this area, increasing from 24.4% of all Federal Spending funds going to local contractors for FY2014 to 61.1% for FY2018.
FORECAST FOR GUAM’S ECONOMY IN 2019
Compared to our forecast of a zero to slightly negative (-0.5%) growth of Guam’s economy in 2018 and considering that the effect of the Tax Cut and Jobs Act (TJCA) tax cuts are already reflected in consumers’ paycheck and spending pattern, no further growth is expected in consumer spending in 2019. Spending by businesses might recover depending on the line of business they are in, with those in tourism to continue to expect weak demand while those in military/defense projects to benefit from the clearly visible increases in funding toward military construction projects. However, there is some uncertainty created by the pressure of the U.S. Federal Government to improve its fiscal situation through possibly an across-the-board reduction in spending, which could affect Guam projects during FY2020. Spending by Guam-based businesses might increase from 2019 being a non-election year and on the hope of “better things” to happen from the new administration and legislature. Overall, the value of Federal Government contracts for work performed on Guam reached $1.5 billion in FY2017 and FY2018 and might stay that same level or even increase slightly for FY2019, with spending during the January-September 2019 contributing toward the 2019 being forecasted here. As noted above, there is always the risk that the Federal Government cuts its budget for all categories of Federal Government spending in FY2020 in order to improve its fiscal situation. There is also a high probability that the U. S. economy will go into a recession within the next two years (2019-2020), which would reduce Federal Government revenues and would possibly require additional cuts in many spending categories and the funds provided to Guam.

2018 Guam Economic Report 26 Regional Center for Public Policy – [email protected]
GovGuam spending is expected to be reduced to better match its predicted revenues in FY2019, which are estimated to be $77 million less than in FY2018, including revenues from tax increases included in the FY2019 Budget Law. Despite continued optimism from GVB based on the recovery of the Japan market in October and November 2018 and the increased available flights connecting Guam to Japan, it is more likely that tourism will continue to yield lower overall tourist spending, even if the total number of visitors increases. Forecasts by the Asian Development Bank (ADB) for growth of Japan’s and Korea’s economies have been downgraded, which would reduce the number of visitors to Guam or their spending or both. For 2018, Japan’s economy was originally forecasted to grow at 1.4%, later reduced to 1.1%. Growth in 2019 is still expected at 1%. Korea’s growth in 2018 was originally forecasted by the ADB at 3% but later downgraded to 2.9% (Asian Development Bank, 2018 September). In contrast, the Yonhap News Agency recently forecast Korea’s 2018 economic growth to be at 2.6% (Yonhap News Agency, 2018 November 29) and to enter into a recession in 2019 (Yonhap News Agency, 2018 December 9) in response to the slowing China’s economy in general and in response to the trade war with the U.S. China’s economy affects Korea in terms of tourism (visitors to Korea are mainly from China) and exports (China is Korea’s number one export market). The Yonhap News Agency forecast of a recession in Korea in 2019 is different from the Asia Development Bank’s forecast of a 2.8% growth in Korea for 2019. All of these information point to the possibility that the number of visitors to Guam from both Japan and Korea might both decrease in 2019. With the U.S. mainland and Hawaii making up the third
largest tourist market for Guam and with the expectation of the U.S. economy slowing down possibly in 2019 if not 2020, Guam’s visitor arrivals and tourist spending will be negatively affected even more.
Given the importance of the different types of spending and their individual contribution to Guam’s overall economy (as measured by Real GDP), it is very likely that the negative effects of lower GovGuam spending and tourist spending would offset the increase in Federal Government spending. Since no further growth would expecting in consumer spending and it is unclear whether or not businesses would spend more, our most optimistic forecast for Guam’s economy in 2019 is the same as for 2018, zero to slightly negative.
There is a good chance that Guam’s economic growth would show a 1% decline from its 2018 level unless the combined consumer and business spending increases. Interestingly, this conclusion brings the focus back to the local economy and the local customers (in addition to our other customers, visitors and the Federal Government including the military) and the importance of creating an environment in Guam that builds confidence and motivation to fully participate in our economy for the benefit of our community.

2018 Guam Economic Report 27 Regional Center for Public Policy – [email protected]
UPDATES ON GUAM’S ECONOMIC DATA The following section provides information on economic data and reports about Guam that will be available in the near-term horizon. GUAM’S 2015 SURVEY OF CORRUPTION PERCEPTION Two reports on the corruption perception survey conducted in Guam in late-2015 are expected to be released in January 2019. The first report, authored by Dr. Maria Claret M. Ruane, Mr. Daniel Cayanan, Mr. Jun Patrick Salalila, Ms. Angelina Tretnoff and Mr. Christian Valencia, summarizes the survey results in a report formatted according to the Transparency International, which conducts the Global Corruption Barometer, which was used as the basis for the corruption survey in Guam in late-2015. In an effort to put the results of Guam’s corruption survey in better perspective, the second report, authored by Dr. Maria Claret M. Ruane and Ms. Kristina C. Sayama, compares Guam’s corruption results with those of the U.S. and more than 100 countries around the world using data from Transparency International. Both reports will be made available to the public by the Regional Center for Public Policy at the University of Guam-School of Business and Public Administration. 2017 ECONOMIC CENSUS OF THE ISLAND AREAS The U.S. Census Bureau publishes the Economic Census, including that for the island areas including Guam, as “the official five-year measure of businesses and provides a comprehensive measure of economic activity by industry and election district for the island” and has been working with the Guam Department of Labor to conduct this census. Businesses on Guam received census forms by mail in early May 2018 and were asked to complete and return them by June 12, 2018. The final census results for Guam are expected to be released in October 2019.
2018 GUAM’S HOUSEHOLD INCOME AND EXPENDITURES SURVEY (HIES) Thanks to a funding of $494,657 included in the $2.5 million funding announced by the U.S. Department of the Interior (DOI) in July 2018 and the collaboration between the University of Guam-Cooperative Extension and Outreach under Mr. Peter Barcinas and the Bureau of Statistics and Plans, the 2018 Household Income Expenditure Survey (HIES) is under way. This survey is “serves as the one of the most reliable economic data tools for re-basing the Consumer Price Index, measuring inflation, developing the Gross Domestic Product and other key economic indicators critical to business and government decision-makers.” (U.S. Department of the Interior, 2018 July 3; also in Saipan Tribune, 2018 July 5). 2018 SURVEY OF COMPACT OF FREE ASSOCIATION (COFA) MIGRANTS The U.S. Bureau of Census, in collaboration with the University of Guam-Cooperative Extension and Outreach under Mr. Peter Barcinas and the Bureau of Statistics and Plans conducted the 2018 Survey of COFA Migrants between August and November 2018. The goal is to “get an estimate of the number of migrants living on Guam currently… so we can get an accurate count for funding to the island its several million dollars of funding a year, and money for Guam, which is used for public service programs - healthcare, schools, public safety, etc.” (KUAM, 2018 October 18).

2018 Guam Economic Report 28 Regional Center for Public Policy – [email protected]
GUAM’S 2019 COMPREHENSIVE ECONOMIC DEVELOPMENT STRATEGY (CEDS) This is a report that is spearheaded by the Guam Economic Development Authority (GEDA) in collaboration with the Regional Center for Public Policy at the University of Guam-School of Business and Public Administration and other stakeholder representatives from “the Mayors’ Council of Guam and their Municipal Planning Councils, … Guam Chamber of Commerce representatives, industry experts and
some government of Guam agency heads” (Pacific Daily News, 2018 August 27). According to the GEDA Administrator, “Guam’s 2019 CEDS is a crucial document to be published showing the path forward in Guam’s economic growth … It will act as a planning tool for both the local and federal governments, paving the way for future collaboration on infrastructure and industry development” (Pacific Daily News, 2018 August 27). This report is funded by the Economic Development Administration under the U.S. Department of Commerce.
ACKNOWLEDGEMENT
Annette Taijeron Santos, D.B.A. Dean of the University of Guam School of Business and Public Administration
John J. Rivera, Ph.D.
Director, Regional Center for Public Policy at the University of Guam School of Business and Public Administration
Fred R. Schumann, Ph.D. Professor, Global Resource Management, University of Guam School of Business and Public Administration
Jonas D. Macapinlac, PMBA
Director, University of Guam Integrated Marketing and Communication
John E. Ruane, MPA Alumnus, University of Guam School of Business and Public Administration
Melanie Mendiola, PMBA
Executive Director, University of Guam Endowment Foundation
The University of Guam Endowment Foundation

2018 Guam Economic Report 29 Regional Center for Public Policy – [email protected]
REFERENCES Asian Development Bank (2018, September). Asian Development Outlook Update: Maintaining Stability and Heightened Uncertainty. DefenseNews (2018, October 17) by Aaon Mehta, Trump appears to call for defense spending cuts. Defensecommunities.org (2018, February 23) Guam realignment construction to peak in FY 2022. Dela Cruz (2014, December 17). Does social protection affect unemployment rate? Unpublished manuscript. Federal Emergency Management Agency (2018, February 13). 2018 Guam Catastrophic Typhoon Plan. FoxNews (2018, October 17) by Brooke Singman. Trump to ask Cabinet secretaries to cut spending by 5 percent for fiscal year 2020. General Appropriations Act of 2019, GU. (GU 2018, August) Government of Guam (latest) Fiscal Year 2018 4th Quarter Staffing Pattern. Guam Behavioral Health & Wellness Center (latest) Fiscal Year 2018 Agency Staffing Pattern. Guam Bureau of Statistics and Plans (latest). Guam Consumer Price Index, 3rd Quarter 2018. Guam Daily Post (2018, May 16) Bum software hindering tax collections. Guam Daily Post (2018, July 3). Sales tax repealed. Guam Daily Post (2018, August 25). ‘Flawed’ budget now law. Guam Daily Post (2018, September 6). GEC denies new ballot recount. Guam Daily Post (2018, October 9) by Kevin Kerrigan. Tax amnesty collects $30M of $35M pledged. Guam Daily Post (2018, November 19) by Gov. Eddie Calvo. Thanks to those who do great things for Guam. Guam Daily Post (2018, December 25). Price of gasoline drops 13 cents Guam Department of Labor-Bureau of Labor Statistics (2018, July 28). Unemployment Situation on Guam: March 2018. Guam Department of Labor-Bureau of Labor Statistics (2018, March). Guam’s Unemployment Historical Table: 1974-2018. Guam Department of Labor-Bureau of Labor Statistics (2018, March). Current Employment Survey (CES) Historical Table: 1993-2018. Guam Department of Labor-Bureau of Labor Statistics (2018, September 4). Current Employment Report: March 2018. Guam Department of Labor-Bureau of Labor Statistics (2018, April 11). Plans Underway for 2017 Economic Census. Guam Department of Revenue and Taxation (2018, May 4). 2018 Tax Amnesty Program. Guam Economic Development Authority (2018). Guam Bond Information, retrieved December 21, 2018. Guam Election Commission (2018, November 23). General Election Summary Report. Guam Economic Development Authority (2018, April 26) March, 2018 Staffing Pattern. Guam Legislature. 34th Guam Legislature – Bills. Guam Office of Public Accountability (various fiscal years). Our Report to Our Citizens. Guam Visitors Bureau (latest) Fiscal Year 2018 2nd Quarter Staffing Pattern. Guam Visitors Bureau (2018). Korea Visitor Tracker Exit Profile FY2018 DATA AGGREGATION, prepared by Anthology Research. Guam Visitors Bureau (2018). Japan Visitor Tracker Exit Profile FY2018 DATA AGGREGATION, prepared by Anthology Research. Guam World War II Loyalty Recognition Act, GU. (GU 2016, December) KUAM (2017, November 3). Projection sees Guam’s economy cooling in 2018. KUAM (2018, October 18) by Carmen Terlaje. Census officials surveying COFA migrants. Marianas Business Journal (2018, August 20). Fiscal 2019 budget bill brings tax increases, government cuts. Marianas Business Journal (2018, September 11). Post-storm assessment vital; NMI seeks aid. Office of Public Accountability (2018, June 27). FY 2017 Financial Highlights. New York Times (2017, August 8) by Peter Baker and Choe Sang-Hun. Trump Threatens ‘Fire and Fury’ Against North Korea if It Endangers U.S. Pacific Daily News (2015, November 14) by Steve Limtiaco and Gaynor Dumat-ol Daleno. More Guam households on food welfare.

2018 Guam Economic Report 30 Regional Center for Public Policy – [email protected]
Pacific Daily News (2018, March 30) by Haidee Eugenio. Calvo plan approved, business privilege tax increases April 1. Pacific Daily News (2018, May 7). Forecasters provide 2018 typhoon prediction assessment for Guam. Pacific Daily News (2018, June 22). Federal tax impact on fiscal 2019 budget at $120M to $160M. Pacific Daily News (2018, August 9, 2018). 23,302 taxpayers owe GovGuam $194M but only $73M can be collected. Pacific Daily News (2018, August 22). War claims expected to be paid next fiscal year. Pacific Daily News (2018, August 27) by Steve Limtiaco. Calvo: Plan for economic future can be found in the past. Pacific Daily News (2017, August 30). Guam legislature passes $688.56 million budget act after almost two weeks of debate. Pacific Daily News (2018, August 30). Here’s where Section 30 funds will go: $77M for GovGuam, $6.4M for war claims. Pacific Daily News (2018, September 27). Typhoon Mangkhut cost GovGuam $4.3 million; no guarantee of federal aid. Pacific Daily News (2018, October 2). Trump approved typhoon bailout for GovGuam; residents still waiting. Pacific Daily News (2018, October 8). FEMA denies individual aid request for typhoon Mangkhut on Guam. Pacific Daily News (2018, October 17) by Anumita Kaur. Bank of Guam looks toward sustainability. Pacific Daily News (2018, December 6) by Anumita Kaur. Women’s Chamber of Commerce elects new board, shares future plans. Pacific Daily News (2018, December 17) by Jerick Sablan. Gas prices down 10 cents. Pacific Daily News (2018, December 24) by Anumita Kaur. GVB: Record number of November visitor arrivals. Pacific Island Times (2018, September 19). Federal money showered on Guam. Pacific Island Times (2018, September 21). Did Mangkhut spoil your food stamp goodies? Not to worry. Pacific Island Times (2018, October 12). FSM’s (relatively) great gas prices about to rise. Pacific Island Times (2018, December 12) by Gwen L. Lucas. Arrivals up, spending down. Pacific News Center (2018, May 17). AUDIT: $40 million in leaks found at Rev & Tax. Office of Guam Congressional Delegate. Guam World War II Loyalty Recognition Act FAQ. Office of Guam Congressional Delegate. Various Press Releases on the NDAA Funding for Military Construction Projects on Guam. Rojas, Gena A., Fred R. Schumann & Maria Claret M. Ruane (2014, July). “Guam Farmer Survey: February-April 2014”, University of Guam-Pacific Center for Economic Initiatives
Technical Report, Issue 21, July 2014. Ruane, Maria Claret M. (2011, December). Estimating the Spending Multiplier in Guam. University of Guam-Pacific Center for Economic Initiatives Technical Report, Issue 15,
December 2011. Saipan Tribune (2018 July 5). Interior provides $2.5M in FY ’18 grant allocations to Guam. Schumann, Fred R., Gena A. Rojas & Maria Claret M. Ruane (2014, July). “Survey of Current and Past Village-Level Production on Guam”, University of Guam-Pacific Center for
Economic Initiatives Technical Report, Issue 20, July 2014. Stars and Stripes (2018, August 13) by Matthew M. Burke, Work on Guam’s $8.7 billion portion of Pacific realignment gaining momentum, officials say. United Nations (2018). http://www.un.org/en/decolonization/pdf/PRS-2018-CRP.14%20(Guam).pdf USAspending.gov (various fiscal years). Total federal spending and contracts awarded. U.S. Bureau of Census (2014, April 29). Economic Census Shows Guam's Economy Grows 24 Percent Over Five Years. U.S. Department of Agriculture, Food and Nutrition Service (latest). Supplemental Nutrition Assistance Program data. U.S. Department of Commerce, Bureau of Economic Analysis (2018, November 14). Guam GDP Increases in 2019: Consumer Spending increases for the 7th year in a row. U.S. Department of the Interior (2018 July 3). Interior Provides $2.5 Million in FY 2018 Grant Allocations to Guam. U.S. Department of the Navy (2012). Guam Buildup Environmental Impact Statement. U.S. Depoartment of the Navy (2015). Guam Buildup Environmental Impact Statement, Record of Decision Signed. Washington Post (2017 September 15). Latest North Korea missile launch suggests Guam is within reach. Yonhap News Agency (2018, November 27). Korea’s economic growth forecast to slow to 2.6% in 2019. Yonhap News Agency (2018, December 9). Korea economy in downturn, to hit bottom sometime in 2019: think tank.

2018 Guam Economic Report 31 Regional Center for Public Policy – [email protected]
2018 GUAM Economic Report Regional Center for Public Policy School of Business and Public Administration Maria Claret M. Ruane, Ph.D. Alexander K.M. Aflague Rebecca G. Casimbon, MPA Luisa V. Tenorio
303 University Drive UOG Station, Mangilao, Guam 96913
www.uog.edu/sbpa
www
+1 (671) 735-2501